Embed Size (px)
Citation preview
ROBUST DESIGN OF MULTILEVEL SYSTEMS USING DESIGN
TEMPLATES
A Thesis Presented to
The Academic Faculty
by
Hannah Muchnick
In Partial Fulfillment of the Requirements for the Degree
Master’s of Science in the School of Mechanical Engineering
Georgia Institute of Technology May 2007

ROBUST DESIGN OF MULTILEVEL SYSTEMS USING DESIGN
TEMPLATES
Approved by: Dr. Janet K. Allen, Advisor G. W. Woodruff School of Mechanical Engineering Georgia Institute of Technology
Dr. David L. McDowell G. W. Woodruff School of Mechanical Engineering / School of Materials Science and Engineering Georgia Institute of Technology
Dr. Farrokh Mistree G. W. Woodruff School of Mechanical Engineering Georgia Institute of Technology
Dr. David Scott School of Civil and Environmental Engineering Georgia Institute of Technology
Date Approved: March 30, 2007

iii
ACKNOWLEDGEMENTS
The completion of this thesis would not have been possible without the tremendous
intellectual contribution, personal encouragement, and financial support of many people
and organizations.
First, I express heartfelt gratitude to my advisor, Janet K. Allen, for her dedication to my
academic development. When I first joined the Systems Realization Lab, Janet made it
clear that her passion in advising students is to help them achieve their fullest potential.
During my time at the SRL, I have seen this passion come to life through Janet’s support
of my intellectual and personal development. I am also grateful to Farrokh Mistree for
teaching me to combine critical evaluation with the ability to dream. Based on
encouragement from Janet and Farrokh I have learned how to continue learning in every
area of life. I would also like to thank David McDowell and David Scott for providing
expertise in the material and structural aspects of engineering design. Their contributions
to the design problems presented in this thesis are invaluable.
The students of the SRL tremendously impacted my intellectual development. I extend
my gratitude to Stephanie Thompson and Matthias Messer, two students with whom I
often collaborated. Through the daily tasks of coursework and research, Stephanie
provided the intellectual spark for many of the ideas expressed in this thesis. I am
grateful for her encouragement and friendship. Matthias’ pursuit of scholarly research
prompted me to examine my own work to ensure that my intellectual contributions went
beyond problem solving. I am grateful for my SRL mentors—Hae-Jin Choi, Jitesh
Panchal, Chris Williams, and Andrew Schnell—for their wise insight into my research
endeavors. I am also thankful for current and former students—Jin Song, Nathan Young,

iv
Emad Samadiani, and Gautam Puri—for creating an environment of collegial learning in
the SRL.
The work presented in this thesis is sponsored in part by intellectual and financial
contributions of the US Army Research Lab, US Air Force, and research groups at
Georgia Tech and Penn State as part of the I/UCRC on computational materials design.
Particularly, I gratefully acknowledge the US Army Research Lab and US Air Force for
providing experience-based knowledge in blast resistant panel performance and design. I
am also grateful for the financial support of provided by National Science Foundation as
part of a graduate research fellowship.
Finally, I express my love, appreciation, and gratitude for my family. I am blessed with
loving parents, siblings, and extended family who have offered constant prayer and
encouragement throughout my stay at Georgia Tech. I am also grateful for my husband,
Joseph, for his enduring love and friendship during this time of graduate studies.
The LORD is my strength and shield. I
trust him with all my heart. He helps me,
and my heart is filled with joy. I burst
out in songs of thanksgiving.
Psalm 28:7

v
TABLE OF CONTENTS
Page
ACKNOWLEDGEMENTS iii
LIST OF TABLES x
LIST OF FIGURES xiii
LIST OF SYMBOLS AND ABBREVIATIONS xviii
GLOSSARY OF KEY TERMS xx
SUMMARY xxii
CHAPTER
1 FOUNDATIONS OF MULTILEVEL DESIGN 1
1.1 MULTILEVEL DESIGN – A FRAMEWORK FOR SOLVING COMPLEX DESIGN PROBLEMS 4
1.1.1 Multilevel Design of Engineering Systems 4
1.1.2 Multilevel Design Challenges 6
1.2 FRAME OF REFERENCE 7
1.2.1 Robust Design of Multilevel Systems 8
1.2.2 Template-Based Design Approach 8
1.2.3 A Template-Based Approach to the Robust Design of Blast Resistant Panels 9
1.3 RESEARCH FOCUS AND CONTRIBUTIONS 11
1.3.1 Research Questions and Hypotheses 11
1.3.2 Research Contributions 13
1.4 METHOD VALIDATION STRATEGY – THE VALIDATION SQUARE 14
1.4.1 Verifying and Validating Design Methods 15

vi
1.4.2 Thesis Validation Strategy 18
1.5 OVERVIEW OF EXAMPLE PROBLEMS 20
1.5.1 Overview of Conceptual Example – Design of a Cantilever Beam 21
1.5.2 Overview of Comprehensive Example – Design of a Blast Resistant Panel 21
1.6 SYNOPSIS OF CHAPTER 1 22
2 MULTILEVEL TEMPLATE-BASED ROBUST DESIGN – REVIEW OF LITERATURE AND IDENTIFICATION OF RESEARCH GAPS 2 3
2.1 MULTILEVEL DESIGN 25
2.1.1 Definition of Multilevel Design 25
2.1.2 Materials Design – A Multilevel Design Problem 27
2.1.3 Multilevel-Multiscale vs. Multilevel-Homogenization Design Processes 31
2.2 UNCERTAINTY AND ROBUST DESIGN 35
2.2.1 Uncertainty in a Design Process 36
2.2.2 Robust Design Definition 36
2.2.3 Robust Design Classification 37
2.3 DESIGN TEMPLATES 45
2.3.1 Design Templates in Engineering Design 46
2.3.2 Requirements for Design Templates 47
2.3.3 The Compromise Decision Support Problem – A Design Template 49
2.4 RESEARCH GAPS IN TEMPLATE-BASED MULTILEVEL DESIGN 56
2.4.1 Research Gap Relating to Multilevel Robust Design – From Multiscale Design to Multilevel Design 57
2.4.2 Research Gap Relating to a Template-Based Approach to Multilevel Robust Design 58
vii
2.5 SYNOPSIS OF CHAPTER 2 59
3 THEORETICAL FOUNDATIONS FOR A MULTILEVEL DESIGN TEMPLATE 61
3.1 MULTILEVEL ROBUST DESIGN BASE METHOD 63
3.1.1 Overview of Base Method 64
3.1.2 Base Method – Assumptions and Usefulness 65
3.1.3 Base Method Procedure 66
3.2 MULTILEVEL DESIGN TEMPLATE 72
3.2.1 From IDEM to a Multilevel Design Template 72
3.2.2 Formulation of Multilevel Design Template 74
3.2.3 Multilevel Design Template Particularized for Example Problems 81
3.3 VERIFICATION AND VALIDATION OF TEMPLATE-BASED APPROACH TO MULTILEVEL DESIGN 88
3.3.1 Domain-Independent Structural Validity 88
3.3.2 Domain-Independent Performance Validity 91
3.4 SYNOPSIS OF CHAPTER 3 92
4 CONCEPTUAL EXAMPLE – DESIGN OF A CANTILEVER BEAM 94
4.1 OVERVIEW OF CONCEPTUAL EXAMPLE – DESIGN OF A CANTILEVER BEAM 96
4.1.1 Introduction to Cantilever Beam Example Problem 97
4.1.2 Multilevel Design Approach to Cantilever Beam Design 101
4.1.3 Value in Completing Cantilever Beam Example Problem 104
4.2 CANTILEVER BEAM DESIGN PROCESS AND SOLUTION 105
4.2.1 Multilevel Design Template Particularized for Cantilever Beam Design 106
4.2.2 Cantilever Beam Design Process 108

viii
4.2.3 Cantilever Beam Inductive Design Solution 125
4.3 VERIFICATION AND VALIDATION BASED ON CANTILEVER BEAM DESIGN 129
4.3.1 Verification and Validation of Computational Design Tools in Cantilever Beam Design 129
4.3.2 Verification and Validation of Multilevel Design Template Based on Cantilever Beam Design 130
4.4 SYNOPSIS OF CHAPTER 4 135
5 COMPREHENSIVE EXAMPLE – DESIGN OF A BLAST RESISTANT PANEL 136
5.1 OVERVIEW OF COMPREHENSIVE EXAMPLE – DESIGN OF A BLAST RESISTANT PANEL 138
5.1.1 Introduction to Blast Resistant Panel Example Problem 139
5.1.2 Multilevel Design Approach for Blast Resistant Panel Design 144
5.1.3 Value in Completing Blast Resistant Panel Example Problem 147
5.2 BLAST RESISTANT PANEL DESIGN PROCESS AND SOLUTION 148
5.2.1 Multilevel Design Template Particularized for Blast Resistant Panel Design 149
5.2.2 Blast Resistant Panel Design Process 150
5.2.3 Blast Resistant Panel Inductive Design Solution 179
5.3 VERIFICATION AND VALIDATION BASED ON BLAST RESISTANT PANEL DESIGN 189
5.3.1 Domain-Specific Structural Validity 190
5.3.2 Domain-Specific Performance Validity 192
5.4 SYNOPSIS OF CHAPTER 5 201
6 METHOD VALIDATION AND CLOSING STATEMENTS 203
6.1 INTELLECTUAL CONTRIBUTIONS BASED ON ANSWERING RESEARCH QUESTIONS 205

ix
6.1.1 Development of Multilevel Design Template 205
6.1.2 Application of Multilevel Template to Blast Resistant Panel Design 209
6.2 VERIFICATION AND VALIDATION OF MULTILEVEL DESIGN TEMPLATE 210
6.2.1 Domain-Independent Structural Validity 212
6.2.2 Domain-Specific Structural Validity 214
6.2.3 Domain-Specific Performance Validity 214
6.2.4 Domain-Independent Performance Validity 220
6.3 ADDRESSING THE GAP – COMPLETED AND FUTURE WORK IN TEMPLATE-BASED MULTILEVEL DESIGN 222
6.3.1 Addressing the Research Gap 223
6.3.2 Future Work Relating to Multilevel Design Template 225
6.3.3 Future Work Related to Example Problems 228
6.3.4 Extending Template-Based Multilevel Design Methodology 231
6.3.5 Vision for Template-Based Engineering Design of the Future 231
6.3.6 Lessons Learned from the Design and Application of a Multilevel Design Template 234
6.4 SYNOPSIS OF CHAPTER 6 237
APPENDIX A PAHL AND BEITZ SYSTEMATIC PRODUCT DESIGN METHOD 238
APPENDIX B REQUIREMENTS LIST FOR BLAST RESISTANT PANEL DESIGN 239
APPENDIX C BLAST RESISTANT PANEL PERFORMANCE AND VARIATION OF PERFORMANCE CALCULATIONS 244
APPENDIX D VERIFICATION AND VALIDATION OF COMPUTATIONAL DESIGN TOOLS IN BRP DESIGN 271
APPENDIX E DATA POINTS FOR BRP PARETO CURVES 278
REFERENCES 280

x
LIST OF TABLES
CHAPTER 1 Page
Table 1.1 – Summary of Chapter 1 2
Table 1.2 – Validation strategy implemented in this thesis 19
CHAPTER 2
Table 2.1 – Summary of Chapter 2 24
Table 2.2 – Requirements list for a multilevel design process based on critical needs in a multiscale materials design process 30
CHAPTER 3
Table 3.1 – Summary of Chapter 3 62
CHAPTER 4
Table 4.1 – Summary of Chapter 4 95
Table 4.2 – cDSP for multilevel cantilever beam design 98
Table 4.3 – Requirements list for cantilever beam design 99
Table 4.4 – Cantilever beam design parameters 109
Table 4.5 – Cantilever beam Level 1 cDSP 110
Table 4.6 – Cantilever beam Level 2 cDSP 113
Table 4.7 – Cantilever beam Level 3 cDSP 117
Table 4.8 – Bounds on design variables for cantilever beam design 118
Table 4.9 – Design variables and deviation variables to find in beam design solution 122
Table 4.10 – Cantilever beam design variable data: Level 1 125
Table 4.11 – Cantilever beam performance data: Level 1 125
Table 4.12 – Cantilever beam material property data: Level 1 125
xi
Table 4.13 – Cantilever beam design variable data: Level 2 126
Table 4.14 – Cantilever beam performance data: Level 2 126
Table 4.15 – Cantilever beam material property data: Level 2 126
Table 4.16 – Cantilever beam design variable data: Level 3 127
Table 4.17 – Cantilever beam performance data: Level 3 128
Table 4.18 – Cantilever beam material property data: Level 3 128
CHAPTER 5
Table 5.1 – Summary of Chapter 5 137
Table 5.2 – cDSP for multilevel BRP design 141
Table 5.3 – BRP design variables 152
Table 5.4 – BRP Level 1 cDSP 154
Table 5.5 – BRP Level 2 cDSP 158
Table 5.6 – BRP Level 3 cDSP 163
Table 5.7 – Bounds on design variables in BRP design 170
Table 5.8 – Design variables and deviation variables to find in BRP design solution 174
Table 5.9 – Cantilever beam design variable data: Level 1 179
Table 5.10 – Cantilever beam performance data: Level 1 179
Table 5.11 – BRP design variable data: Level 2 180
Table 5.12 – BRP performance data: Level 2 180
Table 5.13 – BRP design variable data: Level 3 180
Table 5.14 – BRP performance data: Level 3 181
Table 5.15 – Robust vs. non-robust BRP performance at Level 1 182
Table 5.16 – Robust vs. non-robust BRP design solution at Level 1 182
Table 5.17 – Robust vs. non-robust BRP performance at Level 2 183
Table 5.18 – Robust vs. non-robust BRP design solution at Level 2 184

xii
Table 5.19 – Robust vs. non-robust BRP performance at Level 3 184
Table 5.20 – Robust vs. non-robust BRP design solution at Level 3 185
Table 5.21 – Inductive vs. deductive BRP performance at Level 3 188
Table 5.22 – Inductive vs. deductive BRP performance at Level 3 188
Table 5.23 – Pareto frontier data outlier analysis 198
Table 5.24 – Weighting scheme to best achieve design goals based on Pareto curves 199
CHAPTER 6
Table 6.1 – Summary of Chapter 6 203
Table 6.2 – Research contributions of this thesis 205
Table 6.3 – Summary of verification and validation of multilevel design template presented in this thesis 211
APPENDIX
Table B.1 – BRP Requirements List for the advancement of multiscale robust design methodology 239
Table B.2 – BRP Requirements List for the verification and validation of template based approach to the robust design of multiscale systems 240
Table B.3 – BRP Requirements List for satisfying customer requirements 242
Table E.1 – Pareto curve data points supporting Figure 5.17 278

xiii
LIST OF FIGURES
CHAPTER 1 Page
Figure 1.1 – Setting the context for Chapter 1 3
Figure 1.2 – Multiscale design process at product and material levels 5
Figure 1.3 – Schematic of BRP sandwich structure under uniform impulse loading 10
Figure 1.4 – BRP design team with individual research goals 11
Figure 1.5 – Addressing the research questions throughout thesis 13
Figure 1.6 – Validation Square construct 15
Figure 1.7 – Design method validation: a process of building confidence in usefulness with respect to a purpose 16
Figure 1.8 – Validation strategy implemented in this thesis 19
Figure 1.9 – Overview of example problems 20
CHAPTER 2
Figure 2.1 – Setting the context for Chapter 2 25
Figure 2.2 – The design of an aircraft and it associated material – a multilevel design problem 26
Figure 2.3 – Current materials design research 28
Figure 2.4 – Materials design process 29
Figure 2.5 – Multilevel-multiscale design process 32
Figure 2.6 – Multilevel-homogenization design process 33
Figure 2.7 – Multilevel-multiscale vs. multilevel-homogenization 34
Figure 2.8 – Types of uncertainty in design processes 37
Figure 2.9 – Robust design for variations in noise factors and control factors 40
Figure 2.10 – Type III robust design 41
xiv
Figure 2.11 – Multiscale robust design 44
Figure 2.12 – Word formulation of cDSP 51
Figure 2.13 – Mathematical formulation of cDSP 51
Figure 2.14 – Research gap in multilevel, template-based design 57
CHAPTER 3
Figure 3.1 – Setting the context for Chapter 3 63
Figure 3.2 – An example of information flow in a model chain 64
Figure 3.3 – Diagram of the inductive design exploration concept 65
Figure 3.4 – Procedure for IDEM 67
Figure 3.5 – Calculation of HD-EMI 70
Figure 3.6 – Building blocks of a design template 73
Figure 3.7 – Word formulation of generic multilevel design template compared to cDSP 75
Figure 3.8 – Generic design template for a single level design process 76
Figure 3.9 – Generic design templates for single level design combined in a multilevel design process 77
Figure 3.10 – Simplification of generic multilevel design process 78
Figure 3.11 – Combined multilevel design template 81
Figure 3.12 – Diagram of the inductive design exploration concept for cantilever beam design problem 84
Figure 3.13 – Multilevel robust design template for cantilever beam example problem 85
Figure 3.14 – Diagram of the inductive design exploration concept for BRP design problem 87
Figure 3.15 – Multilevel robust design template for BRP example problem 87
Figure 3.16 – Information flow chart for multilevel design template 89
Figure 3.17 – Value added to verification and validation of design template in Chapter 3 92

xv
CHAPTER 4
Figure 4.1 – Setting the context for Chapter 4 96
Figure 4.2 – Dimensions and loading conditions of cantilever beam 97
Figure 4.3 – Multilevel design approach for cantilever beam example 102
Figure 4.4 – Multilevel design approach for cantilever beam example 103
Figure 4.5 – Overview and motivation for cantilever beam example problem 104
Figure 4.6 – Generic word formulation of multilevel design template 106
Figure 4.7 – Multilevel design template for cantilever beam product and materials design 107
Figure 4.8 – Material properties as a function of x 112
Figure 4.9 – Information flow in beam design at level 2 114
Figure 4.10 – Cantilever beam design approach for level 3 116
Figure 4.11 – Deductive material mapping functions for cantilever beam design 119
Figure 4.12 – Inductive material mapping functions for cantilever beam design 120
Figure 4.13 – Uncertainty mapping of cantilever beam material properties 121
Figure 4.14 – Volume fraction graph for level 2 beam design 127
Figure 4.15 – Volume fraction graph for level 3 beam design 129
Figure 4.16 – Value added to verification and validation of design template – Chapter 4 134
CHAPTER 5
Figure 5.1 – Setting the context for Chapter 5 138
Figure 5.2 – Sample blast resistant panels 139
Figure 5.3 – BRP under uniform pressure loading 140
Figure 5.4 – BRP design problem divided according to levels of model precision complexity 145
Figure 5.5 – Multilevel design approach for cantilever beam example 146

xvi
Figure 5.6 – Overview and motivation for BRP example problem 147
Figure 5.7 – Multilevel model 1: One solid panel 153
Figure 5.8 – BRP Design Studio, a graphical user interface implemented in MATLAB 157
Figure 5.9 – Multilevel model 2: Three solid panels 158
Figure 5.10 – Multilevel model 3: Solid panels surrounding honeycomb core 163
Figure 5.11 – Mapping functions of material properties in BRP design (deductive) 171
Figure 5.12 – Mapping functions of material properties in BRP design (inductive) 172
Figure 5.13 – Uncertainty mapping in BRP design 173
Figure 5.14 – BRP starting point analysis – level 1 193
Figure 5.15 – BRP starting point analysis – level 2 194
Figure 5.16 – BRP starting point analysis – level 3 194
Figure 5.17 – BRP Pareto curves for Level 3 BRP design 195
Figure 5.18 – Value added to verification and validation of design template –Chapter 5 201
CHAPTER 6
Figure 6.1 – Setting the context for Chapter 6 204
Figure 6.2 – Verification and validation of this thesis using the Validation Square 211
Figure 6.3 – Addressing the research gap 223
Figure 6.4 – Collaborative, distributive multilevel design process 233
APPENDIX
Figure A.1 – Pahl and Beitz systematic product design method 238
Figure D.1 – BRP deflection analyzed in ABAQUS 273
Figure D.2 – Single panel deflection analyzed in ABAQUS 275
Figure D.3 – A comparison of uniform and spherical loading conditions on a solid plate 276

xvii
Figure D.4 – A comparison of peak pressure values for uniform and spherical loading conditions resulting in similar panel deflection 277

xviii
LIST OF SYMBOLS AND ABBREVIATIONS
Across-section Cross-sectional area
Ai(x) System achievement in cDSP
a Characteristic cross-section dimension
B In-plane spacing of webs of square honeycomb core
BRP Blast resistant panel
cDSP Compromise decision support problem
cpi Control point at location i
+−ii dd , Deviation variables in cDSP
δ, δmax, ∆δ Deflection, maximum deflection, variation of deflection
E Young’s Modulus
εc Average crushing strain of BRP core
F Force
g Gravitational constant
Gi System goal in cDSP
gδ, ∆gδ BRP deflection constraint function, variance in deflection constraint
gM, ∆gM BRP mass constraint function, variance in mass constraint
gSH1, ∆gSH1 BRP front face shear constraint 1, variance in front face shear constraint 1
gSH2, ∆gSH2 BRP front face shear constraint 2, variance in front face shear constraint 2
ΓSH BRP front face shear constraint 1 value
HH , Thickness of undeformed and deformed BRP core layer, respectively
hc, hf, hb Thickness of core webs and face sheets, respectively
HD-EMI i Hyper-Dimensional Error Margin Index in i performance direction
htotal Total height of BRP
I0 Impulse for BRP loading

xix
KEI, KEII BRP kinetic energy per unit area in panel after stages 1 and 2, respectively
L Length of cantilever beam, length of BRP
λc, λs Factors governing strength of BRP core in crush and stretch
m Mass
M, ∆M BRP mass / area, variation in BRP mass / area
µp, ∆p Mean and standard deviation of impulse peak pressure
µt, ∆t Mean and standard deviation of impulse load characteristic pulse time
p0 Peak pressure of free-field pulse
ρ Density
ρf, ρb, ρc Density of front face sheet, core, and back face sheet of a BRP
∆ρ Variation in density
Rc Relative density of BRP core layer
s.f. Safety factor
σy Yield strength
σy,f, σy,b, σy,c Yield strength of front face sheet, core, and back face sheet of a BRP
∆σy Variation in yield strength
Ti Target performance
t0 Characteristic time of incident pressure pulse
vfi Volume fraction at location i
w Weight (w = mg)
wi Weight of design goal i
IIIpW Plastic work per unit area dissipated in stage three
Z Deviation function in cDSP

xx
GLOSSARY OF KEY TERMS
The Glossary of Key Terms presents fundamental definitions in the context of multilevel
design, robust design, and template-based design with contributions from Matthias
Messer and Stephanie Thompson of the Systems Realization Laboratory at Georgia Tech.
Blast Resistant Panel (BRP) – (noun) a sandwich structure consisting of solid front and back face sheets surrounding a honeycomb core. Under impulse loading, BRPs are designed to experience less deflection than solid plates of equal mass.
Deductive Design Solution – (noun) in a multilevel design problem, a solution that is obtained by transferring design information from the most specific model to the most general model. Also called a bottom-up design approach.
Design – (verb) to systematically plan out a product or process, often in graphic form. To create or contrive a product or process for a particular purpose or effect (compiled from www.dictionary.com).
Design Complexity – (noun) a measure of the interactions and couplings in a system model denoted by the number of independent design variables (degrees of freedom) used to describe system performance.
Design Freedom – (noun) the extent to which a system can be modified while still meeting design requirements (Simpson, et al. 1996)
Design Template – (noun) a pattern, used as a guide in making decisions in a design process. A design process having a preset format, used as a starting point for a particular design application so that the format does not have to be recreated each time it is used (Panchal, et al. 2004; compiled from www.dictionary.com)
Inductive Design Solution – (noun) in a multilevel design problem, a solution that is obtained by transferring design information from the most general model to the most specific model. Also called a top-down design approach.
Level – (noun) a position or plane in a graded scale of values. An extent, measure, or degree of intensity. A division of a multilevel design problem representing the

xxi
precision of system performance models used in making design decisions (compiled from www.dictionary.com).
Materials Design – (noun) the process of tailoring material properties to meet design goals. Also referred to multiscale materials design, denoting the various length scales at which material performance is modeled and design decisions are made (e.g., nanometer scale, micrometer scale)
Model Abstraction – (noun) the extent to which system behavior is modeled using generalizations to approximate actual, concrete system phenomena (compiled from www.dictionary.com).
Model Fidelity – (noun) the adherence of system performance models to actual system behavior. As model abstraction increases, model fidelity decreases. In general, as design complexity increases, model fidelity increases.
Multilevel Design – (noun) a subset of engineering design methods in which design problems are defined and analyzed at various levels of design complexity.
Multiscale Design – (noun) a subset of engineering design methods in which design problems are defined and analyzed at various length and / or time intervals.
Robust Design – (noun) a method for improving the quality of products and processes by reducing their sensitivity to variations, thereby, reducing the effect of variability without removing its sources (Seepersad 2004; Taguchi 1986; Taguchi and Clausing 1990).
Scale – (noun) a length or time interval at which system performance models are designed in order to predict system behavior in a multiscale design process.
Satisficing – (adj) a term describing a solution that may be sub-optimal, but sufficiently meets system requirements (Simon 1996).

xxii
SUMMARY
PROBLEM: Traditional methods in engineering design involve producing solutions at a
single level. However, in complex engineering design problems, such as concurrent
product and materials design, extensive design space exploration at a single level is
cumbersome if not impossible. Therefore, to encourage design space exploration,
complex engineering design problems can be divided and analyzed at various levels of
model complexity, known as a multilevel design approach. One example of multilevel
design is the design of a material, product, assembly, and system. However, it is
observed that analyzing design problems at multiple levels increases the possibility for
introducing and propagating uncertainty. Therefore, critical needs of multilevel design
processes include the organization and simplification of complex design information and
the management of propagated design uncertainty.
APPROACH: Design templates are reusable, modular design process units that can be
applied to a variety of design problems. One way to address the critical needs of
multilevel design is the application of a template-based design approach with multilevel
design methods. Additionally, it is advantageous to infuse multilevel robust design
techniques in a template-based multilevel design environment. Design solutions that
perform predictably in the presence of uncertainty are robust designs. The Inductive
Design Exploration Method (IDEM) is an existing design method used to produce robust
multilevel design solutions. In this thesis, a multilevel design template with robust
design goals is created based on the Compromise Decision Support Problem and IDEM.
The verification and validation of the multilevel design template is examined using the
Validation Square construct which involves investigation of the theoretical and
performance capabilities of the multilevel design template.

xxiii
RESEARCH QUESTIONS:
Primary Research Question – How can information regarding multilevel robust design
processes be captured and stored in a reusable format?
Primary Research Hypothesis – Information regarding robust multilevel design processes
can be captured and stored in a reusable format by developing generic, reusable,
computer executable design templates based on the Compromise Decision Support
Problem (cDSP) and Inductive Design Exploration Method (IDEM).
Secondary Research Question – How can information regarding the robust multilevel
design of blast resistant panels by captured and stored in a reusable, computer-executable
format?
Secondary Research Hypothesis – By particularizing a generic multilevel design template
for the multilevel robust design of blast resistant panels and translating design process
information to computer-interpretable modules, information regarding the robust
multilevel design of blast resistant panels can be captured and stored in a reusable,
computer-executable format.
CONTRIBUTIONS: In this thesis, the possibilities of a template-based approach to
multilevel design are explored. A multilevel design template for producing inductive
multilevel robust solutions for complex engineering design problems is developed and
validated. The multilevel design template is particularized and applied to two example
problems including the multilevel design of a cantilever beam and its associated material
and the multilevel design of a blast resistant panel. Based on the successful application
of the multilevel design template to example problems, confidence is built in the ability
to apply the template to additional multilevel engineering design problems.
1
CHAPTER 1
FOUNDATIONS OF MULTILEVEL DESIGN
The motivation for this thesis is to investigate the robust design of multilevel systems
using design templates. As stated in the glossary of key terms, multilevel design is a
subset of engineering design in which design problems are defined and analyzed at
various levels of complexity. Additionally, template-based design is a strategy for
simplifying a design process by using predefined design templates to support design
decision-making. In this thesis, a design template is developed for a multilevel design
environment, and applied to two multilevel design problems. In order to design systems
that are insensitive to variation, robust design concepts are embedded in the multilevel
design template.
Much of the current research in multilevel design relates to multiscale materials design in
which material properties are tailored in order to meet specific design requirements. In a
multiscale materials design process, material behavior is predicted based on design and
analysis models at various length and time scales (e.g., length [continuum, mesometer,
micrometer, nanometer, etc.]; time [second, microsecond, nanosecond, etc.]). The term
“multiscale” is used to denote the different length and time scales of material
performance analysis in a materials design process. However, in this thesis, the term
“multilevel” rather than “multiscale” is adopted in order to convey a broader design
concept. Instead of limiting investigation to length and time measurements, in this thesis,
measures of design complexity in a multilevel design process are analyzed. Therefore,
the terms “multilevel” and “design level” are used to convey the idea of a design process
in which performance analysis tools are developed to predict system behavior at various
levels of model complexity.

2
At the beginning of each chapter, a figure and table are presented in order to give a
summary of the information in the current chapter (Table 1.1), and to show how the
current chapter relates to remaining thesis chapters (Figure 1.1).
Table 1.1 – Summary of Chapter 1
Heading / Sub-Heading Information Multilevel Design – A Framework for Solving Complex Design Problems Multilevel Design of
Engineering Systems Multilevel design overview:
- A design process divided into levels of model complexity
- Example multilevel design problem—aircraft design Multilevel Design Challenges Challenges in multilevel design:
- Partitioning a complex design problem - Characterizing level-to-level interactions - Deductive vs. inductive solution paths - Multilevel robust design approach
Frame of Reference Robust Design of Multilevel
Systems Summary of robust design concepts applied to multilevel design problems
Template-Based Design Approach
Summary of template-based design approach in engineering design
Template-Based Design of BRPs
BRP design: - Overview of motivating example for this thesis - Template-based design approach applied to BRP
design - BRP collaboration team
Research Focus and Contributions Research Questions and
Hypotheses - Primary research question and hypothesis - Secondary research question and hypothesis
Research Contributions Research contributions in this thesis: - Development of a template-based approach to
multilevel design - Multilevel robust design solution to BRP design
problem Method Validation Strategy – The Validation Square Verifying and Validating
Design Methods Motivation for method validation
Thesis Validation Strategy Validation Square: - Description of Validation Square construct - How to apply Validation Square to a thesis - Validation strategy for this thesis
Overview of Example Problems Design of a Cantilever Beam
and its material Overview of cantilever beam example problem
Design of a BRP Overview of BRP example problem Chapter 1 Synopsis

3
Chapter 1 begins with a description of multilevel design and its challenges. In Section
1.2, the frame of reference for this thesis is established with a discussion of robust design
of multilevel systems and a template-based design approach. In Section 1.3, the research
focus of this thesis is presented, including the primary and secondary research questions
and hypotheses. Research contributions from this thesis are also discussed. The design
method validation strategy used in this thesis is presented in Section 1.4. Chapter 1
concludes with an overview of the example problems completed in this thesis.
1
2 3
4
Motivation for thesis:• Multilevel design: advantages and
challenges• Frame of reference: multilevel design,
robust design, template based design• Research questions and hypotheses• Method verification construct• Overview of example problems
Robust Design
Multilevel Design
Design Uncertainty
Design Templates
MO
TIV
AT
ION
ME
TH
OD
AN
ALY
SIS
CLO
SU
RE
1 – Motivation 2 – Literature Review
4 – Cantilever Beam
6 – Method Validation
5 – Blast Resistant Panel
3 – Theoretical Foundations
Figure 1.1 – Setting the context for Chapter 1

4
1.1 MULTILEVEL DESIGN – A FRAMEWORK FOR SOLVING COMPLEX
DESIGN PROBLEMS
Multilevel design is an approach for managing design complexity. With the current trend
of increasing product performance requirements, many design problems are too complex
to allow for thorough and agile design space exploration given the current computational
tools. By applying a multilevel design approach, prohibitively complex design problems
are divided into levels of manageable complexity. Design prediction models are created
at each level, and design information is passed among all levels. Overall design decisions
are made by combining design information at each design level. In Section 1.1 an
overview of multilevel design and the key challenges faced in multilevel design are given.
1.1.1 Multilevel Design of Engineering Systems
As stated in the glossary of key terms, multilevel design is a subset of engineering design
methods in which design problems are defined and analyzed at various levels of design
complexity. Multilevel design processes begin with a complex design problem with
many design variables. In order to fully explore the extensive design space defined by
many design variables, the complex design problem is divided according to levels of
model complexity. The complexity of design levels is directly related to the number of
design variables used to describe system performance. Design information among
various levels is combined in making overall design decisions.
For complex design problems, a multilevel design approach is preferred over traditional
design methods in order to mange vast design complexity and to limit the use of
unnecessarily complex prediction models in decision-making. The system prediction
models of a multilevel design process vary in complexity and, therefore, computation
cost. In a multilevel design approach, complex models are only referred to when such

5
prediction accuracy is needed. Otherwise, less complex (and less computationally
expensive) prediction models are used in design design-making.
An example of multilevel design is shown in the aircraft design problem in Figure 1.2.
At the least complex design level, overall system specifications (aircraft dimensions, total
mass, geometry, etc.) are used to model aircraft performance (velocity, drag, thrust, etc.).
As model complexity increases, aircraft subsystems are considered when modeling
overall aircraft performance. At this more complex design level, the relationship between
individual aircraft subsystems and overall aircraft performance is modeled. Increasing in
design model complexity, each component and part in the aircraft system is modeled in
order to predict overall aircraft performance. As prediction models continue to increase,
material specifications of each part are modeled in determining overall system
performance. The most complex design level considers the quantum characteristics of
each material in predicting overall aircraft performance.
Figure 1.2 – Multiscale design process at product and material levels (Seepersad 2004)

6
Aircraft design presents significant design complexity with thousands, if not millions, of
design variables. With current computational limitations, it is not feasible to holistically
model, analyze, and design an aircraft while simultaneously considering all design
variables. By implementing a multilevel design approach, aircraft performance models
are developed at various levels of design complexity and design decisions are made at
each level. Design information is then shared with other design levels and overall system
design decisions are determined.
1.1.2 Multilevel Design Challenges
Several of the key challenges in multilevel design are presented in Section 1.1.2. These
multilevel design challenges are addressed in a multilevel design template presented in
Chapter 3. Multilevel design challenges are as follows:
Partitioning a complex design problem – When presented with a complex design problem,
it can be difficult to know how to divide the design problem according to levels of
model complexity. The main challenge is in determining how much detail in system
performance models is needed in order to reach a valuable overall design solution.
With most product design problems, it is unnecessary to model material specifications
below the continuum level. However, as concurrent product and materials design
increases in popularity, detailed material models are needed in system prediction
models.
Level-to-level interactions – An additional multilevel design challenge exists in sharing
design information among various design levels. Mapping functions must be
developed to describe the relationship between design variables at each level.
Additionally, in a computational design environment, the appropriate computational
infrastructure must be developed in order to pass design data among various design
levels.

7
Deductive vs. inductive solution paths – Once system performance has been sufficiently
modeled at each level, design information at each level is used to make design
decisions regarding the overall system. In order to reach an overall design solution,
the designer must choose between two solution paths: deductive or inductive. As
defined in the glossary of key terms, a deductive design solution is achieved by
making design decisions progressing from specific design models to general design
models. In contrast, an inductive design solution is achieved from analyzing design
information from general to specific design models. In engineering design, inductive
solution paths are preferred because this approach allows design goals to be stated at
the beginning of a design process and details regarding the achievement of these
goals to be presented at the end of a design process.
Multilevel robust design – The distributed and collaborative nature of multilevel design
causes it to be susceptible to propagated uncertainty in the design and analysis
process chain. When design information at various levels is generated and analyzed
using different design tools in different locations, potential error is introduced as
design information is transferred. In order to achieve a robust multilevel design
solution, uncertainty must be modeled and managed. In Chapter 3, a method for
multilevel robust design is implemented in a template-based approach to multilevel
design. Robust design concepts are discussed in more detail in Section 1.2.1, Chapter
2 and Chapter 3.
1.2 FRAME OF REFERENCE
In Section 1.2, the frame of reference for this thesis is presented with a discussion of
multilevel robust design and template-based design. More details regarding each of these
topics are presented in a literature review in Chapter 2. Additionally, the motivating
example for this thesis, the design of a blast resistant panel, is presented.

8
1.2.1 Robust Design of Multilevel Systems
Robust design is the practice of improving the quality of products by reducing sensitivity
to noise factors, including uncertainty. When products are robust, performance levels
remain stable despite the presence of noise factors (Taguchi 1986; Taguchi, et al. 1990).
A robust solution may have lower performance levels than an optimum solution in the
absence of variation; however, a robust solution produces predictably satisfactory results
in the presence of variation. In multilevel design problems where the likelihood of
uncertainty introduction and propagation is high, robust solutions are often favored.
The concept of designing for robustness was made popular by Taguchi (Taguchi 1986).
Taguchi recognized that some noise factors could not be controlled; therefore, designs
should be robust to these uncontrollable variations. Rather than increase the cost of a
product by trying to eliminate noise factors, Taguchi proposed to minimize the variance
of performance as well as bringing the mean on target. Uncertainty in multilevel design
problems arises from noise factors, uncertain control factors, uncertain system models,
and propagated process chain uncertainty. The concepts of robust design proposed by
Taguchi have been adapted to a multilevel robust design method, the Inductive Design
Exploration Method (IDEM) (Choi, et al. 2005). In IDEM robust solutions are selected
by minimizing response variation while maximizing distance to design variable bounds.
IDEM is the base method for a template-based approach to multilevel robust design
developed in Chapter 3. A formal review of robust design is presented in Chapter 2.
1.2.2 Template-Based Design Approach
Design templates are reusable design process modules that support decision-making at
various stages in design. In order to facilitate reuse, design templates are created with
sufficient generality so that they can be applied to a variety of design problems. Design
templates supporting decisions at various stages in design can be linked to accommodate

9
the specific needs of individual design processes. Design templates can be created at
various ranges of abstraction. At a high level of abstraction, design templates resemble
generic decision support structures that can be applied at any stage of the design process,
in any design domain. Design templates at a lower level of abstraction can take the form
of computer executable modules developed for a specific type of design problems
(Panchal, et al. 2004).
The principle goal in this thesis is to develop a design template to support multilevel
robust design. In this thesis, design templates at various levels of abstraction are created,
starting with a generic design template, and then progressing to a design template for
solving a specific design problem. In Chapter 3, a design template at a high level of
abstraction is developed to demonstrate the concepts involved in a multilevel robust
design process. When solving the example problems in Chapter 4 and Chapter 5, the
general multilevel design template is particularized for application in the specific
example problems.
1.2.3 A Template-Based Approach to the Robust Design of Blast Resistant Panels
The motivating example in this thesis is the design of a blast resistant panel. Blast
resistant panels (BRPs) are sandwich structures consisting of solid front and back face
sheets surrounding a honeycomb core. An example of the type of BRPs designed in this
thesis is shown in Figure 1.3.
As shown in Figure 1.3, the front face sheet receives the initial pressure loading from a
blast. The topology of the core is designed to dissipate a majority of the impulse energy
in crushing. The back face sheet provides additional protection from the blast as well as a
means to confine the core collapse and absorb energy in stretching.

10
hf
hb
hc
B
H
p(t)
hf
hb
hc
B
H
p(t)
Front face sheet
Back face sheet
Core
Figure 1.3 – Schematic of BRP sandwich structure under uniform impulse loading
Due to the complex nature of a BRP, it is advantageous to implement a multiscale robust
design approach in solving this design problem. Additionally, a reusable template-based
BRP design process is beneficial in exploring various potential alterations in BRP design
including the addition of a fill material in core cells, expanding the number of panel
layers, and exploring new material systems. The multilevel BRP design problem
provides the motivation for developing a template-based approach to multilevel robust
design, presented in Chapter 3. The successful implementation of the developed
multilevel design template in BRP design adds value to the validation of the developed
template, a topic that is discussed in more detail in Section 1.4. The BRP design problem
is a collaborative effort among students of the Systems Realization Lab at Georgia Tech.
In Figure 1.4, students involved in BRP design, along with individual research interests,
are presented.

11
Stephanie Thompson
Hannah Muchnick
Matthias Messer
Hae-Jin Choi
Jin Song
Gautam Puri
How can we decide between material design
and material selection in a BRP design process?
How can we design BRPs using multilevel
design templates?
How can we design a BRP concurrently with the
material and the design process?
How can we manage the design of a BRP in
a collaborative environment?
How can we perform a detailed
analysis of a BRP?
How can we efficiently analyze and modify BRP
configurations?
Figure 1.4 – BRP design team with individual research goals
1.3 RESEARCH FOCUS AND CONTRIBUTIONS
The primary and secondary research questions and hypotheses addressed in this thesis are
given in Section 1.3. The research questions are formulated out of the need to develop a
multilevel design template for application in BRP design.
1.3.1 Research Questions and Hypotheses
The primary research question relates to the development of a multilevel design template
to provide a reusable, adaptable framework for completing the design of multilevel
systems. In the primary research hypothesis, it is proposed that the multilevel design
template be based on an existing multiscale robust design method, IDEM (Choi, et al.
2005). The primary research question and hypothesis are listed below.

12
The secondary research question relates to the implementation of the developed
multilevel design template in the design of blast resistant panels. The secondary research
question and hypothesis are listed below.
Primary Research Question
How can information regarding multilevel robust design processes be captured and
stored in a reusable format?
Primary Research Hypothesis
Information regarding robust multilevel design processes can be captured and stored
in a reusable format by developing generic, reusable, computer executable design
templates based on the Compromise Decision Support Problem (cDSP) and Inductive
Design Exploration Method (IDEM).
Secondary Research Question
How can information regarding the robust multilevel design of blast resistant panels
by captured and stored in a reusable, computer-executable format?
Secondary Research Hypothesis
By particularizing a generic multilevel design template for the multilevel robust
design of blast resistant panels and translating design process information to
computer-interpretable modules, information regarding the robust multilevel design
of blast resistant panels can be captured and stored in a reusable, computer-executable
format.

13
The primary research question is addressed with the development of a multilevel design
template (Chapter 3); the secondary research question is addressed in the implementation
of the robust design template in the multilevel design of BRPs (Chapter 5). The
verification and validation of the multilevel design template is evaluated using the
Validation Square Construct (see Section 1.4). A visual representation of how the
research questions are addressed in the remainder of this thesis is given in Figure 1.5.
Research Question 1
Research Question 2
Research Question 1
CHAPTER 1Foundations
CHAPTER 2Lit. Review
CHAPTER 3Template
CHAPTER 4Beam Design
CHAPTER 5BRP Design
CHAPTER 6Validation
Motivation / Background Method ValidationExamples
Figure 1.5 – Addressing the research questions throughout thesis
1.3.2 Research Contributions
The main contributions presented in this thesis are the development of a multilevel design
template and its application in the robust multilevel design of a BRP. The research
contributions are realized in addressing the primary and secondary research questions.
Details regarding research contributions in this thesis are presented in Section 1.3.2 and
analyzed in Section 6.1.
Multilevel Robust Design Template
In Chapter 3, a multilevel design template is presented. The multilevel design template is
developed from a template-based approach to engineering design and an existing
multilevel robust design method, IDEM. The design template is a reusable pattern to
support decision-making in multilevel design problems. The multilevel design template
is a contribution to the field of engineering design because it combines two design

14
approaches, multilevel robust design and template-based design, in order to create a
design tool to capture and store multilevel robust design information in a reusable format.
As it is presented in Chapter 3, the multilevel design template is sufficiently general such
that it can be applied to a variety of multilevel design problems. In Chapter 4 and
Chapter 5, the developed design template is particularized into computer-executable
modules for solving two example problems, the design of a cantilever beam and its
material and the design of a BRP.
Robust, Multilevel BRP Design
The motivating example in this thesis is the robust design of a BRP. The second main
research contribution in this thesis is the particularization and application of the
multilevel design template for the robust design of a BRP such that BRP design
information is captured and stored in a reusable, computer-interpretable format. The
design approach presented in the generic multilevel design template (Chapter 3) is
adapted to computer-executable modules to aid in design decisions in the multilevel
robust design of a BRP (Chapter 5).
1.4 METHOD VALIDATION STRATEGY – THE VALIDATION SQUARE
In this thesis, the verification and validation of the multilevel design template is assessed
using the Validation Square construct. The Validation Square is a tool used to ease the
leap of faith required to move from theory to practice in engineering design methodology.
The progression of building confidence in the usefulness of the method based on the
Validation Square is broken into four stages and is shown in Figure 1.6 (Seepersad, et al.
2005). A review of method validation using the Validation Square is presented in
Section 1.4. In Section 1.4.1, an overview of method validation is presented, and in
Section 1.4.2, a strategy for validation and verification of this thesis is presented.

15
Domain-Independent Structural Validity
Internal consistency of design method
Is the design method internally consistent?
Domain-Specific Performance Validity
Appropriateness of the example problem(s).
Are the example problems used in modeling the method appropriate choices?
Domain-IndependentPerformance Validity
Ability to produce useful results beyond the chosen example problem(s).
Does the application of the method to other problems produce practical results?
Domain-Specific Performance Validity
Ability to produce useful results for the chosen example problem(s).
Does the application of the method to the sample problems produce practical results?
1
2 3
4
Figure 1.6 – Validation Square construct
1.4.1 Verifying and Validating Design Methods
Section 1.4.1 on method validation using and the Validation Square is leveraged with
minor modification from the Ph.D. dissertation of Carolyn Conner Seepersad (Seepersad
2005).
Validation—justification of knowledge claims, in a modeling context—of engineering
research has typically been anchored in formal, rigorous, quantitative validation based on
logical induction and/or deduction. As long as engineering design is based primarily on
mathematical modeling, this approach works well. Engineering design methods,
however, rely on subjective statements as well as mathematical modeling; thus,
validation solely by means of logical induction or deduction is problematic. Pedersen
and coauthors and Seepersad and coauthors propose an alternative approach to validation
of engineering design based on a relativistic notion of epistemology in which “knowledge

16
validation becomes a process of building confidence in its usefulness with respect to a
purpose.”
The Validation Square is a framework for validating design methods in which the
‘usefulness’ of a design method is associated with whether the method provides design
solutions correctly (structure validity) and whether it provides correct design solutions
(performance validity). Additionally, the validity of the method itself (domain-
independent) and the method applied to example problems (domain-specific) is addressed.
This process of validation is represented graphically in Figure 1.7.
(1) and (2)
STRUCTURALVALIDITY
(3)
Domain-SpecificSTRUCTURAL
VALIDITY
(4) and (5)
Domain-SpecificPERFORMANCE
VALIDITY
(6)
Domain-IndependentPERFORMANCE
VALIDITY
DESIGNMETHOD
IInput:•information•resources
IOutput:•Design Solution
PURPOSE:
Defined based onExperience and Judgment
USEFULNESS:METHOD Efficient and / or
Effective in achieving thearticulated purpose(s).
METHOD VALIDITYMETHOD is valid from structuraland performance perspectives for
achieving the articulated purpose(s).
Structural Validity:Qualitative Evaluation of
consistency of METHOD
Performance Validity:Quantitative Evaluation ofperformance of METHOD
METHOD VALIDITYCriteria: USEFULNESS with
respect to a PURPOSE
METHOD VALIDITYCriteria: USEFULNESS with
respect to a PURPOSE
Appropriateness ofexample problems used to
verify METHODusefulness
Correctness of METHOD-constructs, both Separately
and Integrally
Performance of DesignSolutions and Method
beyond example problems
Performance of DesignSolutions and Method with
respect to exampleproblems
and supporting examples
Domain-Independent
Figure 1.7 – Design method validation: a process of building confidence in usefulness
with respect to a purpose (Seepersad, et al. 2005)
17
With respect to the quadrants of the Validation Square, domain-independent structure
validity involves accepting the individual constructs constituting a method as well as the
internal consistency of the assembly of constructs to form an overall method. Domain-
specific structure validity includes building confidence in the appropriateness of the
example problems chosen for illustrating and verifying the performance of the design
method. Domain-specific performance validity includes building confidence in the
usefulness of a method using example problems. Domain-independent performance
validity involves building confidence in the generality of the method and accepting that
the method is useful beyond the example problems.
How can this validation framework be implemented in a thesis?
Establishing domain-independent structure validity involves searching and referencing
the literature related to each of the parent constructs utilized in the design method. In
addition, flow charts are often useful for checking the internal consistency of the
design method by verifying that there is adequate input for each step and that
adequate output is provided for the next step. A list of criteria may be useful for
establishing and comparing the domain-independent structure validity of methods and
constructs with respect to a set of explicit, favorable properties.
Establishing domain-specific structural validity consists of documenting that the example
problems are similar to the problems for which the methods/constructs are generally
accepted, that the example problems represent actual problems for which the method
is intended, and that the data associated with the example problems can be used to
support a conclusion.
Domain-specific performance validity can be established by using representative example
problems to evaluate the outcome of the design method in terms of its usefulness.
Metrics for usefulness should be related to the degree to which the method’s purpose
has been achieved (e.g., reduced cost, reduced time, improved quality). It is also

18
important to establish that the resulting usefulness is, in fact, a result of applying the
method. For example, solutions obtained with and without the construct/method can
be compared and/or the contribution of each element of the method can be evaluated
in turn. An important part of domain-specific performance validity is empirical
verification of data used to support domain-specific performance validation.
Empirical verification can be established by demonstrating the accuracy and internal
consistency of the data. For example, in optimization exercises, multiple starting
points, active constraints and goals, and convergence can be documented to verify
that the solution is stationary and robust. For any engineering model it is important to
verify that data obtained from the model represents aspects of the real world that are
relevant to the hypotheses in question. The model should react to inputs in an
expected manner or in the same way that an actual system would react.
Domain-independent performance validity can be established by showing that the
method/construct is useful beyond the example problem(s). This may involve
showing that the problems are representative of a general class of problems and that
the method is useful for these problems; from this, the general usefulness of the
method can be inferred.
1.4.2 Thesis Validation Strategy
In Table and 1.2 and Figure 1.8, an outline of the validation strategy for this thesis is
presented. It is arranged according to the quadrants in the Validation Square, and
references are included for chapters in which method validation is documented. In
Chapter 3 – Chapter 5, contributions to method validation are presented at the end of each
chapter. A detailed summary of the validation of the multilevel design template is given
in Chapter 6.

19
Table 1.2 – Validation strategy implemented in this thesis
Domain-Independent Structural Validity
The multiscale robust design template is based on existing multiscale robust design method (IDEM).
The internal consistency of the template is largely dependent on the internal consistency of the base
method. The internal consistency of the base method and multiscale design template are considered
in (Chapter 2, Chapter 3).
Domain-Specific Structural Validity
The appropriateness of selected problems is based on the ability of the examples to test the various
aspects of the multiscale design template. That is, the example should be clearly defined and
multiscale in nature. The appropriateness of example problems is address (Chapter 4, Chapter 5).
Domain-Specific Performance Validity
The reasonableness of design results when applying the multiscale template is investigated by
observing the value of design solutions obtained from completing the example problems.
Additionally, the value that the design template adds to a multiscale design process is discussed in
(Chapter 4, Chapter 5).
Domain-Independent Performance Validity
The likelihood of producing desirable results when applying the design template to other multiscale
design problems is investigated by considering the generic, mutable nature of the template and
determining the type of design problems for which the design template is best suited. Discussed in
(Chapter 3, Chapter 6)
Domain-Specific Structural Validity
CHAPTERS 4, 5
Beam BRP
Domain-Independent Structural Validity
CHAPTERS 2, 3
Variables
Bounds
Constraints
Goals
Preferences
Performance Model
Response
Single Scale Design Template
Design Template
Domain-Independent Structural Validity
CHAPTERS 2, 3
Variables
Bounds
Constraints
Goals
Preferences
Performance Model
Response
Single Scale Design Template
Design Template
Domain-Specific Performance Validity
CHAPTERS 4, 5
Variables
Bounds
Constraints
G oals
Preferences
Performance Model
Response
Single Scale Design Template
Design Template Implementation
Domain-Independent Performance Validity
CHAPTERS 3, 6
V ariables
Bounds
Constraints
Goals
Preferences
Performance Model
Response
Single Scale Design Template
Design Template Abstraction
Domain-Independent Performance Validity
CHAPTERS 3, 6
V ariables
Bounds
Constraints
Goals
Preferences
Performance Model
Response
Single Scale Design Template
Design Template Abstraction
Figure 1.8 – Validation strategy implemented in this thesis

20
1.5 OVERVIEW OF EXAMPLE PROBLEMS
In this thesis, two example problems relating to multilevel robust design using design
templates are presented and solved. The example problems are chosen based on their
appropriateness in relation to the primary and secondary research questions. The
example problems play a valuable role in the verification and validation of a design
template approach for the robust design of multilevel systems. Successfully applying
design templates to the example problems and observing useful results builds confidence
in the validity of the developed multilevel design template. An overview of the example
problems is given in Section 1.5 and illustrated in Figure 1.9.
Figure 1.9 – Overview of example problems
hf
hb
hc
B
H
p(t)
hf
hb
hc
B
H
p(t)
Example Problem Motivation
Cantilever Beam Design Design of a cantilever beam and its associated material
• Design goals minimize beam weight maximize beam robustness to uncertainty in material properties
• Design constraints maximum deflection δmax ≤ 1 cm safety factor ≥ 1 • Design variables material properties of beam
beam cross-sectional area
• Example problem used to illustrate the concepts of template-based multilevel robust design and to validate developed multilevel design template
L = 2 ma
F = 10 N
a
δmax = 0.01 m
w = ρg
Blast Resistant Panel Design Design of a blast resistant panel
• Design goals minimize BRP deflection & mass maximize BRP robustness to uncertainty in material properties and loading conditions
• Design constraints maximum deflection δmax ≤ 0.1L mass / area ≤ 100 kg/m2
additional constraints • Design variables material properties of BRP
dimensions of BRP
• Example problem intended as a comprehensive illustration of template-based multilevel robust design and to validate developed multilevel design template

21
1.5.1 Overview of Conceptual Example – Design of a Cantilever Beam
The conceptual example problem involves the design of a cantilever beam and its
associated material, presented in Chapter 4. The loading conditions, variable bounds, and
performance constraints are given in the design problem. The design goals include
minimizing beam mass while maximizing beam robustness to uncertainty in material
properties. Since the beam example contains the concurrent design of product and
material, the example problem is easily identified as a multilevel design problem. The
multilevel design template is particularized for use in solving the cantilever beam design
problem. The design process and results obtained add value to the verification and
validation of the developed template based approach to the robust design of multilevel
systems. The conceptual example problem is selected because it is useful in illustrating
the concepts of multilevel robust design using design templates. This conceptual
example problem is relatively simple, and is used to demonstrate the ideas discussed in
the thesis without unneeded difficulties of solving a complex example problem.
1.5.2 Overview of Comprehensive Example – Design of a Blast Resistant Panel
A second example, more comprehensive in nature, is presented and solved in Chapter 5.
The comprehensive example is used to illustrate the effectiveness of the developed
template-based approach to multilevel design problems for typical problems encountered
in a non-idealized engineering design process. The comprehensive example problem
involves the design of a BRP. The loading conditions, variable bounds, and performance
constraints are given in the design problem. The design goals are to minimize BRP
deflection, minimize BRP mass / area and maximize system robustness to uncertainty in
loading conditions and materials properties. The various levels of geometric complexity
of the design problem cause the design problem to be multilevel in nature. The
multilevel design template developed in Chapter 3 is particularized and applied to the
BRP design problem. As with the conceptual example, the successful completion of the

22
comprehensive example problem builds confidence in the validity of the developed
template based approach to multilevel design problems.
1.6 SYNOPSIS OF CHAPTER 1
At the conclusion of each chapter, a chapter synopsis is given. The chapter synopsis is
intended to summarize the information presented in the previous chapter, and introduce
topics discussed in the following chapter. Chapter 1 provides the introduction and
motivation for this thesis. Chapter 1 begins with a discussion of multilevel design and its
challenges. Then, the frame of reference for this thesis—robust design and template-
based design—is discussed. Next, the research focus is presented including the research
questions and hypotheses and research contributions. The strategy for method validation
in this thesis is presented with a discussion of the Validation Square. Chapter 1
concludes with an overview of the two example problems that are completed in this thesis
in order to add value to the verification and validation of a template-based approach to
multilevel robust design.
Chapter 2 continues the establishment of the motivation and frame of reference of this
thesis with a review of relevant topics in design literature in order to identify areas of
research opportunity. The identified research gaps in Chapter 2 directly correlate with
the research questions presented in Chapter 1. In Chapter 3, the theoretical foundations
of this thesis are developed with the creation and discussion of a multilevel design
template. In Chapters 4 and 5 the multilevel design template is applied to two example
problems—the design of a cantilever beam and it associated material and the design of a
BRP. In Chapter 6 aspects of method validation presented throughout the thesis are
brought together with a thorough assessment of the validity of the multilevel design
template. Chapter 6 also contains the research contributions of this thesis and
opportunities for future research.

23
CHAPTER 2
MULTILEVEL TEMPLATE-BASED ROBUST DESIGN – REVIEW
OF LITERATURE AND IDENTIFICATION OF RESEARCH GAPS
In Chapter 2, key concepts of template-based multilevel robust design are presented. To
begin, a discussion of multilevel design and materials design as a multilevel design
process is presented. Then, topics relating to uncertainty and robust design are discussed.
Uncertainty classification and previously developed robust design methods are presented.
Then, information regarding a template-based approach to design is presented. With each
reviewed topic, an explanation of its value added to the work presented in this thesis is
given. At the end of Chapter 2, areas for development in template-based multilevel
robust are identified. The research gap is the motivation for formulating the primary and
secondary research questions.
The work presented in this thesis is intended to illustrate the extension and
implementation of existing engineering design concepts, rather than the development of
new fields of study for template-based multilevel robust design. Therefore, topics such
as multilevel design, uncertainty and robust design, template-based design, and method
validation are given in the reviewed literature in order to present the foundation from
which the work in this thesis begins. Significant portions of Chapter 2 are adapted from
the work of former and current graduate students in the Systems Realization Laboratory,
with specific contributions identified in the text. In Section 2.4, research opportunities in
multilevel robust design are identified based on the current state of research discussed in
Section 2.1 – Section 2.3. A summary of Chapter 2 is given in Table 2.1. An illustration
of the topics presented in Chapter 2 in the context of the entire thesis is shown in Figure
2.1.

24
Table 2.1 – Summary of Chapter 2
Heading / Sub-Heading Information Multilevel Design Definition of Multilevel Design Multilevel design:
- Definition - Aircraft design example
Materials Design – A Multilevel Design Problem
Materials design overview including: - Definition - Methods to achieve materials design - Materials design process - Key requirements in materials design - Requirements list for multilevel robust design
process Uncertainty and Robust Design Uncertainty in a Design Process Design uncertainty:
- Non-parametric system noise - Un-configured system noise
Robust Design Definition Robust design overview Robust Design Classification Robust design classification – (Type I, Type II, Type
III, multiscale robust design) Design Templates Design Templates in Engineering
Design Definition of design template as related to engineering design
Requirements for Design Templates Key requirements: - Reusable - Modular - Mutable - Archival
The Compromise Decision Support Problem – A Design Template
Presentation of cDSP and robust design techniques using the cDSP
Research Opportunities Research Opportunities Relating to
Multilevel Robust Design – From Multiscale Design to Multilevel Design
Extending the usefulness of the concepts in multiscale materials design to include all complex engineering design problems
Research Opportunities Relating to a Template-Based Approach to Multiscale Robust Design
Adapting robust design methods (specifically, IDEM) to a template-based design environment
Chapter 2 Synopsis

25
1
2 3
4
Reviewed topics include:• Multilevel design• Uncertainty in design• Robust design• Design templates• Validation of design methods
MO
TIV
AT
ION
ME
TH
OD
AN
ALY
SIS
CLO
SU
RE
1 – Motivation 2 – Literature Review
4 – Cantilever Beam
6 – Method Validation
5 – Blast Resistant Panel
3 – Theoretical Foundations
Figure 2.1 – Setting the context for Chapter 2
2.1 MULTILEVEL DESIGN
In Section 2.1 a review of multilevel design literature is given in an effort to identify
future research opportunities in this field. Since the term “multilevel design” is most
commonly known as “multiscale design” in engineering design literature, Section 2.1.2
contains a discussion of multiscale materials design, a subset of multilevel design. In
Section 2.4 areas for future development in multilevel design are discussed.
2.1.1 Definition of Multilevel Design
Multilevel design is gaining particular interest in the engineering design community due
to increased complexity and more demanding performance requirements in engineering
design problems. Recall from Chapter 1 that multilevel design is a subset of engineering

26
design in which design problems are defined and analyzed at various levels of complexity.
Due to the relatively new nature of multilevel design concepts, a common taxonomy for
the study of multilevel design has not been widely adopted in the engineering design
community. Therefore, basic definitions for multilevel design are provided in the
glossary of key terms. Contributions to the glossary of key terms were provided by
Matthias Messer and Stephanie C. Thompson of the Systems Realization Lab.
Recall from Section 1.1.1 (Figure 1.2) in which the design of an aircraft and its associated
material is given as an example of a multilevel design problem. Figure 1.2 is reproduced
in Figure 2.2, with additional details added.
Level 1
Level 2
Level 3
Level 4
Level 5
Level 6
Increased model
complexity
Figure 2.2 – The design of an aircraft and it associated material – a multilevel design
problem. Modified from: (Seepersad 2004)

27
In Figure 2.2, the illustrated multilevel design process contains six levels of model
complexity. At Level 1, the aircraft is modeled as a single product with overall product
specifications (dimensions, mass, propulsion, etc.). As one moves to Level 2, aircraft
subsystems are considered in system performance models. Modeling aircraft
performance becomes much more complex when systems and subsystems are considered
due to an increasing amount of detail considered in product performance models. As
design complexity increases, material specifications are considered at Level 4 to Level 6,
representing the materials design portion of this design problem. By increasing the
complexity with which system performance is predicted (i.e., increasing design level)
system performance is more accurately predicted, although the cost of performance
models increases. The concept of modeling and designing a multilevel design problem
using levels of model complexity is a key topic addressed in this thesis.
2.1.2 Materials Design – A Multilevel Design Problem
As shown in Figure 2.2, materials design is part of a multilevel design process (often
called multiscale materials design in the materials design community). Materials design
is the process of tailoring material properties to meet the requirements of specific design
problems (Seepersad 2004). Materials can be tailored or adapted to produce new
materials with specific properties and performance levels. Examples of materials design
are given in Figure 2.3 and include topology design and functionally grading material
properties. In the past, new materials were created largely by a process of experimental
trial and error, and new materials were often discovered by chance. Today researchers
are in the process of defining a systematic design method for integrated product and
materials design. Materials design is investigated in this thesis because multiscale
material modeling and design, a well-developed research field, contains many similarities
to the idea of multilevel modeling and design discussed in this thesis.

28
Linear Cellular Alloys
Functionally Graded Materials2.2Rapid Manufacturing2.1
Figure 2.3 – Current materials design research. Modified from: (Seepersad 2004)12
Designing new materials is complicated by the fact that the performance of a material is
determined by several inter-related characteristics (processing, structure, property,
performance) as shown in Figure 2.4. The processing link represents the manufacturing
processes used to create a material. The structure link represents the microstructure of
the material. The processing path directly affects a material’s microstructure. A
material’s microstructure is identified by (for example) grain size and distribution. The
property link in the chain in Figure 2.4 represents the physical properties of the material.
The microstructure of a material directly impacts the properties of the material. Material
properties describe the behavior of a material and can be found in many engineering
material tables (for example, Young’s Modulus, density, and thermal conductivity). The
performance of a material describes how a part constructed from the given material
behaves under specific conditions.
2.1 Image from: Laser Center Flanders, http://www.lcv.be/nl/nieuwe_ontw.asp?id=123&oper=show rubriek_id=10 [cited February 3, 2007] 2.2 Image from: University of Oslo, http://www.math.uio.no/avdb/faststoff/felt_eng.shtml [cited February 3, 2007]

29
Structure
Property
PerformanceTop-Down Approach (inductive)
Bottom-Up Approach (deductive)Processing
Structure
Property
PerformanceTop-Down Approach (inductive)
Bottom-Up Approach (deductive)Processing
Figure 2.4 – Materials design process. Modified from: (Olsen 1997)
Current materials design processes are deductive in nature (bottom-up). Changing the
processing path of a material adjusts its microstructure. Adjusting the microstructure of a
material changes the properties and performance of the material. From an engineering
design perspective, it is advantageous for materials design processes to consist of an
inductive (top-down) approach in which designers specify the required material
performance at the beginning of the design process. Then the material properties,
microstructure, and processing path will be determined based on the material
performance requirements.
A definition for materials design in the context of this thesis is given in the glossary of
key terms. Critical needs in a materials design problem, unique from design problems
that take place at a single level, are listed below (based on research collaboration with
Matthias Messer and Stephanie C. Thompson of the Systems Realization Lab). In a
materials design process, due to the varying levels of design complexity used in
predicting material performance, it is shown that materials design is a multilevel design
process. The critical needs of a materials design process is abstracted in the development
of a requirements list for a multilevel design process, given in Table 2.2.
Critical needs in a multiscale materials design process:
- Quasi unlimited design freedom in material configuration and composition

30
- Strong couplings between subsystems, multiple disciplines, and physical
phenomena at various scales
- Coupling between differing physical phenomena at various scales must be
explicitly modeled and accounted for in decision making
- Fundamentally different types of models appear at various scales and model
refinement may lead to fundamentally different types of models
- Significantly greater complexity than in conventional systems implying the
necessity of designer expertise
- Uncertainty generation and propagation within and throughout scales must be
understood, modeled, and managed
- The need for a single design process that holistically describes the overall design
variables, bounds, constraints, and goals in a multiscale materials design process
- Complexity displayed in a unmanageably large number of design variables which
inhibits extensive and agile design space exploration
Table 2.2 – Requirements list for a multilevel design process based on critical needs in a
multiscale materials design process
Requirements list for a multilevel design process Issued On: 1/23/2007
Problem Statement: Design a multilevel design process that facilitates design decision-making at various levels of model complexity, and addresses the critical needs identified in a multiscale materials design process (see text in previous paragraph for critical needs)
# Demand/Wish Requirements
Overall Design Process
1 D Encompasses design information and decision-making at various levels of model complexity
2 D Multilevel design process is sufficiently general to ensure successful application to a variety of multilevel design problems
3 D Provides the information infrastructure in order to pass design information among inherently different design models at various levels
4 W Increased complexity implies a greater need for designer expertise. Should be flexible to allow modifications from designer at any stage in design process

31
Table 2.2 (continued) – Requirements list for a multilevel design process based on
critical needs in a multiscale materials design process
Interactions and Couplings Among Levels 5 D Couplings among levels should be sufficiently understood and modeled
6 D Interfaces between inherently different models should allow for design information flow
Managing Design Freedom
7
W Number of design variables should be limited to allow agile design space exploration at most complex design levels
Uncertainty Modeling and Management
8 W Uncertainty generation and propagation within and throughout scales should be understood, modeled, and managed
The concept of materials design as a multilevel design process is included in the reviewed
literature because materials design is a key topic currently addressed in multiscale design
research, and multiscale materials design is a specific class of multilevel design. In
Section 2.4, opportunities for future research related to multilevel design are given.
Additionally, the topic of product and materials design is addressed in the example
problems in Chapter 4 and Chapter 5 in which concurrent product and material multilevel
design problems are solved.
2.1.3 Multilevel-Multiscale vs. Multilevel-Homogenization Design Processes
Multilevel design is described in two ways: multilevel-multiscale design and multilevel-
homogenization design. An example of multilevel-multiscale design relating to BRP
design is shown in Figure 2.5 (a multilevel-multiscale design process is also shown in
Figure 1.2 and Figure 2.2). Multilevel-multiscale design is a multilevel design process in
which an increase in model complexity relates to a decrease in system length and / or
time scale. As shown in Figure 2.5, BRP design is only one aspect of an overall
multilevel design problem describing tank design. In Figure 2.5, the examined multilevel
system of tank design is situated at Level 1, indicating that prediction models at all levels
are used to describe the performance of the overall tank system. An increase in design
level indicates an increase in design complexity described by a decrease in length scale

32
used to predict overall tank performance. The first three levels illustrated relate to system
specifications including the overall system (tank design), subsystems (BRP subsystem),
and components (BRP core layer). Increasing in model complexity, material
specifications at the microscale, nanoscale, and quantum levels are considered in
modeling tank behavior, representing the multiscale materials design portion of this
multilevel-multiscale design process.
Level 1
Level 2
Level 3
Level 4
Level 5
Level 6
Increased model
complexity
Figure 2.5 – Multilevel-multiscale design process
Multilevel design is also described using homogenization techniques categorized as
multilevel-homogenization design. Multilevel-homogenization design is a multilevel
design problem at a single length and / or time scale divided into levels of model
complexity. In a multilevel-homogenization design problem, model complexity (or
simplicity) is achieved by approximating system performance with varying degrees of

33
accuracy. Simplified system performance models are derived based on approximations
of more complex performance models through a series of homogenization techniques.
BRP design described as a multilevel-homogenization process is shown in Figure 2.6.
Deterministic Modeling
Solid Plate
3 Solid Plates
Cellular Core
Finite Element
Analysis
Solid Plate
3 Solid Plates
Cellular Core
Level 1
Level 2
Level 3
Level 4
Level 5
Level 6
Increased model
complexity
Figure 2.6 – Multilevel-homogenization design process
In Figure 2.6, the designed multilevel system is a BRP, shown at each level in the design
process. In contrast to Figure 2.5, all levels of BRP design in Figure 2.6 relate to design
at a single length scale. An increase in design level the multilevel-homogenization
process in Figure 2.6 results in an increase in model complexity used to predict BRP
performance. The multilevel-homogenization process in Figure 2.6 is divided into two
segments—modeling BRP performance using deterministic models and modeling BRP
performance using finite element analysis. The least complex level in Figure 2.6
represents modeling BRP performance using deterministic performance models of a

34
single, solid plate. Increasing in model complexity, BRP performance is predicted using
analytical models representing multiple panels and a honeycomb core. As BRP
performance is more accurately modeled, finite element analysis is used to predict system
performance. The most complex level in Figure 2.6 is finite element analysis of a three-
layer BRP with honeycomb core used to model BRP performance.
Multilevel-multiscale and multilevel-homogenization design process are related, as
shown in Figure 2.7.
SystemSpecifications
System
Subsystem
Components
Parts
MaterialSpecifications
Meso
Continuum
Molecular
Quantum
Increased model
complexity
SystemSpecifications
System
Subsystem
Components
Parts
SystemSpecifications
System
Subsystem
Components
Parts
MaterialSpecifications
Meso
Continuum
Molecular
Quantum
MaterialSpecifications
Meso
Continuum
Molecular
Quantum
Increased model
complexity
Deterministic Modeling
Solid Plate
3 Solid PlatesCellular Core
Finite Element Analysis
Solid Plate
3 Solid PlatesCellular Core
Increased model
complexity
Multilevel-Multiscale
Multilevel-Homogenization
Figure 2.7 – Multilevel-multiscale vs. multilevel-homogenization
Multilevel-homogenization is a method for further investigating a single level of a
multilevel-multiscale design process. Once a multilevel-multiscale design problem is

35
established, a multilevel-homogenization approach is employed to make design decisions
at a single level of multilevel-multiscale design. As seen in Figure 2.7, a multilevel-
multiscale design process involving tank design is presented. Then, a multilevel-
homogenization process, based on Level 3 BRP design is abstracted from the multilevel-
multiscale design process. The multilevel-homogenization design process involving BRP
design is an approach for modeling BRP behavior using various levels of model
complexity. Performance models for BRP design from the multilevel-homogenization
process are then inserted into the multilevel-multiscale design process in order to aid the
designer in decision-making in the complex multilevel-multiscale design environment.
The multilevel design template presented in Chapter 3 can be applied in either multilevel-
multiscale or multilevel-homogenization design problems. Example problems
investigated in this thesis are classified as multilevel-homogenization because design
phenomena at a single length scale are modeled with varying degrees of accuracy using
homogenization techniques.
2.2 UNCERTAINTY AND ROBUST DESIGN
In the following section, a discussion on the classification of uncertainty and techniques
for managing uncertainty in a design process are presented. Information in Section 2.2 is
leveraged with minor modifications from the Ph.D. dissertation of Hae-Jin Choi (Choi
2005). Section 2.2 on uncertainty and robust design is included in this thesis in order to
provide a thorough background on robust design techniques, and identify opportunities
for advancement in this area, specifically related to multilevel design. The template-
based approach to multilevel robust design presented in Chapter 3 is rooted in the
multilevel robust design method presented in the following section, and discussed in
detail in Chapter 3.

36
2.2.1 Uncertainty in a Design Process
There are four sources of uncertainty that are associated with uncertainty embedded in
system functions of an engineering design problem. Uncertainty sources include (a) non-
parametric system noise, (b) un-configured system noise, (c) model parameter uncertainty,
and (d) model structure uncertainty. First, uncertainty of system functions may arise
from “non-parametric system noise”. Non-parametric system noise is the source of noise
that is difficult for designers to parameterize numerically. When system responses vary
without the variance of noise factors or control factors, the system may include non-
parametric system noise. However, non-parametric system noise is difficult to represent
numerically, resulting in a challenging issue in system design at small length levels.
Second, system functions could have “un-configured system noise”. This un-configured
system noise is similar to non-parametric system noise because system response varies
without input changes. However, in this case, the system has un-configured parameters
that could be parameterized as numeric forms, but are not because of limited knowledge
of and/or data for the system. Since un-configured system noise can be reduced by
increasing the knowledge of the system, it is categorized as model structural uncertainty.
2.2.2 Robust Design Definition
Robust design is a method of improving the quality of products by reducing sensitivity to
uncertainty in noise factors, control factors (design variables), and models. When
product designs are robust, performance levels remain stable despite the presence of
noise factors (Taguchi 1986; Taguchi 1990). Various types of uncertainty are shown in
Figure 2.8. Types of uncertainty include uncertainty in noise factors (Type I), uncertainty
in control factors (Type II), uncertainty in system models (Type III), and propagated
process chain uncertainty (multiscale uncertainty). Robust design techniques have been
developed specifically for each type of uncertainty shown in Figure 2.8. A more

37
thorough explanation of types of uncertainty and robust design techniques is given in
Section 2.2.3.
y = Response
z = Noise Factors
x = Control Factors
y1 = x2 = Control Factors
z1 = Noise Factors
x1 = Control Factors
y2 = Response
z2 = Noise Factors
y1 = Response
y = f(x,z)y1 = f(x1,z1)
y2 = f(x2,z2)
Uncertainty in: Noise Factors, Control Factors, and Response Model Propagated Model Chain Uncertainty
Figure 2.8 – Types of uncertainty in design processes
In typical robust design problems, the variance of a performance objective function is
minimized with respect to environmental conditions, loading conditions, material
properties, and other noise factors (Seepersad 2004). The variance of the response is
minimized while also maximizing the response, minimizing the response, or bringing the
response to a target. The robust solution may be inferior to the optimum solution in the
absence of variation; however, the robust solution produces predictably satisfactory
results in the presence of variation.
2.2.3 Robust Design Classification
The following section on uncertainty and robust design, unless otherwise noted, are
leveraged with slight modifications from the work of Hae-Jin Choi in his Ph.D.
dissertation (Choi 2005). Efforts in this thesis are focused on extending the
implementation of multilevel robust design techniques, rather than the development of
new methods to facilitate multilevel robust design. Therefore, the review of uncertainty

38
and robust design completed by Choi provides a satisfactory review of these topics for
the work presented in this thesis. In the following section, definition and classification of
uncertainty are presented.
Type I Uncertainty
One of the main forms of uncertainty in a system model is uncertainty in uncontrollable
independent system parameters, which are known as “noise factors”. Noise factors are in
parametric form and may be quantified and characterized as continuous numbers with or
without probability information. Noise factors are usually given in system models as
environmental factors, operating conditions, boundary conditions, or materials property
variances that may be represented as continuous parameters and cannot be controlled by
designers. Uncertainty in noise factors can exist as one of the aforementioned uncertainty
types (Section 2.2.1); however, the most dominant type of uncertainty is variability
(natural uncertainty), which can be measured using statistical methods. The degree of
uncertainty in noise factors can be decreased by increasing the size of sampling and/or
adapting efficient uncertainty analysis methods, leaving only irreducible statistical
variability. In order to design a system robust to the uncertainty in noise factors, Type I
robust design was proposed by Taguchi (Taguchi 1987).
Type I robust design is used to design systems that satisfy a set of performance
requirement targets despite variations in noise factors which are uncertain, uncontrollable,
independent, system parameters. Although Taguchi’s robust design principles (Taguchi
1993) are advocated widely in both industrial and academic settings, his statistical
techniques, including orthogonal arrays and signal-to-noise ratio, have been criticized
Type I Robust Design: Identify control factor (design variable) values that satisfy a
set of performance requirement targets despite variation in noise factors.

39
extensively, and improving the statistical methodology has been an active area of
research (Chen, et al. 1996; Myers and Montgomery 1995; Nair 1992; Tsui 1992; Tsui
1996). During the past decade, a number of researchers have extended robust design
methods for a variety of applications in engineering design (Cagan and Williams 1993;
Chen, et al. 1996; Chen and Lewis 1999; Mavris, et al. 1999; Parkinson, et al. 1993; Su
and Renaud 1997; Yu and Ishii 1994).
Type II Uncertainty
The second form of uncertainty in a system model is uncertainty in controllable system
variables, which are known as “control factors”. Similar to noise factors, control factors
are also represented parametric form, measured and characterized as continuous numbers
with or without probability distribution. Control factors are usually derived from the
characterized parameters in system models that relate to system performances, including
geometric information, mass, electrical, mechanical, or chemical inputs, amounts of
constituents in materials, process control inputs, etc. Designers can determine the means
of control factors; however, the deviations of control factors may not be controllable.
Therefore, control factors should be characterized in a manner similar to noise factors. In
order to design a system robust to the uncertainty in control factors, Type II robust design
was proposed by Chen and coauthors (Chen, et al. 1996) as shown in Figure 2.9.
Type II Robust Design: Identify control factor (design variable) values that satisfy a
set of performance requirement targets despite variation in control and noise factors.

40
Y
X
Deviation or Objective Function
Deviationat Optimal Solution
Deviationat Type I, II Robust Solution
Design VariableType I, IIRobustSolution
OptimalSolution
Res
pons
e
TYPE I
TYPE II
y =
Res
pons
e
z = Noise Factors
x =
Con
trol
F
acto
rs
y = f(x,z)
y =
Res
pons
e
z = Noise Factors
x =
Con
trol
F
acto
rs y = f(x,z)
Figure 2.9 – Robust design for variations in noise factors and control factors. Modified
from: (Choi 2005)
Type II robust design is used to design systems that are robust to possible variations in
system parameters as a design evolves. In Type II robust design, designers search for
means of control factors that satisfy a set of performance requirement targets despite
variation in control factors. A method combining Types I and II robust design in the
early stages of product development, namely, the Robust Concept Exploration Method
(RCEM) has been developed (Chen 1995). RCEM is a domain-independent approach for
generating robust, multidisciplinary design solutions. Robust solutions to multifunctional
design problems are preference-weighted trade-offs between expected performance and
sensitivity of performance due to deviations in design or uncontrollable variables. These
solutions may not be absolute optima within the design space. By strategically
employing experiment-based metamodels, some of the computational difficulties of
performing probability-based robust design are alleviated. RCEM has been employed
successfully for a simple structural problem and design of a solar powered irrigation
system (Chen 1995), a High Speed Civil Transport (Chen, et al. 1996), a General
Aviation Aircraft (Simpson, et al. 1996), product platforms (Simpson, et al. 2001), and
other applications (Chen, et al. 2001).

41
Type III Uncertainty
The third factor for the uncertainty embedded in system functions is “model parameter
uncertainty,” which is due to a combination of limited data and nonparametric system
noise (or un-configured system noise). For example, if a nondeterministic system
analysis is computationally intensive or experimentally expensive, then the limited data
will result in uncertain parameters in metamodels (such as response surface models) of
the system response. This is the typical type of uncertainty in materials design that
employs computationally intensive models. The final factor for the uncertainty
embedded in a system model is “model structural uncertainty” that is due to assumptions
and idealization in a system. For example, model structural uncertainty includes
linearization and discretization errors in finite element analysis, errors in computer codes,
employment of uncertain knowledge, and other assumptions due to limited information.
The uncertainty embedded in a system model cannot be managed by previous robust
design approaches (Type I and II). In order to manage this uncertainty, a new type of
robust design approach, called Type III robust design, is proposed. A visual
representation of Type III robust design, compared to Type I and Type II robust design, is
shown in Figure 2.10.
Type I, II, IIIRobustSolution
Upper Limit
Lower Limit
Deviation or Objective Function
Deviationat Optimal Solution
Deviationat Type I, II Robust Solution
Deviationat Type I, II, III Robust Solution
Type I, IIRobustSolution
OptimalSolution
TYPE III
y =
Res
pons
e
x =
Con
trol
F
acto
rs
Y
XDesign Variable
Res
pons
e
z = Noise Factors
y = f(x,z)
Figure 2.10 – Type III robust design (Choi 2005)

42
Type III Robust Design is illustrated in Figure 2.10. In the figure, the same objective
function curve is employed to show the differences among the optimal solution, Type I
and II robust solution, and Type I, II and III robust solutions. A deviation (or objective)
function, which represents the system’s response, is illustrated as a solid curve. In
addition, two dotted curves are added around the objective function, representing
uncertainty limits, which is due to the non-parametric variability, un-configured
variability, and model parameter uncertainty as mentioned above. Considering not only
the objective function but also the two uncertainty limits, the optimal and Type I and II
robust solution have larger performance deviations than the Type I, II, and III robust
solution.
Type III robust design becomes more important since modern engineering systems are
getting more and more complex (or extremely small) and their behaviors are stochastic.
Compared to Type I and II robust design, Type III robust design has not been studied
rigorously in engineering systems design. The absence of the studies is due to the
ignorance of this uncertainty in most of traditional engineering systems design problems
or the difficulties in quantifying and incorporating this uncertainty into a design
exploration process.
For Type III robust design, it is required to build error bounds (uncertainty bounds) in a
model in a computationally inexpensive manner. The most accurate way to incorporate
the embedded uncertainties as well as the uncertainty in control and noise factors during
Type III Robust Design: Identify adjustable ranges for control factors (design
variable), that satisfy a set of performance requirement targets and/or performance
requirement ranges and are insensitive to the variability within the model.

43
design exploration is to perform actual simulation using statistical techniques
(simulation-based design). Monte Carlo Simulation is a popular method to measure
variations of performance by simulating input variations (uncertainty analysis). Du and
coauthors employed this approach for a relatively simple problem (Du and Chen 2000).
Even though this approach could produce accurate results in design exploration, it
requires a large number of experiments (more than 10,000 in many cases) for uncertainty
analysis even in a single evaluation during a design exploration process. However, most
multiscale material performance analyses need intensive computing power (from half an
hour to several days for a single simulation run). It is nearly impossible to employ this
approach in materials design exploration even if a sampling technique, such as Latin
Hypercube sampling, is applied to reduce the number of experiments. Computationally
inexpensive uncertainty analysis methods are needed to solve this problem. In this
section, Type III robust design is defined. In the next section, a strategy for managing
propagated uncertainty in a design/analysis process chain is presented.
Multiscale Uncertainty
The final type of uncertainty in a complex system model is that generated in the design
and analysis process chain, which, unlike the aforementioned uncertainties in a system
model, arises from the complex design and analysis process chain and not from the
system model itself. This type of uncertainty is often observed in multidisciplinary
uncertain system design problems and includes errors in decisions made by other
designers and accumulated errors (propagated uncertainty) by subsequent series of
uncertain subsystem models. Typically, complex multidisciplinary system design
requires multiple experts to collaborate to make decisions for designing a system. The
outputs of other experts’ decisions in a subsystem could be input parameters, constraints,
or design spaces of other subsystems or systems design. In many cases, multiple
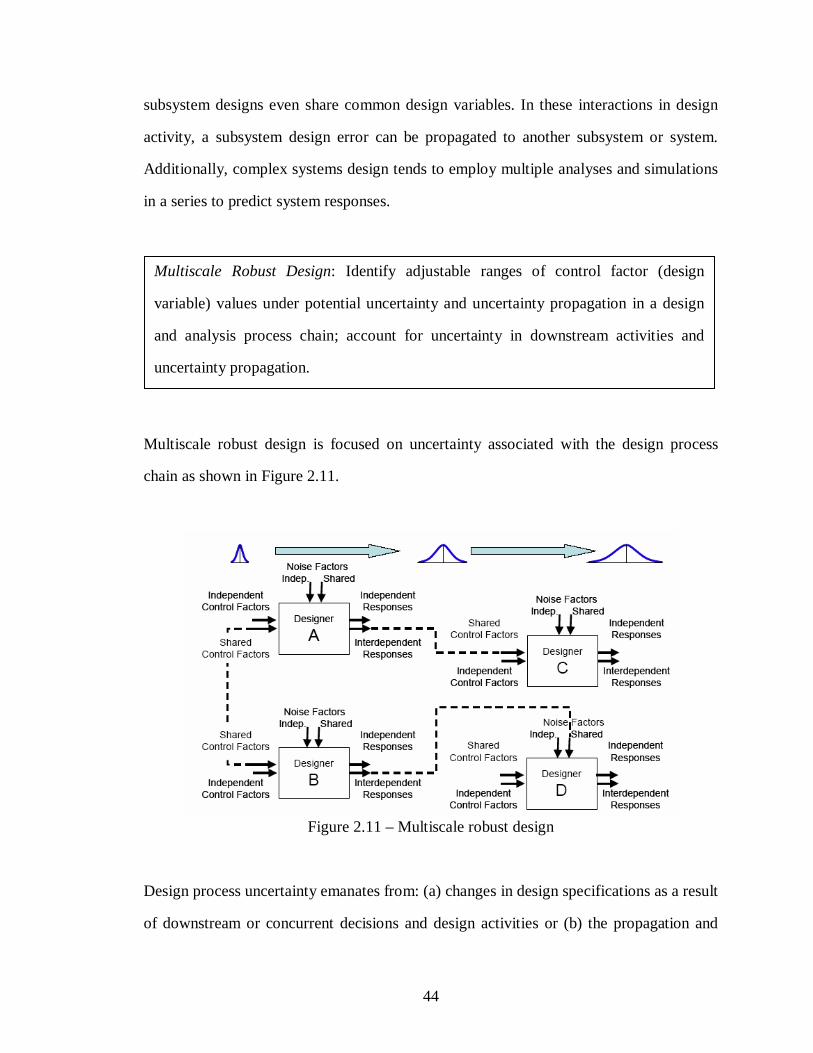
44
subsystem designs even share common design variables. In these interactions in design
activity, a subsystem design error can be propagated to another subsystem or system.
Additionally, complex systems design tends to employ multiple analyses and simulations
in a series to predict system responses.
Multiscale robust design is focused on uncertainty associated with the design process
chain as shown in Figure 2.11.
Figure 2.11 – Multiscale robust design
Design process uncertainty emanates from: (a) changes in design specifications as a result
of downstream or concurrent decisions and design activities or (b) the propagation and
Multiscale Robust Design: Identify adjustable ranges of control factor (design
variable) values under potential uncertainty and uncertainty propagation in a design
and analysis process chain; account for uncertainty in downstream activities and
uncertainty propagation.

45
potential amplification of uncertainty due to the combined effect of analysis tasks
performed in series or in parallel. Both sources of design process uncertainty are
common and important for multidisciplinary design and analysis, including multiscale,
multi-physics materials design, with a plethora of shared or coupled variables and
analyses performed on multiple length and time levels. The information dependency in
multiscale models engenders complex design process chains – hierarchical, parallel, and
serial design processes.
The underlying concepts in multiscale robust design provide the theoretical basis for a
multilevel design template developed in Chapter 3 and implemented in the multilevel
design problems in Chapter 4 and Chapter 5. In Chapter 3, it is shown how the concepts
of multiscale design are adapted for a multilevel robust design method, the Inductive
Design Exploration Method (IDEM) (Choi, et al. 2005). The usefulness of IDEM is
extended by adapting the multiscale robust design method IDEM to a template-based
approach to multilevel design. Details regarding research opportunities in multiscale
robust design are given in Section 2.4.
2.3 DESIGN TEMPLATES
In Section 2.3, a discussion of a template-based approach to engineering design is
presented. Section 2.3.1 begins with general information on using design templates as
design process building blocks. Then, the key requirements of design templates are given
in Section 2.3.2. Section 2.3.3 contains a detailed explanation of a specific design
template implemented in this thesis—the Compromise Decision Support Problem (cDSP).
The cDSP is a framework for solving nonlinear, multi-objective design problems and is
utilized in the example problems in this thesis. The cDSP also provides the structural
basis for the multilevel design template presented in Chapter 3.

46
2.3.1 Design Templates in Engineering Design
Design templates are a key topic addressed in this thesis. Recall from the glossary of key
terms that a design template is a design process building block with a preset format, used
as a starting point for a particular design application so that the format does not have to
be recreated each time it is used (Panchal, et al. 2005). The main goal in this thesis is the
development of a design template for facilitating a multilevel robust design process. A
review of design templates is included in this thesis because of its direct link to one of the
main research topics presented in this thesis. Section 2.3.1 on design templates is taken
from the Ph.D. dissertation of Jitesh Panchal (Panchal 2005) with only slight
modification. The concepts relating the design templates presented in Panchal’s Ph.D.
dissertation are extended in Section 2.3.2 to include requirements for design templates in
engineering design.
One of the main challenges in modeling any design effort, regardless of level or scope, is
standardizing the manner in which information and associated dependencies are
represented. The need for reusability of information translates this requirement into
representing information in a domain-neutral form that supports designers in providing
and structuring required information content in a computationally archival and reusable
manner. This calls for a domain-independent means of capturing design information. In
order to facilitate designer interactions required for effective collaboration from a
decision-based perspective, expression of design decision related information in a
standardized format is also required. It is for this reason that a modular template-based
approach to modeling design information is advocated. A template is commonly defined
as (1) a pattern, used as a guide in making something accurately, (2) a document or file
having a preset format, used as a starting point for a particular application so that the
47
format does not have to be recreated each time it is used2.3. Clearly, the word template is
appropriate in the context of this thesis because it implies reusability, achievability, and
support/guidance.
In order to effectively support engineering design processes, this notion translates to the
development of reusable computational templates for design. These computational
templates should serve as building blocks – completely modular components that are
standardized with respect to structure and interface architecture. Such building blocks
must also facilitate analysis, and execution. Currently, there is a lack of formal,
executable, computational models for representing and reusing existing knowledge about
design processes. The only knowledge that is readily available is confined either to
designers’ expertise or to descriptive/pictorial forms of documentation. This is a result of
the predominantly narrative or symbolic nature of current models.
2.3.2 Requirements for Design Templates
The key requirements of design templates are discussed in Section 2.3.2. These
requirements describe the essence of a design template. Also, the following requirements
detail the advantages of using a template-based approach to multilevel design. The
descriptions provided in the following section are given in the context of template-based
engineering design.
Reusable
Reusability relates to the ability to use a single system in multiple instances. In
engineering design, reusability is relevant both within a particular design problem and
among multiple design problems. Reusability describes one of most crucial requirements
of design templates. One of the main purposes of creating design templates from existing
2.3 Compiled from www.dictionary.com

48
design methods is to store a method’s procedural information in a form that can be easily
reused and applied to multiple design problems. Reusability in design templates is also
useful at a lower level of design process abstraction. Design templates are often used to
store information that is used multiple times in a single design process in a format and
location that is easily accessible in all stages of a design process. For example,
information relating the design goals and preferences is important at several stages in a
design process. By using a design template to gather this information, the “design goals
and preferences template” contains information that is readily available at all stages in
design.
Modular
Modularity is the characteristic of “being composed of standardized units or sections for
easy construction or flexible arrangement2.4.” Also, a modular system is one which
possesses the ability for a portion of the system to be altered without disturbing the
remainder of the system. Modularity in a system is best illustrated by considering
standardized building blocks (such as Legos®). Standardized building blocks can be
joined to produce a variety of configurations to meet current design requirements.
Similarly, design-templates should be modular, allowing for unique configuration to
better meet the requirements of each design problem.
Mutable
Mutability (also called flexibility) is a characteristic of being available and capable of
change. It is important for design templates to be flexible to change so that generic
design templates can be particularized for individual design problems. In Chapter 4 and
Chapter 5, the flexibility of the developed design template is demonstrated as it is
particularized in solving two example problems. The characteristics of modularity and
2.4 www.dictionary.com

49
mutability work together in the design of design templates. It is desirable that one can
easily make changes to portions of a design template without negatively affecting the
entire template. For example, it is desirable that the design constraints template be
capable of adjustments without affecting the performance of other templates in a design
process.
Archival
An archival system posses some inherent value such that it is stored for future reference,
implementation, examination, and / or augmentation. One of the key advantages of
design templates is that they can be used to store design process information. By
implementing a design template in a design process, the designer stores information
regarding the information and the flow of information throughout the design process.
Following this procedure of continual and thorough data storage throughout a design
process can become beneficial in design augmentation and design trouble-shooting,
design. Additionally, storing design information in a standardized format encourages a
collaborative environment in which information is shared among design stakeholders.
2.3.3 The Compromise Decision Support Problem – A Design Template
Based on the discussion on design templates in engineering design, the compromise
Decision Support Problem, as it relates to design templates, is discussed in the following
section. The compromise Decision Support Problem is implemented in the example
problems included in this thesis. Therefore, it is appropriate to include a review of the
compromise Decision Support Problem to provide a theoretical background for the
method in which the example problems are solved. The following information on the
compromise Decision Support Problem (cDSP) is leveraged with only minor
modifications from the Master’s Thesis of Andrew Schnell (Schnell 2006). The
development and implementation of the cDSP is discussed in detail in many papers
published by the Systems Realization Laboratory (SRL). In his Master’s Thesis, Schnell

50
provides a detailed summary of the cDSP, as described by former and current members
of the SRL.
In this section, the work of the Systems Realization Laboratory towards creating a means
to support design decision-making is summarized the Compromise Decision Support
Problem (cDSP) is introduced. The cDSP is the backbone technology that facilitates the
frameworks presented in the next sections. The purpose of this section is to review the
literature regarding the use of Decision Support Problems in solving engineering design
problems, to build confidence in the use of DSPs to solve engineering design problems in
product design. The discussion begins with a brief introduction into the history of DSPs
and specifically cDSPs. This section concludes with a discussion regarding how the
cDSP has been extended to improve its usefulness, and the ease with which the problems
can be formulated using reusable templates.
The Compromise Decision Support Problem (cDSP)
Decision Support Problems (DSPs) provide a means of modeling decisions encountered
by a human designer. Multiple objectives that are quantified using analysis-based “hard”
and insight-based “soft” information can be modeled in DSPs. Compromise and selection
Decision Support Problems are two flavors of DSP. Selection DSPs serve as decision
models for selecting between design alternatives. The compromise DSP is a decision
model for solving multi-objective, non-linear, optimization problems (Mistree, et al.
1990). Mathematically, the cDSP is a multi-objective decision model which is a hybrid
formulation based on Mathematical Programming and Goal Programming (Mistree, et al.
1993a). It is used to determine the values of design variables, which satisfy a set of
constraints and bounds and achieve as closely as possible a set of conflicting goals. The
word formulation of the cDSP is shown in Figure 2.12. The mathematical formulation of
the cDSP is shown in Figure 2.13.

51
Figure 2.12 – Word formulation of cDSP (Mistree, et al. 1993a)
Figure 2.13 – Mathematical formulation of cDSP (Mistree, et al. 1993b)
Currently, there are two types of deviation function used in formulating a compromise
DSP: the Archimedean solution scheme and the Preemptive approach (Ignizio 1985). In
this thesis, the Archimedean approach is used exclusively, therefore the Preemptive
approach is not included in the mathematical formulation of the cDSP in Figure 2.10. In
the Archimedean approach, the deviation function, Z, is simply a weighted sum of the
deviation variables of each of the objectives.
Given: A feasible alternative, assumptions, parameter values, and goals Find: Values of design and deviation variables Satisfy: System constraints, system goals, and bounds on variables Minimize: A deviation function (deviation variables that measure distance
between goals targets and design points)

52
A solution to a compromise DSP is called a satisficing solution. “Satisficing” is a term
coined in the context of mathematical optimization, meaning not the best but good
enough (Simon 1996). In a compromise DSP, the bounds and constraints form the
feasible design space. The solution of the compromise DSP is a point selected within the
feasible design space based on its degree of satisfaction to a set of conflicting design
goals. Satisfaction is evaluated using the value of the deviation function in the
compromise DSP. The human designer or designers must decide whether the solution of
the compromise DSP is acceptable or further investigations should be conducted by
modifying the aspirations and/or the feasible design space.
The values of the deviation variables (di- di
+) indicate the extent to which each of the
goals have not been achieved and thus are a source of useful information (Simpson 1998).
The deviation variables represent the levels of overachievement and underachievement,
respectively, of a goal. The deviation variables are never negative, and one of them will
always be zero. This rule is represented by Equation 2.1.
0
0
0
=⋅
≥
≥
−+
−
+
ii
i
i
dd
d
d
(2.1)
Robust Design and the Compromise Decision Support Problem
As discussed in Section 2.2, a robust design solution is one which is insensitive to
variation. That is, a robust design will have predictable performance despite slight
variation in input parameters. The cDSP can be used in robust product design by setting
a design goal to include the minimization of response variation. Therefore, in robust
design using the cDSP it is necessary to recognize at least two design goals: (1) minimize

53
/ maximize / bring to target performance, (2) minimize performance variation. The
challenge exists in characterizing variation in a design process. In the following section,
a discussed on methods for describing the impact of input uncertainty on performance
variation are discussed. Information in the remainder of Section 2.3 is taken with slight
modification from the Ph.D. dissertation of Carolyn Conner Seepersad (Seepersad 2004).
There are many techniques for transmitting or propagating variation from input factors to
responses, and each technique has strengths and limitations. Monte Carlo analysis is a
simulation-based approach that requires a very large number of experiments (Liu 2001).
It is typically very accurate for approximating the distribution of a response, provided
that probability distributions are available for the input factors. On the other hand, it is
very computationally expensive, especially if there are large numbers of variables or if
computationally expensive simulations are needed for evaluating each experimental data
point. If only a moderate number of experimental points are computationally affordable,
a variety of space-filling experimental designs are available such as Latin Hypercube
designs (Koehler and Owen 1996; McKay, et al. 1979). If only a few experimental points
can be afforded, sparse experimental designs such as fractional factorials or orthogonal
arrays are available [e.g., (Myers and Montgomery 1995)]. Whereas, these experimental
designs require fewer experimental points, they do not provide approximations of the
distribution of a response, but they do provide estimates of the range(s) of response(s).
All of these experimental techniques can be used in two ways: (1) to provide estimates of
the variation or distribution in responses at a particular design point or (2) to construct
surrogate models of the response that can then be used in place of a computationally
expensive simulation model for evaluating mean responses and variations (Chen, et al.
1996; Mavris, et al. 1999; Welch, et al. 1990). They all suffer from the problem of size
identified by Koch and coauthors (Koch, et al. 1999) in which the number of experiments
becomes prohibitively large (given the computational expense of most engineering

54
simulations) as the number of input factors or design variables increases. This
characteristic is very important for multilevel design applications in which there are large
numbers of variables and non-negligible computational requirements. Although
experiments may be appropriate for evaluating the impact of variation of noise factors
(which may be relatively few in number), they are not likely to be computationally
attractive for evaluating the impact of variation in factors such as local material
properties or design variables.
An alternative means for propagating variation is by Taylor series expansion (Phadke
1989). A first order Taylor series expansion, for example, can be used to relate variation
in response, ∆y, to variation in a noise factor, ∆z, or a control factor, ∆x, as follows:
1 1
k m
i ii ii i
f fy x z
x z= =
∂ ∂∆ = ∆ + ∆∂ ∂∑ ∑ (2.2)
where the variation could represent a tolerance range or a multiple of the standard
deviation. Higher order Taylor series expansions can also be formulated to provide better
approximation of the variation in response, but higher order expansions also require high
order partial derivatives of the response function with respect to control and noise factors.
Taylor series expansions are relatively accurate for small magnitudes of variation in
control or noise factors but lose their accuracy for large variations or highly nonlinear
function, f. A Taylor series expansion requires evaluation of the partial derivative or
sensitivity of the response function with respect to changes in control or noise factors. If
analytical expressions are available for the sensitivities, this can be a computationally
attractive and relatively accurate approach (Bisgaard and Ankenman 1995), even for
large numbers of control and noise factors. Otherwise, the sensitivities can be estimated

55
using finite differencing techniques, automatic differentiation (a feature built into some
computer programming languages), and other advanced techniques such as perturbation
analysis and likelihood ratio methods (Andradottir 1998), but these techniques can
diminish the computational attractiveness and accuracy of the approach. Sensitivity-
based approaches have been proposed for modeling constraints (Parkinson, et al. 1993;
Phadke 1989) and objectives (Belegundu and Zhang 1992; Su and Renaud 1997) in
robust design. When analytical expressions are available, a Taylor series expansion is
promising for propagating variation in control factors in the identification of multilevel
design requirements. In this thesis, a first order Taylor’s series expansion is used to
model system performance variation. The Taylor’s series method is selected due to its
ease of use for the given example problems in Chapter 4 and Chapter 5 of this thesis.
Closing Thoughts on Template-Based Robust Design
Recall that Section 2.3 begins with a definition of design templates and their advantages
in solving engineering design problems. In current design research, it is identified that
design templates should be reusable, modular, mutable, and archival in order to add value
to a design process. Next in Section 2.3, a previously developed design template, the
cDSP, is discussed. The cDSP is recognized as a design template because it is a pattern
for solving multi-objective, non-linear optimization problems. The cDSP is formulated at
a high enough level of abstraction so that it can be applied to a variety of design problems
without reconfiguration. At the end of Section 2.3, an approach for infusing robust
design techniques in the cDSP is presented.
A discussion of the current research trends in template-based design is necessary because
the main purpose in this thesis is the development of a template-based approach to
multilevel robust design problems. The multilevel design template presented in Chapter
3 is based on the structure and information flow in the cDSP. Additionally, the cDSP is

56
used when making design decisions at a single level in the example problems in Chapter
4 and Chapter 5. A thorough investigation of current design template research is
intended to lead to research opportunities for advancement in this field. In Section 2.4 a
research gap as related to template-based design is presented. The research questions for
this thesis are developed in order to address portions of the identified knowledge gap in
template-based design.
2.4 RESEARCH GAPS IN TEMPLATE-BASED MULTILEVEL DESIGN
The primary purpose of the literature review in Section 2.1 – Section 2.3 is to identify
knowledge gaps relating to the key concepts of this thesis, a template-based approach to
multilevel robust design. Ultimately, research in the area of template-based multilevel
design is aimed at achieving a detailed multilevel design method and associated
multilevel design templates. Although numerous detailed design methods for single level
design have been developed and implemented (see Pahl and Beitz 1996) a detailed
multilevel design process that addresses the critical needs of multilevel design (see
Section 2.1.2 and Table 2.2) does not exist. The knowledge gaps identified in this thesis
are intended to move the design community one step closer to a detailed multilevel
design process composed of reusable, modular design templates. Figure 2.11 is a
representation of the research gaps identified in this thesis, and the ultimate goal of
multilevel template-based design research.
In Section 2.4 knowledge gaps relating to multilevel robust design and design templates
are presented. The information in Section 2.4 is organized based on the two foundational
concepts of this thesis, multilevel robust design and design templates. The research
questions in Chapter 1 are developed in order to address the identified research gaps.

57
Where We
AREWhere We
WANT TO BE
Extension of multiscale materialsdesign concepts to multilevel
product design approach
Template-based multilevel robust design based on existing design
methods
Detailed multilevel design method
Research Gap
Figure 2.14 – Research gap in multilevel, template-based design
2.4.1 Research Gap Relating to Multilevel Robust Design – From Multiscale
Design to Multilevel Design
In Section 2.1, the definitions of multilevel design and materials design as a multilevel
design process are given. The critical needs of a multilevel design process compared to
design at a single level are listed, and a requirements list for a multilevel design process
is developed based on these critical needs. Section 2.2 contains a classification of four
types of uncertainty in a design process. Robust design techniques addressing each type
of design uncertainty are given. In Section 2.4.1 research gaps relating to multilevel
design and multilevel robust design are given.
As stated in Section 2.1, much of the current research in multilevel design relates to
material modeling and design, often referred to as multiscale materials design. The
‘scales’ in multiscale materials design denote various length and / or time intervals at
which material prediction models are created and design decisions are made. The key
advantage of a multiscale material modeling and design approach is that unmanageably

58
complex materials design problems can be divided into segments capable of being
processed by current computational tools. Information at each material scale is then
combined in order to design an overall material system.
Based on a review and analysis of multiscale design literature, it is determined that an
area of research opportunity involves extending the concepts of multiscale modeling and
design beyond the materials design community. The concepts of multiscale materials
design can be extended to include all forms of complex engineering design problems. In
this thesis, multiscale material modeling and design techniques are adapted in a more
general multilevel design approach. The term multilevel design represents a design
process in which a complex design problem is divided and analyzed according levels of
model complexity. Multilevel design is a more general case of multiscale materials
design. In multilevel design, design levels represent the complexity of system prediction
models and based on the number of design variables used in prediction models.
Exploring a multilevel design approach is a key component of both research questions
presented in Chapter 1. In Chapter 3, an approach for multilevel design using design
templates is given. In Chapter 4 and Chapter 5, two multilevel design problems are
solved using the developed multilevel design approach.
2.4.2 Research Gap Relating to a Template-Based Approach to Multilevel
Robust Design
In Section 2.2 a discussion of design uncertainty and robust design techniques is given.
In this thesis, there is particular interest in the multiscale robust design method (IDEM).
The motivation for developing IDEM originally came from complex, multidisciplinary
materials design problems, but IDEM can be applied to any design problem in which
uncertainty is introduced due to design and analysis process chains (Choi 2005). In its
current state, IDEM is a design strategy consisting of a series of steps and equations that,

59
when applied, lead to a range of feasible multiscale robust design solutions. A research
opportunity exists in combining the procedural steps of IDEM into the reusable, modular,
mutable, and archival form of a design template.
Recall from Section 2.3 in which the topic of design templates is discussed. Template-
based design is an engineering design strategy in which a generic design pattern built to
aid in design decision-making is applied to a variety of design problems without
changing its basic structure. A specific design template, the cDSP, is used in solving
multi-objective, nonlinear design problems at a single level. The key research gap
identified in this thesis is the potential advantage of combining the notion of template-
based design with previously developed robust design methods, specifically IDEM. It is
also identified that the cDSP, a design template for single scale analysis, can be extended
to encompass multilevel design processes. The key research contribution in this thesis is
to transfer the information in a multiscale robust design method (IDEM) into a multilevel
design template based on the cDSP. The identified research gaps are addressed in the
research questions in Chapter 1.
2.5 SYNOPSIS OF CHAPTER 2
Chapter 2 contains a review of multilevel design, robust design, and template-based
design in order to identify research opportunities in these areas. The key research gaps
identified in Chapter 2 are: the opportunity to expand a traditional multiscale design
approach beyond the materials design community, resulting in multilevel design strategy
for complex engineering design; and to adapt an existing multiscale robust design method
to a design template based on the cDSP. The research questions presented in Chapter 1
are intended to address the research gap identified in Chapter 2.
60
Chapters 1 and 2 provide the motivation and frame of reference for the remainder of the
thesis. Key topics addressed in this thesis—multilevel design, robust design, and
template-based design—are discussed in detail in Chapters 1 and 2. Chapter 3 contains
the theoretical foundation for the development of a design template to support multilevel
robust design. In Chapters 4 and 5 the multilevel design template is applied to two
example problems. Chapter 6 contains a detailed look at the verification of the multilevel
design template as well as research opportunities in multilevel robust template-based
design.

61
CHAPTER 3
THEORETICAL FOUNDATIONS FOR A MULTILEVEL DESIGN
TEMPLATE
The information presented in Chapter 3 provides the theoretical foundation for the
remainder of this thesis. In this chapter, the generic formulation of a multilevel design
template is presented. The theory supporting the development of the multilevel design
template comes from the compromise Decision Support Problem (cDSP) (Section 2.3), a
previously developed multilevel robust design method (the Inductive Design Exploration
Method [IDEM]) (Choi, et al. 2005), and a template-based design approach (Section 2.3).
The usefulness of IDEM and the cDSP are extended by combining key concepts from
each of these design tools and adapting them for a template-based design environment.
Chapter 3 begins with a discussion of IDEM as a base method for a multilevel design
template. The steps of IDEM are described in detail. The overall usefulness of the base
method and its assumptions are discussed. After the base method is sufficiently
established, a discussion of building a design template from a design method is given.
Specifically, the steps required to extend the base method into a reusable, modular,
design template are presented. Next, the developed multilevel design template is
presented and discussed. The overall usefulness and the underlying assumptions of the
developed design template are given. The generic multilevel design template is
particularized for application in the example problems presented in Chapter 4 (design of a
cantilever beam and its associated material) and Chapter 5 (design of a BRP). Finally,
the verification and validation of the multilevel design template is presented by
examining its domain-independent structural validity and domain-independent

62
performance validity. A summary of the information in Chapter 3 is given in Table 3.1
and Figure 3.1 illustrates how Chapter 3 is connected to other ideas in this thesis.
Table 3.1 – Summary of Chapter 3
Heading / Sub-Heading Information Multilevel Robust Design Base Method Overview of Base Method Base method:
- Robust design approach to multilevel design problems - Inductive Design Exploration Method (IDEM)
Base Method – Assumptions and Usefulness
Characteristics of IDEM: - Assumes that inductive multilevel design solutions
cannot be directly calculated, but are found using a series of deductive mapping functions
- IDEM used to produce multilevel design solutions that are robust to model structure uncertainty and process chain uncertainty
Base Method Procedure Three procedural steps: - Define design levels and feasible space at each level - Map discrete points to solution ranges through
deductive mappings (specific-to-general) - Map solution ranges to robust solution using developed
deductive mapping functions in an inductive manner (general-to-specific)
Multilevel Robust Design Template From IDEM to a Multilevel
Robust Design Template Developing a design template:
- Determine key steps in IDEM - Transform procedural information from IDEM to a
modular, reusable, archival form Formulation of Multilevel
Robust Design Template Multilevel robust design template:
- Multilevel design template is based on the cDSP - Generic design template at a single design level is
developed - Single level design templates are joined creating a
multilevel design template Multilevel Design Template
Particularized for Examples Multilevel design template is particularized for example problems discussed later in thesis:
- Design of a cantilever beam (Chapter 4) - Design of a blast resistant panel (Chapter 5)
Verification and Validation Domain-Independent Structural
Validity Internal consistency of multilevel design template:
- Template is based on an existing method, IDEM, with proven internal consistency
- Template is successfully applied to two example problems indicating its internal consistency
Domain-Independent Performance Validity
Ability to apply template to a variety of multilevel design problems, not previously tested:
- Template is sufficiently generic and can be particularized for a variety of design problems
- Template is flexible and modular and can be adjusted for special needs in individual design problems
Thesis Roadmap

63
1
2 3
4
Theoretical foundation for template-based multilevel robust design:• Multilevel robust design base method (IDEM)• Augmented IDEM for template-based multilevel design• Validation template-based multilevel design approach
Robust Design
Multilevel Design
Design Uncertainty
Design Templates
MO
TIV
AT
ION
ME
TH
OD
AN
ALY
SIS
CLO
SU
RE
1 – Motivation 2 – Literature Review
4 – Cantilever Beam
6 – Method Validation
5 – Blast Resistant Panel
3 – Theoretical Foundations
Figure 3.1 – Setting the context for Chapter 3
3.1 MULTILEVEL ROBUST DESIGN BASE METHOD
The main focus in this thesis is to develop a design template to facilitate multilevel robust
design solutions (Research Question #1, Section 1.3). In order to address this challenge,
it is decided that the multilevel design template should be based on an existing method
for facilitating robust solutions to multilevel design problems. The Inductive Design
Exploration Method (IDEM) is selected as the base method for this thesis because the
method is designed to produce robust solutions to multilevel design problems (Choi, et al.
2005). In the following section, an overview of IDEM as a tool for generating multilevel
design solutions is given. An overview of IDEM is given in Section 3.1.1. The overall

64
usefulness and assumptions associated with IDEM are given in Section 3.1.2. IDEM is
composed of three procedural steps, which are discussed in detail in Section 3.1.3.
3.1.1 Overview of Base Method
IDEM was developed by Hae-Jin Choi (Choi, et al. 2005) and is presented in his Ph.D.
dissertation (Choi 2005). As stated in Section 2.3.3, multilevel robust design techniques
are used to manage uncertainty associated with the design process chain. Design process
uncertainty emanates from: (a) changes in design specifications as a result of downstream
or concurrent decisions and design activities (model structure uncertainty) or (b) the
propagation and potential amplification of uncertainty due to the combined effect of
analysis tasks performed in series or in parallel (process chain uncertainty) (Choi 2005).
An example of information flow in a model chain is presented in Figure 3.2. In Figure
3.2, suppose that design input parameters x1 and x2 have some associated uncertainty.
Uncertainty in input parameters x1 and x2 lead to uncertainty in output responses y1 and
y2. As shown in the figure, y1 and y2 combine to form the input parameter to f3. The
combination of uncertainty responses y1 and y2 produces a value with greater uncertainty
than what is observed in input parameters x1 and x2. Therefore, the resulting output
parameter, z, contains increased uncertainty due to the combination of uncertain input
factors, y1 and y2. In a similar manner, combining process chains in a multilevel design
problem can lead to unexpectedly large variation in final output performance
measurements.
Figure 3.2 – An example of information flow in a model chain (Choi 2005)

65
3.1.2 Base Method – Assumptions and Usefulness
Basic assumptions and the general usefulness of IDEM are presented in the following
section. Recall from Section 2.2.3 that design solutions from implementing IDEM
“result in ranged sets that are robust to propagated and expanded uncertainty in a process
and to the unquantifiable potential uncertainty a model might have” (Choi 2005 [Section
4.2]). The basic procedure of IDEM applied to multilevel aircraft design, is shown in
Figure 3.3, Step 1 – Step 3.
Step 1 – Definition of feasible design space at each design level. Discretize design space.
Level 1 Level 2
Performance space Design space
Increased model complexity
Level n
Product performance
1 2 n...
Step 2 – Map discrete points to solution ranges.
1
2
n
Cause-to-effect deductive process
(specific to general)
Mapping functions
Step 3 – Determine range of feasible design solutions.
1
2
n
Goals-to-means inductive process
(general to specific)
Figure 3.3 – Diagram of the inductive design exploration concept
First, the feasible design space at each level is determined (Step 1 in Figure 3.3). Then,
mapping functions are used to map discrete points at Level n to solution ranges at Level
n+1 (Step 2 in Figure 3.3). This mapping procedure is carried out in a deductive manner.
66
Finally, feasible solution ranges are determined at each level of the design by following
an inductive design decision path based on previously developed deductive mapping
functions (Step 3 in Figure 3.3). The final solution range is selected such that design
freedom is preserved. A more detailed description of the base method procedure is found
in Section 3.1.3. IDEM is used to inductively determine ranged sets of feasible solutions
in a multilevel design problem and can be applied to a range of multilevel design
problems. The solutions obtained from applying IDEM are robust to model structure
uncertainty and process chain uncertainty. The final step of IDEM includes a method for
strategically selecting a design solution within feasible solution ranges either
emphasizing product performance or product robustness (Choi 2005).
IDEM has several underlying assumptions. The most crucial assumption implicitly stated
in IDEM is that inductive solutions to multilevel design problems cannot be directly
calculated. Evidence of this assumption in IDEM is that discrete points are mapped to
solution ranges (deductive) before an inductive range of design solutions is reached.
Also, in applying IDEM, the designer assumes that design levels are clearly defined and
mapping functions can be created to accurately transfer information among design levels.
An additional assumption of IDEM is that the design space is small enough to allow for
an exhaustive search of all possible design combinations. For design problems
containing approximately 10 or more design variables, characterizing the entire design
space can be unrealistic. For such design problems, modifications to the base method,
such as reducing the number of design variables, using metamodeling techniques, or
employing parallel function evaluation, should be considered (Choi 2005).
3.1.3 Base Method Procedure
A procedure for multilevel robust design abstracted from IDEM is presented below in
Step 1 – Step 3 and in Figure 3.4 (Choi, et al. 2005).

67
Figure 3.4 – Procedure for IDEM
The goal in this thesis is not to simply solve a design problem using IDEM, but to adapt
the multilevel robust design method to a template-based design environment. Therefore,
the exact details of IDEM are not discussed in detail. An overview of IDEM is given to
show how it is used to inspire a template-based approach to multilevel robust design. For
a complete description of IDEM, refer to the Ph. D. dissertation of Hae-Jin Choi (Choi
2005 [Chapter 4]).
Step 1: Define Design Levels and Feasible Design Space
To begin, a multilevel design problem is divided according to design levels. The process
of partitioning a multilevel design problem into smaller units is unique for each design
problem. However, several basic guidelines can be applied. The first challenge is to
determine the basis from which to measure a design level. In traditional materials design
applications, multiscale product and materials design is divided according to length scale
(nano, micro, meso, meter, etc.). The main distinction between each scale involves a
change in the overall length interval considered in a design process. However, in the
research presented in this thesis, it is asserted that a multilevel design problem can be
divided into levels according to a variety of characteristics. For example, the
comprehensive example problem in this thesis involves the multilevel design of a BRP.
The BRP design problem can be divided into levels according to length measurements
(micro, meso, meter), reaction time measurements (millisecond, second, month, decade),
Procedure for multilevel robust design
Step 1: Define design levels in multilevel design process and
feasible design space at each level
Step 2: Deductively map points to solution ranges
Step 3: Inductively determine range of feasible design

68
or levels of model complexity (11 design variables, 9 design variables, 3 design
variables). (The term multiscale often refers to materials design. The term multilevel is
used in this thesis to denote a hierarchical product or process defined by changes in
length, time, complexity, etc.). In this thesis, characterizing levels in terms of modeling
complexity is investigated in solving the example problems. The metric a designer
should use to partition a multilevel design problem should come from the natural
behavior of the design problem. For example, if a multilevel design problem is most
heavily dependent on reaction as a function of time, the various levels should be defined
according to time levels.
Once the metric for partitioning a multilevel design problem is identified, various levels
are defined. The process of determining level boundaries is unique for each design
problem; however, several guidelines can be followed. First, a natural level boundary is
identified at locations where it becomes necessary to alter design analysis tools. For
example, in a multilevel materials design problem, different performance analysis tools
are used when designing at the nano-level compared to the micro-level. A necessary
change in design analysis tools provides a natural break in levels of a multilevel design
problem. Additionally, it is important that an appropriate number of design levels are
defined in order to accurately capture design phenomena without over-complicating the
design problem. Partitioning the design problem into too few levels may result in the
inability to capture certain relevant design phenomena, whereas defining too many design
levels may result in an increase in design cost without a noticeable gain in design
knowledge.
Once levels have been defined in a multilevel design problem, feasible design space at
each level is specified. The feasible design space is identified by bounds placed on
design variables. Since the design variables may be different at each level in a multilevel

69
design problem, the feasible design space should be determined at each level. It is
observed that all points in the feasible design space do not result in a design performance
that is within given performance constraints. Therefore, mapping functions are
developed to describe the deductive mappings from design levels to solution ranges.
Once deductive mapping functions are developed (Step 2), solution finding algorithms
are used to determine which points in the feasible design space result in design
performance that is within specified performance constraints.
Step 2: Deductively Map Points to Solution Ranges
Mapping functions are created to translate information among levels. Due to the
challenges of a multilevel robust design problem, deterministic mapping functions can
only be created for a deductive transition among levels (moving from specific to general).
Design information captured in mapping functions relates to design variable
transformation and uncertainty propagation models. Design variable mapping models are
used to describe how design information at a more specific design level maps into design
information at a more general level. For the purposes of the example problems
investigated in this these, variable mapping functions are used to describe the relationship
of design variables among various levels of model complexity.
Uncertainty mapping functions are used to model uncertainty at each level of the design
process, and the propagation of uncertainty throughout the design process. Uncertainty
mapping functions are developed only when uncertainty in a design process can be
modeled. In the example problems included in this thesis, it is assumed that design
uncertainty is modeled by a known function. It is also assumed that uncertainty
propagation among various levels is known and modeled using a specific equation or set
of equations.

70
Step 3: Inductively Determine Range of Feasible Design Solutions
In the final step of IDEM, a robust design solution is presented as a range of possible
solutions, obtained by inductive design space mapping. In the original method,
developed by Choi (Choi 2005), a robust solution range is obtained by evaluating a
metric for determining if a discrete point from an input space maps to a feasible design
solution in the output space. This metric, called hyper-dimensional error margin indices
(HD-EMI) is also used in determining a robust solution range. See Figure 3.5 for a visual
and mathematical representation of HD-EMI.
Figure 3.5 – Calculation of HD-EMI (Choi 2005)
Practically, HD-EMI is a measure of system’s robustness. HD-EMI is a measure of the
distance of a design point from design space boundary divided by variation in system
performance. From Figure 3.5, note that as the HD-EMI increases, the output is more
likely to be satisfactory, meaning that the output range moves farther from the constraint
boundary, and system performance variation decreases (Choi 2005). Solutions that are
far from the boundaries of the feasible design space will remain within the feasible design
space in the presence of slight variation (i.e., these solutions are insensitive to, or robust
to variation). Therefore, when determining a robust design solution, a designer is

71
interested in selecting ranges with high values of HD-EMI. This approach to inductively
determining ranges of design solutions is implemented in the work of Choi (Choi 2005).
However, this approach is modified slightly in the example problems in this thesis. In
this thesis, a single robust solution (rather than a range of solutions) is obtained by
choosing the design point that best meets the design goals of maximizing product
performance and maximizing system robustness (that is, maximizing HD-EMI). Instead
of selecting a range of possible solutions that meet some minimum value of robustness
(HD-EMI), in this thesis, the solution with the highest value of robustness (HD-EMI)
while best meeting performance goals, is chosen as the inductive design solution.
For the multilevel example problems in this thesis, a single design solution rather than a
range of design solutions is determined in order to more accurately gage the effectiveness
of the multilevel design template. By solving for a single design solution, one is able to
analyze the domain-specific performance validity of the multilevel design template.
Additionally, for the BRP design problem, a single design solution is provided in order to
meet customer requirements. Simple changes in the solution search algorithm
implemented in the multilevel design template would result in a range of all possible
solutions that meet a specified minimum level of robustness. The advantages of
determining a range of possible design solutions and a single robust design solution are as
follows. The main advantage of returning a range of all possible solutions is that the
designer is able to select the best design solution from the range of satisficing design
solutions based on intuition and designer expertise, giving the designer considerable
flexibility. Advantages of returning a single design solution are that the best solution is
presented when the complexity of the design problem is beyond designer intuition, and
the domain-specific performance validity is more easily assessed when a single design
solution is presented.

72
3.2 MULTILEVEL DESIGN TEMPLATE
Section 3.2 contains information relating to the creation and personalization of design
templates as part of a multilevel design process. To begin, a discussion of extending the
value of existing design methods with the development of design templates is given.
Next, a generic formulation of a multilevel design template based on IDEM is presented.
Then, the underlying assumptions and overall usefulness of the developed multilevel
design template are given. Section 3.2 includes a discussion on the extent to which a
generic template can be applied to a variety of design problems. The section concludes
with the particularization of the generic multilevel design template for implementation in
the example problems presented in Chapter 4 (design of a cantilever beam and its
associated material) and Chapter 5 (design of a BRP).
3.2.1 From IDEM to a Multilevel Design Template
One of the key contributions of the work presented in this thesis is an illustration of how
an existing design method can be transformed into a reusable, archival, modular design
template. Recall from the glossary of key terms that a design template is a design process
having a preset format, used as a starting point for a particular design application so that
the format does not have to be recreated each time it is used (Panchal, et al. 2005). At the
heart of every design method is a series of steps that, when followed properly, produce a
specified design outcome. The steps in a design method can be expressed in a design
template without loosing any of the inherent value in the design method. While many
design methods are archival and reusable, they often are not modular or flexible. The
advantage of creating design templates from design methods is that the valuable
information in a design method can be transformed to a user-friendly, reusable, modular
state, while method procedure is preserved.

73
Modularity is one of the key benefits of design templates. In complex design problems it
is often beneficial to combine aspects from various design methods. However,
modularity is not typically a characteristic that is designed into design processes. This
lack of modularity makes it difficult to build a design method based on portions of
existing design methods. By adapting a design method to a design template, the design
method can be expanded or condensed based on the needs of a particular design problem.
An example of design modularity is illustrated in Figure 3.6 with Legos®. Legos are
generic modular building blocks that can produce a variety of designs.
Elements of a design template
(also called sub-templates) Overall design template
Figure 3.6 – Building blocks of a design template3.1
In Figure 3.6, an overall design template is illustrated as a ship built out of many Legos®.
The overall design template is modular—it can connect with other Lego® creations.
Additionally, the components used to build the ship are also modular. The individual
building bricks are analogous to sub-templates that combine to describe an overall design
process. This modularity within an overall design template and among other design
templates highlights one of the key advantages of template-based engineering design.
3.1 Images from www.lego.com
74
Another advantage of transitioning from a design method to a design template is that
information produced at any stage in a design process can be stored in a design template
for retrieval and use at a later stage in the design process. Design templates are
particularly useful for multilevel design problems in which design information (such as
goals, preferences, constraints, and bounds) is common to multiple design levels. By
organizing information in a multilevel design process in the form of a design template,
various sub-templates can be used to expresses the differences between levels, while
another sub-template contains information that is used by all levels in a multilevel design
process.
The previously stated procedure and advantages of template-based design are illustrated
in the creation of the multilevel design template presented in Section 3.2.2. The
multilevel design template is based on an existing design method, IDEM (Choi, et al.
2005). The main steps in IDEM are used to develop modules in the design template. For
example, in Step 1, the designer is instructed to define relevant levels in a multilevel
design process. This step is realized when a separate system response model is created
for each level of a multilevel design process. Focusing on one step of IDEM at a time, a
design template for multilevel robust design is adapted, and is presented in Section 3.2.2.
3.2.2 Formulation of Multilevel Design Template
In the following section, a general form of a multilevel design template is presented and
discussed. The multilevel design template represents design templates at a high level of
abstraction. That is, the general design template provides the framework for solving
multilevel design problems. However, it is left to the designer to particularize the generic
template into a form that is useful in providing design solutions to specific problems.

75
Multilevel Design Template
A word formulation of a multilevel design template is given in Figure 3.7. The construct
of the word formulation is leveraged from the compromise Decision Support Problem
(Mistree, et al. 1993a; Mistree, et al. 1993b). At this level of abstraction, the connection
between the steps in the base method and the headings of the word formulation of a
generic multilevel design template are easily observed.
Figure 3.7 – Word formulation of generic multilevel design template compared to cDSP
The word formulation of the multilevel design template begins with information that is
available to the designer at the beginning of the design process: goals, preferences, design
variables, and design variable bounds. A “robustness goal” is incorporated in the
multilevel design template in order to achieve robust solutions. For multilevel robustness
examined in this thesis, the robustness goal is based on IDEM. The robustness metric
(HD-EMI) defined in IDEM is maximized in order to maximize robustness of a
multilevel design solution. Next, various levels in the design problem are defined along
Given A feasible alternative Assumptions Parameters Goals
Define Design levels Feasible design space
Map Discrete points to solution ranges (deductive) Solution ranges to robust solution (inductive)
Find Design variables Deviation variables
Satisfy Constraints Bounds Goals
Minimize Weighted sum of deviation variables
Given A feasible alternative Assumptions Parameters Goals
Find Design variables Deviation variables
Satisfy Constraints Bounds Goals
Minimize Weighted sum of deviation variables
Compromise Decision Support Problem Multilevel Design Template

76
with the feasible design space at each level. The feasible design space is defined based
on bounds placed on design variables. Next in the multilevel design template, deductive
mapping functions are developed to describe the change in design variables and
uncertainty models among the various levels of the design problem. By employing
deductive mapping functions in an inductive manner, a robust solution is obtained such
that design constraints and goals are met.
The word formulation of the multilevel design template is translated into a visual
representation, illustrating information flow in the multilevel design template. The
schematics of the design template are borrowed from an electrical breadboard which is a
modular, reusable devise used to design electrical circuits. A generic design template at a
single level is given in Figure 3.8.
Variables
Bounds
Constraints
Goals
Preferences
Performance Model
Response
Single Level Design Template
Figure 3.8 – Generic design template for a single level design process (Mistree, et al.
1993a; Mistree, et al. 1993b, Panchal, et al. 2004)
The single level design template in Figure 3.8 can be combined with other single level
design templates to form a multilevel design template, as shown in Figure 3.9. (Single
level design templates can also be joined in a horizontal manner). Mapping functions are
developed to describe the flow of information among various levels. Moving from Level
1 to Level n represents an increase in model precision or complexity, in other words,

77
changing from general models to specific models. As single level design templates are
joined to form a multilevel design template, each single level design template becomes a
sub-template of the overall multilevel design process. A sub-template is a design process
building block linked with other building blocks to create a multilevel design template.
Goals
Preferences Multilevel Design Sub-Template at Level n
ConstraintsModel
Performance Response
Variables
Bounds
Goals
Preferences
Map
pin
g
Fun
ctio
ns
ConstraintsModel
Performance Response
Variables
Bounds
Variables
Bounds
Constraints
Goals
Preferences
Performance Model
Response
Multilevel Design Sub-Template at Level 1
Map
pin
g
Fu
nctio
ns
Multilevel Design Sub-Template at Level 2 In
crea
sed
mod
el c
ompl
exity
Figure 3.9 – Generic design templates for single level design combined in a multilevel
design process
The multilevel design template presented in Figure 3.9 is divided into various sub-
templates and simplified, shown in Figure 3.10. Information that is common to design at
all levels is separated into the design parameter sub-template. The design parameter sub-
template is used to store and access design information regarding design variables, design
variable bounds, constraints, goals, and designer preferences. Analysis sub-templates,
which are system prediction models developed by the designer, are distinguished at each
design level. By partitioning the design process into various sub-templates, the
modularity of the overall multilevel design template increases.

78
Variables
Bounds
Constraints
Goals
Preferences
Performance Model
at Level 2
Analysis Sub-Template – Level 2
Design Parameters Sub-Template
Response
Performance Model
at Level 1
Analysis Sub-Template – Level 1
Response
Performance Model
at Level n
Analysis Sub-Template – Level n
Response
Map
pin
g
Fu
nct
ion
sM
app
ing
F
un
ctio
ns
Incr
ease
d m
odel
com
plex
ity
Figure 3.10 – Simplification of generic multilevel design process from previous figure
The development of mapping functions to link design information among various levels
is one of the key steps in the multilevel design template. Mapping functions are
mathematical expressions used to transfer design information among design levels. In
complex multilevel design problems, mapping functions are used to limit design space at
complex design levels by identifying likely regions containing satisficing design
solutions. Initially, the structure of mapping functions are created in a deductive manner;
that is, mapping functions describe design information from a more complex level to a
less complex level using approximation or homogenization techniques. Then, using an
inductive solution approach, the previously developed mapping functions are applied in
an inductive manner. For example, in an inductive multilevel solution approach, a design
solution is determined at the least complex design level, Level 1. Then, Level 1 design
information is passed from Level 1 to Level 2 via a previously developed mapping
function. An additional design constraint (based on the mapping function) is added at
Level 2 such that the Level 2 design solution behaves similarly to the Level 1 design
solution. In this way, the feasible design space at Level 2 is reduced allowing a

79
satisficing design solution to be determined at reduced cost. In design problems with few
design variables limiting the design space is not beneficial since an exhaustive search can
be applied to the design space to determine the “best” design solution. However,
increasing in design complexity to 10, 100, or 1000 design variables, fully exploring the
design space is no longer a reasonable option. As a multilevel design problem increases
in complexity, design information from all previous design levels is used to identify a
reduced design space likely containing a satisficing design solution.
The multilevel design template presented in the previous section is a generic tool that can
be particularized and implemented in specific design problems. In the following section
assumptions and the overall usefulness of the developed template are explained. In
Section 3.2.3, the generic multilevel design template is particularized for two example
problems included in this thesis.
Multilevel Design Template – Assumptions and Usefulness
The developed multilevel design template has several key assumptions. First, in this
thesis, levels in a multilevel design problem are divided according to model precision or
model complexity. This assumption is a more general way of measuring design levels
compared to what is observed in materials design. In the materials design community, a
multilevel (also called multiscale) design problem involves design at various length
scales. By distinguishing levels as measures of model complexity the essence of
transitioning from general to specific in a multilevel design problem is captured.
Another assumption is that the method for incorporating robustness in a multilevel design
problem in which the multilevel design template is utilized is left to the discretion of the
designer. In IDEM (and in the multilevel design template), robustness is achieved by
setting a goal to maximize a robustness metric, HD-EMI. HD-EMI is a measure of the

80
distance from the current design point to the design bound divided by variation in system
response (See Figure 3.5). In the example problems, the HD-EMI robustness metric is
maximized to achieve robust solutions. However, due to the modular nature of the
multilevel design template, additional methods for achieving robust designs (such as
minimizing system response variation) could be applied without significantly affecting
the structure of the design process.
Key assumptions relating to mapping functions in multilevel design follow. Mapping
functions for solving a multilevel design problem are determined by the designer. It is
assumed that there are many possible mapping functions for a particular design problem.
It is the role of the designer to determine mapping functions to best transfer relevant
design information while appropriately limiting the design space at more complex design
levels. The mapping functions in multilevel template-based design have a significant
impact on the overall design solution. Therefore, determining appropriate mapping
functions represents a crucial decision point early in a multilevel design process. A
formal procedure for “mapping function design” is not provided in this thesis. However,
for future work in multilevel template-based design it is beneficial to investigate the
influence of mapping functions in multilevel design solutions and to formulate a
procedure for developing appropriate mapping functions for particular multilevel design
problems.
The key advantages of the developed multilevel design template are modularity,
flexibility, and ease-of-use. The developed template has two forms of modularity. The
design template can be joined with other design templates to solve complex multilevel
design problem, and the individual components of the template can be altered without
negatively affecting the remainder of the template. Figure 3.11 illustrates how multilevel

81
design templates can be combined in order to solve complex engineering problems
involving multiple multilevel systems.
Multilevel Design 1 Multilevel Design 2
Combined Multilevel Design Template
Figure 3.11 – Combined multilevel design template
The second aspect of modularity of the multilevel design template is that individual
components used to develop the template provide modularity within the template itself.
For example, the design parameters sub-template can be adjusted to reflect the needs of a
specific design problem. Also, the analysis template can be duplicated in order to
represent a multilevel design problem with considering many levels. The modular nature
of the template relate to its flexibility in adjusting to the needs of individual design
problems. The modularity, flexibility, and natural flow of information in the design
template contribute to its ease-of-use.
3.2.3 Multilevel Design Template Particularized for Example Problems
In order to build confidence in the verification and validation of the multilevel design
template, the template is applied to example problems and the value of design solutions is
assessed. In the following section, the multilevel design template is particularized for
two example problems. The example problems include the design of a cantilever beam
and the design of a blast resistant panel. Additional information relating to design
procedure for each of these example problems can be found in Chapter 4 (cantilever

82
beam design) and Chapter 5 (BRP design). The successful application of the design
template to these example problems builds confidence in its domain-specific structural
validity and domain-specific performance validity (see Validation Square, Section 2.5).
Recall one of the main advantages of the multilevel design template is that it provides a
procedure for limiting design space at complex design levels by searching design regions
which are likely to contain satisficing design solutions. Complex design space reduction
is achieved by mapping functions which translate design information from less complex
design levels using averaging and homogenization techniques. This key advantage is
examined in the application of the multilevel design template to the example problems.
Containing at most 13 design variables, the example problems in this thesis lack the
complexity of many product and material design problems encountered in the
engineering design community. The example problems in this thesis can be directly
solved at their most complex design levels and do not require the use of the multilevel
design template to reduce design space at complex levels. However, the example
problems are chosen to illustrate concepts relating to the key advantages of the multilevel
design template. It is assumed that by applying the multilevel design template to more
complex designs, the advantages of this design approach will be more apparent. A more
complex design problem was not selected for examination in this thesis because the
expertise required to model a complex design problem is beyond the scope of this
research.
Multilevel Robust Design Template for Cantilever Beam Design
The multilevel design template is particularized for the design of a cantilever beam and
its associated material. A cantilever beam with a square cross section is under constant
loading at the free end. The design goals include minimizing the mass of the beam while
maximizing beam robustness to uncertainty in material properties. In order to more

83
closely achieve design goals, the material properties of the beam are allowed to vary
along the length of the beam. This design problem, involving the concurrent design of
product and material, represents a multilevel design problem.
To begin, it is determined that the various levels in the cantilever beam example problem
are distinguished based on model complexity. At Level 1 a beam with constant material
properties is observed. As the level increases, the material properties of the beam vary
along the length of the beam according to discrete segments. At the greatest level of
model complexity, the material properties of the beam are described as continuous
functions along the length of the beam. The next step is to determine the number of
design levels to consider in the design problem. Three levels that sufficiently describe
the behavior of the beam are selected. The three levels are: a beam with constant
material properties, a beam divided into 10 discrete segments each with independent
material properties, and a beam in which the material properties are described as
continuous functions. This multilevel design problem could be divided into many more
levels of complexity (e.g., the microstructure and nanostructure of the beam’s material
could be designed). However, this example problem is intended to illustrate the concepts
of template-based multilevel robust design. Next, deductive mapping functions are
developed. These mapping functions describe material property mappings among the
various design levels. Finally, a robust solution is determined based on inductive
solution-finding techniques. Recall the design procedure of IDEM given in Figure 3.3
and Figure 3.4. The generic multilevel design approach is particularized for the
cantilever beam design problem and is shown in Figure 3.12.

84
Step 1 – Definition of feasible design space at each design level. Discretize design space.
Product level
A B
a
ρi, Ei
Material level
Feasible design space
Design levels:Performance levelA – Homogenous beamB – Discretized beamC – Finite element beam
Performance space Design space
Increased model precision
ρ, E
a
Weight
C
FEADiscretized design space
Step 2 – Map discrete points to solution ranges.
A
BMin. W
ρi, Ei, aCause-to-effect deductive process
f(ρ,E, a)
g(ρ i,Ei, a)
ρ, E, aC
ρ=f(x), E=f(x),
a
Mapping functions
h(ρi,Ei, a)
Step 3 – Determine range of feasible design solutions.
A
B
Goals-to-means inductive process
Min. W
ρi, Ei, a
ρ, E, a C
ρ=f(x), E=f(x),
a
Figure 3.12 – Diagram of the inductive design exploration concept for cantilever beam
design problem
The multilevel design template applied to the cantilever beam example problem is shown
in Figure 3.13. Once the generic template is applied to a specific multilevel design
problem, computational tools are introduced. The design template presented in Figure
3.13 is adapted to computer executable modules. By completing example design
problems, the advantages of a template-based approach to multilevel robust design are
observed, and confidence is built in the validation of the developed multilevel design
template. Details regarding the implementation of the template in Figure 3.13 are in
Chapter 4.

85
Variables
Bounds
Constraints
Goals
Preferences
Analysis Sub-Template – Level 2
Design Parameters Sub-Template
Analysis Sub-Template – Level 1
Mass, ∆ Mass
Analysis Sub-Template – Level 3Map
pin
g
Fu
nct
ion
sM
app
ing
F
un
ctio
ns
Incr
ease
d m
odel
com
plex
ity
Response
Response
Response
Mass, ∆ Mass
Mass, ∆ Mass
Figure 3.13 – Multilevel robust design template for cantilever beam example problem
Multilevel Robust Design Template for Blast Resistant Panel Design
The generic multilevel design template is particularized for the design of a BRP. A BRP
is a sandwich structure consisting of a solid front and back face sheet surrounding a
honeycomb core. Under impulse loading, a BRP experiences less deflection that
similarly loaded panels of equal mass. The design goals include minimizing the
deflection of the BRP, minimizing mass of the BRP, and maximizing BRP robustness
with respect to uncertainty in loading conditions and material properties.
The various levels in the BRP example problem are distinguished based on model
complexity. At Level 1, a BRP consisting of a solid panel is analyzed. As level increases,
more details of BRP design are modeled and analyzed. At the greatest level of model
complexity considered in this thesis, the BRP is modeled as a sandwich structure with
two solid panels surrounding a honeycomb core. Additional levels of complexity are
open for consideration in this design problem. One of the main benefits of applying a
multilevel design template to this example problem is that the template can be updated

86
when it becomes desirable to consider additional design features at more complex levels,
such as a fill material in the core cells, or the design of associated material. Next, the
number of design levels to consider in the design problem is determined. Three levels
that sufficiently describe the behavior of the BRP are selected. The three levels are: a
BRP modeled as a single panel (Level 1), a BRP modeled as three solid panels (Level 2),
and a BRP modeled as two solid panels surrounding a honeycomb core (Level 3). This
multilevel design problem could be divided into many more levels of complexity (e.g.,
the microstructure and nanostructure of the BRP material could be designed). However,
such computationally expensive modifications are beyond the scope of this thesis. In
Step 2, deductive mapping functions are developed. These mapping functions describe
material property and uncertainty mappings among the various design levels. Finally, a
robust solution is determined based on inductive solution-finding techniques. Figure 3.14
displays a diagram of the base method as applied to the BRP example problem.
The multilevel design template applied to the BRP beam example problem is shown in
Figure 3.15. Once the generic template is applied to a specific multilevel design problem,
computational tools are introduced. Similarly to the cantilever beam example, the design
template presented in Figure 3.15 is adapted to computer executable modules. Details
regarding the implementation of the template in Figure 3.15 are in Chapter 5 on BRP
robust design.

87
Step 1 – Definition of feasible design space at each design level. Discretize design space.
Productlevel
A B
Layerlevel
Perform. level
Feasible design space
Design levels:
Performance levelA – Product levelB – Layer levelC – Core level
Performance space Design space
Increased model precision
C
Corelevel
L, H tot , ρ, σy L, H, h f, hb, ρ, σy
L, H, h f, hb, B, h c, ρ, σy
Deflection
Discretized design space
Mass
Step 2 – Map discrete points to solution ranges.
A
B
CMin. δMin. M
Cause-to-effect deductive process
(specific to general)
f(L,Htot,ρ,σy)
D
g(L,H,hf,hb,ρ,σy)
h(L,H,hf,hb,B,hc,ρ,σy)
L, Htot , ρ, σy
L, H, h f, hb, ρ, σy
L, H, h f, hb, B, h c, ρ, σy
Mapping functions
Step 3 – Determine range of feasible design solutions.
A
B
C
Goals-to-means inductive process
(general to specific)
DL, H tot , ρ, σy
L, H, h f, hb, ρ, σy
L, H, h f, hb, B, h c, ρ, σy
Min. δMin. M
Figure 3.14 – Diagram of the inductive design exploration concept for BRP design
problem
Variables
Bounds
Constraints
Goals
Preferences
Analysis Sub-Template – Level 2
Design Parameters Sub-Template
Analysis Sub-Template – Level 1
Analysis Sub-Template – Level 3Map
pin
g
Fu
nct
ion
sM
app
ing
F
un
ctio
ns
Incr
ease
d m
odel
com
plex
ity
δ, ∆δ, M, ∆M
Response
Response
Response
δ, ∆δ, M, ∆M
δ, ∆δ, M, ∆M
Figure 3.15 – Multilevel robust design template for BRP example problem

88
3.3 VERIFICATION AND VALIDATION OF TEMPLATE-BASED APPROACH TO
MULTILEVEL DESIGN
In the following section, value is added to the verification and validation of the developed
multilevel design template. To begin, the domain-independent performance validity of
the multilevel design template is examined. Domain-independent performance validity
relates to the internal consistency of the proposed template. Next, the domain-
independent structural validity of the developed template is examined. Domain-
independent performance validity is used to describe the likelihood that the template
could be successfully applied to other design problems (outside of the examined fields)
with positive design results. The following section on method validation provides only
two pieces to the validation puzzle. At the end of Chapters 3 – 5, a discussion on method
validation as it relates to the current chapter is given. In Chapter 6, the overall
verification and validation of the developed template is discussed by examining
verification and validation evidence presented at the end of each chapter.
3.3.1 Domain-Independent Structural Validity
The domain-independent structural validity of a design method relates to its internal
consistency. The multilevel design template developed in Chapter 3 is based on an
existing multilevel robust design method, IDEM. Thus, it follows that if the base method
is internally consistent, than the multilevel design template is also internally consistent.
The internal consistency of the base method is examined in detail in the Ph.D.
dissertation of Hae-Jin Choi (Choi 2005 [Chapter 4]). In Choi’s work, the domain-
independent performance validity of the base method is tested by completing a
conceptual example problem—the design of a cantilever beam and its associated material.
Based on the effective application of the base method to an example problem, Choi
asserts that IDEM is internally consistent. Since the multilevel design template presented
in this thesis is based on IDEM, it can be concluded that it is also internally consistent.
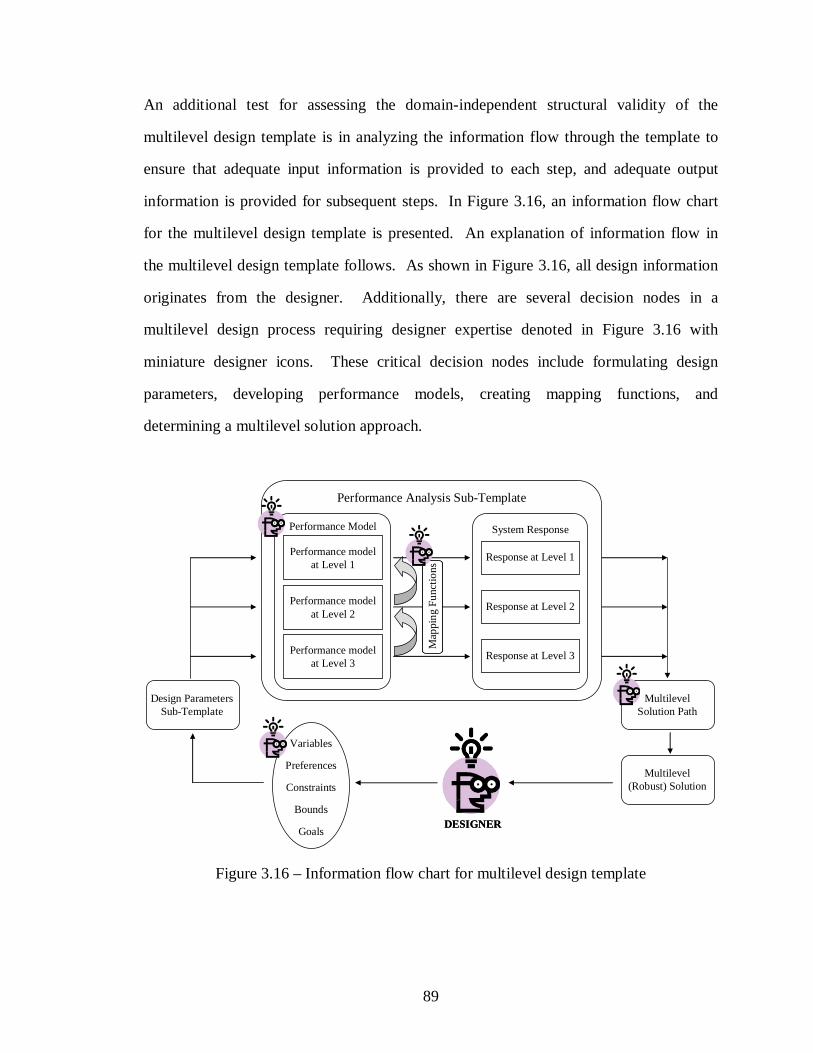
89
An additional test for assessing the domain-independent structural validity of the
multilevel design template is in analyzing the information flow through the template to
ensure that adequate input information is provided to each step, and adequate output
information is provided for subsequent steps. In Figure 3.16, an information flow chart
for the multilevel design template is presented. An explanation of information flow in
the multilevel design template follows. As shown in Figure 3.16, all design information
originates from the designer. Additionally, there are several decision nodes in a
multilevel design process requiring designer expertise denoted in Figure 3.16 with
miniature designer icons. These critical decision nodes include formulating design
parameters, developing performance models, creating mapping functions, and
determining a multilevel solution approach.
Variables
Bounds
Constraints
Goals
Preferences
Design Parameters Sub-Template
DESIGNERDESIGNER
Performance model at Level 1
Performance model at Level 2
Performance model at Level 3
Response at Level 1
Response at Level 2
Response at Level 3
Performance Model System Response
Map
pin
g F
unc
tions
Map
pin
g F
unc
tions
Performance Analysis Sub-Template
Multilevel Solution Path
Multilevel (Robust) Solution
Figure 3.16 – Information flow chart for multilevel design template

90
As shown in Figure 3.16, at the beginning of a template-based approach to multilevel
design, a designer specifies basic design information such as variables, preferences,
constraints, bounds, and goals. This information is stored in a design parameters sub-
template. The information from the design parameters sub-template is serves as input
information to multilevel performance models. Design information passes from the
design parameters sub-template to performance models by a system of storing and
recalling information in a computational framework.
The next step in the multilevel design template is to define various levels of model
complexity and develop system performance models at each level, steps provided by the
designer. The designer also creates mapping functions which illustrate the mathematical
relationship between various multilevel performance models and work to limit the
unmanageable large design space at complex design levels. Developing multilevel
performance models and mapping functions are the two most important steps of a
multilevel design process because they have the most influence on the design solution.
Input design information for the multilevel performance models comes from the design
parameters sub-template. Output information of the performance analysis sub-template is
a multilevel system response. The multilevel system response is then analyzed using a
multilevel solution path strategy, provided by the designer. In this thesis, an inductive
solution path strategy is used to analyze the multilevel response data to determine a
multilevel design solution. The output information from the multilevel solution path is a
multilevel design solution. If robustness goal is defined at the beginning of the design
process in the design parameters sub-template, then the multilevel design solution will be
robust to design uncertainty. To close the information loop of the multilevel design
template, the multilevel design solution is directed to the designer for analysis. As shown
in the multilevel design template information flow chart, each component of the template
has adequate input information, provided from the designer or other template components,

91
and each template component provides adequate output information for subsequent
design process steps. This logical flow of information adds value to the internal
consistency of the multilevel design template.
Additional confidence in the internal consistency of the developed template is achieved in
the successful implementation of the template in two example problems. It can be
assumed that applying the multilevel design template to two example problems and
reaching successful outcomes indicates a logical flow of information within the design
template. If the information flow in the multilevel design template is not logical, when
the template is applied to example problems, it is assumed that such illogical or
incomplete decision paths would be identified by the designer. A logical progression of
thought and flow of information adds value to the domain-independent structural validity
of the multilevel design template.
3.3.2 Domain-Independent Performance Validity
The domain-independent performance validity of a design method relates to the ability to
apply the design method to a range of example problems, not previously tested, and
achieve desirable results. The nature of a template-based approach to multilevel robust
design adds value to its domain-independence performance validity. That is, design
templates are designed to be sufficiently generic, modular, and flexible. Such qualities
indicate that a design template can be applied to a range of design problems. The
multilevel design template discussed in this thesis is presented at a high level of
abstraction. That is, the design template is very general, and can be applied to most all
multilevel design problems. However, in order to gain any real value from the design
template, it must be particularized for a specific design problem. The key to the domain-
independent structural validity of the multilevel design template is in its ability to be
particularized to a variety of design problems. Based on the successful particularization

92
of the template in the example problems presented in this thesis, it can be assumed that
the design template can be applied to additional design problems, beyond the domain of
examples investigated in this thesis.
The contribution of method validation presented in Chapter 3 is shown in Figure 3.17.
Domain-Specific Structural Validity
Appropriateness of the example problems.
Are the example problems used in modeling the method appropriate choices?
Domain-Specific Performance Validity
Ability to produce useful results for the chosen example problems.
Does the application of the method to the sample problems produce practical results?
1
2 3
4
CHAPTERS 4 and 5 CHAPTERS 4 and 5
CHAPTERS 2 and 3 CHAPTERS 3 and 6
Domain-Independent Structural Validity
Domain-IndependentPerformance Validity
Multilevel robust design template is based on existing multilevel robust design method.
Variables
Bounds
Constraints
Goals
Preferences
Performance Model
Response
Single Scale Design Template
The design template is flexible and modular—qualities that allow it to be particularized and applied to a family of example problems, similar to those investigated in this thesis.
Variables
Bounds
Constraints
Goals
Preferences
Performance Model
Response
Single Scale Design Template
Figure 3.17 – Value added to verification and validation of design template in Chapter 3
3.4 SYNOPSIS OF CHAPTER 3
The multilevel design template presented in Chapter 3 provides the theoretical backbone
for the reminder of the thesis. The multilevel design template is based on several key
concepts from Chapter 1 (such as multilevel design, design templates, and method
validation) and Chapter 2 (such as uncertainty in design, robust design, and the cDSP).
Looking ahead in this thesis, two example problems are solved using the multilevel

93
design template (Chapter 4 [cantilever beam], Chapter 5 [BRP]). In completing the
example problems, the advantages of a template-based approach to multilevel design are
illustrated. Additionally, successful completion of the example problems adds value to
the verification and validation of the multilevel design template. In Chapter 6, research
contributions from the development of the multilevel design template are presented and
discussed. Information regarding the verification and validation of the multilevel design
template are also presented in Chapter 6.

94
CHAPTER 4
CONCEPTUAL EXAMPLE – DESIGN OF A CANTILEVER BEAM
In Chapter 4, the concepts of template-based multilevel robust design are explored by
completing the design of a cantilever beam and its associated material. A cantilever
beam with non-negligible weight is loaded at the free end with a force of F = 10 N. The
cantilever beam has a length L = 2 m and a square cross-section with characteristic length
a. The maximum allowable deflection at the free end is δmax = 1 cm. The design goals
are to minimize the mass of the beam and to produce a design solution that is robust to
uncertainty characterized by variation in material properties: density (ρ), elastic modulus
(E), and yield strength (σy). Design variables include the cross-section area (a2) and the
material properties (ρ, E, σy) of the beam.
Materials design is achieved by alloying two existing materials (steel and aluminum) to
produce a material with desired properties, and by functionally grading material
properties along the length of the beam (from x = 0 to x = L). The desired material
properties are achieved by controlling the volume fraction of steel or aluminum present in
the designed material. Using the developed multilevel design template, the design
problem is divided into various levels of increasing complexity, including the design of a
solid beam with constant material properties, a discretized beam with independent
material properties in each segment, and functionally graded beam with material
properties that vary continuously along the length of the beam. Functions that map the
properties and performance of the beam across levels are developed. Uncertainty
propagation throughout the various levels is also modeled. Using a template-based
approach and an inductive solution path, a multilevel cantilever beam that is robust to
variation in material properties is designed. The completion of this example problem

95
adds value to the verification and validation of developed multilevel design template by
building confidence in its domain-specific structural and performance validity. A
summary of the information in Chapter 4 is given in Table 4.1 and Figure 4.1 illustrates
how Chapter 4 is connected to other ideas in this thesis.
Table 4.1 – Summary of Chapter 4
Heading / Sub-Heading Information Problem Overview Introduction to Example
Problem Cantilever beam example problem is introduced including:
- Design requirements - Design goals
Design Approach Nature of cantilever beam problem is examined: - Multilevel nature of design problem - Use of design templates for achieving inductive design
solution Value in Completing Example
Problem Address value based on:
- Research questions presented in Chapter 1 - Verification and validation of a template-based approach to
multilevel robust design Design Process and Solution Particularization of Multilevel
design template Multilevel design template is organized under the headings:
- Given – feasible alternative, assumptions, parameters, goals - Define – design levels, feasible design space, performance
metrics - Map – discrete points to solution ranges (deductive),
solution ranges to robust solution (inductive) - Find – design variables, deviation variables - Satisfy – constraints, bounds, goals - Minimize – weighted sum of deviation variables
Multilevel design template is particularized for cantilever beam design problem
Design Process Multilevel nature of cantilever beam design problem: - Level 1 – homogeneous material properties throughout
beam
- Level 2 – discretized beam with independent material properties in each segment
- Level 3 – functionally graded beam with continuously
changing material properties along length of beam
Cantilever Beam Multilevel Inductive Design Solution
Method for inductive multilevel design is presented and design solutions are obtained and discussed
Verification and Validation Verification and Validation of
Computational Design Tools Verification and validation of the computational tools used in obtaining cantilever beam multilevel robust design solution
Verification and Validation of Multilevel design template
Value added to the verification and validation of a template-based approach to multilevel design based on completing beam design

96
1
2 3
4
Multilevel cantilever beam design:• Design problem (requirements list)• Multilevel design template
particularized for beam design• Multilevel inductive design
approach and solution• Value added to method validation
Robust Design
Multilevel Design
Design Uncertainty
Design Templates
MO
TIV
AT
ION
ME
TH
OD
AN
ALY
SIS
CLO
SU
RE
1 – Motivation 2 – Literature Review
4 – Cantilever Beam
6 – Method Validation
5 – Blast Resistant Panel
3 – Theoretical Foundations
Figure 4.1 – Setting the context for Chapter 4
4.1 OVERVIEW OF CONCEPTUAL EXAMPLE – DESIGN OF A CANTILEVER
BEAM
The example problem examined in Chapter 4 is used to demonstrate the implementation
and advantages of a template-based approach in a multilevel robust design process.
Using the generic multilevel design template presented in Chapter 3, the multilevel
design template is particularized for the design of a cantilever beam and its material.
Testing the presented template-based approach to multilevel design adds value to the
verification and validation of the developed generic multilevel design approach from
Chapter 3. In Section 4.2, an overview of the design problem is presented. A conference
paper presented by Muchnick and coauthors at the ASME IDETC/CIE conference in 2006

97
details a preliminary cantilever beam design approach and solution (Muchnick, et al.
2006).
4.1.1 Introduction to Cantilever Beam Example Problem
Consider a solid cantilever beam with a square cross-section under constant loading. The
base of the beam is clamped to a solid vertical surface, and the free end of the beam is
allowed to translate and rotate. The beam is subject to a force of F = 10 N located at the
free end. The weight of the beam is modeled as a constant distributed load along the
length of the beam. The maximum allowable displacement at the free end is δmax = 0.01
m. The length of the beam is L = 2 m. In this design problem, the material properties of
the beam, as well as the cross-section area of the beam are design variables. The design
goals are to minimize the mass (thus, the weight) of the beam while designing a beam
that is robust to variation in material properties. An illustration of the loading conditions
and geometry of the beam are presented in Figure 4.2.
L = 2 ma
F = 10 N
a
δmax = 0.01 m
w = ρg
Figure 4.2 – Dimensions and loading conditions of cantilever beam
Incorporating materials design in the cantilever beam design problem gives an
opportunity for increased design complexity due to a potentially large number of design
variables. Because of this potential for design complexity, the cantilever beam design
problem is divided into various levels of model complexity. In order to reach a final
robust design solution, the various levels of design complexity are combined and

98
analyzed in an inductive multilevel robust design approach. A generic approach for
multilevel design is presented in Chapter 3. In order to apply this approach to the
cantilever beam design problem, the multilevel design template is particularized for this
design problem. This is discussed in more detail in Section 4.1.2.
Before the multilevel design solution is obtained, a method for analyzing beam
performance at a single level is selected. A compromise Decision Support Problem
(cDSP) is formulated at each design level in order to determine a robust design solution
at a single level of model complexity. The cDSP is discussed in detail in Chapter 2. A
cDSP for the overall cantilever beam design problem is given in Figure 4.3. A more
mathematically rigorous cDSP is presented for each level of model complexity in Section
4.2.2. The design requirements and goals for the overall cantilever beam example
problem are given in the cDSP in Figure 4.3 and discussed in more detail in the following
paragraphs.
Table 4.2 – cDSP for multilevel cantilever beam design
Word Formulation Mathematical Formulation Given Given Force at free end: F = 10 N Beam length: L = 2 m
Cantilever beam with a square cross-section loaded at the free end with beam weight modeled as a distributed load Beam cross-section: A = a2
Material properties reflect a steel / aluminum alloy using rule of mixtures where vf is percent of aluminum present in alloy
( ) ( )1alloy Al SteelX vf X vf X= + −
Material property uncertainty model 0.1vf∆ =
Cantilever beam performance models: deflection ( ), , , ,f F L a Eδ ρ=
mass ( ), ,m f a L ρ=
safety factor ( ). . , , , , yS F f F L a ρ σ=
Find Find Beam design variables Dimensions of beam cross-section: (a) Material properties of beam: (vf) Beam deviation variables di
+, di-

99
Table 4.2 (continued) – cDSP for multilevel cantilever beam design
Satisfy Satisfy Constraints Constraints Maximum allowable deflection δ + ∆δ ≤ 1 cm Minimum allowable safety factor s.f. ≥ 1 Bounds Bounds volume fraction 0 ≤ vf ± ∆vf ≤ 1 density 2700 kg/m3 ≤ ρ ≤ 7850 kg/m3 yield strength 105 MPa ≤ σy ≤ 325 MPa elastic modulus 69 GPa ≤ E ≤ 205 GPa cross-section dimension 0.5 cm ≤ a ≤ 15 cm deviation variables di
+, di- ≥ 0
di+ · di
- = 0 Goals Goals Minimize mass (m) d1
- = 1 – G1 / A1(x) W1 = 0.5 Maximize HD-EMIm d2
- = 1 – A2(x) / G2 W2 = 0.5 Minimize Minimize Deviation from target Z = W1d1
- + W2d2-
Cantilever Beam Design Requirements
The design requirements of the cantilever beam design problem are given in Table 4.3.
The design requirements detail the geometric, loading, performance, material, and
analysis specifications of the designed cantilever beam.
Table 4.3 – Requirements list for cantilever beam design
Design of a Cantilever Beam and its Material
Requirements list for the multilevel design of a cantilever beam and its associated material
Issued On: 10/1/2006
Problem Statement: Design a cantilever beam and its associated material to minimize beam mass and maximize robustness to material property uncertainty. Design variables include material properties (ρ, E, σy) and cross-section area (a2).
# Demand/Wish Requirements
Geometric requirements 1 D Length of beam: L = 2 m 2 D Cross-section area of beam is square: Area = a2 m2 3 D 0.005 m ≤ a ≤ 0.15 m
Loading Requirements and Boundary Conditions 4 D Force at free end: F = 10 N 5 D Weight of beam is modeled as a distributed load along length of beam
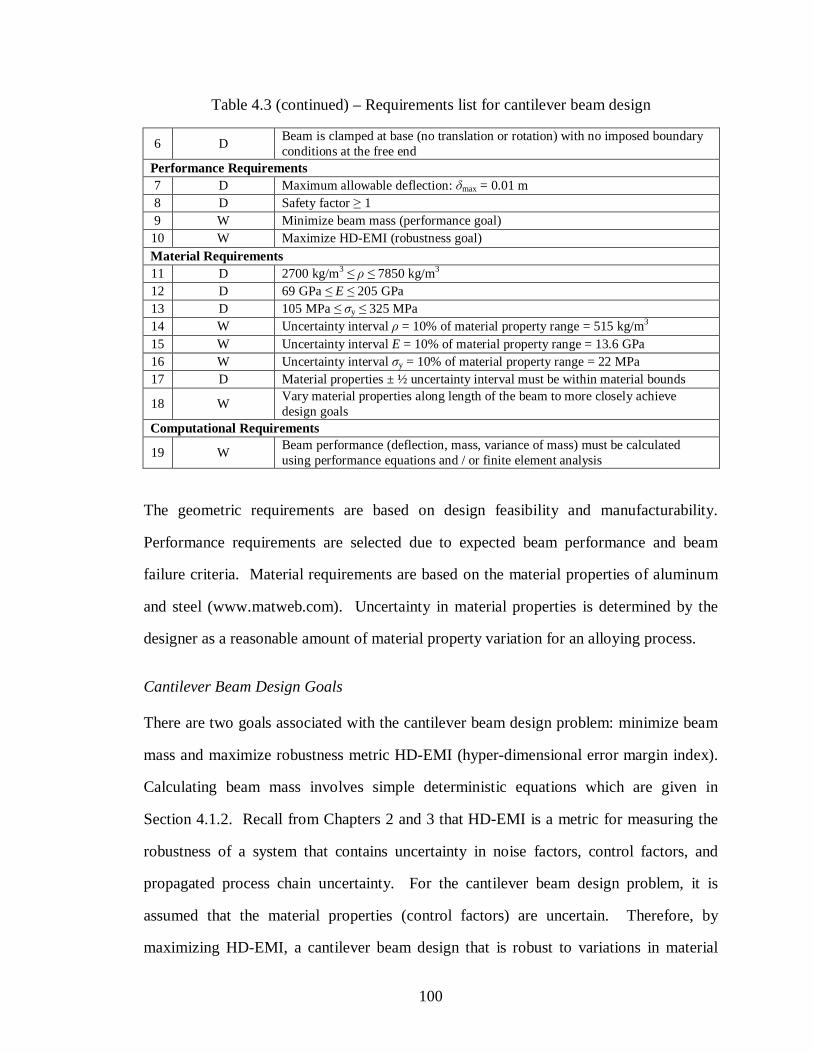
100
Table 4.3 (continued) – Requirements list for cantilever beam design
6 D Beam is clamped at base (no translation or rotation) with no imposed boundary conditions at the free end
Performance Requirements 7 D Maximum allowable deflection: δmax = 0.01 m 8 D Safety factor ≥ 1 9 W Minimize beam mass (performance goal) 10 W Maximize HD-EMI (robustness goal) Material Requirements 11 D 2700 kg/m3 ≤ ρ ≤ 7850 kg/m3 12 D 69 GPa ≤ E ≤ 205 GPa 13 D 105 MPa ≤ σy ≤ 325 MPa 14 W Uncertainty interval ρ = 10% of material property range = 515 kg/m3 15 W Uncertainty interval E = 10% of material property range = 13.6 GPa 16 W Uncertainty interval σy = 10% of material property range = 22 MPa 17 D Material properties ± ½ uncertainty interval must be within material bounds
18 W Vary material properties along length of the beam to more closely achieve design goals
Computational Requirements
19 W Beam performance (deflection, mass, variance of mass) must be calculated using performance equations and / or finite element analysis
The geometric requirements are based on design feasibility and manufacturability.
Performance requirements are selected due to expected beam performance and beam
failure criteria. Material requirements are based on the material properties of aluminum
and steel (www.matweb.com). Uncertainty in material properties is determined by the
designer as a reasonable amount of material property variation for an alloying process.
Cantilever Beam Design Goals
There are two goals associated with the cantilever beam design problem: minimize beam
mass and maximize robustness metric HD-EMI (hyper-dimensional error margin index).
Calculating beam mass involves simple deterministic equations which are given in
Section 4.1.2. Recall from Chapters 2 and 3 that HD-EMI is a metric for measuring the
robustness of a system that contains uncertainty in noise factors, control factors, and
propagated process chain uncertainty. For the cantilever beam design problem, it is
assumed that the material properties (control factors) are uncertain. Therefore, by
maximizing HD-EMI, a cantilever beam design that is robust to variations in material

101
composition and robust to uncertainty in the multilevel design process chain is achieved.
More details in how the HD-EMI metric is applied to the design problem at each level is
given in Section 4.2.
4.1.2 Multilevel Design Approach for Cantilever Beam Design
In Section 4.1.2, an overview of the multilevel approach used in solving the cantilever
beam design problem is presented. First, the multilevel nature of the design problem is
presented. Then, a summary of the application of the multilevel design template
(developed in Chapter 3) in the cantilever beam example problem is given.
Cantilever Beam Design as a Multilevel Design Problem
At first, the cantilever beam design problem may seem rather simple, and not multilevel.
After careful consideration, it becomes clear that by designing the geometry and the
material of the beam, this example problem has the potential for increased design
complexity. For example, the cantilever beam material could be designed at the
continuum, meso, micro, or nano level. Also, material properties could be homogeneous
or vary throughout the beam. When presented with such design complexity, it is left to
the expertise of the designer to determine the levels of complexity that are considered in
this design problem.
In this thesis, the multilevel nature of the cantilever beam problem is defined based on
three levels of increasing design complexity. At multilevel model 1, the beam is modeled
with homogeneous material properties. The design variables include the material
properties of the beam (ρ, E, σy) and the characteristic cross-section dimension (a). At
multilevel model 2, the material properties of the beam are allowed to vary along the
length of the beam. The beam is divided into 10 discrete segments with independent
material properties. The material properties in each segment are a function of volume
fraction. Volume fraction is a measure of the percent of aluminum present in the steel-

102
aluminum alloy used in beam materials design. A variety of material properties (ρi, Ei,
σyi, for i = 1 to 10) can be defined using only 10 volume fraction design variables. The
design variables in multilevel model 2 include the volume fraction of each segment (vf1 –
vf10) and the characteristic cross-section dimension (a). At multilevel model 3, the beam
is designed using continuously changing material properties. Similar to multilevel model
2, volume fraction calculations are used to calculate beam material properties. The
continuously changing material properties of the beam are determined based on a series
of cubic splines. The design variables include 21 control points evenly spaced along the
length of the beam (used in calculating cubic splines) and the cross-section dimension (a).
The mathematical details for this multilevel design problem are presented in detail in
Section 4.2. A pictorial representation of the multilevel nature of the cantilever beam
design problem is shown in Figure 4.3.
vf1 vf2 vf3 vf4 vf5 vf6 vf7 vf8 vf9 vf10
Incr
ease
d M
odel
Com
plex
ity
Multilevel model 1
Multilevel model 2
Multilevel model 3
Figure 4.3 – Multilevel design approach for cantilever beam example
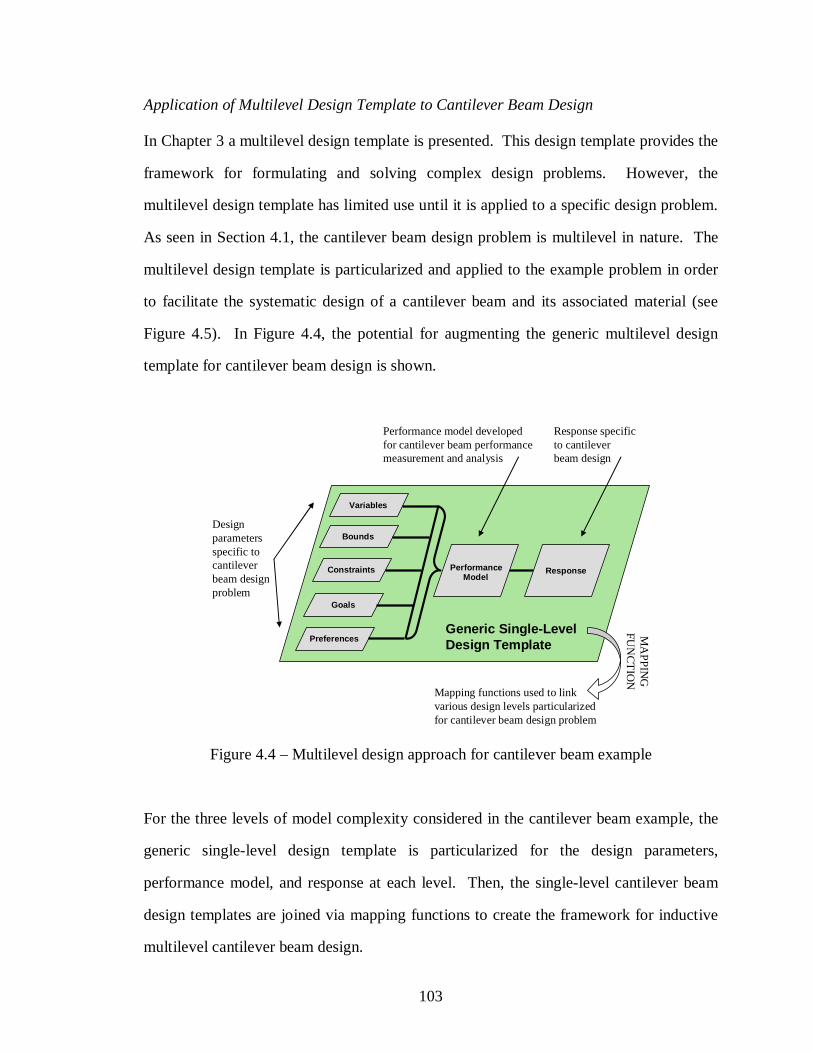
103
Application of Multilevel Design Template to Cantilever Beam Design
In Chapter 3 a multilevel design template is presented. This design template provides the
framework for formulating and solving complex design problems. However, the
multilevel design template has limited use until it is applied to a specific design problem.
As seen in Section 4.1, the cantilever beam design problem is multilevel in nature. The
multilevel design template is particularized and applied to the example problem in order
to facilitate the systematic design of a cantilever beam and its associated material (see
Figure 4.5). In Figure 4.4, the potential for augmenting the generic multilevel design
template for cantilever beam design is shown.
Variables
Bounds
Constraints
Goals
Preferences
Performance Model
Response
Generic Single-Level Design Template
Design parameters specific to cantilever beam design problem
Performance model developed for cantilever beam performance measurement and analysis
Response specific to cantilever beam design
Mapping functions used to link various design levels particularized for cantilever beam design problem
MA
PP
ING
F
UN
CT
ION
Figure 4.4 – Multilevel design approach for cantilever beam example
For the three levels of model complexity considered in the cantilever beam example, the
generic single-level design template is particularized for the design parameters,
performance model, and response at each level. Then, the single-level cantilever beam
design templates are joined via mapping functions to create the framework for inductive
multilevel cantilever beam design.

104
4.1.3 Value in Completing Cantilever Beam Example Problem
Addressing Research Questions
In the following section, the motivation for completing the example problem of the
design of a cantilever beam and its material is discussed. The motivation for completing
the example problem is divided in two topics: to demonstrate the multilevel robust design
of multilevel systems using a design template approach (in response to Research
Question #1, Section 1.3), and to provide an avenue for the validation of the generic
multilevel design template presented in Chapter 3. A summary of the example problem
and the related motivation is presented in Figure 4.5.
Figure 4.5 – Overview and motivation for cantilever beam example problem
The cantilever beam example problem is selected because of its similarity to the topics
discussed in the research questions. That is, the cantilever beam example problem is a
clearly defined multilevel design problem for which a multilevel design template can be
applied. The primary motivation in completing the cantilever beam example problem is
to demonstrate the usefulness of a template-based approach in the robust design of
multilevel systems (Research Question #1, Section 1.3). The application of the
multilevel design template to the cantilever beam example problem, and evidence of
Example Problem Motivation
Cantilever Beam Design Design of a cantilever beam and its associated material
• Design goals minimize beam weight maximize beam robustness to uncertainty in material properties
• Design constraints maximum deflection δmax ≤ 1 cm safety factor ≥ 1 • Design variables material properties of beam
beam cross-sectional area
• Example problem used to illustrate the concepts of template-based multilevel robust design and to validate developed multilevel design template
L = 2 ma
F = 10 N
a
δmax = 0.01 m
w = ρg

105
useful results, add value to the verification and validation of the multilevel design
template presented in Chapter 3.
Verification and Validation of Multilevel Design Template
Additionally, completing the cantilever beam example problem adds value to the
verification and validation of the developed multilevel design template (discussed in
more detail in Section 4.3 and in Chapter 6). The cantilever beam example problem
contributes to the domain-specific structural validity (appropriateness of example
problems) and the domain-specific performance validity (ability to produce useful results
for the chosen example problems) of the multilevel design templates. Additionally, the
cantilever beam example problem is intended to illustrate the key advantages of the
multilevel design template. Recall that one of the key advantages of the multilevel
design template is a procedure for limiting complex design space exploration to include
only areas likely to contain satisficing design solutions. Although the cantilever beam
example problem is relatively simple and can be solved directly without the use of the
multilevel design template, cantilever beam design is included in this thesis to illustrate
the benefits of the multilevel design template when applied to more complex design
problems. This example problem is not intended to encompass a detailed, comprehensive
multilevel robust design problem formulation and solution. However, lessons obtained in
completing this conceptual example problem can be abstracted to facilitate deeper
learning in template-based multilevel robust design. A more comprehensive example
problem is presented and discussed in Chapter 5, in the design of a BRP.
4.2 CANTILEVER BEAM DESIGN PROCESS AND SOLUTION
In the following section, the design of a cantilever beam and its associated material are
presented. First, the cantilever beam design process, as it relates to the developed
multilevel design template, is discussed. Then, the details of the problem formulation,
design process, and solutions are examined. The successful implementation of a

106
template-based approach to the design of a cantilever beam and its material build
confidence in the verification and validation of a template-based design approach to
multilevel systems.
4.2.1 Multilevel Design Template Particularized for Cantilever Beam Design
In the following section, a generic template for multilevel robust design is particularized
for the design of a cantilever beam and its material. Recall from Chapter 3 the generic
design template for multilevel robust design represented in word form, organized under
the headings Given, Define, Map, Find, Satisfy, Minimize, is restated in Figure 4.6. The
generic multilevel design template is particularized for the cantilever beam example
problem and is shown in Figure 4.7.
Figure 4.6 – Generic word formulation of multilevel design template
The cantilever beam multilevel design template in Figure 4.7 begins with the collection
and modeling of design parameters including: design variables, design variable bounds,
design constraints, design goals, and design preferences. The design parameters are
given in the problem statement or determined by an experienced engineer. Following the
specification of design parameters, multilevel models of the multilevel design problem
Given A feasible alternative Assumptions Parameters Goals
Define Design levels Feasible design space
Map Discrete points to solution ranges
(deductive) Solution ranges to robust solution
(inductive)
Find Design variables Deviation variables
Satisfy Constraints Bounds Goals
Minimize Weighted sum of deviation
variables

107
are developed. Multilevel models are used to predict the response or performance of the
design at each level of model complexity.
Variables
Bounds
Constraints
Goals
Preferences
Analysis Sub-Template – Level 2
Design Parameters Sub-Template
Analysis Sub-Template – Level 1
Mass, ∆Mass
Analysis Sub-Template – Level 3Map
pin
g
Fu
nct
ion
sM
app
ing
F
un
ctio
ns
Incr
ease
d m
odel
com
plex
ity
Response
Response
Response
Mass, ∆Mass
Mass, ∆Mass
Figure 4.7 – Multilevel design template for cantilever beam product and materials design
For the cantilever beam design problem, three levels of model complexity are considered.
The multilevel models defined for the cantilever beam example problem include a beam
with homogeneous material properties, a discretized beam (10 segments of uniform
length), and a beam with functionally graded material properties. The cantilever beam
example problem could be described using more levels of complexity. However, for the
purposes of this conceptual example problem, three levels of design complexity are
sufficient to display the concepts presented in this thesis. Each multilevel model is linked
with mapping functions that map material properties and uncertainty models at each level
interface. At the end of the multilevel design template, the design performance is
determined using multilevel models. For the cantilever beam example, the mass and
variation of mass is measured at the Design Performance section of the multilevel design
template.

108
4.2.2 Cantilever Beam Design Process
In the following section, the cantilever beam design process based on the developed
multilevel design template is presented. In Section 4.2.2, the problem formulation and
solution procedure is given. In Section 4.2.3 the inductive robust design solution is
presented. Topics discussed in the following section are organized under the headings
found in the multilevel design template: Given, Define, Map, Find, Satisfy, Minimize. By
grouping the design information in this way, the natural flow of information in the
multilevel cantilever design process is preserved.
Given
The following information provides the underlying assumptions of the cantilever beam
design problem.
A Feasible Alternative
The feasible alternative that this design process is based on is a cantilever beam with a
square cross-section. The beam is clamped at its base and is loaded at its free end. The
weight of the beam is considered as non-negligible and is modeled as a distributed load
along the length of the beam. Improvements to the feasible alternative are achieved my
modifying the product geometry and material properties.
Assumptions
Assumptions used to model beam performance are as follows: The beam is assumed to be
clamped at its base (no translation or rotation). The free end of the beam is allowed to
translate and rotate in all directions; however, it is assumed that maximum beam
deflection occurs in the same direction as the applied load (in the y-direction). Based on
cantilever beam deflection equations, the maximum deflection is assumed to occur at the
free end (at x = L). Materials design of the cantilever beam occurs at the continuum level.

109
Any change in material properties throughout the beam occurs along the length of the
beam (in the x-direction).
Parameters
Parameters for cantilever beam design include system variables, constraints, and goals.
Design parameters are summarized in Table 4.4, and discussed in more detail in the
following section.
Table 4.4 – Cantilever beam design parameters
System Variables Constraints Goals vf, a (Level 1) δmax ≤ 1 cm minimize mass vf1 – vf10, a (Level 2) s.f. ≥ 1 maximize HD-EMI cp1 – cp21, a (Level 3)
Define
In the following section design levels and feasible design space are defined for the
cantilever beam example.
Design Levels
Design levels represent the amount of design simplicity or complexity that is considered
in reaching a design solution. The cantilever beam design problem is divided into three
levels of model complexity. In the following section, a cDSP, performance modeling
equations, and modeling techniques are presented for each design level. Recall that when
making design decision at a single level, a cDSP is employed.
Level 1
In Level 1, the simplest level of cantilever beam analysis with two design variables, the
material properties of the beam are considered to be constant throughout the beam. As
stated previously, the material properties of the beam are achieved by alloying steel and

110
aluminum. Therefore, material properties are expressed based on the volume fraction of
aluminum present in the alloy. This relationship is shown in Equation 4.1, and can be
used for all of the material properties required for material property calculations: E, ρ,
and σy, where XA and XB are the material properties of alloy component A and alloy
component B, respectively. By varying the volume fraction of the beam’s material one is
able to design a material that best meets design goals.
( ) ( ) BAalloy XvfXvfX −+= 1 (4.1)
A cDSP for Level 1 is given in Table 4.5. Recall the word formulation of the multilevel
design template in Figure 4.6. Under the Define heading, three design levels are defined
for the cantilever beam design problem. A cDSP is created at each design level (Table
4.4).
Table 4.5 – Cantilever beam Level 1 cDSP
Word Formulation Mathematical Formulation Given Given Force at free end: F = 10 N Beam length: L = 2 m
Cantilever beam with a square cross-section loaded at the free end with beam weight modeled as a distributed load Beam cross-section: A = a2
Material properties reflect a steel / aluminum alloy using rule of mixtures where vf is percent of aluminum present in alloy
( ) ( )1alloy Al SteelX vf X vf X= + −
Constant material properties throughout beam
Material property uncertainty model 0.1vf∆ =
Cantilever beam performance models: deflection ( ), , , ,f F L a Eδ ρ=
mass ( ), ,m f a L ρ=
safety factor ( ). . , , , , yS F f F L a ρ σ=
Find Find Beam design variables Dimensions of beam cross-section: (a) Material properties of beam: (vf) Beam deviation variables di
+, di-

111
Table 4.5 (continued) – Cantilever beam Level 1 cDSP
Satisfy Satisfy Constraints Constraints Maximum allowable deflection δ + ∆δ ≤ 1 cm Minimum allowable safety factor s.f. ≥ 1 Bounds Bounds volume fraction 0 ≤ vf ± ∆vf ≤ 1 density 2700 kg/m3 ≤ ρ ≤ 7850 kg/m3 yield strength 105 MPa ≤ σy ≤ 325 MPa elastic modulus 69 GPa ≤ E ≤ 205 GPa cross-section dimension 0.5 cm ≤ a ≤ 15 cm deviation variables di
+, di- ≥ 0
di+ · di
- = 0 Goals Goals Minimize mass (m) d1
- = 1 – G1 / A1(x) W1 = 0.5 Maximize HD-EMIm d2
- = 1 – A2(x) / G2 W2 = 0.5 Minimize Minimize Deviation from target Z = W1d1
- + W2d2-
Determining a robust solution to the design of a cantilever beam at Level 1 is executed in
Matlab. The cDSP is modeled as a multi-objective constrained optimization problem,
making use of the Matlab built-in function fmincon() (MATALB 2004). The design
variables include the characteristic cross-section dimension (a) and the volume fraction
of beam material (vf). The performance of the beam is measured by calculating the
deflection (δmax), mass (m), variation of mass (∆m), safety factor (S.F.), and HD-EMI of
beam performance. The equations used to calculate the performance of the beam are
presented below (Gere 2001; Choi 2005).
( )
4
423
max 238Ea
LgaFL ρδ +−= (4.2)
ρLam 2= (4.3)
ρρρ
∆=∆∂∂=∆ Lam
m 2 (4.4)

112
( )
+=3
2/6..
a
gFLFS y
ρσ
(4.5)
−−=−
massmassjmass
massjmass
massbmean
bmean
,
,minEMIHD (4.6)
Level 2
For Level 2 model complexity, the material properties of the cantilever beam are allowed
to vary along the length of the beam, as shown in Figure 4.8.
x
E = f (x)ρ = f (x)σy = f (x)
x = L
Figure 4.8 – Material properties as a function of x
Recall from Figure 4.3 that at Level 2, the cantilever beam is modeled with 10 discrete
segments (each of length 0.2 m) such that the material properties of each segment are
independent. A design solution that more accurately achieves design goals is realized by
choosing a stronger/heavier material for the base of the beam, and a weaker/lighter
material for the beam’s free end. A cDSP for Level 2 is presented in Table 4.6.

113
Table 4.6 – Cantilever beam Level 2 cDSP
Word Formulation Mathematical Formulation Given Given Force at free end: F = 10 N Beam length: L = 2 m
Cantilever beam with a square cross-section loaded at the free end with beam weight modeled as a distributed load Beam cross-section: A = a2
Material properties reflect a steel / aluminum alloy using rule of mixtures where vf is percent of aluminum present in alloy
( ) ( )1alloy Al SteelX vf X vf X= + −
Independent material properties in 10 segments of beam
Material property uncertainty model 0.1vf∆ =
Cantilever beam performance models: deflection ( ), , , ,f F L a Eδ ρ=
mass ( ), ,m f a L ρ=
safety factor ( ). . , , , , yS F f F L a ρ σ=
Find Find Beam design variables Dimensions of beam cross-section: (a) Material properties of beam: (vf1, vf2, ..., vf10) Beam deviation variables di
+, di-
Satisfy Satisfy Constraints Constraints Maximum allowable deflection δ + ∆δ ≤ 1 cm Minimum allowable safety factor s.f. ≥ 1 Multilevel inductive constraint ( ) 1
10
1 2, %510 level
i leveli vfvf
±=∑ =
Bounds Bounds volume fraction 0 ≤ vf ± ∆vf ≤ 1 density 2700 kg/m3 ≤ ρ ≤ 7850 kg/m3 yield strength 105 MPa ≤ σy ≤ 325 MPa elastic modulus 69 GPa ≤ E ≤ 205 GPa cross-section dimension 0.5 cm ≤ a ≤ 15 cm deviation variables di
+, di- ≥ 0
di+ · di
- = 0 Goals Goals Minimize mass (m) d1
- = 1 – G1 / A1(x) W1 = 0.5 Maximize HD-EMIm d2
- = 1 – A2(x) / G2 W2 = 0.5 Minimize Minimize Deviation from target Z = W1d1
- + W2d2-
Since the beam at Level 2 does not have constant material properties, the beam
performance equations presented in Equation 4.2 – Equation 4.5 cannot be used.
Therefore, to enable heterogeneous material properties in the resultant beam, the beam is

114
modeled in COMSOL, a finite element modeling software. A flow-chart of the modeling
techniques used in beam design at Level 2 is shown in Figure 4.9.
cDSP function: Initiates the design of a cantilever beam and its material
This function calls the optimization function, fmincon()
Objective function: Used to store design
goals and weights
Constraint function: Used to store the constraints of the cantilever beam design problem
Call to COMSOL to determine deflection and stress distributed
of the current beam design
Yield stress function: Used to calculate yield stress of the current beam design
Mass function: Used to calculate mass of
current beam design
Figure 4.9 – Information flow in beam design at Level 2
The beam is modeled in COMSOL using ten discrete segments with independent material
properties, as shown previously in Figure 4.4. COMSOL is chosen because of its
availability and ease of use; COMSOL is compatible with MATLAB. The volume
fraction (vf) in each of the segments are assigned independently. The inputs to the
COMSOL beam performance model are the characteristic dimension of the beam cross-
section (a) and the volume fraction in each segment (vf1 – vf10). The characteristic
dimension (a) is held constant for all sections to avoid stress concentrations. The outputs
of the interaction model are the maximum deflection of the beam, the maximum stress,
and the location of maximum stress. A simple script to calculate the mass of the beam is
also created in MATLAB by summing the mass of the individual segments based on the
volume fractions in each segment and the densities of the alloy components, as shown in
Equation 4.7. Equations for variation in mass and HD-EMImass are also given.
[ ]( )∑ = −+=10
1
22.0i steelalisteeltotal vfam ρρρ (4.7)

115
ρρρ
∆=∆∂∂=∆ Lam
m 2 (4.8)
−−=−
massmassjmass
massjmass
massbmean
bmean
,
,minEMIHD (4.9)
Once the deflection and stress of the beam are calculated in COMSOL, this information
is passed to a MATLAB file implementing the built-in optimization function
fmincon() (MATLAB 2004). Similar to Level 1, beam performance information,
combined with specified constraints and goals are used to determine a beam solution that
is robust to variation in material properties.
Level 3
In cantilever beam Level 3 analysis, the material properties of the beam are continuously
changing along the length of the beam. In order to analyze the performance of a
functionally graded cantilever beam, the design optimization capabilities of MATLAB
are combined with the beam response measurements obtained from FEA software
COMSOL (similar to the design approach for Level 2, Figure 4.9). In COMSOL, the
cantilever beam is modeled as a single part with material properties based on continuous
functions. Using COMSOL, material properties can be defined based on a set of control
points that are joined using a series of connected cubic splines. In the cantilever beam
design process, 21 control points are defined along the length of the beam (cp1 – cp 21)
as shown in Figure 4.10. The control points are connected with smooth, continuous
functions mathematically defined by a series of 20 joined cubic splines. The control
points are design variables that describe the volume fraction of the material at a particular
location along the beam. Therefore, by changing the control points, the material
properties and performance of the beam change.

116
cp1 cp3 cp5 cp7 cp9 cp11 cp13 cp15 cp17 cp19 cp21
cp2
(vf1)
cp4
(vf2)
cp6
(vf3)
cp8
(vf4)
cp10
(vf5)
cp12
(vf6)
cp14
(vf7)
cp16
(vf8)
cp18
(vf9)
cp20
(vf10)
Multilevel model 3
Figure 4.10 – Cantilever beam design approach for Level 3
Similar to design at Level 1 and Level 2, the MATLAB minimization function
fmincon() is used to determine a robust design solution. However, with 22 design
variables in Level 3 (cp1 – cp21, a) the design space cannot be fully explored due to the
limitations of computing software. Therefore, the number of design variables is reduced
from 21 to 12 by assuming that the values for cp2, cp4, cp6, ... , cp20 are equal to the
values of vf1 – vf10 determined in cantilever beam design at Level 2, shown in Figure
4.11. In addition to reducing the number of design variables (without taking away from
the design complexity) this method transfers design information from Level 2 to Level 3,
an important step in inductive multilevel design, discussed in a later section. With a
functionally graded cantilever beam, calculated beam mass is no longer trivial. The exact
formula for beam mass is given in Equation 4.10.
( )∫ ===Lx
xtotal dxxam0
2 ρ (4.10)
For this design problem, the equation for beam density consists of a series of 20 cubic
equations in which each equation defines a function for beam density along 0.1 meters of
the beam. Due to this complexity, an approximation is used to determine beam mass,
shown in Equation 4.11. Equations for variation in mass and HD-EMImass are also given.

117
+= ∑ = +20
112
21.0
iii
total amρρ
(4.11)
ρρρ
∆=∆∂∂=∆ Lam
m 2 (4.12)
−−=−
massmassjmass
massjmass
massbmean
bmean
,
,minEMIHD (4.13)
A cDSP describing the cantilever beam design process at Level 3 is shown in Table 4.7.
Table 4.7 – Cantilever beam Level 3 cDSP
Word Formulation Mathematical Formulation Given Given Force at free end: F = 10 N Beam length: L = 2 m
Cantilever beam with a square cross-section loaded at the free end with beam weight modeled as a distributed load Beam cross-section: A = a2
Material properties reflect a steel / aluminum alloy using rule of mixtures where vf is percent of aluminum present in alloy
( ) ( )1alloy Al SteelX vf X vf X= + −
Continuous material properties defined by 21 control point connected with a series of cubic splines
Material property uncertainty model 0.1vf∆ =
Cantilever beam performance models: deflection ( ), , , ,f F L a Eδ ρ=
mass ( ), ,m f a L ρ=
safety factor ( ). . , , , , yS F f F L a ρ σ=
Find Find Beam design variables Dimensions of beam cross-section: (a) Material properties of beam: (vf1, vf3, vf5, ... , vf21) Beam deviation variables di
+, di-
Satisfy Satisfy Constraints Constraints Maximum allowable deflection δ + ∆δ ≤ 1 cm Minimum allowable safety factor s.f. ≥ 1 Multilevel inductive constraint
{ }10,...,3,2,12,3,2
=
=
i
vfcp levelileveli

118
Table 4.7 (continued) – Cantilever beam Level 3 cDSP
Bounds Bounds volume fraction 0 ≤ vf ± ∆vf ≤ 1 density 2700 kg/m3 ≤ ρ ≤ 7850 kg/m3 yield strength 105 MPa ≤ σy ≤ 325 MPa elastic modulus 69 GPa ≤ E ≤ 205 GPa cross-section dimension 0.5 cm ≤ a ≤ 15 cm deviation variables di
+, di- ≥ 0
di+ · di
- = 0 Goals Goals Minimize mass (m) d1
- = 1 – G1 / A1(x) W1 = 0.5 Maximize HD-EMIm d2
- = 1 – A2(x) / G2 W2 = 0.5 Minimize Minimize Deviation from target Z = W1d1
- + W2d2-
Feasible Design Space
The feasible design space at each level of design complexity is defined by bounds placed
on design variables. That is, it is impossible to achieve a design solution outside the
design variable bounds. In beam design, bounds on design material property variables
are determined based on material properties of known materials (steel and aluminum).
Design bounds for beam cross-section dimension (a) are based on estimations of beam
manufacturability. Bounds placed on volume fraction / control point measurements span
from 0% to 100% representing the percentage of aluminum present in the steel /
aluminum alloy used for beam design. A summary of the feasible design space for
multilevel cantilever beam design is given in Table 4.8.
Table 4.8 – Bounds on design variables for cantilever beam desgin
Design Variable Lower Bound Upper Bound a 0.05 m 0.15 m ρ 2700 kg/m3 7850 kg/m3 E 69 GPa 205 GPa σy 105 MPa 325 MPa
vf / cp 0 % 100 %
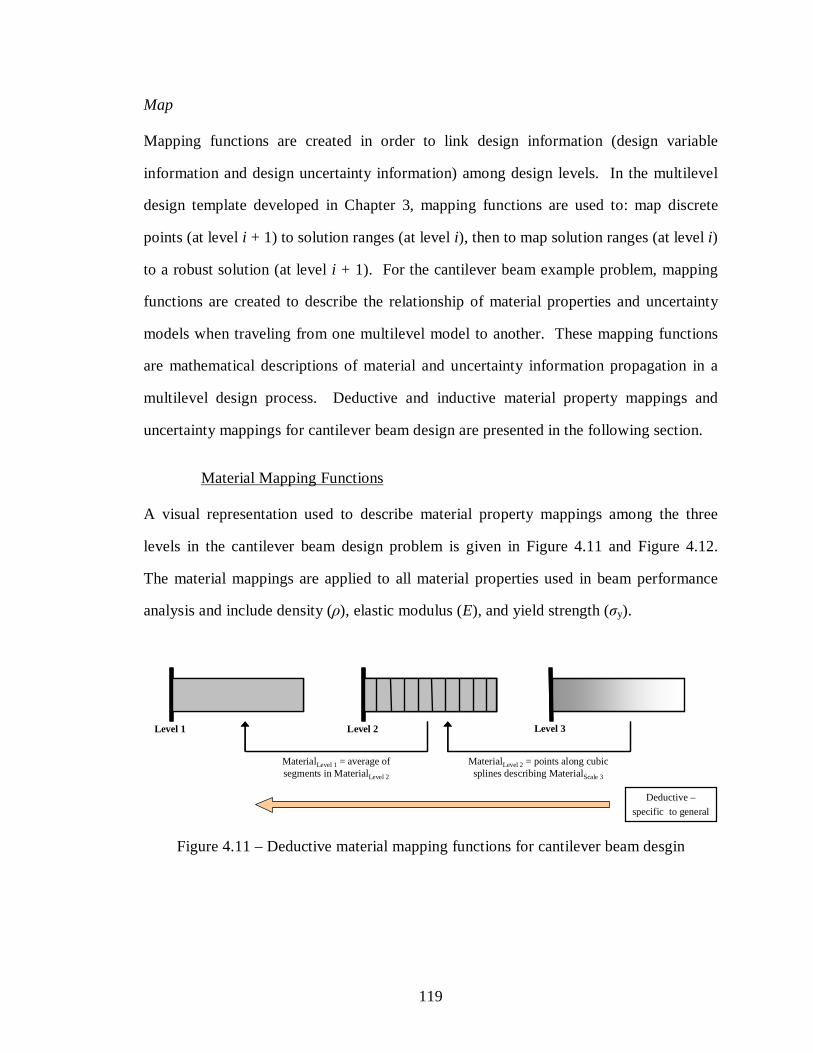
119
Map
Mapping functions are created in order to link design information (design variable
information and design uncertainty information) among design levels. In the multilevel
design template developed in Chapter 3, mapping functions are used to: map discrete
points (at level i + 1) to solution ranges (at level i), then to map solution ranges (at level i)
to a robust solution (at level i + 1). For the cantilever beam example problem, mapping
functions are created to describe the relationship of material properties and uncertainty
models when traveling from one multilevel model to another. These mapping functions
are mathematical descriptions of material and uncertainty information propagation in a
multilevel design process. Deductive and inductive material property mappings and
uncertainty mappings for cantilever beam design are presented in the following section.
Material Mapping Functions
A visual representation used to describe material property mappings among the three
levels in the cantilever beam design problem is given in Figure 4.11 and Figure 4.12.
The material mappings are applied to all material properties used in beam performance
analysis and include density (ρ), elastic modulus (E), and yield strength (σy).
Deductive –
specific to general
Level 1 Level 2 Level 3
MaterialLevel 1 = average of segments in MaterialLevel 2
MaterialLevel 2 = points along cubic splines describing MaterialScale 3
Figure 4.11 – Deductive material mapping functions for cantilever beam desgin

120
A description of the specific mapping functions follows:
Deductive mapping functions
- Level 3 to Level 2 – In Level 3, a series of cubic splines are used to define
material properties in the cantilever beam as a function of position along the
length of a beam. In order to determine material properties in the discrete
segments of a cantilever beam in Level 2, the continuous material functions
are evaluated at specific locations along the length of the beam.
- Level 2 to Level 1 – The homogeneous material properties in Level 1 are
defined as the average of the heterogeneous material properties of Level 2.
Inductive –
general to specific
Level 1 Level 2 Level 3
MaterialLevel 3 = cubic splines fit to material data in MaterialLevel 2
MaterialLevel 2 = “best” material distribution using inequality constraint from MaterialLevel 1
Figure 4.12 – Inductive material mapping functions for cantilever beam design
Inductive mapping functions
- Level 1 to Level 2 – When solving for a robust beam design at Level 2, an
additional constraint is added such that the average material properties at
Level 2 are within 5% of the material properties solved in Level 1. This
constraint preserves design information from Level 1 when making design
decisions at Level 2 (Equation 4.17). A 5% error bound is allowed so that the
design problem is not overly restrictive and a feasible solution can be found.
- Level 2 to Level 3 – The 10 design variables describing volume fraction in
Level 2 (vf1 – vf10) are preserved in the Level 3 robust design solution.

121
Material property functions at Level 3 are modeled as a series of cubic splines.
The volume fraction solved for in Level 2, in addition to 11 other design
points, are used as control points in defining material property cubic splines at
Level 3 (Equation 4.18).
Uncertainty Mapping Functions
In order to determine a robust cantilever beam design, uncertainty in the beam example
problem must be identified and modeled. It is assumed that material properties of the
beam are uncertain design parameters. The material properties of interest in this design
problem are density (ρ), elastic modulus (E), and yield strength (σy). Each material
property can also be described using the volume fraction (vf) calculation. For the
cantilever beam example problem, it is assumed that each material property contains a
10% error bound. That is, when specifying a material property in the design process, the
uncertainty in the material property is modeled as bounds surrounding the designed
material property value. A representation of this concept is shown in Figure 4.13.
Material Property Uncertainty Model
density (ρ)
average_ρlb_ρ ub_ρ
∆ρ = 10% (ub_ρ – lb_ρ)
elastic modulus (E)
average_Elb_E ub_E
∆E = 10% (ub_E – lb_E)
yield strength (σy)
average_ σylb_ σy ub_ σy
∆σy = 10% (ub_σy – lb_ σy)
volume fraction (vf)
average_vflb_vf ub_vf
∆vf = 10% (ub_vf – lb_vf)
Figure 4.13 – Uncertainty mapping of cantilever beam material properties

122
Find
Design variables and deviation variables at each level of design are determined for the
robust solution, and are listed in Table 4.9.
Table 4.9 – Design variables and deviation variables to find in beam design solution
Design Level Design Variables Deviation Variables
Level 1 vf, a −+ii dd ,
Level 2 vf1 – vf10, a −+ii dd ,
Level 3 cp1 – cp21, a −+ii dd ,
Satisfy
Constraints
For cantilever beam design, performance constraints are given in Equation 4.14 and
Equation 4.15. The maximum allowable beam deflection is 1 cm, and the safety factor at
any location throughout the beam must be greater than or equal to 1.
cm1max ≤δ (4.14)
safety factor 1≥ (4.15)
Because of the uncertainty associated with material properties, an additional constraint
must be added to the solution-finding algorithm. Since the material properties are
uncertain up to 5% above and below the mean predicted value, the material properties
determined for the solution must not vary outside the lower bound and upper bound set
for each material property. This constraint is represented in Equation 4.16.

123
( )( )
{ }yEx
xx
xx
σρ ,,
0boundupper 2
1
02
1boundlower
=∀≤−
∆+
≤
∆−−
(4.16)
In an inductive design process, an additional constraint is imposed such that the robust
design solution at level i + 1 is constrained to behave similar to the robust design solution
previously determined at level i. Linking design levels in inductive design through
imposed design constraints is given in Equation 4.17 (Level 1 to Level 2) and Equation
4.18 (Level 2 to Level 3).
( ) 1
10
1 2, %510 level
i leveli vfvf
±=∑ = (4.17)
{ }10,...,3,2,12,3,2
=
=
i
vfcp levelileveli (4.18)
Goals
The two goals of the cantilever beam design problem are to minimize the mass of the
beam, and to maximize the robustness of beam with respect to variation in material
properties. The metric used for determining design robustness is HD-EMI. In practical
terms, the HD-EMI metric is a measure of the distance from design space bounds divided
by system performance variation. Since there is only one performance goal in the
cantilever beam design problem (minimize mass), the HD-EMI calculation only
considers variation of mass in robustness calculations. In Equation 4.19 – Equation 4.21
HD-EMI calculation as it relates to design variables and performance goals at each

124
design level is given. Notice that by increasing distance from feasible design space and
decreasing variation in system performance, one is able to maximize HD-EMI.
( )( )
{ }avfx
mass
xx boundary
levelmass
,
max
minEMIHD 1,
=∀∆−
=− (4.19)
( )( )
{ }avfvfx
mass
xx boundary
levelmass
,101
max
minEMIHD 2,
−=∀∆−
=− (4.20)
( )( )
{ }acpcpcpcpx
mass
xx boundary
levelmass
,21,...,5,3,1
max
minEMIHD 3,
=∀∆−
=− (4.21)
Minimize
A deviation function in minimized in order to determine a design solution that best meets
design goals. In this thesis, due to its ease of use, the Archimedian formulation of the
deviation function is chosen. It consists of a weighted sum of the deviation variables, and
the weights are chosen to reflect designer preferences such that they are all greater than
or equal to zero and sum to unity.
Weighted Sum of Deviation Variables
The deviation function for the BRP design is shown in Equation 4.22. The goal is to
minimize the value of Z in order to find the design point with the smallest deviation from
design goals. In cantilever beam design, each goal is weighted equally at Wi = 0.5 (i = 1,
2).

125
−− ⋅+⋅= 2211 dWdWZ (4.22)
4.2.3 Cantilever Beam Inductive Design Solution
The inductive multilevel robust cantilever beam design solution is presented in Section
4.3.3. Following a general-to-specific (inductive) approach, the design solutions are
presented in a top-down manner for Level 1, Level 2, and Level 3.
Level 1
When obtaining an inductive multilevel design solution, the designer begins at Level 1,
the least amount of design complexity. The cantilever beam design solution and
performance data at design Level 1 are presented in Table 4.10 – Table 4.12.
Table 4.10 – Cantilever beam design variable data: Level 1
Design Variable Value Units
a 11.3 cm
vf 0.5 none
Table 4.11 – Cantilever beam performance data: Level 1
Performance Value Units
max deflection 0.1 cm
mass 134.8 kg variation of mass 13.1 kg
safety factor 1 none
Table 4.12 – Cantilever beam material property data: Level 1
Material Property Value Units
density 5275 kg/m3
elastic modulus 137 GPa yield strength 215 MPa

126
Level 2
Once the robust design solution is obtained for Level 1, an additional design constraint
characterizing cantilever beam design at Level 1 is imposed for cantilever beam design at
Level 2. The cantilever beam design solution and performance data at design Level 2 are
presented in Table 4.13 – Table 4.15.
Table 4.13 – Cantilever beam design variable data: Level 2
Design Variable Value Units a 2.9 cm
vf1 0.12 none vf2 0.36 none vf3 0.48 none vf4 0.48 none vf5 0.54 none vf6 0.54 none vf7 0.54 none vf8 0.66 none vf9 0.66 none vf10 0.94 none
Table 4.14 – Cantilever beam performance data: Level 2
Performance Value Units max deflection 1.0 cm
mass 8.3 kg variation of mass 0.8 kg min safety factor 11.86 none
Table 4.15 – Cantilever beam material property data: Level 2
Material Property
Segment Location (meters)
Density (kg/m3)
Elastic Modulus (GPa)
Yield Strength (MPa)
1 0 to 0.2 7225 188 298 2 0.2 to 0.4 5977 156 245 3 0.4 to 0.6 5381 140 220 4 0.6 to 0.8 5361 139 219 5 0.8 to 1.0 5086 132 207 6 1.0 to 1.2 5086 132 207 7 1.2 to 1.4 5086 132 207 8 1.4 to 1.6 4440 115 179

127
Table 4.15 (continued) – Cantilever beam material property data: Level 2
9 1.6 to 1.8 4439 115 179 10 1.8 to 2.0 2989 77 117
Material Solution for Discretized Cantilever Beam
0
0.1
0.2
0.3
0.4
0.5
0.6
0.7
0.8
0.9
1
1 2 3 4 5 6 7 8 9 10
Segment
Vol
ume
Fra
ctio
n
Percent Steel
Percent Aluminum
Figure 4.14 – Volume fraction graph for Level 2 beam design
Level 3
Once the robust design solution is obtained for Level 2, an additional design constraint
characterizing cantilever beam design at Level 2 is imposed for cantilever beam design at
Level 3. The cantilever beam design solution and performance data at design Level 3 are
presented in Table 4.16 – Table 4.18. Based on the complexity requirements of the
cantilever beam design problem, design solutions at Level 3 are considered the final
multilevel design solution.
Table 4.16 – Cantilever beam design variable data: Level 3
Design Variable Value Units a 2.6 cm
cp1 0.07 none cp3 0.24 none

128
Table 4.16 (continued) – Cantilever beam design variable data: Level 3
cp5 0.36 none cp7 0.49 none cp9 0.50 none cp11 0.55 none cp13 0.57 none cp15 0.60 none cp17 0.60 none cp19 0.94 none cp21 0.94 none
Table 4.17 – Cantilever beam performance data: Level 3
Performance Value Units max deflection 1.0 cm
mass 6.9 kg variation of mass 0.7 kg min safety factor 9.50 none
Table 4.18 – Cantilever beam material property data: Level 3
Material Property
Segment Location (meters)
Density (kg/m3)
Elastic Modulus (GPa)
Yield Strength (MPa)
1 0 to 0.1 7473 195 309 2 0.1 to 0.2 7225 188 298 3 0.2 to 0.3 6638 173 273 4 0.3 to 0.4 5977 156 245 5 0.4 to 0.5 6005 156 246 6 0.5 to 0.6 5381 140 220 7 0.6 to 0.7 5303 138 216 8 0.7 to 0.8 5361 139 219 9 0.8 to 0.9 5295 138 216 10 0.9 to 1.0 5086 132 207 11 1.0 to 1.1 5014 130 204 12 1.1 to 1.2 5086 132 207 13 1.2 to 1.3 4936 128 201 14 1.3 to 1.4 5086 132 207 15 1.4 to 1.5 4779 124 194 16 1.5 to 1.6 4440 115 179 17 1.6 to 1.7 4779 124 194 18 1.7 to 1.8 4439 115 179 19 1.8 to 1.9 3029 78 119 20 1.9 to 2.0 2989 77 117

129
Material Solution for Functionally Graded Cantilever Beam
00.1
0.20.3
0.40.5
0.60.7
0.80.9
1
1 2 3 4 5 6 7 8 9 10 11 12 13 14 15 16 17 18 19 20 21
Segment
Vol
um
e F
ract
ion
Percent Steel
Percent Aluminum
Figure 4.15 – Volume fraction graph for Level 3 beam design
4.3 VERIFICATION AND VALIDATION BASED ON CANTILEVER BEAM
DESIGN
The following section contains evidence for the verification and validation of the
template-based approach to multilevel robust design presented in Chapter 3 by
considering the design of a cantilever beam and its associated material. First, the validity
of the design solution is examined. Then, the results obtained from completing the BRP
example problem are discussed in terms of validating the proposed template-based
approach to multilevel systems design.
4.3.1 Verification and Validation of Computational Design Tools in Cantilever
Beam Design
In the following section, the validity of the computational design tools used in the
cantilever beam example problem is examined. In order to reach design solutions in the
cantilever beam example problem, performance models and finite element analysis are
employed. Fundamental beam deflection equations (Euler’s beam equations) are used to

130
determine the deflection of a beam with homogeneous material properties under constant
loading (Level 1, ). When the material properties of the beam are not constant,
Euler’s beam equations can no longer be used to predict beam deflection. Therefore, for
cantilever beam design at Level 2 ( ) the discretized beam is modeled in the FEA
software COMSOL where beam deflection and stress are measured. The functionally
graded cantilever beam (Level 3, ) is also modeled in COMSOL. Continuous
functions describing the material properties of the beam are defined by a set of control
points connected by cubic splines. Similar to analysis at Level 2, beam deflection and
stress are determined using COMSOL for the functionally graded beam at Level 3. For
cantilever beam design at all levels, the design problem is formulated as a compromise
Decision Support Problem with design variables, constraints, goals, and preferences. The
cDSP at each level is solved in MATLAB using the solution-finding algorithm,
fmincon() (MATLAB 2004).
4.3.2 Verification and Validation of Multilevel Design Template Based on
Cantilever Beam Design
One of the main goals in completing the cantilever beam example problem is to provide
evidence in the verification and validation of the developed template for multilevel robust
design. Recall the Validation Square discussed in detail in Chapter 2. To summarize, the
Validation Square, composed of four sections, is a construct used in the systematic
verification and validation of design methods. Recall that the sections of the Validation
Square dealing with the application of the proposed design method to example problems
include domain-specific structural validity and domain-specific performance validity. In
the following sections, ways in which completing the cantilever beam example problem
adds value to the domain-specific structural validity and domain-specific performance
validity of the developed multilevel design template are presented.

131
Domain-Specific Structural Validity
Domain-specific structural validity relates to the appropriateness of the selected example
problem and the designer is prompted to ask the question, “Is the example problem used
in demonstrating the method an appropriate choice?” It is asserted that the cantilever
beam example problem is an appropriate choice for testing the effectiveness of the
developed multilevel design template for because the design problem possesses the
following characteristics:
- Clearly defined design problem – The cantilever beam design problem contains a
clearly defined problem statement with specified design variables, bounds,
constraints, goals, and preferences (formulated in a cDSP). Each of these
descriptions is needed for the successful implementation of the multilevel design
template. Additionally, material property mappings and uncertainty mappings are
known or easily determined for the cantilever beam design problem. The
multilevel robust design temple is developed for a design environment in which
design requirements, bounds, constraints, goals, and preferences are clearly
known.
- Multilevel design problem – The cantilever beam problem is inherently multilevel
in nature because it is used to examine the design of a product and material. The
various levels of model complexity are used to describe the design of the material
in more specific detail. The various levels in the cantilever beam design problem
are used to capture more complex details of the performance of the product based
on material properties. Only three levels are considered in this design problem
due to computational and time constraints. However, to increase the value in the
materials design portion of this example problem, model of increased complexity
(such as models that capture the micro- and nano- nature of the material) should
be considered. Due to the multilevel nature of the cantilever beam example

132
problem it is an appropriate choice for applying the developed multilevel design
template presented in Chapter 3.
Domain-Specific Performance Validity
Domain-specific structural validity relates to the outcome of applying the method to an
example problem and is used to ask the question, “Does the application of the method to
the example problem produce useful results?” To adequately address this question two
topics are considered: the usefulness of the numerical design solution and the overall
usefulness of the multilevel design template.
One way to analyze the effectiveness of the numerical results obtained from the
cantilever beam design problem is to compare numerical solutions with expected solution
trends. It is expected that the strongest (and heaviest) material would appear at the base
of the beam where stress is the greatest. It is also assumed that moving from the base to
the free end of the beam the strength (and density) of beam material decreases. This
trend is observed in the cantilever beam design solutions at all levels. The agreement
with numerical results and expected trends builds confidence in the validity of the
cantilever beam design solution.
The internal consistency of the numerical design solution is also tested with a starting
point analysis. The cantilever beam example problem is solved using an optimization
routine at each design level. Therefore, it is important to determine if the selected
starting point at each level results in a robust, stable solution that most closely meets
design goals. For cantilever beam design at Level 1, ten different starting points
spanning the range of all possible design variable values result in identical design
solutions and beam performance. Therefore, it is concluded that the cantilever beam
design solution at Level 1 is robust to changes in starting point, and the best solution at

133
Level 1 is identified. Cantilever beam design at Level 2 and Level 3 requires the use of
computationally expensive finite element software. Also, the number of design variables
at Level 2 and Level 3 increase the probability that implementing the optimization
routine will result in a local (and not global) minimum. Due to high computation cost for
each design run at Level 2 and Level 3, a slightly different approach is taken in order to
ensure a reasonable solution is reached. The starting point at Level 2 and Level 3 is set to
reflect the expected solution trend with the strongest (and heaviest) material at the base of
the beam, and material strength (and density) decreasing along the length of the beam.
By beginning the optimization routine in this way, it is found that more reasonable,
logical solutions are obtained that reflect the expected trends of cantilever beam design.
Additionally, confidence is built in the domain-specific performance validity of the
multilevel design template based on its overall usefulness in the cantilever beam design
problem. First, by applying the multilevel design template, the cantilever beam design
problem is divided into levels of varying model complexity. That is, by using the
multilevel design template, the computationally rigorous task of designing a product and
material is partitioned into more manageable design problems at increasing levels of
model complexity. Applying the design template also provides a guided direction for the
designer to proceed through the design process. Additionally, information collected
during the design process is stored in the design template and organized for future design
space exploration in cantilever beam design. The modular nature of the design template
allows for expanding aspects within the cantilever beam design problem, and / or
combining the cantilever beam design problem with other design processes. In addition
to providing the overall construct to facilitate multilevel robust design, by implementing
the design template, a designer is required to develop and utilize mapping functions used
to travel (deductively and inductively) through levels of design complexity. The
developed mapping functions are useful tools facilitating low-cost design space

134
exploration at various levels of model complexity. Finally, applying the multilevel
design template guides the designer to the determination of a multilevel robust design
solution. The achieved solution meets design constraints, and as design complexity
increases, design goals are more closely met. The inductive design solution also agrees
with what is intuitively expected—the beam material is strongest at the base and
decreases in strength (and density) as one moves from the base to the free end.
To summarize, the template-based approach to multilevel robust cantilever beam design
is a valuable design strategy because the complexity of the design problem is decreased
leading to agile design space exploration, design information is store in a organized and
modular fashion for future design exploration, and at low computation cost, mapping
functions are used to travel throughout the multilevel design problem in both a top-down
and bottom-up path. A visual representation of the value added to the verification and
validation of the developed design template provided in Chapter 4 is shown in Figure
4.16.
Domain-Independent Structural Validity
Internal consistency of design method
Is the design method internally consistent?
Domain-IndependentPerformance Validity
Ability to produce useful results beyond the chosen example problems.
Does the application of the method to other problems produce practical results?
1
2 3
4
CHAPTERS 4 and 5 CHAPTERS 4 and 5
CHAPTERS 2 & 3 CHAPTERS 3 and 6
Domain-Specific Structural Validity
Domain-Specific Performance Validity
CHAPTERS 4 and 5 CHAPTERS 4 and 5
Cantilever beam and BRP example problems are clearly defined and multilevel in nature
Applying the multilevel design template to example problems produce useful results
Variables
Bounds
Constraints
Goals
Preferences
Performance Model
Response
Single Scale Design Template
Figure 4.16 – Value added to verification and validation of design template – Chapter 4
135
4.4 SYNOPSIS OF CHAPTER 4
The completion of the cantilever beam design problem adds value to the validation of the
multilevel design template. The multilevel design template is used to guide the designer
through a multilevel inductive design process, and useful design solutions are obtained.
Recall from Chapter 1 and Chapter 2 that the context for this thesis is set with a
discussion of multilevel design, design uncertainty, robust design, and template-based
design. Then, in Chapter 3, the multilevel design template is presented. In Chapter 4 and
Chapter 5, the template is applied to example problems in order to determine its domain-
specific structural and performance validity. Chapter 6, concludes this thesis with a
summary of the validation of the multilevel design template based on the Validation
Square. The overall value of a template-based approach to multilevel design as well as
the intellectual contributions of this thesis is presented in Chapter 6.

136
CHAPTER 5
COMPREHENSIVE EXAMPLE – DESIGN OF A BLAST
RESISTANT PANEL
In order to demonstrate the use of the multilevel design template presented in Chapter 3,
a comprehensive example problem is completed. In Chapter 5, the design of a blast
resistant panel is investigated. Blast resistant panels (BRPs) are sandwich structures
designed to experience less deflection under blast loading compared to solid panels of
equal mass. The blast resistant panels designed in this thesis are layered panels
consisting of a front face sheet, core, and back face sheet. The front and back face sheets
are solid panels, whereas the core is a honeycomb cellular structure, which dissipates
large amounts of impulse energy due to core crushing. Based on proposed BRP military
armor applications, the design goals are to minimize BRP deflection, minimize BRP mass
/ area, and maximize BRP robustness with respect to uncertainty in material properties
and loading conditions.
In this thesis, BRP design is divided into levels according to model complexity.
Specifically, the BRP example problem is divided into 3 levels of model complexity:
BRP modeled as two solid panels surrounding a honeycomb core [Level 3, greatest
complexity], BRP modeled as three solid panels [Level 2, moderate complexity], and
BRP modeled as a single solid panel [Level 1, least complexity]. Similarly to Chapter 4,
BRP multilevel design is explored using models of increasing complexity (Level 1 to
Level 3). After multilevel BRP performance models are developed, mapping functions
describing material property and uncertainty relationships among the various levels are
discussed. Then, an inductive BRP design solution is presented and discussed. Chapter 5
concludes with a discussion of the advantages of a template-based approach to multilevel

137
design, and how completing the multilevel robust design of BRPs adds value to the
verification and validation of the template-based approach to the robust design of
multilevel systems. The complex nature of the BRP example problem builds confidence
in the likelihood that the multilevel design template can be successfully applied to a
variety of complex engineering design problems. A summary of the information in
Chapter 5 is given in Table 5.1 and Figure 5.1 illustrates how Chapter 5 is connected to
other ideas in this thesis.
Table 5.1 – Summary of Chapter 5
Heading / Sub-Heading Information Problem Overview Introduction to Example
Problem BRP example problem is introduced including:
- Design requirements (included in Appendix B) - Design goals
Design Approach Nature of BRP problem is examined: - Multilevel nature of design problem - Use of design templates for achieving design solution
Value in Completing Example Problem
Address value based on: - Research questions presented in Chapter 1 - Verification and validation of a template-based
approach to multilevel robust design Design Process and Solution Particularization of Multilevel
Robust Design Template Multilevel design template is organized under the headings:
- Given – feasible alternative, assumptions, parameters, goals
- Define – design levels, feasible design space, performance metrics (additional information in Appendix C)
- Map – discrete points to solution ranges (deductive), solution ranges to robust solution (inductive)
- Find – design variables, deviation variables - Satisfy – constraints, bounds, goals - Minimize – weighted sum of deviation variables
Multilevel template is particularized for BRP design problem Design Process Multilevel nature of BRP design problem:
- Level 1 – single solid panel with uniform material properties
- Level 2 – three solid panels with independent material properties and layer heights
- Level 3 – two solid layers surrounding honeycomb core each with independent material properties and layer thicknesses
BRP Multilevel Inductive Design Solution
Method for inductive multilevel design is presented and design solutions are obtained and discussed

138
Table 5.1 (continued) – Summary of Chapter 5
Verification and Validation Verification and Validation of
Computational Design Tools Verification and validation of the computational tools used in obtaining BRP multilevel robust design solution including:
- BRP computational models (MATLAB) - BRP FEA analysis (ABAQUS) - BRP impulse loading analysis
Verification and Validation of Multilevel Robust Design Template
Value added to the verification and validation of a template-based approach to multilevel robust design based on BRP design
1 – Motivation 2 – Literature Review
3 – Theoretical Foundations
4 – Cantilever Beam
6 – Method Validation
5 – Blast Resistant Panel
1
2 3
4
Multilevel BRP design:• Design problem (requirements list)• Multilevel design template
particularized for BRP design• Multilevel inductive design
approach and solution• Value added to method validation
Robust Design
Multilevel Design
Design Uncertainty
Design Templates
MO
TIV
AT
ION
ME
TH
OD
AN
ALY
SIS
CLO
SU
RE
Figure 5.1 – Setting the context for Chapter 5
5.1 OVERVIEW OF COMPREHENSIVE EXAMPLE – DESIGN OF A BLAST
RESISTANT PANEL
In Section 5.1 an overview of the BRP design problem is presented. Completing the BRP
design problem is a collaborative effort among students in the Systems Realization Lab at
Georgia Tech. The intellectual contributions from Matthias Messer, Jin Song, and

139
Stephanie Thompson in completing this design problem are gratefully acknowledged. A
conference paper presented by Thompson and coauthors at the AIAA/ISSMO
Multidisciplinary Analysis and Optimization Conference in 2006 details a preliminary
BRP design approach and solution (Thompson, et al. 2006).
5.1.1 Introduction to Blast Resistant Panel Example Problem
The BRP example problem examined in Chapter 5 is used to demonstrate the robust
design of multilevel systems using a template-based approach. BRPs are sandwich
structures consisting of a front face sheet, core, and back face sheet. Under impulse
loading, a BRP experiences less deflection than a similarly loaded solid plate of equal
mass. The front face sheet and back face sheet of a BRP are solid plates, whereas, the
core contains honeycomb cellular structures arranged perpendicular to the front and back
face sheets. As a BRP is loaded perpendicular to the front face sheet, the core of the BRP
collapses, absorbing large amounts of energy. Examples of BRPs with varying core
topologies are shown in Figure 5.2 (Fleck and Deshpande 2004). In this thesis, BRP core
topology analysis is limited to square honeycomb cores.
Figure 5.2 – Sample blast resistant panels (Fleck and Deshpande 2004)

140
For BRP design analysis in this thesis, consider a BRP consisting of two solid panels
surrounding a square honeycomb core. The BRP is loaded with a spatially-uniform,
time-dependent pressure [p(t)] along the front face sheet as seen in Figure 5.3.
hf
hb
hc
B
H
p(t)
hf
hb
hc
B
H
p(t)
Front face sheet
Back face sheet
Core
Figure 5.3 – BRP under uniform pressure loading
Noise factors and uncertain design parameters include uncertainty in loading conditions
and BRP material properties. System design goals include minimizing back face sheet
deflection, minimizing BRP mass / area, and maximizing BRP robustness with respect to
uncertainty in material properties and loading conditions. The maximum allowable back
face sheet deflection (δmax) is 10% of panel length (panel length, L = 1 m), and maximum
allowable mass / area (M) is 150 kg/m2. Key BRP dimensions are given in Figure 5.3 (hf
[height of front face sheet], hb [height of back face sheet], H [height of core], hc [core cell
wall thickness], B [core cell spacing]).
BRP performance analysis models are developed based on the work of Fleck and
Deshpande, 2004 and Hutchinson and Xue, 2005. The deformation of sandwich plates

141
under impulse loading may be divided into three time periods (Fleck and Deshpande,
2004). The three phases of panel deformation include:
- Phase 1 – blast wave encounters front face sheet
- Phase 2 – core crushing
- Phase 3 – bending and stretching of the back face sheet.
Hutchinson and Xue, 2005 adapted the three period deformation theory and applied it to
the optimization of blast resistant panels. The deflection of BRPs is predicted based on
calculations developed by Hutchinson and Xue. In this thesis, BRP performance models
developed by Hutchinson and Xue are implemented in a template-based multilevel robust
design approach.
Before a multilevel BRP design solution is obtained, a method for analyzing BRP
performance at a single level is selected. A compromise Decision Support Problem
(cDSP) is formulated at each design level in order to determine a robust design solution
at a single level of model complexity. The cDSP is discussed in detail in Section 2.4.3.
The cDSP developed at each level of design complexity is analogous to the single level
design template show in Figure 3.8. A more mathematically rigorous cDSP is presented
for each level of model complexity in Section 5.3.2. A cDSP for the overall BRP design
problem, intended to illustrate overall design requirements and goals, is given in Table
5.2 and discussed in more detail in the following paragraphs.
Table 5.2 – cDSP for multilevel BRP design
Word Formulation Mathematical Formulation Given Given BRP with two solid layers surrounding a
honeycomb core with a square topology BRP length: L = 1 m
Uniform pressure impulse Impulse load model: 0/
0ttepp −
=
∫ == 000 d tptpI
40 025MPa, 10 secp t −
= =
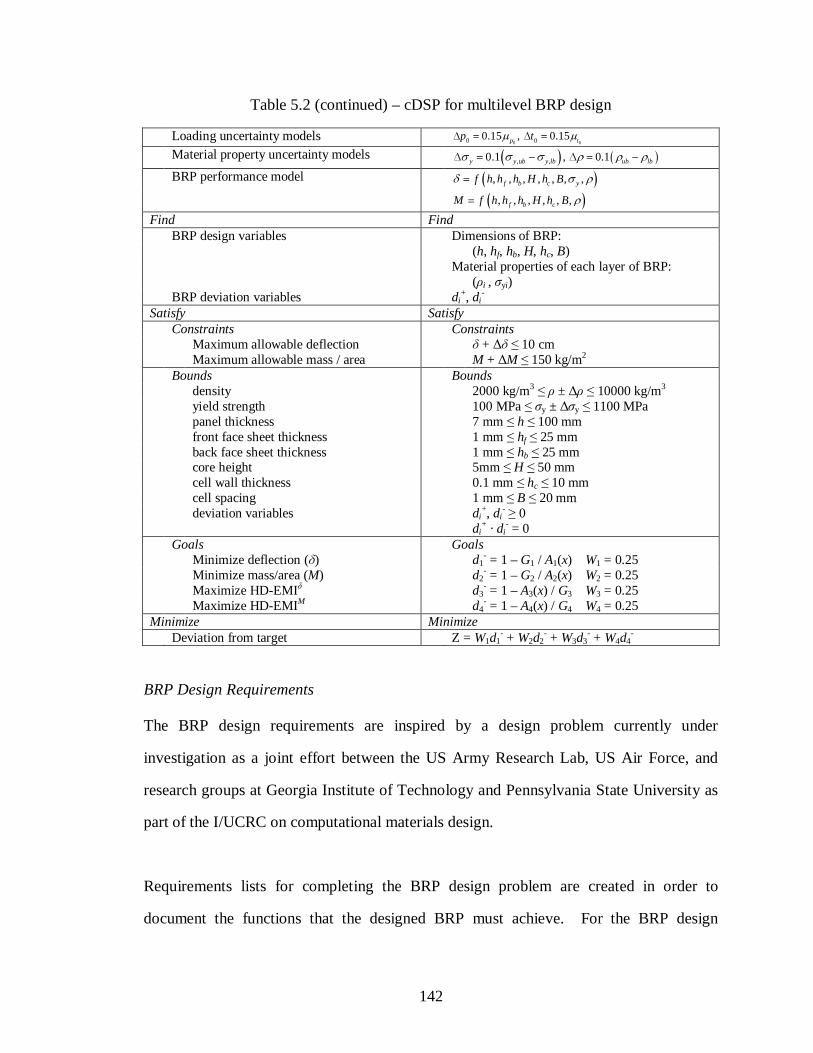
142
Table 5.2 (continued) – cDSP for multilevel BRP design
Loading uncertainty models 0 00 00.15 , 0.15p tp tµ µ∆ = ∆ =
Material property uncertainty models ( ) ( ), ,0.1 , 0.1y y ub y lb ub lbσ σ σ ρ ρ ρ∆ = − ∆ = −
BRP performance model ( ), , , , , , ,f b c yf h h h H h Bδ σ ρ=
( ), , , , , ,f b cM f h h h H h B ρ=
Find Find BRP design variables Dimensions of BRP: (h, hf, hb, H, hc, B) Material properties of each layer of BRP: (ρi , σyi) BRP deviation variables di
+, di-
Satisfy Satisfy Constraints Constraints Maximum allowable deflection δ + ∆δ ≤ 10 cm Maximum allowable mass / area M + ∆M ≤ 150 kg/m2 Bounds Bounds density 2000 kg/m3 ≤ ρ ± ∆ρ ≤ 10000 kg/m3 yield strength 100 MPa ≤ σy ± ∆σy ≤ 1100 MPa panel thickness 7 mm ≤ h ≤ 100 mm front face sheet thickness 1 mm ≤ hf ≤ 25 mm
back face sheet thickness 1 mm ≤ hb ≤ 25 mm core height 5mm ≤ H ≤ 50 mm cell wall thickness 0.1 mm ≤ hc ≤ 10 mm cell spacing 1 mm ≤ B ≤ 20 mm deviation variables di
+, di- ≥ 0
di+ · di
- = 0 Goals Goals Minimize deflection (δ) d1
- = 1 – G1 / A1(x) W1 = 0.25 Minimize mass/area (M) d2
- = 1 – G2 / A2(x) W2 = 0.25 Maximize HD-EMIδ d3
- = 1 – A3(x) / G3 W3 = 0.25 Maximize HD-EMIM d4
- = 1 – A4(x) / G4 W4 = 0.25 Minimize Minimize Deviation from target Z = W1d1
- + W2d2- + W3d3
- + W4d4-
BRP Design Requirements
The BRP design requirements are inspired by a design problem currently under
investigation as a joint effort between the US Army Research Lab, US Air Force, and
research groups at Georgia Institute of Technology and Pennsylvania State University as
part of the I/UCRC on computational materials design.
Requirements lists for completing the BRP design problem are created in order to
document the functions that the designed BRP must achieve. For the BRP design

143
problem, three requirements lists are created which reflect the areas in which the
completed BRP design problem will add value. The requirements lists for the BRP
design problem are divided into the following categories: advancement of multilevel
robust design methodology, verification and validation of robust multilevel design
template, and satisfying customer requirements.
- Advancement of multilevel robust design methodology – One of the goals in
studying multilevel BRP design is to advance multilevel robust design
methodology. By completing various example problems, researchers expect to
extend current understanding of the special requirements involved in multilevel
design in order to develop a detailed method for the design of multilevel systems.
- Verification and validation of a design strategy – In Chapter 3 theoretical
foundations for a template-based approach to robust multilevel design are
presented. One step in verifying the multilevel template-based design approach is
to complete example problems using the developed design template. Completing
example problems adds value to the domain-specific structural validity and
domain-specific performance validity of method validation.
- Satisfy customer requirements – The BRP problem is a collaborative design
project between academic, industrial, and government research organizations.
Acting as the “customer”, government and industrial research labs are responsible
for supplying BRP performance requirements as part of a I/UCRC on
computational materials design.
Requirements lists for BRP design are listed in Appendix B, Table B.1 – Table B.3. The
three requirements lists correspond to the three areas of motivation for completing the
BRP example problem.
144
BRP Design Goals
For the BRP design problem, the design goals include minimizing deflection of the back
face sheet, minimizing mass / area of panel, and maximizing the robustness of the system
with respect to uncertainty in loading conditions (noise factors) and material properties
(uncertain control factors). Recall from Chapters 2 and 3 that HD-EMI is a metric for
measuring the robustness of a system that contains uncertainty in noise factors, control
factors, and propagated process chain uncertainty. By maximizing HD-EMI, a BRP
design that is robust to variations in loading conditions and material composition and
robust to uncertainty in the multilevel design process chain is achieved. Since there are
two BRP performance goals (minimize deflection, minimize mass/area) the HD-EMI
metric is maximized with respect to each design variable for each performance design
goal. More details in how the HD-EMI metric is applied to the design problem at each
level is given in Section 5.3.
5.1.2 Multilevel Design Approach for Blast Resistant Panel Design
In the following section, an overview of the multilevel approach used in solving the BRP
design problem is presented. First, the multilevel nature of the design problem is
presented. Then, a summary of the application of the multilevel design template
(developed in Chapter 3) in the BRP problem is given.
BRP Design as a Multilevel Design Problem
In order to design a BRP with independent dimensions and material properties among the
three layers, 11 design variables (ρf, ρb, ρc, σy,f, σy,b, σy,c, hf, hb, H, hc, B) must be
considered. Design space exploration with such a large number of design variables is
difficult and costly due to the large number of design variable combinations. Therefore,
it is determined that the BRP design problem can be divided into levels of models of
decreased complexity, thereby reducing the number of design variables and facilitating

145
agile design space exploration. To achieve this goal, the BRP design problem is divided
into three levels of model complexity. The three levels, shown in Figure 5.4, are selected
based on value added to the BRP design process and natural divisions in the problem
statement.
Incr
ea
sed
Mod
el C
ompl
exi
ty
Multilevel model 1
Multilevel model 2
Multilevel model 3
Figure 5.4 – BRP design problem divided according to levels of model complexity
First, a BRP modeled as a single solid panel is analyzed. At BRP Level 1, 3 design
variables are considered (ρ [density], σy [yield strength], h [panel height]). Increasing in
model complexity, the next level analyzed is a BRP with three solid layers (front face
sheet [solid], core [solid], back face sheet [solid]). Each layer has independent material
properties and thicknesses. Level 2 design analysis consists of 9 design variables (ρf, ρb,
ρc, σy,f, σy,b, σy,c, hf [front face sheet thickness], hb [back face sheet thickness], H [core
thickness]). Last, a BRP consisting of three layers with a honeycomb core is considered
(front face sheet [solid], core [honeycomb], back face sheet [solid]). With 11 design
variables, this is the most complex level considered in the BRP design problem (ρf, ρb, ρc,

146
σy,f, σy,b, σy,c, hf, hb, H, hc [cell wall thickness in core], B [cell spacing in core]). In Section
5.3, the performance of a BRP is analyzed using models of varying complexity.
Application of Multilevel Robust Design Template to BRP Design
In Chapter 3 a multilevel design template is presented. This design template is applied to
the cantilever beam design problem in Chapter 4 and the BRP design problem in Chapter
5. The multilevel design template presented in Chapter 3 is particularized and applied to
the BRP example problem in order to facilitate the systematic design of a BRP (see
Figure 5.7). In Figure 5.5, the potential for augmenting the generic multilevel design
template BRP design is shown.
Variables
Bounds
Constraints
Goals
Preferences
Response
Generic Single-Level Design Template
Design parameters specific to BRP design problem
Performance model developed for BRP performance measurement and analysis
Response specific to BRP design
Mapping functions used to link various design levels particularized for BRP design problem
MA
PP
ING
F
UN
CT
ION
Performance Model
Figure 5.5 – Multilevel design approach for cantilever BRP example
For the three levels of model complexity considered in the BRP example, the generic
single-level design template is particularized for the design parameters, performance
model, and response at each level. Then, the single-level design templates are joined
using material and uncertainty mapping functions to create the framework for inductive
multilevel BRP design.
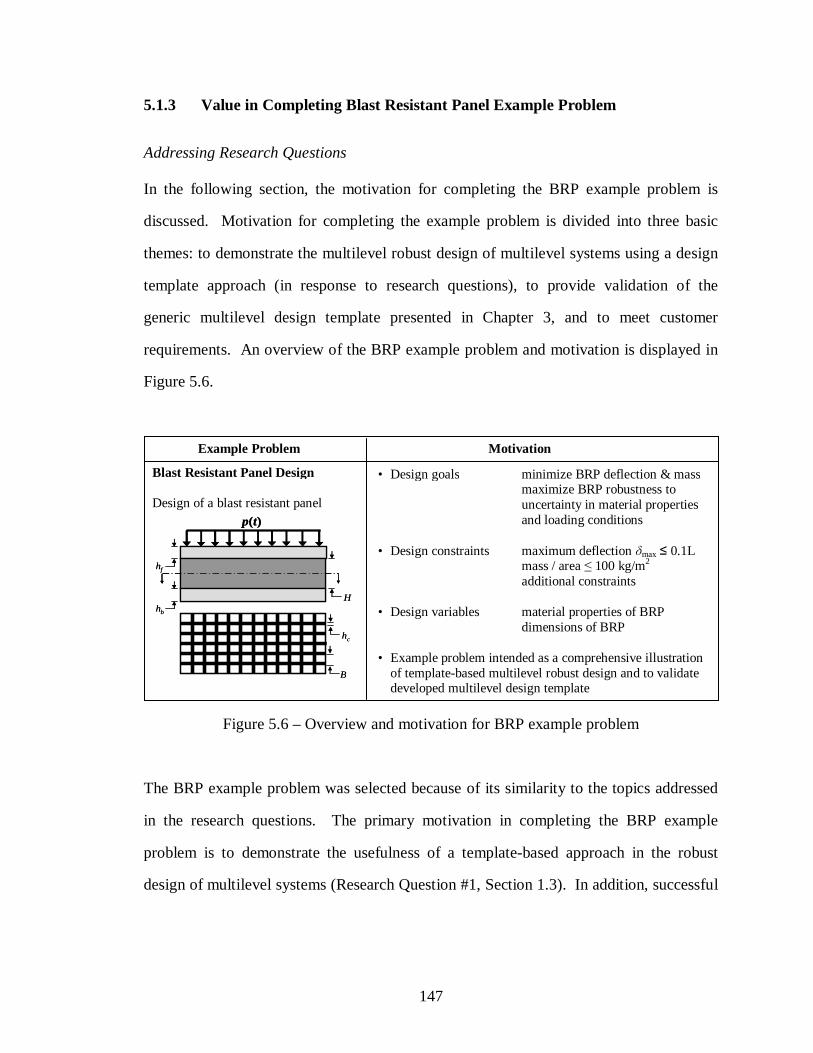
147
5.1.3 Value in Completing Blast Resistant Panel Example Problem
Addressing Research Questions
In the following section, the motivation for completing the BRP example problem is
discussed. Motivation for completing the example problem is divided into three basic
themes: to demonstrate the multilevel robust design of multilevel systems using a design
template approach (in response to research questions), to provide validation of the
generic multilevel design template presented in Chapter 3, and to meet customer
requirements. An overview of the BRP example problem and motivation is displayed in
Figure 5.6.
Figure 5.6 – Overview and motivation for BRP example problem
The BRP example problem was selected because of its similarity to the topics addressed
in the research questions. The primary motivation in completing the BRP example
problem is to demonstrate the usefulness of a template-based approach in the robust
design of multilevel systems (Research Question #1, Section 1.3). In addition, successful
hf
hb
hc
B
H
p(t)
hf
hb
hc
B
H
p(t)
Example Problem Motivat ion
Blast Resistant Panel Design Design of a blast resistant panel
• Design goals minimize BRP deflection & mass maximize BRP robustness to uncertainty in material properties and loading conditions
• Design constraints maximum deflection δmax ≤ 0.1L mass / area ≤ 100 kg/m2
additional constraints • Design variables material properties of BRP
dimensions of BRP
• Example problem intended as a comprehensive illustration of template-based multilevel robust design and to validate developed multilevel design template

148
completion of a template-based approach to multilevel BRP design addresses themes in
Research Question #2, Section 1.3.
Verification and Validation of Multilevel Robust Design Template
Additionally, the BRP design problem is chosen for investigation in this thesis because it
can be used to demonstrate a template-based approach to multilevel robust design of
systems, and it contains design complexities found in many design problems in academia
and industry. In terms of validating the multilevel design template, the BRP example
problem is useful in demonstrating the domain-specific structural validity
(appropriateness of example problems) and the domain-specific performance validity
(ability to produce useful results for the chosen example problems) of the developed
template. The BRP example problem is also intended to illustrate the key advantages of
the multilevel design template. Recall that one of the key advantages of the multilevel
design template is a procedure for limiting complex design space exploration to include
only areas likely to contain satisficing design solutions. The BRP example problem adds
value beyond the cantilever beam example problem (Chapter 4) because of it is more
complex in nature. However, with 13 design variables, the BRP example problem can be
solved directly without the use of the multilevel design template. BRP design is included
in this thesis to illustrate the benefits of the multilevel design template when applied to
more complex design problems.
5.2 BLAST RESISTANT PANEL DESIGN PROCESS AND SOLUTION
In the following section, the design of a BRP is presented. First, the BRP design process,
as it relates to the multilevel design template, is discussed. Then, the details of the
problem formulation, design process, and solutions are examined. The successful
implementation of the multilevel design template in the design of a BRP builds
confidence in the validation of the multilevel design template.

149
5.2.1 Multilevel Design Template Particularized for Blast Resistant Panel Design
In the following section, a generic template for multilevel robust design is particularized
for the design of a BRP. Recall from Chapter 3 the generic design template for
multilevel robust design represented in word form, organized under the headings Given,
Define, Map, Find, Satisfy, Minimize.
The domain-general multilevel design template, shown in Figure 3.10, begins with the
collection and modeling of design parameters including: design variables, design variable
bounds, design constraints, design goals, and design preferences. Design parameters are
specified at each level of model complexity. The design parameters are given in the
problem statement or determined by an experienced engineer. Following the
specification of design parameters, multilevel models of the multilevel design problem
are developed at each level of model complexity. Multilevel models are used to predict
the response or performance of the design at each level of model complexity.
The generic multilevel design template is particularized for the BRP example problem
and is shown in Figure 3.15. At the beginning of the design process, the design
parameters (including design variables, bounds on design variables, design constraints,
design goals, and design preferences) are given in the problem statement or determined
by the designer. After the design parameters are defined, multilevel models of the BRP
are developed at each level of model complexity. For the BRP example problem,
selection of the multilevel models is based on the levels of complexity in the design
problem. The multilevel models defined for the BRP example problem include a BRP
consisting of a single solid panel, a BRP consisting of three solid panels, and a BRP with
three panels with a honeycomb core. The BRP example problem could be described
using more levels of complexity. However, for this example problem, three levels of
design complexity are sufficient to capture the behavior of the design. Each multilevel
150
model is linked with mapping functions that map material properties and uncertainty
models at each level interface. The deflection and mass of the panel are measured at the
Design Performance or Response section of the design template.
5.2.2 Blast Resistant Panel Design Process
In the following section, the multilevel BRP design process is presented. Design
information is organized similar to the information flow of the multilevel design template
in word form (Figure 3.7) under the headings, Given, Define, Map, Find, Satisfy,
Minimize. The inductive multilevel BRP design solution is given in Section 5.3.3.
Given
The following information provides the underlying assumptions of the BRP design
problem.
A Feasible Alternative
BRP design in this thesis is based on a three-layer blast panel with two solid layers
surrounding a honeycomb core. It is assumed that the front face sheet receives the initial
pressure loading from the blast. The geometry of the core layer is designed to dissipate a
majority of the impulse energy in crushing. The back face sheet provides additional
protection from the blast as well as a means to confine the core collapse and absorb
energy in stretching. A square honeycomb structure is chosen for the cell shape of the
core material because the square shape resists stretching of the back face sheet more so
than triangular-, hexagonal- and chiral-shaped cores.
Assumptions
The loading conditions and constraints are the same for BRP performance analysis at
each level. The impulse load experimented by the BRP is modeled as a uniform pressure

151
wave with a peak pressure of p0 = 25 MPa and characteristic loading time t0 = 10-4 sec.
Equations for BRP loading conditions are shown below (Hutchinson and Xue 2005).
0/0
ttepp −
= (5.1)
∫ == 000 d tptpI (5.2)
The impulse load acts perpendicular to the surface of the BRP and is uniformly
distributed over the area of the plate. For deflection calculations, the plate is assumed to
be fully clamped at both ends, of width L/2, and of infinite extent in the y-direction
(Hutchinson and Xue 2005).
For the BRP design material properties are assumed to have an elastic, perfectly-plastic
stress-strain relationship, and the material is assumed to be defined by independent yield
strength and density variables. The bounds for material property design variables are
determined from the ranges of properties for engineering metals. The uncertainty in
material design variables is 5% of the range of each material property. The geometric
design variables are used to define the height of each layer as well as the cell spacing and
cell wall width of the square honeycomb core. Geometric design variables are assumed
to have no associated uncertainty. There are two noise factors pertaining to the air blast
received by the panel, peak pressure of the incoming pulse and the characteristic time of
the pulse. Variation in noise factors is modeled at 15% of the mean value
( MPap 25%150 ×=∆ , sec10%15 40
−×=∆t ).

152
Parameters
Parameters for BRP design include system variables, constraints, and goals. Design
variables are summarized in Table 5.3. BRP design goals include minimizing back face
sheet deflection, minimizing mass / area, and maximizing HD-EMI with respect to
previously stated performance goals. BRP performance constraints are maximum
deflection (δmax) of back face sheet must be less than or equal to 10 % of panel length and
maximum mass / area (M) must be less than or equal to 150 kg/m2. Additional BRP
design constraints are discussed later in this section.
Table 5.3 – BRP design variables
Certain Design Variables Lower Bound Upper Bound Units hf 0.001 0.025 m hb 0.001 0.025 m H 0.001 0.020 m hc 0.0001 0.010 m B 0.005 0.050 m
Uncertain Design Variables Lower Bound Upper Bound Units
ρf 2000 10000 kg/m3
ρb 2000 10000 kg/m3
ρc 2000 10000 kg/m5
σY,f 100 1100 MPa
σY,b 100 1100 MPa
σY,c 100 1100 MPa
Define
In the following section design levels, feasible design space, and performance metrics are
defined for the BRP multilevel design problem.

153
Design Levels
Design levels represent the amount of design simplicity or complexity that is considered
in reaching a design solution. The BRP design problem is divided into three levels of
model complexity. In the following section, a cDSP, performance modeling equations,
and modeling techniques are presented for each design level. Recall that when making
design decision at a single level, a cDSP is employed.
Level 1
In the following section, the performance of a BRP modeled as one solid layer analyzed
(see Figure 5.8). At Level 1 BRP design only 3 design variables are considered (σy, ρ, htotal).
Figure 5.7 – Multilevel model 1: One solid panel
A cDSP for Level 1 BRP design is presented in Table 5.4.
Table 5.4 – BRP Level 1 cDSP
Word Formulation Mathematical Formulation Given Given BRP with a single, solid layer BRP length: L = 1 m Uniform pressure impulse Impulse load model: 0/
0ttepp −
=
∫ == 000 d tptpI
40 025MPa, 10 secp t −
= =
Loading uncertainty models 0 00 00.15 , 0.15p tp tµ µ∆ = ∆ =
Material property uncertainty models ( ) ( ), ,0.05 , 0.05y y ub y lb ub lbσ σ σ ρ ρ ρ∆ = − ∆ = −
BRP performance model ( ) ( ), , , ,yf h M f hδ σ ρ ρ= =

154
Table 5.4 (continued) – BRP Level 1 cDSP
Find Find BRP design variables Dimensions of BRP: (h) Material properties of each layer of BRP: (ρ, σy) BRP deviation variables di
+, di-
Satisfy Satisfy Constraints Constraints Maximum allowable deflection δ + ∆δ ≤ 10 cm Maximum allowable mass / area M + ∆M ≤ 150 kg/m2 Bounds Bounds density 2000 kg/m3 ≤ ρ ± ∆ρ ≤ 10000 kg/m3 yield strength 100 MPa ≤ σy ± ∆σy ≤ 1100 MPa panel thickness 7 mm ≤ h ≤ 100 mm deviation variables di
+, di- ≥ 0
di+ · di
- = 0 Goals Goals Minimize deflection (δ) d1
- = 1 – G1 / A1(x) W1 = 0.25 Minimize mass/area (M) d2
- = 1 – G2 / A2(x) W2 = 0.25 Maximize HD-EMIδ d3
- = 1 – A3(x) / G3 W3 = 0.25 Maximize HD-EMIM d4
- = 1 – A4(x) / G4 W4 = 0.25 Minimize Minimize Deviation from target Z = W1d1
- + W2d2- + W3d3
- + W4d4-
Equations used in predicting BRP performance at Level 1 are given in the following
paragraphs. The three-stage deformation process developed by Fleck and Deshpande is
implemented in performance analysis of a BRP with one solid layer. The three-stage
deformation process is modified to reflect the performance of a single panel under
impulse loading. The following deflection equations are adapted from the work of
Hutchinson and Xue, 2005. Following the three stage deformation theory, the impulse of
the blast is received by the front face sheet and momentum is transferred in stage one
(Fleck and Deshpande 2004). The equation for kinetic energy per unit area at the end of
stage one is given in Equation 5.3. In stage two, the deflection equation has been
modified to reflect no core crushing and a BRP consisting of a single panel. The
equation for the amount of kinetic energy per unit area at the end of stage two is shown in
Equation 5.4.
h
tpKEI ρ
20
202
= (5.3)

155
h
IKEII ρ
202
= (5.4)
In stage three, the remaining kinetic energy must be dissipated through bending and
stretching of the panel. The equation for deflection is derived by equating the remaining
kinetic energy per unit area to the plastic work per unit area dissipated through bending
and stretching. The average plastic work per unit area dissipated in stage three is
estimated by summing the dissipation from bending and stretching, following the work of
Hutchinson and Xue, 2005. The equation for this estimate is shown in Equation 5.5. The
equation for deflection is shown in Equation 5.6. Details regarding the calculation of the
deflection of a BRP at Level 1 are given in Appendix C.
[ ]
+
=LL
hh
LhW yy
pIII
δσδσ2
32
(5.5)
( )2 2 20 02 2 4 16
343
y
y y
y
L h p th h
h
h
σσ σ ρδσ
− ± +=
(5.6)
Equations for the variation in deflection are also needed in order to determine the
sensitivity of the panel to variation in noise factors and uncertain design variables. The
derived equation for the variation in deflection is shown in Equation 5.7. Extensive
details regarding the calculation of the variance of deflection of a BRP are given in
Appendix C.
0 00 0
yy
p tp t
δ δ δ δδ σ ρσ ρ∂ ∂ ∂ ∂∆ = ∆ + ∆ + ∆ + ∆∂ ∂ ∂ ∂
(5.7)

156
Performance and design variable constraints for a BRP at Level 1 are given in the
following paragraphs. For a BRP modeled as three solid layers, the derivation of the
maximum mass per unit area constraint is shown in Equation 5.8, and the derivation of
the maximum deflection constraint is shown in Equation 5.9.
( )( )
0
/150,,
,,
0/150
2
2
≤∆+
∆∂∂=∆
−==
≤−
MM
ff
mm
totalyM
totaly
gg
gg
mkghfg
hfM
mkgM
ρρ
σρ
σρ
(5.8)
( )( ) ( )
0
1.0,,
,,
01.0
≤∆+
∆∂∂+∆
∂∂=∆
−==
≤−
δδ
δ
δ
σσρρ
σρσρδ
δ
gg
ggg
Lhfg
hf
L
yy
mm
totaly
totaly
(5.9)
Constraints to keep the material property design variables within the specified bounds in
spite of the assumed uncertainty in these variables are imposed. A generic form of these
constraints is shown in Equation 5.10.
( ) ( )( ) ( )
{ }totaly hx
xx
xx
,,
0boundupper 21
021boundlower
σρ=∀≤−∆+
≤∆−−
(5.10)

157
Solutions for BRP design at each level are found by implementing a cDSP using the
fmincon() function in MATLAB (MATLAB 2004). A graphical user interface (GUI)
called the Blast Resistant Panel Design Studio is developed to gather user input data for
BRP design solution analysis. Developing BRP analysis models and the BRP Design
Studio is a collaboration with Georgia Tech student, Stephanie Thompson. The BRP
GUI is shown in Figure 5.8.
Figure 5.8 – BRP Design Studio, a graphical user interface implemented in MATLAB
Level 2
In the following section, the performance of a BRP consisting of three solid layers is
analyzed (see Figure 5.10). The BRP analyzed in the following section is different from

158
the BRP analyzed in the previous section in that model complexity is significantly
increased. In the previous BRP analysis model, 3 design variables are used to describe a
design solution. The BRP performance model analyzed in the following section
considers 9 design variables (σy, σy, σy, ρf, ρb, ρc, hf, hb, H).
Figure 5.9 – Multilevel model 2: Three solid panels
A cDSP for Level 2 BRP design is presented in Table 5.5.
Table 5.5 – BRP Level 2 cDSP
Word Formulation Mathematical Formulation Given Given BRP with three solid layers BRP length: L = 1 m Uniform pressure impulse Impulse load model: 0/
0ttepp −
=
∫ == 000 d tptpI
40 025MPa, 10 secp t −
= =
Loading uncertainty models 0 00 00.15 , 0.15p tp tµ µ∆ = ∆ =
Material property uncertainty models ( ) ( ), ,0.05 , 0.05y y ub y lb ub lbσ σ σ ρ ρ ρ∆ = − ∆ = −
BRP performance model ( ),, , , ,f b y i if h h Hδ σ ρ=
( ), , ,f b iM f h h H ρ=
Find Find BRP design variables Dimensions of BRP: (hf, hb, H) Material properties of each layer of BRP: (ρi , σyi) BRP deviation variables di
+, di-
Satisfy Satisfy Constraints Constraints Maximum allowable deflection δ + ∆δ ≤ 10 cm Maximum allowable mass / area M + ∆M ≤ 150 kg/m2

159
Table 5.5 (continued) – BRP Level 2 cDSP
Bounds Bounds density 2000 kg/m3 ≤ ρ ± ∆ρ ≤ 10000 kg/m3 yield strength 100 MPa ≤ σy ± ∆σy ≤ 1100 MPa front face sheet thickness 1 mm ≤ hf ≤ 25 mm
back face sheet thickness 1 mm ≤ hb ≤ 25 mm core height 5mm ≤ H ≤ 50 mm deviation variables di
+, di- ≥ 0
di+ · di
- = 0 Goals Goals Minimize deflection (δ) d1
- = 1 – G1 / A1(x) W1 = 0.25 Minimize mass/area (M) d2
- = 1 – G2 / A2(x) W2 = 0.25 Maximize HD-EMIδ d3
- = 1 – A3(x) / G3 W3 = 0.25 Maximize HD-EMIM d4
- = 1 – A4(x) / G4 W4 = 0.25 Minimize Minimize Deviation from target Z = W1d1
- + W2d2- + W3d3
- + W4d4-
The three-stage deformation process developed by Fleck and Deshpande is implemented
in performance analysis of a BRP with three solid layers. The three-stage deformation
process is modified slightly in Stage II, core crushing. Since a BRP consisting of three
solid layers does not experience core crushing, equations reflecting this portion of BRP
deformation have been modified to reflect the non-crushing nature of a BRP with three
solid layers. These modifications are reflected in the equations that follow. The
deflection equations developed for a BRP with three solid layers are adapted from the
work of Hutchinson and Xue, 2005. Similar assumptions regarding loading conditions
and material properties discussed in BRP modeling at Level 1 are applied to BRP
modeling at Level 2.
The equations for deflection of the back face sheet developed by Hutchinson and Xue are
extended to allow for independent layer height, and independent material in each layer,
and the modification of the core layer to resemble a solid panel. Following the three
stage deformation theory, the impulse of the blast is received by the front face sheet and
momentum is transferred in stage one (Fleck and Deshpande 2004). The equation for
kinetic energy per unit area at the end of stage one is given in Equation 5.11. In stage
two, the deflection equation has been modified to reflect no core crushing. The equation

160
for the amount of kinetic energy per unit area at the end of stage two is shown in
Equation 5.12.
ff
I h
tpKE
ρ
20
202
= (5.11)
202
IIf f c b b
IKE
h H hρ ρ ρ=
+ + (5.12)
In stage three, the remaining kinetic energy must be dissipated through bending and
stretching of the back face sheet. The equation for deflection is derived by equating the
remaining kinetic energy per unit area to the plastic work per unit area dissipated through
bending and stretching. The average plastic work per unit area dissipated in stage three is
estimated by summing the dissipation from bending and stretching, following the work of
Hutchinson and Xue, 2005. The equation for this estimate is shown in Equation 5.13.
The equation for deflection is shown in Equation 5.14. Details regarding the calculation
of the deflection of BRPs are given in Appendix C.
2
, , , ,
2
3p
III y f f y c y b b y b b
HW h H h h
L L L
δ δσ σ σ σ = + + + (5.13)
( )2 2 2, , , 0 02 2 2
. ,
, , ,
163
43
y f f y c y b b
y b b y b bf f c b b
y f f y c y b b
L h H h p th H h H
h H h
h H h
σ σ σσ σ ρ ρ ρδσ σ σ
+ + − ± + + += + +
(5.14)
Equations for the variation in deflection are also needed in order to determine the
sensitivity of the panel to variation in noise factors and uncertain design variables. The

161
derived equation for the variation in deflection is shown in Equation 5.15. Extensive
details regarding the calculation of the variance of deflection of a BRP are given in
Appendix C.
00
00
,,
,,
,,
...
...
tt
pp
ff
cc
bb
fyfy
cycy
byby
∆∂∂+∆
∂∂
+∆∂∂+∆
∂∂+∆
∂∂
+∆∂∂+∆
∂∂+∆
∂∂=∆
δδ
ρρδρρ
δρρδ
σσδσσ
δσσδδ
(5.15)
In order to transfer design information from Level 2 to Level 1, material mapping
functions are developed. The material properties of a BRP modeled as three solid layers
(Level 2) are mapped to a BRP defined by one solid layer (Level 1) by averaging the
material properties of a BRP at Level 2, accounting for differences in panel height. A
description of how material properties mapped from Level 2 to Level 1 is given in
Equation 5.16 and Equation 5.17. The height of a BRP modeled as a single panel is the
sum of panel height for each panel in a BRP modeled using three solid layers. This
relationship is given in Equation 5.18.
( )
( ) ( )2,2,2,2,22.
2,2,2,1
//
.../
leveltotallevelflevelfleveltotallevellevelc
leveltotallevelblevelblevel
hhhH
hh
ρρρρ
+
+= (5.16)
( )( )( )2,2,2,,
2,22,,
2,2,2,,1,
/
.../
.../
leveltotallevelflevelfy
leveltotallevellevelcy
leveltotallevelblevelbylevely
hh
hH
hh
σ
σ
σσ
+
+=
(5.17)

162
fbtotal hHhh ++= (5.18)
For a BRP modeled as three solid layers, the derivation of a maximum mass per unit area
constraint is shown in Equation 5.19, and a derivation of the maximum deflection
constraint is shown in Equation 5.20.
( )( )
0
/150,,,,,
,,,,,
0/150
,,
2,
,
2
≤∆+
∆∂∂+∆
∂∂+∆
∂∂=∆
−==
≤−
MM
bb
meffectivec
effectivec
mf
f
mm
bfbeffectivecfM
bfbeffectivecf
gg
gggg
mkghhHfg
hhHfM
mkgM
ρρ
ρρ
ρρ
ρρρ
ρρρ
(5.19)
( )( ) ( )
0
...
1.0,,,,,,,,
,,,,,,,,
01.0
,,,,
,,,
,,
,,
,,,,,
,,,,,
≤∆+
∆∂
∂+∆∂
∂+∆∂∂
+∆∂∂+∆
∂∂+∆
∂∂=∆
−==
≤−
δδ
δ
δ
σσσσσσ
ρρρρρρ
σσσρρρσσσρρρδ
δ
gg
ggg
gggg
LhhHfg
hhHf
L
effectivecyeffectivecy
mfy
effectivecy
mfy
fy
m
bb
meffectivec
effectivec
mf
f
m
bfbyeffectivecyfybeffectivecf
bfbyeffectivecyfybeffectivecf
(5.20)
Finally, constraints to keep the material property design variables within the specified
bounds in spite of the assumed uncertainty in these variables are imposed. A generic
form of these constraints is shown in Equation 5.21. There are two such constraints for
each of the six uncertain design variables. Similarly to the previous section, it is assumed
that material property uncertain is modeled as 5% of the corresponding material bound.

163
( ) ( )( ) ( )
{ }, , ,
1lower bound 02
1 upper bound 02
, , , , ,b c f Y b Y c Y f
x x
x x
x ρ ρ ρ σ σ σ
− − ∆ ≤
+ ∆ − ≤
∀ =
(5.21)
Level 3
In the following section, a BRP consisting of three layers and a honeycomb core is
analyzed (see Figure 5.10). In this section, BRP performance modeling is at the highest
level of model complexity examined in this thesis.
Figure 5.10 – Multilevel model 3: Solid panels surrounding honeycomb core
A cDSP for Level 3 BRP design is presented in Table 5.6.
Table 5.6 – BRP Level 3 cDSP
Word Formulation Mathematical Formulation Given Given BRP with two solid layers surrounding a
honeycomb core with a square topology BRP length: L = 1 m
Uniform pressure impulse Impulse load model: 0/
0ttepp −
=
∫ == 000 d tptpI
40 025MPa, 10 secp t −
= =
Loading uncertainty models 0 00 00.15 , 0.15p tp tµ µ∆ = ∆ =
Material property uncertainty models ( ) ( ), ,0.05 , 0.05y y ub y lb ub lbσ σ σ ρ ρ ρ∆ = − ∆ = −
BRP performance model ( ), , , , , ,f b c yf h h H h Bδ σ ρ=
( ), , , , ,f b cM f h h H h B ρ=

164
Table 5.6 (continued) – BRP Level 3 cDSP
Find Find BRP design variables Dimensions of BRP: (hf, hb, H, hc, B) Material properties of each layer of BRP: (ρi , σyi) for i = f, b, c BRP deviation variables di
+, di-
Satisfy Satisfy Constraints Constraints Maximum allowable deflection δ + ∆δ ≤ 10 cm Maximum allowable mass / area M + ∆M ≤ 150 kg/m2 Relative density of core constraint Rc ≥ 0.07 Shear-off constraints ( )1 , 0 0, , , ,SH f f y fg f h p tρ σ=
( )2 , , , ,SH f cg f h H h B ρ=
Bounds Bounds density 2000 kg/m3 ≤ ρ ± ∆ρ ≤ 10000 kg/m3 yield strength 100 MPa ≤ σy ± ∆σy ≤ 1100 MPa front face sheet thickness 1 mm ≤ hf ≤ 25 mm
back face sheet thickness 1 mm ≤ hb ≤ 25 mm core height 5mm ≤ H ≤ 50 mm cell wall thickness 0.1 mm ≤ hc ≤ 10 mm cell spacing 1 mm ≤ B ≤ 20 mm deviation variables di
+, di- ≥ 0
di+ · di
- = 0 Goals Goals Minimize deflection (δ) d1
- = 1 – G1 / A1(x) W1 = 0.25 Minimize mass/area (M) d2
- = 1 – G2 / A2(x) W2 = 0.25 Maximize HD-EMIδ d3
- = 1 – A3(x) / G3 W3 = 0.25 Maximize HD-EMIM d4
- = 1 – A4(x) / G4 W4 = 0.25 Minimize Minimize Deviation from target Z = W1d1
- + W2d2- + W3d3
- + W4d4-
The deformation of sandwich plates under impulse loading is divided into three time
periods according to the three-stage deformation theory developed by Fleck and
Deshpande, 2004. Fleck and Deshpande analyze the stages of deformation, and propose
equations relating impulse loading to deformation. In subsequent work, Hutchinson and
Xue adapted the three-stage deformation theory proposed by Fleck and Deshpande and
applied it to the optimization of blast resistant panels (Hutchinson and Xue 2005).
The equations for deflection of the back face sheet developed by Hutchinson and Xue
(2005) are extended to allow for independent layer heights, and independent materials in
each layer. Following the three stage deformation theory, the impulse of the blast is

165
received by the front face sheet and momentum is transferred in stage one (Fleck and
Deshpande 2004). The equation for kinetic energy per unit area at the end of stage one is
given in Equation 5.22. In stage two, some of the kinetic energy is dissipated through
crushing of the core layer. The equation for the amount of kinetic energy per unit area at
the end of stage two is shown in Equation 5.23. The crushing strain is used to determine
the crushed height of the core layer and is derived by equating the plastic dissipation per
unit area in the core to the loss of kinetic energy per unit area in stage two (Hutchinson
and Xue 2005). The crushing strain in is shown in Equation 5.24.
ff
I h
tpKE
ρ
20
202
= (5.22)
bbccff
II hHRh
tpKE
ρρρ ++=
20
202
(5.23)
( )( )bbccffffcycc
ccbbc hHRhhHR
HRhtp
ρρρρσλρρε
++
+=
,
20
202
(5.24)
In stage three, the remaining kinetic energy must be dissipated through bending and
stretching of the back face sheet. The equation for deflection is derived by equating the
remaining kinetic energy per unit area to the plastic work per unit area dissipated through
bending and stretching. The average plastic work per unit area dissipated in stage three is
estimated by summing the dissipation from bending and stretching, following the work of
Hutchinson and Xue, 2005. The equation for this estimate is shown in Equation 5.25.
The equation for deflection is shown in Equation 5.26. Details regarding the calculation
of the deflection of BRPs are given in Appendix C.

166
[ ]
+
++=LL
Hh
LhHRhW bbYbbYSccYffY
PIII
δσδσλσσ ,
2
,,, 43
2 (5.25)
( ) [ ]( )
[ ]( ) ( )( )
+++−=−=
++
+++++±−
=
HRhhhR
HRhIHHH
hHRh
hHRh
hHRhLIHhHh
ccbbffffcycc
ccbbc
bbySccyffy
bbccff
bbySccyffybbybby
ρρρρσλρρε
σλσσρρρ
σλσσσσδ
,
20
,,,
,,,22
0222,,
21where
393
(5.26)
Equations for the variation in deflection are also needed in order to determine the
sensitivity of the panel to variation in noise factors and uncertain design variables. The
derived equation for the variation in deflection is shown in Equation 5.27. Extensive
details regarding the calculation of the variance of deflection of a BRP are given in
Appendix C.
00
00
,,
,,
,,
...
...
tt
pp
ff
cc
bb
fyfy
cycy
byby
∆∂∂+∆
∂∂
+∆∂∂+∆
∂∂+∆
∂∂
+∆∂∂+∆
∂∂+∆
∂∂=∆
δδ
ρρδρρ
δρρδ
σσδσσ
δσσδδ
(5.27)
In order to pass design information from Level 3 to Level 2, material mapping functions
are created. The core layer of a BRP at Level 2 is modeled as a solid layer with effective
material properties. Effective material properties (ρc, σy,c) for the core at Level 2 are
developed based on the material properties of the core layer and the relative density of
the core layer at Level 3. The effective density of the core layer of a BRP at Level 2 is
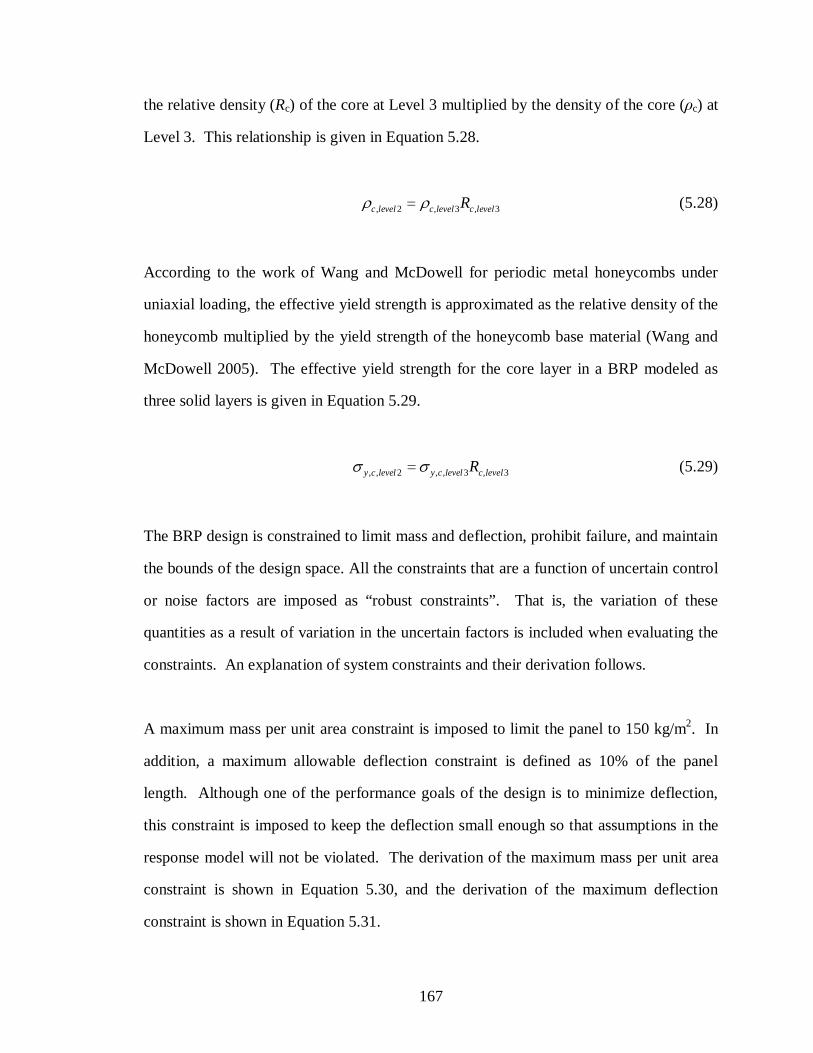
167
the relative density (Rc) of the core at Level 3 multiplied by the density of the core (ρc) at
Level 3. This relationship is given in Equation 5.28.
, 2 , 3 , 3c level c level c levelRρ ρ= (5.28)
According to the work of Wang and McDowell for periodic metal honeycombs under
uniaxial loading, the effective yield strength is approximated as the relative density of the
honeycomb multiplied by the yield strength of the honeycomb base material (Wang and
McDowell 2005). The effective yield strength for the core layer in a BRP modeled as
three solid layers is given in Equation 5.29.
, , 2 , , 3 , 3y c level y c level c levelRσ σ= (5.29)
The BRP design is constrained to limit mass and deflection, prohibit failure, and maintain
the bounds of the design space. All the constraints that are a function of uncertain control
or noise factors are imposed as “robust constraints”. That is, the variation of these
quantities as a result of variation in the uncertain factors is included when evaluating the
constraints. An explanation of system constraints and their derivation follows.
A maximum mass per unit area constraint is imposed to limit the panel to 150 kg/m2. In
addition, a maximum allowable deflection constraint is defined as 10% of the panel
length. Although one of the performance goals of the design is to minimize deflection,
this constraint is imposed to keep the deflection small enough so that assumptions in the
response model will not be violated. The derivation of the maximum mass per unit area
constraint is shown in Equation 5.30, and the derivation of the maximum deflection
constraint is shown in Equation 5.31.

168
( )( )
0
/150,,,,,,,
,,,,,,,
0/150
2
2
≤∆+
∆⋅∂∂+∆⋅
∂∂+∆⋅
∂∂=∆
−==
≤−
MM
cc
Mb
b
Mf
f
MM
bfcfffM
bfcfff
gg
gggg
mkghhhHBfg
hhhHBfM
mkgM
ρρ
ρρ
ρρ
ρρρ
ρρρ
(5.30)
( )( ) ( )
0 0 , , ,
0 0 , , ,
0 0 ,0 0 ,
,, ,
0.1 0
, , , , , , , , , , , ,
, , , , , , , , , , , , 0.1
Y b b Y c c Y f f c f
Y b b Y c c Y f f c f
Y b bY b b
Y c cY c c Y f
L
f p t B H h h L
g f p t B H h h L L
g g g gg p t
p t
g g g
δ
δ δ δ δδ
δ δ δ
δδ σ ρ σ ρ σ ρ
σ ρ σ ρ σ ρ
σ ρσ ρ
σ ρ σσ ρ σ
− ≤=
= −
∂ ∂ ∂ ∂∆ = ⋅∆ + ⋅∆ + ⋅∆ + ⋅∆ +∂ ∂ ∂ ∂
∂ ∂ ∂⋅∆ + ⋅∆ + ⋅∆∂ ∂ ∂ ,
0
Y f ff
g
g g
δ
δ δ
ρρ∂+ ⋅∆∂
+ ∆ ≤
(5.31)
The relative density (Rc) of the core is the amount of material in the core divided by the
total volume of the core. A minimum relative density of the core constraint is imposed to
ensure crushing of the core rather than buckling, which would not dissipate as much
energy. The relative density is not a function of uncertain factors. The equation for the
calculation of the relative density constraint is shown in Equation 5.32.
( )2 22
0.07 0
c c c
c
R Bh h B
R
= −
− ≤ (5.32)
Two constraints to avoid shear failure of the front face sheet are imposed. The first
criterion prohibits shear of the face sheet at the clamped ends of the plate, and the second

169
criterion prohibits shear of the face sheet at the core webs. These constraints are shown
in Equations 5.33 and 5.34, respectively.
( )1 0 0 ,
1 1 1 11 0 0 ,
0 0 ,
1 1
2 , where 0.6
0
SH f Y f f SH SH
SH SH SH SHSH Y f f
Y f f
SH SH
g p t h
g g g gg p t
p t
g g
σ ρ
σ ρσ ρ
= −Γ Γ =
∂ ∂ ∂ ∂∆ = ∆ + ∆ + ∆ + ∆∂ ∂ ∂ ∂
+ ∆ ≤
(5.33)
2
2 22
2 2
4
3
0
c cSH
f f
SH SHSH f c
f c
SH SH
HRg
h
g gg
g g
ρρ
ρ ρρ ρ
= −
∂ ∂∆ = ∆ + ∆∂ ∂
+ ∆ ≤
(5.34)
Finally, constraints to keep the material property design variables within the specified
bounds in spite of the assumed uncertainty in these variables are imposed. A generic
form of these constraints is shown in Equation 5.35. There are two such constraints for
each of the six uncertain design variables. It is assumed that material property uncertain
is modeled as 5% of the corresponding material bound.
( ) ( )( ) ( )
{ }, , ,
1lower bound 02
1 upper bound 02
, , , , ,b c f Y b Y c Y f
x x
x x
x ρ ρ ρ σ σ σ
− − ∆ ≤
+ ∆ − ≤
∀ =
(5.35)
Feasible Design Space
The feasible design space at each level of design complexity is defined by bounds placed
on design variables. In BRP design, bounds on material property design variables are

170
based on properties of all metals. Bounds placed on geometric design variables are
determined based on blast panel manufacturability. A summary of the feasible design
space for each level of model complexity is given in Table 5.7.
Table 5.7 – Bounds on design variables in BRP design
Design Variable Lower Bound Upper Bound σy,f 100 MPa 1100 MPa σy,c 100 MPa 1100 MPa σy,b 100 MPa 1100 MPa ρf 2000 kg/m3 1000 kg/m3 ρc 2000 kg/m3 1000 kg/m3 ρb 2000 kg/m3 1000 kg/m3 B 1 mm 20 mm H 5 mm 50 mm hc 0.1 mm 10 mm hf 1 mm 25 mm hb 1 mm 25 mm
Map
Once product performance is modeled at various levels of design complexity, a method
for linking the models, both deductively and inductively, is developed. For a generic
multilevel design process, mapping functions describing design variables and uncertainty
models should be developed at each level-to-level interface. For the BRP example
problem, mapping functions are created to describe the relationship of material properties
and uncertainty models when traveling from one multilevel model to another. These
mapping functions are mathematical descriptions of material and uncertainty information
propagation in a multilevel design process. Details regarding developed mapping
functions for the BRP example problem are given in the following section.
Material Mapping Functions
A visual representation used to describe material property mappings among the three
levels in the BRP design problem is given in the Figure 5.11 and Figure 5.12. The

171
material mappings are applied to all material properties used in BRP performance
analysis and include density (ρ) and yield strength (σy).
Deductive –
specific to general
MaterialLevel 1 = effective material properties (average) from MaterialLevel 2
MaterialLevel 2 = effective material properties from core layer of MaterialLevel 3
Level 1 Level 2 Level 3
Figure 5.11 – Mapping functions of material properties in BRP design (deductive)
A description of the specific mapping functions follows:
Deductive mapping functions
- Level 3 to Level 2 – Material properties of the core layer at Level 2 are
determined by multiplying the material properties of the core layer at Level 3
by the relative density of the core at Level 3. Recall from Equations 5.28 –
5.29 that this assumption holds for metallic honeycomb cores under uniaxial
loading conditions (Wang, et al. 2005).
- Level 2 to Level 1 – The homogeneous material properties of the single layer
BRP at Level 1 are determined by averaging the material properties of the
three layers of the BRP in Level 2, as in Equations 5.16 – 5.18. In this case,
averaging depends on the material properties as well as the height of the layer,
compared to the total height of the panel.

172
Inductive –
general to specific
MaterialLevel 3 = “best” material and relative density solution based on MaterialLevel 2
MaterialLevel 2 = “best” material property and layer thickness solution based on MaterialLevel 1
Level 1 Level 2 Level 3
Figure 5.12 – Mapping functions of material properties in BRP design (inductive)
Inductive mapping functions
In order to achieve an inductive design solution, the solution path must travel from
general to specific, that is, from Level 1 to Level 3 in BRP design. In an inductive
solution path, design information from the previous level is preserved by imposing
additional design constraints. For example, when making design decisions at Level 2,
design information previously determined at Level 1 is preserved by constraining the
design solution at Level 2 to have similar properties to the solution at Level 1 (a ± 5%
deviation is acceptable in order to sufficiently relax the design constraint so a feasible
design solution can be found). In BRP design deductive material mapping functions
are imposed at Level 2 and Level 3, based on BRP design solutions determined at
Level 1 and Level 2, respectively. By implementing these multilevel inductive design
constraints, a designer is able to make design decisions at level of high complexity
(such as Level 3) based on design information from Level 1 and Level 2. Inductive
mapping functions for BRP design are described below.
- Level 1 to Level 2 – Material properties and layer height corresponding to the
three layers of a BRP designed at Level 2 are determined based on a robust
design solution to achieve specified user defined goals. The limiting
constraint is that the weighted average (based on material properties of each

173
layer and height of layer compared to the total height of BRP) of the material
properties of the three layers in Level 2 must equal the material properties in
the single layer for the BRP at Level 1 (±5% acceptable deviation). See
Equation 5.43 for mathematical representation.
- Level 2 to Level 3 – The material properties and core geometry of the BRP at
Level 3 is determined by finding a robust design solution to achieve user
defined goals. The limiting constraint is that the relative density multiplied by
the material properties of the core layer in Level 3 must equal the material
properties of the core layer at Level 2 (±5% acceptable deviation). See
Equation 5.44 for mathematical representation.
Uncertainty Mapping Functions
In order to quantify and model propagated uncertainty in a multilevel design process,
inductive and deductive uncertainty mappings are developed. A description of
uncertainty mappings in the multilevel BRP design problem is given in Figure 5.13. For
the BRP design problem explored in this thesis, uncertainty is modeled as uncertainty in
material properties [density (ρ), yield strength (σy)] and loading conditions [average peak
pressure (p0), characteristic loading time (t0)]. Uncertainty is modeled as bounds
surrounding an assumed nominal value.
Uncertain Factor Uncertainty Model
Design variable: density (ρ)
average_ρlb_ρ ub_ρ
∆ρ = 5% (ub_ρ – lb_ρ)
Design variable: yield strength (σy)
average_ σylb_ σy ub_ σy
∆σy = 5% (ub_σy – lb_ σy)
Figure 5.13– Uncertainty mapping in BRP design

174
Noise factor: characteristic loading time (t0)
average_ t0lb_t0 ub_t0
∆t0 = 15% (average_t0)
Noise factor: average peak pressure (p0)
average_ p0lb_p0 ub_p0
∆p0 = 15% (average_p0)
Figure 5.13 (continued) – Uncertainty mapping in BRP design
In the BRP design problem, it is assumed that material properties and loading conditions
are uncertain. Uncertainty in loading conditions is considered a noise factor (Type I
uncertainty) and uncertainty in material properties is categorized as uncertainty in a
control factor (Type II uncertainty). In the BRP design problem, all uncertainty is
modeled as an interval surrounding a nominal value. There is an equal probability for
selecting any value within a specified uncertainty interval. Both inductive and deductive
uncertainty mappings in the BRP design problem are defined as bounds on loading
conditions and bounds on material properties relevant for design at a given level.
Find
Design variables and deviation variables at each level of design are determined for the
robust solution, and are listed in Table 5.8.
Table 5.8 – Design variables and deviation variables to find in BRP design solution
Design Level Design Variables Deviation Variables
Level 1 σy, ρ, h −+ii dd ,
Level 2 σyf, σyc, σyb, ρf, ρc, ρb, hf, H, hb −+ii dd ,
Level 3 σyf, σyc, σyb, ρf, ρc, ρb, hf, H, hb, hc, B −+ii dd ,

175
Satisfy
Constraints
For BRP design, performance constraints are given in Equation 5.36 – Equation 5.37.
max max
max max
0.1
0.1 for 1
L
L m
δ δδ δ
+ ∆ ≤+ ∆ ≤ =
(5.36)
2/150 mkgMM ≤∆+ (5.37)
Material property constraints are given in Equation 5.38.
( ) ( )( ) ( )
{ }, , ,
1lower bound 02
1 upper bound 02
, , , , ,b c f Y b Y c Y f
x x
x x
x ρ ρ ρ σ σ σ
− − ∆ ≤
+ ∆ − ≤
∀ =
(5.38)
Geometric constraints are given in Equation 5.39 – Equation 5.41.
( )2 22
0.07 0
c c c
c
R Bh h B
R
= −
− ≤ (5.39)
( )1 0 0 ,
1 1 1 11 0 0 ,
0 0 ,
1 1
2 , where 0.6
0
SH f Y f f SH SH
SH SH SH SHSH Y f f
Y f f
SH SH
g p t h
g g g gg p t
p t
g g
σ ρ
σ ρσ ρ
= −Γ Γ =
∂ ∂ ∂ ∂∆ = ∆ + ∆ + ∆ + ∆∂ ∂ ∂ ∂
+ ∆ ≤
(5.40)

176
2
2 22
2 2
4
3
0
c cSH
f f
SH SHSH f c
f c
SH SH
HRg
h
g gg
g g
ρρ
ρ ρρ ρ
= −
∂ ∂∆ = ∆ + ∆∂ ∂
+ ∆ ≤
(5.41)
Constraints relating to deviation variables are given in Equation 5.42.
{ }4,3,2,1
0,,0
=
≥=⋅ −+−+
i
dddd iiii (5.42)
Inductive design constraints are given in Equation 5.1 – Equation 5.2. Recall from the
cantilever beam example in Chapter 4 that in an inductive design solution path, additional
constraints are added to preserve design information from levels of decreasing
complexity. When transitioning from Level 1 to Level 2, an additional constraint is
added at Level 2 such that the average material properties of a BRP at Level 2 are within
5% of the material properties of the BRP designed at Level 1. This constraint is reflected
in Equation 5.43. Additionally, when transitioning from Level 2 to Level 3, an additional
constraint is added at Level 3 such that effective material properties of the core layer at
Level 3 are within 5% of the material properties of the core layer at Level 2. This
constrained is detailed in Equation 5.44. Recall that effective material properties at Level
3 are determined by multiplying base material properties by the relative density (Rc) of
the core.
( )
{ }, 2 , 2 , 2 15%
,
f bf level b level c level level
y
h h Hx x x x
h h h
x σ ρ
+ + = ± =
(5.43)

177
( )
{ }ρσ ,
%5 2,3,
y
levelclevelcc
x
xxR
=
±= (5.44)
Goals
There are four goals involved in BRP design including two performance goals and two
robustness goals: minimize deflection of back face sheet, minimize mass / area, maximize
robustness with based on deflection goal, maximize robustness based on mass /area goal.
The metric used for determining design robustness is HD-EMI. Recall that the HD-EMI
metric is a measure of the distance from design space bounds divided by system
performance variation. Since there are two performance goals in the BRP design
problem (minimize deflection, minimize mass / area) the HD-EMI metric is maximized
considering variation in deflection and variation in mass / area. In Equation 5.45 –
Equation 5.47 HD-EMI calculations as they relate to design variables and performance
goals at each design level are given. Notice that by increasing distance from feasible
design space and decreasing variation in system performance, one is able to maximize
HD-EMI.
( )( )
( )( )
{ }hx
M
xx
xx
y
boundary
levelM
boundary
level
,,
max
minEMIHD
max
minEMIHD
1,
1,
ρσ
δδ
=∀∆
−=−
∆−
=−
(5.45)

178
( )( )
( )( )
{ }Hhhx
M
xx
xx
bfcbfcybyfy
boundary
levelM
boundary
level
,,,,,,,,
max
minEMIHD
max
minEMIHD
,,,
2,
2,
ρρρσσσ
δδ
=∀∆
−=−
∆−
=−
(5.46)
( )( )
( )( )
{ }cbfcbfcybyfy
boundary
levelM
boundary
level
hBHhhx
M
xx
xx
,,,,,,,,,,
max
minEMIHD
max
minEMIHD
,,,
3,
3,
ρρρσσσ
δδ
=∀∆
−=−
∆−
=−
(5.47)
Minimize
A deviation function in minimized in order to determine a design solution that best meets
design goals. In this thesis, due to its ease of use, the Archimedian formulation of the
deviation function is chosen. It consists of a weighted sum of the deviation variables, and
the weights are chosen to reflect designer preferences such that they are all greater than
or equal to zero and sum to unity.
Weighted Sum of Deviation Variables
The deviation function for the BRP design is shown in Equation 5.48. The goal is to
minimize the value of Z in order to find the design point with the smallest deviation from
design goals. In BRP design, each goal is weighted equally at Wi = 0.25 (i = 1 to 4).
44
332211 dWdWdWdWZ ⋅+⋅+⋅+⋅= −− (5.48)

179
5.2.3 Blast Resistant Panel Inductive Design Solution
The inductive multilevel BRP design solution is presented in Section 5.3.3. Following a
general-to-specific (inductive) approach, the design solutions are presented based on a
top-down approach: Level 1, Level 2, and Level 3.
Level 1
When obtaining an inductive multilevel design solution, the designer begins at Level 1,
the level with the least amount of design complexity. The BRP design solution and
performance data at design Level 1 are presented in Table 5.9 – Table 5.10.
Table 5.9 – BRP design variable data: Level 1
Design Variable Value Units
σy 1075 MPa
ρ 2941 kg/m3
h 36 mm
Table 5.10 – BRP performance data: Level 1
Performance Value Units
back face sheet deflection (δ) 5.9 cm
mass / area (M) 107 kg/m2 variation of deflection (∆δ) 2.8 cm
variation of mass / area (∆M) 43 kg/m2
Level 2
Once the robust design solution is obtained for Level 1, an additional design constraint
characterizing BRP material properties at Level 1 is imposed for BRP design at Level 2.
The BRP design solution and performance data at design Level 2 are presented in Table
5.11 – Table 5.12.
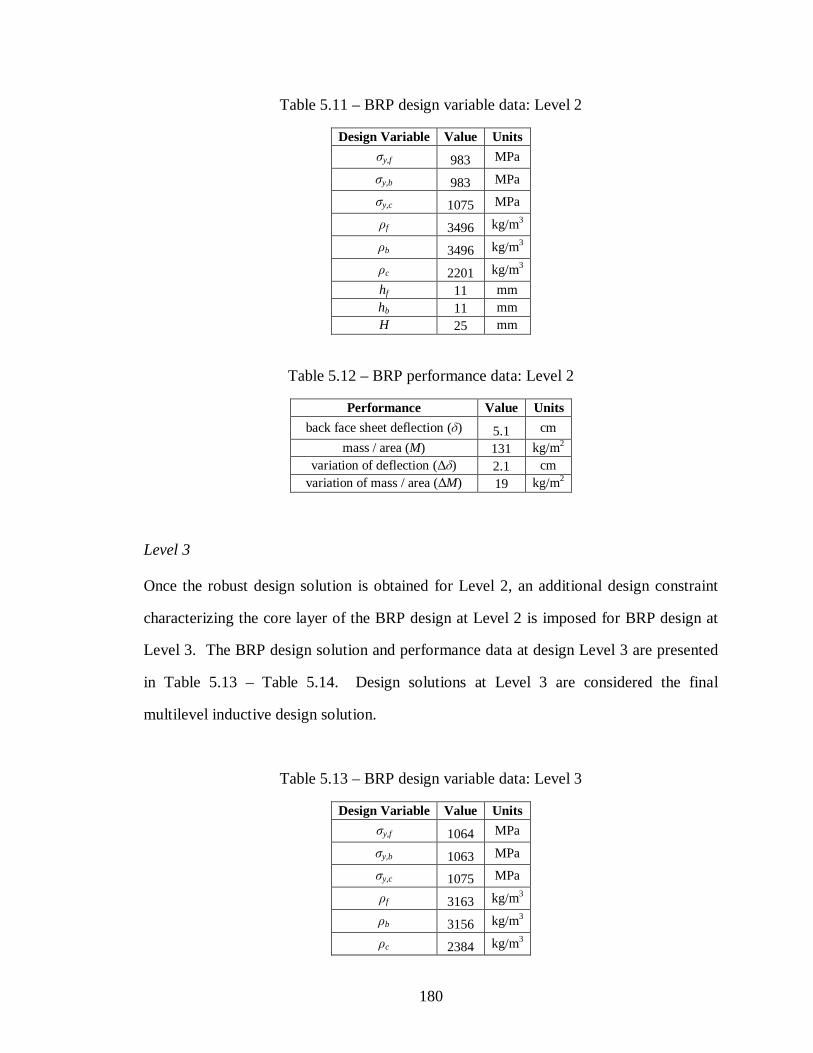
180
Table 5.11 – BRP design variable data: Level 2
Design Variable Value Units
σy,f 983 MPa
σy,b 983 MPa
σy,c 1075 MPa
ρf 3496 kg/m3
ρb 3496 kg/m3
ρc 2201 kg/m3
hf 11 mm hb 11 mm H 25 mm
Table 5.12 – BRP performance data: Level 2
Performance Value Units
back face sheet deflection (δ) 5.1 cm
mass / area (M) 131 kg/m2 variation of deflection (∆δ) 2.1 cm
variation of mass / area (∆M) 19 kg/m2
Level 3
Once the robust design solution is obtained for Level 2, an additional design constraint
characterizing the core layer of the BRP design at Level 2 is imposed for BRP design at
Level 3. The BRP design solution and performance data at design Level 3 are presented
in Table 5.13 – Table 5.14. Design solutions at Level 3 are considered the final
multilevel inductive design solution.
Table 5.13 – BRP design variable data: Level 3
Design Variable Value Units
σy,f 1064 MPa
σy,b 1063 MPa
σy,c 1075 MPa
ρf 3163 kg/m3
ρb 3156 kg/m3
ρc 2384 kg/m3

181
Table 5.13 (continued) – BRP design variable data: Level 3
hf 12 mm hb 12 mm H 26 mm B 7 mm hc 5 mm
Table 5.14 – BRP performance data: Level 3
Performance Value Units
back face sheet deflection (δ) 1.5 cm
mass / area (M) 131 kg/m2 variation of deflection (∆δ) 0.9 cm
variation of mass / area (∆M) 19 kg/m2
Robust vs. Non-Robust BRP Design Solutions
In the following section, the robustness of the multilevel BRP design solution is
examined. Recall that the performance of a robust design is insensitive to slight variation
in input parameters. The motivation for this section is to examine the differences in BRP
robust vs. non-robust design (based on goal weighting factors). In the following tables,
BRP design data from robust vs. non-robust design scenarios is compared for design
solutions at each level. Additionally, the robustness of design solutions (based on the
HD-EMI robustness metric) is analyzed at each level. Data supporting the observations
in this section are given in Table 5.15 – Table 5.20. Recall that there are four design
goals in BRP multilevel robust design: (1) minimize deflection (2) maximize robustness
with respect to variation in deflection, (3) minimize mass / area, and (4) maximize
robustness with respect to variation in mass / area. For a robust BRP design scenario,
each goal is weighted equally at Wi = 0.25. For a non-robust design scenario,
performance goals are weighted at Wperformance = 0.5 while the two remaining robustness
goals are weighted at Wrobust = 0.

182
In Table 5.15, robust and non-robust BRP design performance at Level 1 is compared.
Table 5.15 – Robust vs. non-robust BRP performance at Level 1
Performance Robust Non-Robust Units back face sheet deflection (δ) 5.9 6.5 cm
mass / area (M) 107 104 kg/m2
variation of deflection (∆δ) 2.8 3.2 cm
variation of mass / area (∆M) 43 46 kg/m2
In Table 5.15, variation in BRP performance is less for the robust scenario compared to
the non-robust scenario, as expected. However, the performance goals of minimizing
deflection and mass / area are also more closely achieved in the robust design scenario, a
trend that is not expected.
In Table 5.16 the HD-EMI metric is calculated for the robust and non-robust design
scenarios at Level 1. Recall that there are two components to the HD-EMI metric: the
maximization of distance to design space bounds divided by the minimization of
performance variation. Therefore, by maximizing HD-EMI, one is able to maximize
system robustness. By comparing HD-EMI calculations for each design variable one is
able to asses the relative robustness of BRP design at Level 1. In Table 5.16, the greatest
HD-EMI value for each design variable is presented in bold type in an effort to compare
robust and non-robust design scenarios.
Table 5.16 – Robust vs. non-robust BRP design solution at Level 1
Robustness Metric Design Solution
HD-EMI δ (m-1) HD-EMI M (m2/kg) Design
Variable Robust Non-
Robust Units Robust Non- Robust Robust Non-
Robust
σy 1075 863 MPa 89 741 0.06 0.52
ρ 2941 2715 kg/m3 420 279 0.27 0.19
h 36 38 mm 1114 1042 0.73 0.72

183
As seen in Table 5.16, the greatest HD-EMI values are most often found in the robust
design scenario. This observation combined with the fact that performance variation is
minimized in the robust design case (Table 5.15) indicates that for Level 1, the robust
design case (Wi = 0.25) is indeed more robust than the non-robust case (Wperformance = 0.5;
Wrobust = 0).
In Table 5.17, BRP design performance at Level 2 for the robust and non-robust cases is
compared.
Table 5.17 – Robust vs. non-robust BRP performance at Level 2
Performance Robust Non-Robust Units back face sheet deflection (δ) 5.1 5.5 cm
mass / area (M) 131 130 kg/m2
variation of deflection (∆δ) 2.1 2.3 cm
variation of mass / area (∆M) 19 20 kg/m2
Similar to BRP performance at Level 1 (Table 5.15) variation in BRP performance at
Level 2 (Table 5.17) is less for the robust case compared to the non-robust case, as
expected. The BRP deflection goal at Level 2 is best achieved for the robust case,
whereas the BRP mass / area goal is best achieved for the non-robust case. This shift in
design trends may indicate that the differences in the robust and the non-robust design
scenarios become less obvious at later stages in the BRP multilevel design process.
In Table 5.18, the robustness of BRP design scenarios at Level 2 is assessed using the
HD-EMI metric. Similar to Table 5.16, the greatest HD-EMI value for each design
variable is presented in bold type in an effort to compare robust and non-robust design
scenarios.

184
Table 5.18 – Robust vs. non-robust BRP design solution at Level 2
Robustness Metric Design Solution
HD-EMI δ (m-1) HD-EMI M (m2/kg) Design
Variable Robust Non-
Robust Units Robust Non- Robust Robust Non-
Robust
σy,f 983 750 MPa 557 1522 0.62 1.75
σy,b 983 750 MPa 557 1522 0.62 1.75
σy,c 1075 919 MPa 119 787 0.13 0.91
ρf 3496 3115 kg/m3 890 606 0.98 0.70
ρb 3496 3115 kg/m3 890 606 0.98 0.70
ρc 2201 2200 kg/m3 120 109 0.13 0.13
hf 11 12 mm 1984 1993 2.19 2.29
hb 11 12 mm 1984 1993 2.19 2.29
H 25 26 mm 2116 2029 2.34 2.33
As seen in Table 5.18, instances of maximum HD-EMI occur in both the robust and non-
robust case. This indicates that at Level 2 the measure of design robustness for the robust
and non-robust design scenarios is similar. At Level 1 it is clear that the robust scenario
produces a more robust design solution. However, at Level 2 the robust and non-robust
design scenarios produce design solutions with similar levels of robustness.
In Table 5.19, BRP design performance at Level 3 for the robust and non-robust cases is
compared.
Table 5.19 – Robust vs. non-robust BRP performance at Level 3
Performance Robust Non-Robust Units back face sheet deflection (δ) 1.5 1.6 cm
mass / area (M) 131 132 kg/m2
variation of deflection (∆δ) 0.9 1 cm
variation of mass / area (∆M) 19 17 kg/m2
Similar to Level 2 BRP performance, there is little difference in BRP performance at
Level 3. Performance goals are slightly improved for the non-robust case compared to
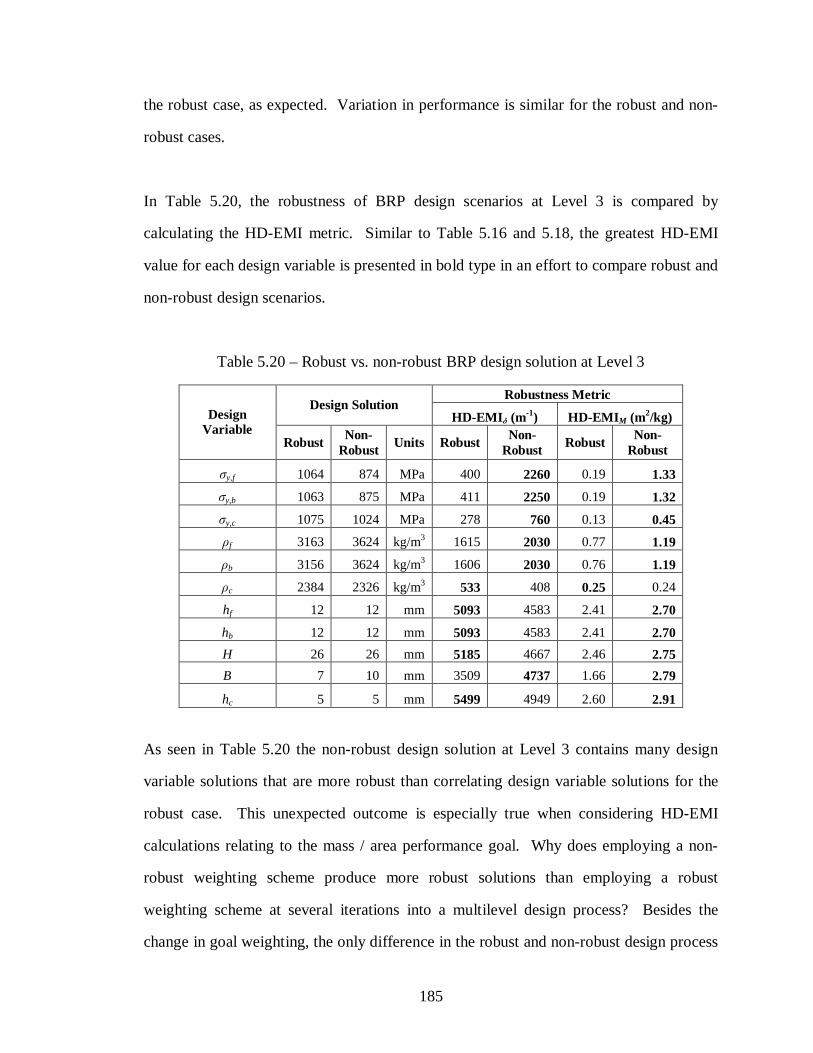
185
the robust case, as expected. Variation in performance is similar for the robust and non-
robust cases.
In Table 5.20, the robustness of BRP design scenarios at Level 3 is compared by
calculating the HD-EMI metric. Similar to Table 5.16 and 5.18, the greatest HD-EMI
value for each design variable is presented in bold type in an effort to compare robust and
non-robust design scenarios.
Table 5.20 – Robust vs. non-robust BRP design solution at Level 3
Robustness Metric Design Solution
HD-EMI δ (m-1) HD-EMI M (m2/kg) Design
Variable Robust Non-
Robust Units Robust Non- Robust Robust Non-
Robust
σy,f 1064 874 MPa 400 2260 0.19 1.33
σy,b 1063 875 MPa 411 2250 0.19 1.32
σy,c 1075 1024 MPa 278 760 0.13 0.45
ρf 3163 3624 kg/m3 1615 2030 0.77 1.19
ρb 3156 3624 kg/m3 1606 2030 0.76 1.19
ρc 2384 2326 kg/m3 533 408 0.25 0.24
hf 12 12 mm 5093 4583 2.41 2.70
hb 12 12 mm 5093 4583 2.41 2.70
H 26 26 mm 5185 4667 2.46 2.75
B 7 10 mm 3509 4737 1.66 2.79
hc 5 5 mm 5499 4949 2.60 2.91
As seen in Table 5.20 the non-robust design solution at Level 3 contains many design
variable solutions that are more robust than correlating design variable solutions for the
robust case. This unexpected outcome is especially true when considering HD-EMI
calculations relating to the mass / area performance goal. Why does employing a non-
robust weighting scheme produce more robust solutions than employing a robust
weighting scheme at several iterations into a multilevel design process? Besides the
change in goal weighting, the only difference in the robust and non-robust design process

186
is in the mapping functions. At the beginning of BRP design, a design solution is found
at Level 1. Recall that at this design level a robust weighting scheme produces the most
robust design solution. Then, design information from the robust and non-robust Level 1
solution is input into Level 2 mapping function constraints. Since the robust and non-
robust weighting schemes at Level 1 product different design solutions, the mapping
functions are slightly different for robust and non-robust design at Level 2. Next, a
design solution is obtained for Level 2 design using the two design scenarios. At this
stage in the design process, it is observed that there is little difference in the robustness of
design solutions obtained from the robust and non-robust weighting schemes. Again,
design information from Level 2 is input as mapping function constraints into Level 3
and design solutions are obtained at Level 3 based on the specified goal weighting
schemes. At Level 3 design, the observed trend continues and the design solution from
the non-robust weighting scheme actually produces more robust results than the design
solution from the robust weighting scheme. While this unexpected trend is not fully
understood at this time, it is almost certainly related to the mapping functions used to
transfer design information among each level since the solution-finding approach for the
robust and non-robust case is identical, except for goal weighting and mapping functions.
In summary, early in the BRP design process (Level 1) design solutions obtained from a
robust goal weighting scheme are more robust than design solutions achieved based on
non-robust goal weighting. As the designer progresses through the design process (Level
2), the robust and non-robust design solutions begin to have similar levels or robustness.
Then, late in the design process (Level 3) design solutions from a non-robust weighting
scheme are actually more robust than design solutions from a robust weighing scheme.
This unexpected trend in multilevel design is attributed to the mapping functions which
control what information is passed to subsequent design decisions and set the tone for
design solutions later in the design process. Based on design information presented in

187
this section, should multilevel robustness be omitted from multilevel design processes
because it is unpredictable and difficult to attain? No, if anything, the previous section
serves to illustrate the significant impact of propagated process chain uncertainty
introduced by mapping functions in multilevel design, indicating that there remains a
great need for robustness in multilevel design. Information presented in the previous
section reiterates the impact of mapping functions in reaching desirable multilevel design
solutions. Based on the previous section, with the incorporation of a multilevel
robustness approach in multilevel design, the designer is encouraged to devote significant
effort in mapping function design as a key component of a multilevel design process.
Inductive vs. Deductive BRP Design Approach
In the following section, BRP design solutions attained from an inductive multilevel
design approach and a deductive design approach are compared. Recall that in an
inductive design approach design decisions are made in a top-down or general-to-specific
manner. In BRP multilevel inductive design, design decisions are first made at the
simplest design level (Level 1). Then design information from general models is used in
making more specific or complex design decisions. In a deductive design approach,
design decisions are made in a bottom-up or specific-to-general way. In BRP deductive
design, a BRP design solution is reached at Level 3 without the addition of design
information from more general models. With 11 design variables, BRP design is
sifficiently complex to benefit from a multilevel design approach without necessitating its
use. BRP design at Level 3 can be directly solved using analytical equations describing
BRP performance and a computational solution-finding algorithm. In Table 5.21 and
Table 5.22 BRP Level 3 design information is compared for a deductive and inductive
design solution approach.

188
Table 5.21 – Inductive vs. deductive BRP performance at Level 3
Performance Deductive Inductive Units
back face sheet deflection (δ) 1.9 1.5 cm
mass / area (M) 133 131 kg/m2
variation of deflection (∆δ) 1.2 0.9 cm
variation of mass / area (∆M) 17 19 kg/m2
Relative density of core (Rc) 0.67 0.73 unitless
Table 5.22 – Inductive vs. deductive BRP design solution at Level 3
Design Variable Deductive Inductive Units
σy,f 614 1064 MPa
σy,b 689 1063 MPa
σy,c 612 1075 MPa
ρf 3758 3163 kg/m3
ρb 3582 3156 kg/m3
ρc 2200 2384 kg/m3
hf 12 12 mm
hb 13 12 mm H 27 26 mm B 12 7 mm
hc 5 5 mm
As seen in Table 5.21, in general, BRP design goals are more closely achieved when
using an inductive design approach. However, BRP performance for an inductive design
approach and direct calculation are similar. Comparing BRP design solutions from Table
5.22, it is observed that material property data (σy) and geometric data (B) for the two
design scenarios are significantly different. Since each design scenario produces similar
BRP performance it is concluded that differences in design variable data indicate
different by comparable solutions in BRP design space.
In summary, the above design comparison indicates that while implementing an inductive
and deductive solution path in BRP design produces different design solutions, the design
solutions measure remarkably similar performance. This realization adds value to the

189
inductive design approach. In complex BRP design, an inductive design approach
simplifies the design process by limiting the design space at complex design levels.
Based on the information in the previous section, it is observed that an inductive solution
path in which complex design space is limited does not inversely affect the overall
performance of the attained BRP design solution.
5.3 VERIFICATION AND VALIDATION BASED ON BLAST RESISTANT
PANEL DESIGN
The following section contains evidence for the verification and validation of the
template-based approach to multilevel design presented in Chapter 3 by considering the
design of blast resistant panels. First, the domain-specific structural validity is examined
by investigating the appropriateness of the BRP design problem in adding value to the
verification and validation of the multilevel design template. Then, the domain-specific
performance validity of the multilevel design template is examined in by looking at the
solutions obtained from completing the BRP example problem in Chapter 5. Appendix D
contains information regarding the validation of computational design tools used in
solving the BRP design problem.
Recall the Validation Square discussed in detail in Chapter 2. To summarize, the
Validation Square is a construct used in the verification and validation of design methods.
In an attempt to facilitate a systematic approach for the validation of design methods, the
Validation Square is divided into four sections. Recall that the sections of the Validation
Square dealing with the application of the proposed design method to example problems
include domain-specific structural validity and domain-specific performance validity. In
the following sections, ways in which completing the BRP example problem add value to
the domain-specific structural validity and domain-specific performance validity of the
developed multilevel design template are presented.
190
Both the cantilever beam example problem (Chapter 4) and the BRP example problem
(Chapter 5) are used in testing the domain-specific structural validity and domain-specific
performance validity of the developed multilevel design template. The cantilever beam
example problem is chosen because of the simplified nature of the problem. Initially, the
cantilever beam example problem is used to refine the developed multilevel design
template. After the final template is developed, the cantilever beam example problem is
used to illustrate the concepts of template base multilevel robust design in a rather
idealized environment. However, the domain-specific structural validity and domain-
specific performance validity are not satisfied by considering only the simplified
cantilever beam example problem. The BRP example problem is included in this thesis
because it is used to illustrate the effectiveness of a template-based approach to
multilevel robust design in a more complex design environment. The results of the
cantilever beam example problem and the BRP example problem combine to provide
domain-specific structural validity and domain-specific performance validity to the
developed multilevel design template.
5.3.1 Domain-Specific Structural Validity
Domain-specific structural validity relates to the appropriateness of the selected example
problem and the designer is prompted to ask the question “Is the example problem used
in demonstrating the method an appropriate choice?”. It is asserted that the BRP example
problem is an appropriate choice for testing the effectiveness of the developed multilevel
design template for because the BRP problem possesses the following characteristics:
Clearly Defined Design Problem
The BRP design problem contains clearly defined design variables, bounds on design
variables, constraints, goals, and preferences. Each of these descriptions is needed for the
successful implementation of the multilevel design template. Additionally, material
property mappings and uncertainty mappings are known or easily determined for the BRP

191
design problem. The multilevel robust design temple is developed for a design
environment in which design requirements, bounds, constraints, goals, and preferences
are clearly known.
BRP Design is Multilevel in Nature
The BRP design problem is multilevel in nature. The separation of levels in the BRP
design problem involved determining various levels of model complexity. The specified
levels of model complexity are implemented at various levels in the multilevel design
template. While single-level design problems could be solved using the multilevel design
template (the designer would consider only one level in the design process) in order to
test the full range of effectiveness of the multilevel design template, analysis of
multilevel design problem is needed.
Phenomena in BRP Design at Various Levels Affect BRP Performance
Any design problem can be divided into various levels and labeled a multilevel design
problem. However, it is important that phenomena affecting product performance occurs
at each level and is captured in descriptive models at each level. Otherwise, the cost of
analyzing a design problem at multiple levels does not yield any design benefit. In other
words, dividing a design problem into various levels should be done for a reason. If the
designer is not interested in or cannot model the relevant phenomena at a specific level,
then that particular level should not be included in design analysis because no value is
added. For the BRP design problem, each level of model complexity considered
contained valuable information relating the complexity of a performance model to the
accuracy of a performance prediction. Therefore, not only is the BRP a multilevel design
problem, be each level considered adds value to the overall BRP product design process.
192
Uncertainty in BRP Design Problem is Characterized
All design problems contain uncertainty. However, in order to design a robust solution,
the uncertainty in a design problem must be sufficiently characterized. In the BRP design
problem, there are numerous sources of uncertainty. In an attempt to account for design
uncertainty without over-complicating the design process, uncertainty in the BRP design
problem is modeled as uncertainty in loading conditions and uncertainty in material
properties. Because models describing the uncertainty in the BRP design problem are
developed, robust design techniques can be employed to develop a robust design solution.
Robust design is a key element in the developed multilevel design template. The BRP
example problem is appropriate choice in testing this aspect of the developed design
template.
5.3.2 Domain-Specific Performance Validity
Domain-specific structural validity relates to the outcome of applying the method to an
example problem and is used to ask the question “Does the application of the method to
the example problem produce useful results?”. To adequately address this question two
topics are considered: the usefulness of the numerical results and the overall usefulness of
the multilevel design template.
Appropriateness of BRP Design Solutions
When solving a BRP robust design problem, the results obtained are reasonable. That is,
the solution to design variables and the predicted BRP performance agree with what is
intuitively expected. However, due to the complex nature of BRPs, many aspects of
design performance are too complicated to follow a designer’s intuition. Based on a
comparison of BRP performance results given in Section 5.5, it is shown that BRP
performance predictions at various levels of model complexity are within an acceptable
range of error. Also, BRP performance data at each level of model complexity agrees

193
with BRP performance equations detailed in the work of Hutchinson and Xue, 2005. For
future work, it is beneficial to compare BRP performance measurements calculated using
analytical models with BRP performance determined using a finite element analysis
computational tool.
Starting Point Analysis for BRP Multilevel Design
The internal consistency of the numerical BRP design solution is also tested with a
starting point analysis. The BRP example problem is solved using an optimization
routine at each design level. Therefore, it is important to determine if the selected
starting point at each level results in a robust, stable solution that most closely meets
design goals. A starting point analysis that implemented ten different starting points is
completed for each design level. The starting points are at 10% increments of the design
variable bounds. BRP performance is measured at each starting point. The starting point
analysis for each level of BRP design is given in Figure 5.14 – Figure 5.16.
Starting Point Analysis - Deflection
0
0.02
0.04
0.06
0.08
0.1
0 20 40 60 80 100
Starting Point (%)
De
flect
ion
(m)
Deflection Delta Deflection
Starting Point Analysis - Mass / Area
0
50
100
150
0 20 40 60 80 100
Starting Point (%)
Ma
ss /
Are
a (
kg/m
^2)
Mass Delta Mass
Figure 5.14 – BRP starting point analysis – Level 1

194
Starting Point Analysis - Deflection
0
0.02
0.04
0.06
0.08
0.1
0 20 40 60 80 100
Starting Point (%)
De
flect
ion
(m
)
Deflection Delta Deflection
Starting Point Analysis - Mass / Area
0
50
100
150
0 20 40 60 80 100
Starting Point (%)
Ma
ss /
Are
a (
kg/m
^2)
Mass Delta Mass
Figure 5.15 – BRP starting point analysis – Level 2
Starting Point Analysis - Deflection
0
0.02
0.04
0.06
0.08
0.1
0 20 40 60 80 100
Starting Point (%)
De
flect
ion
(m
)
Deflection Delta Deflection
Starting Point Analysis - Mass / Area
0
50
100
150
0 20 40 60 80 100
Starting Point (%)
Ma
ss /
Are
a (
kg/m
^2)
Mass Delta Mass
Figure 5.16 – BRP starting point analysis – Level 3
For BRP design at Level 1, all starting points result in a stable design solution. In BRP
design at Level 2, the starting points that result in the most stable design solutions occur
after 40% of design variable bounds. For BRP design at Level 3, starting at 20% of
variable bounds results in an unstable design solution, and this starting point should be
avoided. The starting point selected for design at each level is the midpoint of each
design variable bound (50%). As seen in the previous figures, this results in stable BRP
performance at each design level.

195
Pareto Curves for BRP Multilevel Design
Recall that for BRP design there are four goals: (1) minimize deflection, (2) maximize
robustness considering variation in deflection, (3) minimize mass / area, and (4)
maximize robustness considering variation in mass / area. For BRP design solutions,
each goal is weighted equally at Wi = 0.25. Additional goal weighting schemes are
employed to determine Pareto curves for BRP design at Level 3 in order to identify the
relationships between the four goals. Eleven weighting schemes are used to compare two
design goals such that the goal weighting for the first goal varies from 0 to 1 at
increments of 0.1, while goal weighting for the second goal varies from 1 to 0 at
increments of 0.1 (while all remaining goals held constant at zero). Pareto curves in
Figure 5.17 represent all possible comparisons of BRP goals, examined in pairs [(a) M vs.
δ, (b) ∆δ vs. δ, (c) ∆M vs. M, (d) ∆M vs. δ, (e) ∆δ vs. M, (f) ∆M vs. ∆δ]. Two graphs are
given for each comparison including a graph displaying all eleven data points and a graph
in which outliers are removed. Pareto graphs with outliers removed are used to observe
the general relationship between the compared goals when extreme data points may
hinder the realization of overall data trends. In Appendix E, data points with
corresponding goal weighting scenarios are presented for each graph in Figure 5.17.
Pareto Curve with all Design Points
130.5
130.6
130.7
130.8
130.9
131
1.43 1.44 1.45 1.46 1.47
Deflection (cm)
Ma
ss /
are
a (
kg/m2 )
Pareto Curve without Outliers
130.96
130.964
130.968
130.972
130.976
1.435 1.44 1.445 1.45 1.455
Deflection (cm)
Mas
s / a
rea
(kg
/m2 )
(a.1) (a.2)
Figure 5.17 – BRP Pareto curves for Level 3 BRP design

196
Pareto Curve with all Design Points
0.9
0.904
0.908
0.912
0.916
1.43 1.435 1.44 1.445 1.45 1.455
Deflection (cm)
Var
iatio
n of
De
flect
ion
(cm
)
Pareto Curve without Outliers
0.9128
0.9136
0.9144
0.9152
1.447 1.448 1.449 1.45 1.451
Deflection (cm)
Va
riatio
n of
Def
lect
ion
(c
m)
(b.1) (b.2)
Pareto Curve with all Design Points
16
17
18
19
20
124 126 128 130 132
Mass / area (kg/m2)
Var
iatio
n of
Mas
s /
are
a
(kg/
m2 )
Pareto Curve without Outliers
18.92
18.96
19
19.04
130 130.5 131 131.5
Mass / area (kg/m2)
Va
riat
ion
of
Ma
ss /
are
a
(kg/
m2 )
(c.1) (c.2)
Pareto Curve with all Design Points
19
19.01
19.02
19.03
19.04
1.445 1.45 1.455 1.46
Deflection (cm)
Va
riat
ion
of M
ass
/ a
rea
(kg
/m2 )
Pareto Curve without Outliers
19.032
19.034
19.036
19.038
1.446 1.448 1.45 1.452
Deflection (cm)
Va
riatio
n of
Ma
ss /
are
a
(kg/
m2 )
(d.1) (d.2)
Figure 5.17 (continued) – BRP Pareto curves for Level 3 BRP design

197
Pareto Curve with all Design Points
0.89
0.9
0.91
0.92
0.93
130.4 130.6 130.8 131 131.2
Mass / area (kg/m2)
Va
riat
ion
of D
efle
ctio
n (c
m)
Pareto Curve without Outliers
0.896
0.904
0.912
0.92
130.95 131 131.05 131.1 131.15
Mass / area (kg/m2)
Va
riatio
n o
f D
efle
ctio
n (c
m)
(e.1) (e.2)
Pareto Curve with all Design Points
18.9
19
19.1
19.2
0.84 0.86 0.88 0.9 0.92
Variation of Deflection (cm)
Va
riatio
n of
Mas
s /
are
a
(kg
/m2 )
Pareto Curve without Outliers
18.9
19
19.1
19.2
0.9 0.905 0.91 0.915 0.92
Variation of Deflection (cm)
Va
riatio
n o
f M
ass
/ a
rea
(kg/
m2)
(f.1) (f.2)
Figure 5.17 (continued) – BRP Pareto curves for Level 3 BRP design
In Figure 5.17 (a.1), (a.2) comparing mass / area vs. deflection, a slight inverse
relationship is detected, best shown in graph (a.2) with outliers removed. That is, as mass
/ area decreases, panel deflection increases. This trend agrees with designer intuition and
is observed in BRP design space exploration in that smaller deflection values can be
obtained by increasing the mass / area constraint. Graphs (b.1), (b.2) and (c.1), (c.2) in
Figure 5.17 display a comparison of variation in deflection vs. deflection and variation in
mass / area vs. mass / area, respectively. For each of these comparisons, a loose direct
relationship between BRP performance and BRP variation of performance is observed,
illustrating that as performance increases, variation in performance also increases. As

198
shown in Equation 5.30 and Equation 5.31, variation of performance is a function of BRP
performance (δ, M). Therefore, it follows that a change in BRP performance would result
in a change in variation in performance, and based in graphs (b.1), (b.2) and (c.1), (c.2) in
Figure 5.17, it is shown that the compared quantities are directly related. In graphs (d.1),
(d.2), (e.1), (e.2), (f.1), and (f.2) in Figure 5.17 no conclusive relationships are detected
among the compared quantities. This indicates to the designer that there is little
correlation between variation in mass / area vs. deflection, variation in deflection vs.
mass / area, and variation in mass / area vs. variation in deflection.
Outliers in Figure 5.17 are not simply disregarded in Pareto curve analysis. In fact, these
outliers may give the designer an indication of the “best” weighting scenarios for
achieving design goals. In Appendix E, outliers are highlighted in grey and most often
occur at weighing scenarios in which one goal is weighted significantly greater than
another goal. In Table 5.23, outliers from the six Pareto graphs in Figure 5.17 are shown
with goal weighting and BRP performance information included. Notice that, with the
exception of outliers in rows 4 and 8, outliers tend to occur when one goal is weighted
significantly greater than the other goal.
Table 5.23 – Pareto frontier data outlier analysis
Row Weight, Goal X Weight, Goal Y Performance X Performance Y 1 Wδ = 0.2 WHD-EMIδ = 0.8 δ = 1.45 cm ∆δ = 0.90 cm 2 Wδ = 0.1 WHD-EMIδ = 0.9 δ = 1.44 cm ∆δ = 0.90 cm 3 Wδ = 0 WHD-EMIδ = 1 δ = 1.43 cm ∆δ = 0.91 cm 4 WM = 0.4 WHD-EMIM = 0.6 M = 125.02 kg/m2 ∆M = 16.90 kg/m2 5 Wδ = 0 WHD-EMIM = 1 δ = 1.46 cm ∆M = 19.01 kg/m2 6 WM = 1 WHD-EMIδ = 0 M = 130.53 kg/m2 ∆δ = 0.92 cm 7 Wδ = 0 WM = 1 δ = 1.46 cm M = 130.53 kg/m2 8 WHD-EMIδ = 0.6 WHD-EMIM = 0.4 ∆δ = 0.86 cm ∆M = 18.98 kg/m2
From the first three rows of data in Table 5.23, an interesting and unexpected design
trend is observed. BRP design solutions with low values of deflection and low values of

199
variation in deflection are observed when the robustness goal related to variation in
deflection (HD-EMIδ) is weighted significantly higher than the deflection goal.
Additionally, in row 4 it is observed that the mass / area and robust goal relating to mass /
area are best achieved when the robustness goal is weighted slightly higher than the mass
/ area performance goal. Based on weighing schemes that best achieve design goals (row
3, row 4 in Table 5.23), a goal weighting scenario incorporating all four design goals is
developed. The weighing scenario and design solution (compared to the design solution
with design goals equally weighted at Wi = 0.25) is presented in Table 5.24.
Table 5.24 – Weighting scheme to best achieve design goals based on Pareto curves
SCENARIO A: Priority based on Pareto curves SCENARIO B: Equal priority for each design goal Weight Performance Weight Performance
Wδ = 0 δ = 1.45 cm Wδ = 0.25 δ = 1.45 cm WHD-EMIδ = 0.5 ∆δ = 0.92 cm WHD-EMIδ = 0.25 ∆δ = 0.91 cm WM = 0.2 M = 130.97 kg/m2 WM = 0.25 M = 130.97 kg/m2 WHD-EMIM = 0.3 ∆M = 19.03 kg/m2 WHD-EMIM = 0.25 ∆M = 19.03 kg/m2
The two weighting schemes in Table 5.24 yield similar BRP performance levels.
However, notice that in Scenario A in Table 5.24 the deflection goal is not considered in
reaching a design solution (Wδ = 0) leading to the reasonable conclusion that the deflection
goal has little effect in achieving BRP performance and robustness goals. Also, it is
observed that the robustness goal related to variation in deflection is significant in
achieving design solutions that best meet design goals. Such conclusions, which are
beyond designer intuition, could be useful starting points when developing weighting
schemes for BRP design at increased levels of model complexity.
Usefulness of Multilevel Template in BRP Design
Now that evidence supports the validity of the multilevel BRP design solutions, it is
important to identify if the multilevel design template is useful in BRP design. Simply
obtaining valid solutions from implementing the multilevel design template is not

200
sufficient for it domain-specific performance validity. The benefits experienced from
implementing the multilevel design template in BRP design should also be investigated.
The usefulness of applying the multilevel design template to the BRP example problem is
demonstrated in decreased design complexity and computation cost observed in
completing the example problem. As BRP model complexity decreased from a BRP
modeled with three layers with a honeycomb core to a BRP modeled as a single panel,
the number of design variables decreased from 11 to 3. Also, BRP performance
calculations are significantly less complex for the BRP modeled at the lowest level of
complexity compared to similar equations for a BRP modeled at the highest level of
complexity considered in this design problem. This reduction in performance modeling
is made possible by relatively simple mapping functions describing the relationship of
material properties and uncertainty models throughout all levels in the BRP design
problem. By applying mapping functions, the designer can travel (inductively and
deductively) throughout all levels of the BRP design problem at low computation cost.
To summarize, the template-based approach to multilevel robust BRP design is a
valuable design strategy because the complexity of the design problem was decreased
leading to agile design space exploration; and at low computation cost, mapping
functions are used to travel throughout the multilevel design problem in both a top-down
and bottom-up path. A visual representation of the value added to the verification and
validation of the developed design template provided in Chapter 5 is shown in Figure
5.18.

201
Domain-Independent Structural Validity
Internal consistency of design method
Is the design method internally consistent?
Domain-IndependentPerformance Validity
Ability to produce useful results beyond the chosen example problems.
Does the application of the method to other problems produce practical results?
1
2 3
4
CHAPTERS 4 and 5 CHAPTERS 4 and 5
CHAPTERS 2 & 3 CHAPTERS 3 and 6
Domain-Specific Structural Validity
Domain-Specific Performance Validity
CHAPTERS 4 and 5 CHAPTERS 4 and 5
Cantilever beam and BRP example problems are clearly defined and multilevel in nature
Applying the multilevel design template to example problems produce useful results
Variables
Bounds
Constraints
Goals
Preferences
Performance Model
Response
Single Scale Design Template
Figure 5.18 – Value added to verification and validation of design template – Chapter 5
5.4 SYNOPSIS OF CHAPTER 5
The completion of the BRP design problem adds value to the validation of the multilevel
design template. It is shown that the developed design template can be applied to
complex and uncertain design problems with desirable results. Recall that in Chapters 1
and 2 the context for this thesis is set by a discussion of multilevel design, design
uncertainty, robust design, and template-based design. In Chapter 3, the multilevel
design template, based on IDEM, is presented and discussed. In Chapters 4 and 5 the
multilevel design template is applied to example problems in order to prove its logical
flow of information and usefulness in the design environment. In Chapter 6, the thesis
concludes with a summary of the validation of the multilevel design template based on
the Validation Square. Closing comments relating to the general benefits of a template-

202
based approach to multilevel design, as well as the intellectual contributions presented in
this thesis are discussed.

203
CHAPTER 6
METHOD VALIDATION AND CLOSING STATEMENTS
Chapter 6 begins with a discussion of the intellectual contributions presented in this
thesis, which include the development of a multilevel design template for achieving
inductive, multilevel, robust design solutions and the application of the design template
for multilevel BRP design. Next, the verification and validation of the multilevel design
template is examined using the Validation Square construct. Components of method
validation presented throughout this thesis are brought together in order to asses the
overall validity of the multilevel design template. Chapter 6 concludes with a discussion
of opportunities for improvement related to the information presented in this thesis.
Future work related to the multilevel design template and the application of the multilevel
design template in the example problems are discussed. Improvements in the multilevel
design template and the example problems lead to a discussion of how a template-based
design approach can gain increasing influence in the design community. At the
conclusion of Chapter 6, lessons learned from developing and implementing the
multilevel design template are discussed. A summary of the information presented in
Chapter 6 is given in Table 6.1, and Chapter 6 in relation to the remainder of this thesis is
illustrated in Figure 6.1.
Table 6.1 – Summary of Chapter 6
Heading / Sub-Heading Information Intellectual Contributions Based on Answering Research Questions Development of a Multilevel
Design Template Research contributions include:
- Adapting IDEM to a template-based environment - Multilevel defined by levels of model precision /
complexity Application of Design Template
to Multilevel Design of BRPs Multilevel design template is particularized for BRP design and a multilevel robust BRP design solution is obtained

204
Table 6.1 (continued) – Summary of Chapter 6
Verification and Validation of Multilevel Design Template Quadrant 1 - DISV Is the multilevel design template internally consistent? Quadrant 2 - DSSV Are the example problems appropriate choices? Quadrant 3 - DSPV Does the application of the multilevel design template to the
example problems produce useful results? Quadrant 4 - DIPV Can it be assumed that the multilevel design template could be
applied to additional example problems with positive results? The Validation Square –
Bringing It All Together Confidence built in the overall validation of the multilevel design template based on 4 quadrants of the Validation Square
Opportunities for Improvement Future Work Related to
Multilevel Design Template - Particularizing the generic multilevel design template
for example problems - A closer look model complexity in multilevel design - New methods for incorporating robustness in
multilevel design template Future Work Related to
Example Problems - Future work for cantilever beam example problem - Future work for BRP example problem
Vision for Template-Based Engineering Design of the Future
Opportunities for advancement in template-based multilevel robust design of the future:
- Collaborative, distributive template-based design - Design template database
Lessons leaned Chapter 6 Synopsis
Concluding thoughts:• Intellectual contribution to engineering design research and BRP design• Method validation based on Validation Square• Future work relating to template-based design and example problems
Robust Design
Multilevel Design
Design Uncertainty
Design Templates
MO
TIV
AT
ION
ME
TH
OD
AN
ALY
SIS
CLO
SU
RE
1 – Motivation 2 – Literature Review
4 – Cantilever Beam
6 – Method Validation
5 – Blast Resistant Panel
3 – Theoretical Foundations
Figure 6.1 – Setting the context for Chapter 6

205
6.1 INTELLECTUAL CONTRIBUTIONS BASED ON ANSWERING RESEARCH
QUESTIONS
In Section 6.1, the key research contributions of this thesis are discussed. The research
contributions are divided into two categories corresponding to the primary and secondary
research hypotheses. Key research contributions in this thesis include the development of
a multilevel design template (Section 6.1.1), and the application of the robust design
template in multilevel robust BRP design (Section 6.1.2). An overview of research
contributions in this thesis is presented in Table 6.2.
Table 6.2 – Research contributions of this thesis
Research contributions in template-based multilevel design (Primary RQ) Added value to the study of multilevel robust design by combining it with
concepts of template-based design §3.1, §3.2
Defined design problems according to levels of model complexity or resolution in multilevel design and analysis
§1.1, §2.1
Developed multilevel design template based on existing design tools: the cDSP and IDEM
§2.3.3, §3.1, §3.2
Infused a multiscale robust design approach in the multilevel design template §2.2.3, §3.1, §3.2 Compiled a glossary of key terms relating to template-based multilevel robust
design Glossary of Key Terms at beginning of thesis
Verified multilevel design template using the Validation Square §3.3, §6.2 Research contributions in BRP design (Secondary RQ)
Illustrated the multilevel nature of the BRP problem, and divided it according to levels of model complexity
§5.1
Particularized the multilevel design template for BRP design §3.2.3, §5.2.1 Developed BRP performance models for each level, implemented performance
models in MATLAB §5.2.2, Appendix C
Developed mapping functions linking BRP design information among various levels in multilevel BRP design
§5.2.2
Adapted a multilevel robust design method (IDEM) for the robust multilevel design of BRPs
§3.1.3, §5.2.2, §5.2.3
Determined inductive BRP design solution robust to variation in material properties and loading conditions
§5.2.3
6.1.1 Development of a Multilevel Design Template
Recall the primary research question and hypothesis addressed in this thesis from Section
1.3.1 which is restated below:

206
The primary research hypothesis outlines the key research contribution in this thesis—the
development of a template-based approach to multilevel robust design. In response to the
primary research question, a multilevel design template is created in order to capture and
store information from a multilevel design process in a reusable format. The unique
research contributions inherent in the multilevel design template are the transformation of
an existing design method to a template-based design environment and the categorization
of a multilevel design process based on degrees of model complexity. These unique
research contributions are discussed in the following paragraphs.
Adapting an Existing Design Method for a Template-Based Design Approach
The multilevel design template is adapted from two existing design constructs: the cDSP
and IDEM. Recall that IDEM is a multilevel robust design method which, in its original
form, is not well-adapted for a template-based design environment (Choi, et al. 2005). A
key research contribution in this thesis is the adaptation of IDEM to a multilevel design
template capable of collecting and storing design information in a multilevel design
process. The multilevel design template is based on the structure of the cDSP, which is
organized under the headings of Given, Find, Satisfy, and Minimize. In order to capture
the procedural steps of IDEM in a design template construct based on the cDSP, two
Primary Research Question
How can information regarding multilevel robust design processes be captured and
stored in a reusable format?
Primary Research Hypothesis
Information regarding robust multilevel design processes can be captured and stored
in a reusable format by developing generic, reusable, computer executable design
templates based on the Compromise Decision Support Problem (cDSP) and Inductive
Design Exploration Method (IDEM).

207
additional headings (Define and Map) are added. The multilevel design template
provides a generic framework for multilevel design problems. The multilevel design
template can be particularized for a variety of multilevel design problems in order to
guide a designer in multilevel decision-making. Additionally, a multilevel robustness
goal (based on IDEM) is easily incorporated in the multilevel design template in order to
achieve multilevel design solutions that are robust to propagated process chain
uncertainty.
Defining Complex Systems According to Levels of Model Complexity
Another key research contribution realized in the development of a multilevel design
template is a method of dividing a complex design problem according to levels of model
precision. In the materials design community, multiscale material modeling and design
processes are divided according to material behavior at different length scales, or time
scales. In this thesis, multiscale modeling according to length or time scales is extended
beyond the material modeling community to include the division of complex design
problems based on model precision or complexity. Prediction models with high precision
are often characterized by high complexity, and low precision models tend to be less
complex. In this thesis, complex multilevel design problems are divided according to
levels of model abstraction in order to facilitate agile design space exploration by using
approximation models of complex system behavior. This contribution involves adapting
a proven modeling technique from the materials design community (multiscale modeling)
and abstracting it for application in a broad range of complex systems design.
Limiting Design Space Using Mapping Functions
An additional intellectual contribution presented in this thesis is a framework to achieve
satisficing design solutions to complex design problems by limiting design space at
complex design levels via mapping functions. For complex multilevel design problems
with many design variables, it is impractical to thoroughly explore the entire design space

208
in order to find the optimum design solution. One of the key advantages of the multilevel
design template is that it is used to identify regions of the design space for which a
satisficing design solution is likely to exist. The multilevel template-based design
procedure begins by determining a design solution at the simplest level of model
complexity, Level 1. Then, design information from Level 1 is passed to the level with
slightly increased model complexity, Level 2, via a predetermined mapping function.
The design space at Level 2 is limited by setting additional design constraints such that
the Level 2 design solution behaves similarly to the Level 1 design solution. In this way,
design space at Level 2 is limited to include only design points that are known to have
desirable performance based the Level 1 design solution. Once a Level 2 design solution
is determined, design information from Level 2 is passed to Level 3 using specified
mapping functions. This method of passing design information from more simple design
levels to more complex design levels is continued until a multilevel design solution is
determined at the most complex design level of interest. An interesting trade-off is
noticed in the multilevel design template. By limiting design space at complex design
levels, there is a risk of excluding the “best” design solution from the feasible search
region, therefore selecting a sub-optimum design solution. However, in many cases, fully
exploring the design space of a complex design problem is impractical, if not impossible.
The design approach presented in the multilevel design template provides a method for
limiting the design space based on multilevel system knowledge gained at less complex
design levels. Recall from Section 2.2 that the multilevel design template is based on the
key concept of robust design, a design approach in which satisficing, rather than optimum,
design solutions are selected in order to achieve design performance that is predictable in
the presence of uncertainty. Limiting the design space and possibly excluding the
optimum design solution from the searchable design region is not a setback for the design
approach presented in the multilevel design template. The design approach in the

209
multilevel design template is used to determine satisficing robust design solutions that
acceptably achieve design goals, rather than the optimum design solution.
6.1.2 Application of Multilevel Design Template to Blast Resistant Panel Design
The secondary research question and hypothesis are restated from Section 1.3.1:
The second key contribution in this thesis is the application of the multilevel design
template to the design of BRPs. With significant design complexity, BRP design is
modeled as a multilevel design process. Additionally, uncertainty in BRP loading
conditions and material properties is clearly stated in the problem definition such that a
multilevel robust design solution is achieved. The multilevel design template is
particularized for BRP design by developing computer-executable design modules
predicting BRP performance. Following the structure of the multilevel design template,
the BRP design problem is divided into three levels of model complexity. BRP
performance models are developed for each level and mapping functions are created to
exchange information between each level. Based on IDEM, design solutions at each
level are robust to uncertainty in material properties, loading conditions, and multilevel
process chain. In practice, BRP performance models are developed in MATLAB.
Secondary Research Question
How can information regarding the robust multilevel design of blast resistant panels
by captured and stored in a reusable, computer-executable format?
Secondary Research Hypothesis
By particularizing a generic multilevel design template for the multilevel robust
design of blast resistant panels and translating design process information to
computer-interpretable modules, information regarding the robust multilevel design
of blast resistant panels can be captured and stored in a reusable, computer-executable
format.

210
Information is shared among each level such that the robust design solution at one level
becomes input information for design at another level. Once BRP performance models
and mapping functions are in place, an inductive robust design solution is determined.
That is, BRP design decisions are made starting at the least complex level moving
towards the most complex level. Information at each stage and in each level of the
design process is stored in reusable, modular, computer-executable sub-templates
facilitating BRP design space exploration for future design investigation.
6.2 VERIFICATION AND VALIDATION OF MULTILEVEL DESIGN TEMPLATE
The verification and validation of the multilevel design template is examined using the
Validation Square construct. The Validation Square is introduced in Chapter 1 as a
systematic procedure for building confidence in the validity of design methods. Evidence
for method validation is presented at the end of Chapter 3 – Chapter 5 based on
theoretical foundations of the multilevel design template and successful application of the
template to example problems. In Chapter 6, aspects of method validation presented
throughout the thesis are combined to build confidence in the validation of the multilevel
design template, shown in Figure 6.2.
The verification and validation of the multilevel design template is established by
examined the four quadrants of the Validation Square. A summary of method validation
is presented in Table 6.3.

211
Domain-Independent Structural Validity
Domain-Specific Structural Validity
Domain-IndependentPerformance Validity
Domain-Specific Performance Validity
1
2 3
4
Multilevel robust design template is based on existing multilevel robust design method.
CHAPTERS 2 and 3
CHAPTERS 4 and 5 CHAPTERS 4 and 5
CHAPTERS 3 and 6
Variables
Bounds
Constraints
Goals
Preferences
Performance Model
Response
Single Scale Design Template
Cantilever beam and BRP example problems are clearly defined and multilevel in nature
Applying the multilevel design template to example problems produce useful results
V ariables
Bounds
Constraints
Goals
Preferences
Performance Model
Response
Single Scale Design Template
The successful implementation of the template to different design problem, and its modular, flexible nature make it a good candidate for other design problems
Variables
Bounds
Constraints
Goals
Preferences
Performance Model
Response
Single Scale Design Template
Figure 6.2 – Verification and validation of this thesis using the Validation Square
Table 6.3 – Summary of verification and validation of multilevel design template
presented in this thesis
Domain-Independent Structural Validity • Critical review of literature that is foundational to the multilevel design template • Topics include multilevel design, robust design, and template-based design • Examination of the way in which foundational topics are combined in multilevel design
template
Ch. 2
• Presentation and discussion of an existing multilevel robust design method, IDEM, used as the base method in the multilevel design template
• Development of the multilevel design template • Information flow chart illustrates adequate input information for each step in multilevel
design template, and adequate output information for subsequent steps
Ch. 3
Domain-Specific Structural Validity • Identification of example problems similar to design problems for which the multilevel design
template is intended • Example problems include:
o Design of a cantilever beam and its associated material o Design of a blast resistant panel
• Example problems are multilevel in nature (concurrent product and materials design) • Example problems contain well-defined design variables, constraints, bounds, goals, and
uncertainty models • Design solution provide sufficient information for analyzing the effectiveness of the design
template
Ch. 4, 5

212
Table 6.3 (continued) – Summary of verification and validation of multilevel design
template presented in this thesis
Domain-Specific Performance Validity • Obtained solutions match designer intuition • Validity of numerical solutions tested with a starting point analysis • Internal consistence of cantilever beam and BRP performance models analyzed by varying
input information to determine if models behave similar to physical systems
Ch. 4, 5
Domain-Independent Performance Validity • Multilevel design template has its foundations in a template-based approach to engineering
design • Generic design templates are built for application in a variety of design problems with the
expectation of design-template reuse
Ch. 3
• Both example problems presented in this thesis are multilevel in nature • Confidence is built in the success of applying the multilevel design template for all multilevel
design problems
Ch. 6
6.2.1 Domain-Independent Structural Validity
Domain-independent structural validity relates to the internal consistency of the design
method. Recall from Section 1.4.1 in which several practical steps for asserting domain-
independent structural validity are presented. Such validation steps include a thorough
literature review of theoretical foundations of the method and an assessment of logical
information flow of the design method.
Literature Review of Method Theoretical Foundations
Theoretical foundations of the multilevel design template are presented in Section 2.1 –
2.3 and include a literature review of multilevel design, robust design, and template-
based design. Since the multilevel design template is based on well accepted, logical
research fields, this builds confidence in the internal consistency of the multilevel design
template. The multilevel design template is also based on an existing multilevel robust
design method, IDEM (Choi 2005). The internal consistency of IDEM is explored and
confirmed in its logical progression of information and successful implementation in
example problems (Choi 2005).

213
Once confidence is built in the structural validity of the theoretical foundations of the
multilevel design template, it is important to examine the way in which foundational
topics (multilevel design, robust design, and template-based design) are combined.
Theoretical foundations multilevel design and robust design are combined in order to
produce a multilevel robust design approach. Combining a class of engineering design
problems with a robust design technique is common in engineering design, as
demonstrated by the multilevel robust design base method, IDEM (Choi 2005), and this
combination preserves the internal consistency of each of the theoretical foundations.
Then, multilevel design and robust design are combined with template-based design to
develop a design template that supports the robust design of multilevel systems. One of
the inherent advantages of a template-based engineering design approach is to map out
design information flow in a form that is reusable and archival. That is, adapting an
existing design approach to a template-based environment does not affect its internal
consistency, it simply arranges and stores design method information in a reusable,
modular, and archival form.
Logical Information Flow of Method
An information flow chart in Figure 3.16 and the discussion that follows in Section 3.3.1
builds confidence in the logical progression of thought and information of the multilevel
design template. In Section 3.3.1, it is verified that for each step in the multilevel design
template there is adequate input information, and that adequate output information is
provided for subsequent steps in the design template. Additional confidence is built in
the logical information flow of the multilevel design template in the successful
implementation of the multilevel design template in two example problems (Chapter 4,
Chapter 5). By testing the multilevel design template using example problems, any
inconsistent or illogical information exchange would be indicated by an incomplete or
unexpected design solution.

214
6.2.2 Domain-Specific Structural Validity
Domain-specific structural validity is an analysis of the appropriateness of example
problems used to test the effectiveness of the method. Example problems should be
similar to the problems for which the method was developed, the example problems must
represent actual problems that the method would be applied to, and the example problems
must produce useful design solutions that can be used to asses the effectiveness of the
method.
In this thesis, the multilevel design template is applied to two example problems, the
design of a cantilever beam (Chapter 4) and the design of a BRP (Chapter 5). Each
problem is clearly defined with known design variables, constraints, goals, and bounds.
Each example problem is multilevel in nature demonstrating concurrent product and
materials design, and various levels of design models used to predict complex
phenomena. Additionally, each example problem contains quantifiable uncertainty. It is
asserted that since the example problems are clearly defined, multiscale in nature, and
have known uncertainty models, the example problems are similar to problems for which
the multilevel robust design method was developed and represent actual problems that the
method would be applied to. Appling the multilevel design template to the example
problems produces a multilevel design solution that is within specified constraints and
bounds. The multilevel design solution provides sufficient data to assess the
effectiveness of the multilevel design template based on design variables and design
performance. Comments relating to the domain-specific structural validity of the
multilevel design template are found in Section 4.3.2 and Section 5.3.1.
6.2.3 Domain-Specific Performance Validity
Domain-specific performance validity is established by applying the method to example
problems and testing its effectiveness. Two areas are addressed in order to establish

215
domain-specific performance validity: the usefulness of the numerical design solutions
and the overall usefulness of the multilevel design template. These two areas are
addressed in Section 6.2.3.
Usefulness of Numerical Results in Cantilever Beam and BRP Example Problems
Establishing the validity of numerical results is necessary to build confidence in the
domain-specific performance validity of the multilevel design template. If the numerical
results are not valid, then there is no way to assume that the application of the design
template to other design problems will produce useful results. In this thesis usefulness of
the numerical results are analyzed by conducting starting point analyses and examining
the internal consistency of the data. In BRP design Pareto plots and comparing robust vs.
non-robust design scenarios are also used to test the domain-specific performance
validity of the multilevel design template. In Section 4.3.2 and Section 5.3.2 the domain-
specific performance validity is analyzed based on the cantilever beam and BRP design
problems.
For the cantilever beam and BRP design problems, starting point analyses are conducted
at each design level. For cantilever beam design (Figure 4.3), it is discussed in Section
4.3.2 that various starting points for Level 1 design produce identical results. Cantilever
beam design at Level 2 and Level 3 is significantly more complex, and requires the use of
the finite element software, COMSOL. Due to the large number of design variables at
design Level 2 and Level 3, it is observed that in order to reach logical solutions the
starting points must be set to reflect the expected outcome of the design solution.
Expected trends in the design solution are left to the discretion of the designer; however,
for the cantilever beam example problem, it is fairly obvious that the stronger material
should be placed at the base of the beam where there is the greatest stress, and the
strength of the material decreases along the length of the beam in the direction of the free

216
end. Therefore, a rigorous starting point analysis is not conducted for cantilever beam
design at Level 2 and Level 3. But, the validity of the cantilever beam design solution is
established in the internal consistency of the numerical data.
For the BRP design problem (Figure 5.4), starting point analyses are conducted for
design at all three levels. For BRP design at Level 3, the starting point analysis revealed
one area of instability which is avoided when determining a BRP design solution at Level
3. Starting point analyses at Level 2 and Level 1 indicate stable design solutions for all
starting points. Due to its stability based on starting point analyses, the midpoint of
design bounds for all design points is used for the starting point in BRP design at all
levels. Based on the discussion in Section 5.3.2, it is asserted that the BRP starting point
analysis builds confidence in the validity of the numerical BRP design solution.
The second aspect of establishing the validity of the numerical solutions is testing
whether changes in input parameters produce results as expected from physical systems.
For the cantilever beam design problem, it is observed that increasing the load at the free
end increases beam deflection. Similarly, decreasing beam cross-sectional area increases
beam deflection, for constant loading conditions. In terms of beam material properties,
increasing the strength of the beam decreased beam deflection for constant loading
conditions. Based on these observations, it is asserted that the cantilever beam
performance models perform similarly to what is expected from a physical cantilever
beam under constant loading.
In a similar manner, changes in BRP input parameters are analyzed in order to test the
internal consistency of the performance models. Increasing BRP peak pressure load
increases BRP back face sheet deflection. Alternatively, increasing characteristic
impulse loading time increased back face sheet deflection. In terms of BRP material

217
properties, increasing material strength decreased BRP deflection. These results are
expected based on physical systems, therefore, adding value to the internal consistency of
the cantilever beam and BRP analysis models.
Additional tests are completed in order to explore BRP design space and add value to the
domain-specific performance validity of the multilevel design template based on BRP
design. BRP design space is more thoroughly explored using Pareto curves, robust vs.
non-robust design scenarios, and inductive vs. deductive solution path analysis discussed
in the following paragraphs:
Pareto curves (Section 5.3.2) – Pareto curves are created for BRP design at Level
3 in order to observe the relationship between various design goals while
incrementing goal weighing schemes. For BRP design each of the four design
goals is compared with all design goals resulting in eight Pareto plots each
comparing two design goals. By altering the weighing factors, relationships
between the compared goals are identified. In order to more clearly observe
trends in goal relationships, an additional graph is displayed for each goal
comparison in which outliers are excluded. In Figure 5.17 (a.1), (a.2) comparing
mass / area vs. deflection, a slight inverse relationship is detected, best shown in
graph (a.2) with outliers removed. That is, as mass / area decreases, panel
deflection increases. This trend agrees with designer intuition and is observed in
BRP design space exploration in that smaller deflection values can be obtained by
increasing the mass / area constraint. Graphs (b.1), (b.2) and (c.1), (c.2) in Figure
5.17 display a comparison of variation in deflection vs. deflection and variation in
mass / area vs. mass / area, respectively. For each of these comparisons, a loose
direct relationship between BRP performance and BRP variation of performance
is observed, illustrating that as performance increases, variation in performance
also increases. In graphs (d.1), (d.2), (e.1), (e.2), (f.1), and (f.2) in Figure 5.17 no

218
conclusive relationships are detected among the compared quantities of variation
in mass / area vs. deflection, variation in deflection vs. mass / area, and variation
in mass / area vs. variation in deflection.
Outlier points in BRP Level 3 Pareto graphs are analyzed in order to determine
the “best” weighting scheme to achieve design goals. BRP performance is
compared using the determined “best” weighing scheme and an equal weighting
scheme. Surprisingly, the “best” BRP weighting scheme places the greatest
emphasis on maximizing robustness with respect to variation in BRP deflection.
The goal of minimizing BRP deflection is weighted at zero. The two remaining
goals are weighted similarly. A comparison reveals similar BRP performance for
both weighting schemes. However, for the “best” weighting scenario the
deflection goal is not considered in reaching a design solution, leading to the
reasonable conclusion that the deflection goal has little effect in achieving BRP
performance and robustness goals. Also, it is observed that the robustness goal
related to variation in deflection is significant in achieving design solutions the
best meet design goals. Such conclusions, which are beyond designer intuition,
could be useful starting points when developing weighting schemes for BRP
design at increased levels of model complexity.
Robust vs. non-robust design scenarios (Section 5.2.3) – Two design scenarios are
investigated in order to assess the robustness of the multilevel design solution. In
the robust-design scenario, each of the four design goals is weighted equally. In
the non-robust design scenario, the two performance goals are weighted equally,
and the robustness goals are removed from the design process. The robust and
non-robust design scenarios are maintained throughout all levels of the multilevel
design process and results are analyzed. Robustness of design solutions is

219
measured using the HD-EMI robustness metric. It is found that early in the BRP
design process (Level 1) design solutions obtained from a robust goal weighting
scheme are more robust than design solutions achieved based on non-robust goal
weighting. As the designer progresses through the design process (Level 2), the
robust and non-robust design solutions begin to have similar levels or robustness.
Then, late in the design process (Level 3) design solutions from a non-robust
weighting scheme are actually more robust than design solutions from a robust
weighing scheme. This unexpected trend in multilevel design is attributed to the
mapping functions which control what information is passed to subsequent design
decisions and set the tone for design solutions later in the design process.
Inductive vs. deductive solution path (Section 5.2.3) – Due to its relative
simplicity, the BRP design problem can be solved directly without the use of the
inductive approach embedded in the multilevel design template. The direct (or
deductive) design solution is obtained and compared with the inductive BRP
design solution determined using the multilevel design template. In general, BRP
design goals are more closely achieved when using an inductive design approach.
However, BRP performance for an inductive design approach and direct
calculation are similar. Since each design scenario produces similar BRP
performance it is concluded that differences in design variable data indicate
different by comparable solutions in BRP design space. The inductive vs.
deductive design comparison indicates that while implementing an inductive and
deductive solution path in BRP design produces different design solutions, the
design solutions measure remarkably similar performance. This realization adds
value to the inductive design approach. In complex BRP design, an inductive
design approach simplifies the design process by limiting the design space at
complex design levels. Based on the information in the previous section, it is
220
observed that an inductive solution path in which complex design space is limited
does not inversely affect the overall performance of the attained BRP design
solution.
Usefulness of Multilevel Design Template in Solving Example Problems
A second aspect of establishing the domain-specific performance validity of the
multilevel design template is in analyzing its overall usefulness by addressing the
question, “Are there any advantages to using the multilevel design template compared to
a traditional product design process?” In Section 4.3.2 and Section 5.3.2 the advantages
of implementing the multilevel design template in cantilever beam and BRP design are
discussed and include: the partitioning of a complex design problem to levels of design
complexity, the support of agile design space exploration via performance models and
mapping functions, and the collection and organization of design information for use in
future design analysis. In summary, the structure of the multilevel design template is
useful in guiding a designer in information collection and allocation, design space
exploration, and solution analysis of a complex, multilevel design problem.
6.2.4 Domain-Independent Performance Validity
Domain-independent performance validity is asserted by showing that the method is
useful beyond the selected example problems. This step in the Validation Square is often
referred to a “leap of faith” in which the designer must speculate as to the future success
of the method based on confidence built from the previous three quadrants of the
Validation Square. The domain-independent performance validity of the multilevel
design template is established in the successful application of the template in two
multilevel example problems, and the mutable nature of the design template. Due to the
successful application of the design template to the two multilevel example problems, it
is inferred that the template will produce equally beneficial results when applied to
additional multilevel design problems. Also, the design template is problem-generic,

221
modular, and mutable—all characteristics that allow it to be adapted to suit future design
problems. Recall from Chapter 2 that one of the key requirements of a design template is
reusability. By nature, design templates are designed for application in a variety of
design problems. Therefore, it is asserted with confidence that the multilevel design
template can be applied to additional multilevel design problems producing beneficial
design solutions.
Additionally, the domain-independent performance validity quadrant of the Validation
Square involves investigation of the underlying theoretical contributions in the multilevel
design template. These theoretical contributions describe the essence of the multilevel
design template, and are advances in engineering design that can be applied to design
problems beyond those investigated in this thesis. The intellectual contributions of the
multilevel design template that can be applied to future design problems include: the
application of an existing design method to a template-based design environment, the
partitioning of complex design problems based on level of model complexity, and the
limitation of vast design space by identifying regions likely containing satisficing design
solutions. First, the multilevel design template is developed based on two existing design
methods, cDSP and IDEM. The overall structure and information flow of these two
methods are combined and extended to a template-based environment for multilevel
robust design. The multilevel design template is then extended to computer-executable
modules capable of capturing and directing design information for specific design
problems. The concept of adapting an existing design method to a template-based
computer executable environment can be applied to a variety of design problems outside
of the domains investigated in this thesis. Next, the multilevel design template introduces
a new method for dividing multilevel design problems based on levels of model
complexity. A complex design problem can be divided in a multilevel-multiscale manner
(based on changes in length and / or time measure) or in a multilevel-homogenization
222
manner (based on averaging or homogenization techniques to achieve model simplicity /
complexity). This underlying concept of the multilevel design template can be applied as
a method for partitioning complex engineering design problems beyond the examples
investigated in this thesis. Finally, the multilevel design template provides an approach
for achieving satisficing design solutions to complex design problems. Based on a series
of increasingly complex design decisions connect by mapping functions, design
information from simple design levels is transferred to complex design levels in order to
limit design space and identify regions likely containing satisficing design solutions.
This approach for simplifying prohibitively complex design problems represents one of
the key contributions in the multilevel design template, a concept which can be applied to
a variety of complex design problems, regardless of domain. The three key theoretical
contributions listed in the previous paragraph detail aspects of the multilevel design
template that can be applied to many complex design problems, building confidence in
the domain-independent performance validity of the multilevel design template.
6.3 ADDRESSING THE RESEARCH GAP – COMPLETED AND FUTURE WORK
IN TEMPLATE-BASED MULTILEVEL DESIGN
In Section 6.3, an assessment of how well the identified research gap has been addressed
and opportunities for advancement relating to the multilevel design template and example
problems are presented. The research gap is revisited in Section 6.3.1 with a discussion
of how well the identified gap has been addressed. In Section 6.3.2 future work relating
to the multilevel design template is presented. Section 6.3.3 contains opportunities for
improvement relating to the example problems, cantilever beam design and BRP design.
Section 6.3.4 contains speculation as to how template-based multilevel robust design can
be extended for engineering design of the future.

223
6.3.1 Addressing the Research Gap
In Section 2.4, two key research gaps in multilevel template-based design are identified.
The extent to which these gaps have been filled in this thesis is addressed in Section 6.3.1.
Figure 6.3 lists the key gaps investigated in this thesis including: the extension of
multiscale design concepts from the materials design community to encompass a
multilevel product and materials design approach, and the combination of existing design
methods with a template-based design approach. Recall from Section 2.4, that research
in multilevel template-based design is aimed at the development of a detailed multilevel
design method composed of reusable design templates that addresses the critical needs of
a multilevel design process (see Section 1.1.2, Section 2.1.2 and Table 2.2 for a list of
critical needs). Addressing the research gaps shown in Figure 6.3 is a small step in
achieving the overall goal of a detailed multilevel design method.
Where We
AREWhere We
WANT TO BE
Extension of multiscale materialsdesign concepts to multilevel
product design approach
Template-based multilevel robust design based on existing design
methods
Detailed multilevel design method
Bridging the Research Gap
Figure 6.3 – Addressing the identified research gap
In the engineering design community there are a variety of detail design methods for
single scale design (e.g., Pahl and Beitz 1996). One of the main research goals in the
field of multiscale (or multilevel) design methodology is the development of a detail,

224
systematic design method to characterize multilevel systems and address the critical
needs of a multilevel design process (see Section 1.1.2, Section 2.1.2 and Table 2.2 for a
list of critical needs). A detail multilevel design method would provide the procedural
steps needed for multilevel design with sufficient generality for application in a variety of
design problems. The multilevel design template presented in this thesis in response to
the identified research gaps is one step in the journey to creating a multilevel design
method by providing a framework for multilevel design. However, the multilevel design
template lacks the details needed for a systematic multilevel design method. Researchers
must gain a greater understanding of the elaborate interaction patterns of various levels in
complex design problems before a detail design method for multilevel design is
developed. The work presented in this thesis is intended to help close this wide research
gap by providing design tools in template-based multilevel robust design that can be built
on in future research. A discussion of the extent to which the identified research gaps
have been addressed in this thesis follows.
Addressing the Research Gap Relating to Multilevel Robust Design – From Multiscale
Design to Multilevel Design
In Section 2.4.1 a research gap is identified based on the extension of multiscale design
concepts from the materials design community to a multilevel product and material
design approach. It is observed that the multiscale modeling and design approach used in
materials design based on dividing a design problem according to length and / or time
scales can be abstracted to include a wider range of engineering design problems. This
research gap is addressed in this thesis with the distinction of multilevel design (different
from multiscale design) as a design problem which is modeled and analyzed at various
levels of model complexity or resolution. The complexity or resolution of a design level
is based on the number of degrees of freedom at that level. Once a multilevel design
problem is identified, design levels are defined and performance models are created at

225
each level. Information at each level is combined to determine the multilevel design
solution.
Addressing the Research Gap Relating to a Template-Based Approach to Multilevel
Robust Design
It is also identified that a template-based approach to multilevel design problem currently
does not exist in the engineering design community. This research gap is addressed in
this thesis with the development of a multilevel design template based on a multi-
objective design template, the cDSP, and a multilevel robust design method, IDEM (see
Section 3.1, Section 3.2). The multilevel design template presented in this thesis
provides the framework and information flow necessary to frame and solve a multilevel
design problem. Additionally, multilevel robust design goals are infused in the multilevel
template such the multilevel design solution is robust to propagated process chain
uncertainty. The next phase in addressing this research gap is to apply the multilevel
design template to multilevel example problems (see Figure 3.13, Figure 3.15). Two
example problems are solved (Chapter 4, Chapter 5) as part of the verification and
validation of the multilevel design template. The multilevel design template can be
added to as future research leads to a detailed multilevel design method based on design
templates.
6.3.2 Future Work Related to Multilevel Design Template
In Section 6.3.1 areas for future improvement relating to the multilevel design template
are discussed. To begin, the knowledge gap that arises from particularizing the generic
multilevel design template for a specific multilevel design problem is addressed. Then, it
is shown how dividing a design problem according to levels of model complexity can be
extended for future design processes. Also, current limitations in the method for
achieving robust design solutions are addressed.

226
The first area for future advancement of the multilevel design template is the
development of guidelines for the particularization and application of the multilevel
design template in specific design problems. The multilevel design template presented in
Chapter 3 is a generic design structure used as a guide in multilevel design process
formulation and design-making. In order for the multilevel design template to be useful,
it must be particularized for a specific multilevel design problem. In this thesis, it is left
to the discretion of the designer to determine how the multilevel design template should
be altered for application in a specific design problem. It would be useful to develop
guidelines for altering the multilevel design template such that the augmented multilevel
design template performs as expected. Additionally, in this thesis, it remains unclear how
to translate the structure of the multilevel design template into computer-executable
system response model sub-templates. Currently there are no guidelines for how
information is shared among computer executable sub-templates. For the example
problems examined in this thesis, design information is shared among design levels by
allowing a robust design solution at one scale to become input information to determine a
robust design solution at another scale. However, in this thesis, no standard is
determined for sharing design information in a computational template-based design
environment. For future work, it is beneficial to research methods for applying generic
design tools, such as the multilevel design template, to the computational design
environment of specific example problems.
The next area for advancing research of template-based multilevel design involves further
examination of design complexity as a method for partitioning multilevel design
problems. In this thesis, multilevel design problems are divided based on model
precision, or model complexity. It is observed that simply increasing the complexity of a
prediction model does not necessarily increase its precision (in this thesis, it is assumed
that an increase in complexity is synonymous with an increase in model precision).

227
Future work in this area should clarify differences in model complexity and model
precision. Additionally, in this thesis, the measure for design complexity is the number
of design variables used in system prediction models (as the number of design variables
increases, model complexity increases). However, measuring design complexity based
solely on the number of design variables is perhaps too simplistic. Complexity in a
design problem is defined by many factors including the number of design variables,
couplings between design variables, and the influence of each design variable on system
performance. In future work, it would be beneficial to thoroughly investigate what is
meant by the precision of a system prediction model and develop a method for measuring
system complexity based on a variety of factors. The concepts of model complexity
presented in this thesis open the door to a new method of model classification that has
many areas for research opportunities.
An additional area of future work relating to the multilevel design template involves
selecting the best strategy for incorporating robust design concepts in the multilevel
design template. In this thesis, multilevel robust design is achieved by setting a design
goal to maximize system robustness at each design level (based on the robustness metric,
HD-EMI). A research opportunity exists in expanding this approach to include section of
the best method for achieving multilevel robust solutions. Ideally, a “multilevel robust
method library” containing many approaches for achieving multilevel robust solutions
would exist such that a designer could select the robustness strategy that best suits a
particular multilevel design problem. In future research it would be interesting to
compare various multilevel robust design methods incorporated in a template-based
multilevel design environment, highlighting the advantages and disadvantages of each
approach.

228
6.3.3 Future Work Related to Example Problems
In Section 6.3.2 research opportunities relating to the example problems completed in this
thesis are discussed. Since each example problem involves the concurrent design of
product and material, a research opportunity exists in increasing the precision at which
system prediction models are developed to incorporate more detailed material
performance models. For the examples in this thesis, material behavior models operate at
the continuum level by predicting system performance based on homogeneous material
properties. In order to fully explore the benefits of concurrent product and materials
design in the examples in this thesis, material behavior models at the meso-, micro-,
nano-, etc. levels should be investigated. With current computation power, developing
micro- and nano- material models and making design decisions at these scales requires
significant computation cost. However, less expensive steps, such as modeling material
at failure sites with more precise models using FEA software, could be taken to improve
the quality of concurrent product and materials design solutions.
Future Work – Cantilever Beam Example Problem
The cantilever beam example problem is used to illustrate the advantages of a template-
based approach to multilevel design in a concurrent product and material design process.
Design freedom exists in the cross-sectional area of the cantilever beam and its material
properties. Areas for future research include extending the design freedom of the
cantilever beam to include variation in material properties in more than one direction and
dynamic cross-section geometry. For this thesis, the material properties of the cantilever
beam vary in one direction, along the length of the beam (x-direction). For a more
realistic materials design illustration, the material properties of the beam should be
alloyed to vary in all three directions of the beam (x-, y-, and z-direction). This increase
in material freedom would result in a more accurate picture of the ideal material for
cantilever beam design. For cantilever beam design in this thesis beam cross-section
229
geometry remains constant. For future work, it would be interesting to allow beam
geometry to vary and investigate cross-sectional geometry trends in cantilever beam
design. Expanding design freedom in material properties and beam cross-section would
produce a more complex design environment for concurrent product and materials design.
Future Work – BRP Example Problem
There are four main areas for future work in BRP design including: model verification
using FEA, loading analysis and verification, core layer design and analysis, and
identification of key working principles in BRP design. Each of these research
opportunities in BRP design is discussed in the following paragraphs. In addition to
these areas for future work, a broader area for reach opportunity includes increasing the
detail of BRP material models, discussed in Section 6.3.2, first paragraph. By design
BRP material with increased precision the advantages of concurrent product and material
design are more easily observed.
Current BRP multilevel performance models are based on the work of Hutchinson and
Xue, 2005 and implemented in MATLAB. These models represent an approximation of
BRP performance and should be verified using FEA. Jin Song and Gautam Puri, former
and current undergraduate researchers of the Systems Realization Lab at Georgia Tech,
initiated the verification of BRP analytical models using FEA software ABAQUS. This
work is still in progress, although preliminary solutions can be found in Appendix D.
Additionally, a BRP loading analysis should be conducted in order to verify
approximations in BRP loading conditions. In practical use, BRPs are designed to
protect against blast loading, similar to what is found in a wartime environment. Recall
from Section 5.1.1 that BRP impulse loading (blast loading) in BRP prediction models is
modeled as a pressure pulse, with constant pressure over the panel top face sheet, varying

230
in time. For future work, FEA should be used to determine if the constant pressure blast
wave is an acceptable approximation for BRP impulse loading conditions.
The key feature of a BRP is its honeycomb core layer which dissipates energy due to core
crushing. There are many research opportunities relating to altering the honeycomb core
layer in order to achieve greater energy dissipation while decreasing core mass. In this
thesis, BRPs with square honeycomb cores are considered. However, research should be
conducted to determine the best topology for the BRP core layer in order to maximize
energy absorption while minimizing BRP mass. Future work in BRP design includes
concurrent BRP product, material, and core topology design. Another promising research
opportunity in BRP design is investigating the advantages of placing a fill material in the
cells of honeycomb core to increase energy dissipation. A lightweight granular fill
material placed in BRP honeycomb cells would dissipate blast energy due to friction
among fill material particles without significantly increasing BRP mass. Design
variables in a BRP with fill material could include the properties of the fill material (grain
density, grain size, grain roughness, etc.), location of fill material in BRP core, and
amount of fill material in the filled cells.
Finally, for future work in BRP design, it is important to identify the key working
principles of BRP energy dissipation. The basic mechanism for energy dissipation in the
BRP design investigated in this thesis is known to be crushing of the core layer.
However, it is important investigate other methods for dissipating energy and minimizing
deflection that could be incorporated in BRP design. For future BRP design, the role of
each layer and its features (material properties, topology, layer thickness, etc.) in
minimizing back face sheet deflection should be fully understood and modeled. By doing
so an inductive and systematic design method for BRP design which meets specific goals
and requirements could be accomplished.

231
6.3.4 Extending Template-Based Multilevel Robust Design Methodology
In Section 6.3.3 future work relating to the general study of template-based multilevel
robust design is investigated. The multilevel design template presented in this thesis is
only one contribution to the vast research field of engineering design, and specifically,
template-based design. Based on knowledge gained in developing and implementing the
multilevel design template in this thesis key areas for advancement in template-based
multilevel design include: the development of a multidimensional multilevel design
template and the development of a template-based approach to a detailed multilevel
design method. These areas for research opportunity are discussed in Section 6.3.3.
Template-Based Multidimensional Multilevel Design
The multilevel design template in this thesis is useful for design problems divided
according to levels of model precision or complexity. However, there are many other
factors that can be used to divide a complex design problem such as component length
scale, system reaction time, groups relating to similar system behavior, and components
along a single flow of information. An inherent weakness in the multilevel design
template is that it is only capable of managing design problems divided using a single
metric. An exceptionally complex design problem may be best described using multiple
design metrics to define design levels, referred to as multidimensional multilevel design.
An example of a multidimensional multilevel design problem is a materials design
problem divided according to component length scale and system reaction time.
Developing a framework for multidimensional multilevel design is currently unexplored
in the engineering design community and is left as future work.
6.3.5 Vision for Template-Based Engineering Design of the Future
The main focus in this thesis is the adaptation of design methods into design templates,
thus increasing the reusability, modularity, flexibility, and archival nature of the design

232
method. While a template-based approach to engineering design is beneficial for today,
what role will design templates play in design processes of the future? Due to the
distributive, collaborative, and increasingly complex nature of engineering design of the
future, we assert that design templates will grow in popularity and necessity as design
process building blocks for engineering design of the future.
It seems inarguable that society is moving towards a distributive, collaborative, and
increasingly competitive social and business environment. It is already observed that as
engineering design problems increase in complexity, design experts from around the
world focus united effort to solve a single design problem. We speculate that this trend
will continue to increase, resulting in the need for collaboration in almost all design
problems. There is the additional pressure of quickly and constantly designing new
products in keeping with ever-changing consumer needs. Design collaborating is also
beneficial in reducing design process time, thus reducing a product’s time to market.
Recall the information flow of the multilevel design template in Figure 3.16. As
illustrated, the multilevel design process is carried out by a single designer. In actuality,
this rarely occurs. Today, and certainly in the future, design process information flow
contains a variety of experts making decisions at various points along the design process,
as illustrated in Figure 6.4
As shown in Figure 6.4, information flow in a collaborative design process contains
many individuals supplying design expertise at various points in the design process. The
design is coordinated by a single designer or group of designers who has a working
knowledge of the overall design process without full understanding of each design
decision. This model of design collaboration is expected as engineering design problems
of the future continue to increase in complexity.

233
Variables
Bounds
Constraints
Goals
Preferences
Design Parameters
Performance Models System Responses
Performance Analysis
Solution Path
LEAD DESIGNER
LEAD DESIGNER
Design Solution
Figure 6.4 – Collaborative, distributive multilevel design process
In light of the distributive and collaborative nature of engineering design in the future,
how can design templates be used to add value and efficiency to engineering design? By
observing the key characteristics of design templates, we assert that a template-based
approach to engineering design is a valuable and necessary step in design process design
of the future. Key characteristics of design template are listed below:
Reusable – Design templates are reusable, meaning that time and money are saved by
implementing the same design template in multiple design problems.
Modular – Design templates can be used as building blocks to tailor the design
process of a particular application. Additionally, components within the design
template can be altered or replaced to meet design process requirements without
affecting the remainder of the template. The modularity of design templates allows

234
for quick and easy design process reconfiguration to accommodate for changes in the
design problem.
Mutable – Design templates are capable of modification in order to meet the needs of
a specific design process, or aspect of a design process implying that a similar design
template can be applied to a variety of design problems with only slight modification.
Archival – Design templates provide the construct to store and transport information
supporting a collaborative and distributive design environment.
Our vision for engineering design of the future includes the wide-spread use of design
templates as building blocks in design process design. As design templates increase in
popularity, a design template data base may be created. The design template data base
contains a searchable collection of design templates that can be combined to create
personalized design processes. We envision a future in which, once a design process is
defined, a designer’s first action will be to build a suitable design process from a design
template database. What steps must be taken in the design community to make this a
reality? We assert that the development of design templates based on existing and new
design processes is necessary and crucial to encourage efficient collaborative and
distributive design of complex systems of the future.
6.3.6 Lessons Learned from the Design and Application of a Multilevel Design
Template
In creating the multilevel design template presented in this thesis and applying it to
cantilever beam and BRP example problems, I have gained valuable insight into the
benefits and challenges of a template-based approach to multilevel design. In Section
6.3.6, I present key lessons learned based on the ideas and information presented in this
thesis. Lessons learned are discussed below by addressing three questions that I often
pondered during the creation and application of the multilevel design template.

235
Key Lesson #1: Why is a multilevel design approach beneficial for solving complex
design problems?
Multilevel design is a strategy for dividing complex design problems into levels of
manageable complexity. In engineering design, a trend of increasing product complexity
is observed. In many cases, design problems are becoming so complex that modern
computational tools are not sufficient to produce satisfactory design solutions within
design process time and cost constraints. By implementing a multilevel design approach,
complex design problems are analyzed at various levels of model complexity. Models at
low levels of complexity are used for extensive design space exploration. Design
knowledge gained from investigating less complex models is mapped into more complex
design models thereby reducing the amount of design space exploration necessary at
complex levels. A multilevel design approach is intended to produce satisfactory design
solutions to complex design problems at reduced time and computation cost compared to
traditional single-level design processes. I have observed that one of the key challenges
in multilevel design is the translation of design information among various design levels
such that design knowledge is preserved without over-complicating future design
decisions.
Key Lesson #2: Is my design problem multilevel? How do I define levels?
After careful consideration, I conclude that all design problems are multilevel in nature.
All design problems can be modeled at increasing or decreasing levels of model
complexity. Consider a simple design problem that may not seem multilevel at first
glance—the design of a cantilever beam. However, by including all aspects of cantilever
beam design (product and material) the multilevel nature of cantilever beam design is
soon realized. There are no regulations for defining design levels in a multilevel design
problem. However, after completing two multilevel example problems, I have observed

236
several guidelines indicating a change in design level including: a change in computation
tools used to describe product performance, a change in length and / or reaction time in
modeling product performance, and a change in fundamental phenomena used to describe
produce performance. It is left to the informed designer to define the “best” number of
design levels and location of design levels in a multilevel design process. Defining too
many design levels may over-complicate design decisions and introduce unnecessary
propagated process chain uncertainty. Defining too few design levels may result in the
failure to capture relevant phenomena in a multilevel design problem.
Key Lesson #3: Mapping functions in a multilevel design template, friend or foe?
The key to a successful multilevel design template is in the careful design of its mapping
functions. Mapping functions are information highways used to transfer design
information among design levels. Specifically, mapping functions are created such that
design knowledge obtained at less complex design levels can be transferred to more
complex deigns levels. A particular multilevel design problem does not have a unique set
of mapping functions. Rather, it is the role of the designer to create mapping functions
that best transfer design information in order to meet design objectives. Mapping
functions are powerful tools in multilevel design, setting the tone for design designs at
more complex levels of design. A poor selection of mapping functions may result in an
over-limited design space for which a satisfactory design solution cannot be found.
Inappropriate mapping functions are also capable of transferring incorrect or irrelevant
design information, resulting in an undesired multilevel design solution. But, with well-
crafted mapping functions, the essence of design knowledge is passed throughout a
multilevel design process enhancing design decisions at later and more complex stages of
design.

237
6.4 SYNOPSIS OF CHAPTER 6
Central topics in Chapter 6 include research contributions of this thesis, verification and
validation of the multilevel design template, and opportunities for improvement relating
to the multilevel design template and example problems. The main research
contributions of this thesis include the development of a multilevel design template and
the application of the design template to the multilevel design of BRPs. Verification and
validation of the multilevel design template is established based on the Validation Square
construct. Aspects of method validation presented throughout this thesis are brought
together in Section 6.2 where the verification and validation of the multilevel design
template is established. Chapter 6 continues with future work relating to the multilevel
design template, the example problems presented in this thesis, and the advancement of
template-based multilevel design methodology for complex design problems of the future.
At the conclusion of Chapter 6 lessons learned from the design and application of a
multilevel design template are discussed.

238
APPENDIX A
PAHL AND BEITZ SYSTEMATIC PRODUCT DESIGN METHOD
The flow of information in the systematic design method developed by Pahl and Beitz is
shown in Figure A.1 (Pahl and Beitz 2006).
Pha
se 1
: Pla
nnin
g an
d cl
arify
ing
Pha
se 2
: Con
cept
ual d
esig
n
TaskMarket, company, economy
Plan and clarify the task:
Analyze the market and the company situation
Find and select product ideas
Formulate a product proposal
Clarify the task
Elaborate a requirements list
Requirements list(Design specification)
Develop the principle solution:Identify essential problems
Establish function structures
Search for working principles and working structures
Combine and firm up into concept variants
Evaluate against technical and economic criteria
Concept(Principal Solution)
Develop the construction structure:
Preliminary form design, material selection and calculation
Select best preliminary layouts
Refine and improve layouts
Evaluate against technical and economic criteria
Preliminary layout
Define the construction structure:
Eliminate weak spots
Check for errors, disturbing influences and minimum costs
Prepare the preliminary parts list and production and assembly documents
Definitive layout
Prepare production and operating documents:
Elaborate detail drawings and parts lists
Complete production, assembly, transport, and operating instructions
Check all documents
Product Documentation
Solution
Pha
se 3
: Em
bodi
men
t des
ign
Pha
se 4
: Det
ail d
esig
n
Info
rmat
ion:
Ada
pt th
e re
quire
men
ts li
st
Figure A.1 – Pahl and Beitz systematic product design method (Pahl and Beitz 2006)

239
APPENDIX B
REQUIREMENTS LISTS FOR BLAST RESISTANT PANEL DESIGN
Requirements lists for the design of a blast resistant panel are presented in Table B.1 –
Table B.3. The requirements list presented below relate to the motivation for completing
the BRP design example problem. The motivation is categorized as: advancement of
multiscale robust design methodology, verification and validation of proposed template
based approach to multiscale robust design, and to satisfy BRP design requirements
developed by the customer.
Table B.1 – BRP Requirements List for the advancement of multiscale robust design
methodology
Request: Title: Originator: Issued on:
BRP Blast Resistant Panel (BRP) Hannah Muchnick, Matthias Messer, Stephanie Thompson
24-Jul-06
Problem Statement: A blast resistant panel (BRP) that provides increased energy absorption per unit mass compared to conventional solid plates is to be designed. Given the design goals of minimizing deflection for a given mass constraint, a material can be designed to meet the BRP performance requirements. Since there is uncertainty associated with the manner in which the BRP will be loaded and the BRP material properties, a BRP that is robust to uncertainty in loading conditions and material properties is designed.
Principal solution: Multilayer sandwich structure with extruded honeycomb core(s):
Motivation: Advancement of multiscale robust design methodology (including robust materials design)
Requirements Type D
W No. Description Data and Comments
Material composition Sandwich-structure consisting of bondable layers
Energy absorption
Functionality
Structural stability
Maximize energy absorption due to core crushing and friction between fill material particles
Minimize variation of energy absorption
Dissipate energy in multiple directions
Material-design goals
Transfer vertical load into shear direction
Yield strength
Density
Design variables
Microstructure
Number of layers
Layer thickness(es) hf
Mat
eria
l
Mat
eria
l Des
ign
"Mul
tila
yer
Sand
wic
h St
ruct
ure
wit
h E
xtru
dabl
e C
ore(
s)"
Material-design variables
Core topology Square

240
Table B.1 (continued) – BRP Requirements List for the advancement of multiscale robust
design methodology
Triangle
Hexagon
Chiral
Core dimensions H, B, hc
Relative density (Rc) Core material / total volume of core >= 0.07
Mass/area constraint
Deflection constraint
Material-design constraints
Shear-off constraint
Density: 1000 - 10000 kg/m3
Material properties
Yield strength: 100 - 1500 Mpa
Face sheet (hf): 1 - 2.5 mm
Layer thickness
Core (H): 5 - 50 mm
Cell spacing (B): 1 - 20 mm
Material-design bounds
Core topology
Cell wall thickness (hc): 0.1 - 5 mm
Material-design simplifying assumptions
No strain hardening
Physical properties Low aging
Chemical properties Low oxidation
No buckling: Rc >= 0.07
No delamination (shearing of face sheets)
No rupture
Failure modes to be avoided:
No structural collapse
Macro-scale
Meso-scale
Material-design length scales
Micro-scale
Product reaction time 0.0001 sec
Product life cycle time 10 years Des
ign
Scal
es
Material-design time scales
Product evolution time 100 years
Uncertainty in loading conditions (impulse shape and direction)
Uncertainty in material properties
Uncertainty in design factors
Rob
ust
Robust to
Uncertainty in simulation models
Table B.2 – BRP Requirements List for the verification and validation of template based
approach to the robust design of multiscale systems
Request: Title: Originator: Issued on:
BRP Blast Resistant Panel (BRP) Hannah Muchnick, Matthias Messer, Stephanie Thompson
24-Jul-06
Problem Statement: A blast resistant panel (BRP) that provides increased energy absorption per unit mass compared to conventional solid plates is to be designed. Given the design goals of minimizing deflection for a given mass constraint, a material can be designed to meet the BRP performance requirements. Since there is uncertainty associated with the manner in which the BRP will be loaded and the BRP material properties, a BRP that is robust to uncertainty in loading conditions and material properties is designed. The BRP design problem is used to demonstrate and validate a multiscale robust design process.

241
Table B.2 (continued) – BRP Requirements List for the verification and validation of
template based approach to the robust design of multiscale systems
Principal solution: Multilayer sandwich structure with extruded honeycomb core(s):
Motivation: Multiscale design problem used to demonstrate and validate a template based approach to multiscale robust design as presented in a MS Thesis.
Requirements Type D
W No. Description Data and Comments
Material composition Sandwich-structure consisting of bondable layers
Energy absorption
Functionality
Structural stability
Maximize energy absorption due to core crushing and friction between fill material particles
Minimize variation of energy absorption
Dissipate energy in multiple directions
Material-design goals
Transfer vertical load into shear direction
Yield strength
Density
Design variables
Microstructure
Number of layers
Layer thickness(es) hf
Square
Triangle
Hexagon
Core topology
Chiral
Core dimensions H, B, hc
Material-design variables
Relative density (Rc) Core material / total volume of core >= 0.07
Mass/area constraint
Deflection constraint
Material-design constraints
Shear-off constraint
Density: 1000 - 10000 kg/m3
Material properties
Yield strength: 100 MPa - 1500 MPa
Face sheet (hf): 1 - 2.5 mm
Layer thickness
Core (H): 5 - 50 mm
Cell spacing (B): 1 - 20 mm
Material-design bounds
Core topology
Cell wall thickness (hc): 0.1 - 5 mm
Material-design simplifying assumptions
No strain hardening
Physical properties Low aging
Chemical properties Low oxidation
No buckling: Rc >= 0.07
No delamination (shearing of face sheets)
No rupture
Mat
eria
l Des
ign
"Mul
tila
yer
Sand
wic
h St
ruct
ure
wit
h E
xtru
dabl
e C
ore(
s)"
Failure modes to be avoided:
No structural collapse
Macro-scale
Meso-scale
Mat
eria
l
Des
ign
Scal
es
Material-design length scales
Micro-scale

242
Product reaction time 0.0001 sec
Product life cycle time 10 years
Material-design time scales
Product evolution time 100 years
Uncertainty in loading conditions (impulse shape and direction)
Uncertainty in material properties
Uncertainty in design factors Rob
ust
Robust to
Uncertainty in simulation models
Complete mathematical models
8/1/2006
Response surface model 8/10/2006
Implement IDEM method to BRP design
9/1/2006
Complete BRP robust design solution
9/30/2006
Write BRP chapter of thesis 10/1/2006
MS thesis presentation 10/18/2006
MS
The
sis
Necessary revisions to BRP solution
11/15/2006
Table B.3 – BRP Requirements List for satisfying customer requirements
Request: Title: Originators: Issued on:
BRP Blast Resistant Panel (BRP) Hannah Muchnick, Matthias Messer, Stephanie Thompson
24-Jul-06
Problem Statement: A blast resistant panel (BRP) that provides increased energy absorption per unit mass compared to conventional solid plates is to be designed. In one application of this design, BRPs can be attached on the outside of military vehicles to protect them from explosions. The BRP must be robust to changes in loading conditions. Since there is uncertainty associated with the manner in which the BRP will be loaded, a BRP that has a relatively consistent performance in a changing environment has to be designed.
Principal solution: Multilayer sandwich structure with extruded honeycomb core(s):
Motivation: Satisfaction of customer requirements initiated by the Army Research Lab (ARL)
Requirements Type D
W No. Description Data and Comments
Length 1 m
Size:
Breadth 1 m
Arrangement Multilayer sandwich panel with extruded honeycomb core(s)
Number of layers >= 2
Boundary conditions To be determined for FEM simulations
Shape Overall panel is flat square
Core(s) have various topologies
Interfaces Interfacing with flat and curved surfaces
Mutability Mutable core(s)
Modularity Modular layers
Geo
met
ry
Scalability Scalable in size (in length and breadth direction)
Load Impulse in air uniformly distributed over front face sheet
Magnitude of force Blast pressure: 19000 (190 MPa) - 28000 N/s (280 MPa)
Direction of force Blast encounters front face sheet at a varying angle of incidence
Weight (mass/area) <= 25 kg/m2
Deformation <= 0.01 m (10% of length)
Eng
inee
ring
Sys
tem
"B
last
Res
ista
nt P
anel
"
For
ces
Frequency BRP intended for one time use

243
Table B.3 (continued) – BRP Requirements List for satisfying customer requirements
Input Kinetic energy
Output Thermal energy
Efficiency Low => high energy absorption
Loss High energy dissipation through core crushing, face sheet bending and face sheet stretching and friction between fill material particles
Temperature - 10 degrees Celsius (winter) to + 50 degrees Celsius
(summer)
E
nerg
y
Cooling Air cooling (natural convection)
Material composition Sandwich-structure consisting of bondable layers
Energy absorption
Functionality
Structural stability
Uncertainty in loading conditions
Uncertainty in noise factors
Uncertainty in design factors Mat
eria
l Des
ign
Robust to
Uncertainty in simulation models
Physical properties Low aging
Chemical properties Low oxidation
No buckling: Rc >= 0.07
No delamination (shearing of face sheets)
No rupture
Mat
eria
l
Pro
pert
ies
Failure modes to be avoided:
No structural collapse
Initial proposal Fall 2005
Initial presentation Fall 2005
CCMD Meeting at Georgia Tech - 2006 2/27/2006 - 2/28/2006
Quad chart Spring 2006
Meeting at ARL 6/26/2006
CCMD Meeting at Penn State - 2006 8/25/2006 - 8/26/2006
CCMD Meeting at Georgia Tech - 2007 Winter 2007 Mee
ting
s w
ith
AR
L
Paper on robust design templates Spring 2007

244
APPENDIX C
BLAST RESISTANT PANEL
PERFORMANCE AND VARIATION OF PERFORMANCE
CALCULATIONS
Details regarding the calculation of the deflection, mass, variation of deflection, and
variation of mass of blast resistant panels (BRPs) are given below. Information relating
to BRPs with three layers (front face sheet, core, back face sheet) are provided first.
Then, details regarding BRPs with three solid layers and one solid layer follow.
Developing the following BRP performance models is a joint effort with Stephanie
Thompson of the Systems Realization Lab at Georgia Tech.
C.1 BLAST RESISTANT PANEL – 3 LAYERS WITH HONEYCOMB CORE
The following section contains equations and explanations for calculating the
performance and variation of performance of a BRP with three layers with a honeycomb
core. Blast resistant panels discussed in this section contain a solid front face sheet and
solid back face sheet with a cellular honeycomb core. The square topology of the core
layer is perpendicular to the front and back face sheets. Equations are adapted from the
work of Xue and Hutchinson, 2005 in “Metal Sandwich Plates Optimized for Pressure
Impulses”. References to the particular page number, equation, or paragraph are
presented in given to direct the reader to where the selection equations and / or
assumptions are located in the referenced Xue and Hutchinson paper, 2005.
The following equations apply for the following cases only:
- Blasts in air only, not water
- All metal sandwich plate with square honeycomb core.
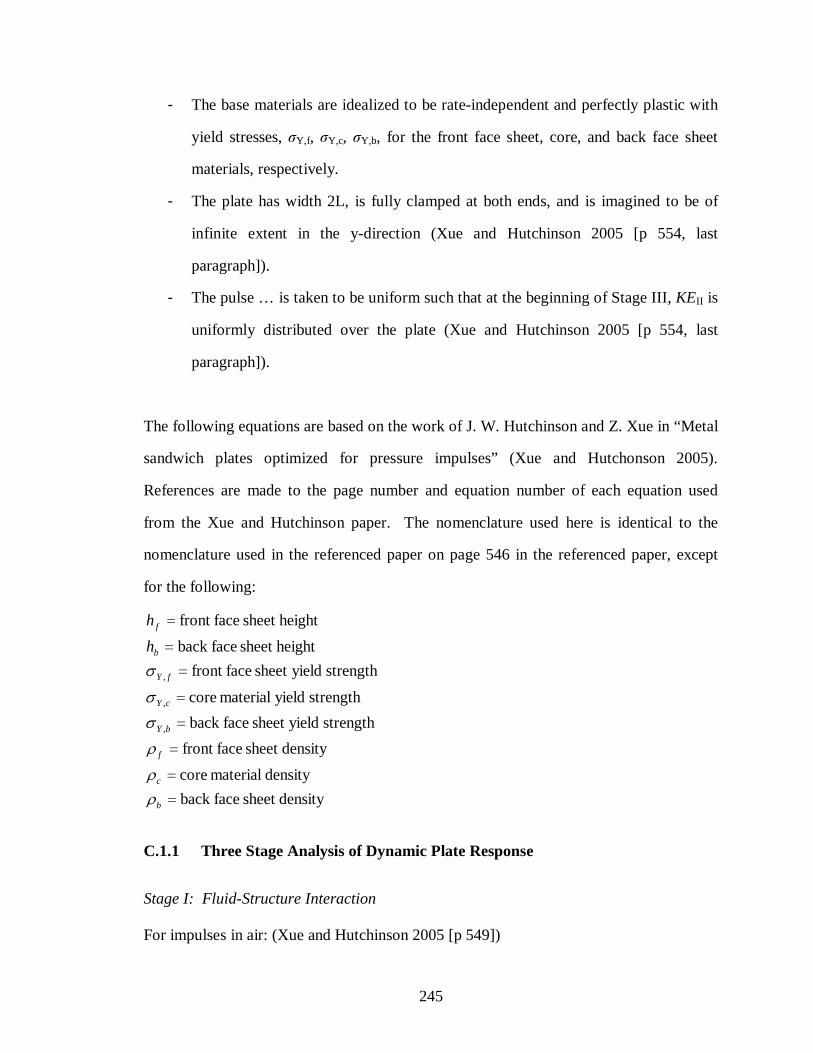
245
- The base materials are idealized to be rate-independent and perfectly plastic with
yield stresses, σY,f, σY,c, σY,b, for the front face sheet, core, and back face sheet
materials, respectively.
- The plate has width 2L, is fully clamped at both ends, and is imagined to be of
infinite extent in the y-direction (Xue and Hutchinson 2005 [p 554, last
paragraph]).
- The pulse … is taken to be uniform such that at the beginning of Stage III, KEII is
uniformly distributed over the plate (Xue and Hutchinson 2005 [p 554, last
paragraph]).
The following equations are based on the work of J. W. Hutchinson and Z. Xue in “Metal
sandwich plates optimized for pressure impulses” (Xue and Hutchonson 2005).
References are made to the page number and equation number of each equation used
from the Xue and Hutchinson paper. The nomenclature used here is identical to the
nomenclature used in the referenced paper on page 546 in the referenced paper, except
for the following:
densitysheet faceback
density material core
densitysheet facefront
strength yieldsheet faceback
strength yield material core
strength yieldsheet facefront
heightsheet faceback
heightsheet facefront
,
,
,
=
=
=
=
=
=
=
=
b
c
f
bY
cY
fY
b
f
h
h
ρρρσσσ
C.1.1 Three Stage Analysis of Dynamic Plate Response
Stage I: Fluid-Structure Interaction
For impulses in air: (Xue and Hutchinson 2005 [p 549])
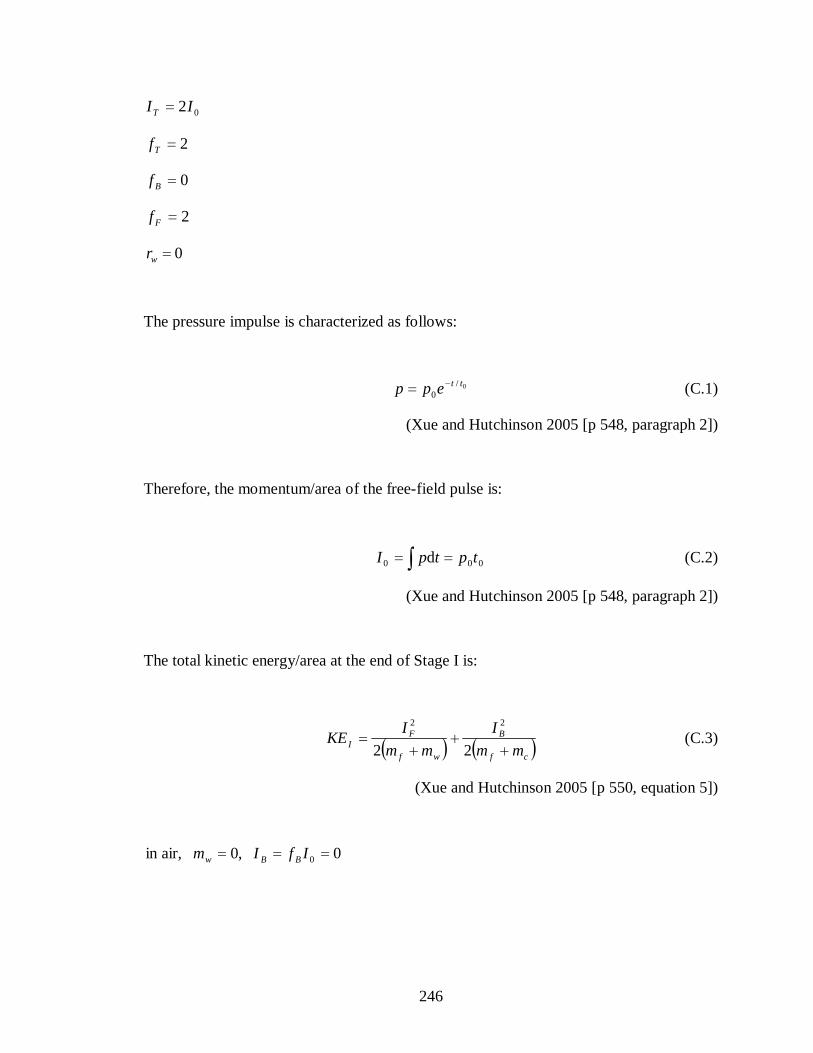
246
02IIT =
2=Tf
0=Bf
2=Ff
0=wr
The pressure impulse is characterized as follows:
0/0
ttepp −
= (C.1)
(Xue and Hutchinson 2005 [p 548, paragraph 2])
Therefore, the momentum/area of the free-field pulse is:
∫ == 000 d tptpI (C.2)
(Xue and Hutchinson 2005 [p 548, paragraph 2])
The total kinetic energy/area at the end of Stage I is:
( ) ( )cf
B
wf
FI mm
I
mm
IKE
++
+=
22
22
(C.3)
(Xue and Hutchinson 2005 [p 550, equation 5])
0 ,0 air,in 0 === IfIm BBw

247
( ) ( )( ) ( )fff
FI m
I
m
tp
m
IKE
2
4
2
2
2
20
200
2
=== (C.4)
For independent face sheet thicknesses and material properties:
( )fI m
IKE
202
= (C.5)
Stage II: Core Crushing
The total kinetic energy/area at the end of Stage II is:
( )wcf
TII mmm
IKE
++=
22
2
(C.6)
(Xue and Hutchinson 2005 [p 551, equation 6])
For independent face sheet thicknesses and material properties:
( ) ( )bbccffbcfII hHRh
I
mmm
IKE
ρρρ ++=
++=
20
20 22
(C.7)
The kinetic energy/area dissipated by core crushing is:
( )( )cbff
cbIII mmmm
mmIKEKE
++
+=−
202
(C.8)
Obtain the crushing strain,cε , by equating the plastic dissipation in the core, WcP, to the
kinetic energy loss in Stage II, KEI-KEII.

248
HW ccY
Pc εσ= (C.9)
(Xue and Hutchinson 2005 [in text above equation 11 on pg 552])
cYcccY R ,σλσ = (C.10)
(Xue and Hutchinson 2005 [pg 552, equation 10])
( )( )cbff
cbIIIc
cY mmmm
mmIKEKEH ++
+=−=202εσ (C.11)
( )( )cbffcYcc
cbc mmmHmR
mmI
++
+=
,
202
σλε (C.12)
( )cHH ε−= 1 (C.13)
(Xue and Hutchinson 2005 [in text on p 556 after equation 17])
Stage III: Overall Bending and Stretching
“The kinetic energy/area of the plate at the end of Stage II, KEII in Eq. (6), must be
dissipated by bending and stretching of the plate in Stage III” (Xue and Hutchinson 2005
[p 554, section 5]).
Plastic work/area dissipated in Stage III is:
( )LL
Hh
LhW fYSfY
PIII
δσδµλσ 423
22
+
+= (C.14)
(Xue and Hutchinson 2005 [eq.17, p.556])

249
[ ]
+
++=LL
Hh
LhHRhW bbYbbYSccYffY
PIII
δσδσλσσ ,
2
,,, 43
2 (C.15)
C.1.2 Calculating the deflection of the plate
Solve for deflection by equating KEII to WPIII , plastic work/area dissipated in Stage III.
[ ]
( )bbccffII
bbYbbYSccYffYP
III
hHRh
IKE
LL
Hh
LhHRhW
ρρρ
δσδσλσσ
++==
=
+
++=20
,
2
,,,
2
43
2
(C.16)
Deflection Equation
02
=−
+
C
LB
LA
δδ (C.17)
[ ]bbYSccYffY hHRhA ,,,3
2 σλσσ ++= (C.18)
L
HhB bbY ,4σ= (C.19)
( )bbccff hHRh
IC
ρρρ ++
−=
202
(C.20)

250
The quadratic equation above is then solved to find the normalized deflection (δ/L). The
maximum of the two roots is taken to ensure a positive deflection.
A
ACBB
L 2
42 −±−=
δ (C.21)
[ ] ( )[ ]
++
++−
++−
±
−
=bbySccyffy
bbccffbbySccyffybbybby
hHRh
hHRh
IhHRh
L
HhL
L
HhL
,,,
20
,,,
2
,,
3
22
232
444
σλσσρρρσλσσσσ
δ
(C.22)
( ) [ ]( )
[ ]bbySccyffy
bbccff
bbySccyffybbybby
hHRh
hHRh
hHRhLIHhHh
,,,
,,,22
0222,,
4
31616343
σλσσρρρ
σλσσσσδ ++
+++++±−
= (C.23)
( ) [ ]( )
[ ]bbySccyffy
bbccff
bbySccyffybbybby
hHRh
hHRh
hHRhLIHhHh
,,,
,,,22
0222,,
393
σλσσρρρ
σλσσσσδ ++
+++++±−
=
(C.24)
( )( )cbffcYcc
cbc mmmHmR
mmI
++
+=
,
202
σλε (C.25)
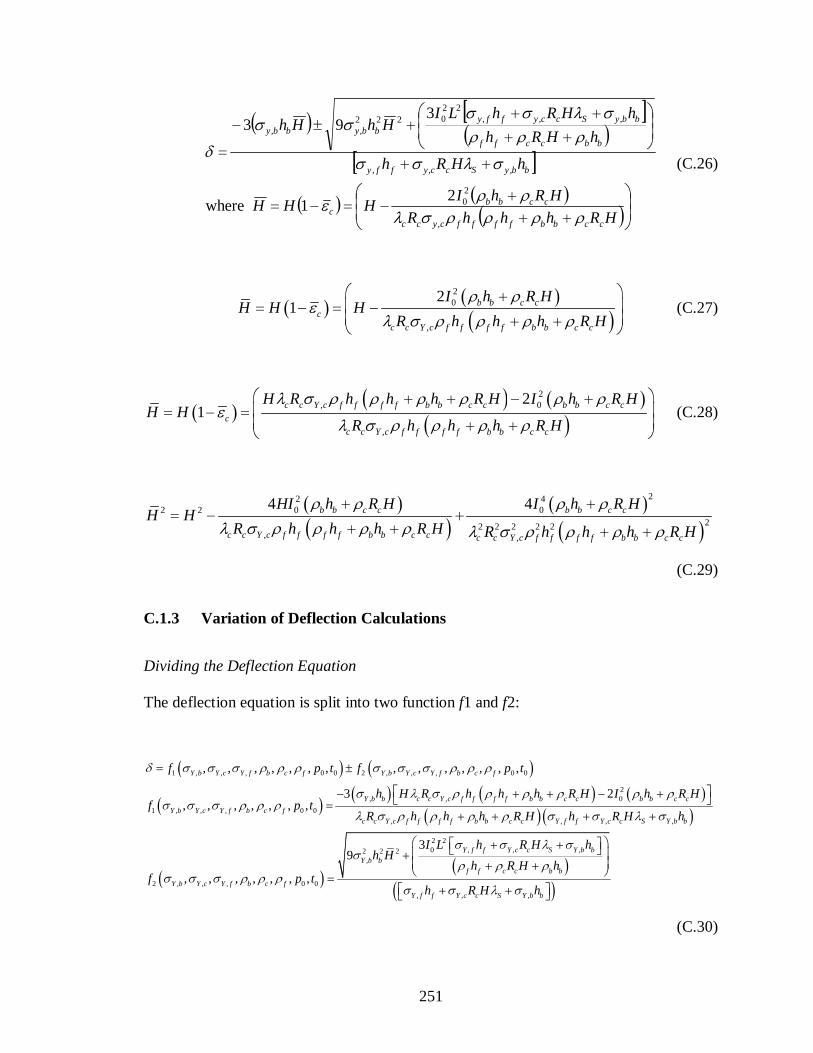
251
( ) [ ]( )
[ ]( ) ( )( )
+++−=−=
++
+++++±−
=
HRhhhR
HRhIHHH
hHRh
hHRh
hHRhLIHhHh
ccbbffffcycc
ccbbc
bbySccyffy
bbccff
bbySccyffybbybby
ρρρρσλρρε
σλσσρρρ
σλσσσσδ
,
20
,,,
,,,22
0222,,
21where
393
(C.26)
( ) ( )( )
20
,
21 b b c c
c
c c Y c f f f f b b c c
I h R HH H H
R h h h R H
ρ ρε λ σ ρ ρ ρ ρ + = − = − + +
(C.27)
( ) ( ) ( )( )
2, 0
,
21
c c Y c f f f f b b c c b b c c
c
c c Y c f f f f b b c c
H R h h h R H I h R HH H
R h h h R H
λ σ ρ ρ ρ ρ ρ ρε λ σ ρ ρ ρ ρ + + − + = − = + +
(C.28)
( )( )
( )( )
22 40 02 2
22 2 2 2 2, ,
4 4b b c c b b c c
c c Y c f f f f b b c c c c Y c f f f f b b c c
HI h R H I h R HH H
R h h h R H R h h h R H
ρ ρ ρ ρλ σ ρ ρ ρ ρ λ σ ρ ρ ρ ρ
+ += − +
+ + + +
(C.29)
C.1.3 Variation of Deflection Calculations
Dividing the Deflection Equation
The deflection equation is split into two function f1 and f2:
( ) ( )( ) ( ) ( ) ( )
( )
1 , , , 0 0 2 , , , 0 0
2, , 0
1 , , , 0 0
, , , ,
, , , , , , , , , , , , , ,
3 2, , , , , , ,
Y b Y c Y f b c f Y b Y c Y f b c f
Y b b c c Y c f f f f b b c c b b c c
Y b Y c Y f b c f
c c Y c f f f f b b c c Y f f Y c c S Y b
f p t f p t
h H R h h h R H I h R Hf p t
R h h h R H h R H
δ σ σ σ ρ ρ ρ σ σ σ ρ ρ ρσ λ σ ρ ρ ρ ρ ρ ρ
σ σ σ ρ ρ ρ λ σ ρ ρ ρ ρ σ σ λ σ
= ± − + + − + = + + + +( )
( ) ( )( )
2 20 , , ,2 2 2
,
2 , , , 0 0
, , ,
39
, , , , , , ,
b
Y f f Y c c S Y b b
Y b b
f f c c b b
Y b Y c Y f b c f
Y f f Y c c S Y b b
h
I L h R H hh H
h R H hf p t
h R H h
σ σ λ σσ ρ ρ ρσ σ σ ρ ρ ρ
σ σ λ σ
+ + + + + = + +
(C.30)

252
f1 is further divided into g1N and g1D
( ) ( )( )
( ) ( ) ( )
1 , , 0 0
1 , , , 0 0
1 , , ,
2 2 21 , , 0 0 , , 0 0 ,
1 , , ,
, , , , , ,, , , , , , ,
, , , , ,
, , , , , , 3 6
, , ,
N Y b Y c b c f
Y b Y c Y f b c f
D Y b Y c Y f b c f
N Y b Y c b c f c c f b Y c Y b f f f b b f c c Y b b b b c c
D Y b Y c Y f b
g p tf p t
g
g p t H R h h h h R H p t h h R H
g
σ σ ρ ρ ρσ σ σ ρ ρ ρ σ σ σ ρ ρ ρσ σ ρ ρ ρ λ σ σ ρ ρ ρ ρ ρ σ ρ ρσ σ σ ρ
=
= − + + + + ( ) ( )( )2 2
, , , , ,, ,c f c c f f f f b b f c c Y c Y f f Y c c S Y c Y b bR h h h R H h R H hρ ρ λ ρ ρ ρ ρ ρ σ σ σ λ σ σ= + + + +
(C.31)
f2 is also divided into g2N and g2D
( ) ( )( )
( ) ( )
2 , , , 0 0
2 , , , 0 0
2 , , ,
2 20 , , ,2 2 2
2 , , , 0 0 ,
2 , ,
, , , , , , ,, , , , , , ,
, ,
3, , , , , , , 9
N Y b Y c Y f b c f
Y b Y c Y f b c f
D Y b Y c Y f
Y f f Y c c S Y b b
N Y b Y c Y f b c f Y b b
f f c c b b
D Y f f Y c c
g p tf p t
g
I L h R H hg p t h H
h R H h
g h R H
σ σ σ ρ ρ ρσ σ σ ρ ρ ρ σ σ σσ σ λ σσ σ σ ρ ρ ρ σ ρ ρ ρ
σ σ
=
+ + = + + + = +( ),S Y b bhλ σ +
(C.32)
g2N is then further divided into j2N and j2D. j2N is then divided into 6 piece j2Na through
j2Nf
( ) ( )( )
( )( )
2 , , , 0 0
2 , , , 0 0
2 ,
2 , , , 0 0 2 2 2 2 2 2
2 2 2 2 2 2 2 4 22 , , , ,
, , , , , , ,, , , , , , ,
, , ,
, , , , , , ,
, , , , 9
N Y b Y c Y f b c f
N Y b Y c Y f b c f
D Y c b c f
N Y b Y c Y f b c f Na Nb Nc Nd Ne Nf
Na Y b Y c b c f b c c f Y b Y c f f f
j p tg p t
j
j p t j j j j j j
j h H R h h
σ σ σ ρ ρ ρσ σ σ ρ ρ ρ σ ρ ρ ρσ σ σ ρ ρ ρσ σ ρ ρ ρ λ σ σ ρ ρ
=
= + + + + +
= +( )( )( ) ( )( )( )
2 2 2 2 2 2 2 3 3 2
2 2 2 2 2 2 2 2 2 2 22 , , 0 0 0 0 , ,
2 4 42 , 0 0 0 0
2 2 2
, , , , , , 36 2
, , , , 36
b b f c c f f b b f f c c f b b c c
Nb Y b Y c b c f b c c f Y b Y c b b f f f b b f b b c c f f c c f c c
Nc Y b b c b Y
h R H h h h R H h R H
j p t h H R h p t h h h h R H h R H R H
j p t h p t
ρ ρ ρ ρ ρ ρ ρ ρ ρ ρσ σ ρ ρ ρ λ σ σ ρ ρ ρ ρ ρ ρ ρ ρ ρ ρ ρσ ρ ρ σ
+ + + +
= − + + + +
= ( )( )( ) ( )( )
2 2 2 2 2 2,
2 2 2 2 2 2 3 2 2 3 22 , , , 0 0 0 0 , , , , ,
2 2 2 2 2 2 2 2 32 , , , 0 0 0 0 , , ,
2
, , , , , 3
, , , , , , 3
b b b b b c c c c
Nd Y b Y c Y f f c c f f Y f Y c f Y c c f S Y c Y b f b
Ne Y b Y c Y f b f c c f f b Y f Y c f b Y c c b S Y
h h R H R H
j p t L R h p t h R Hh h h
j p t L R h p t h h R Hh
ρ ρ ρ ρσ σ σ ρ λ ρ σ σ σ λ σ σσ σ σ ρ ρ λ ρ ρ σ σ σ λ σ
+ +
= + +
= + +( )( ) ( )( )
2 2, ,
2 2 2 2 2 2 2 2 3 2 2 22 , , , 0 0 0 0 , , , , ,
2 2 2 2 2 4 2 2 2 2 2 2 2 2 3 3 22 , ,
, , , , , , 3
, , , 2 2 2
c Y b b
Nf Y b Y c Y f c f c c f f c Y f Y c c f Y c c S Y c Y b c b
D Y c b c f c c f Y c f f f b b f c c f f b b f f c c f b b
h
j p t L R h p t R Hh R H R Hh
j L R h h h R H h h h R H h
σσ σ σ ρ ρ λ ρ ρ σ σ σ λ σ σσ ρ ρ ρ λ σ ρ ρ ρ ρ ρ ρ ρ ρ ρ ρ ρ ρ
= + +
= + + + + +( )c cR H
(C.33)

253
Calculating Variation of Deflection
General form of Variation of Deflection Equation:
, , , 0 0, , , 0 0
Y b Y c Y f b c fY b Y c Y f b c f
p tp t
δ δ δ δ δ δ δ δδ σ σ σ ρ ρ ρσ σ σ ρ ρ ρ∂ ∂ ∂ ∂ ∂ ∂ ∂ ∂∆ = ∆ + ∆ + ∆ + ∆ + ∆ + ∆ + ∆ + ∆∂ ∂ ∂ ∂ ∂ ∂ ∂ ∂
(C.34)
( ) ( )( )
( ) ( )( )
( )( )
22 22 2 21 1 1 1
2 2 22 2
2 21 2
2 2ND N
N D DD N N DN D D
D DD D
jj jj j gg g g g x xj j j xx xx j gg g
δ
∂ ∂ ∂ ∂ ∂ − − ∂ ∂ ∂∂ ∂ ∂ = ± − ∂
(C.35)
Variation in Deflection:
, , , 0 0, , , 0 0
Y b Y c Y f b c fY b Y c Y f b c f
p tp t
δ δ δ δ δ δ δ δδ σ σ σ ρ ρ ρσ σ σ ρ ρ ρ∂ ∂ ∂ ∂ ∂ ∂ ∂ ∂∆ = ∆ + ∆ + ∆ + ∆ + ∆ + ∆ + ∆ + ∆∂ ∂ ∂ ∂ ∂ ∂ ∂ ∂
(C.36)
( )( )
( )( )( )
2 , , , 0 0
2 ,1 , , 0 0
1 , , , 2 , , ,
, , , , , , ,
, , ,, , , , , ,
, , , , , , ,
N Y b Y c Y f b c f
D Y c b c fN Y b Y c b c f
D Y b Y c Y f b c f D Y b Y c Y f
j p t
jg p t
g g
σ σ σ ρ ρ ρσ ρ ρ ρσ σ ρ ρ ρδ σ σ σ ρ ρ ρ σ σ σ= ±
(C.37)

254
( ) ( )
( )( )
( )
( )
( )
( ) ( )( )
( ) ( )( )
( )( )
1 1 22 221 1
2 22 2 2
1 2 2
221 1 1 1 2 2 2 2
22 2
2 21 2
N D DN NDD N
D D
D D D
NDD N N D D N N D
D
D DD D
g g gj jgg g
x jx x j x
x g g g
jgg g g g j j j j j xx x x x
x j gg g
δ
δ
∂ ∂ ∂ ∂− ∂∂ ∂ ∂∂ = ± − ∂ ∂ ∂ ∂ ∂ ∂− − ∂∂ ∂ ∂ ∂ ∂ = ± −∂
( ) ( )( )
( ) ( )( )
( )( )
22 22 2 21 1 1 1
2 2 22 2
2 21 2
2 2ND N
N D DD N N DN D D
D DD D
jj jj j gg g g g x xj j j xx xx j gg g
δ
∂ ∂ ∂ ∂ ∂ − − ∂ ∂ ∂∂ ∂ ∂ = ± − ∂
(C.38)
C.2 BLAST RESISTANT PANEL – 3 SOLID LAYERS
The following section contains equations and explanations for calculating the
performance and variation of performance of a BRP with three solid layers. Blast
resistant panels discussed in this section contain a solid front face sheet, a solid back face
sheet, and a solid core layer with effective material properties. Equations are adapted
from the work of Xue and Hutchinson, 2005 in “Metal Sandwich Plates Optimized for
Pressure Impulses”. References to the particular page number, equation, or paragraph
direct the reader to where the selection equations and / or assumptions are located in the
referenced Xue and Hutchinson paper. Since there is no core crushing a three solid layer
BRP the deflection equations are greatly simplified.
The following equations apply for the following cases only:
- Blasts in air only, not water
- All metal sandwich plate with square honeycomb core.

255
- The base materials are idealized to be rate-independent and perfectly plastic with
yield stresses, σY,f, σY,c, σY,b, for the front face sheet, core, and back face sheet
materials, respectively.
- The plate has width 2L, is fully clamped at both ends, and is imagined to be of
infinite extent in the y-direction (Xue and Hutchinson 2005 [p 554, last
paragraph]).
- The pulse … is taken to be uniform such that at the beginning of Stage III, KEII is
uniformly distributed over the plate (Xue and Hutchinson 2005 [p 554, last
paragraph]).
The following equations are based on the work of J. W. Hutchinson and Z. Xue in “Metal
sandwich plates optimized for pressure impulses” (Xue and Hutchonson 2005).
References are made to the page number and equation number of each equation used
from the Xue and Hutchinson paper. The nomenclature used here is identical to the
nomenclature used in the referenced paper on page 546 in the referenced paper, except
for the following:
densitysheet faceback
density material core
densitysheet facefront
strength yieldsheet faceback
strength yield material core
strength yieldsheet facefront
heightsheet faceback
heightsheet facefront
,
,
,
=
=
=
=
=
=
=
=
b
c
f
bY
cY
fY
b
f
h
h
ρρρσσσ
C.2.1 Three Stage Analysis of Dynamic Plate Response
Stage I: Fluid-Structure Interaction
For impulses in air: (Xue and Hutchinson 2005 [p 549])

256
02IIT =
2=Tf
0=Bf
2=Ff
0=wr
The pressure impulse is characterized as follows:
0/0
ttepp −
= (C.39)
(Xue and Hutchinson 2005 [p 548, paragraph 2])
Therefore, the momentum/area of the free-field pulse is:
∫ == 000 d tptpI (C.40)
(Xue and Hutchinson 2005 [p 548, paragraph 2])
The total kinetic energy/area at the end of Stage I is:
( ) ( )cf
B
wf
FI mm
I
mm
IKE
++
+=
22
22
(C.41)
(Xue and Hutchinson 2005 [p 550, equation 5])
0 ,0 air,in 0 === IfIm BBw
( ) ( )( ) ( )fff
FI m
I
m
tp
m
IKE
2
4
2
2
2
20
200
2
=== (C.42)

257
For independent face sheet thicknesses and material properties:
( )fI m
IKE
202
= (C.43)
Stage II: Core Crushing
Since the core layer of the BRP is approximated as a solid panel, there is no core
crushing. The revised equation for the kinetic energy/area of the plate at the end of stage
II is presented below.
The total kinetic energy/area at the end of Stage II is:
bbcff
II hHh
IKE
ρρρ ++=
202
(C.44)
(Xue and Hutchinson 2005 [p 551, equation 6])
Stage III: Overall Bending and Stretching
“The kinetic energy/area of the plate at the end of Stage II, KEII in Eq. (6), must be
dissipated by bending and stretching of the plate in Stage III” (Xue and Hutchinson 2005
[p 554, section 5]).
Plastic work/area dissipated in Stage III is:
[ ]
+
++=LL
Hh
LhHhW bbybbycyffy
pIII
δσδσσσ ,
2
,,,32
(C.45)
(Xue and Hutchinson 2005 [eq.16, p.555])
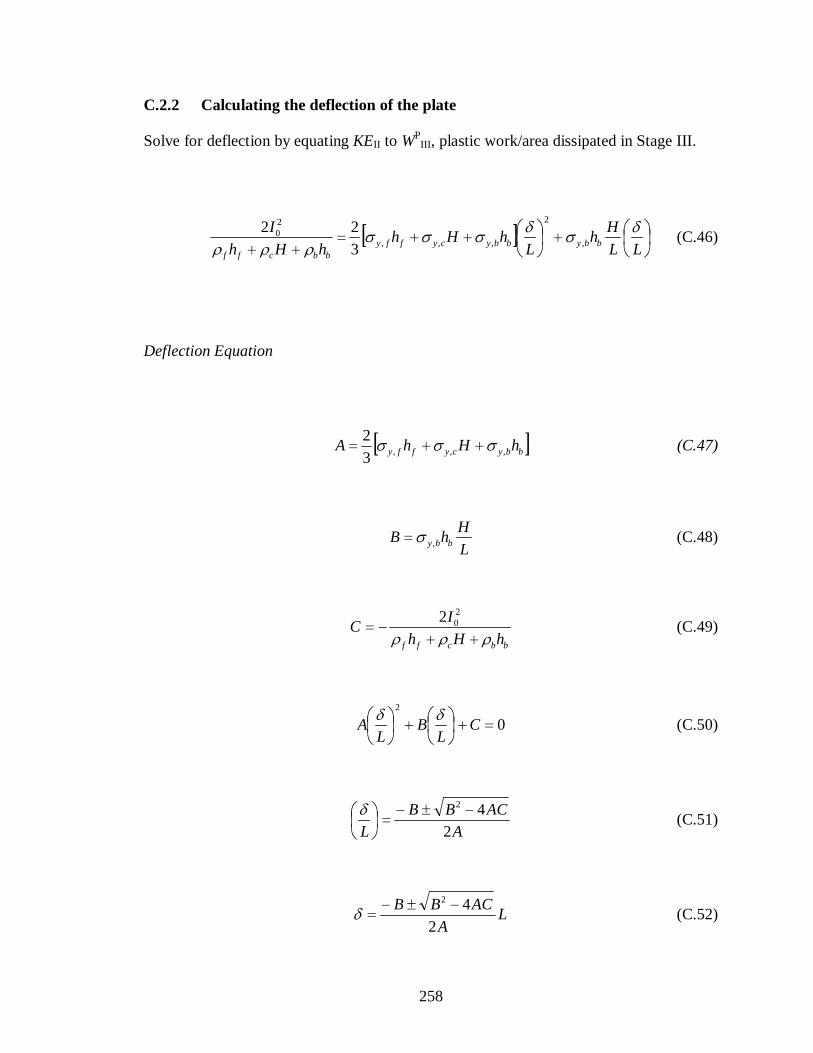
258
C.2.2 Calculating the deflection of the plate
Solve for deflection by equating KEII to WPIII , plastic work/area dissipated in Stage III.
[ ]
+
++=++ LL
Hh
LhHh
hHh
Ibbybbycyffy
bbcff
δσδσσσρρρ ,
2
,,,
20
3
22 (C.46)
Deflection Equation
[ ]bbycyffy hHhA ,,,3
2σσσ ++= (C.47)
L
HhB bby,σ= (C.48)
bbcff hHh
IC
ρρρ ++−=
202
(C.49)
02
=+
+
C
LB
LA
δδ (C.50)
A
ACBB
L 242 −±−=
δ
(C.51)
LA
ACBB
2
42 −±−=δ (C.52)

259
[ ] ( )
[ ] ++
++−
++−
±
−=
bbycyffy
bbcffbbycyffybbybby
hHh
hHh
tphHh
L
HhL
L
HhL
,,,
200
,,,
2
,,
3
22
232
4
σσσρρρσσσσσ
δ
(C.53)
[ ][ ] ( )
[ ] ++
++−
++−
±
++
−=
bbycyffy
bbcffbbycyffybby
bbycyffy
bby
hHh
hHh
tphHh
L
HhL
hHh
L
HhL
,,,
200
,,,
2
,
,,,
,
32
2
2
3
24
32
2 σσσρρρσσσσ
σσσ
σδ
(C.54)
[ ][ ]( )
[ ]bbycyffy
bbcff
bbycyffybby
bbycyffy
bby
hHh
hHh
tphHh
L
HhL
hHh
Hh
,,,
20
20,,,
2
222,
,,,
.
3
4
3
16
3
4 σσσρρρ
σσσσ
σσσσδ
++++
+++
±++
−=
(C.55)
C.2.3 Variation of Deflection Calculations
Dividing the Deflection Equation
The deflection equation is split into two function f1 and f2:
( ) ( )00,,,2,,,1 ,,,,,,,,, tpff fcbfycybyfycyby ρρρσσσσσσδ ±= (C.56)
( ) [ ]bbycyffy
bbyfycyby
hHh
Hhf
,,,
.,,,1
34
,,σσσ
σσσσ
++
−= (C.57)

260
( )[ ]( )
[ ]bbycyffy
bbcff
bbycyffybby
fcbfycyby
hHh
hHh
tphHh
L
HhL
tpf
,,,
20
20,,,
2
222,
00,,,2
3
4
316
,,,,,,,σσσ
ρρρσσσσ
ρρρσσσ++
+++++
=
(C.58)
The two functions in the deflection equation (f1 and f2) are further divided based on
numerator and denominator functions (g1N, g1D, g2N, g2D):
( ) ( )( )fycybyD
byNfycyby g
gf
,,,1
,1,,,1 ,,
,,σσσ
σσσσ = (C.59)
( ) Hhg bbybyN .,1 σσ −= (C.60)
( ) [ ]bbycyffyfycybyD hHhg ,,,,,,1 3
4,, σσσσσσ ++= (C.61)
( ) ( )( )fycybyD
fcbfycybyNfcbfycyby g
tpgtpf
,,,2
00,,,200,,,2 ,,
,,,,,,,,,,,,,,
σσσρρρσσσ
ρρρσσσ = (C.62)
( ) [ ]( )bbcff
bbycyffybbyfcbfycybyN hHh
tphHh
L
HhLtpg
ρρρσσσσ
ρρρσσσ +++++
=
20
20,,,
2
222,
00,,,2 3
16,,,,,,,
(C.63)
( ) ( )( ) [ ]( )( )bbcff
bbycyffybbcffbbyfcbfycybyN hHhL
tphHhLhHhHhtpg
ρρρσσσρρρσ
ρρρσσσ++
+++++=
2
20
20,,,
2222,
00,,,2 3
163,,,,,,,
(C.64)

261
( ) [ ]bbycyffyfycybyD hHhg ,,,,,,2 3
4,, σσσσσσ ++= (C.65)
g2N is further divided into j2N and j2D
( ) ( )( )fcbD
fcbfycybyNfycybyN j
tpjg
ρρρρρρσσσ
σσσ,
,,,,,,,,
,2
00,,,,2,,,2 = (C.66)
( ) ( )( ) [ ]( )20
20,,,
2222,00,,,,2 163,,,,,, tphHhLhHhHhtpj bbycyffybbcffbbyfcbfycybyN σσσρρρσρρρσσσ +++++=
(C.67)
( ) ( )bbcfffcbD hHhLj ρρρρρρ ++= 2,2 3, (C.68)
Calculating Variation of Deflection
General form of Variation of Deflection Equation:
, , , 0 0, , , 0 0
Y b Y c Y f b c fY b Y c Y f b c f
p tp t
δ δ δ δ δ δ δ δδ σ σ σ ρ ρ ρσ σ σ ρ ρ ρ∂ ∂ ∂ ∂ ∂ ∂ ∂ ∂∆ = ∆ + ∆ + ∆ + ∆ + ∆ + ∆ + ∆ + ∆∂ ∂ ∂ ∂ ∂ ∂ ∂ ∂
(C.69)
( ) ( )( )
( ) ( )( )
( )( )
22 22 2 21 1 1 1
2 2 22 2
2 21 2
2 2ND N
N D DD N N DN D D
D DD D
jj jj j gg g g g x xj j j xx xx j gg g
δ
∂ ∂ ∂ ∂ ∂ − − ∂ ∂ ∂∂ ∂ ∂ = ± − ∂
(C.70)

262
Variation in Deflection:
, , , 0 0, , , 0 0
Y b Y c Y f b c fY b Y c Y f b c f
p tp t
δ δ δ δ δ δ δ δδ σ σ σ ρ ρ ρσ σ σ ρ ρ ρ∂ ∂ ∂ ∂ ∂ ∂ ∂ ∂∆ = ∆ + ∆ + ∆ + ∆ + ∆ + ∆ + ∆ + ∆∂ ∂ ∂ ∂ ∂ ∂ ∂ ∂
(C.71)
( )( )
( )( )( )
2 , , , 0 0
2 ,1 , , 0 0
1 , , , 2 , , ,
, , , , , , ,
, , ,, , , , , ,
, , , , , , ,
N Y b Y c Y f b c f
D Y c b c fN Y b Y c b c f
D Y b Y c Y f b c f D Y b Y c Y f
j p t
jg p t
g g
σ σ σ ρ ρ ρσ ρ ρ ρσ σ ρ ρ ρδ σ σ σ ρ ρ ρ σ σ σ= ± (C.72)
( ) ( )
( )( )
( )
( )
( )
( ) ( )( )
( ) ( )( )
( )( )
1 1 22 221 1
2 22 2 2
1 2 2
221 1 1 1 2 2 2 2
22 2
2 21 2
N D DN NDD N
D D
D D D
NDD N N D D N N D
D
D DD D
g g gj jgg g
x jx x j x
x g g g
jgg g g g j j j j j xx x x x
x j gg g
δ
δ
∂ ∂ ∂ ∂− ∂∂ ∂ ∂∂ = ± − ∂ ∂ ∂ ∂ ∂ ∂− − ∂∂ ∂ ∂ ∂ ∂ = ± −∂
( ) ( )( )
( ) ( )( )
( )( )
22 22 2 21 1 1 1
2 2 22 2
2 21 2
2 2ND N
N D DD N N DN D D
D DD D
jj jj j gg g g g x xj j j xx xx j gg g
δ
∂ ∂ ∂ ∂ ∂ − − ∂ ∂ ∂∂ ∂ ∂ = ± − ∂
(C.73)
C.3 BLAST RESISTANT PANEL – 1 SOLID LAYER
The following section contains equations and explanations for calculating the
performance and variation of performance of a BRP with one solid layer. Blast resistant
panels discussed in this section contain one solid with effective material properties.
Equations are adapted from the work of Xue and Hutchinson, 2005 in “Metal Sandwich
Plates Optimized for Pressure Impulses”. References to the particular page number,

263
equation, or paragraph direct the reader to where the selection equations and / or
assumptions are located in the referenced Xue and Hutchinson paper.
The following equations apply for the following cases only:
- Blasts in air only, not water
- All metal sandwich plate with square honeycomb core.
- The base materials are idealized to be rate-independent and perfectly plastic
- The plate has width 2L, is fully clamped at both ends, and is imagined to be of
infinite extent in the y-direction (Xue and Hutchinson 2005 [p 554, last
paragraph]).
- The pulse … is taken to be uniform such that at the beginning of Stage III, KEII is
uniformly distributed over the plate (Xue and Hutchinson 2005 [p 554, last
paragraph]).
The following equations are based on the work of J. W. Hutchinson and Z. Xue in “Metal
sandwich plates optimized for pressure impulses” (Xue and Hutchonson 2005).
References are made to the page number and equation number of each equation used
from the Xue and Hutchinson paper. The nomenclature used here is identical to the
nomenclature used in the referenced paper on page 546 in the referenced paper, except
for the following:
density
strength yield
panel theofheight
=
=
=
ρσ Y
h

264
C.3.1 Three Stage Analysis of Dynamic Plate Response
Stage I: Fluid-Structure Interaction
For impulses in air: (Xue and Hutchinson 2005 [p 549])
02IIT =
2=Tf
0=Bf
2=Ff
0=wr
The pressure impulse is characterized as follows:
0/0
ttepp −
= (C.74)
(Xue and Hutchinson 2005 [p 548, paragraph 2])
Therefore, the momentum/area of the free-field pulse is:
∫ == 000 d tptpI (C.75)
(Xue and Hutchinson 2005 [p 548, paragraph 2])
Stage II: Core Crushing
Since the core layer of the BRP is approximated as a solid panel, there is no core
crushing. The revised equation for the kinetic energy/area of the plate at the end of stage
II is presented below.

265
The total kinetic energy/area at the end of Stage II is:
h
IKEII ρ
202
= (C.76)
(Xue and Hutchinson 2005 [p 551, equation 6])
Stage III: Overall Bending and Stretching
“The kinetic energy/area of the plate at the end of Stage II, KEII in Eq. (6), must be
dissipated by bending and stretching of the plate in Stage III” (Xue and Hutchinson 2005
[p 554, section 5]).
Plastic work/area dissipated in Stage III is:
[ ]
+
=LL
hh
LhW yy
pIII
δσδσ2
32
(C.77)
(Xue and Hutchinson 2005 [eq.16, p.555])
C.3.2 Calculating the deflection of the plate
Solve for deflection by equating KEII to WPIII , plastic work/area dissipated in Stage III.
[ ]
+
=LL
hh
Lh
h
Iyy
δσδσρ22
0
322
(C.78)

266
Deflection Equation
[ ]hA yσ3
2= (C.79)
L
hB y
2
σ= (C.80)
h
IC
ρ
202
−= (C.81)
02
=+
+
C
LB
LA
δδ (C.82)
A
ACBB
L 242 −±−=
δ
(C.83)
LA
ACBB
2
42 −±−=δ (C.84)
[ ][ ] L
h
h
Ih
L
h
L
h
y
yyy
−
−
±
−
=σ
ρσσσδ
3
22
2
3
24
20
222
(C.85)

267
[ ][ ]
[ ]
−
−
±
−
=h
h
Ih
L
hL
h
L
hL
y
yy
y
y
σρσσ
σ
σδ
3
22
2
3
24
3
22
20
222
(C.86)
[ ][ ]( )
[ ]h
h
tph
L
hL
h
h
y
yy
y
y
σρ
σσ
σσδ
34
3
16
34
20
20
2
42
2+
±−= (C.87)
C.3.3 Variation of Deflection Calculations
Dividing the Deflection Equation
The deflection equation is divided into two functions f1 and f2:
( ) ( )0021 ,,, tpff yy ρσσδ ±= (C.88)
[ ]h
hf
y
y
σ
σ
34
2
1
−= (C.89)
[ ]( )[ ]h
h
tph
L
hL
f
y
yy
σ
ρσσ
34
3
1620
20
2
42
2
+
= (C.90)
The two functions in the deflection equation (f1 and f2) are further divided based on
numerator and denominator functions (g1N, g1D, g2N, g2D):

268
( ) ( )( )yD
yNy g
gf
σ
σσ
1
11 = (C.91)
( ) 21 hg yyN σσ −= (C.92)
( ) [ ]hg yyD σσ3
41 = (C.93)
( ) ( )( )yD
yNy g
tpgtpf
σρσ
ρσ2
002002
,,,,,, = (C.94)
( ) [ ]( )h
tph
L
hLtpg yy
yN ρσσ
ρσ20
20
2
42
002 3
16,,, +
= (C.95)
( ) ( )( ) [ ]( )hL
tphLhhLtpg yy
yN ρσρσ
ρσ2
20
20
242
002 3
163,,,
+= (C.96)
( ) [ ]hg yyD σσ3
42 = (C.97)
g2N is further divided into j2N and j2D
( ) ( )( )ρρσ
σD
yNyN j
tpjg
2
0022
,,,= (C.98)
( ) ( )( ) [ ]( )20
20
242002 163,,, tphLhhtpj yyyN σρσρσ += (C.99)

269
( ) hLj D ρρ 22 3= (C.100)
Calculating Variation of Deflection
General form of Variation of Deflection Equation:
, , , 0 0, , , 0 0
Y b Y c Y f b c fY b Y c Y f b c f
p tp t
δ δ δ δ δ δ δ δδ σ σ σ ρ ρ ρσ σ σ ρ ρ ρ∂ ∂ ∂ ∂ ∂ ∂ ∂ ∂∆ = ∆ + ∆ + ∆ + ∆ + ∆ + ∆ + ∆ + ∆∂ ∂ ∂ ∂ ∂ ∂ ∂ ∂
(C.101)
( ) ( )( )
( ) ( )( )
( )( )
22 22 2 21 1 1 1
2 2 22 2
2 21 2
2 2ND N
N D DD N N DN D D
D DD D
jj jj j gg g g g x xj j j xx xx j gg g
δ
∂ ∂ ∂ ∂ ∂ − − ∂ ∂ ∂∂ ∂ ∂ = ± − ∂
(C.102)
Variation in Deflection:
, , , 0 0, , , 0 0
Y b Y c Y f b c fY b Y c Y f b c f
p tp t
δ δ δ δ δ δ δ δδ σ σ σ ρ ρ ρσ σ σ ρ ρ ρ∂ ∂ ∂ ∂ ∂ ∂ ∂ ∂∆ = ∆ + ∆ + ∆ + ∆ + ∆ + ∆ + ∆ + ∆∂ ∂ ∂ ∂ ∂ ∂ ∂ ∂
(C.103)
( )( )
( )( )( )
2 , , , 0 0
2 ,1 , , 0 0
1 , , , 2 , , ,
, , , , , , ,
, , ,, , , , , ,
, , , , , , ,
N Y b Y c Y f b c f
D Y c b c fN Y b Y c b c f
D Y b Y c Y f b c f D Y b Y c Y f
j p t
jg p t
g g
σ σ σ ρ ρ ρσ ρ ρ ρσ σ ρ ρ ρδ σ σ σ ρ ρ ρ σ σ σ= ±
(C.104)

270
( ) ( )
( )( )
( )
( )
( )
( ) ( )( )
( ) ( )( )
( )( )
1 1 22 221 1
2 22 2 2
1 2 2
221 1 1 1 2 2 2 2
22 2
2 21 2
N D DN NDD N
D D
D D D
NDD N N D D N N D
D
D DD D
g g gj jgg g
x jx x j x
x g g g
jgg g g g j j j j j xx x x x
x j gg g
δ
δ
∂ ∂ ∂ ∂− ∂∂ ∂ ∂∂ = ± − ∂ ∂ ∂ ∂ ∂ ∂− − ∂∂ ∂ ∂ ∂ ∂ = ± −∂
( ) ( )( )
( ) ( )( )
( )( )
22 22 2 21 1 1 1
2 2 22 2
2 21 2
2 2ND N
N D DD N N DN D D
D DD D
jj jj j gg g g g x xj j j xx xx j gg g
δ
∂ ∂ ∂ ∂ ∂ − − ∂ ∂ ∂∂ ∂ ∂ = ± − ∂
(C.105)

271
APPENDIX D
VERIFICATION AND VALIDATION OF COMPUTATIONAL
DESIGN TOOLS IN BRP DESIGN
In the following section, a look at the validity of the computational design tools used in
calculating BRP design solutions is presented by addressing the following topics: BRP
computational models, BRP finite element analysis, and BRP impulse loading analysis.
The BRP computational models were developed in conjunction with Stephanie
Thompson of the Systems Realization Lab at Georgia Tech. The BRP finite element
analysis and BRP impulse loading analysis was lead by Jin Song, a former undergraduate
researcher in the Systems Realization Lab at Georgia Tech. The intellectual
contributions of Stephanie and Jin are essential to the development and verification of
BRP performance analysis models.
Computational Models
The computational models are BRP performance prediction tools implemented in
MATLAB and used to predict the performance of a BRP designed at various levels of
model complexity. The equations used in generating BRP computational models are
based on the work of Hutchinson and Xue (Hutchinson and Xue 2005). Equations for
calculating the deflection and energy absorption of a BRP are provided in detail in
Appendix C. The BRP performance computational models are one aspect of a BRP
multilevel design template. In addition to the computational models, design goals,
constraints, bounds, preferences, mapping functions and a solution finding algorithm are
used to form a domain-specific, computer executable design template for the multilevel
robust design of BRPs.

272
Confidence is built in the validity of the computational models due to the fact that they
are based on existing performance calculations of BRPs found in the literature
(Hutchinson and Xue 2005). Although the equations for BRP deflection are taken
directly from the work of Hutchinson and Xue, BRP deflection solutions calculated as
part of the research in this thesis do not match the deflection results published by
Hutchinson and Xue (Hutchinson and Xue 2005). Deflection calculations based on the
work in this thesis disagree with published deflection calculations by approximately an
order of 2. After rigorous examination for possible errors, researches in the Systems
Realization Lab at Georgia Tech are confident that the BRP performance equations have
been implemented correctly. Due to this inconsistency, researchers in the SRL at
Georgia Tech have contacted Hutchinson and Xue in an effort to resolve this in
consistency. Since this issue is not yet resolved, it is left as future work in the BRP
design project.
Finite Element Analysis
To provide further validation to the computational design tools used to predict BRP
performance, finite element analysis (FEA) of BRP performance using the commercial
software package, ABAQUS (ABAQUS 2005), is currently being conducted.
Information regarding BRP analysis using ABAQUS is contributed by Jin Song a former
undergraduate researcher in the Systems Realization Lab at Georgia Tech. Current BRP
analysis using ABAQUS is conducted by Gautam Puri, undergraduate researcher in the
Systems Realization Lab at Georgia Tech. Once a BRP design solution is obtained, a 3D
model of the designed BRP is imported to ABAQUS for further deformation analysis.
An example of a BRP analyzed in ABAQUS is shown in Figure D.1.

273
Figure D.1 – BRP deflection analyzed in ABAQUS (contributed by Jin Song)
Current efforts to validate the mathematical models used to predict BRP performance
using FEA are in progress. Modeling material behavior in a material modeling FEA
program is a significant research challenge requiring many iterations. No FEA solutions
are currently available for BRP performance comparison, and this portion of model
validation will be addressed in the future work of BRP design.
Analyzing BRP performance using FEA will become extremely valuable in the future
when BRP design continues to increase in complexity. For example, there is a research
interest in filling various cells in the BRP core layer with a ceramic particle powder. It is
assumed that this will further decrease BRP deflection without significantly increasing
panel mass. Analyzing complex phenomena such as energy dissipation in ceramic
particles will most likely be completed using FEA software.

274
BRP Impulse Loading Analysis
A close approximation for impulse load is modeled as a spherical wave, shown in the
following equation, where θ is the angle of incidence, pr is the reflected pressure, pi is the
incident pressure, and p0 is the average peak pressure (Neuberger, et al. 2006).
( ) ( ) ( ) ( )( )θθθ cos2cos1cos 2i
2r −++= pptp (D.1)
However, the computational models used in BRP deflection calculations implemented in
this thesis assume a uniform pressure wave across the front face sheet of the panel,
varying as a function of time. The pressure vs. time equation implemented in BRP
loading in this thesis is presented below.
( ) 0/0
tteptp −
= (D.2)
The uniform pressure wave assumption used in this thesis is compared to a spherical
pressure wave in order to provide additional validation of the BRP performance models.
Uniform and spherical pressure waves are compared by loading a single solid panel in
ABAQUS, and measuring maximum deflection of the panel. An example of a loaded
single panel is shown in Figure D.2.
A single solid panel is modeled in ABAQUS and loaded using a uniform pressure wave
with peak pressure P0 and a spherical pressure wave with peak pressure P0. The
maximum deflection of the panel is calculated. The material properties of the panel are
modeled as rolled homogeneous armor (RHA) steel in half of the simulations and
magnesium alloy in half of the simulations. The purpose of this experiment is to
determine the difference in deflection when a panel undergoes uniform versus spherical

275
loading, assuming equal peak pressure in each loading scenario. A secondary goal in this
experiment is to determine to role of material properties in a comparison of uniform
versus spherical pressure loading.
Figure D.2 – Single panel deflection analyzed in ABAQUS (Contributed by Jin Song)
Results from this experiment are shown in Figure D.3. For peak pressure values less than
100 MPa, uniform pressure waves produce greater deflection in both RHA steel and Mg
alloy plates. However, at a peak pressure of 200 MPa, it is observed that for a RHA steel
panel, a spherical pressure produces greater panel deflection than a uniform pressure
wave. This anomaly in the data should be investigated further to see if material
properties and peak pressure influence the relationship in deflection of a panel under
uniform and spherical loading.

276
Deflection vs. Peak Pressure for Solid Plate
0
10
20
30
40
50
60
0 50 100 150 200
Peak Pressure (MPa)
Def
lect
ion
(cm
)
Uniform Pressure - RHA Steel Spherical Pressure - RHA SteelUniform Pressure - Mg Alloy Spherical Pressure - Mg Alloy
P0 = 45.2 MPa
Figure D.3 – A comparison of uniform and spherical loading conditions on a solid plate
(Contributed by Jin Song)
After analyzing the results, it is obvious that for large values of peak pressure
(approximately greater than 45 MPa), a uniform pressure wave is not a good
approximation for a spherical pressure wave. Therefore, further investigation is
conducted to more accurately approximate spherical waves using uniform waves by
multiplying the peak pressure by a certain scaling factor. The graphs in Figure D.4 show
a comparison of spherical and uniform pressure waves on a single solid Mg alloy panel.
Notice that a spherical peak pressure of P0,spherical = 90.4 MPa and a uniform peak
pressure of P0,uniform = 22.6 MPa result in similar values for maximum panel deflection.
This indicates that it is possible that a scaling factor can be applied to uniform pressure
calculations in order to more accurately model a spherical pressure load.

277
Uniform loading
P0 = 22.6 MPa
Mg solid plate
Similar maximum displacement
Spherical loading
P0 = 90.4 MPa
Mg solid plate
Figure D.4 – A comparison of peak pressure values for uniform and spherical loading
conditions resulting in similar panel deflection (Contributed by Jin Song)

278
APPENDIX E
DATA POINTS FOR BRP PARETO CURVES
In Appendix E, data points used to describe BRP Pareto curves in Figure 5.17 are
presented. Outliers for each data set are highlighted in grey.
Table E.1 – Pareto curve data points supporting Figure 5.17
GOAL WEIGHTING PERFORMANCE
Deflection Mass Deflection (cm) Mass (kg/m2) Figure 5.17 (a)
1 0 1.4476 130.9667 0.9 0.1 1.4364 130.9699 0.8 0.2 1.4441 130.9665 0.7 0.3 1.4493 130.9658 0.6 0.4 1.4500 130.9636 0.5 0.5 1.4503 130.9635 0.4 0.6 1.4491 130.9637 0.3 0.7 1.4506 130.9635 0.2 0.8 1.4496 130.9741 0.1 0.9 1.4448 130.8562
0 1 1.463 130.5252
Deflection HD-EMIδ Deflection (cm) Variation of deflection (cm)
Figure 5.17 (b)
1 0 1.4476 0.9132 0.9 0.1 1.4504 0.9146 0.8 0.2 1.4505 0.9147 0.7 0.3 1.4505 0.9147 0.6 0.4 1.4500 0.9144 0.5 0.5 1.4482 0.9135 0.4 0.6 1.4474 0.9130 0.3 0.7 1.4498 0.9143 0.2 0.8 1.446 0.9028 0.1 0.9 1.4361 0.9017
0 1 1.433 0.9051
Mass HD-EMIM Mass (kg/m2) Variation of mass (kg/m2)
Figure 5.17 (c)
1 0 130.5252 18.9747 0.9 0.1 130.5665 18.9761 0.8 0.2 130.2430 18.9284 0.7 0.3 130.5773 18.9792 0.6 0.4 130.5013 18.9656 0.5 0.5 130.7811 19.0094

279
Table E.1 (continued) – Pareto curve data points supporting Figure 5.17
0.4 0.6 125.0214 16.8977 0.3 0.7 130.8203 19.0139 0.2 0.8 130.8432 19.0176 0.1 0.9 130.8748 19.0148
0 1 130.9941 19.0056
Deflection HD-EMIM Deflection (cm) Variation of mass (kg/m2)
Figure 5.17 (d)
1 0 1.4476 19.0333 0.9 0.1 1.4494 19.0343 0.8 0.2 1.4475 19.0329 0.7 0.3 1.4493 19.0340 0.6 0.4 1.4500 19.0361 0.5 0.5 1.4503 19.0361 0.4 0.6 1.4505 19.0361 0.3 0.7 1.4495 19.0359 0.2 0.8 1.4512 19.0361 0.1 0.9 1.4515 19.0362
0 1 1.455 19.0056
Mass HD-EMIδ Mass (kg/m2) Variation of deflection (cm)
Figure 5.17 (e)
1 0 130.5252 0.9215 0.9 0.1 130.9749 0.9156 0.8 0.2 130.9643 0.9152 0.7 0.3 130.9650 0.9152 0.6 0.4 130.9658 0.9151 0.5 0.5 130.9664 0.9152 0.4 0.6 130.9679 0.9151 0.3 0.7 131.1077 0.9030 0.2 0.8 131.0096 0.9120 0.1 0.9 131.0159 0.8991
0 1 130.9711 0.9051
HD-EMIδ HD-EMIM Variation of deflection (cm)
Variation of mass (kg/m2)
Figure 5.17 (f)
1 0 0.9051 19.0289 0.9 0.1 0.9115 19.1190 0.8 0.2 0.9120 18.9716 0.7 0.3 0.9118 19.1228 0.6 0.4 0.8597 18.9796 0.5 0.5 0.9152 19.0332 0.4 0.6 0.9152 19.0336 0.3 0.7 0.9152 19.0343 0.2 0.8 0.9153 19.0345 0.1 0.9 0.9154 19.0356
0 1 0.9167 19.0056

280
REFERENCES
ABAQUS/Explicit, 2005. Providence, RI. ABAQUS, Inc.
Andradottir, S., 1998, "Simulation Optimization," Handbook of Simulation (J. Banks, Ed.), John Wiley & Sons, Inc., New York.
Automation Creations, Inc., MatWeb Material Property Data [online database], URL: www.matweb.com [cited August 9, 2006].
Belegundu, A. D. and S. Zhang, 1992, “Robustness of Design through Minimum Sensitivity,” ASME Journal of Mechanical Design, Vol. 114, pp. 213-217.
Bisgaard, S. and B. Ankenman, 1995, “Analytic Parameter Design,” Quality Engineering, Vol. 8, No. 1, pp. 75-91.
Cagan, J. and B. C. Williams, 1993, "First-Order Necessary Conditions for Robust Optimality," ASME Advances in Design Automation, Albuqueque, NM, pp. 539-549.
Chen, W., 1995, A Robust Concept Exploration Method fo Configuring Complex Systems, PhD. Dissertation, G. W. Woodruff School of Mechanical Engineering, Georgia Institute of Technology, Atlanta, GA.
Chen, W., J. K. Allen, K.-L. Tsui and F. Mistree, 1996, “A Procedure for Robust Design: Minimizing Variations Caused by Noise Factors and Control Factors,” ASME Journal of Mechanical Design, Vol. 118, No. 4, pp. 478-485.
Chen, W., R. Garimella and N. Michelena, 2001, “Robust Design for Improved Vehicle Handling Under Range of Maneuver Conditions,” Engineering Optimization, Vol. 33, No. 3, pp. 2-22.
Chen, W. and K. Lewis, 1999, “A Robust Design Approach for Achieving Flexibility in Multidisciplinary Design,” AIAA Journal, Vol. 37, No. 8, pp. 982-989.

281
Choi, H., 2005, A Robust Design Method for Model and Propagated Uncertainty, PhD. Dissertation, G. W. Woodruff School of Mechanical Engineering, Georgia Institute of Technology, Atlanta.
Choi, H.-J., J. K. Allen, D. Rosen, D. L. McDowell and F. Mistree, 2005, "An Inductive Design Exploration Method for the Integrated Design of Multi-scale Materials and Products," ASME 31st Design Automation Conference, Long Beach, CA. DETC2005-85335.
Cochran, J. K., K. J. Lee, D. L. McDowell and T. H. Sanders, 2000, "Low Density Monolithic Honeycombs by Thermal Chemical Processing," Proceedings of the 4th Conference of Aerospace Materials, Processes, and Environmental Technology, Huntsville, AL.
Du, X. and W. Chen, 2000, “Towards a Better Understanding of Modeling Feasibility Robustness in Engineering Design,” ASME Journal of Mechanical Design, Vol. 122, No. 4, pp. 385-394.
Gere, J. M., 2001, Mechanics of Materials, Fifth Edition, Brooks/Cole, Pacific Grove, CA.
Fleck, N. A. and V. S. Deshpande, 2004, “The Resistance of Clamped Sandwich Beams to Shock Loading,” Journal of Applied Mechanics, Vol. 71, pp. 386-401.
Hutchinson, J. W. and Z. Xue, 2005, “Metal sandwich plates optimized for pressure impulses,” International Journal of Mechanical Sciences, Vol. 47, pp. 545–569.
Ignizio, J. P., 1985, “Multiobjective Mathematical Programming via the Multiplex Model and Algorithm,” European Journal of Operational Research, Vol. 22, pp. 338-346.
Koch, P. N., T. W. Simpson, J. K. Allen and F. Mistree, 1999, “Statistical Approximations for Multidisciplinary Design Optimization: The Problem of Size,” Journal of Aircraft, Vol. 36, No. 1, pp. 275-286.
Koehler, J. R. and A. B. Owen, 1996, "Computer Experiments," Handbook of Statistics (S. Ghosh and C. R. Rao, Eds.), Elsevier Science, New York, Vol. 13, pp. 261-308.

282
Liu, J. S., 2001, Monte Carlo Strategies in Scientific Computing, Springer, New York.
MATLAB, Software Package, Ver. 7.0.1.24704(R14) Service Pack 1.The Mathworks, Inc, Natick, MA, 2004.
“Matweb Material Property Data”, www.matweb.com (Accessed November 11, 2005).
Mavris, D. N., O. Bandte and D. A. DeLaurentis, 1999, “Robust Design Simulation: A Probabilistic Approach to Multidisciplinary Design,” Journal of Aircraft, Vol. 36, No. 1, pp. 298-307.
McKay, M. D., R. J. Beckman and W. J. Conover, 1979, “A Comparison of three Methods for Selecting Values of Input Variables in the Analysis of Output from a Computer Code,” Quality Engineering, Vol. 11, No. 3, pp. 417-425.
Mistree, F., W. F. Smith, B. A. Bras, J. K. Allen and D. Muster, 1990, “Decision-Based Design: A Contemporary Paradigm for Ship Design,” Transactions, Society of Naval Architects and Marine Engineers, Vol. 98, pp. 565-597.
Mistree, F., O. F. Hughes and B. A. Bras, 1993a, "The Compromise Decision Support Problem and the Adaptive Linear Programming Algorithm," Structural Optimization: Status and Promise (M. P. Kamat, Ed.), AIAA, Washington, D.C., pp. 247-286.
Mistree, F., W. F. Smith and B. A. Bras, 1993b, “A Decision Based Approach to Concurrent Engineering,” Handbook of Concurrent Engineering (H.R. Paresai and W. Sullivan, Ed.), pp. 127-158.
Mistree, F., K. Lewis and L. Stonis, 1994, "Selection in the Conceptual Design of Aircraft," in Proceedings of the 5th AIAA/USAF/NASA/ISSMO Symposium on Recent Advances in Multidisciplinary Analysis and Optimization, Panama City, FL, pp. 1153-1166.
Muchnick, H., S. C. Thompson, E. Samadiani, J. K. Allen, Y. Joshi and F. Mistree, 2006, "Exploring the Advantages of Materials Design in a Product Design Process," IDETC/CIE, DETC2006-99492, Philadelphia, PA.

283
Myers, R. H. and D. C. Montgomery, 1995, Response Surface Methodology: Process and Product Optimization Using Designed Experiments, John Wiley and Sons, New York.
Nair, V. N., 1992, “Taguchi's Parameter Design: A Panel Discussion,” Technometrics, Vol. 34, pp. 127-161.
Neuberger, A., S. Peles and D. Rittel, 2006, “Scaling the response of circular plates subjected to large and close-range spherical explosions. Part I: Air-blast loading,” International Journal of Impact Engineering, Vol. 34, pp. 859-873.
Olson, G. B., 1997, Computational Design of Hierarchically Structured Materials, in Science. 277, 1237-1242.
Pahl, G. and W. Beitz, 1996, Engineering Design, A Systematic Approach, Springer-Verlag London Limited.
Panchal, J. H., 2005, A Framework for Simulation-based Integrated Design of Products and Design Processes, PhD. Dissertation, G. W. Woodruff School of Mechanical Engineering, Georgia Institute of Technology, Atlanta, GA.
Panchal, J. H., M. G. Fernandez, C. J. J. Paredis and F. Mistree, 2004, "Reusable Design Processes via Modular, Executable, Decision-Centric Templates," 10th AIAA/ISSMO Multidisciplinary Analysis and Optimization Conference, Albany, New York, USA. Paper Number: AIAA-2004-4601.
Parkinson, A., C. Sorensen and N. Pourhassan, 1993, “A General Approach for Robust Optimal Design,” ASME Journal of Mechanical Design, Vol. 115, No. 1, pp. 74-80.
Pedersen, K., J. Emblemsvag, J. K. Allen and F. Mistree, 2000, "Validating Design Methods and Research–The Validation Square," IDETC/CIE, DETC2000-14579, Baltimore, MD.
Phadke, M. S., 1989, Quality Engineering Using Robust Design, Prentice Hall, Englewood Cliffs, NJ.

284
Seepersad, C. C., 2004, A Robust Topological Preliminary Design Exploration Method with Materials Design Applications, PhD. Dissertation, G. W. Woodruff School of Mechanical Engineering, Georgia Institute of Technology, Atlanta.
Seepersad, C. C., K. Pedersen, J. Emblemsvag, R. R. Bailey, J. K. Allen and F. Mistree, 2005, "The Validation Square: How Does One Verify and Validate a Design Method?," Decision-Based Design: Making Effective Decisions in Product and Systems Design (W. Chen, K. Lewis and L. Schmidt, Eds.), ASME Press, New York, NY, Chapter 25, pp. 305-316.
Schnell, A. R., 2006, Use of Decision-Centric Templates in the Design of a Separation Column for a Microscale Gas Chromatography System, MS Thesis, G. W. Woodruff School of Mechanical Engineering, Georgia Institute of Technology, Atlanta, GA.
Simon, H. A., 1996, The Sciences of the Artificial, Cambridge: MIT Press.
Simpson, T. W., 1998, A Concept Exploration Method for Product Family Design, PhD. Dissertation, G. W. Woodruff School of Mechanical Engineering, Georgia Institute of Technology, Atlanta, GA.
Simpson, T. W., W. Chen, J. K. Allen and F. Mistree, 1996, “Conceptual Design of a Family of Products Through the Use of the Robust Concept Exploration Method,” 6th AIAA/USAF/NASA/ISSMO Symposium on Multidisciplinary Analysis and Optimization, AIAA-1996-4161, Bellevue, WA.
Simpson, T. W., J. R. A. Maier and F. Mistree, 2001, “Product Platform Design: Method and Application,” Research in Engineering Design, Vol. 13, No. 1, pp. 2-22.
Su, J. and J. E. Renaud, 1997, “Automatic Differentiation in Robust Optimization,” AIAA Journal, Vol. 35, No. 6, pp. 1072-1079.
Taguchi, G., 1986, Introduction to Quality Engineering, Asian Productivity Organization, Tokyo.
Taguchi, G., 1987, System of Experimental Design: Engineering Methods to Optimize Quality and Minimize Costs, UNIPUB/Kraus International Publications.

285
Taguchi, G., 1993, Taguchi on Robust Technology Development: Bringing Quality Engineering Upstream, ASME Press, New York, NY.
Taguchi, G. and D. Clausing, 1990, “Robust Quality,” Harvard Business Review, Vol. Jan/Feb, pp. 65-75.
Taylor, G. I., 1963, The Pressure and Impulse of Submarine Explosion Waves on Plates, Cambridge University Press, Cambridge.
The Mathworks, Inc., "fmincon," Optimization Toolbox User's Guide [online user's guide], Version 3, URL: www.mathworks.com/access/helpdesk/help/toolbox/ optim/ug/fmincon.html [cited August 29, 2006].
Thompson, S. C., H. Muchnick, H.-J. Choi, D. McDowell, J. K. Allen and F. Mistree, 2006, "Robust Materials Design of Blast Resistant Panels," AIAA/ISSMO Multidisciplinary Analysis and Optimization Conference, Portsmouth, VA. Paper Number: AIAA 2006-7005.
Tsui, K.-L., 1992, “An Overview of Taguchi Methods and Newly Developed Statistical Methods for Robust Design,” IIE Transactions, Vol. 24, No. 5, pp. 44-57.
Tsui, K.-L., 1996, “A Critical Look at Taguchi's Modeling Approach for Robust Design,” Journal of Applied Statistics, Vol. 23, No. 1, pp. 81-95.
Welch, W. J., T. K. Yu, S. M. Kand and J. Sacks, 1990, “Computer Experiments for Quality Control by Parameter Design,” Journal of Quality Technology, Vol. 22, pp. 15-22.
Wang, A.-J. and D. L. McDowell, 2005, “Yield surfaces of various periodic metal honeycombs at intermediate relative density,” International Journal of Plasticity, Vol. 21, pp. 285-320.
Yu, J. and K. Ishii, 1994, "Robust Design by Matching the Design with Manufacturing Variation Patterns," ASME Design Automation Conference, Minneapolis, MN, pp. 7-14.