Embed Size (px)
Citation preview
W P C A
Worldwide Pollution Control Association
WPCA-Duke Energy
FGD Wastewater
Treatment Seminar
March 7, 2013
Visit our website at www.wpca.info
All presentations posted on this website are copyrighted by the Worldwide Pollution
Control Association (WPCA). Any unauthorized downloading, attempts to modify or to
incorporate into other presentations, link to other websites, or to obtain copies for any
other purposes than the training of attendees to WPCA Conferences is expressly
prohibited, unless approved in writing by the WPCA or the original presenter. The
WPCA does not assume any liability for the accuracy or contents of any materials
contained in this library which were presented and/or created by persons who were
not employees of the WPCA.
Protection notice / Copyright notice
Trends & Observations
from a WFGD Effluent
Characterization Study
FGD Wastewater Treatment Seminar March 7, 2013 Duke Energy Corporate Headquarters, Charlotte, NC Stephen E. Winter Siemens Environmental Systems & Services (SESS)
© Siemens. All rights reserved
© Siemens. All rights reserved
Outline
Background
Characterization and Why It is Important
SESS Study
Methodology
Trends & Observations
Recap
© Siemens. All rights reserved
Background - Regulatory
National Effluent Guidelines last revised (1982)
Significant deployment of WFGD since due to tighter air quality regulations
Stricter local, NPDES, and regional water quality limits
Federal concern over power plant waters and discharges → WFGD
EPA “Steam” Study (2009) & ICR (2010) → Hg, Se, As, Cd, V, B, N, Organics
New Guidelines - Review (2012), Implementation (2014)
© Siemens. All rights reserved
Characterization and Why It Is Important
Critical design criteria for WWT strategy is influent composition
FGD effluent is dynamic and difficult to benchmark
Mercury and Selenium chemistry affected by FGD effluent composition
Waste water treatment performance can be significantly impacted
More knowledge and data to inform the rulemaking
Helps to ensure sound guidelines are not over reaching of WWT technology
© Siemens. All rights reserved
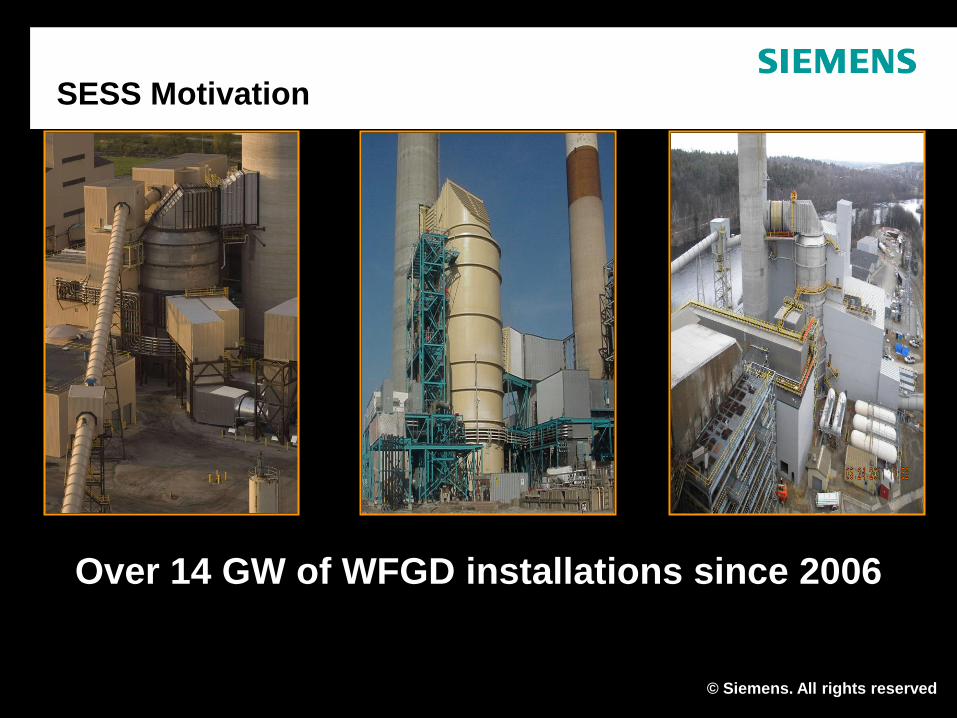
SESS Motivation
Over 14 GW of WFGD installations since 2006
© Siemens. All rights reserved
SESS Study - Goals
Better understanding of complex chemistry with respect to operations & WWT
Assess relative impact from coal, reagents, APC, operations, other factors
Robust data set for inclusion in USEPA review
Sound basis for A&E’s to specify required APC & WWT equipment
© Siemens. All rights reserved
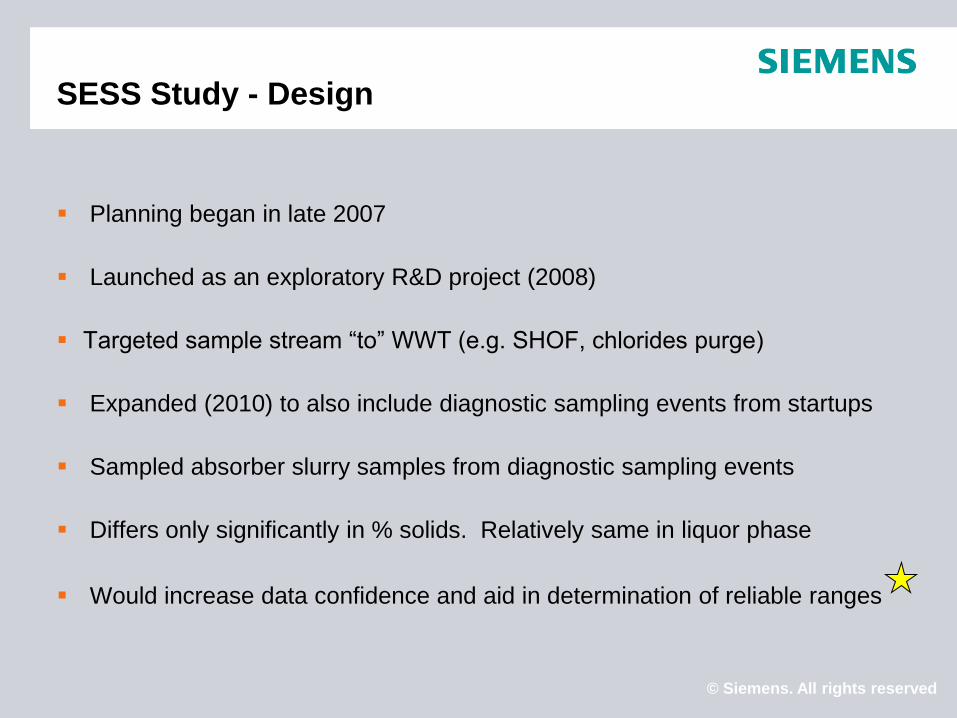
SESS Study - Design
Planning began in late 2007
Launched as an exploratory R&D project (2008)
Targeted sample stream “to” WWT (e.g. SHOF, chlorides purge)
Expanded (2010) to also include diagnostic sampling events from startups
Sampled absorber slurry samples from diagnostic sampling events
Differs only significantly in % solids. Relatively same in liquor phase
Would increase data confidence and aid in determination of reliable ranges
© Siemens. All rights reserved
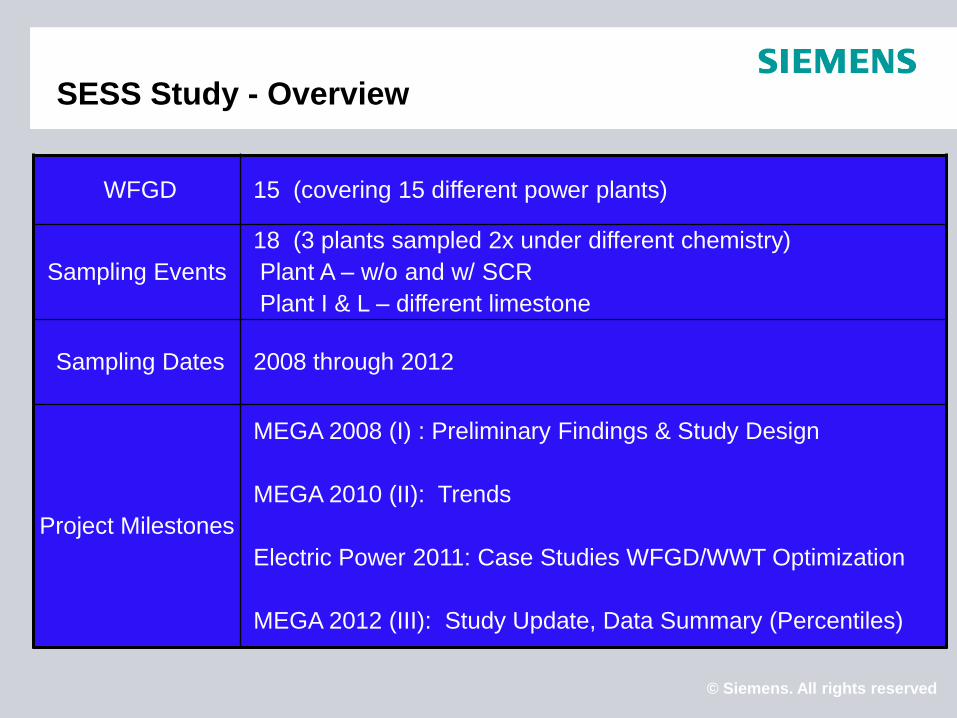
SESS Study - Overview
WFGD 15 (covering 15 different power plants)
Sampling Events
18 (3 plants sampled 2x under different chemistry)
Plant A – w/o and w/ SCR
Plant I & L – different limestone
Sampling Dates 2008 through 2012
Project Milestones
MEGA 2008 (I) : Preliminary Findings & Study Design
MEGA 2010 (II): Trends
Electric Power 2011: Case Studies WFGD/WWT Optimization
MEGA 2012 (III): Study Update, Data Summary (Percentiles)
© Siemens. All rights reserved
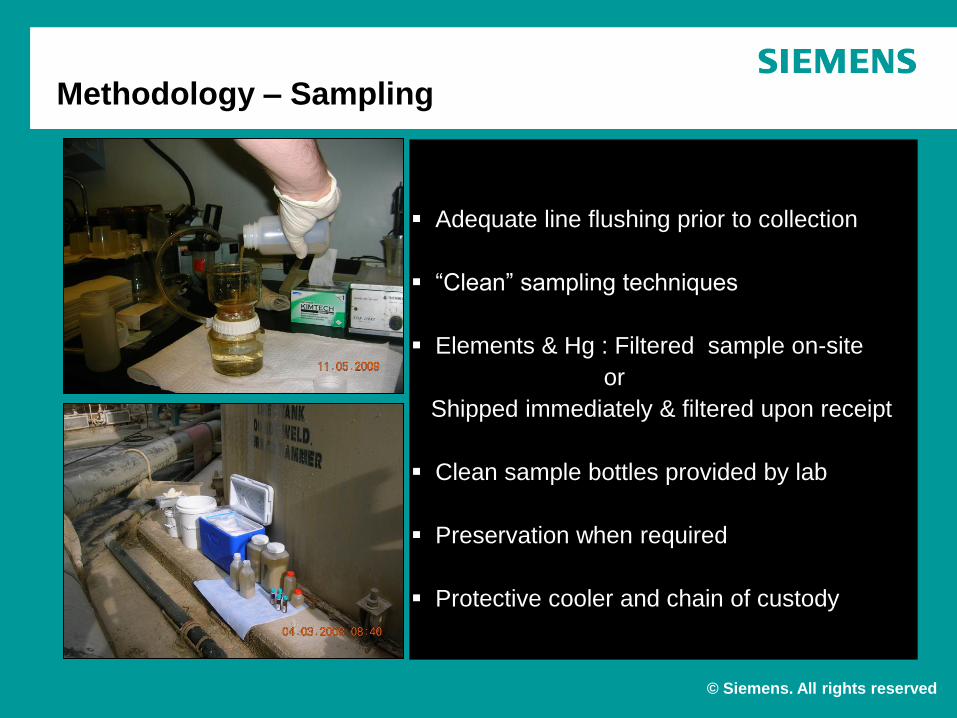
Methodology – Sampling
Adequate line flushing prior to collection
“Clean” sampling techniques
Elements & Hg : Filtered sample on-site
or
Shipped immediately & filtered upon receipt
Clean sample bottles provided by lab
Preservation when required
Protective cooler and chain of custody
© Siemens. All rights reserved
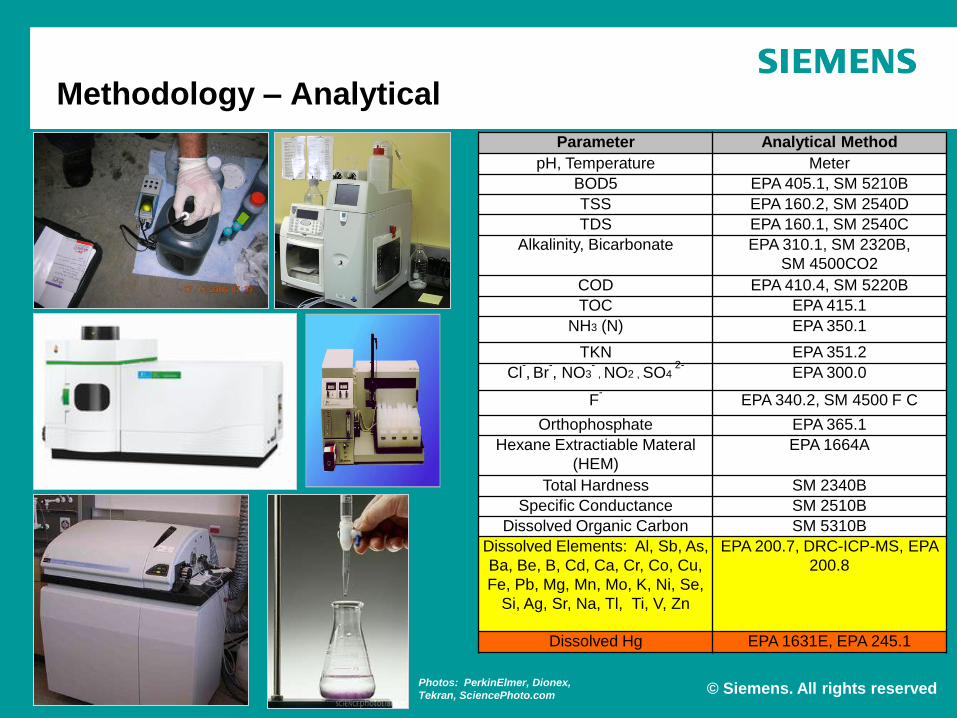
Methodology – Analytical
Photos: PerkinElmer, Dionex,
Tekran, SciencePhoto.com
Parameter Analytical Method
pH, Temperature Meter
BOD5 EPA 405.1, SM 5210B
TSS EPA 160.2, SM 2540D
TDS EPA 160.1, SM 2540C
Alkalinity, Bicarbonate EPA 310.1, SM 2320B,
SM 4500CO2
COD EPA 410.4, SM 5220B
TOC EPA 415.1
NH3 (N) EPA 350.1
TKN EPA 351.2
Cl-, Br
-, NO3
- , NO2 , SO4
2- EPA 300.0
F- EPA 340.2, SM 4500 F C
Orthophosphate EPA 365.1
Hexane Extractiable Materal
(HEM) EPA 1664A
Total Hardness SM 2340B
Specific Conductance SM 2510B
Dissolved Organic Carbon SM 5310B
Dissolved Elements: Al, Sb, As,
Ba, Be, B, Cd, Ca, Cr, Co, Cu,
Fe, Pb, Mg, Mn, Mo, K, Ni, Se,
Si, Ag, Sr, Na, Tl, Ti, V, Zn
EPA 200.7, DRC-ICP-MS, EPA
200.8
Dissolved Hg EPA 1631E, EPA 245.1
© Siemens. All rights reserved
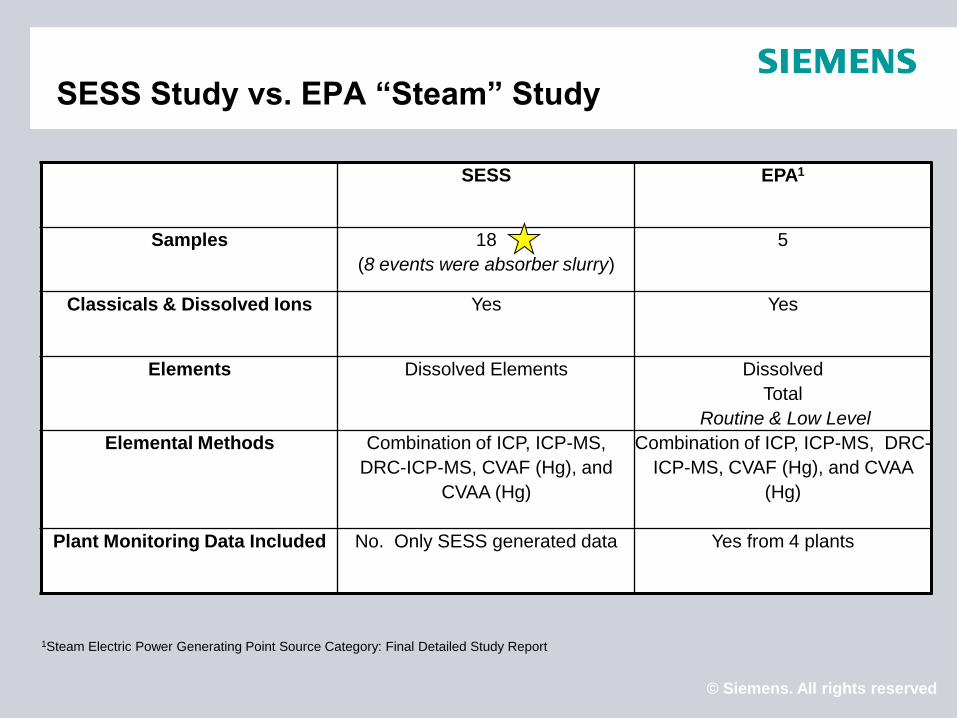
SESS Study vs. EPA “Steam” Study
SESS EPA1
Samples 18
(8 events were absorber slurry)
5
Classicals & Dissolved Ions Yes Yes
Elements Dissolved Elements Dissolved
Total
Routine & Low Level
Elemental Methods Combination of ICP, ICP-MS,
DRC-ICP-MS, CVAF (Hg), and
CVAA (Hg)
Combination of ICP, ICP-MS, DRC-
ICP-MS, CVAF (Hg), and CVAA
(Hg)
Plant Monitoring Data Included No. Only SESS generated data Yes from 4 plants
1Steam Electric Power Generating Point Source Category: Final Detailed Study Report

© Siemens. All rights reserved
Trends & Observations – Mercury
195
0
1
2
3
4
5
6
7
8
9
10
A A B C D E F G H I I J K L M O
Plant
µg/L
Min 0.04
10th % 0.04
Median 0.50
90th % 5.54
Max 195
# 16
ORP ~ 200 -250
99.8% Hg on solids
© Siemens. All rights reserved
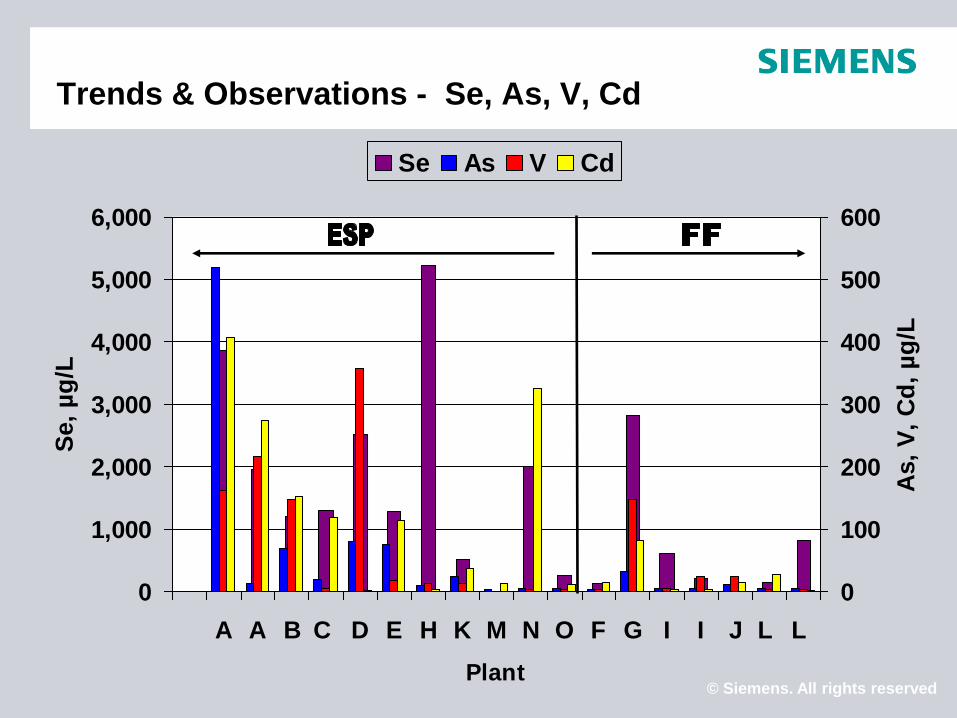
Trends & Observations - Se, As, V, Cd
0
1,000
2,000
3,000
4,000
5,000
6,000
A A B C D E H K M N O F G I I J L L
Plant
Se,
µg
/L
0
100
200
300
400
500
600
As,
V,
Cd
, µ
g/L
Se As V Cd
© Siemens. All rights reserved
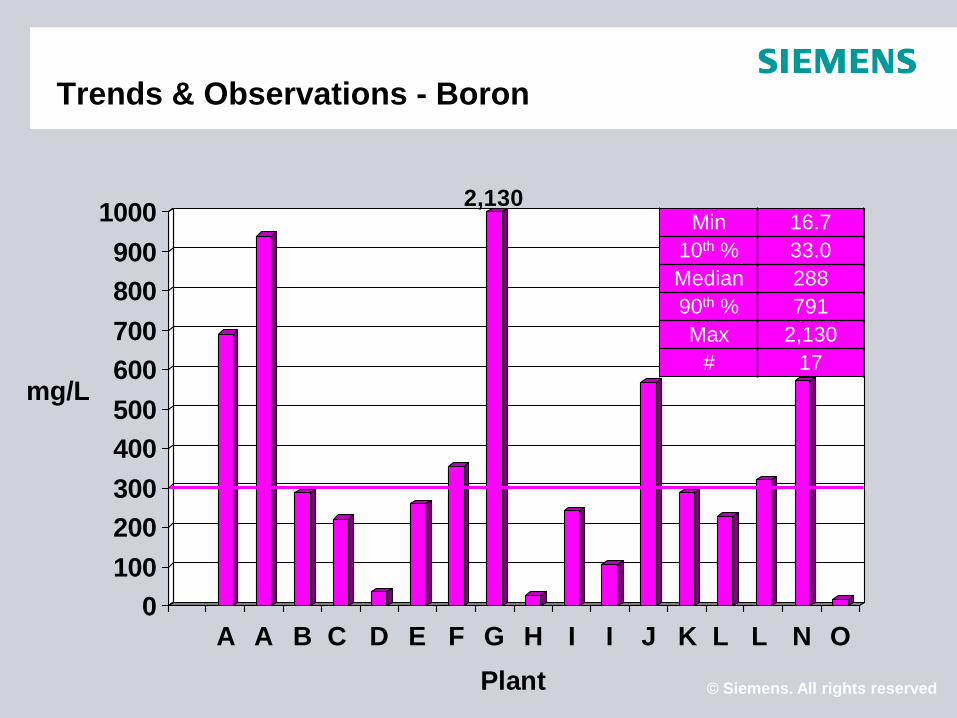
Trends & Observations - Boron
2,130
0
100
200
300
400
500
600
700
800
900
1000
A A B C D E F G H I I J K L L N O
Plant
mg/L
Min 16.7
10th % 33.0
Median 288
90th % 791
Max 2,130
# 17
© Siemens. All rights reserved
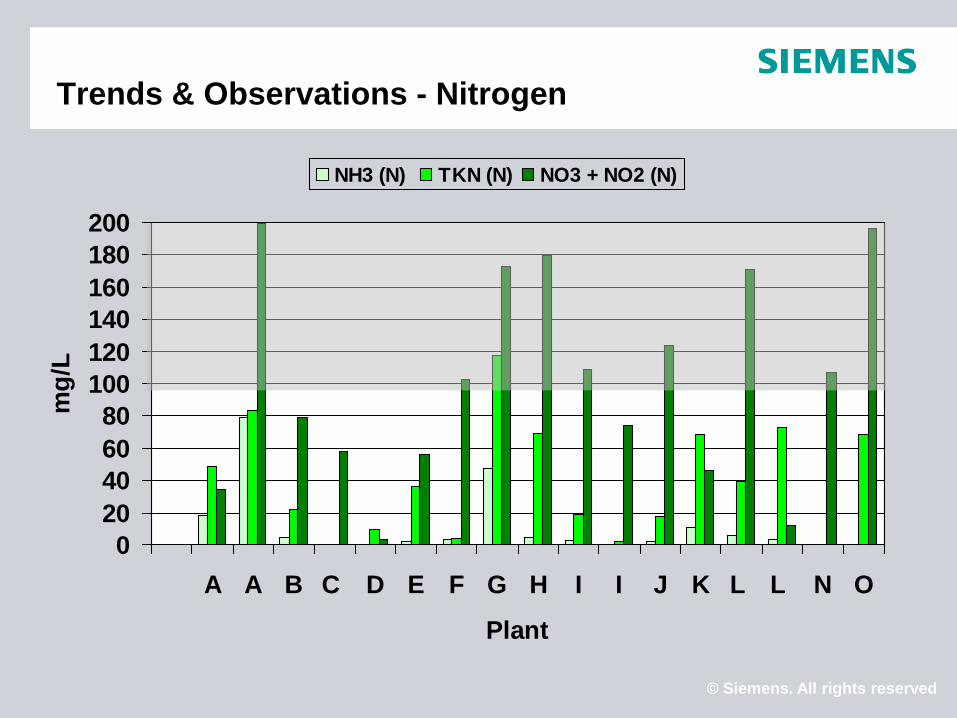
Trends & Observations - Nitrogen
0
20
40
60
80
100
120
140
160
180
200
A A B C D E F G H I I J K L L N O
Plant
mg
/L
NH3 (N) TKN (N) NO3 + NO2 (N)
© Siemens. All rights reserved
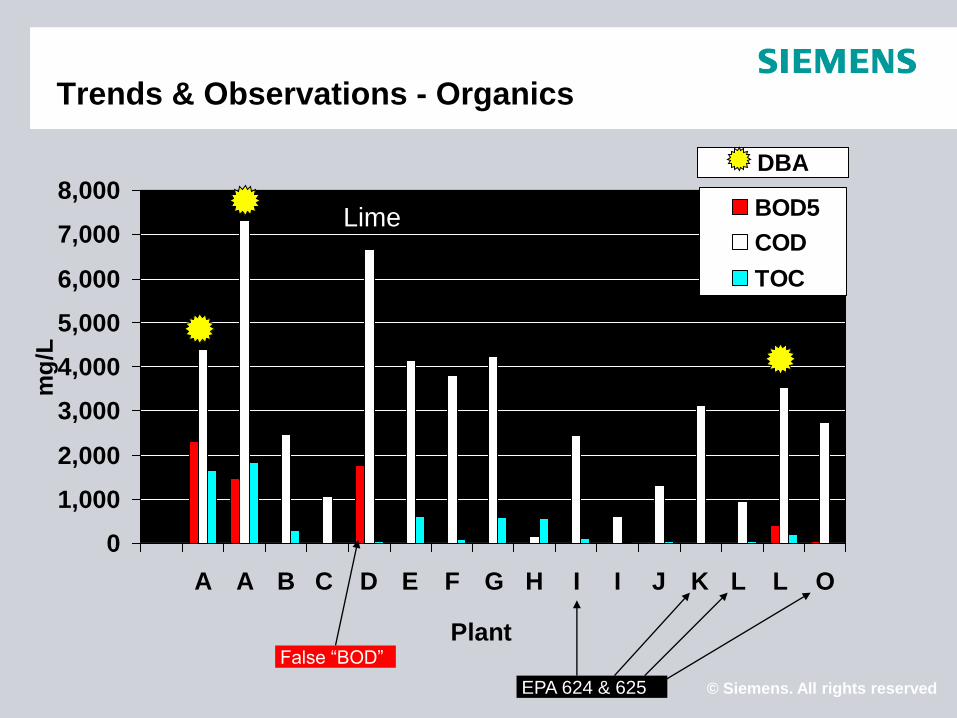
Trends & Observations - Organics
0
1,000
2,000
3,000
4,000
5,000
6,000
7,000
8,000
A A B C D E F G H I I J K L L O
Plant
mg
/L
BOD5
COD
TOC
DBA
EPA 624 & 625
Lime
False “BOD”
© Siemens. All rights reserved
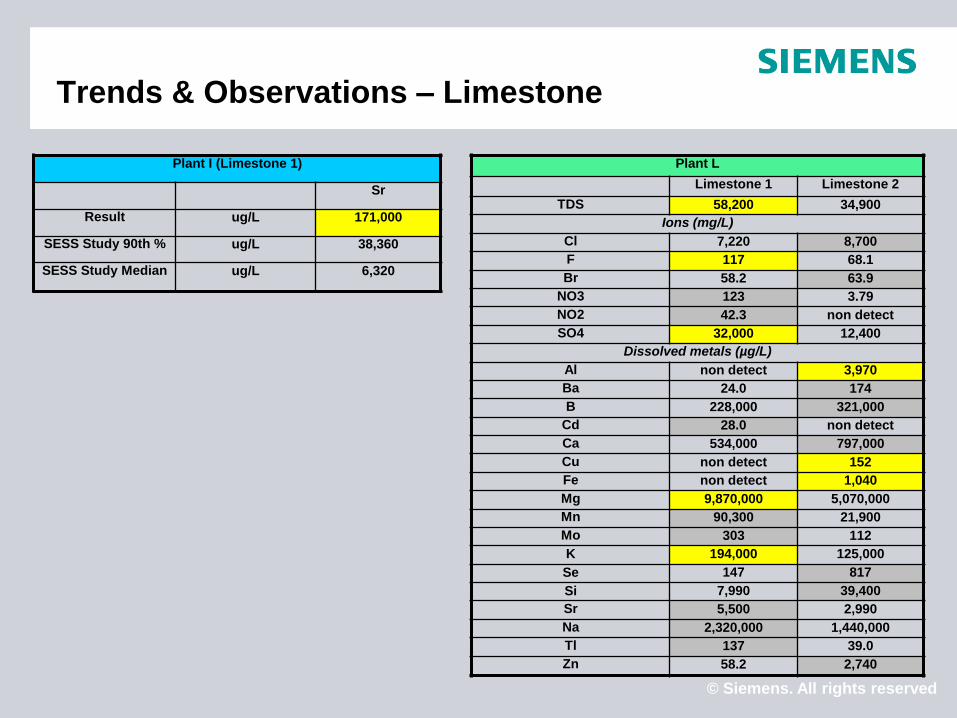
Trends & Observations – Limestone
Plant I (Limestone 1)
Sr
Result ug/L 171,000
SESS Study 90th % ug/L 38,360
SESS Study Median ug/L 6,320
Plant L
Limestone 1 Limestone 2
TDS 58,200 34,900
Ions (mg/L)
Cl 7,220 8,700
F 117 68.1
Br 58.2 63.9
NO3 123 3.79
NO2 42.3 non detect
SO4 32,000 12,400
Dissolved metals (µg/L)
Al non detect 3,970
Ba 24.0 174
B 228,000 321,000
Cd 28.0 non detect
Ca 534,000 797,000
Cu non detect 152
Fe non detect 1,040
Mg 9,870,000 5,070,000
Mn 90,300 21,900
Mo 303 112
K 194,000 125,000
Se 147 817
Si 7,990 39,400
Sr 5,500 2,990
Na 2,320,000 1,440,000
Tl 137 39.0
Zn 58.2 2,740
© Siemens. All rights reserved
Recap
Hg
1. Relatively low liquor phase mercury concentrations across SESS fleet 2. Other measurements (ORP & % Hg in solids) suggest ideal partitioning for effective Hg removal 3. Design strategy contribute (I.e. larger recycle tanks & longer retention times)?
Se, As, Cd, V 1. Considerably lower concentrations in WFGD effluent with a FF vs. ESP 2. FF offers reduced load on WWT for key regulatory elements (plus overall solids($) to WWT) 3. Is FF (or an upgraded ESP) part of the solution for MATS + Revised Effluent Guidelines?
Boron 1. No observable trends
Nitrogen 1. No observable trends 2. Possible correlation between N concentration and foaming? Further investigation required
Organics 1. BOD5 (and maybe TOC) not COD corresponds to organics in WFGD effluent
Limestone Quality – Impact on WFGD effluent 1. Can severely disrupt WFGD and WWT with operational problems 2. Can change liquor chemistry significantly (dissolved ions and elements) 3. High levels of inerts can add to solids load to WWT