Embed Size (px)
Citation preview
H:\N1037 WOLLONGONG COASTAL CREEKS & LAGOONS\DOCS\R.N1037.001.01.DOC 16/1/06 17:01

H:\N1037 WOLLONGONG COASTAL CREEKS & LAGOONS\DOCS\R.N1037.001.01.DOC 16/1/06 17:01
Wollongong Coastal Creeks and Lagoons Data
Compilation and Review
Prepared For: Wollongong City Council
Prepared By: WBM Oceanics Australia
Offices
Brisbane Denver
Karratha Melbourne
Morwell Newcastle
Sydney Vancouver

H:\N1037 WOLLONGONG COASTAL CREEKS & LAGOONS\DOCS\R.N1037.001.01.DOC 16/1/06 17:01
DOCUMENT CONTROL SHEET
Document: R.N1037.001.01.doc
Title: Wollongong Creeks and Lagoons Data Compilation and Review
Project Manager: Philip Haines
Author: Michelle Fletcher
Client: Wollongong city Council
Client Contact: Dr Tony Miskiewicz
Client Reference:
WBM Oceanics Australia Newcastle Office: 126 Belford Street BROADMEADOW NSW 2292 Australia PO Box 266 Broadmeadow NSW 2292 Telephone (02) 4940 8882 Facsimile (02) 4940 8887 www.wbmpl.com.au ACN 010 830 421
Synopsis: This report documents a review of available data for 10 estuarine watercourses along the northern Illawarra Coastline.
REVISION/CHECKING HISTORY
REVISION NUMBER
REVISION DESCRIPTION
DATE CHECKED BY ISSUED BY
0 DRAFT 24/6/2005 PEH PEH
1 FINAL PEH MF
DISTRIBUTION
DESTINATION REVISION
0 1 2 3 4 5 6 7 8 9 10
WCC
WBM File
WBM Library
2
1
2 + elec
Elec
1

EXECUTIVE SUMMARY I
H:\N1037 WOLLONGONG COASTAL CREEKS & LAGOONS\DOCS\R.N1037.001.01.DOC 16/1/06 17:01
EXECUTIVE SUMMARY
This report documents the collation, and desk top review of existing data and references related to ten coastal creeks / lagoons located within the Wollongong LGA. This essentially satisfies Step 2 of the NSW Government’s Estuary Management Process for these systems, as defined in the Estuary Management Manual (NSW Government, 1992) although the project is being completed outside the Government’s Estuary Management Program.
The condition of the creeks / lagoons is influenced by interactions that occur across the catchment and ocean interface. These interactions have been described, where possible, based on the available information and data. A summary of this information is provided below.
Overview of available data on estuarine processes
Rain falls on the Illawarra Escarpment and flows at high velocities down the steep topography. Climate averages from the Bureau of Meteorology indicate that the majority of this rain falls between January and May. Modelling by CSIRO indicates that changes to the global climate are likely to modify the intensity and frequency of drought and flood events within the next 50 years. Some rainfall infiltrates into the underlying geology, which is characterised by Hawkesbury sandstone, the Narrabeen Group, Illawarra coal measures and the Shoalhaven Group. Interactions between the groundwater and surface water of the catchment are not well understood.
The steep escarpment and seasonally high rainfall mean that flooding is an issue for most of the creeks. This is evident through a search of historical newspaper clippings and flood studies. Flood inundation mapping for the study area is incomplete and is not considered to depict a comprehensive understanding of the probable maximum flood. Bathymetry data is unavailable, or outdated.
The creeks travel through the traditional country of Aboriginal coastal dwelling people, who are known to have actively utilised the creeks and lagoons in traditional times. European arrival saw a period of over clearing and cedar harvesting and then successive stages of agricultural, mining, industrial and urban development. Each of these activities has impacted on the present day condition of the creeks. There are significant heritage items within the catchments of the creeks that are recognised on the Australian Heritage Database, Aboriginal Heritage Information and Management System Register and Wollongong LEP.
Present day land uses continue to influence the overall water quality of the creeks and lagoons. The Wollongong LEP and air photos show that the upper catchments are generally forested, while the lower catchments are dominated by urban land uses with varying degrees of industrial activities. While routine water quality sampling has been undertaken by Council, there is no data regarding changes in water quality during and after rainfall events. Such information would be useful in identifying the sources of nutrients, sediments, heavy metals and faecal contamination from tributaries and subcatchments. EPA information on licensed point sources of pollution is not available in a format that allows catchment mapping.
Information on erosion sites and patterns of sedimentation within the creeks and lagoons is sparse. Sediment quality is an issue for at least one of the systems (Bellambi Lagoon), with sampling revealing measured results higher than the lower guideline trigger value for lead and copper.

EXECUTIVE SUMMARY II
H:\N1037 WOLLONGONG COASTAL CREEKS & LAGOONS\DOCS\R.N1037.001.01.DOC 16/1/06 17:01
There are limitations in the availability of data regarding the plants, birds, reptiles, frogs and fish which utilise the creeks and lagoons. Data on algae, mammals and fish is particularly limited. Riparian vegetation condition varies between the creeks, with those to the north generally having higher potential to function as environmental corridors. Information on estuarine flora is sparse and generally considered inadequate for the development of an estuary management plan. Both flora and fauna communities include some threatened species and communities within the catchments. Weed infestation is reportedly a significant issue.
There is a general lack of information regarding tidal inflows for the creeks and lagoons. An appreciation of the tidal hydraulics is important for understanding flow on processes, such as water quality, ecology and sediment transport. The frequency of entrance opening and closing for each of the creeks has not been documented.
Potential Management Issues, Data Gaps and Recommended Actions
Based on the review of available information, a list of potential management issues has been developed. The most evident issues identified from the existing information include a decline in water quality, loss of valued ecological communities, weed invasion, and heavy metal contamination of sediments and water column. Data gaps pertaining to these issues have been identified and a series of further studies and management actions have been recommended. These have been prioritised according to their importance in developing an Estuary Processes Study and subsequent Estuary Management Plan. This information is presented in Table 8-1.

CONTENTS III
H:\N1037 WOLLONGONG COASTAL CREEKS & LAGOONS\DOCS\R.N1037.001.01.DOC 16/1/06 17:01
CONTENTS
Executive Summary i Contents iii List of Figures v List of Tables vi
1 INTRODUCTION 1-1
2 GENERAL DESCRIPTION OF ENVIRONMENT 2-1
2.1 Climate 2-1 2.2 Climate Change 2-4 2.3 Physical environment 2-5
2.3.1 Geology 2-5 2.3.2 Topography 2-5 2.3.3 Soils 2-6
2.4 Zoning and Landuse 2-6
3 HUMAN INFLUENCES 3-1
3.1 Aboriginal Heritage 3-1 3.2 Post European arrival 3-2 3.3 Remaining Significant heritage items 3-3 3.4 Changes to creek catchments and alignment 3-4
3.4.1 Available Aerial Photography 3-4
4 ECOLOGICAL PROCESSES 4-1
4.1 Flora 4-3 4.1.1 Riparian Vegetation 4-3 4.1.2 Estuarine Flora 4-4 4.1.3 Threatened Communities 4-5 4.1.4 Weed Infestation 4-6
4.2 Fauna 4-7 4.2.1 Fisheries 4-7 4.2.2 Mammals 4-8 4.2.3 Birds 4-8 4.2.4 Reptiles and amphibians 4-8

CONTENTS IV
H:\N1037 WOLLONGONG COASTAL CREEKS & LAGOONS\DOCS\R.N1037.001.01.DOC 16/1/06 17:01
4.2.5 Macroinvertebrates and other benthos 4-9 4.2.6 Threatened Species 4-9
4.3 Further Site Specific Ecological Data 4-10 4.3.1 Hargraves Creek 4-10 4.3.2 Stanwell Creek 4-10 4.3.3 Collins Creek 4-11 4.3.4 Bellambi Lagoon 4-11 4.3.5 Tom Thumb Lagoon 4-11
5 WATER QUALITY PROCESSES 5-1
5.1 Note on Water Quality Guidelines 5-2 5.2 Physical and Chemical Indicators 5-3
5.2.1 Physio-chemical parameters 5-3 5.2.1.1 pH 5-3 5.2.1.2 Dissolved Oxygen 5-4 5.2.1.3 Salinity 5-4 5.2.1.4 Turbidity 5-5
5.2.2 Nutrients 5-5 Nitrogen 5-5 5.2.2.1 5-5 5.2.2.2 Phosphorus 5-6
5.2.3 Metals 5-6 5.3 Biological Indicators 5-7
5.3.1 Macroinvertebrates as indicators of water quality 5-7 5.3.2 Chlorophyll a 5-7 5.3.3 Bacterial 5-7
5.4 Stormwater management 5-8 5.5 Wastewater management 5-9 5.6 Other Point Sources of Water Pollution 5-9
6 SEDIMENT PROCESSES 6-1
6.1 Sediment Quality 6-1 6.1.1 Nutrient fluxes 6-6 6.1.2 Erosion and sedimentation 6-6
7 HYDRODYNAMIC PROCESSES 7-1
7.1 Tidal Flows 7-1 7.1.1 Entrance State 7-2

LIST OF FIGURES V
H:\N1037 WOLLONGONG COASTAL CREEKS & LAGOONS\DOCS\R.N1037.001.01.DOC 16/1/06 17:01
7.1.2 Ocean Conditions 7-2 7.2 Freshwater Flows 7-3 7.3 Groundwater 7-4 7.4 Bathymetry 7-4 7.5 Waves 7-5
8 CONCLUSIONS AND RECOMMENDATIONS 8-1
9 REFERENCES 9-1
APPENDIX A: GIS FIGURES A-1
APPENDIX B: WATER QUALITY DATA SUMMARY B-1
APPENDIX C: COMPILATION OF COUNCIL WATER QUALITY DATA C-1
APPENDIX D: AERIAL PHOTOGRAPHY REVIEW D-1
APPENDIX E: SYDNEY WATER NOTIFICATIONS E-1
LIST OF FIGURES
Figure 1-1 The location of the ten study site creeks along the Illawarra Coastline 1-2 Figure 2-1 Temperature and rainfall averages for the two weather stations in Wollongong
2-3 Figure 3-1 Illustration of Tom Thumb Lagoon sketched in 1841 3-2 Figure 4-1 Relative weed densities for Collins Creek (Source: Tuckett-Carr 2005) 4-7 Figure 6-1 Sediment sampling sites used by Figgis (2001) 6-3 Figure 6-2 Sediment Sampling locations in Bellambi Lagoon (Golder and Associates,
1993a) 6-6 Figure 9-1 ASS Potential and DLWC (DNR) Riparian Mapping for Hargraves, Stanwell and
Stony Creeks A-2 Figure 9-2 ASS Potential and DLWC (DNR) Riparian mapping for Flanagans and Slacky
Creeks A-3 Figure 9-3 ASS Potential and DLWC (DNR) Riparian mapping for Whartons Creek, Collins
Creek, Bellambi Gully and Bellambi Lagoon A-4 Figure 9-4 ASS Potential and DLWC (DNR) Riparian mapping for Tom Thumb Lagoon
A-5

LIST OF TABLES VI
H:\N1037 WOLLONGONG COASTAL CREEKS & LAGOONS\DOCS\R.N1037.001.01.DOC 16/1/06 17:01
Figure 9-5 Broad zoning Categories for the catchments of Hargraves Creek, Stanwell Creek and Stony Creek A-6
Figure 9-6 Broad zoning categories for the catchments of Whartons Creek, Collins Creek and Bellambi Gully A-7
Figure 9-7 Broad zoning categories for the catchment of Bellambi Lagoon A-8 Figure 9-8 Broad zoning categories for the catchment of Tom Thumb Lagoon A-9 Figure 9-9 Vegetation mapping for Hargraves Creek and Stanwell Creek A-10 Figure 9-10 Vegetation Mapping for Stony Creek A-11 Figure 9-11 Vegetation mapping for Flanagans Creek, Slacky Creek, Whartons Creek and
Collins Creek A-12 Figure 9-12 Vegetation mapping for Bellambi Gully and Bellambi Lagoon A-13 Figure 9-13 Vegetation mapping for the Tom Thumb Lagoon A-14 Figure 9-14 AHIMS Sites, Heritage Areas and Flooding Hazard areas for Hargraves,
Stanwell and Stony Creeks A-15 Figure 9-15 AHIMS Sites, Heritage Areas and identified flood areas forFlanagans, Slacky,
Whartons and Collins Creeks A-16 Figure 9-16 AHIMS Sites, Heritage Areas and identified flood areas forBellambi Gully and
Bellambi Lagoon Catchments A-17 Figure 9-17 AHIMS Sites, Heritage Areas and identified flood areas forTom thumb Lagoon
Catchment A-18
LIST OF TABLES
Table 2-1 Climate averages for wollongong Post Office collected between 1870 and 1953 (Source BOM 2005) 2-1
Table 2-2 Climate averages for data collected at Wollongong University between 1970 and 2004 (Source: BOM 2005) 2-1
Table 2-3 Evaporation and mean daily sunshine for the Nowra RAN base 2-3 Table 2-4 Changes to the Sydney Climate expected due to the enhanced Greenhouse
Effect (CSIRO, 2004) 2-4 Table 2-5 Catchment area, maximum elevation and maximum distance to the ocean for
each of the creek catchments 2-5 Table 3-1 References and data relevant to Human Influences 3-1 Table 4-1 References relevant to Ecological Processes 4-1 Table 4-2 Summary of information on the biodiversity of wetlands that occuring within
the Study Area (Source: Chafer, 1997) 4-3 Table 4-3 Saltmarsh species noted by Chafer (1997) 4-4 Table 4-4 Species recordered for Tom Thum Lagoon 4-5 Table 4-5 Threatened species recorded by Chafer 1997 4-8 Table 4-6 Information on vegetaion communities of Hargraves Creek presented in Neil
(2005) 4-10 Table 5-1 References relevant to Water Quality Processes 5-1 Table 5-2 ANZECC Default Trigger values for two ecosystem types in South East
Australia for Aquatic Ecosystems 5-2

LIST OF TABLES VII
H:\N1037 WOLLONGONG COASTAL CREEKS & LAGOONS\DOCS\R.N1037.001.01.DOC 16/1/06 17:01
Table 6-1 References relevant to Sediment Processes 6-1 Table 6-2 Metal results for sediments in Wollongong Northern Streams compared to the
ANZECC recommended Guidelines 6-2 Table 6-3 Sediment Quality results for Bellambi Lagoon compared to ISQG Guidelines
6-5 Table 7-1 References relevant to Hydrodynamic processes 7-1 Table 7-2 Observed entrance state (source: CECCS 1998) 7-2 Table 7-3 Ocean tidal statistics for Port Kembla, as reported by WCC (2002) 7-2 Table 7-4 Design Ocean Water Levels for the Hewitts Creek (incl. Slacky Creek) Flood
Study (WCC 2002) 7-2 Table 7-5 Peak Discahrges estimated for Bellambi Lagoon (Source: PWD et al., 1993)
7-4 Table 8-1 Potential Management Issues, Data Gaps and Recommended Actions 8-1 Table B-9-1 Summary of water quality data available for each of the creeks B-1

INTRODUCTION 1-1
H:\N1037 WOLLONGONG COASTAL CREEKS & LAGOONS\DOCS\R.N1037.001.01.DOC 16/1/06 17:01
1 INTRODUCTION
This report has been prepared by environmental consultants, WBM Oceanics Australia on behalf of Wollongong City Council. The report documents the collation, and desk top review of existing data and references related to ten (10) coastal creeks located within the Wollongong LGA. This essentially satisfies Step 2 of the NSW Government’s Estuary Management Process for these systems, as defined in the Estuary Management Manual (NSW Government, 1992) although the project is being completed outside the Government’s Estuary Management Program. As such the project has not received funding under DNR’s Estuary Program and an Estuary Management Committee has not been established to oversee the works (step 1).
The focus of this investigation is 10 estuarine systems located along the northern Illawarra Coastline. The Illawarra Escarpment runs close, and parallel, to the coastline making for small catchments with steep, mainly forested upper catchment areas. The 10 watercourses included in the study, from north to south, are:
• Hargraves Creek
• Stanwell Creek
• Stony Creek
• Flanagans Creek
• Slacky Creek
• Whartons Creek
• Collins Creek
• Bellambi Gully
• Bellambi Lake
• Tom Thumb Lagoon
Although these systems are individually diverse, the distinct topography of the northern Illawarra region results in some common features and characteristics. For example, tidal limits for each of the systems are less than 1km from the coastline (with the exception of Tom Thumb Lagoon). The lower, tidal sections of the waterways contain a range of urban, industrial and natural land uses.
The locations of the creeks along the Illawarra coastline are shown in Figure 1-1. All further GIS mapping is presented in Appendix A.

INTRODUCTION 1-2
H:\N1037 WOLLONGONG COASTAL CREEKS & LAGOONS\DOCS\R.N1037.001.01.DOC 16/1/06 17:01
Figure 1-1 The location of the ten study site creeks along the Illawarra Coastline
Stakeholder consultation was undertaken with key government agencies, Wollongong University and Council Officers. A list of management issues for each of the systems has been prepared and key data gaps identified. Finally, a program of additional studies to be completed in order to fill the data gaps, has been prepared. These studies would be required before formal Estuary Management Plans can be developed for the systems.

GENERAL DESCRIPTION OF ENVIRONMENT 2-1
H:\N1037 WOLLONGONG COASTAL CREEKS & LAGOONS\DOCS\R.N1037.001.01.DOC 16/1/06 17:01
2 GENERAL DESCRIPTION OF ENVIRONMENT
2.1 Climate
Wollongong has a warm temperate climate. The relatively high rainfall in the region and steep topography creates many small high velocity waterways, including those described in this study. The Bureau of Meteorology has temperature, rainfall and wind data for Wollongong extending back to 1870. Data were collected at Wollongong Post Office up until 1953, then at Wollongong University from 1970. Climatic averages for these locations are presented in Table 2-1 and Table 2-2.
Table 2-1 Climate averages for wollongong Post Office collected between 1870 and 1953 (Source BOM 2005)
Element Jan Feb Mar Apr May Jun Jul Aug Sep Oct Nov Dec %
capture
Mean daily maximum temperature - deg C 26 25.8 24.8 22.4 19.6 17.1 16.7 18.1 20.2 22.2 23.7 25.1 97
Mean daily minimum temperature - deg C 17 17.1 15.9 13.5 10.9 8.9 7.9 8.5 10.3 12.2 14 15.8 100
Mean 9am air temp - deg C 22.5 22.5 21.2 18.4 15.2 12.6 11.8 13.5 16.3 18.5 20.3 21.8 100 Mean 9am wet bulb temp - deg C 19.2 19.3 18.2 15.5 12.7 10.3 9.4 10.5 12.8 14.9 16.7 18.4 100 Mean 9am relative humidity - % 72 73 73 72 73 74 72 67 64 65 67 70 100 Mean 3pm air temp - deg C 23.2 23.4 22.4 19.8 17.4 15 14.7 15.8 17.5 19.4 20.8 22.2 98 Mean 3pm wet bulb temp - deg C 19.8 20.1 19.1 16.7 14.1 12 11.3 12 13.8 15.6 17.1 18.8 98 Mean 3pm relative humidity - % 71 73 72 71 68 68 65 63 64 66 68 71 98 Mean monthly rainfall - mm 106.8 108.7 118.5 131.2 115.8 109 91 61.4 66.7 68.1 71.9 86.5 98 Median (5th decile) monthly rainfall - mm 77.4 78.7 92.2 97.3 76.5 57.4 63.7 37.3 48.6 52.8 68.1 68.9
9th decile of monthly rainfall - mm 231.4 279.1 259.5 287.4 256.3 266.3 227 148.7 142 138.5 143.7 179.6 1st decile of monthly rainfall - mm 25.8 14.1 21.9 28 9.8 7.4 6.5 4.2 5.4 14 13.5 11.4 Mean no. of raindays 8.9 8.5 9.2 8.8 7.7 7.6 7.1 6.2 6.5 7.5 7.8 8.1 95 Highest monthly rainfall - mm 577.2 519.6 673.6 705.8 731.9 443.4 471.3 371.7 239.5 349.1 393.6 432.8 98 Lowest monthly rainfall - mm 1.8 1.3 3.3 3.8 0 0 0 0 0 8.6 2 0 98 Highest recorded daily rainfall - mm 233.7 279.4 317.5 254 244.1 153.9 205.7 137.2 162.6 190.5 224.8 216.4 96
Table 2-2 Climate averages for data collected at Wollongong University between 1970 and 2004 (Source: BOM 2005)
Element Jan Feb Mar Apr May Jun Jul Aug Sep Oct Nov Dec %Capture
Mean daily maximum temperature - deg C 26 26 25 23 20 18 17 18 20 22 23 25 98
Mean no. of days where Max Temp >= 40.0 deg C 0.1 0.1 0 0 0 0 0 0 0 0 0 0.1 99
Mean no. of days where Max Temp >= 35.0 deg C 0.7 0.5 0.2 0 0 0 0 0 0 0.1 0.4 0.6 99
Mean no. of days where Max Temp >= 30.0 deg C 3 2.5 1.3 0.3 0 0 0 0 0.4 1.6 1.7 3.4 99
Highest daily Max Temp - deg C 42 42 40 35 29 25 26 30 34 37 41 42 99 Mean daily minimum temperature - deg C 18 18 17 14 12 9.5 8.4 8.8 11 13 14 17 99
Mean no. of days where Min Temp <= 2.0 deg C 0 0 0 0 0 0.1 0.1 0 0 0 0 0 99

GENERAL DESCRIPTION OF ENVIRONMENT 2-2
H:\N1037 WOLLONGONG COASTAL CREEKS & LAGOONS\DOCS\R.N1037.001.01.DOC 16/1/06 17:01
Mean no. of days where Min Temp <= 0.0 deg C 0 0 0 0 0 0 0 0 0 0 0 0 99
Lowest daily Min Temp - deg C 9.6 10 9.5 5.6 0.5 -1 0.8 2 3.3 4.7 5.4 8.5 98
Mean 9am air temp - deg C 22 22 21 19 17 14 13 14 17 19 19 21 100
Mean 9am wet bulb temp - deg C 19 19 18 15 13 11 9.4 10 12 14 15 17 95
Mean 9am dew point - deg C 16 17 15 12 9.9 6.8 5.1 5.3 6.9 9.8 12 14 99
Mean 9am relative humidity - % 70 73 69 64 66 64 61 57 55 60 65 66 94
Mean 9am wind speed - km/h 7.4 7.5 7.7 8.3 9.4 12 12 12 12 11 9.5 8.7 96
Mean 3pm air temp - deg C 24 24 23 21 19 16 16 17 18 20 21 23 100
Mean 3pm wet bulb temp - deg C 20 20 19 17 14 12 11 12 13 15 16 18 92
Mean 3pm dew point - deg C 17 18 16 13 11 7.4 5.7 6.1 8 11 13 15 99
Mean 3pm relative humidity - % 68 69 66 63 61 57 54 52 55 61 63 64 91
Mean 3pm wind speed - km/h 15 14 13 12 11 11 12 14 15 16 16 16 97
Mean monthly rainfall - mm 135 161 171 134 115 108 60 88 64 101 114 94 100 Median (5th decile) monthly rainfall - mm 112 111 148 74 88 80 49 29 46 62 98 73
9th decile of monthly rainfall - mm 339 378 359 369 282 254 165 295 170 306 231 244
1st decile of monthly rainfall - mm 41 33 25 18 20 17 4.3 6 8.9 6.9 22 17
Mean no. of raindays 14 14 15 11 11 9.4 8.5 7.7 9 12 13 13 100
Highest monthly rainfall - mm 424 488 484 656 416 638 250 764 215 400 368 368 100
Lowest monthly rainfall - mm 23 20 12 1.8 1.9 7.4 0.4 0.6 2.8 4.4 16 14 100
Highest recorded daily rainfall - mm 138 241 248 212 158 225 199 316 102 103 146 149 100
Mean no. of clear days 6.8 5.9 7.2 8.4 9.3 9.9 13 15 11 7.8 6.5 6.4 100
Mean no. of cloudy days 13 12 13 10 12 10 8.3 7.3 8.2 11 13 13 100
Highest recorded wind gust - km/h 97 84 89 106 108 118 131 148 124 111 108 93 56
A summary of this data is also shown graphically in Figure 2-1. From this data it can be seen that Wollongong has a mild, coastal climate with winter maximum temperatures averaging about 17 degrees and a summer average maximum temperature of about 27 degrees. The average annual rainfall is 1345mm. The wettest months are January to May.

GENERAL DESCRIPTION OF ENVIRONMENT 2-3
H:\N1037 WOLLONGONG COASTAL CREEKS & LAGOONS\DOCS\R.N1037.001.01.DOC 16/1/06 17:01
Figure 2-1 Temperature and rainfall averages for the two weather stations in Wollongong
(Note that the Post Office (PO) averages are based on data collected between 1870 and 1953 and the University averages are based on data collected between 1970 and 2004).
Manly Hydraulics Laboratory has also been collecting rainfall data at Russell Vale since 1982.
The nearest BOM station for evaporation data is at the Nowra RAN Base. This data is presented in Table 2-3.
Table 2-3 Evaporation and mean daily sunshine for the Nowra RAN base Element Jan Feb Mar Apr May Jun Jul Aug Sep Oct Nov Dec %Capture Mean Daily Sunshine (hrs)
6.7 6.6 6.4 6.7 5.9 5.7 6.7 7.5 7.4 7.2 7.3 7.3 100
Mean Daily Evaporation (mm)
6.3 5.7 4.7 4.0 3.1 2.9 3.1 4.1 5.0 5.7 6.1 6.9 99
Estimates of monthly and annual evapotranspiration are also available through the Bureau of Meteorology. These can be interpreted from maps on the web page or purchased in grid format (BOM, 2005).
0
5
10
15
20
25
30
Jan Feb Mar Apr May Jun Jul Aug Sep Oct Nov Dec
Month
Tem
pera
ture
deg
C
0
20
40
60
80
100
120
140
160
180
Rai
nfal
l mm
PO Mean daily maximum temperature - deg C
UNI Mean daily maximum temperature - deg C
UNI Mean monthly rainfall - mm
PO Mean monthly rainfall - mm

GENERAL DESCRIPTION OF ENVIRONMENT 2-4
H:\N1037 WOLLONGONG COASTAL CREEKS & LAGOONS\DOCS\R.N1037.001.01.DOC 16/1/06 17:01
2.2 Climate Change
Changes to the global climate are expected within the foreseeable future due to the enhanced greenhouse effect. A build up of greenhouse gases from human activities is causing an increase in global temperatures with flow on effects for weather patterns. Greenhouse gases include methane and carbon dioxide. These gases are transparent to incoming short wave solar radiation, but they absorb the longer wavelength infrared radiation (heat) emitted by the earth. As such, excess heat is trapped within the Earth’s atmosphere.
A regionally specific indication of the magnitude of these expected changes is given in the CSIRO report Climate Changes in NSW Part 2: Projected changes in Climate Extremes (CSIRO, 2004). Using a range of different emission scenarios, climate models have been used to project climate changes in response to an average increase in global temperatures. Outcomes have been developed for 12 different sites in NSW. The site most relevant to the study area is Sydney. An indication of the magnitude of changes predicted is outlined in Table 2-4.
Table 2-4 Changes to the Sydney Climate expected due to the enhanced Greenhouse Effect (CSIRO, 2004)
Parameter Present Condition (1964-2003) 2030 2070
Days per year exceeding 35oC 3 4-6 4-18
Days per year exceeding 40 oC 0 0-1 0-4
% Change in intensity of 1 in 40 year 1 day rainfall event relative to 1961 – summer
N/A +12 +10
% Change in intensity of 1 in 40 year 1 day rainfall event relative to 1961 –autumn
N/A -3 -3
% Change in intensity of 1 in 40 year 1 day rainfall event relative to 1961 –Winter
N/A 0 -7
% Change in intensity of 1 in 40 year 1 day rainfall event relative to 1961 –Spring
N/A 0 0
Extreme rainfall intensity
N/A N/A
Increases in spring, summer and autumn,
and decreases in winter.
Storm tides
A shift in wave climate with waves from the Southeast becoming more prevalent and waves
from the northeast and east becoming less prevalent.
Sea level rise Between 0.09-0.88m between 1990 and 2100
Graphical changes in wind speed are also presented in the report.

GENERAL DESCRIPTION OF ENVIRONMENT 2-5
H:\N1037 WOLLONGONG COASTAL CREEKS & LAGOONS\DOCS\R.N1037.001.01.DOC 16/1/06 17:01
2.3 Physical environment
2.3.1 Geology
Geology of the Illawarra area has been mapped by Bowman (1974). Figgis (2001) summarised this information by stating that the region is characterised by four geological rock groups, being:
• The Shoalhaven group which underlies the coastal plane;
• The Illawarra coal measures occurring above the foothills;
• The Narrabeen group on the escarpment slope; and
• Hawkesbury sandstone, capping the escarpment.
A number of data sets are available through the online NSW Natural Resource Atlas (formerly CANRI) that apply to geology of the area. These include:
• 1:250, 000 Geology and Unit Labels
• Major Basins
• Major Geological Foldbelts
2.3.2 Topography
Wollongong City Council has two topographical contour GIS layers with 10 metre and two metre intervals. These show the Illawarra escarpment giving way to the coastal plain. The estimated catchment area, maximum catchment elevation and approximate distance of water flow from the upper catchment boundary to the ocean, for each of the creeks, are presented in Table 2-5.
Table 2-5 Catchment area, maximum elevation and maximum distance to the ocean for each of the creek catchments
Creek Catchment area (hectares)1
Maximum elevation of catchment (m AHD)2
Estimated distance from upper catchment boundary
to the ocean (km)3 Hargraves Creek 207.3 7, 142 3.2 Stanwell Creek 757.7 7, 190 5.2
Stony Creek 425.3 6,200 3.1 Flanagans Creek 181.5 4,950 2.3
Slacky Creek 285.4 4,037 4.6 Whartons Creek 210.8 3,468 3.4
Collins Creek 390.9 3,466 3.9 Bellambi Gully 426.8 2,900 4.1
Bellambi Lagoon 245.8 2,766 4.3 Tom Thumb Lagoon Catchment mapping not available for Tom Thumb Lagoon
1 Based on GIS catchment mapping provided by Wollongong City Council 2 Based on 2 metre contour GIS layer 3 As measured from GIS layers- flow paths interpreted from contour data where creek lines not available
GENERAL DESCRIPTION OF ENVIRONMENT 2-6
H:\N1037 WOLLONGONG COASTAL CREEKS & LAGOONS\DOCS\R.N1037.001.01.DOC 16/1/06 17:01
2.3.3 Soils
Wollongong City Council supplied an acid sulphate Soils GIS layer that identifies soils of high and low Acid Sulphate Soil potential. This is mapped in Figure 9-1 to Figure 9-4. Figgis (2001) references Hazelton and Tille (1990) in describing the three main soil types in the area. These three types are:
• Alluvial soils and siliceous sands with dark brown sands and heavy clays that exists in patches behind most beaches, known as the Fairy Meadow Group;
• A shallow layer of topsoil of sandy loam above acidic brown clay subsoils known as the Gwynneville group; and
• Unconsolidated loose sands and sandy clays extending up the steep slopes of the escarpment, known as the Illawarra Escarpment Group (Hazelton & Tille, 1990; cited in Figgis 2001)
Soils are influenced by many factors that are discussed elsewhere in this report. These include geology, topography, hydrology, vegetation, fauna and land use.
2.4 Zoning and Landuse
Local Environmental Plans (LEPs) provide the broad framework for environmental planning and development control within every Local Government Area (LGA). LEPs address local issues such as land use controls, approval criteria, urban structure, heritage conservation, protection of environmentally sensitive land and reservation of land for public purposes such as roads and open space. The landuse zonings applicable to the Study Area are defined by the Wollongong LEP.
The zonings for the creeks are presented in Figure 9-5 to Figure 9-8 in Appendix A and lagoons are generally characterised by forested areas zoned for Environmental protection in the upper catchments and lower catchments dominated by residential zones with areas of public open space surrounding the lagoons and/or creek ocean entrance area. There are also business zones associated with town centres, such as Stanwell Park in the Hargraves Creek Catchment. In addition to this general description are the following areas zoned for varying degrees of Industrial land use:
• Illawarra Coal and Coke in Stony Creek Catchment;
• Bulli Colliery in Slacky Creek Catchment;
• Bulli tile and brick works in Slacky Creek Catchment and partially in Whartons Creek Catchment;
• A light industry area in Whartons Creek Catchment ;
• Integral Energy and other industrial areas in Bellambi Gully Catchment ;
• South Bulli Colliery in Bellambi Gully Catchment; and
• Tom Thumb Lagoon itself, which is partially zoned for special uses and is surrounded by industry and an STP.
Also, the following Special Use zones are located in the study area:
• The sports field and Holy Spirit Colliery in Bellambi Gully Catchment;

GENERAL DESCRIPTION OF ENVIRONMENT 2-7
H:\N1037 WOLLONGONG COASTAL CREEKS & LAGOONS\DOCS\R.N1037.001.01.DOC 16/1/06 17:01
• The elongated “Reserved zone” stretching from Collins Creek Catchment, through Bellambi Gully Catchment which is reserved for an extension of the Northern Distributor; and
• The Bellambi STP which may fall partially into the Bellambi Lagoon Catchment; and
• Tom Thumb Lagoon.
Section 5.6 discusses EPA licensed point sources within the catchments. Note that some of the industries listed above (for example, Bulli Tile and Brick) are no longer operational.

HUMAN INFLUENCES 3-1
H:\N1037 WOLLONGONG COASTAL CREEKS & LAGOONS\DOCS\R.N1037.001.01.DOC 16/1/06 17:01
3 HUMAN INFLUENCES
References relevant to human influences on the creeks and lagoons are summarised in Table 3-1.
Table 3-1 References and data relevant to Human Influences Reference Summary Comments Organ 1990 Compilation of historically available documents
relating to the aboriginal people of the Illawarra.
Government based documents – indicates there is more information available on early aboriginal culture and occupation (some information dates back to pre-colonisation).
Mills 1986 Inventory of natural items of environmental heritage significance in the Wollongong LGA that were not included in the National Park or Illawarra Escarpment Area
Includes clear maps
Department of Environment and Heritage, 2005
Database listing of items of national significance Latest formal information available
Navin Officer Heritage Consultants 2004
Information review and archaeological survey for the dunes between Bellambi Lagoon and the ocean
Field survey involved 5 people walking a grid to identify surface items.
Neil 2005 Brief description of European and Aboriginal history with a focus on vegetation considerations
WCC 1990 Schedule 1 of the LEP lists items of local significance
WCC 2005c Summary of European History of the Wollongong Area
Based on a review of the available information in the Wollongong City Library
3.1 Aboriginal Heritage
Organ (1990) compiled documents related to the recent history of the Illawarra and south coast Aborigines. The compilation covers the period between 1770 and 1850. The original inhabitants of the Illawarra consisted of family groups of coastal dwellers, which sometimes utilised the area west of the escarpment and lived on a diet rich in seafood (Organ 1990). White settlement saw the destruction of Aboriginal traditions that had evolved over thousands of years through the introduction of diseases (believed to have halved the population, almost immediately), murder, landscape change and the introduction of alcohol (Organ 1990). The documents reproduced in the compilation include blanket returns, government records, official correspondence and newspaper articles. The contents of the documents are disturbing and paint a shameful picture of the way many early colonial Australians treated the Aboriginal people. According to documents collated in Organ (1990), by the 1850’s, the original inhabitants and family groups of the northern Illawarra area were either “destroyed, decimated or dispersed along the coastline to the north and south, and even west inland”. Organ (1990) also explains that many Aborigines from other areas then moved into the Northern Illawarra.

HUMAN INFLUENCES 3-2
H:\N1037 WOLLONGONG COASTAL CREEKS & LAGOONS\DOCS\R.N1037.001.01.DOC 16/1/06 17:01
Organ (1990) specifically mentions Tom Thumb Lagoon at least three times. The first is in relation to an extract from Governor Macquarie’s journal that describes the entrance of the lagoon as “at this time dry”, suggesting that it was in a closed state. Charles Throsby Smith describes his arrival at Wollongong in the following extract “I located myself here ….. and commenced clearing land, in defiance of the blacks……the country .. was heavily timbered in the early days with fine trees…Where my house now stands [on Smiths Hill, Wollongong] was densely timbered; and so was the site of Wollongong, except a portion towards Tom Thumb Lagoon which was of a swampy nature”. The third reference to the Tom Thumb Lagoon is to a sketch produced by John Skinner Prout in 1841.
Figure 3-1 Illustration of Tom Thumb Lagoon sketched in 1841
Bellambi Lagoon is also mentioned a number of times as the site of an Aboriginal Kitchen Midden (Organ 1990).
A search of the AHIMS database was undertaken for the catchment areas covered by this study. The information on the recognised sites is limited to an ID number. The sites located are indicated on GIS maps (Figure 9-14 toFigure 9-17) in APPENDIX A.
3.2 Post European arrival
Neil (2005) presents a brief history of early European arrival with a focus on native vegetation. It is widely accepted that the first Europeans to visit the Northern Illawarra area were Bass and Flinders in 1896 (Neil, 2005). Bass reportedly returned a year later and made notes about the local vegetation describing how it differed from that of Sydney (Fuller, cited in Neil 2005). Neil (2005) supposed that the cattle brought to the Illawarra fed on Themeda australis and Danthonia spp. growing under a tree canopy of the coastal plain. A period of overclearing and cedar harvesting spanned from about 1819

HUMAN INFLUENCES 3-3
H:\N1037 WOLLONGONG COASTAL CREEKS & LAGOONS\DOCS\R.N1037.001.01.DOC 16/1/06 17:01
to 1860, during which time “Clearing Licences and Leases” with a 5 year duration were issued (Neil, 2005).
The local studies section of the Wollongong Library has summarised the available historical information relating to European settlement in the Wollongong region (WCC 2005c). The summary includes discussion of agricultural, mining, industrial and urban development of the Wollongong area. The summary gives details on the first land grants and prominent families in the Wollongong region. This includes Charles Throsby Smith, Surgeon John Osborne and Catherine Ann Bright. According to the 1828 Census, 42% of those working in Wollongong were employed in agriculture. This most likely included timber getting and clearing for farming. In 1841 the European population was estimated to include about 800 people. In 1849, the first coal mine in the Illawarra was established at Mount Kiera, by John Shoobert. Improvements to the harbour commenced in 1861 in response to demands from the coal trade. The “New Basin” opened in 1868 and was reportedly capable of loading 3000 tons of coal per day. In the 1870’s Patrick Lahiff established the first coke works at Wollongong Harbour. By 1901, the population of Wollongong was about 17,000 and there were 3,000 dwellings. Reticulated water was supplied in 1902. In 1942 Wollongong was declared a city and by 1954, the population was 90,852. The 2004 population is estimated at about 190,000.
3.3 Remaining Significant heritage items
The 2003 Wollongong State of the Environment Report (SOE) states that there are 348 sites of local significance, 165 sites of regional significance, 37 sites of state significance and 1329 registered aboriginal sites within the Wollongong LGA .
Mills (1986) undertook an assessment of natural items of environmental heritage significance in the Wollongong LGA that were not included in the National Park or Illawarra Escarpment Area. The two sites mentioned in this inventory that are in the study area are the hind dune and estuary area at Stanwell Park (which would include Hargraves Creek) and the Bellambi Lagoon including adjacent areas (Mills 1986).
Mcdonald Mcphee (1991) undertook the City of Wollongong Heritage Study. This study identifies items of local, regional and state heritage significance. Listed items have been incorporated into councils GIS. Schedule 1 of Wollongong LEP (1990) lists items of heritage significance.
The Australian Heritage Database (Australian Department of Environment and Heritage, 2005) lists 5 places of national significance, which are relevant to the study sites:
• The area which comprises the catchment of Stanwell and Hargraves Creeks including the Stanwell Park “Amphitheatre” (ID 14919);
• Two indigenous places for which information is withheld at Thirroul and Bulli (ID 13700 & 13685);
• Coalcliff Geological Site, Lawrence Hargrave Dr, Coalcliff, NSW (ID 1166); and
• The Illawarra escarpment (ID 1526).
Navin Officer Heritage Consultants (NOHC, 2004) undertook a preliminary Archaeological reconnaissance of the east Corrimal dune system, which lies between Bellambi Lagoon and the ocean, to assess the potential impacts of dune rehabilitation works. The study involved a review of
HUMAN INFLUENCES 3-4
H:\N1037 WOLLONGONG COASTAL CREEKS & LAGOONS\DOCS\R.N1037.001.01.DOC 16/1/06 17:01
existing information and a field survey. The information review revealed that no system of formal archaeological survey had been undertaken in the past, although the NPWS Aboriginal Heritage Information Management System (AHIMS) lists eight sites within 1 km of the study area. The survey was conducted over one day with a team of five people walking transects across the study area inspecting the visible ground surface (NOHC, 2004). The study found that 3 of the sites recorded in the AHIMS were possibly outcrops of the same large midden (NOHC, 2004). Significantly for this study, the survey identified that estuarine middens may be present in the western part of the dunes, close to Bellambi Lagoon and a ‘potential archaeological deposit’ has been identified in this area. It was also recognised that there is a possibility of Aboriginal skeletal material being uncovered during any rehabilitation works in the area. The results of the study were mapped in GIS, but have not been assessed for this study.
3.4 Changes to creek catchments and alignment
This section describes sources of information regarding major changes to the catchments and alignment of the creeks and lagoons. For many of the creeks, the only information located was through the historical aerial photography.
3.4.1 Available Aerial Photography
A compilation of photography held by Wollongong City Council is included in Appendix D. The earliest photography available is 1948. The most recent photography is georectified and has been used as a mapping base for the GIS figures in Appendix A. Some aspects identified through the review of available aerial photography are described further in the following sections.
Slacky Creek
As part of a flood study undertaken by WCC (2002), an historical air photo review was undertaken for the Slacky Creek Catchment. The major changes that were relevant to flooding and observed to have occurred between 1937 and 1993 were noted to include the construction of roads, culverts and residential development.
Collins Creek
Tuckett-Carr (2005) states the following
“The logbook of James Cook of the “Endeavour” has an entry record, dated Saturday April 28th 1770, of an attempted landing at Collins Point, Woonona. It records that “4 or 5 natives carrying a small boat or canoe” were observed on the beach, but who fled “to the woods” as the landing boat approached. The landing attempt however, was aborted due to the “great Surf”. The following day a (historic) landing at Botany Bay was met with great resistance from the indigenous natives in that location.”
Tuckett-Carr (2005) notes that this description suggests the area was well vegetated.
Tuckett-Carr also reports that anecdotal information from local residents suggests the “Ocean Park” site was initially mined for clay (for brick making). The resulting clay pit was then used to receive landfill before being rehabilitated for a sporting ground.

HUMAN INFLUENCES 3-5
H:\N1037 WOLLONGONG COASTAL CREEKS & LAGOONS\DOCS\R.N1037.001.01.DOC 16/1/06 17:01
Bellambi Lagoon
During the 1990s, improvement works were undertaken for Bellambi Lagoon as a joint project between Wollongong City Council, Sydney Water and the former Department of Public Works and Services.
Relevant Sydney Water files were reviewed (Referenced hereafter as Sydney Water unpublished), and found to include a number of items of interest including media releases, draft plans, planting and landscape plans, community consultation correspondence and sediment sampling results. Based on invoicing history, the project was completed by 1995 (Sydney Water unpublished).
A Statement of Environmental Effects was completed for the project (PWD et al., 1993). The stated project objectives were to:
• Improve within practicable limits the water quality within the lagoon; particularly in the removal of coarse sediments and gross pollutants prior to entering the lagoon and the dilution of nutrients; and
• Preserve and enhance the quality of aquatic and terrestrial habitats within and around the lagoon.
The Statement of Environmental Effects summarises the proposed Bellambi Lagoon Improvement Works as including:
• The construction of a gross pollutant trap (GPT) on the Turners Esplanade Drain to retain rubbish and coarse sediment;
• The construction of trash racks at five stormwater outlets located along the lagoon and inlet area to an average depth of 0.3 metres below the exiting bed level. It was then considered that deepening would:-remove a store of nutrients attached to sediment that are contributing to excessive nutrient concentrations and plant growth, reduce turbidity, and improve water circulation and aquatic habitat;
• The creation of a circulation channel (of varying width and depth to create habitat for fish and other aquatic life forms) around the periphery of the lagoon extending from north of the reed beds to south of the islands, in order to improve the wind driven water circulation within the lagoon and through the reed beds thereby diluting the concentration of pollution hotspots. It was considered that this would also have the advantage of isolating the reed bed and islands from the mainland;
• The clearance of sediment and excessive reed growth from existing stormwater drains; and
• The treatment of eroded lengths of foreshore by landscaping and planting of native vegetation or protection with natural materials.
Detailed descriptions of the proposed works are described in the report (PWD et al 1993).
Bellambi Gully
The construction of the Pioneer Beach Estate involved significant realignment of the creek and construction of the adjacent open water and freshwater wetland areas. This construction was not

HUMAN INFLUENCES 3-6
H:\N1037 WOLLONGONG COASTAL CREEKS & LAGOONS\DOCS\R.N1037.001.01.DOC 16/1/06 17:01
discussed in detail in the available reports, however, the extent of the works can be observed by comparing the 2002 aerial photography with earlier photos.
.

ECOLOGICAL PROCESSES 4-1
H:\N1037 WOLLONGONG COASTAL CREEKS & LAGOONS\DOCS\R.N1037.001.01.DOC 16/1/06 17:01
4 ECOLOGICAL PROCESSES
Data Sources for ecological processes are summarised in Table 4-1.
Table 4-1 References relevant to Ecological Processes Reference Summary Comments Chafer 1997 Wetland Inventory with consideration of
biodiversity. Wetlands covered include
• Stanwell Creek Lagoon
• Stony Creek Lagoon
• Flanagan’s Creek Lagoon
• Slacky Creek Lagoon
• Whartons Creek Lagoon
• Collins Creek Lagoon
• Bellambi Gully Lagoon Wetland
• Ballambi Lagoon; and
• Tom Thumb Lagoon.
Methods and data sources clearly described. A good base document for ecological data in the catchment.
McKinnon, L. 2004
Presents a ground truthing exercise undertaken to assess the accuracy of air photo based mapping for the Bioregional Assessment Study by the Department of Environment and Conservation. Focuses specifically on the previously listed Endangered Ecological Community ‘Sydney Coastal Estuarine Swamp Forest Complex’
University honours report. Changes to Schedule 1 of the TSC Act limit the usefulness of the data contained as the EEC has been redefined
NPWS 2003 Presents the methodology and results of the Biodiversity Assessment Study for Wollongong LGA.
Most of the data is based on air photo interpretation, however, a score is given to each map to rank its reliability based on the certainty of the interpretation (based on whether the site was visited and the confidence of the mapping). Recent changes to TSC Act limit the usefulness of the mapping. The confidence levels are mapped graphically.
WCC GIS Layers Threatened Flora and Fauna
Up to date spatial register of threatened flora and fauna species in the study area
Recently updated and reliable- although only includes identified sightings- it may be possible for threatened species to be present and unknown
DPI Fisheries (2005)
Listing of threatened freshwater and saltwater fish and invertebrates, and saltwater plants.
This is the latest statutory information available
DIPNR 2004 Categorises the study site riparian areas as either Environmental corridor, Terrestrial and aquatic habitat or Bank stability and water quality according to the potential of existing riparian vegetation. GIS layers received for this study.
Scale of accuracy uncertain as lines sometimes vary from photographic and other GIS layers creek lines.

ECOLOGICAL PROCESSES 4-2
H:\N1037 WOLLONGONG COASTAL CREEKS & LAGOONS\DOCS\R.N1037.001.01.DOC 16/1/06 17:01
CECCS 1998
Survey of shallow water fishes and eels in Stanwell, Bellambi, Stoney, Slacky and Bellambi Creeks and /Bellambi Lagoon (and others outside study area). Surveys taken across at least three seasons in 1996/7. Inventory includes description of entrance state during each of the sampling events (at least one per season)
Academic standard scientific paper. Sampling was temporally and spatially limited. Covers one 12 month period and is confined to shallow waters.
Robinson 1995
Lists and describes native and introduced mammal species along the Illawarra Escarpment between Stanwell Park and Camblawarra
Spatial scale much broader than the present study and specific locations not listed. Methodology and quantified results not given.
Merrin et al 2000
Action Plan for Illawarra wetlands that builds on information presented in Chafer 1997
Management document- makes specific qualitative comments about the creeks in the study area.
Anthony 1994
Considers water quality and catchment influences for 14 sites in Bellambi Creek Catchment
University assignment level
AWT 1999 Northern Illawarra Towns Priority Sewerage Program – Water Quality Study. This included sampling of macroinvertebrates in Hargraves, Stony and Stanwell Creeks in preparation of an EIS into the proposed reticulated sewerage scheme. The results were compared to reference sites in the Royal National Park.
EIA standard document. Methodology, results and QA procedures clearly described.
Thomas 1987
The main aim of the report is to identify the most appropriate plant species for regeneration projects in the Bellambi Lagoon area. Includes transect vegetation sampling results and soil pH results.
Community group report with emotive language
Tuckett-Carr 2005
The aim of the report is to identify the most appropriate plant species for regeneration projects in the Collins Creek lower catchment area. Additional field observations and site descriptions are included.
Bush regeneration management plan
WCC (undated)
This report investigates the impact of tip leachate on saltmarsh in Tom Thumb Lagoon. The main focus is the water chemistry of the groundwater, however, the document includes results of quadrat vegetation surveys for two sites in Tom Thumb Lagoon.
The document appears to be incomplete
A key document for the consideration of ecological processes is a wetland inventory undertaken by Chafer (1997). The wetlands from the study area included in the inventory are:
• A 1.3 hectare area known as Stanwell Creek Lagoon in the Stanwell Creek Catchment;
• A 0.2 hectare area known as Stony Creek Lagoon for the Stony creek Catchment;
• A 1.4 hectare estuarine lagoon known as Flanagan’s Creek Lagoon in the Flanagan’s Creek Catchment;
• A 3.3 hectare wetland area known as Slacky Creek Lagoon in the Slacky creek Catchment;
• A 0.1 hectare area known as the Wharton’s Creek Lagoon in the Wharton’s Creek Catchment;
• A 0.5 hectare area known as Collins Creek Lagoon in the Collins Creek Catchment;
• A 5.6 hectare area known as the Bellambi Gully Lagoon Wetland in the Bellambi Gully Catchment;

ECOLOGICAL PROCESSES 4-3
H:\N1037 WOLLONGONG COASTAL CREEKS & LAGOONS\DOCS\R.N1037.001.01.DOC 16/1/06 17:01
• A 14.2 hectare area known as the Bellambi Lagoon Wetlands in the Bellambi Lagoon Catchment; and
• A 9.1-hectare area known as Tom Thumb Lagoon.
There is also a number of upland (non-estuarine) wetlands within the catchment areas of the creeks being investigated, however, their locations are beyond the tidal limits and as such are outside the considerations of this study. The upland wetlands include Hanging Swamp, in Hargraves Creek Catchment, which is considered regionally significant, as it is the only habitat of its type in the Illawarra Catchment.
A summary of the information presented in Chafer (1997) is given in Table 4-2.
Table 4-2 Summary of information on the biodiversity of wetlands that occuring within the Study Area (Source: Chafer, 1997)
Wetland Size (ha)
# Plant spp.
#Algae Spp.
#Mammal Spp.
# Bird Spp
#Reptile Spp
#Frog spp
# Fish Spp
Macro invertebrates
Hargraves
Lagoon
0.6 42 No data
No data 21 5 4 7 No data
Stanwell Crk
Lagoon
1.3 45 No data
No data 21 7 3 6 No data
Stony Ck Lagoon
0.2 40 No data
No data 21 3 1 3 No data
Flanagan’s Ck
Lagoon
1.4 No data
No data
No data No data
2 No data
1 No data
Slacky Ck
Lagoon
3.3 No data
No data
No data No data
2 No data
2 No data
Whartons Ck
Lagoon
0.1 No data
No data
No data No data
No data No data
No data
No data
Collins Ck.
Lagoon
0.5 68 No data
No data 18 2 No data
2 No data
Bellambi Gully Lagoon
5.6 82 No data
No data 27 3 2 8 No data
Bellambi Lagoon
14.2 54 No data
No data 35 5 3 10 No data
Tom Thumb Lagoon
9.1 55 No data
0 41 No data 2 No data
No data
As in indicated by Table 4-2, the inventory showed major limitations for the availability of data on algae, mammals and macro-invertebrate species. Local limitations of data on plants, birds, reptiles, frogs and fish are also evident.
4.1 Flora
4.1.1 Riparian Vegetation
DIPNR (2004) mapped the streams of the Wollongong LGA into categorised segments depending on the potential of the riparian habitat to meet ecological objectives. The three categories mapped were:

ECOLOGICAL PROCESSES 4-4
H:\N1037 WOLLONGONG COASTAL CREEKS & LAGOONS\DOCS\R.N1037.001.01.DOC 16/1/06 17:01
• Environmental Corridor – provide biodiversity linkages ideally between one key destination to another;
• Terrestrial and Aquatic Habitat – provides basic habitat and preserves the natural features of a watercourse;
• Bank stability and water quality – has limited, if any, habitat value but contributes to the overall basic health of a catchment.
The mapping was based on unspecified digital data supplied by the Land Information Centre and the local knowledge of DIPNR staff (DIPNR 2004). Field verification was also undertaken for some sites, although not quantified. The correlation to the desktop results was reportedly high (DIPNR 2004).
The mapping is shown in Figures in Appendix A (Figure 9-9 to Figure 9-13)
4.1.2 Estuarine Flora
There has not been a comprehensive program to identify seagrass, saltmarsh and mangroves at a scale appropriate to the study area. The mapping undertaken by West et al (1985) for NSW estuarine vegetation would not have been at a scale capable of identifying the study sites (Ron West, Pers Comm. 2005).
Chafer (1997) lists plant species recorded for each of the wetlands listed in Table 4-2. These lists group multiple wetlands together. Estuarine species included in these lists are presented in Table 4-3. As the table shows, the data is not at a fine enough resolution to provide a spatial representation of estuarine vegetation for the individual waterways. Avicenna marina is also listed as presented for Tom Thumb Lagoon.
Table 4-3 Saltmarsh species noted by Chafer (1997) Wetland (from Chafer, 1997) Characteristic Saltmarsh Species Recorded? Saltmarsh
community mapped?
Hargraves Creek Lagoon, Stanwell Creek Lagoon and Stody Creek Lagoon
No* No
Flanagans Creek Isolepis nodosa, Sporobolus virginicus, Juncus spp.
No
Slacky, Whatons and Collins Creek
Isolepis nodosa, Sporobolus virginicus, Juncus spp., sedge spp.
No
Bellambi Gully Isolepis nodosa No Bellambi Lagoon Sarcocornia quinqueflora, Sedge spp.,
Sporobolus virginicus No
Tom Thumb Lagoon Sarcocornia quinqueflora, Zoysia macrantha, Sporobolus virginicus
Yes
* Note that Neil (2005) refers to an area of Juncus kraussii growing along Hargraves Creek that is in good condition and weed free.
In terms of algae, Chafer (1997) reported that there was no data available for any of the creeks and lagoons. Anecdotal evidence of algae can be found throughout the literature. Algal growth was also

ECOLOGICAL PROCESSES 4-5
H:\N1037 WOLLONGONG COASTAL CREEKS & LAGOONS\DOCS\R.N1037.001.01.DOC 16/1/06 17:01
observed during the field visits. PWD et al. (1993) state that Bellambi Lagoon supports the algae species Ectocarpus sp., Cladophora sp. and Ulva lactuca.
Recently, Wollongong City Council undertook a groundwater monitoring exercise in response to degradation of saltmarsh, most notably the species Sporobolus virginicus, attributed to leachate from the adjacent landfill site. As part of this exercise, a vegetation survey was undertaken for Tom Thumb Lagoon. A total of six 0.5m x 0.5m quadrats were surveyed. The quadrats covered reference and impacted sites. The saltmarsh in the reference southern site are described as robust and dense, while the saltmarsh for the impacted northern site is referred to as highly impacted and denuded. A total list of species encountered as part of this monitoring exercise is given in Table 4-4.
Table 4-4 Species recordered for Tom Thum Lagoon
Species Present at reference site?
Present at impacted site?
Sarcocornia quinqueflora Suaeda australis Sporobolus virginicus Zoysia macarantha Juncus kraussii X Samolus repens Triglochin striata Bolboschoenus caldwellis X Hydrocotyle peduncularis Casuarina glauca Atriplex australasica
Source: WCC (undated)
Note that Bolboschoenus caldwellis is a freshwater species that is believed to be displacing Sporobolus virginicus in response to increased nutrients and freshwater from the leachate.
Chlorophyll a results, which is an indicator of phytoplankton, are discussed in relation to water quality in Section 5.
AWT (1999) recorded descriptive information for the habitats in which in-stream water quality samples were taken for two sites each in Hargraves, Stanwell and Stony Creeks. The descriptors were then used to generate a score for habitat characteristics. The raw descriptors are not included in the report, however, the resulting scores (a function of the proportion of the bed covered by algae and organic debris, among other things), showed that for these creeks, bed condition was better at downstream sites.
4.1.3 Threatened Communities
Identification of threatened ecological communities within the study site is complicated by recent amendments (Dec 2004) to Schedule 1 of the Threatened Species Conservation Act 1995.
The Biodiversity Assessment Study (NPWS, 2003) mapped vegetation patterns along the Illawarra escarpment and coastal plain using aerial photograph interpretation and a targeted field program. The survey identified 57 vegetation communities, five of which were identified as proposed Endangered Ecological Communities within Wollongong LGA.

ECOLOGICAL PROCESSES 4-6
H:\N1037 WOLLONGONG COASTAL CREEKS & LAGOONS\DOCS\R.N1037.001.01.DOC 16/1/06 17:01
McKinnon (2004) ground truthed the aerial photograph interpretation for the community known as ‘Sydney Coastal Estuarine Swamp Forest Complex’. This was categorised as an endangered ecological community under the Threatened Species Conservation Act 1995. Since this report was prepared, changes to Schedule 1 of the Threatened Species Conservation Act 1995, have redefined the categorisation of ecological communities. The community ‘Sydney Coastal Estuarine Swamp Forest Complex’ has been removed and replaced by broader characterisations such as Swamp Oak Floodplain Forest. These changes occurred on December 17 2004. There are expected to be further amendments to the Threatened Species Conservation Act 1995 in the near future.
The community of ‘Sydney Coastal Estuarine Swamp Forest Complex’ included the transition from Phragmites australis and/or Typha orientalis reed bed, through a Melaleuca and Acacia longifolia scrubland to a forest of Casuarina glauca, Eucalyptus botryoides and Eucalyptus robusta. For each of the sites surveyed, an assessment of whether the site was consistent with the definition of ‘Sydney Coastal Estuarine Swamp Forest Complex’ was made as well as a ranking of integrity and conservation significance (McKinnon 2004). The survey included quadrats at Collins Creek, Collins Creek Lagoon, Bellambi Lagoon and Tom Thumb Lagoon (McKinnon 2004). Twenty four of the twenty nine sites sampled were found to have been correctly classified under the Bioregional Assessment Study undertaken by NPWS (2003). A cluster analysis was also undertaken to identify sites of high conservation value, however, the results were not conclusive.
As discussed in Section 4.1.2, the listed community of coastal saltmarsh is at present not yet adequately mapped in the study area.
4.1.4 Weed Infestation
Weed infestation is an issue for all of the creeks covered by this study. Thomas (1987) notes that Bitou bush (Chrysanthomoides monilifera) was already recognised as an issue for the Bellambi dunes in 1973.
Neil (2005) maps weed densities and abundance for Hargraves Creek.
Chafer (1997) lists weed species recorded for each of the wetlands listed in Table 4-2.

ECOLOGICAL PROCESSES 4-7
H:\N1037 WOLLONGONG COASTAL CREEKS & LAGOONS\DOCS\R.N1037.001.01.DOC 16/1/06 17:01
Tuckett-Carr maps relative weed densities for Collins Creek. This mapping is reproduced here as Figure 4-1.
Figure 4-1 Relative weed densities for Collins Creek (Source: Tuckett-Carr 2005)
4.2 Fauna
4.2.1 Fisheries
Chafer (1997) reported that information on fish fauna in the northern Illawarra wetlands was almost non existent. In response to this, CECCS (1998) undertook a study of shallow water fish communities in Illawarra Wetlands including Stanwell Creek, Bellambi Lagoon, Stony Creek, Slacky Creek and Bellambi Creek. The role of these ecosystems to provide habitat for juvenile fish was confirmed by the finding that all commercial species captured in the study were juveniles and that at least two commercial species were found in each of the creeks (CECCS, 1998). Both Bellambi Creek and Bellambi Lagoon were found to contain the introduced mosquito fish (Gambusia holbrooki). An inventory of fish and site description including entrance condition (opened or closed) is included as an appendix to the report. None of the species recorded for the sites are listed by NSW Fisheries as threatened species.
McGowan (2002) investigated morphological differences in freshwater crayfishes in a number of creeks including Stanwell and Flanagan’s Creeks. Stanwell Creek contained Euastacus spinifer and Flanagans Creek was found to contain Eustacus hirsutus.

ECOLOGICAL PROCESSES 4-8
H:\N1037 WOLLONGONG COASTAL CREEKS & LAGOONS\DOCS\R.N1037.001.01.DOC 16/1/06 17:01
4.2.2 Mammals
Robinson (1995) lists twenty-six species of native and introduced mammals present along the Illawarra Escarpment. It is not possible to draw conclusions from this data for the specific areas covered by the present study.
Chafer (1997) notes that bats and swamp rats may use the wetlands, however, there is no information available on this. A cross reference for each of the wetlands included in the Inventory and mammal species observed within the periphery of the wetland are presented (Chafer, 1997). There is no data presented for the wetlands included in this study (Chafer, 1997).
4.2.3 Birds
Chafer (1997), presents full lists of birds recorded for each of the wetlands as part of the inventory. While Chafer (1997) notes that avifauna of the Illawarra wetlands is generally well documented, there was reportedly no data for the lagoons of Flanagan’s Creek, Slacky Creek, or Whartons Creek. The wetlands for which there were data available for bird species were Hargraves Creek, Stanwell Creek, Stony Creek, Collins Creek, Bellambi Gully, Bellambi Lagoon and Tom Thumb Lagoon (refer to Table 4-2 for numbers at each of the sites). It is interesting to note that Tom Thumb Lagoon has the highest species count. Of the species listed by Chafer (1997), three of the creeks for this study was known to support threatened species listed on Schedules 1 and 2 of the Threatened Species Conservation Act, 1995. These were all listed as Vulnerable and are shown in Table 4-5.
Table 4-5 Threatened species recorded by Chafer 1997 Creek Vulnerable Species
Bellambi Gully Australasian Bittern Bellambi Lagoon Australasian Bittern
Stanwell wetlands* Sooty Oyster Catcher
*Includes Hargraves Creek and Stanwell Creek Lagoons
In preparing a vegetation management plan for the Hargraves Creek Catchment, Neil (1995) conducted two bird counts by the Random Walking Method. A total of eight hours was spent undertaking these exercises. A list of all bird species encountered is included in the report. None of the species encountered are listed on Schedule 1 or 2 of the Threatened Species Conservation Act 1995.
4.2.4 Reptiles and amphibians
Data on reptiles and frogs in Chafer (1997) are sourced mainly from the authors own observations over an eighteen year period and information supplied by another casual observer. There is no data available on frog species present for Flanagan’s Creek, Slacky Creek, Whartons Creek and Collins Creek Lagoons. Similarly there are no data available on reptiles in Whartons Creek or Tom Thumb Lagoon. Given the informal nature of data collation, it is likely that the data for the other lagoons (presented in Table 4-2) is not complete.

ECOLOGICAL PROCESSES 4-9
H:\N1037 WOLLONGONG COASTAL CREEKS & LAGOONS\DOCS\R.N1037.001.01.DOC 16/1/06 17:01
4.2.5 Macroinvertebrates and other benthos
At the time of the Wetland Inventory, Chafer (1997) reported there were no data available on macroinvertebrates for the study site (Refer to Table 4-2).
AWT (1999) undertook sampling of macroinvertebrates in Hargraves, Stony and Stanwell Creeks in preparation of an EIS into the proposed reticulated sewerage scheme. The results are discussed in reference to water quality in Section 5.3.1.
4.2.6 Threatened Species
Council supplied a GIS layer that identified species listed on Schedule 1 and 2 of the Threatened Species Conservation Act, 1995. These layers are based on information provided by the Department of Environment and Conservation. Cross reference made to the Wildlife Atlas (NPWS, 2005) confirms that the layers are up to date.
From these Council GIS layers, it was determined that the following species occur within the study are:
• Sooty Owl and Powerful Owl in Hargraves Creek Catchment;
• Sooty Owl and Rosenbergs Goanna in Stanwell Creek;
• Sooty Owl, Barking Owl and Red crowned Toadlet in upper Stony Creek Catchment. Also not far from the Coke works is the floral species Callistemon linarifolius ;
• Pink robin in upper Flanagan’s Creek Catchment ;
• The plant species Pultenaea aristata in upper Slacky Creek catchment;
• Sooty Owl in Wharton’s Creek Catchment;
• Black Bittern in Collins Creek;
• Green and Golden Bell frog in the vicinity of the brickworks and the Sooty Owl in the Bellambi Gully Catchment;
• Green and Golden Bell frog around the Bellambi Lagoon; and
• Little Shearwater near Tom Thumb Lagoon.
The Department of Primary Industries (NSW Fisheries division) have responsibility for aquatic animals. From a search of the DPI website, the only species with some potential to occur in the study sites are the Adams Emerald Dragon Fly as the larvae are found in small creeks with gravel or sandy bottoms, in narrow, shaded riffle zones with moss and rich riparian vegetation. The presence of this species has not been recorded in any of the material reviewed for the present data compilation and review.
It is interesting to note that threatened species identified in certain wetlands by Chafer (1997) are not listed in the wildlife atlas. An example is the Australasian Bittern in the Bellambi Catchment.

ECOLOGICAL PROCESSES 4-10
H:\N1037 WOLLONGONG COASTAL CREEKS & LAGOONS\DOCS\R.N1037.001.01.DOC 16/1/06 17:01
4.3 Further Site Specific Ecological Data
4.3.1 Hargraves Creek
The upper catchment of Hargraves Creek contains the Hanging Swamp. This upland (non-estuarine) wetland ecosystem is considered regionally significant as it is the only habitat of its type in the Illawarra Catchment (Chafer, 1997).
A vegetation management plan for Hargraves creek was recently prepared by Neil (2005). The Management Plan aims to:
• Restore and maintain the wet sclerophyll forest community (Specht 1970) to a state as close to self sustainability as possible, by removing weeds and by supplementing the regeneration with revegetation where appropriate;
• Protect existing native fauna habitat and increase habitat potential by the staged removal of weeds and careful consideration of the impacts of all actions;
• Improve the aesthetic and recreational value of the area by the removal of weeds and the enhancement of defined public pathways;
• Involve the community in the restoration and conservation of its locality by ongoing education;
• Control the erosive effects of tracks, stormwater and run-off.
The Plan describes the existing vegetation communities, as determined by ecologists visiting the sites (specific survey details not given). The plan describes the existing plant communities and recommends a 5 year plan for weed removal and native planting. All species to be removed and planted are listed with specific directions. The existing vegetation communities and selected characteristic species are listed in Table 4-6. Mapping within the report classifies weed densities and abundance.
Table 4-6 Information on vegetaion communities of Hargraves Creek presented in Neil (2005)
Community Characteristic Species Backhousia myrtifolia Syncarpia glomulifera Glochidion ferdinandi Eucalyptus saligna
Rainforest
Amena smithii Melaleuca styphelioides Syncarpia glomulifera Trima aspera Euclyptus gummifera Acacia maidennii Pittsporum undulatum Cryptocarya glaucescens Amenca smithii Rapenea variabilis Callicoma serratifolia Braynia oblongifolia Ficus coronata Plectranthus parviflous Tristaniopsis laurina Pittosporum revolutum
Tall Wet Sclerophyll Forest
Also a large number of vines, ferns and groundcovers Reed beds Phragmites australis Juncus kraussii
4.3.2 Stanwell Creek
There are two artificial wetlands in the Stanwell Creek Lagoon upper catchment. These are formed by the Stanwell Dam and Coalcliff Dam (Chafer, 1997).

ECOLOGICAL PROCESSES 4-11
H:\N1037 WOLLONGONG COASTAL CREEKS & LAGOONS\DOCS\R.N1037.001.01.DOC 16/1/06 17:01
4.3.3 Collins Creek
As a part of the ground truthing exercise undertaken by McKinnon (2004), two 40x10 metre quadrats, adjacent to Collins Creek were sampled. The area was considered to have low conservation significance and was not classified as ‘Sydney Coastal Estuarine Swamp Forest Complex’ (refer to Section 4.1.3) due to the high presence of introduced species and low structural diversity. Three 40 x 10 metre quadrants were also established in the vicinity of Collins Creek Lagoon. This was classified as ‘Sydney Coastal Estuarine Swamp Forest Complex’ and was considered to have medium conservation significance. While not actually surveyed, the island in Collins Creek is considered significant due to the good structural diversity and condition of ‘Sydney Coastal Estuarine Swamp Forest Complex’ and it is also noted that it is regionally significant due to the presence of Swamp Oak, Melaleuca forest and a reed bed which provides habitat for the threatened Australasian Bitten (McKinnon, 2004). This island referred to by McKinnon could not be located on the available aerial photograph. The use of the term island may refer to an isolated patch of vegetation referred to by Merrin and Chafer (2000) at the corner of Lawrence and Carrington streets (Trevor Brown, WCC, pers comm.. 2005). It is also noted that Bitou Bush (Chrysanthemoides monilifera) is an increasing issue in the area.
Merrin et al (2000), note that a wetland area containing remnant Swamp Oak Forest in good condition, was not mapped in Chafer (1997).
Tuckett-Carr (2005) developed a Vegetation Management Plan for Collins Creek. The lower catchment is divided into management units and the existing native vegetation and weed assemblages are discussed. Specific ecological survey methods are not described; however, the descriptions are quite detailed and spatially specific.
4.3.4 Bellambi Lagoon
The Bellambi Lagoon Wetlands are considered a rare example of a hind dune wetland complex (Chafer 1997). They are reportedly the most natural wetland of this type between Sydney and Gerroa (Chafer 1997).
Some revegetation work has also been undertaken, with extensive planting of the Western Australian species Acacia saligna.
McKinnon (2004) sampled the area previously classified as Estuarine Swamp by Chafer (1997). This was classified by McKinnon as ‘Sydney Coastal Estuarine Swamp Forest Complex’ (refer to section 4.1.3) and considered to have high conservation significance.
The Centre for Estuarine and Coastal Catchment Studies (CECCS, 1998) reported that the lagoon bottom was mostly bare substrates and very small areas of the seagrass species Ruppia megacarpus.
4.3.5 Tom Thumb Lagoon
Tom Thumb Lagoon is significantly different to the other systems being investigated for this study. Tom Thumb Lagoon was originally an ICOLL covering about 350 hectares (Chafer, 1997). The Lagoon was partially deepened and extensively filled during the establishment of the Inner Port Kembla Harbour during the 1950’s and 1960’s (Chafer, 1997). Further reclamation is reported to
ECOLOGICAL PROCESSES 4-12
H:\N1037 WOLLONGONG COASTAL CREEKS & LAGOONS\DOCS\R.N1037.001.01.DOC 16/1/06 17:01
have occurred through the 1980’s, resulting in a small brackish pond and saltmarsh flats that represent less than 5% of the original wetland area (Chafer, 1997).
Before these works took place in the 1960s the area was an extensive shallow coastal lagoon that was the largest known Little Tern breeding colony in NSW (Chafer, 1997). Historical records confirm the presence of over 1000 black swans (no longer present) and the Banded Stilt and Red-necked Avocet, although the habitat used by all three species has since been lost to reclamation. The lagoon remains regionally significant as it is one of the very few locations between Lake Illawarra and Sydney that the Striated Heron can be regularly located (Chafer, 1997).
McKinnon (2004) established two quadrats in Tom Thumb Lagoon, near Spring Hill Road. The sites were classified as ‘Sydney Coastal Estuarine Swamp Forest Complex’ (refer to Section 4.1.3) and one was considered to have Medium conservation significance.

WATER QUALITY PROCESSES 5-1
H:\N1037 WOLLONGONG COASTAL CREEKS & LAGOONS\DOCS\R.N1037.001.01.DOC 16/1/06 17:01
5 WATER QUALITY PROCESSES
Relevant data for water quality processes are summarised in Table 5-1
Table 5-1 References relevant to Water Quality Processes Reference Summary Comments Figgis 2001 As a part of the Wollongong Wide Water Quality
Study (WWWQS), Figgis (2001) undertook a water quality and sediment study of Wollongong’s Northern streams (University Honors Thesis). The sampling included physical parameters and Faecal Coliforms, Filtered Nutrients, Filtered Metals and unfiltered totals, for 23 sites. This included the following sites within study:
• Flanagans (2 sites) • Slacky Creek (1 site) • Whartons Creek (1 site) • Collins Creek (2 sites) • Bellambi Creek (2 sites) • Bellambi Lake (1 site) • Bellambi Lagoon (1 site) • Bellambi Creek and Bellambi Lake were also
monitored in response to high rainfall (>10mm in 24 hours). This was sampled on 10 occasions.
Sampling limited to 10 days. Raw data not included.
AWT 1999 Northern Illawarra Towns Priority Sewerage Program – Water Quality Study. This study was conducted to assess the impact of existing on-site sewage disposal systems and urban areas on water quality and ecosystem health. The streams covered include Hargraves, Stanwell and Stony Creeks.
EIA standard document. Methodology, results and QA procedures clearly outlined.
Forbes Rigby 1999
Draft Wollongong Coastal Stormwater Management Plan
Sydney Water 2002
Coalcliff, Stanwell Park, Stanwell tops and Otford Sewerage Scheme Review of Environmental Factors
No new data refer to AWT 1999
Ochier 1996
Presents and compares a range of water quality physical parameters over a period of one month at 37 sites to those measured in an earlier 1994 study (Anthony, 1994). Prepares a list of recommendations for future planning.
The data interpretation included within the report should be viewed with a high level of caution. For example the author may make conclusions beyond the capabilities of a one-month sampling exercise (eg “the overall water quality has definitely improved since 1994”). The time of each sampling exercise is not given and it is not clear how many replicates were taken.
Anthony 1994
Presents water quality results collected by Wollongong Council on two occasions in October and November 1993 and makes planning recommendations to improve water quality in the future.
The data is statistically limited as it was only collected on two occasions.
Scientific Maps overflow points and stormwater outlets on Now 13 years old

WATER QUALITY PROCESSES 5-2
H:\N1037 WOLLONGONG COASTAL CREEKS & LAGOONS\DOCS\R.N1037.001.01.DOC 16/1/06 17:01
Services 1992
Slacky, Whartons, Collins and Bellambi Creeks
WCC 2005b
Excel spreadsheet of water quality results for variables including pH, salinity, DO, temperature, FC, nutrients and some metals including all study area creeks except Hargraves, Stawell and Stony Creeks
Unable to determine collection techniques, circumstances and QA procedures.
Please also see Appendix B for a summary of the data available for each of the creeks.
5.1 Note on Water Quality Guidelines
Water quality monitoring results are frequently compared to the Australian and New Zealand Guidelines for Fresh and Marine Water Quality (ANZECC 2000). The Guidelines recommend the development of site specific target concentrations for water quality parameters. The ANZECC (2000) guidelines also give concentrations or “Trigger Values” to be used as a first pass. The triggers are given for six different ecosystem types. The ecosystem types are estuarine, coastal and marine, lakes and reservoirs, wetlands, upland rivers and streams and lowland rivers and streams. Exceedence of the values indicates a potential environmental problem, and acts as a ‘trigger’ for further investigation. Different trigger values are given for different values or uses (eg. aquatic ecology, recreational contact, primary industries, drinking water).
The intermittently opened and closed creeks and lagoons in this investigation do not clearly fit into the ecosystem categories in the ANZECC guidelines. The data review indicated that the categorisation of ecosystem type varied between authors. For example, Figgis (2001) classified Bellambi Lagoon as an estuary and the other sites covered as lowland rivers. The following table gives the ANZECC guidelines for aquatic ecosystems, for commonly cited water quality parameters for both estuarine waters and lowland rivers and streams.
Table 5-2 ANZECC Default Trigger values for two ecosystem types in South East Australia for Aquatic Ecosystems
Parameter Ecosystem type ANZECC (2000) Trigger Value Primary contact – median of
150 CFU/100mL Faecal Coliforms Recreational Waters
Secondary Contact – median of 1000 CFU / 100mL
Lowland Rivers 6.5-8.0 pH Estuaries 7.0-8.5 Lowland Rivers 6-50 NTU Turbidity Estuaries 0.5-10 NTU Lowland Rivers 5 µg L-1 Chlorophyll a Estuaries 4 µg L-1 Lowland Rivers 50 µg L-1 Total Phosphorus Estuaries 30 µg L-1 Lowland Rivers 500 µg L-1 Total Nitrogen Estuaries 300 µg L-1 Lowland Rivers 85-110% sat Dissolved Oxygen Estuaries 80-110 % sat Lowland Rivers 40µg N L-1 NOx
Estuaries 15µg N L-1 Lowland Rivers 20µg N L-1 NH4
+ Estuaries 15µg N L-1

WATER QUALITY PROCESSES 5-3
H:\N1037 WOLLONGONG COASTAL CREEKS & LAGOONS\DOCS\R.N1037.001.01.DOC 16/1/06 17:01
Copper Freshwater (99% Species) 1.0 Lead Freshwater (99% Species) 1.0*
Manganese Freshwater (99% Species) 1200 Zinc Freshwater (99% Species) 2.4
Arsenic (As III) Freshwater (99% Species) 1
* note that lead has not been adjusted for site specific hardness
Wollongong city Council provided a database with water quality results for 36 sites within the LGA. These sites did not include data for Hargraves, Stanwell or Stony Creeks. This data has partly been used in a number of honours projects completed by University of Wollongong students. The honours projects are also supplemented by data collected by the students and not necessarily added to the data base. The honours projects are discussed below and include:
• Figgis 2001
• Anthony 1994
• Ochier 1996
The Council database, referred to by some references as WWWQS is limited by a lack of complementary information about collection techniques, QA procedures and time of the day of collection. The database has a maximum of twenty four (24) data points per parameter / per site collected at irregular intervals between February 2001 and September 2004 (48 months). The data has been graphed and is presented in Appendix B. This shows that for all parameters except pH, every site has displayed measured results that trigger the ANZECC guidelines and therefore warrant further risk assessment.
5.2 Physical and Chemical Indicators
5.2.1 Physio-chemical parameters
5.2.1.1 pH
pH is a measure of acidity or alkalinity of water on a log scale from 0 (extremely acidic) through 7 (neutral) to 14 (extremely alkaline).
The WCC database shows that Tom Thumb Lagoon, Bellambi Lagoon, Ballambi Gully and Collins Creek water quality values sometimes exceed the ANZECC upper pH limit. None of the creeks in the study sites displayed pH values below the lower ANZECC level of 6.5 for the days sampled.
Figgis (2001) determined pH means by averaging H+ concentrations and then converting to the pH scale. Both sites on Bellambi Creek exceeded the ANZECC (2000) pH trigger value of 8.5 (Figgis 2001). Increases in pH for Flanagans Creek, Bellambi Creek, Bellambi Lagoon and Collins Creek in downstream sections were attributed to leachate from blast furnace slag which has been used as fill around much of Wollongong (Figgis, 2001).
Lawson and Treloar (2005) raised concerns about the impacts of potential acid sulphate soils due to low pH values in tidal areas, however, the pH values reported here were not lower than 6.5 and have not been flagged as an issue.

WATER QUALITY PROCESSES 5-4
H:\N1037 WOLLONGONG COASTAL CREEKS & LAGOONS\DOCS\R.N1037.001.01.DOC 16/1/06 17:01
Anthony (1994) presents and analyses the results of water quality monitoring undertaken at 14 sites on Bellambi Creek by Wollongong City Council on the 12/10/1993 and the 2/11/1993. The limited data presented indicates that pH is above the range given in the ANZECC guidelines.
AWT (1999) sampled Hargraves, Stanwell and Stony Creeks to assess the impact of urban areas on water quality. AWT (1999) reported that the Hargraves Creek upstream site showed a pH below the ANZECC range for both the sampling events in wet and dry weather. The downstream site also fell slightly below the ANZECC trigger during wet weather events (AWT, 1999). Stanwell Creek was within the ANZECC range.
5.2.1.2 Dissolved Oxygen
The Dissolved Oxygen (DO) concentration in estuarine waters is the result of the balance between oxygen producing processes (such as photosynthesis and aeration) and oxygen consuming processes (such as aerobic respiration, nitrification, chemical oxidation and degassing).
All sites included in the WCC database (WCC 2005b) except Bellambi Lagoon downstream displayed some points with lower dissolved oxygen (DO) than the ANZECC trigger level. Each of the sites except Bellambi Gully, Whartons Creek and Slacky Creek showed limited instances of supersaturation of DO. This indicates that on occasions, net photosynthesis oxygen production is greater than oxygen consumption. Such instances may be indicative of algal blooms, and could potentially be followed by an oxygen sag during non-daylight hours when the system is dominated by respiration. In order to attain a better understanding of the oxygen balance of the creeks, time series data collected over diurnal and seasonal timescales would be necessary.
Figgis (2001) reported all average DO results above the ANZECC trigger levels. It should be noted that dissolved oxygen fluctuates substantially in response to temperatures and diurnal light fluctuations, so the use of averages (without specifying the time of day) can be misleading.
AWT (1999) reported that mean Dissolved Oxygen concentrations for the upstream site in Hargraves Creek triggered the ANZECC guidelines (dry weather value 61%, wet weather value 40%). Stanwell and Stony Creeks approached the ANZECC guideline level, but did not trigger them.
Ochier (1996) sampled and compared a range of water quality physical parameters over a period of one month at 37 sites to those measured in an earlier 1994 study (Anthony 1994). The report only presents one value for each of the sites and as multiple visits to sites are referred to in the text this is assumed to be a mean value. The data is of limited value due to a lack of detail about the circumstances of its collection. The results show that dissolved oxygen and conductivity measurements sometimes trigger the ANZECC guidelines (Ochier, 1996).
5.2.1.3 Salinity
Salinity is a non-dimensional parameter that is often presented in units of parts per thousand (ppt). The salinity of seawater is generally 35ppt.
From the salinity data included in the WCC database (WCC, 2005b), it can be seen that for a number of sites, the salinity varies substantially from almost fresh (less than 5 ppt) to marine (30+ ppt) conditions. This is expected for intermittently opened and closed systems, however, detailed

WATER QUALITY PROCESSES 5-5
H:\N1037 WOLLONGONG COASTAL CREEKS & LAGOONS\DOCS\R.N1037.001.01.DOC 16/1/06 17:01
interpretation is limited as the tidal condition and entrance state at the time of sampling is not available.
The maximum conductivity measured for Stanwell Creek Lagoon was 1235µS/cm (AWT 1999). This equates to a salinity of about 8 ppt, at a temperature of 17 degrees Celsius.
5.2.1.4 Turbidity
Turbidity is a measure of water clarity or murkiness. Suspended particulate matter may include clay and silt (e.g. suspended sediment), detritus and organisms (Geoscience Australia, 2005).
Turbidity was higher than ANZECC trigger levels for Bellambi Lagoon and Slacky and Whartons Creeks (Figgis 2001).
The values for NFR, BOD and COD are also high in the vicinity of the Bellambi Coal Company (Anthony 1994). The data reported by Anthony (1994) was not included in the WCC database (WCC 2005b).
Wollongong City Council Officers have observed that wet weather flows in Slacky Creek are unusually turbid compared to neighbouring catchments. A decommissioned clay pit has been identified as a significant source of suspended solids in its catchment. A soil and water management plan has been prepared and implemented at the site to reduce its impact on water quality.
5.2.2 Nutrients
5.2.2.1 Nitrogen
Nitrogen exists in water both as inorganic and organic species, and in dissolved and particulate forms. Inorganic nitrogen is found both as oxidised species (e.g. nitrate (NO3-) and nitrite (NO2-)) and reduced species (eg ammonia (NH4 and NH3) and di-nitrogen gas (N2)). Total nitrogen (abbreviated TN) is a measure of all forms of dissolved and particulate nitrogen present in a water sample (Geosciences Australia, 2005).
Total nitrogen data presented in the WCC database (WCC 2005b) is available for all creeks except Hargraves, Stanwell and Stony Creeks. Of those sampled, Bellambi Lagoon, Bellambi Gully, Flanagans Creek, Collins Creek, Whartons Creek and Slacky Creek sometimes exceed the ANZECC guidelines.
Figgis (2001) sampled ammoniacal nitrogen and found that both Bellambi Lagoon and Bellambi Gully exceeded the ANZECC trigger. As with other data presented by Figgis (2001), interpretation is limited by the presentation of a single mean value per site. Seasonal trends are therefore not available.
The data presented in Figgis (2001) showed that all sites exceeded the ANZECC trigger value for oxidised nitrogen. The mean Total Oxidised Nitrogen (NOx) values reported by Figgis (2001) for Hargraves Creek, Stanwell Creek, Stony Creek and Stanwell Creek Lagoon were all above the ANZECC guidelines for lowland rivers, in wet and dry weather.

WATER QUALITY PROCESSES 5-6
H:\N1037 WOLLONGONG COASTAL CREEKS & LAGOONS\DOCS\R.N1037.001.01.DOC 16/1/06 17:01
AWT (1999) found that during dry weather, oxidised and total nitrogen were higher in Stony Creek upstream of Coalcliff compared to downstream. This also correlated with phosphorus and faecal coliform patterns suggesting a sewerage source upstream of Coalcliff. AWT (1999) suggest that this may be related to either the Coalcliff Coke Works or the Coalcliff Community Hall that operate onsite sewerage systems.
5.2.2.2 Phosphorus
Phosphorus is found in creeks and lagoons in dissolved and particulate forms. Dissolved phosphorus includes inorganic orthophosphate (e.g. H2PO4
-, HPO42-, PO4
3-) and organic phosphorus-containing compounds (DOP). Total phosphorous (abbreviated TP) is a measure of all the various forms of phosphorus (dissolved and particulate) found in water (Geosciences Australia, 2005).
Total phosphorus data is available for all creeks except Hargraves, Stanwell and Stony Creeks in the WCC database (WCC 2005b). Each of the creeks included, sometimes exceed the ANZECC guidelines.
Figgis (2001) reported that Bellambi Creek and Bellambi Lagoon had significantly elevated orthophosphorus levels.
The monitoring undertaken in Hargraves, Stanwell and Stony Creeks by AWT (1999) did not indicate mean total phosphorus concentrations above the ANZECC guidelines.
5.2.3 Metals
Human sources of metals include industry, urban development, antifouling paints and sewerage treatment works. Metals can be toxic to animals and plants. The extent of metal uptake, toxicity and bioaccumulation varies depending on the organism, and other water quality parameters, including pH, turbidity, dissolved oxygen and the concentrations of other metals in solution (Geoscience Australia, 2005).
The data included in WCC (2005b) shows that all sites included sometimes exceed the trigger for the protection of 99% of species for Copper, Zinc and lead.
For the sites sampled by Figgis (2001), Cr, Mg, Ni, Cu, Zn, As, Cd and Pb concentrations in surface waters were found to be below the ANZECC (2000) recreational waters trigger value. The more stringent trigger values for the protection of Aquatic Ecosystems were reportedly exceeded by some or all sites sampled by Figgis (2001) (data not presented). The data that is presented is for sites in Bellambi Creek and Bellambi Lake. The Bellambi Lake had the highest concentrations of most metals and exceeded aquatic ecosystem guidelines for Cr, Ni, Cu, Zn and Cd. On Bellambi Creek, the upstream site had elevated levels for Ni, Cu, Zn and Cd and the downstream site exceeded guidelines for Cu, Zn and Cd. There were no clear indications of sources between the sites.
AWT (1999) monitored boron in wet weather conditions for Hargraves Creek, Stanwell Creek and Stony Creek on four occasions. The mean and maximum values presented were all below the ANZECC aquatic ecosystem guideline trigger value of 90 µg/L. AWT (1999) note, however, that concentrations of boron were elevated downstream in Hargraves Creek when compared to the

WATER QUALITY PROCESSES 5-7
H:\N1037 WOLLONGONG COASTAL CREEKS & LAGOONS\DOCS\R.N1037.001.01.DOC 16/1/06 17:01
upstream site. Boron is used widely in clothes washing detergents and can be an indicator of sewage contamination (AWT 1999).
5.3 Biological Indicators
5.3.1 Macroinvertebrates as indicators of water quality
The term macroinvertebrates refers to organisms that live within a creek or lagoon, have no backbone, and are generally larger than 0.5mm, but smaller than 50mm. The abundance, diversity, biomass and species composition of macroinvertebrates can be used as indicators of changing environmental conditions (Geoscience Australia, 2005).
As discussed in Section 4.2.5, AWT undertook sampling of macroinvertebrates in Hargraves, Stony and Stanwell Creeks in preparation of an EIS into the proposed reticulated sewerage scheme. The results were compared to reference sites in the Royal National Park. Standardised samples were obtained from two distinct habitats, pool edges and pool rocks. In general, no significant differences were found between the macroinvertebrate community assemblages for the sites upstream and downstream of the townships. The fauna of the township sites varied to that of the reference sites (AWT 1999). The assemblages at the township sites included species that are considered indicators of disturbed sites and those that are considered pollution sensitive. Assemblages in Hargraves and Stony Creeks were categorised as being in particularly poor condition, which was considered a factor of poor water quality, and the layer of fine silt observed in Stony Creek (AWT 1999).
5.3.2 Chlorophyll a
Chlorophyll a concentration is a commonly used indicator of water quality. The concentration is a measure of green plant material abundance and biomass in estuarine waters. Increased nutrients from catchment runoff following rainfall and increased water temperatures and light intensity during summer, result in increased phytoplankton, which produce elevated chlorophyll a concentrations.
During the AWT (1999) monitoring for Stanwell Creek, chlorophyll a sampling results were within the ANZECC guidelines.
5.3.3 Bacterial
Faecal coliforms (FC) are a group of bacteria used to indicate faecal contamination of a waterway by warm-blooded animals. The presence of faecal coliforms indicates that other human specific pathogens (such as viruses) may be present. It should be noted that the ANZECC (2000) primary contact value of <150cfu/100mL for primary contact is a median value. This would equate to a mean of about 200cfu (NHMRC 1990).
The data included in WCC (2005b) shows that for all sites included except Flanagans Creek upstream, the FC trigger for primary and secondary contact are at times exceeded.
The monthly sampling results from Figgis (2001) show that the mean faecal coliforms for each of the sites sampled over a 12 month period were over the ANZECC trigger value of 150 CFU/100mL for Flanagans Creek, Slacky Creek, Whartons Creek, Collins Creek, Bellambi Gully, Bellambi Lagoon. Bellambi Creek and Bellambi Lake stand out as being significantly higher than the other locations.

WATER QUALITY PROCESSES 5-8
H:\N1037 WOLLONGONG COASTAL CREEKS & LAGOONS\DOCS\R.N1037.001.01.DOC 16/1/06 17:01
An interesting observation from the Figgis (2001) data was the significant difference between the results for the upstream and downstream sites on Bellambi Creek, suggesting a possible point source between the two. Hargraves Creek, Stanwell Creek, Stony Creek and Tom Thumb Lagoon were not covered in this particular investigation.
AWT (1999) sampled faecal coliforms in wet and dry weather. Four wet weather events and 12 dry weather days were sampled. During wet and dry weather there was no significant difference between faecal coliforms in the upstream and downstream sites in Stanwell and Stony Creeks (AWT 1999). Similarly, there was no significant difference between Stanwell Creek and the Lagoon (AWT, 1999). In the dry weather events, Hargraves Creek downstream exceeded the primary contact guideline and was very close to the secondary contact guideline. Stony and Stanwell Creeks and Stanwell Lagoon did not exceed the guidelines in dry weather. In wet weather conditions, both upstream and downstream concentrations in Hargraves Creek, Stanwell Creek and Stony Creek exceeded the primary contact guideline.
AWT (1999) also sampled Faecal Sterol biomarkers in Hargraves and Stony Creeks in the preparation of an EIS into the proposed sewerage upgrade. This method compares the ratio of Coprostanol, which is abundant in human faeces and is produced by the reduction of cholesterol to 24-ethylcoprostanol, which is abundant in herbivore faeces (Shah et al 2004). For Hargraves Creek, the sampling upstream of the urban area indicated that the majority of faecal sterols were from non-human and non-herbivorous sources (AWT 1999). However, downstream of Stanwell Park, in Hargraves Creek, the indicators suggested a mostly human source. In Stony Creek, sampling of the upper catchment did not indicate human or herbivore faecal contamination, while the downstream sampling was inconclusive. AWT (1999) concluded that urban areas were impacting on the bacterial water quality of Hargraves Creek.
Anthony (1994) sampled E.coli at fourteen sites within the Bellambi Creek Catchment on one wet and one dry weather day in spring 1993. On the dry weather day the E.coli counts were 0 for each of the 14 sites. On the wet weather day, all but one of the sites exceeded the primary contact ANZECC trigger for Faecal Coliforms. This is not a direct trigger for ecoli, however, the faecal coliform bacteria in human faeces comprise about 97% E. coli, around 2% Klebsiella, and a further 2% Enterobacter and Citrobacter together (ANZECC 2000).
Scientific Services (1992) note that a bright orange bacteria was observed at several points along the creeks included in that study (Whartons, Slacky, Collins and Bellambi Creeks). The report states that the bacteria is likely to be the iron oxidising bacteria Thiobacillus ferroxidans which is commonly linked to the high concentrations of iron around acid mine drainage sites.
5.4 Stormwater management
A Draft Stormwater Management Plan for Wollongong’s Coastal Creeks was prepared by consultants Forbes Rigby in 1999. The stated purpose of the Stormwater Management Plan was to facilitate the coordinated management of urban stormwater within a catchment to maximise ecological, social and economic benefits, in a sustainable way, with sound management practices. The executive summary of the Stormwater Management Plan explains that the Plan is not as comprehensive as it could be due to restraints on funding and timing. The eastern half of the catchment is almost fully urbanised whilst the upper catchment remains wooded (Forbes Rigby 1999).

WATER QUALITY PROCESSES 5-9
H:\N1037 WOLLONGONG COASTAL CREEKS & LAGOONS\DOCS\R.N1037.001.01.DOC 16/1/06 17:01
Scientific Services (1992) undertook a survey of discharge points into Slacky, Whartons, Collins and Bellambi Creeks to assess possible sources of Faecal coliforms in bathing waters on beaches in the Bulli-Bellambi region. The overflow and stormwater points are mapped and briefly discussed in a table within the report.
5.5 Wastewater management
The 2002/2003 State of the Environment Report for Wollongong Local Government Area (WCC, 2003), states that a total of 107 water pollution complaints from the community were received during 2002/2003, with the majority of these related to wastewater from residential premises and sediment from building sites.
Coalcliff, Stanwell Park and Stanwell Tops were selected to be included in the Priority Sewerage Program in response to their identification as areas where onsite systems were adversely affecting local waterways and having potential to pose a risk to public health. Accordingly, Sydney Water undertook investigations into the design of a sewerage service for these areas. The scheme was originally designed to be a reticulated gravity system and an EIS into this design was undertaken. The EIS included some macroinvtebrate and water quality sampling and the results are discussed elsewhere (See sections 5.3.3 and 5.3.1)
The design was subsequently changed to a Low Pressure Sewerage Scheme and a Review of Environmental Factors (REF) was prepared to consider the potential impacts of this change in design and to assess their consistency with the Minister’s approval. The REF concludes that the potential adverse impacts associated with the proposed changes to the design will have less environmental impact than the approved scheme (SWC, 2000). Construction of the sewerage scheme for Coalcliff, Stanwell Tops and Otford is now complete. The system has been commissioned and a number of residents are connected to the system (Trevor Brown, WCC, Pers. Comm. 2005).
Of particular interest to the Wollongong Coastal Creeks and Lagoon Data Compilation Study is the claim that the new system will result in a reduction (described as a virtual elimination) in overflow and infiltration events from the sewerage system. No new environmental data is presented in the REF.
Sydney Water notifies Wollongong City Council of dry weather sewage overflow events in the catchments of the study site creeks and lagoons. The available notifications are included as Appendix E.
5.6 Other Point Sources of Water Pollution
The Protection of the Environment Operations Act 1997 replaced the Clean Air Act 1961, Clean Waters Act 1970, Noise Control Act 1975, Pollution Control Act 1970, Environmental Offences and Penalties Act 1989 and regulatory provisions of the Waste Minimisation Act 1995. The Act makes it an offence to pollute the environment without an environment protection licence issued by the Environment Protection Authority (now the Department of Environment and Conservation). Schedule 1 lists activities, which require an EPA licence.

WATER QUALITY PROCESSES 5-10
H:\N1037 WOLLONGONG COASTAL CREEKS & LAGOONS\DOCS\R.N1037.001.01.DOC 16/1/06 17:01
The EPA website publishes a database of companies licensed to pollute under the PEO Act The EPA (DEC) could not provide spatially referenced information on these sites for inclusion in GIS. For the EPS, further field inspections and consultation may be necessary.
The database also lists compliance records for companies discharging to the waterways.
It is noted from the online database that Bulli Tile and Brick are noted to have surrendered their licence.

SEDIMENT PROCESSES 6-1
H:\N1037 WOLLONGONG COASTAL CREEKS & LAGOONS\DOCS\R.N1037.001.01.DOC 16/1/06 17:01
6 SEDIMENT PROCESSES
Relevant data regarding sediment processes are listed in Table 6-1.
Table 6-1 References relevant to Sediment Processes Reference Summary Comment AWT 1999 This study was conducted to assess the impact of
existing on-site sewage disposal systems and urban areas on water quality and ecosystem health. The streams covered include Hargraves, Stanwell and Stony Creeks – as part of the macro-invertebrate sampling a bank condition score was given to each of the sites.
EIA standard document. Methodology, results and QA procedures clearly indicated in report
Figgis 2001 One off sampling in Slacky Creek, Whartons Creek, Bellambi Creek and Collins Creek
Snapshot – QA procedures not indicated.
WCC 2004 Hewitts Flood Study including Slacky Creek, includes a qualitative description of historical fill exercises
Qualitative information
Blakey 2005
Investigation into the role of sediment type and light intensity in nutrient cycling for Bellambi Lagoon
Honours Thesis
6.1 Sediment Quality
As a part of the Wollongong Wide Water Quality Study (WWWQS), Figgis (2001) undertook a single episode sediment sampling exercise in the following study site creeks:
• Slacky Creek (2 sites)
• Whartons Creek (1 site)
• Collins Creek (2 sites)
• Bellambi Creek (2 sites)
The sediment results (Figgis 2001) show that sediment contamination is an issue, to some degree for each of the creeks sampled. The report acknowledges that poor recovery of results were experienced due to the use of a weak acid digest and the results are therefore discussed here with caution. The locations of the sediment sites are shown in Figure 6-1.

SEDIMENT PROCESSES 6-2
H:\N1037 WOLLONGONG COASTAL CREEKS & LAGOONS\DOCS\R.N1037.001.01.DOC 16/1/06 17:01
Table 6-2 gives the interim sediment quality guideline values (ISQG) recommended in ANZECC 2000, where available. The sampled creeks for which the triggers were exceeded are identified. This shows that for the sediments tested in this investigation, Nickel results in Slacky and Bellambi Creeks exceeded the guideline.
Table 6-2 Metal results for sediments in Wollongong Northern Streams compared to the ANZECC recommended Guidelines
ISQC – Low trigger value ISQC – High Value Anolyte
(mg/Kg DW) (mg/Kg DW)
Low trigger Exceeded by
High value exceeded by
Lead 50 220 Slacky Creek Collins Creek
Bellambi Creek Nil
Copper 65 270 Bellambi Creek Nil
Nickel 21 52
Slacky Creek Whartons Creek
Collins Creek Bellambi Creek
Slacky Creek Bellambi Creek
Zinc 200 410 Slacky Creek Collins Creek
Bellambi Creek Nil

SEDIMENT PROCESSES 6-3
H:\N1037 WOLLONGONG COASTAL CREEKS & LAGOONS\DOCS\R.N1037.001.01.DOC 16/1/06 17:01
Figure 6-1 Sediment sampling sites used by Figgis (2001)
Golder Associates (1993a) collected samples from eight locations within Bellambi Lagoon and found that the sediment consisted of silty clays within the northern part of the Lagoon and silty sands elsewhere. Chemical analysis was also undertaken for three of the samples and the results were compared to the Interim Sediment Quality Guideline values (ISQG) recommended in ANZECC 2000 (refer

SEDIMENT PROCESSES 6-4
H:\N1037 WOLLONGONG COASTAL CREEKS & LAGOONS\DOCS\R.N1037.001.01.DOC 16/1/06 17:01
Table 6-3). The comparison shows that lead and copper exceed the low ISQG and in the case of copper also the high ISQG value.

SEDIMENT PROCESSES 6-5
H:\N1037 WOLLONGONG COASTAL CREEKS & LAGOONS\DOCS\R.N1037.001.01.DOC 16/1/06 17:01
Table 6-3 Sediment Quality results for Bellambi Lagoon compared to ISQG Guidelines
Anolyte
Bellambi Lagoon Site 1 (Golder
Associates 1993)
Bellambi Lagoon Site 2 (Golder
Associates 1993)
Bellambi Lagoon Site 3 (Golder
Associates 1993)
ISQG – Low trigger value
ISQG – High trigger value
(mg/Kg DW) (mg/Kg DW) (mg/Kg DW) (mg/Kg DW) (mg/Kg DW)
Arsenic 0.001 0.004 0.009 20 70
Lead 62.8 56.8 32.7 50 220
Cadmium 0.83 0.81 0.81 1.5 10
Chromium 7.4 10.8 11.1 80 370
Copper 230 296 245 65 270
Zinc 86.8 138.3 88.2 200 410
Total PAHs 2.2 0.016 0.024 4000 4500
Total PCBs <0.001 <0.001 <0.001 23 Not given
Cyanide 45.5 87.5 77.3 Not given Not given

SEDIMENT PROCESSES 6-6
H:\N1037 WOLLONGONG COASTAL CREEKS & LAGOONS\DOCS\R.N1037.001.01.DOC 16/1/06 17:01
Figure 6-2 Sediment Sampling locations in Bellambi Lagoon (Golder and Associates, 1993a)
6.1.1 Nutrient fluxes
Blakey (2005) investigated the role of sediment type and light intensity in nutrient cycling, for Bellambi Lagoon. Through photosynthesis, benthic microalgae (BMA) influence nutrient cycling by direct uptake, and by increasing the oxygen concentration in sediments, thereby facilitating the oxidation of inorganic nutrients.
Muddy and sandy sediment cores were sampled over a three-month period in early 2005. The cores were exposed to five different treatments of light intensity. The rate of flux from the sediment to the water column was determined by changes in the water column over a four hour period, for oxygen (O2), dissolved inorganic nitrogen (NH4+, NO2
- and NO3-) free reactive phosphorus (FRP), and silcate
(SiO42-).
The investigation confirmed that there are significant differences in benthic flux rates between sediment types. While sandy sediments were found to be autotrophic and a net sink of nutrients from the water column, muddy sediments were heterotrophic and a net source of nutrients to the water column. The estimated annual nutrient load of DIN into the water column for the muddy sediments of Bellambi Lagoon was 609 ± 228 kg per year. Flux rates for both sediment types decreased in the cooler months. The differences in benthic flux rates between light treatments were not statistically significant
6.1.2 Erosion and sedimentation
During the macroinvertebrate sampling that was undertaken for the EIS into proposed sewerage upgrade for Stanwell Park and Coalcliff, a bank condition score was assigned to each of the sampling

SEDIMENT PROCESSES 6-7
H:\N1037 WOLLONGONG COASTAL CREEKS & LAGOONS\DOCS\R.N1037.001.01.DOC 16/1/06 17:01
sites in Stanwell, Stony and Hargraves Creeks, as well as reference creeks in the Royal National Park (AWT 1999). This score was based on the riparian, channel and environmental inventory developed by Peterson (1992). Analysis of these scores showed that:
• Bank condition was generally better for the reference sites in the Royal National Park;
• Stream bank condition was generally better for upstream sites than downstream sites; and
• The downstream sites sampled in Hargraves Creek had particularly poor bank condition.
The Flood Study for Slacky Creek (WCC, 2002) reports that the section between the rail crossing and the ocean entrance has been realigned and filled, creating a straight morphology with significant bank instability.
PWD et al (1993) identify the south western shoreline of Bellambi Lagoon as an area of significant erosion. The erosion escarpment was estimated to be between 0.5 and 1.0 metres high (PWD et al, 1993).
PWD et al (1993) report that the Water Board undertook probing and sampling to determine the thickness and nature of accumulated sediments in the Bellambi Lagoon. From this sampling it was determined that the sediment was silty sands and silty clays that were typically between 0.25 and 0.5 metres thick.
Improvement works completed in 1995 (refer to Section 3-6), were designed to remove much of this sediment. Post project survey information was not identified in the literature review. It is therefore impossible to comment on how the improvement works have impacted on the locations described in these studies.

HYDRODYNAMIC PROCESSES 7-1
H:\N1037 WOLLONGONG COASTAL CREEKS & LAGOONS\DOCS\R.N1037.001.01.DOC 16/1/06 17:01
7 HYDRODYNAMIC PROCESSES
Relevant data for Hydrodynamic Processes are summarised in Table 7-1
Table 7-1 References relevant to Hydrodynamic processes Reference Summary Comment Davidson 1981
An assessment of flooding to date in Wollongong that is acknowledged to be limited by a lack of discharge data, rigorous flood level data and rainfall data. Based mainly on articles in the Illawarra Mercury.
Is the best information available for this period although is clearly limited by a lack of scientifically rigorous data.
South Coast Times 1962
Newspaper article on the collapse of the Bellambi Creek Bridge in the November (1961) floods. Suggests that the bridge was originally constructed in 1930s and that beach access required the bridge.
An interesting historical insight.
WCC 2002 Flood study prepared under the NSW Govt Floodplain Management Manual includes Slacky Creek
Quantitative study with methodology and assumptions well defined
CECCS 1998
Describe creek entrance conditions for Stanwell Creek, Stony Creek, Slacky Creek Bellambi Creek and Bellambi Lagoon on 3- 5 occasions over a 12 month period
Scientific standard document.
WCC 2005 GIS layer- Flood Hazard Areas Varying and undocumented data sources used including anecdotal community information and surveys.
Sinclair Knight and Partners 1991
Flood study that considers 1%, 2% and 5% annual exceedence probability flood events for the tributaries of Collins Creek upstream of Campbell street
Quantitative study with methodology and assumptions well defined
PWD 1987 A summary document outlining flood issues in the vicinity of Woonona High School. Includes recommended options.
No data or quantitative information included in report
WCC (undated)
Reporting of monitoring results for substrate and groundwater chemistry in the vicinity of Tom Thumb Lagoon
Document incomplete
7.1 Tidal Flows
The data review found no information on tidal flows for the creeks and lagoons covered in this study. The NSW tidal monitoring network administered by Manly Hydraulics Laboratory (MHL) on behalf of the Department Natural Resources (DNR) does not have any water level instruments in the creeks covered by this study. Based on a search of their web based records and personal communications with Kerryn Stephens of DNR, MHL have never recorded tidal information in these creeks (MHL, 2005). The best indication of tidal influences at this stage would be through interpretation based on vegetation assemblages. An understanding of tidal hydraulics is very important in understanding overall hydraulic processes and flow on processes related to water quality, ecology and sediment transport.
Tidal limits are shown in Figures presented in Appendix A.

HYDRODYNAMIC PROCESSES 7-2
H:\N1037 WOLLONGONG COASTAL CREEKS & LAGOONS\DOCS\R.N1037.001.01.DOC 16/1/06 17:01
7.1.1 Entrance State
As a part of an investigation into fish species populating selected coastal creeks in the Wollongong LGA, CECCS (1998- refer to Section 4), also made notes on the entrance condition of Stanwell, Stoney, Slacky, Bellambi Creeks and Bellambi Lagoon. For each of these systems there are three to five occasions over a twelve month period that describe entrance state. It is not possible to make any interpolations of entrance states between sampling events.
Table 7-2 Observed entrance state (source: CECCS 1998)
Creek Stanwell Creek Stoney Creek Slacky Creek Bellambi
Creek Bellambi Lagoon
Summer 1996/1997 Closed - - Closed -
Autumn 1997 Open Open - - Open Winter 1997 Closed Open Closed Open Closed Spring 1997 Open Open Closed Closed Open
Summer 1996/ 1997 Closed Open Closed - -
7.1.2 Ocean Conditions
WCC (2002) described tide and ocean conditions at Port Kembla based on statistics supplied by the Department of Defence Navy Office. Based on some work reportedly undertaken by the Public Works Department for Warilla Beach and the entire NSW coast, and an allowance of 30cm for sea level rise in response to global warming, design ocean water levels for a 1%, 2% and 5% AEP event were presented (WCC, 2002). Typical ocean levels are shown in Table 7-3, while design ocean levels are shown in results are presented in Table 7-4
Table 7-3 Ocean tidal statistics for Port Kembla, as reported by WCC (2002) Units mAHD
Highest Astronomical Tide (HAT) 1.12 Mean Higher High Water (MHHW) 0.62 Mean Lower High Water (MLHW) 0.32 Mean Sea Level (MSL) -0.08 Mean Higher Low Water (MHLW) -0.58 Mean Lower Low Water (MLLW) -0.58 Lowest Astronomical Tide (LAT) -0.88
Table 7-4 Design Ocean Water Levels for the Hewitts Creek (incl. Slacky Creek) Flood Study (WCC 2002)
Design Condition Adopted Ocean Condition (mAHD)
For extreme ocean condition including an allowance of 0.3m for global warming
3.7
For a design 1% AEP ocean condition including an allowance of 0.3m for global warming
2.7
For a design 5% AEP ocean condition including an allowance of 0.3m for global warming
2.4
For a conservatively high but ‘likely’ tidal/ocean condition at the peak of a design flood (MLHW + 0.07)
1.0
The closest offshore wave rider buoys would be at Sydney and Batemans Bay. Information from these buoys can be obtained from MHL.

HYDRODYNAMIC PROCESSES 7-3
H:\N1037 WOLLONGONG COASTAL CREEKS & LAGOONS\DOCS\R.N1037.001.01.DOC 16/1/06 17:01
7.2 Freshwater Flows
Davidson (1981) undertook an assessment of flooding in Wollongong between 1945 and 1977 based on reports in the Illawarra Mercury and records held by emergency response and government organisations. The study found that for the 200 days in this period where rainfall of > 200mm per day was recorded at Mount Keira Scout Camp, 73 resulted in reports of some degree of flooding in Wollongong (Davidson 1981). The data presented is not spatially specific.
The South Coast Times (1962), reported that the bridge across Bellambi Creek from the beach to the surf club was washed away in the November 1961 floods. The newspaper report describes the bridge as being 30ft long and necessary to get from the surf club to the beach during high tide (South Coast Times, 1962).
WCC (2002) investigated and quantified the existing flood behaviour of Slacky Creek. Data collected for the study included resident interviews and a creek survey. Hydrologic modelling was undertaken using WBNM and results from this were used in the hydraulic US Army Corp Engineer model, HECRAS. The model was calibrated and verified using flood events from 1988 and 1991. 5%, 2%, 1% and Probable Maximum Flood (PMF) were determined for Slacky Creek. Slacky Creek was considered in two sections from the ocean to the coal haulage embankment below Hobart Street and from the coal haulage embankment up to the bend in National Avenue.
Sinclair Knight (1991) modelled flood events for the tributaries of Collins Creek upstream of Campbell Street, known as Popes Gully. Three branches of the creek were modelled separately. The results are presented for 1%, 2% and 5% AEP events. The data used in the modelling exercise included cross sections (included in appendix to report).
In March 1987, the Public Works Department undertook an investigation into flooding of Collins Creek in the vicinity of Woonona High School (PWD, 1987). The report superseded a report completed in 1986 (not reviewed for this study). The report concludes that flooding in this area occurs because the flow capacity of Liddle Street culvert is inadequate to carry flows with a less than 33% chance of occurrence and sections of Collins Creek are narrow and incapable of carrying minor flood flows. Three options for addressing these issues are canvassed.
Wollongong Council provided three GIS layers relevant to flooding in the Study Area. Meta data were not supplied with these layers and for the purpose of this study they will be referenced as Wollongong City Council (2005). Robert Dinaro of the flood section advised that, in general, the hazard areas are mapped from a compilation of data including:
• Information collected from historic flood events;
• Information that is brought to Council's attention;
• Land that is within a 10m setback from the top of bank of a watercourse; and
• Investigations that may have been carried out.
Robert Dinaro reiterated that these hazard areas are simply a compilation of information and do not represent the entire floodplain (ie areas inundated by the Probable Maximum Flood). In order to obtain an estimate of the entire floodplain, a comprehensive Flood Study would need to be

HYDRODYNAMIC PROCESSES 7-4
H:\N1037 WOLLONGONG COASTAL CREEKS & LAGOONS\DOCS\R.N1037.001.01.DOC 16/1/06 17:01
undertaken for the respective catchments (similar to that undertaken for the Hewitts Creek catchment).
A hydrologic assessment to determine the flow characteristics of stormwater drains flowing into the Bellambi Lagoon was reportedly prepared by the former Water Board in 1992 under the clean waterways program (PWD et al, 1993), however, the report was not located in the current study. Details of stormwater outlets and contributions to Bellambi Lagoon are discussed in some detail in PWD et al (1993). Peak discharges for the major drain at Turners Esplanade and for the total Bellambi Lagoon were modelled using WBNM for the 1, 10 and 100 year average recurrence interval (PWD et al, 1993). Peak discharges for four design events are reproduced in Table 7-5.
Table 7-5 Peak Discahrges estimated for Bellambi Lagoon (Source: PWD et al., 1993) Peak Discharges
Qmax (m3/sec) Rainfall Event Turners Esplanade Drain Total Bellambi Lagoon
1 in 1 year ARI, 2 hr duration 10.8 13.3 10 year ARI, 2 hr duration 24.1 33.1 10 year ARI, 6 hr duration 23.3 32.1 100 year ARI, 2 hr duration 42.7 56.5
7.3 Groundwater
Data can be sourced from the online NSW Natural Resource Atlas (formerly CANRI) showing licensed groundwater bores for the Wollongong LGA.
Groundwater monitoring has been undertaken recently in Tom Thumb Lagoon. The monitoring was commissioned by Council in response to degradation of saltmarsh, most notably the species Sporobolus virginicus, attributed to leachate from the adjacent landfill site. A report detailing the monitoring results was provided by WCC (undated). The report states that two groups of piezometers were installed, the first in the reference area towards the south of the site (presumed to be unaffected by leachate) and the second group to the north. The most distinctive difference between the reference and impacted sites was found to be in ammoniacal nitrogen concentrations. The average concentration of ammoniacal nitrogen in the groundwater of the impacted site is 97.6% greater than that of the reference site. The soil of both the reference site and impacted sites contains high concentrations of iron hydroxide (which can increase water logging).
7.4 Bathymetry
Slacky Creek was surveyed by WCC (2002) from the entrance to the embankment behind National Avenue.
PWD et al (1993) reproduce a survey of Bellambi Lagoon undertaken by the Water Board in November 1991. From this information, it is deduced that the lagoon has a level of between 0.5 and 1.5 metres above AHD (PWD et al, 1993). Since this time, the Bellambi Lagoon improvement works would have modified the bathymetry of waterway.
Bathymetric details of all other creeks in the study area are not available.

HYDRODYNAMIC PROCESSES 7-5
H:\N1037 WOLLONGONG COASTAL CREEKS & LAGOONS\DOCS\R.N1037.001.01.DOC 16/1/06 17:01
7.5 Waves
There is no direct data available on ocean waves penetrating the creeks and lagoons.
PWD et al (1993) estimated return periods, significant wave heights and significant wave periods for the measured fetches for wind generated waves within Bellambi Lagoon. The highest Hs value given is 0.45 metres for a southerly fetch with a 1 in 50 year ARI (PWD et al, 1993)
CONCLUSIONS AND RECOMMENDATIONS 8-1
H:\N1037 WOLLONGONG COASTAL CREEKS & LAGOONS\DOCS\R.N1037.001.01.DOC 16/1/06 17:01
8 CONCLUSIONS AND RECOMMENDATIONS
The creeks and lagoons covered by this assessment are small systems with highly urbanised lower catchment areas. The data review has indicated a range of human impacts with the most pronounced issues across the systems being a decline in water quality, loss of valued ecological communities, weed invasion and contamination of sediments and the water column by heavy metals. Much of the data collected for these creeks has been gathered in an ad hoc and uncoordinated manner without adequate quality control. Reliable information is important to ensure appropriate management required for the protection of the creeks environmental values and to improve their condition into the future.
From an estuarine processes perspective, it is imperative that some information on tidal influences be gathered on the systems.
Based on the limited information available, a list of potential management issues and corresponding data gaps has been developed. Where considered appropriate, further studies or management actions have been recommended. In terms of the development of an Estuary Processes Study (under the NSW Estuary Management Manual, 1992), the recommended actions have been prioritised as high, medium or low. This information is presented in Table 8-1.

CONCLUSIONS AND RECOMMENDATIONS 8-1
H:\N1037 WOLLONGONG COASTAL CREEKS & LAGOONS\DOCS\R.N1037.001.01.DOC 16/1/06 17:01
Table 8-1 Potential Management Issues, Data Gaps and Recommended Actions Potential Issue Creeks potentially
Impacted upon Existing knowledge Data Gaps Recommended Action
MA: Management Action FS: Further Studies
Priority
Acid Sulphate Soils
All Council GIS mapping potential ASS sites.
Actual extents of acid sulphate soils within catchment
MA Review planning requirements to ensure that developments with potential to disturb ASS require sampling / impact assessment and appropriate management actions
High
Disturbance of Aboriginal Sites
All AHIMS register
Study by Navin Officer 1994 demonstrates that AHIMS register does not accurately reflect what’s actually on the ground
MA Review planning framework to ensure that developments with potential to impact on known or unknown sites of Aboriginal Heritage are required to undertake adequate surveying/impact assessment
High
Continued loss of saltmarsh and seagrass
All No mapping of estuarine flora available at appropriate scale for study area
Up to date and historical mapping
FS Undertake program of estuarine vegetation mapping prior to completing the estuary Processes Study FS Identify potential threats to saltmarsh and seagrass
High
Human impacts on fish diversity, size and abundance
All, but particularly creeks for which there is little data such as Hargraves Creek, Whartons Creek, Collins Creek and Tom Thumb Lagoon
CECCS 1998 study limited to shallow waters in Stanwell Creek, Bellambi Lagoon, Stony Creek, Slacky Creek and Bellambi Creek.
Seasonal data on fish species living in creeks – including lists of threatened and commercial species.
FS Undertake field sampling to determine fish communities utilising the creeks
High
Human impacts on benthic macro invertebrates
All, with a priority on creeks other than Hargraves, Stanwell and Stony.
AWT (1999) undertook sampling for Hargraves, Stanwell and Stony Creeks and compared to a reference site in the Royal National Park. For all other sites there is basically no information.
Condition and diversity of macroinvertebrates in creeks
FS Undertake a field sampling across seasons to determine diversity and condition of macroinvertebrate communities, consistent with AWT study
High

CONCLUSIONS AND RECOMMENDATIONS 8-2
H:\N1037 WOLLONGONG COASTAL CREEKS & LAGOONS\DOCS\R.N1037.001.01.DOC 16/1/06 17:01
Potential Issue Creeks potentially Impacted upon
Existing knowledge Data Gaps Recommended Action MA: Management Action FS: Further Studies
Priority
Declining Water Quality
All Data is sparse and collection has not been adequately quality controlled
Temporal and spatial water quality fluctuations and response to events.
MA Within EPS and EMS consider developing a quality controlled and targeted water quality monitoring program- including time of data, sampling technique and weather conditions for sampling events. MA Assess impacts of stormwater/urbanisation on Hargraves, Stanwell and Stony Creeks now that low gravity sewer has been introduced
High
Impacts from pollution incidents from currently used and disused industrial sites and fill
Stony, Slacky, Whartons, Bellambi Gully and Tom Thumb
EPA website lists pollution incidents for licensed sites Groundwater monitoring being undertaken near Tom thumb Lagoon.
Potential incidents from disused sites such as Bulli Tile and Brick in the Slacky Creek Catchment
FS Determine ongoing impacts of disused sites MA Manage and treat tip leachate presently impacting on saltmarsh of Tom Thumb Lagoon
High
Erosion and sedimentation
All Nil Identification of hotspots for erosion Assessment of adequacy of existing sediment control strategies for building sites
FS As part of EPS map and prioritise bank erosion sites MA Audit building sites to assess adequacy of sediment management techniques
High
Tidal influences on estuaries, including flushing potential
All Nil Tidal planes and tidal flushing FS Undertake tidal monitoring prior to EPS – prioritise for systems with larger lagoons FS survey bathymetry FS Model tidal flushing
High
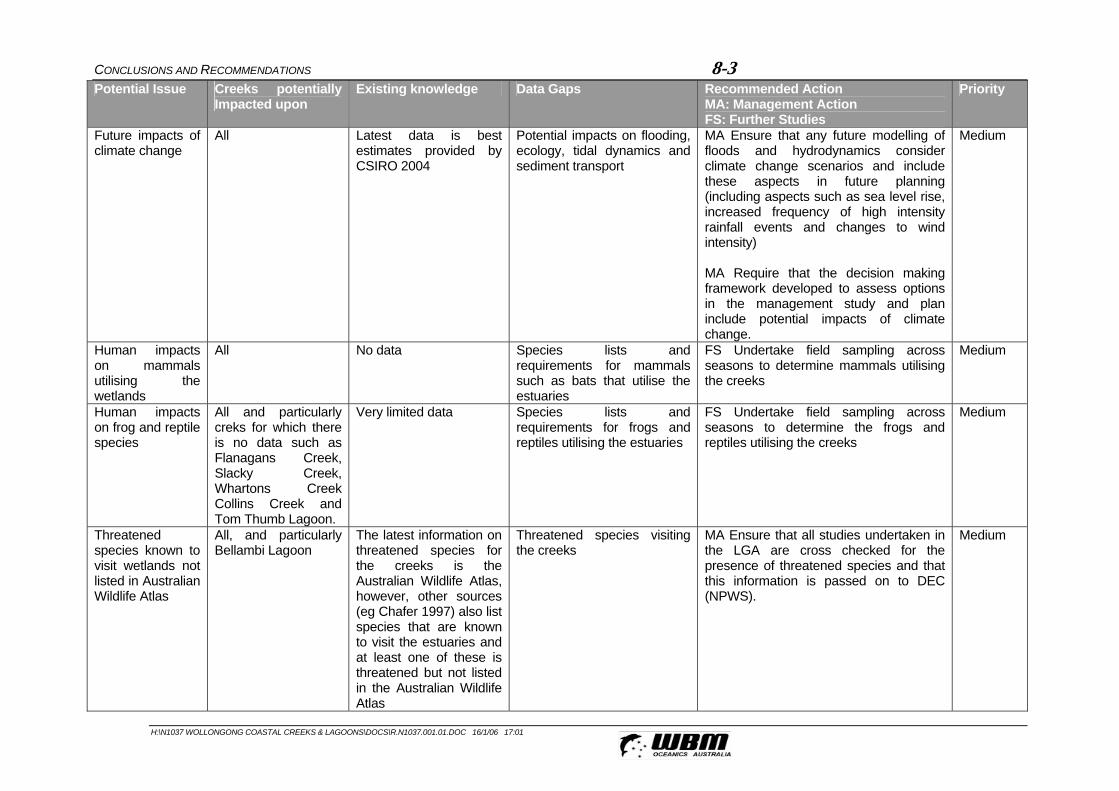
CONCLUSIONS AND RECOMMENDATIONS 8-3
H:\N1037 WOLLONGONG COASTAL CREEKS & LAGOONS\DOCS\R.N1037.001.01.DOC 16/1/06 17:01
Potential Issue Creeks potentially Impacted upon
Existing knowledge Data Gaps Recommended Action MA: Management Action FS: Further Studies
Priority
Future impacts of climate change
All Latest data is best estimates provided by CSIRO 2004
Potential impacts on flooding, ecology, tidal dynamics and sediment transport
MA Ensure that any future modelling of floods and hydrodynamics consider climate change scenarios and include these aspects in future planning (including aspects such as sea level rise, increased frequency of high intensity rainfall events and changes to wind intensity) MA Require that the decision making framework developed to assess options in the management study and plan include potential impacts of climate change.
Medium
Human impacts on mammals utilising the wetlands
All No data Species lists and requirements for mammals such as bats that utilise the estuaries
FS Undertake field sampling across seasons to determine mammals utilising the creeks
Medium
Human impacts on frog and reptile species
All and particularly creks for which there is no data such as Flanagans Creek, Slacky Creek, Whartons Creek Collins Creek and Tom Thumb Lagoon.
Very limited data Species lists and requirements for frogs and reptiles utilising the estuaries
FS Undertake field sampling across seasons to determine the frogs and reptiles utilising the creeks
Medium
Threatened species known to visit wetlands not listed in Australian Wildlife Atlas
All, and particularly Bellambi Lagoon
The latest information on threatened species for the creeks is the Australian Wildlife Atlas, however, other sources (eg Chafer 1997) also list species that are known to visit the estuaries and at least one of these is threatened but not listed in the Australian Wildlife Atlas
Threatened species visiting the creeks
MA Ensure that all studies undertaken in the LGA are cross checked for the presence of threatened species and that this information is passed on to DEC (NPWS).
Medium

CONCLUSIONS AND RECOMMENDATIONS 8-4
H:\N1037 WOLLONGONG COASTAL CREEKS & LAGOONS\DOCS\R.N1037.001.01.DOC 16/1/06 17:01
Potential Issue Creeks potentially Impacted upon
Existing knowledge Data Gaps Recommended Action MA: Management Action FS: Further Studies
Priority
Weed Infestation All Condition of riparian vegetation has been mapped for all systems, although not all of Tom Thumb Lagoon.
MA Rehabilitate creeks Medium
Declining Water Quality as a result of point Sources of pollution
All Stormwater and sewer overflow points mapped for lower sections of Slacky, Whartons, Collins and Bellambi Creeks in 1992. Data not available for other creeks
Possible point sources of pollution
FS As part of EPS map existing stormwater outlets and sewage overflow points.
Medium
Mobilisation of contaminated sediments
All All creeks had high metal concentrations in the water column
Identification of current sources of contaminants. Sediments / water column interactions
FS Assess possible sources of contaminants and rates of contaminant input
Medium
Opening management strategies
All except Tom Thumb Lagoon
Very limited Triggers, policy and methods for modifying entrance state.
MA For future operations record information including trigger, liaison with DNR, conditions before opening – avoid artificial opening where possible.
Medium
Flooding risk on infrastructure / property
All except Slacky Creek
Limited to GIS layers supplied by Council without clear indication of the quality of data supplied
Best information available on flood levels with an indication of the reliability of the data presented
MA Develop metadata for council GIS flood layer based on methods used to develop flood liable areas for each of the creeks.
Medium
Algal blooms and flow-on ecological impacts
All Very limited Information on algal species presence, abundance, blooms and triggers
FS Identification and assessment of algal species MA Monitoring of blooms
Medium
Birds utilising creeks and potential threats
All Inventory by Chafer 1997 and threatened species listed in Australian Wildlife Atlas
Data absent for Flanagans Slacky and Whartons Creek
FS Bird survey across seasons Medium
Continued loss of Endangered Ecological Communities
All The Biodiversity Assessment Study mapping of Endangered Ecological Communities
Up to date mapping of EECs FS Map estuarine EECs (saltmarsh considered above) FS Identify potential threats to estuarine
Low

CONCLUSIONS AND RECOMMENDATIONS 8-5
H:\N1037 WOLLONGONG COASTAL CREEKS & LAGOONS\DOCS\R.N1037.001.01.DOC 16/1/06 17:01
Potential Issue Creeks potentially Impacted upon
Existing knowledge Data Gaps Recommended Action MA: Management Action FS: Further Studies
Priority
(EECs)– since this study was completed there have been changes to Schedule 1 of the threatened species conservation act which lists EECs.
EECs
Impacts of reduced environmental flows
All, and particularly Stony Creek which is damned.
A GIS layer with extraction sites is available from DNR.
Extraction rates and dam release regime.
FS Desktop study to determine current extraction rates and to identify opportunities to modify dam management to benefit estuarine processes
Low
Entrance Regime All except Tom Thumb Lagoon
Very Limited Understanding of entrance dynamics and understanding of how this impacts other processes
FS Ask surfclub/local residents to observe and record conditions over two years. Alternatively, install continuous water level recorders in creeks
Low
Impacts from recreational users
All Current recreational use unknown
Up to date information on recreational uses, potential conflicts and impacts
FS Recreational Assessment Low

REFERENCES 9-1
H:\N1037 WOLLONGONG COASTAL CREEKS & LAGOONS\DOCS\R.N1037.001.01.DOC 16/1/06 17:01
9 REFERENCES
Anthony, L. 1994 An Environmental Management Plan for Bellambi Creek Catchment report prepared for Wollongong City Council
Australian Department of Environment and Heritage 2005 The Australian Heritage Data base accesses at http://www.deh.gov.au/cgi-bin/ahdb/search.pl on May 23 2005.
AWT 1999 Priority Sewerage Program Environmental Impact Statement Appendix E Water Quality Monitoring Study
AWT 1999b Priority Sewerage Program Environmental Impact Statement Appendix H Water Quality Modelling Study
Bowman 1974Geology of the Wollongong, Kiama and Robertson 1: 50 000 sheets NSW Geological Survey Sydney
Centre for Estuarine and Coastal Catchment Studies (CECCS) 1998 Shallow Water Fishes of Illawarra Wetlands University of Wollongong
Chafer, C.J., 1997 Biodiversity of Wetlands in the Illawarra Catchments: an inventory. Illawarra Catchment Management Committee, Wollongong.
CSIRO 2004 Climate Changes in NSW Part 2: Projected changes in Climate Extremes
Davidson, A.R. (1981) Flooding in Wollongong 1945-1977 A Survey: Occasional Paper No 30 Department of Geography, R.M.C., Duntroon.
DIPNR 2004 Riparian Corridor Management Study covering all of the Wollongong LGA and Calderwood Valley in the Shellharbour LGA Prepared for Wollongong City Council in March 2004
DPI (Fisheries) 2005 http://www.fisheries.nsw.gov.au/threatened_species/threatened_species accessed May 23 2005
Figgis 2001 A Water and Sediment Quality Study of Wollongong Northern Streams Honors Research Report for the University of Wollongong.
Forbes Rigby 1999 Draft Wollongong Coastal Stormwater Management Plan
Geoscience Australia 2005 Coastal Indicator Knowledge and Information System I: Biophysical Indicators (Radke, L.C., Smith, C.S., Ryan D.A., Brooke, B., Heggie, D. and contributors). [Web document]. Canberra: Geoscience Australia. www.ozestuaries.org/indicators (Accessed November 28th 2004)
Golder Associates 1993a Soil Sampling and Testing Bellambi Lagoon Restoration between Aldridge Avenue and Birch Crescent Bellambi NSW prepared for the South Coast Region office of the Department of Public Works in February 1993 (viewed for the present study as an appendix to PWD 1993)

REFERENCES 9-2
H:\N1037 WOLLONGONG COASTAL CREEKS & LAGOONS\DOCS\R.N1037.001.01.DOC 16/1/06 17:01
Golder Associates 1993b Geotechnical Investigation for proposed earthworks Bellambi Lagoon report prepared for South Coast Region office of the Department of Public Works in December 1993
McKinnon, L. 2004 Sydney Coastal Estuarine Swamp Forest Complex Validation and Field Assessment of this Endangered Ecological Community (EEC) occurring on Community Lands within the Wollongong LGA Bachelor of Environmental Science Honours Project for the University of Wollongong.
McGowan, J. 2002 Genetic tests of species identity in the freshwater crayfish of the Illawarra Honours Thesis from the University of Wollongong
Merrin, J and Chafer, C. 2000 Illawarra Wetlands Action Plan report prepared for the Illawarra Catchment Management Committee
MHL 2005 www.mhl.nsw.gov.au accessed May 2005
Mills, K. (1986) Items of Environmental Heritage – Natural Features A brief report prepared for the Environmental Heritage Committee
Neil 2005 Vegetation Management Plan for Hargraves Creek and Stanwell Park Funded by Wollongong City Council Environment Fund
NSW Government 1992 Estuary Management Manual
NSW National Parks and Wildlife Service (2002) Fact sheet on changes to the Threatened Species Conservation Amendment Act 2002: An Introduction. (Available online at http://www.nationalparks.nsw.gov.au/PDFs/tsc_amendment_act_factsheet.pdf
NSW National Parks and Wildlife Service 2003 Native Vegetation of the Illawarra Escarpment and Coastal Plain
Ochier, V 1996 Bellambi Creek: Community Participation for a sustainable future report prepared for Wollongong City Council
Public Works Department (PWD) and Wollongong City Council 1993 Bellambi Lagoon Improvement works Statement of Environmental Effects
Public Works Department (PWD) 1987 Woonona High school Flooding of Collins Creek Investigation Report Report No. PK 8702
Robinson, N.H. 1995 Mammals of the Illawarra Escarpment between Stanwell Park and Camblawarra report produced by the Illawarra Heritage Committee
Scientific Services 1992 Inquiry and special Investigation Bellambi - Bulli Survey Report A survey of Discharge Points that may impact on bathing water quality
Shah, V.G., Dunstan, H. and Geary, P.M 2004 Choice of Bacterial Indicator Organism and Source Tracking of Faecal Pollution in Coastal Waters

REFERENCES 9-3
H:\N1037 WOLLONGONG COASTAL CREEKS & LAGOONS\DOCS\R.N1037.001.01.DOC 16/1/06 17:01
Sinclair Knight and Partners 1991 Collins Creek Flood Study Report prepared for Wollongong City Council
South Coast Times 1962 Bridge that GAP! Article on the collapse of the Bellambi Creek Bridge Monday March 5, 1962.
Sydney Water (unpublished) Files related to the Bellambi Lagoon Improvement Works File Numbers: RMIL 260461FB; RMIL 259761FB and RMIL 300549F2).
Thomas, Karin 1987 Bellambi Lagoon and Ecological Overview prepared for the Bellambi Lagoon protection and regeneration association
Tuckett Carr 2005 Collins Creek Riparian Vegetation Management Plan
Wollongong City Council 2002 Hewitts Creek Flood study incorporating Slacky, Tramway, woodlands and Thomas Gibson Creeks
Wollongong City Council 2003 State of the Environment Report 2002/2003
Wollongong City Cuncil 2005 GIS layers
Wollongong City Council 2005b Excel spreadsheet of water quality
Wollongong City Council 2005c Summary of information on European History of the Wollongong area viewed online at http://www.wollongong.nsw.gov.au/library/localinfo/wollongong/history.html in December 2005.