Embed Size (px)
Citation preview

Fa.M.A.F. – Universidad Nacional de Córdoba – Argentina
Gustavo Monti
Principios Básicos de RMN en sólidos destinado a usuarios

SPECTRAL EDITING

Principios Básicos de RMN en sólidos destinado a usuarios: 24-28 de noviembre 2014
Editing
•sideband suppression
•discrimination of C(quarternary), CH, CH2, CH3
• Non Quarternary Suppression (NQS)
• Polarization/Polarization Inversion (CPPI)
Relaxation (in CPMAS experiments)
•T1 and T1ρ measurement for X (e. g. 13C) using CP
•T1 and T1ρ measurement for 1H using CP
Principios Básicos de RMN en sólidos destinado a usuarios: 24-28 de noviembre 2014
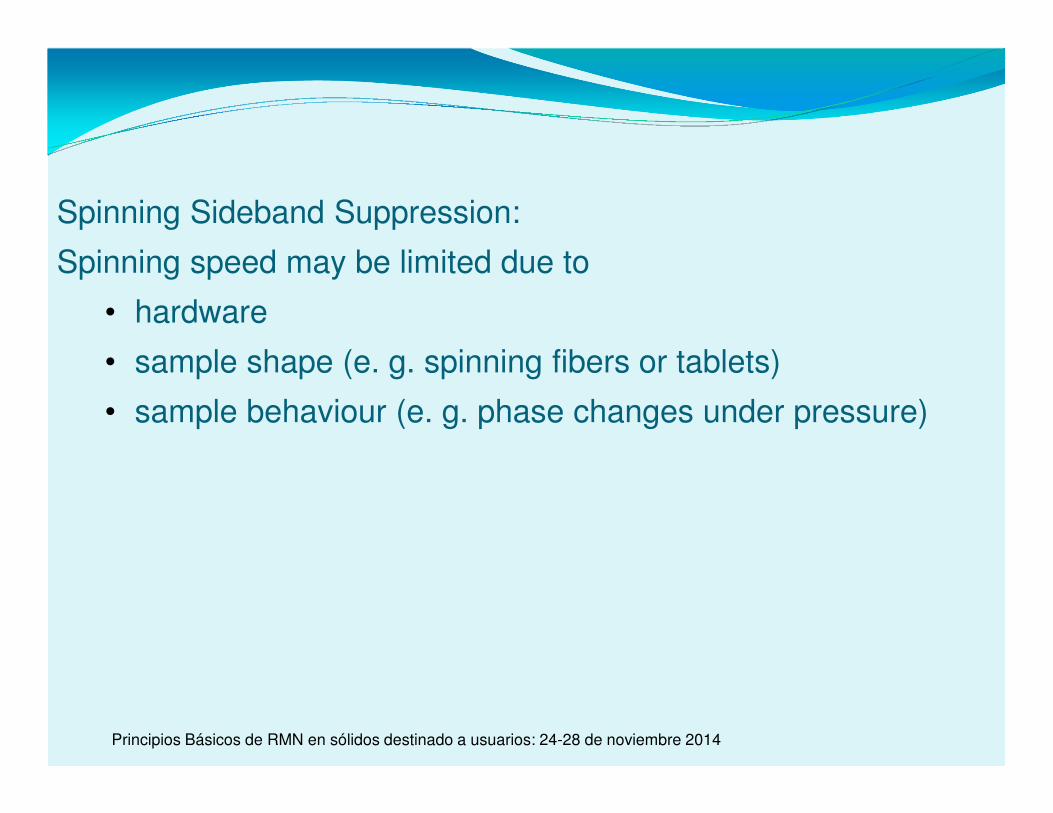
Spinning Sideband Suppression:
Spinning speed may be limited due to
• hardware
• sample shape (e. g. spinning fibers or tablets)
• sample behaviour (e. g. phase changes under pressure)

Principios Básicos de RMN en sólidos destinado a usuarios: 24-28 de noviembre 2014
180x 180-x 180x 180-y
τ1 τ2 τ3 τ4 τ5
90x
1H
contact
decoupling
acquire 13C
contact
TOSS
Total Suppression of Spinning Sidebands
ττττ1111/τ/τ/τ/τrot ττττ2222/τ/τ/τ/τrot ττττ3/τ/τ/τ/τrot ττττ4/τ/τ/τ/τrot ττττ5/τ/τ/τ/τrot ττττtotal/τ/τ/τ/τrot
TOSS A 0.1885 0.0412 0.5818 0.9588 0.2297 2.0000
TOSS B 0.1225 0.0773 0.2236 1.0433 0.7744 2.2412

Principios Básicos de RMN en sólidos destinado a usuarios: 24-28 de noviembre 2014
TOSS
Total Suppression of Spinning Sidebands
L-tyrosine hydrochloride
HCl
top:
TOSS A
4mm probe
5 kHz spinning
(trot= 200 µs)
bottom:
standard CP

Principios Básicos de RMN en sólidos destinado a usuarios: 24-28 de noviembre 2014
τ dephase
180 x
90 x
1H
contact
decoupling
aquire 13C
contact
NQS: Non Quarternary Suppression
refocussed (Hahn echo) version to avoid phase distortion
tdephase for 13C: typically 20 - 100 µs

180 160 140 120 100 80 60 40 20 0
δδδδ13C
(ppm)
180 160 140 120 100 80 60 40 20 0
δδδδ13C
(ppm)
Nitazoxanide
Top: Standard CP
Bottom: NQS
40us delay
NQS: Non Quarternary Suppression
CH3 not supressed
Principios Básicos de RMN en sólidos destinado a usuarios: 24-28 de noviembre 2014

τdephase
180x 180-x 180x 180-y
τ1 τ2 τ3 τ4 τ5
90x
1H
contact
decoupling
aquire13Ccontact
decoupling
TOSS:
Combined with NQS
dephasing delay within TOSS timing
ττττ1111/τ/τ/τ/τrot ττττ2222/τ/τ/τ/τrot ττττ3/τ/τ/τ/τrot ττττ4/τ/τ/τ/τrot ττττ5/τ/τ/τ/τrot ττττtotal/τ/τ/τ/τrot
TOSS A 0.1885 0.0412 0.5818 0.9588 0.2297 2.0000
TOSS B 0.1225 0.0773 0.2236 1.0433 0.7744 2.2412
Principios Básicos de RMN en sólidos destinado a usuarios: 24-28 de noviembre 2014

2030405060708090100110120130140150160170180190 ppm
TOSS and NQS
L-tyrosine hydrochloride
HCl
standard CP
TOSS B
NQS
+TOSS B
Principios Básicos de RMN en sólidos destinado a usuarios: 24-28 de noviembre 2014

90x
1H
polarization
decoupling
aquire13Ccontact
y y
invers.
inversion time for 13C: typically 20 - 400 µs
Polarisation/Polarisation Inversion
Pulse Sequence

2030405060708090100110120130140150160170180190 ppm
L-tyrosine hydrochloride
HCl
+: C, CH3
0: CH
-: CH2
Polarisation/Polarisation Inversion

Enhancement
= sensitivity (and faster recycling) for X
= resolution (for 1H)
CP-Enhanced Relaxation Time Measurement

τ
13C
1H
CP Enhanced T1 Relaxation Pulse Sequence
13C T1 measurement
τ
13C
1H
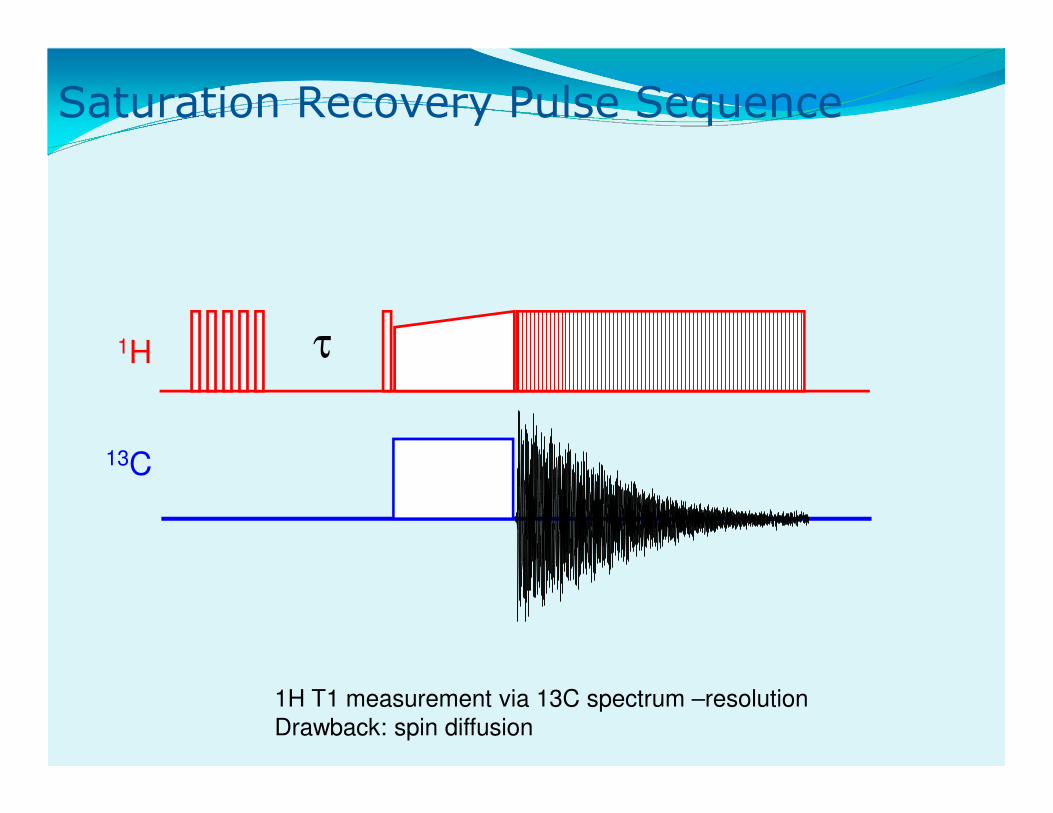
Saturation Recovery Pulse Sequence
1H T1 measurement via 13C spectrum –resolution
Drawback: spin diffusion

Glycine 1H T1 Relaxation via CP to 13C
a.u.
0.5 1.0 1.5 2.0 2.5 3.0 3.5 4.0 4.5 sec
0.9
0.8
0.7
0.6
0.5
0.4
0.3
0.2
0.1
0.0
(2)
(1)
Peak No. 1 at 175.149 ppm, satrec, I[0] = 8.502e-01, T = 488.003m (1)Peak No. 2 at 42.392 ppm, satrec, I[0] = 9.977e-01, T = 487.864m (2)
a.u.
0.5 1.0 1.5 2.0 2.5 3.0 3.5 4.0 4.5 sec
0.9
0.8
0.7
0.6
0.5
0.4
0.3
0.2
0.1
0.0
(2)
(1)
Peak No. 1 at 175.058 ppm, satrec, I[0] = 8.120e-01, T = 580.161m (1)Peak No. 2 at 42.283 ppm, satrec, I[0] = 9.989e-01, T = 582.025m (2)
a.u.
0.5 1.0 1.5 2.0 2.5 3.0 3.5 4.0 4.5 sec
0.9
0.8
0.7
0.6
0.5
0.4
0.3
0.2
0.1
0.0
(2)
(1)
Peak No. 1 at 175.112 ppm, satrec, I[0] = 5.528e-01, T = 720.245m (1)Peak No. 2 at 42.265 ppm, satrec, I[0] = 9.981e-01, T = 724.414m (2)
12.5 kHz 10.0 kHz
5.0 kHz

13C
1H τ
13C detected 1H T1ρ pulse sequence
τ


The QUCP pulse sequence. The DARR irradiation with intensity of ω1H = νMAS is applied
on I channel during the mixing time. Solid bars denote π/2 pulses. Phase cycles: Φ1 =
x,x; Φ2 = y; Φ3 = y,y,y,y,x,x,x,x; Φ4 = x,x,x, x,y,y,y,y; Φ5 = x,x,y,y,x,x,y,y; receiver =
y,y,x,x,y,y,x,x.
Quantitative CP: QUCP
G. Hou et al. / Chemical Physics Letters 421 (2006) 356–360

13C MAS spectra of uniformly 13C, 15N-labeled tyrosine
acquired with a single 90 pulse with proton decoupling (a), CP
(b), QUCP (c) and NOP (d, e). Eight FIDs were accumulated for
each experiment, and the spectra were plotted on the same
amplitude scale. The relaxation interval was 500 s for (a), 16 s
for (b–e). The contact time was 0.5 ms for (b) and (c). For QUCP
experiment, the DARR irradiation time was 1 s. The mixing times
are 10 and 20 s for (d) and (e), respectively.