Embed Size (px)
Citation preview

RIS A Think-Tankof Developing Countries
— Policy research to shape the international development agenda
Discussion Paper # 169
RIS Discussion Papers
RISResearch and Information Systemfor Developing Countries Core IV-B, Fourth Floor, India Habitat Centre, Lodhi Road, New Delhi-110 003, India.
Ph. 91-11-2468 2177-80, Fax: 91-11-2468 2173-74-75, Email: [email protected]: http://www.ris.org.in, http://www.newasiaforum.org
RISResearch and Information Systemfor Developing Countries
Rajesh Mehta
International Food Safety Standards and
India's Food Exports
An Analysis Based on Gravity Model Using Three-Dimensional Data
Research and Information System for Developing Countries (RIS), a
New Delhi based autonomous think-tank under the Ministry of
External Affairs, Government of India is an organization that
specializes in policy research on international economic issues and
development cooperation. RIS is envisioned as a forum for fostering
effective policy dialogue and capacity-building among developing
countries on international economic issues.
The focus of the work programme of RIS has been on promoting
South-South Cooperation and assisting developing countries in
multilateral negotiations in various forums. RIS has been engaged in
the Track II process of several regional initiatives. RIS is providing
analytical support to the Government of India in the negotiations for
concluding comprehensive economic partnership agreements with
partner countries. Through its intensive network of policy think
tanks, RIS has sought to strengthen policy coherence on international
economic issues.
For more information about RIS and its work programme, please visit
its website: www.ris.org.in

International Food Safety Standards and India’s Food Exports
An Analysis Based on Gravity Model Using Three-Dimensional Data
Rajesh Mehta
RIS-DP # 169
September 2010
CoreIV-B,FourthFloor,IndiaHabitatCentreLodhi Road, New Delhi – 110 003 (India)
Tel: +91-11-2468 2177/2180; Fax: +91-11-2468 2173/74Email: [email protected]
RIS Discussion Papers intend to disseminate preliminary findings of the research carried out within the framework of institute’s work programme or related research. The feedback and comments may be directed to the author(s). RIS Discussion Papers are available at www.ris.org.in

1
Abstract: The paper tries to understand precisely how the food safety regulations applied by the industrialized countries have an effect on India’s export of processed food to these markets. It also examines the information deficiencies of Indian firms about international food safety standards, which influence their current performance. In the light of these objectives the paper tests a few hypotheses using primary data. This has been carried out by estimating gravity model using three-dimensional statistics. Our results show that India stood to loose around 156 per cent of actual exports because of higher stringent food safe regulations in select developed countries. It also proves that foreign collaborators provide better information about the prevailing food safety regulations and how to meet those obligations.
Keywords: India’s processed food export, international food safety standards, Gravity Model, fixed effects model, random effect model
International Food Safety Standards and India’s Food Exports
An Analysis Based on Gravity Model Using Three-Dimensional Data*
Rajesh Mehta**
*This paper is based on the detailed study titled ‘International Food Safety Regulations and Processed Food Exports from Developing Countries’. Author would like to express his appreciation to various organizations and individuals. I am especially thankful to R.G. Nambiar, Prema-chandra-Athukorala, Sisira Jayasuriya, Bhanupong Nidhiprahba and other researchers associated with the study. Author is also thankful to the ACAIR for the valuable support.** Senior Fellow, RIS. Email: [email protected], [email protected]
The need to understand how food safety regulations imposed by the US, EU, Japan, and other developed countries affect India’s exports of the processed food to these markets is the main object of this paper. As there is only limited empirical data available in this field, we use primary data through a survey of firms engaged in the processed food exports from India. A preliminary analysis of this sample data is given in Mehta, Nambiar and

2
Arockiasamy (2005). While the preliminary investigations certainly point to the alleged obstructive role of the International Food Safety Standards (IFSS, sometimes know as SPS Agreements of the WTO), the evidence is not sufficient to give a precise quantitative estimate of the deterrent effects of the food safety regulations on India’s processed food exports. Similarly, we would also like to know how the information deficiencies of the firms about SPS affect their current performance, the link between IFSS compliance and export experience, foreign affiliation and size distribution of the firm. In what follows, we try to assess the precise nature of these links by testing the various hypotheses or where such testing is not feasible draw some inferences utilising the available data which would at least help to show the direction of causation. In the light of above mentioned objectives, we intend to test following three hypotheses:• Processedfoodexportsareimpededbytheleveloffoodsafetystandards
in importing countries.
• Effectofinter-countrydifferencesinfoodsafetystandardisdifferentonIndia’s processed food exports.
• CurrentperformanceandpotentialofIndia’sexportsareinfluencedbyfactors such as information deficiencies.
1. India’s Exports and International Food Safety StandardsIn this section, we test the hypothesis:Hypo : Processed food exports are impeded by the higher level of food
safety standards in importing countries as compared to international (Codex1) standards.
To test this hypothesis, we draw on the gravity model. In traditional trade models, differences in factor endowments are posited to explain differences in trade patterns of countries. However, factor endowments have often failed to explain the observed trade patterns. Logically, it leads one to wonder whether other important factors that may be at work have been ignored in thetraditionaltrademodels.Consequently,economistsbegantovisualizethe ‘gravity’ model, a model that was for a long time perceived as having no theoretical foundation till Anderson (1979) gave it a theoretical foundation to offer the best explanatory power. Drawing on Newton’s Law of Universal Gravitation from physics, these models postulate that trade flows between
3
any two countries are positively related to the size of their markets and inversely to the distance between them.2
Recent literature also suggests that the basic model can be expanded to increase its explanatory power by including a number of other variables that influence bilateral trade flows, such as land to capture the natural resources, population to capture economies of scale, etc. Winters and Soloaga (2001) observe that remoteness of a country measured by the average distance of the importer from its exporting partners weighted by exporters’ GDP share inworldGDPcancapturethetradegravity.SrinivasanandCononero(1993)used the gravity model to quantify the impact of tariff barriers on exports of some of the south Asian countries, including India.
Economists have over the past few years used gravity models to trace the impact of food safety standards and regulations on trade by regressing trade flows on a proxy for standards together with other factors that may affect trade flows. Swann (1996) regressed British imports, exports and net exports, and found that unilateral British standards have a positive effect on both, exports and imports. He concluded that shared standards between two trading countries tend to have little impact on imports but a positive effect on exports. Moenius (1999) found that unilateral standards tend to promote trade in manufacturing sectors, but hinder trade in non-manufacturing sectors such as agriculture. Otuski, Wilson and Sewadesh (2001) and Wilson and Otuski (2001) found that the restrictive European standards have a disruptive impact on trade.
In line with the above-cited studies, we utilize the gravity model to estimate the impact of food safety standards (FSS) on processed food exports from India. The four products identified for this purpose are: shrimps, egg powder, mango pulp and mushrooms. The adopted version of the gravity model considered for this study is:
X = f (GDPX, IMPM, POPX, POPM, DIS, SPS)
whereX represents the processed food export from IndiaGDPX is the GDP (Gross Domestic Product) of India

4
IMPM is Import of the importing countriesPOPX and POPM are the population in India and the importing country, respectively.DIS is the distanceSPS is an index of food safety standards (sanitary and phytosanitary measures), in importing countries.
Regression AnalysisIt is sometimes argued that the Food Safety Regulations (or SPS measures) imposed by developed countries do not work as impediments to processed food exports from India. It implies that the coefficient of SPS in the above mentioned model is not significant. The equation considered in this study, using three-dimensional statistics can be written as:
lEXPijt = α + β
l lGDP
t+β
2 lIMP
ijt+β
3 DIS
j+β
4 lPOPI
t+ β
5 lPOP
jt+ β
6 SPS
ijt + ∈
ijt (1)
where lEXP
ijt = log of exports from India of i-th food processed product, to j-th
importing country for t-th year
lGDPt
= log of GDPt of India in year t
lIMPijt
= log of imports of the i-th food product in j-th importing country, during t-th year
DISj = distance between India (I) and the importing country (j)
lPOPIt = log of population in India during year t
lPOPjt = log of population in j-th importing country during year t
SPSijt = value of SPS index of i-th food product in j-th importing country during year t
(higher the index value, higher the standard)
α = intercept
β1, β
2, β
3 , β
4 ,
β
5 , β
6 are coefficients of the explanatory variables
∈ represents the unexplained error term.
Equation (1) is a three-dimensional panel consisting of four sample product lines, seven countries and a four-year period from 2000 to 2003.
i = 1,..,4 = Poultry (Egg powder), Fisheries (Shrimp), Mushroom and Mango Pulp

5
j = 1,2,….,7 = US, Japan, Australia, France, Germany, the Netherlands, the UK
t = 2000, 2001, 2002, 2003.
The panel data demands that random term (∈) should capture the characteristics of different food products, different countries and time periods. Since the sample information for time period is small and the commodities belong to similar group (processed food), we presume
∈ijt = µ
j + e
ijt ….(2)
Finally the model given in equations (1) and (2) is estimated by: (i) Ordinary Least Squares (or OLS), (ii) Least squares with dummy variables (µ being fixed) or Fixed Effects Model, and (3) assuming µ as random i.e. Random Effects Model.
In the Random Effects Model, we have further assumed that
E (eijt) = 0, Var (µ
j) = σµ
2 , Var (eijt ) = σ
e2 andCov(e
ijt, µ
j) = 0 …..(3)
The Random Effects Model is estimated by the Flexible Generalised Least Squares (GLS). Two steps procedure is used for estimation. In the first step, the variance components (σµ
2 and σe2) are estimated by using
the residues from OLS. In the second step, the flexible GLS estimates are computed using estimated variances.
The Variables and the DataGDP
t is taken in US dollars; and this variable is included to capture the supply
potential from India. Population figures are taken from World Development Indicators. Import data of 7 importing countries, i.e. US, Japan, Australia, France, Germany, the Netherlands, and the UK, taken from the World Trade Atlas (WTA) captures the size of the markets in importing countries and is drawn for four-sample product lines defined at the 6-digit level of theHarmonizedSystem(HS)ofInternationalTradeClassification(ITC).India’sexportdata,reportedinmillionUSdollarsisdrawnfromCMIE,India

6
Trades.ConsideringthechangesintheHSClassification,matchingofthefour product lines was done at six digits HS trade classification (Table 1).
Table 1: Six-Digit HS Trade Classification Codes for Chosen Products
Commodity
HS 1996(used for trade
statistics sample years 2001 and
2002)
HS 2002(used for trade of sample year
2003 and 2004)
Mango pulp 081290 081290 extension
Poultry (Egg Powder)
040700 040700
040811 040811
040819 040819
040891 040891
040899 040899
Mushroom
060291 060290
070951070951
070959
071230071231
071239
200310200310
200390
Shrimp
030613 030613
030623 030623
160520 160520
Source: Mehta, Nambiar and Arockiasamy (2005).
The rationale behind considering the nautical distance between India and the processed food importing countries is that it can impede trade. Besides, nautical distance helps us to include the degree of spoilage/damage to exported good, country-wise. Thus, the nautical distances from Mumbai (India) to Osaka (Japan), Elizabeth (USA), Melbourne (Australia), Marseilles (France), Hamburg (Germany), Amsterdam (Netherlands), and Southampton (UK) are considered for this study, based on the data provided by the website www.distances.com.

7
The SPS variable is a weighted index constructed separately for each of the fourproductsandthesampledestinationcountries;andCodexstandardsforthe base year (2000) are taken as benchmarks. Note that this weighted index helps us to estimate the severity or stringency of the imposed standards on Indian processed food exports. More details on the indexing methodology for SPS index are given in Mehta, Nambiar and Arockiasamy (2005), and Jayasuriya, MacLaren and Mehta (2005).
India exports the above-mentioned four sample product lines to many countries. However, the basic purpose of this exercise is to investigate whether the SPS measures work as impediments to processed food exports. Developed countries are the ones, which have rather strict SPS measures. Among the developed countries, the major export markets for processed food products from India are the US, Japan, Australia, France, Germany, the Netherlands, and the UK. Thus, in order to analyse and quantify the impact of SPS measures on processed food exports from India, these seven countries are considered.
Results The estimation of regression equations (1) and (2) is carried out using 112 observations.3 To capture the specific characteristics of different importing countries, we obtained three sets of estimates:
1. ClassicalLeastSquaresRegression/OLSwithoutGroupDummyVariables: The intercept terms relating to individual specific countries and products are assumed to be equal. Thus, the equation can be written as Y
ijt = α
+ β′ X
ijt + ε
ijt. , and this model is estimated
by simple Ordinary Least Squares.2. Least Squares with Intercept Dummy Variable: The Fixed Effects
Model with individual specific intercept constant terms (for countries) is estimated by Ordinary Least Squares. It must be noted thatthemodelisformulatedwithaCgroupspecificconstanttermsand not the overall constant.
3. Random Effects: The Random Effect Model is estimated by feasible two step GLS.

8
After obtaining the estimates from the above-mentioned three types of models, the next step is to select the appropriate model. Therefore, the choice is between: (a) the OLS, (b) Fixed Effect and (c) Random Effect Models. Two tests were used for the selection of the appropriate model, namely: (a) the Lagrange Multiplier (LM) test, and (b) the Hausman’s test. The Lagrange Multiplier test statistic shows whether the Fixed Effects Model/RandomEffectsModelisbetterthantheClassicalRegressionModel/OLS. The Hausman Test helps to make the appropriate choice between the Random Effects Model vis-à-vis the Fixed Effects Model.
Table 2: Regression Results of India’s Process Food Export on SPS Index: Classical, Fixed Effect and Random Effect Models
lEXPijt = α + β
l lGDP
t+β
2 lIMP
ijt+β
3 DIS
j+β
4 lPOPI
t+ β
5 lPOP
jt+ β
6 SPS
ijt + ∈
ijt
Estimated Classical Model - OLSOther Estimated ParametersName of
VariablesEstimated Co-efficient t-Statistics
SPS -0.01089 3.28N = 112R2 = 0.30
LR Multiplier Test Statistics = 2.14Hausman Test Statistics = - 0.01
σµ
2 = 0.25 σ
e2 = 6.82
lIM 0.4367 4.04
lPOPI 23.4691 0.53
lPOP 0.4726 1.60
lGDPI -4.23 0.64
lDIS 1.91 1.25
Constant -398.75 0.52
Source: Authors’ estimates. The estimates of LM and Hausman tests show that Fixed Effects Model is better than the OLS at 10 per cent level of significance. But at the 5 per cent level of significance, it is not accepted. Hence, we have selected OLS model over FE/RE models.
The first set of results using the Lagrange Multiplier test revealed that theFixedEffectModel/RandomEffectsModelwasnotbetterthanClassicalRegressionModel (OLSwithout countrydummies).Thus, theClassicalRegression Model was chosen, and the results are presented in Table 2. As can be seen from the regression results in Table 2, the negative sign of the SPS coefficient indicates that the impact of SPS (in importing countries)

9
on processed food exports from India is negative with a very high degree of significance at the 1 per cent level. The positive impact of imports by developed countries on India’s export is shown by the coefficient of lIMP, i.e. (.4367), which is statistically significant at the 1 per cent level. Variable POPI is not significant. But population of developed countries (lPOP) is significant at 1 per cent level. Distance between countries does not seem to matter. One possible explanation for this is that, most countries considered (in sample) are equi-distant from India. Perhaps, this variable may have gained in importance if the countries chosen were both far and near India (i.e. a sample of countries from both developed and South Asia).
2. Inter-country Differences in FSS
This section tries to test the following hypothesis:
Hypo: Effect of inter-country differences in food safety standards is different on India’s processed food exports.After proving that food safety standards imposed by developed countries, in general, do impede processed food exports from India, the next step is to probe more deeply whether inter-country differences in food safety standards among sample countries have any significantly different negative effect on India’s processed food exports. To test this, we modify the equation (1) assuming that β
6 coefficient is different for different countries. In other words,
β6 is replaced by β
6j in equation (1). The estimated results are presented in
Table 3.
As Table 3 portrays, with country specific slope coefficients of the SPS index, the coefficients of all the countries are either negative or statistically insignificant. The negative co-efficients indicate the negative role-played by SPS on processed food exports from India. A closer look at the coefficient values reveals the impact of SPS standards in US, Japan and France is not statistically significant. The stringency of the SPS standards is much greater in the case of UK, Australia, the Netherlands and Germany. The F-statistic of regression equation signifies the overall rigour, and explains the meaningfulness of the coefficients.

10
Table 3: Regression Results of India’s Process Food Export on SPS Indices of Different Countries: Classical, Fixed Effect and
Random Effect Models
lEXPijt = α +
l lGDP
t+β
2 lIMP
ijt+β
3 DIS
j+β
4 lPOPI
t+ β
5 lPOP
jt+ ∑7
j β
6j SPS
ijt + ∈
ijt
Estimated Classical Model - OLS
Other Estimated ParametersName of Variables
Estimated Co-efficient
t-Statistics
lIM 0.4334 3.744
N = 112R2 = 0.33
LR Multiplier Test Statistics = 2.95Hausman Test Statistics = - 0.43
σµ2 = 75.92
σe2 = 6.07
lPOPI 24.0933 0.542
lPOP -0.3416 0.396
lGDPI -4.2392 0.643
lDIS 3.7824 0.87
SPS_US 0.00076199 0.031
SPS_JP -0.000108588 0.008
SPS_AU -0.016986871 2.071
SPS_FR -0.003173962 0.437
SPS_GR -0.006775802 2.053
SPS_NL -0.014785687 2.364
SPS_UK -0.01445648 2.974
Constant -413.4358019 0.543
Source: Authors’ estimates based on survey given in Mehta, Nambiar and Arockiasamy (2005).
3. Current Performance and PotentialIn this section, an attempt is made to test the following hypothesis:Hypo : There is an economically ‘recoverable’ gap between current
performance and potential of India’s export, which is influenced by factors such as information deficiencies (lack of transparency of standards, delays in notification, absence of established standards, etc.)

11
Sour
ce
of in
for-
mat
ion
Indu
stry
Ass
ocia
tions
Gov
t. A
genc
ies
Fore
ign
Buy
ers
Profits
Imp-
rove
dD
eclin
edSa
me
Tota
lIm
p-ro
ved
Dec
lined
Sam
eTo
tal
Imp-
rove
dD
eclin
edSa
me
Tota
l
US
A3
(17%
)14
(78%
)1
(6%
)18
7(2
5%)
18(6
4%)
3(1
1%)
2812
(63%
)6
(32%
)1
(5%
)19
Japa
n3
(21%
)11
(79%
)0
145
(26%
)13
(68%
)1
(5%
)19
4(2
9%)
9(6
4%)
1(7
%)
14
Aus
tral
ia0
00
00
00
00
1(1
00%
)0
1
Fra
nce
1 (1
7%)
5(8
3%)
06
2(2
2%)
7(7
8%)
09
1(1
7%)
5(8
3%)
06
Ger
man
y0
4(1
00%
)0
41
(11%
)7
(78%
)1
(11%
)9
05
(100
%)
05
U.K
.1
(14%
)5
(71%
)1
(14%
)7
2(2
0%)
6(6
0%)
2(2
0%)
101
(25%
)3
(75%
)0
4
Tota
l8
(16%
)39
(80%
)2
(4%
)49
17(2
3%)
51(6
8%)
7(9
%)
7518
(37%
)29
(59%
)2
(4%
)49
Tabl
e 4:
Ind
ian
Shri
mps
Exp
orti
ng U
nits
: So
urce
s of
Inf
orm
atio
n ab
out
FSS
and
the
Sta
tus
of P
rofit
200
1-02
Sour
ce: A
utho
rs’ e
stim
ates
bas
ed o
n su
rvey
giv
en in
Meh
ta, N
ambi
ar a
nd A
rock
iasa
my
(200
5).

12
This hypothesis could not be put to a regress test for lack of sufficient data. What we could put to test was only a part of it. Hence we re-formulate the hypothesis as:
Hypo : Currentperformanceandpotentialisinfluencedbyfactorssuch as information deficiencies and sources of information.
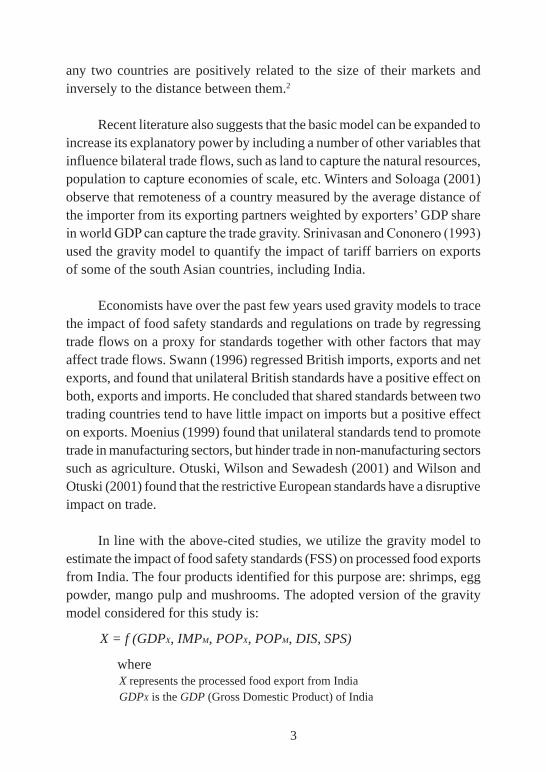
The prevailing perception arising from conventional wisdom is that if a greater degree of information4 is made available to Indian exporters with regard to Food Safety Standards (FSS) of importing countries it will lead to an increase in processed food exports from India, which in turn will result in greater profitability to the food processing units. A glance at the surveyed shrimp units with regard to sources of information on food safety standards indicate that a considerable amount of information is said to flow from the government agencies. Table 4 and Figure 1 highlight two important points:
Figure 1: Indian Shrimp Exporting Units: Source of Information about FSS and Profit Status: Indian Exporters’
Perception about the US Market
Source: Authors’ estimates based on survey given in Mehta, Nambiar and Arockiasamy (2005).
17%25%
63%
78%
64%
32%
6%11%
5%
0%10%20%30%40%50%60%70%80%90%
Indu
stry
Ass
ocia
tion
Gov
t.A
genc
y
Fore
ign
Buy
ers
Indu
stry
Ass
ocia
tion
Gov
t.A
genc
y
Fore
ign
Buy
ers
Indu
stry
Ass
ocia
tion
Gov
t.A
genc
y
Fore
ign
Buy
ers
I - Improved II - Declined III - Same
% F
irms

13
i Although a general dissatisfaction prevails among Indian exporters with regard to the role of government in export promotion, the surveyed units unanimously agree that the government is better in dissemination of information on food safety standards than their own industrial associations. From Table 4 it can be pointed out that in case of all destination countries the number of Indian shrimp exporting units that access information from government agencies is higher than the number of units getting information from either industrial associations or foreign buyers. For example, in case of the US market, 28 exporting units obtain information from government agencies, whereas this number is 18 and 19 in case of those getting information from industrial associations and foreign buyers, respectively.
ii As can be expected, the profit margins of the firms improve with qualitative information provided by foreign buyers. For an illustration, in case of the US market, as shown in Figure 1, the percentage of total exporting units whose profit has increased compared to the previous year is higher for the group of firms that obtain information from foreign buyers than that of the groups accessing information from either industrial associations or government agencies. Similarly, if we look at the percentage of firms that report a decline in their profit, it is the lowest for the group of firms that are getting information from the foreign buyers.
These observations imply curiously that even though the government provides the necessary information, this does not translate into an increase in the profit of the processed food-exporting firms. Therefore, it is not just information per se, but the quality of information that has a crucial impact on the profit of the firms. Thus, it can be said that the gap between the current performance and the potential can be bridged if the government provides more qualitative information similar to those provided by foreign buyers. In this context it may be meaningful to narrate the experience of one of the shrimp exporters. Foreign buyers provide the exporters not only the information on food safety standards but also the way to meet them, including the tips on how to beat the system such as information on more restrictive and less restrictive ports to get their goods across, etc.

14
Table 4 and Figure 1 paint a gloomy picture of a general trend of declining profit margin. However, in the case of the US market, with the access to information from foreign buyers about 63 per cent of the firms report an improvement in their profit compared with to previous year. Therefore, while the qualitative information provided by foreign buyers seems to translate into an improvement in the profit of firms that has not been the case with the vast information flowing from the government sources. It can only be concluded that in the absence of information, perhaps the drop in profit margin may have been greater. However, as Table 4 indicates, in spite of the information coming from different sources, the profit margin is reported to decline in general.
4. ImplicationsThe need to understand precisely how the stringent food regulations implemented by developed countries against imports affect India’s exports of processed food to these markets has been the main concern of this study. Towards that proximate goal, the preceding sections analysed the impact of SPS and other variables like population, geographical distance and total imports of destination countries of shrimps, mango pulp, egg powder and mushroom while using a gravity model. A striking observation from this exercise is that the SPS co-efficient has not only the negative sign but is also statistically significant. Some of the implications arising from this empirical evidence and also some other may now be drawn.
It is important to emphasis that the high food safety regulations unleashed by developed countries are a major impediment to India’s exports of processed food to these markets. The latter’s appetite for imports of processed food from India remain insatiated (implying that demand is not a constraint). But the main hurdle is neither the distance, nor the lack of demand; it is rather the high food safety regulations of these countries, which act as a roadblock. The lack of harmonisation of standards of sample countrieswithCodexstandardsdisruptsIndia’sexports.Onewaytohighlightthis trade hostility is to estimate the probable export loss to India because of lack of harmonisation of standards. The empirical procedure adopted for calculating this export loss is as follows. We calculate first an SPS elasticity

15
measure defined as the percentage change in exports due to a change in SPS standards,thelatteriscalculatedusingCodexstandardsasabenchmark(i.e.morethedeviationofacountry’sSPSindexfromtheCodexstandard,themore severe are that country’s food safety standards and vice versa). The year2003isconsideredformeasuringthedeviationsofSPSfromCodex.As a next step we apply this elasticity to the India’s exports of base year, to developed countries concerned. Our results show that export loss of India of processed food was 156 per cent from the present level of export.
It is also important to realise that processed food exports from India to these developed countries are disrupted not only by the high level of food safety standards of these countries but also by the differences in those standards across these countries. This is confirmed by regression results with coefficients (or elasticities) of SPS index separately for each country. The country specific SPS coefficients are negative confirming the negative role played by SPS on processed food exports from India. Among the sample countries the UK, Australia, the Netherlands and Germany operate a far more restrictive regime than France and Japan. Using these co-efficient we can estimate export loss to India due to difference in elasticities (based on co-efficients). The estimated results are presented in Table 5.
The elasticities reported here are the average elasticities and these average elasticities are found to vary from -1.5966 for the Germany to -2.7773 in the Netherlands. On the whole, elasticity values are relatively high for the Netherlands, Australia, Germany and UK and insignificant for USA, Japan and France.
The estimates of trade loss bring out the following points.1. The magnitude of export loss is much higher in the case of
Germany, UK and the Netherlands and much lower in case of Australia. It is due to relatively low level of India’s exports to Australia, in the base year. The total loss to these countries is more than 100 per cent from the present level. India has lost 18 per cent of its total exports due to inter-country differences in SPS measures.

16
Table 5: Export Loss to India from Higher SPS Standards
Product Average Elasticity
SPS Index 2003; Codex 2000 (=100)
Export Loss-% (w.r.t. to value of base year =2003)
Australia
Mushroom
-2.2889
246.759 136.1
Egg powder 103.552 7.8
Sub total 97.5
Germany
Mango pulp
-1.5966
113.792 19.4
Mushroom 355.935 114.8
Sub total 113.8
Netherlands
Mango pulp
-2.7773
113.792 33.7
Mushroom 359.732 200.5
Egg powder 103.182 8.5
Sub total 70.3
UK
Mango pulp
-1.8375
170.042 75.7
Mushroom 367.241 113.7
Sub total 130.8
Source: Authors’ estimates based on survey given in Mehta, Nambiar and Arockiasamy (2005).* We have not given results of three countries: US, Japan and France because SPS co-efficient is insignificant
There are clear indications that foreign buyers provide better information about food safety standards in their respective countries than our government departments and industry associations. The responses from the surveyed units indicate that wherever the information source for exporters is foreign buyers, the improvement in profitability is relatively high. On the

17
contrary, the information provided by either the government departments or industry associations does not necessarily translate into an improvement in profitability. The implication, of course, is that there should be greater and deeper involvement of both the government and industry associations in the export activities of processed food.
5. Select Concluding ObservationsThis study sought to understand more precisely how the food safety regulations applied by the industrialised countries affect India’s exports of processed food to these markets (i.e. the relationship between India’s exports to these markets and the prevailing FSS regulations in these countries). At the end of this paper, we summarise our main findings. Several points seem worth making.
• Very stringent food safety regulations currently prevailing in developed countries do tend to restrict India’s exports of processed food to these countries. This is evident from the estimates of the Gravity model utilised here to capture the impact of SPS along with other variables such as population, import and geographical distances. In the estimates, the coefficient of SPS has not only the expected negative sign but is also found statistically significant. The message is that the main hurdle for India’s exports of processed food to these markets is neither the lack of demand nor the geographical distance, but it is the stringent food safety regulations prevailing in these countries.
• Inter-country differences in food safety standards also have a strong negative impact on India’s processed food exports – in the regression estimates with country specific SPS index, the coefficients of all countries are negative except one. The advantage with this country-wise estimate is that one can judge from a careful look at the values of these coefficients which of the countries from the sample group are harsher to India in terms of the stringency of food regulations. Thus, UK, Australia, the Netherlands and Germany are found to be harsher to India in terms of increase in restrictiveness of food safety regulations than say France, USA

18
and Japan. To highlight the probable impact of these inter-country differences in food safety regulations, we estimated the potential export loss to India because of differences in standards.
• It was striking to note that India stood to loose around 156 per cent of the actual export of processed food to developed countries. A portion of this loss is due to inter-country differences in standards. Alternatively, India would have gained 19 per cent more than the actual if the increase in standards was same among all countries. CountrydifferencesinSPSmeasuresalsotendtodiminishthecompetitive advantages and weaken the ability of small firms to maintain their profitability.
• There is a tendency for the firms to be in general, better off in terms of profitability wherever the source of information is ‘foreign buyer’. On the contrary, firms, which depended on information supplied either by government departments or industry associations, are seen to have ended with lower profitability. This proves that foreign buyers provide better information about the prevailing food safety regulations and how to meet those obligations than the guidance received either from government departments or industry associations.
Endnotes1 FordetailsofinternationalstandardssetupbyCodex,seeMehtaandGeorge(2005),among
others2 The basic gravity model, originally proposed by Tinbergen (1962) and developed by Peyhonen
(1963) and Linneman (1966), considers two determinants: (1) the size of trading countries, expressed in terms of GDP and per capita GDP, and (2) trade costs in terms of geographical distance between them. GDP and per capita GDP are considered because (a) the size of export-ing country captures the exporters’ supply capacity, and (b) the size of the importing country captures the importer’s demand capacity. The trade costs involve trade frictions, which arise owing to geographical distance, cultural differences, etc. It is assumed that the greater the geographical distance between countries, the higher will be the transport costs and increased difference in preferences.
3 Total number of observations (4 x 4 x 7 = 112) is based on 4 year’s trade statistics, 4 com-modities and 7 countries.
4 Level of food safety standards in importing countries. In this context it should be noted that level of FSS change over time.

19
ReferencesAnderson, J.E. 1979. “A Theoretical Foundation for the Gravity Equation”. American
Economic Review 69, pp. 106-16.
Linneman, H. 1966. An Econometric Study of International Trade Flows. North Holland, Amsterdam.
Mehta, R. and S.K. Bhattacharya. 2000. “South Asian Preferential Trading Arrangement: Impact on Intra-regional Trade”. Asia Pacific Journal of Economics and Business. June Vol.4, No. 1, pp. 92-111.
Mehta, R. and J. George. 2005. Food Safety Regulation Concerns and Trade: The Developing Country Perspective. New Delhi: Macmillan Publisher.
Mehta R., R.G. Nambiar and R. Arockiasamy. 2005. Food Safety Standards and Indian Food Exports. Report presented at workshop on International Food Safety Regulations andProcessedFoodExports:AComparative Study of India andThailand. RIS, New Delhi.
Moenius, J. 1999. Information versus Product Adaptation: The Role of Standards in Trade. North Western University, Kellogg Graduate School of Management.
Otuski,T.,J.S.WilsonandM.Sewadesh.2001.SavingTwoinaBillion:ACaseStudytoQuantify the Trade Effect of European Food Safety Standards on African Exports. Development Research Group, The World Bank.
Jayasuriya, S., D. MacLaren and R. Mehta. 2005. Meeting Food Safety Standards in ExportMarkets:IssuesandChallengesFacingFirmsExportingfromDevelopingCountries.PaperpresentedattheIATRCSummerSymposium,FoodRegulationandTrade:InstitutionalFramework,ConceptsofAnalysisandEmpiricalEvidence,Bonn. Germany. 28-30 May.
Poyhonen,P.1963.“TentativeModelfortheFlowsoftradebetweenCountries”.Welwirts Chatftliches Archive. ac (1).
Srinivasan,T.N.andG.Canonero.1993.PreferentialTradeArrangements:EstimatingtheEffectsofSouthAsianCountries.WorldBank.Memo.
Swann, D. 1996. European Economic Integration: The Common Market, European Union and Beyond. USA: Edward Elgar Publishing.
Tinbergen, J.S. 1962. Shaping the World Economy: Suggestions for an International Economic Policy.NewYork:TheTwentiethCenturyFund.
Wilson, J.S. and T. Otuski. 2001. Global Trade and Food Safety: Winners and Losers in aFragmentedSystem.ResearchPapers,WorldBankWashington,D.C.
Winters, A. and I. Saloaga. 2001. “Regionalism in the Nineties: What Effect on Trade?”. North American Journal of Economics and Finance, 12, pp.1-29.

20
RIS Discussion PapersAvailable at http://www.ris.org.in/risdiscussion_papers.html
DP#168-2010 Technological Change and New Actors: Debate on Returns and Regulations by Sachin Chaturvedi
DP#167-2010 The Food-Feed-Fuel Triangle: Implications of Corn-based Ethanol for Grain-Use Competition by Arindam Banerjee
DP#166-2010 Global Financial Crisis: Implications for Trade and Industrial Restructuring in India byPrabirDeandChiranjibNeogiDP#165-2010 Are Trade Openness and Financial Development Complementary? by Ram Upendra Das and Meenakshi RishiDP#164-2010 Does Governance Matter for Enhancing Trade?: Empirical
Evidence from Asia by Prabir DeDP#163-2010 Rules of Origin under Regional Trade Agreements by Ram
Upendra DasDP#162-2010 Geographical Indications at the WTO: An Unfinished Agenda
by Kasturi DasDP#161-2010 Revision of India Nepal Treaty of Trade and its Implications
for Strengthening Bilateral Trade and Investment Linkages by Indra Nath Mukherji
DP#160-2009 Regional Cooperation for Regional Infrastructure Development: Challenges and Policy Options for South Asia by Prabir De
DP#159-2009 India’s Trade in Drugs and Pharmaceuticals: Emerging Trends, Opportunities and Challenges by Reji K Joseph
DP#158-2009 On Managing Risks Facing the Indian Economy: Towards a Better Balance between Public and Private Sectors by Ramgopal Agarwala
DP#157-2009 Regional Economic Integration in South Asia: Prospects and Challenges by Ram Upendra Das
DP#156-2009 The European Union’s Proposed Carbon Equalization System: Can it be WTO Compatible? by Biswajit Dhar and Kasturi Das
DP#155-2009 Addressing the Defaults of Globalization by Prof. Jan PronkDP#154-2009 Trade Facilitation, Information Technology and SMEs:
Emerging Evidences from IndiabySachinChaturvediDP#153-2009 Climate Change, Technology Transfer and Intellectual
Property Rights by K. Ravi Srinivas