Embed Size (px)
Citation preview

step forward →
RHODE ISLAND HOUSING AND MORTGAGE FINANCE CORPORATION (A COMPONENT UNIT OF THE STATE OF RHODE ISLAND)
FINANCIAL STATEMENTS AND SUPPLEMENTARY INFORMATION JUNE 30, 2019 AND 2018

RHODE ISLAND HOUSING AND MORTGAGE FINANCE CORPORATION TABLE OF CONTENTS JUNE 30, 2019 AND 2018
Independent Auditors’ Report 1-3 Management’s Discussion and Analysis 4-9 Basic Financial Statements: Combining Statements of Net Position 10-11 Combining Statements of Revenues, Expenses and Changes in Net Position 12-13 Combining Statements of Cash Flows 14-17 Statements of Fiduciary Net Position - Private Purpose Trust Component Unit 18 Statements of Changes in Fiduciary Net Position - Private Purpose Trust Component Unit 19 Notes to the Financial Statements 20-51 Required Supplementary Information: Schedule of Changes in Total OPEB Liability and Related Ratios 52 Supplementary Schedules: Combining Statements of Net Position - Single-Family Fund 53-54 Combining Statements of Revenues, Expenses and Changes in Net Position - Single-Family Fund 55-56 Combining Statements of Net Position - Multi-Family Fund 57-59 Combining Statements of Revenues, Expenses and Changes in Net Position - Multi-Family Fund 60-62

1
Independent Auditors’ Report
To the Board of Commissioners Rhode Island Housing and Mortgage Finance Corporation Providence, Rhode Island
Report on the Financial Statements
We have audited the accompanying financial statements of the business-type activities and the discretely presented component unit of Rhode Island Housing and Mortgage Finance Corporation (Rhode Island Housing), a component unit of the State of Rhode Island, as of and for the years ended June 30, 2019 and 2018, and the related notes to the financial statements, which collectively comprise Rhode Island Housing’s basic financial statements as listed in the table of contents.
Management’s Responsibility for the Financial Statements
Management is responsible for the preparation and fair presentation of these financial statements in accordance with accounting principles generally accepted in the United States of America; this includes the design, implementation and maintenance of internal control relevant to the preparation and fair presentation of financial statements that are free from material misstatement, whether due to fraud or error.
Auditors’ Responsibility
Our responsibility is to express opinions on these financial statements based on our audits. We conducted our audits in accordance with auditing standards generally accepted in the United States of America and the standards applicable to financial audits contained in Government Auditing Standards, issued by the Comptroller General of the United States. Those standards require that we plan and perform the audit to obtain reasonable assurance about whether the financial statements are free of material misstatement.
An audit involves performing procedures to obtain audit evidence about the amounts and disclosures in the financial statements. The procedures selected depend on the auditors’ judgment, including the assessment of the risks of material misstatement of the financial statements, whether due to fraud or error. In making those risk assessments, the auditors consider internal control relevant to the entity’s preparation and fair presentation of the financial statements in order to design audit procedures that are appropriate in the circumstances, but not for the purpose of expressing an opinion on the effectiveness of the entity’s internal control. Accordingly, we express no such opinion. An audit also includes evaluating the appropriateness of accounting policies used and the reasonableness of significant accounting estimates made by management, as well as evaluating the overall presentation of the financial statements.
We believe that the audit evidence we have obtained is sufficient and appropriate to provide a basis for our audit opinions.

2
Opinions
In our opinion, the financial statements referred to above present fairly, in all material respects, the respective financial position of the business-type activities and discretely presented component unit of Rhode Island Housing as of June 30, 2019 and 2018, and the respective changes in financial position and, where applicable, cash flows thereof, for the years then ended in accordance with accounting principles generally accepted in the United States of America.
Change in Accounting Principle As discussed in Note 12 to the financial statements, during the fiscal year ended June 30, 2018, Rhode Island Housing and Mortgage Finance Corporation adopted new accounting guidance, GASB Statement No. 75, Accounting and Financial Reporting for Postemployment Benefits Other Than Pensions. Due to the adoption of this guidance, Rhode Island Housing and Mortgage Finance Corporation restated its 2017 financial statements, resulting in a restatement of June 30, 2017 net position to recognize the OPEB liability required in implementing GASB No. 75. Our opinion is not modified with respect to this matter. Other Matters
Required Supplementary Information
Accounting principles generally accepted in the United States of America require that the management’s discussion and analysis and the OPEB schedule, as listed in the table of contents, be presented to supplement the basic financial statements. Such information, although not a part of the basic financial statements, is required by the Governmental Accounting Standards Board, which considers it to be an essential part of financial reporting for placing the basic financial statements in an appropriate operational, economic or historical context. We have applied certain limited procedures to the required supplementary information in accordance with auditing standards generally accepted in the United States of America, which consisted of inquiries of management about the methods of preparing the information and comparing the information for consistency with management’s responses to our inquiries, the basic financial statements and other knowledge we obtained during our audit of the basic financial statements. We do not express an opinion or provide any assurance on the information because the limited procedures do not provide us with sufficient evidence to express an opinion or provide any assurance.
Other Information
Our audits were conducted for the purpose of forming opinions on the financial statements that collectively comprise the Rhode Island Housing’s basic financial statements. The combining information on pages 53 through 62 is presented for purposes of additional analysis and is not a required part of the basic financial statements.
The accompanying supplementary information is the responsibility of management and was derived from and relates directly to the underlying accounting and other records used to prepare the basic financial statements. Such information has been subjected to the auditing procedures applied in the audits of the basic financial statements and certain additional procedures, including comparing and reconciling such information directly to the underlying accounting and other records used to prepare the basic financial statements or to the basic financial statements themselves, and other additional procedures in accordance with auditing standards generally accepted in the United States of America. In our opinion, the accompanying supplementary information is fairly stated in all material respects in relation to the basic financial statements as a whole.

3
Other Reporting Required by Government Auditing Standards
In accordance with Government Auditing Standards, we have also issued our report dated September 27, 2019 on our consideration of the Rhode Island Housing’s internal control over financial reporting and on our tests of its compliance with certain provisions of laws, regulations, contracts and grant agreements and other matters. The purpose of that report is solely to describe the scope of our testing of internal control over financial reporting and compliance and the results of that testing, and not to provide an opinion on the effectiveness of Rhode Island Housing’s internal control over financial reporting or on compliance. That report is an integral part of an audit performed in accordance with Government Auditing Standards in considering the Rhode Island Housing’s internal control over financial reporting and compliance.
Cranston, Rhode Island September 27, 2019

4
RHODE ISLAND HOUSING AND MORTGAGE FINANCE CORPORATION (A COMPONENT UNIT OF THE STATE OF RHODE ISLAND)
MANAGEMENT’S DISCUSSION AND ANALYSIS FOR THE YEARS ENDED JUNE 30, 2019 AND 2018
The accompanying basic financial statements include Rhode Island Housing and Mortgage Finance Corporation (the Corporation) and Affordable Housing Trust Fund (the Trust, a component unit of the Corporation), collectively referred to as Rhode Island Housing.
This section of Rhode Island Housing’s financial statements presents Rhode Island Housing’s management’s discussion and analysis of the Corporation’s financial position and performance as of June 30, 2019 and 2018, and for the years then ended. This discussion and analysis is intended to serve as an introduction to the Corporation’s basic financial statements. The Corporation’s basic financial statements, accompanying notes, and supplementary information should be read in conjunction with the following discussion.
Financial Highlights The financial highlights (in millions) of the Corporation as of and for the years ended June 30, 2019 and 2018, increased (decreased) from the previous year as follows:
2019 2018 $ % $ % Mortgage loans, gross (62.0) (3.8) 23.6 1.4 Investments 97.8 53.0 4.2 2.3 Cash and cash equivalents 91.0 40.3 (30.6) (11.9) Total assets 126.3 6.1 (5.3) (0.3) Bonds and notes payable 105.9 8.2 (38.6) (2.9) Total net position 9.2 2.8 13.0 4.2 Total revenues 4.8 4.0 7.0 6.2 Total expenses 9.5 8.9 4.3 4.2 Operating income (4.7) (33.7) 2.7 24.2
Mortgage loans represent the largest category of the Corporation’s total assets, 72.7% and 80.2% at June 30, 2019 and 2018, respectively. The decrease is driven by Single-family loans and results from a combination of prepayments of existing loans and new production which is securitized and categorized as in investment.
Bonds and notes payable represent the largest component of liabilities, 75.8% and 74.7% at June 30, 2019 and 2018, respectively. The increased in Bonds and notes payable is the result of issuing two Single Family Bonds in 2019.
Overview of the Financial Statements The Corporation engages only in business-type activities; that is, activities that are financed in whole or in part by charges to external parties for services, with funding sources that are primarily external to the Corporation. As a result, the Corporation’s basic financial statements include the statement of net position, the statement of revenues, expenses and changes in net position, the statement of cash flows, and the notes to the financial statements. These basic financial statements are designed to provide readers with a broad overview of the Corporation’s finances, in a manner like a private-sector business.

5
The statement of net position presents information on the Corporation’s assets, liabilities, deferred inflows and outflows of resources, and net position. Over time, increases or decreases in the Corporation’s net position may serve as an indicator of whether the financial position of the Corporation is improving or deteriorating. Other factors, both internal and external to the Corporation, should be considered when evaluating the Corporation’s financial position. The statement of revenues, expenses and changes in net position presents information on how the Corporation’s net position changed during the year.
All assets, liabilities, deferred inflows and outflows of resources, and changes in net position are reported using the accrual basis of accounting for governmental entities and are reported as soon as the underlying event giving rise to the asset or liability and resulting change in net position occurs, regardless of the timing of when a corresponding amount of cash is received or paid. Consequently, certain revenues and expenses reported in the statement of revenues, expenses and changes in net position will result in cash flows in future periods.
The Affordable Housing Trust Fund (the “Trust”) is a separate legal entity created pursuant to a trust agreement initiated by the Corporation. The Trust is a private-purpose trust established to assist in activities that involve the creation and preservation of affordable housing in the State. All resources of the Trust, including income on investments and other revenues, are held in trust for the benefit of private and not-for-profit organizations. There is no requirement that any portion of the Trust’s resources be preserved as capital. The Trust administers its affairs through its trustees, records its assets in segregated accounts and maintains financial records separate from the Corporation.
Operating Activity of the Corporation
The following tables summarize the components of operating income, before the adjustment required to record investments at fair value as required by Governmental Accounting Standards Board (GASB) Statement No. 31:
For the Years Ended June 30, 2019 and 2018 (in thousands)
2019 2018 % Change Revenues:
Interest income on loans $ 71,792 $ 71,727 0.1% Earnings on investments 8,396 5,094 64.8 Gain on sale of loans 10,823 21,823 (50.4) Grant revenue 14,966 9,890 51.3
Other 13,919 15,041 (7.5) Total revenues 119,896 123,575 (3.0)
Expenses: Interest expense 43,977 39,952 10.1 Provision for loan losses 3,380 6,032 (44.0) REO expenditures 343 (522) (165.6)Bond issuance costs 1,646 36 4606.2 Operating expenses 35,328 34,497 2.4 Grant expense 15,524 8,954 73.4 Other expenses 16,635 18,382 (9.7)
Total expenses 116,833 107,331 8.9
Operating Income, Before Adjusting Investments to Fair Value $ 3,062 $ 16,244 (81.1)%

6
For the Years Ended June 30, 2018 and 2017 (in thousands)
2018 2017
(as Restated)
% Change Revenues: Interest income on loans $ 71,727 $ 69,861 2.7% Earnings on investments 5,094 5,749 (11.4) Gain on sale of loans 21,823 11,367 92.0 Grant revenue 9,890 17,438 (43.3) Other 15,041 12,983 15.9 Total revenues 123,575 117,398 5.3 Expenses: Interest expense 39,952 40,756 (2.0) Provision for loan losses 6,032 368 1,538.8 REO expenditures (522) 2,741 (119.0) Bond issuance costs 36 1,634 (97.8) Operating expenses 34,497 30,196 14.2 Grant expense 8,954 16,511 (45.8) Other 18,382 10,821 69.9 Total expenses 107,331 103,027 4.2 Operating Income, Before Adjusting Investments to Fair Value $ 16,244 $ 14,371 13.0%
Operating income, after adjusting investments to fair value, was $9.2 million for the year ended June 30, 2019 and $13.9 million for the year ended June 30, 2018 and $11.2 million for the year ended June 30, 2017. GASB Statement No. 31, which requires investments to be recorded at fair value, caused an increase in operating income of $6.2 million in 2019 compared to a decrease in operating income of $2.3 million in 2018 and a decrease of $3.1 million in 2017. Operating income, excluding the unrealized gains and losses on investments, decreased 81.1% in 2019 to $3.1 million from $16.2 million in 2018 which had increased from $14.4 million in 2017. The 2019 decrease is primarily due to the decrease in gain on sale of loans.
Gain on sale of loans was $10.8 million for the year ended June 30, 2019, $21.8 million for the year ended June 30, 2018 and $11.4 million for the year ended June 30, 2017. The 2019 decrease is a result of a change in financing strategy to take advantage of changing market conditions. In prior years loans were sold to Fannie Mae or securitized pools of loans were sold in the To-Be-Announced market which generated immediate revenue. In 2019 loans were primarily financed through tax-exempt bonds, securitized and held as investments providing stable revenue over the life of the loans.
Other revenue, which decreased in the current year, consists of loan-related fees such as origination and late fees, and fees received for the management and disbursement of funds for federal housing programs.
Operating expenses of the Corporation (personnel services, other administrative expenses, and depreciation and amortization of other assets) amounted to $35.3 million for the year ended June 30, 2019, an increase of 2.4% from $34.5 million for the year ended June 30, 2018, which had increased from $30.2 million for the year ended June 30, 2017.
Real Estate Owned (REO) expenditures are maintenance type costs incurred related to REO properties. Based on a valuation analysis of the underlying properties, the costs are deemed to be non-recoverable. REO expenses were $.3 million, $(.5) million and $2.7 million respectively for the years ended June 30, 2019, 2018 and 2017.

7
Net interest income (interest on loans and investments less interest expense) is the largest component of the Corporation’s operating income. Net interest income decreased to $36.2 million from $36.9 million in 2018 an increase from $34.9 million in 2017. Earnings on investments increased $3.3 million from 2018 to 2019 after a decrease of $.6 million from 2017 to 2018. Net interest income as a percentage of average bonds and notes payable was 2.68% in 2019 and 2.80% in 2018, respectively. Interest income on loans as a percentage of total loans was 4.43% in 2019 and 4.38% in 2018, while interest expense on bonds and notes was 3.25% in 2019 and 3.03% in 2018. This caused a total decrease in the spread margin (i.e., differential between loans and bonds) to 1.18% in 2019 from 1.35% in 2018.
The Corporation’s revenue recognition policy for delinquent loans requires that interest will stop accruing and any accrued interest will be reversed if any loan becomes ninety days past due on the contractual obligation. The Corporation will commence accruing interest income on such loans once the loans are made current.
The provision for loan loss included in the Combining Statements of Revenues, Expenses and Changes in Net Position was $3.4 million in 2019 and $6.0 million in 2018. The adequacy of the allowance is based on a review of the Corporation’s loan portfolio and an analysis of its current characteristics. The primary economic factors incorporated into the allowance estimates are: (1) recent performance characteristics of the single-family portfolio and (2) net operating cash flows of the developments associated with multi-family loans.
For single-family loans, an estimate of loss reserve is based on the last instance of economic softness and real estate depreciation. For the multi-family portfolios, a specific loan loss reserve analysis is performed for every loan demonstrating signs of financial strain. Cash flow projections are developed from the most recent audited financials for each of the sites which may be experiencing difficulty, and which have a mortgage loan. For each of these sites, an analysis of value is calculated and compared to the loan balance. This methodology is the same as that used in the formulation of the income approach found in standard real estate appraisals. Beyond the specific reserves derived above, a general reserve is also established. The general reserve is based on a range of reserve percentages applicable to each loan portfolio.
The State of Rhode Island requested Rhode Island Housing provide financial assistance to the State for its general use. During the year ended June 30, 2018 the Corporation recognized a one-time expense for this transfer to the State in the amount of $1,000,000.

8
Financial Analysis of the Corporation
The following tables summarize certain financial information regarding the Corporation’s financial position:
June 30, 2019 and 2018 (in thousands)
2019 2018 % Change
Loans receivable, net $ 1,547,068 $ 1,611,277 (4.0)% Investments 282,258 184,501 53.0 Cash and cash equivalents 316,624 225,628 40.3 Other assets 38,972 37,265 4.6
Total assets 2,184,922 2,058,671 6.1
Deferred outflows of resources 1,245 4,279 (70.8)
Bonds and notes payable 1,403,850 1,297,944 8.2 Other liabilities 447,603 439,537 1.8
Total liabilities 1,851,453 1,737,481 6.6
Deferred inflows of resources 686 687 (0.2)
Net position: Net investment in capital assets 8,909 9,337 (4.6) Restricted 238,611 221,535 7.7 Unrestricted 86,511 93,909 (7.9)
June 30, 2018 and 2017 (in thousands)
2018 2017 (as
Restated) % Change
Loans receivable, net $ 1,611,277 $ 1,591,992 1.2% Investments 184,501 180,338 2.3 Cash and cash equivalents 225,628 256,196 (11.9) Other assets 37,265 35,430 5.2
Total assets 2,058,671 2,063,956 (0.3)
Deferred outflows of resources 4,279 2,800 0.0
Bonds and notes payable 1,297,944 1,336,538 (2.9) Other liabilities 439,537 418,388 5.1
Total liabilities 1,737,481 1,754,926 (1.0)
Deferred inflows of resources 687
Net position: Net investment in capital assets 9,337 9,298 0.4 Restricted 221,535 203,995 8.6
Unrestricted 93,909 98,537 (4.7)

9
Total assets of the Corporation increased 6.1% from 2018 to 2019, as compared to a 0.3% decrease from 2017 to 2018. Net loans receivable decreased $64 million, or 4.0%, from the previous year. This decrease in loans is attributable to pooling of Single-Family loans into securities which are classified as investments in the Combining Statements of Net Position. Bonds and notes payable increased by $105.9 million, or 8.2%, from 2018, as compared to a decreased of $38.6 million or 2.9% from 2017.
During 2019, the Corporation issued $228 million of single-family bonds, and $14 million of multi-family bonds to finance new loan production. In addition, $84.7 million of single-family bonds and $17.6 million of multi-family bonds were redeemed prior to maturity under provisions in the bond resolutions that allow mortgage prepayments, excess revenues and refunded amounts to be used for such purpose.
As of June 30, 2019, and 2018, the net position-to-asset ratio was 15.3% and 15.8% while the loan-to-asset ratio was 70.8% and 78.3%, respectively. These ratios reflect the application of GASB Statement No. 31.
External Influences
Both the economy and the level of unemployment in the State of Rhode Island have a direct impact on the Corporation’s delinquency experience within its portfolio. The Rhode Island unemployment rate decreased in 2019 to 3.6% from 4.3% in 2018. The Corporation has, however, experienced an increase in its 90+ delinquency rate to 2.08% in 2019 from 1.94% in 2018. This small variance is not unusual given the vulnerability of our customer base as first-time homeowners.
Requests for Information
This management’s discussion and analysis is designed to provide a general overview of the Corporation’s finances. Questions concerning this report may be addressed to the Director of Accounting, Rhode Island Housing and Mortgage Finance Corporation, 44 Washington Street, Providence, Rhode Island, 02903. The Corporation maintains a website at: www.rihousing.com.

RHODE ISLAND HOUSING AND MORTGAGE FINANCE CORPORATION(A COMPONENT UNIT OF THE STATE OF RHODE ISLAND)COMBINING STATEMENTS OF NET POSITIONJUNE 30, 2019 AND 2018
2019 2018 2019 2018
Assets:Loans receivable $ 530,919,418 $ 475,943,895 $ 571,634,309 $ 622,033,229 Less allowance for loan losses (32,000,000) (30,000,000) (10,000,000) (9,800,000)
Loans receivable, net 498,919,418 445,943,895 561,634,309 612,233,229
Loans held for sale 29,547,594 44,753,143 Investments 101,959,959 100,660,853 177,384,095 74,871,601 Accrued interest-loans 1,135,118 1,071,065 2,010,201 2,186,093 Accrued interest-investments 17,981 19,962 568,905 265,007 Cash and cash equivalents 113,208,275 108,521,810 136,989,379 65,230,221 Accounts receivable, net 11,319,014 10,692,951 Other assets, net 18,650,512 16,840,544 3,029,558 3,693,888 Interfund receivable (payable) (3,750) (13,097) (372,025) 18,597
Total assets 774,754,121 728,491,126 881,244,422 758,498,636
Deferred Outflows of Resources:Loan origination costs 4,241 4,497 Hedging instruments 1,104,116 4,179,353 Deferred OPEB outflows 139,263 94,763
Total deferred outflows of resources 1,243,379 4,274,116 4,241 4,497
Combined Assets and Deferred Outflows
of Resources $ 775,997,500 $ 732,765,242 $ 881,248,663 $ 758,503,133
Liabilities and Net Position:
Liabilities:Bonds and notes payable $ 245,710,397 $ 210,103,985 $ 716,656,509 $ 606,627,160 Accrued interest payable on bonds and notes 193,919 103,617 7,499,893 5,004,890 Accounts payable and accrued liabilities 11,594,082 10,010,150 Fees, net 1,097,948 1,303,742 133,118 149,735 Escrow deposits 419,066,103 402,912,048
Total liabilities 677,662,449 624,433,542 724,289,520 611,781,785
Deferred Inflows of Resources:Deferred OPEB Inflow 685,684 686,835
Net Position:Net investment in capital assets 8,909,023 9,337,163 Restricted by bond resolutions 2,229,025 4,398,681 156,959,143 146,721,348 Unrestricted 86,511,319 93,909,021
Total net position 97,649,367 107,644,865 156,959,143 146,721,348
Total Liabilities and Net Position $ 775,997,500 $ 732,765,242 $ 881,248,663 $ 758,503,133
Operating Fund Single-Family Fund
The accompanying notes are an integral part of the financial statements
10

RHODE ISLAND HOUSING AND MORTGAGE FINANCE CORPORATION(A COMPONENT UNIT OF THE STATE OF RHODE ISLAND)COMBINING STATEMENTS OF NET POSITIONJUNE 30, 2019 AND 2018
2019 2018 2019 2018
Assets:Loans receivable $ 456,966,992 $ 508,346,370 $ 1,559,520,719 $ 1,606,323,494 Less allowance for loan losses (42,000,000) (39,800,000)
Loans receivable, net 456,966,992 508,346,370 1,517,520,719 1,566,523,494
Loans held for sale 29,547,594 44,753,143 Investments 2,913,824 8,968,161 282,257,878 184,500,615 Accrued interest-loans 2,225,294 2,455,414 5,370,613 5,712,572 Accrued interest-investments 14,880 41,443 601,766 326,412 Cash and cash equivalents 66,426,198 51,875,806 316,623,852 225,627,837 Accounts receivable, net 11,319,014 10,692,951 Other assets, net 21,680,070 20,534,432 Interfund receivable (payable) 375,775 (5,500) - -
Total assets 528,922,963 571,681,694 2,184,921,506 2,058,671,456
Deferred Outflows of Resources:Loan origination costs 4,241 4,497 Hedging instruments 1,104,116 4,179,353 Deferred OPEB outflows 139,263 94,763
Total deferred outflows of resources - - 1,247,620 4,278,613
Combined Assets and Deferred Outflows of Resources $ 528,922,963 $ 571,681,694 $ 2,186,169,126 $ 2,062,950,069
Liabilities and Net Position
Liabilities:Bonds and notes payable $ 441,483,052 $ 481,212,979 $ 1,403,849,958 $ 1,297,944,124 Accrued interest payable on bonds and notes 2,733,595 3,297,434 10,427,407 8,405,941 Accounts payable and accrued liabilities 88,438 75,926 11,682,520 10,086,076 Fees, net 1,231,066 1,453,477 Escrow deposits 5,195,653 16,679,950 424,261,756 419,591,998
Total liabilities 449,500,738 501,266,289 1,851,452,707 1,737,481,616
Deferred Inflows of Resources:Deferred OPEB Inflow 685,684 686,835
Net Position:Net investment in capital assets 8,909,023 9,337,163 Restricted by bond resolutions 79,422,225 70,415,405 238,610,393 221,535,434 Unrestricted 86,511,319 93,909,021
Total net position 79,422,225 70,415,405 334,030,735 324,781,618
Total Liabilities and Net Position $ 528,922,963 $ 571,681,694 $ 2,186,169,126 $ 2,062,950,069
Multi-Family Fund Total
The accompanying notes are an integral part of the financial statements
11

RHODE ISLAND HOUSING AND MORTGAGE FINANCE CORPORATION
(A COMPONENT UNIT OF THE STATE OF RHODE ISLAND)
COMBINING STATEMENTS OF REVENUES, EXPENSES AND CHANGES IN NET POSITION
FOR THE YEARS ENDED JUNE 30, 2019 AND 2018
2019 2018 2019 2018
Operating Revenues:
Interest Income on loans $ 12,118,036 $ 11,278,911 $ 26,171,469 $ 28,674,185
Interest income attributable to internal servicing activities 5,861,338 4,668,492
Total interest income on loans 17,979,374 15,947,403 26,171,469 28,674,185
Income on investments:
Earnings on investments 1,427,518 495,158 5,653,067 3,748,184
Net increase (decrease) in fair value of investments 35,265 (119,399) 6,207,317 (1,922,758)
Fees 10,927,161 12,795,236
Servicing fee income 2,491,512 2,246,071
Grant revenue 15,466,608 9,890,261
Gain on sale of loans 10,822,699 21,823,303
Total operating revenues 59,150,137 63,078,033 38,031,853 30,499,611
Operating Expenses:
Interest expense 6,909,343 5,205,890 21,921,545 19,796,662
Personnel services 22,625,074 22,643,931
Other administrative expenses 10,636,813 9,998,550
Housing initiatives 6,032,478 7,406,627
Provision for loan losses 2,973,706 5,258,408 406,784 773,656
REO expenditures 124,331 (356,964) 218,219 (164,842)
Bad debt expense 36,652 83,031
Arbitrage rebate
Bond issuance costs (37,741) 1,600 2,059,889
Depreciation and amortization of other assets 2,025,566 1,810,935 6,996 8,776
Loan costs 9,652,419 9,910,169 256 260
State rental subsidy program 205,622 262,865
Grant expense 15,523,606 8,954,494
Total operating expenses 76,707,869 71,179,536 24,613,689 20,414,512
Operating Income (Loss) (17,557,732) (8,101,503) 13,418,164 10,085,099
Transfer to State (1,000,000)
Transfers In (Out) 7,562,234 4,810,556 (3,180,369)
Total Change in Net Position (9,995,498) (4,290,947) 10,237,795 10,085,099
Net Position - Beginning of Year 107,644,865 111,935,812 146,721,348 136,636,249
Net Position - End of Year $ 97,649,367 $ 107,644,865 $ 156,959,143 $ 146,721,348
Operating Fund Single-Family Fund
The accompanying notes are an integral part of the financial statements
12

RHODE ISLAND HOUSING AND MORTGAGE FINANCE CORPORATION(A COMPONENT UNIT OF THE STATE OF RHODE ISLAND)COMBINING STATEMENTS OF REVENUES, EXPENSES AND CHANGES IN NET POSITIONFOR THE YEARS ENDED JUNE 30, 2019 AND 2018
2019 2018 2019 2018
Operating Revenues:Interest income on loans $ 27,640,756 $ 27,104,950 $ 65,930,261 $ 67,058,046 Interest income attributable to internal servicing activities 5,861,338 4,668,492
Total interest income on loans 27,640,756 27,104,950 71,791,599 71,726,538
Income on investments:Earnings on investments 1,315,596 850,159 8,396,181 5,093,501 Net decrease in fair value of investments (55,859) (250,073) 6,186,723 (2,292,230)
Fees 10,927,161 12,795,236 Servicing fee income 2,491,512 2,246,071 Grant revenue 15,466,608 9,890,261 Gain on sale of loans 10,822,699 21,823,303
Total operating revenues 28,900,493 27,705,036 126,082,483 121,282,680
Operating Expenses:Interest expense 15,146,031 14,949,412 43,976,919 39,951,964 Personnel services 22,625,074 22,643,931 Other administrative expenses 33,581 34,661 10,670,394 10,033,211 Housing initiatives 6,032,478 7,406,627 Provision for loan losses 3,380,490 6,032,064 REO expenditures (income) 342,550 (521,806) Bad debt expense 36,652 83,031 Arbitrage (rebate) expense 12,513 43,535 12,513 43,535 Bond issuance costs (375,775) 34,003 1,646,373 35,603 Depreciation and amortization of other assets 2,032,562 1,819,711 Loan costs 695,458 675,830 10,348,133 10,586,259 State rental subsidy program 205,622 262,865 Grant expense 15,523,606 8,954,494
Total operating expenses 15,511,808 15,737,441 116,833,366 107,331,489
Operating Income (Loss) 13,388,685 11,967,595 9,249,117 13,951,191
Transfer to State - (1,000,000) Transfers In (Out) (4,381,865) (4,810,556) - -
Total Change in Net Position 9,006,820 7,157,039 9,249,117 12,951,191
Net Position - Beginning of Year 70,415,405 63,258,366 324,781,618 311,830,427
Net Position - End of Year $ 79,422,225 $ 70,415,405 $ 334,030,735 $ 324,781,618
Multi-Family Fund Total
The accompanying notes are an integral part of the financial statements
13

RHODE ISLAND HOUSING AND MORTGAGE FINANCE CORPORATION(A COMPONENT UNIT OF THE STATE OF RHODE ISLAND)COMBINING STATEMENTS OF CASH FLOWSFOR THE YEARS ENDED JUNE 30, 2019 AND 2018
2019 2018 2019 2018
Cash Flows from Operating Activities:Interest on loans receivable $ 17,915,322 $ 15,812,917 $ 26,347,360 $ 28,785,012 Repayment of loans receivable 424,031,952 426,523,516 65,408,378 86,419,280 Fees collected (paid) 13,212,880 15,036,758 (16,618) (16,732) Deferred OPEB inflows/outflows (45,651) 592,072 Other receipts (disbursements), net 16,097,057 10,105,158 Loans disbursed (463,754,691) (478,981,066) (15,009,457) (29,056,717) Accounts receivable, net (673,300) 360,231 Loss on accounts receivable (83,031) Accounts receivable expenses (36,652) Loss on loans receivable (973,706) (758,408) (206,784) (973,656) Income (loss) on REO properties (124,330) 356,964 (218,219) 164,842 Bond issuance costs 37,741 (1,600) (2,059,889) Personnel services (22,625,074) (22,643,931) Other administrative expenses (10,595,524) (9,670,385) Housing initiative expenses (6,073,767) (7,734,793) Other assets (3,835,533) (3,772,589) 657,334 (215,313) Arbitrage rebateAccounts payable and accrued liabilities 1,583,932 (101,557) Gain on sale of loans 4,245,517 10,453,005 State rental subsidy program (205,622) (262,865) Transfers from (to) other programs 7,552,886 4,805,056 (2,789,746)
Net cash provided by (used in) operating activities (24,266,563) (39,964,548) 72,112,359 85,106,716
Cash Flows from Noncapital Financing Activities:Proceeds from sale of bonds and notes 373,567,333 385,142,211 339,379,507 7,476 Payment of bond and note principal (337,960,922) (346,580,475) (229,350,159) (85,770,043) Interest paid on bonds and notes (6,819,042) (5,311,600) (19,426,542) (20,401,668) Transfer to the State (1,000,000)
Net cash provided by (used in) noncapital financing activities 28,787,369 32,250,136 90,602,806 (106,164,235)
Cash Flows from Investing Activities:Redemption of investments 198,474,486 324,928,945 34,424,647 10,639,886 Earnings on investments 1,429,499 497,332 5,349,168 3,772,919 Purchase of investments (199,738,326) (328,883,595) (130,729,822) (9,188,489)
Net cash provided by (used in) investing activities 165,659 (3,457,318) (90,956,007) 5,224,316
Net Increase (Decrease) in Cash and Cash Equivalents 4,686,465 (11,171,730) 71,759,158 (15,833,203)
Cash and Cash Equivalents - Beginning of Year 108,521,810 119,693,540 65,230,221 81,063,424
Cash and Cash Equivalents - End of Year $ 113,208,275 $ 108,521,810 $ 136,989,379 $ 65,230,221
Operating Fund Single-Family Fund
The accompanying notes are an integral part of the financial statements
14

RHODE ISLAND HOUSING AND MORTGAGE FINANCE CORPORATION(A COMPONENT UNIT OF THE STATE OF RHODE ISLAND)COMBINING STATEMENTS OF CASH FLOWSFOR THE YEARS ENDED JUNE 30, 2019 AND 2018
2019 2018 2019 2018
Cash Flows from Operating Activities:Interest on loans receivable $ 27,870,875 $ 26,803,669 $ 72,133,557 $ 71,401,598 Repayment of loans receivable 76,178,839 35,700,401 565,619,169 548,643,197 Fees collected 13,196,262 15,020,026 Deferred OPEB inflows/outflows (45,651) 592,072 Other receipts (disbursements), net (11,484,296) 12,575,112 4,612,761 22,680,270 Loans disbursed (25,066,880) (63,978,595) (503,831,028) (572,016,378) Accounts receivable, net (673,300) 360,231 Loss on accounts receivable - (83,031) Accounts receivable expenses (36,652) - Loss on loans receivable (1,180,490) (1,732,064) Income (loss) on REO properties (342,549) 521,806 Bond issuance costs 375,775 (34,003) (1,646,373) (35,603) Personnel services (22,625,074) (22,643,931) Other administrative expenses (33,581) (34,661) (10,629,105) (9,705,046) Housing initiative expenses (6,073,767) (7,734,793) Other assets (3,178,199) (3,987,902) Arbitrage rebate (12,513) (43,535) (12,513) (43,535) Accounts payable and accrued liabilities 12,513 (91,177) 1,596,445 (192,734) Gain (loss) on sale of loans (695,458) (675,830) 3,550,059 9,777,175 State rental subsidy program (205,622) (262,865) Transfers to other programs (4,495,721) (4,805,056) 267,419 -
Net cash provided by (used in) operating activities 62,649,553 5,416,325 110,495,349 50,558,493
Cash Flows from Noncapital Financing Activities:Proceeds from sale of bonds and notes 26,398,798 61,633,405 739,345,638 446,783,092 Payment of bond and note principal (66,128,726) (53,026,606) (633,439,807) (485,377,124) Interest paid on bonds and notes (15,709,868) (14,543,028) (41,955,452) (40,256,296) Transfer to the State - (1,000,000)
Net cash used in noncapital financing activities (55,439,796) (5,936,229) 63,950,379 (79,850,328)
Cash Flows from Investing Activities:Redemption of investments 6,006,674 456,056 238,905,807 336,024,887 Earnings on investments 1,342,158 907,736 8,120,825 5,177,987 Purchase of investments (8,197) (4,407,204) (330,476,345) (342,479,288)
Net cash provided by (used in) investing activities 7,340,635 (3,043,412) (83,449,713) (1,276,414)
Net Increase (Decrease) in Cash and Cash Equivalents 14,550,392 (3,563,316) 90,996,015 (30,568,249)
Cash and Cash Equivalents - Beginning of Year 51,875,806 55,439,122 225,627,837 256,196,086
Cash and Cash Equivalents - End of Year $ 66,426,198 $ 51,875,806 $ 316,623,852 $ 225,627,837
Multi-Family Fund Total
The accompanying notes are an integral part of the financial statements
15

RHODE ISLAND HOUSING AND MORTGAGE FINANCE CORPORATION(A COMPONENT UNIT OF THE STATE OF RHODE ISLAND)COMBINING STATEMENTS OF CASH FLOWSFOR THE YEARS ENDED JUNE 30, 2019 AND 2018
2019 2018 2019 2018
Reconciliation of Operating Income (Loss) to Net Cash Provided by (Used in) Operating Activities:
Operating income (loss) $ (17,557,732) $ (8,101,503) $ 13,418,164 $ 10,085,099
Adjustments:Earnings on investments (1,429,499) (497,332) (5,349,168) (3,772,919) Net (increase) decrease in fair value of investments (35,265) 119,399 (6,207,317) 1,922,758 Interest paid on bonds and notes 6,819,042 5,311,600 19,426,542 20,401,668 Transfer of investments and/or net position 7,562,234 4,810,556 (3,180,369) (Increase) decrease in assets:
Loans receivable/loss allowance (37,769,974) (48,169,069) 50,598,920 57,162,563 Accrued interest-loans (64,053) (134,485) 175,892 110,827 Accrued interest-investments 1,981 2,173 (303,898) 24,734 Accounts receivable, net (626,063) 571,750 Other assets (1,809,968) (1,961,654) 664,330 (206,536) Interfund receivable (payable) (9,347) (5,500) 390,622
(Increase) decrease in deferred outflows 3,030,737 (1,478,469) 256 260 Increase (decrease) in liabilities:
Accrued interest-bonds and notes 90,302 (105,710) 2,495,003 (605,006) Accounts payable/accrued liabilities 1,583,932 (177,982) Fees, net (205,794) (4,548) (16,618) (16,732) Escrow deposits 16,154,055 9,169,391
Increase (decrease) in deferred inflows (1,151) 686,835 Total adjustments (6,708,831) (31,863,045) 58,694,195 75,021,617
Net Cash Provided by (Used in) Operating Activities $ (24,266,563) $ (39,964,548) $ 72,112,359 $ 85,106,716
Single-Family FundOperating Fund
The accompanying notes are an integral part of the financial statements
16

RHODE ISLAND HOUSING AND MORTGAGE FINANCE CORPORATION(A COMPONENT UNIT OF THE STATE OF RHODE ISLAND)COMBINING STATEMENTS OF CASH FLOWSFOR THE YEARS ENDED JUNE 30, 2019 AND 2018
2019 2018 2019 2018
Reconciliation of Operating Income (Loss) to Net Cash Provided by (Used in) Operating Activities:
Operating income $ 13,388,685 $ 11,967,595 $ 9,249,117 $ 13,951,191
Adjustments:Earnings on investments (1,342,158) (907,736) (8,120,825) (5,177,987) Net (increase) decrease in fair value of investments 55,859 250,073 (6,186,723) 2,292,230 Interest paid on bonds and notes 15,709,868 14,543,028 41,955,452 40,256,296 Transfer of investments and/or net position (4,381,865) (4,810,556) (Increase) decrease in assets:
Loans receivable/loss allowance 51,379,378 (28,278,195) 64,208,324 (19,284,701) Accrued interest-loans 230,120 (301,280) 341,959 (324,938) Accrued interest-investments 26,563 57,575 (275,354) 84,482 Accounts receivable, net (626,063) 571,750 Other assets (1,145,638) (2,168,190) Interfund receivable (payable) (381,275) 5,500 - -
(Increase) decrease in deferred outflows 3,030,993 (1,478,209) Increase (decrease) in liabilities:
Accrued interest-bonds and notes (563,838) 406,385 2,021,467 (304,331) Accounts payable/accrued liabilities 12,513 (91,176) 1,596,445 (269,158) Fees, net (222,412) (21,280) Escrow deposits (11,484,297) 12,575,112 4,669,758 21,744,503
Increase (decrease) in deferred inflows (1,151) 686,835 Total adjustments 49,260,868 (6,551,270) 101,246,232 36,607,302
Net Cash Provided by (Used in) Operating Activities $ 62,649,553 $ 5,416,325 $ 110,495,349 $ 50,558,493
Multi-Family Fund Total
The accompanying notes are an integral part of the financial statements
17

RHODE ISLAND HOUSING AND MORTGAGE FINANCE CORPORATION (A COMPONENT UNIT OF THE STATE OF RHODE ISLAND) STATEMENTS OF FIDUCIARY NET POSITION - PRIVATE PURPOSE TRUST COMPONENT UNIT AFFORDABLE HOUSING TRUST JUNE 30, 2019 AND 2018
2019 2018
Assets:Loans receivable $ 51,747,632 $ 53,233,467 Less allowance for loan losses (6,000,000) (5,643,974)
Loans receivable, net 45,747,632 47,589,493
Investments 48,115 50,479 Accrued interest-loans 161,771 164,223 Accrued interest-investments 283 288 Cash and cash equivalents 53,535,247 43,276,956 Accounts receivable, net 17,781 102,930 Other assets, net 403,137 459,500
Total Assets $ 99,913,966 $ 91,643,869
Liabilities and Net Position
Liabilities:Accounts payable and accrued liabilities $ 116,534 $ 72,231
Net Position:Held in trust 99,797,432 91,571,638
Total Liabilities and Net Position $ 99,913,966 $ 91,643,869
The accompanying notes are an integral part of the financial statements
18

RHODE ISLAND HOUSING AND MORTGAGE FINANCE CORPORATION (A COMPONENT UNIT OF THE STATE OF RHODE ISLAND) STATEMENTS OF CHANGES IN FIDUCIARY NET POSITION - PRIVATE PURPOSE TRUST COMPONENT UNIT AFFORDABLE HOUSING TRUST FOR THE YEARS ENDED JUNE 30, 2019 AND 2018
2019 2018
Revenues:Interest income on loans $ 2,507,539 $ 2,387,394 Earnings on investments:
Interest on investments 786,026 344,251 Net increase (decrease) in fair value of investments 95 (157) Trust receipts 5,660,826 5,873,346
Total revenues 8,954,486 8,604,834
Expenses:Other administrative expenses 44,303 45,164 Provision for loan losses 684,389 137,008
Total expenses 728,692 182,172
Total Change in Net Position 8,225,794 8,422,662
Net Position - Beginning of Year 91,571,638 83,148,976
Net Position - End of Year $ 99,797,432 $ 91,571,638
The accompanying notes are an integral part of the financial statements
19

RHODE ISLAND HOUSING AND MORTGAGE FINANCE CORPORATION NOTES TO FINANCIAL STATEMENTS FOR THE YEARS ENDED JUNE 30, 2019 AND 2018
20
1. ORGANIZATION AND SUMMARY OF SIGNIFICANT ACCOUNTING POLICIES
A. Organization and Description of Financial Reporting Entity
Rhode Island Housing and Mortgage Finance Corporation (the Corporation) is a public instrumentality established in 1973 by an Act of the Rhode Island General Assembly. The Corporation was created to originate loans and administer other activities to expand the supply of housing available to persons of low and moderate income and to stimulate the construction and rehabilitation of housing and healthcare facilities in the State of Rhode Island (the State). It has the power to issue negotiable notes and bonds to achieve its corporate purpose. The notes and bonds do not constitute a debt of the State, and the State is not liable for the repayment of such obligations.
The Corporation is considered a component unit of the State and is included in the State’s comprehensive annual financial report.
The Corporation is exempt from federal and state income taxes.
In evaluating the inclusion of other separate and distinct legal entities as component units within its financial reporting structure, the Corporation applies the criteria prescribed by Governmental Accounting Standards Board (GASB) Statement No. 14, as amended by GASB Statement Nos. 39 and 61. Through the application of GASB criteria, the Corporation determined that the Affordable Housing Trust Fund (the Trust) is a component unit of the Corporation and the Trust has been presented in the accompanying fiduciary fund financial statements. Control over and financial accountability for the Trust is determined based on appointment by a voting majority of the Trust’s trustees.
B. Affordable Housing Trust Fund
The Trust is a separate legal entity created pursuant to a trust agreement initiated by the Corporation. The Trust is a private-purpose trust established to assist in activities that involve the creation and preservation of affordable housing in the State. All resources of the Trust, including income on investments and other revenues, are held in trust for the benefit of private and not-for-profit organizations. Trust receipts are derived from payments related to affordable housing preservation transactions and funds received from the Corporation to administer housing programs. There is no requirement that any portion of the Trust’s resources be preserved as capital. The Trust administers its affairs through its trustees, records its assets in segregated accounts and maintains financial records separate from the Corporation.
C. Financial Statement Presentation, Measurement Focus and Basis of Accounting
The Corporation engages only in business-type activities. Business-type activities are activities that are financed in whole or in part by fees charged to external parties. The accompanying combining statement of net position, statement of revenues, expenses and changes in net position and statement of cash flows (enterprise fund financial statements) present the financial information of the Corporation.

RHODE ISLAND HOUSING AND MORTGAGE FINANCE CORPORATION NOTES TO FINANCIAL STATEMENTS FOR THE YEARS ENDED JUNE 30, 2019 AND 2018
21
The Corporation classifies its business-type activities into funds, reported as separate columns within the enterprise fund financial statements, each representing a fiscal and accounting entity with a self-balancing set of accounts segregated to carry on specific activities in accordance with bond resolutions established under various trust indentures, special regulations restrictions or limitations. All inter-fund activity has been eliminated from the combining totals in the accompanying financial statements. Transfers between funds are made to cover the operating costs associated with management of bond resolutions. Transfers also consist of reimbursement of collateral for bond resolutions previously funded by the operating fund.
The Operating Fund accounts for the receipt of income not directly pledged to the repayment of specific bonds and notes, expenses related to the Corporation’s administrative functions and for various housing program activities that are not covered by bond resolutions. The Operating Fund also accounts for the activities of the Corporation’s two separate subsidiaries: Rhode Island Housing Equity Corporation and Rhode Island Housing Development Corporation. The Single-Family Housing Fund includes transactions and programs designed to provide affordable housing to eligible persons and families within the State for properties with one to four dwelling units. All loans, whether originated by the Corporation or purchased from participating lenders, are in compliance with bond resolutions. The Multi-Family Fund includes financing activities with the intent to originate multi-family loans secured by a lien.
The Trust engages only in fiduciary activities. Separate financial statements are presented for the Trust as fiduciary activities are excluded from presentation in enterprise fund financial statements.
The Corporation and the Trust use the economic resources measurement focus and accrual basis of accounting. The accompanying financial statements have been prepared in conformance with generally accepted accounting principles (GAAP) for governments as prescribed by GASB, which is the accepted standard-setting body for establishing governmental accounting and financial reporting principles.
The Corporation has presented an unclassified combining statement of net position in accordance with financial institution industry trade practice. Although contractual terms define the principal payments of loans receivable and the amount of principal required to be paid on bonds and notes payable within one year from the date of the combining statement of net position, the actual principal amounts received on loans and repaid on bonds and notes are significantly affected by changes in interest rates, economic conditions and other factors. Consequently, the principal amount of loans receivable and principal amount payable for bonds and notes based on contractual terms would not be representative of actual amounts received or paid, and such amounts are not reliably estimable.
The Corporation distinguishes between operating and nonoperating revenues and expenses. Operating revenues and expenses generally result from services provided in connection with the Corporation’s principal ongoing operations. Operating expenses include the cost of services provided, administrative expenses, and depreciation and amortization expense. All other revenues and expenses are reported as nonoperating revenues and expenses.

RHODE ISLAND HOUSING AND MORTGAGE FINANCE CORPORATION NOTES TO FINANCIAL STATEMENTS FOR THE YEARS ENDED JUNE 30, 2019 AND 2018
22
D. Loans Receivable and Allowance for Loan Losses
Loans receivable are reported at their outstanding principal balance adjusted for any charge-offs and the allowance for loan losses.
In general, interest income on loans receivable is recognized on the accrual basis. A loan is considered delinquent when payments are not made in accordance with contractual terms. Loans go into “nonaccrual status” when loan payments are delinquent for 90 days or more. Interest income is no longer accrued and any accrued interest is reversed. Loans are returned to accrual status when all amounts contractually due are brought current or the loans have been restructured and future payments are reasonably assured. For certain deferred loans which specify that interest is payable based on available cash flow or the availability of other specified sources, related interest is recorded as income when received.
Losses on loans are provided for under the allowance method of accounting. The allowance is increased by provisions charged to operating expenses and by recoveries of previously charged-off loans. The allowance is decreased as loans are charged off.
The allowance represents an amount that management believes will be adequate to provide for potential loan losses based on an evaluation of collectability and prior loss experience, known and inherent risk in the portfolio, changes in the nature and volume of the loan portfolio, overall portfolio quality, specifically identified high-risk loans, the estimated value of the underlying collateral, current and anticipated economic conditions that may affect the borrower’s ability to pay, historical loss experience and the types of mortgage insurance or guarantee programs provided by outside parties. Substantially all loans are secured by real estate in Rhode Island; accordingly, the ultimate collectability of the loans is susceptible to changes in market conditions in the area. Management believes the allowance for loan losses is adequate. While management uses available information to recognize losses on loans, evaluation assessments made by management are inherently subjective and future adjustments to the allowance may be necessary if economic conditions differ substantially from the assumptions used at the time of the evaluation.
Loans originated and intended for sale in the secondary market are carried at the lower of cost or estimated fair value in the aggregate. Such loans are presented as loans held for sale on the accompanying statements of net position. Gains and losses for sales of loans are recognized based upon the difference between the fair value of mortgage-backed securities forward contracts at date of commitment and the carrying value of the underlying loans.
E. Cash and Cash Equivalents
Cash and cash equivalents represent funds on deposit with various financial institutions and funds held by the trustees of the various bond programs. Deposits held in financial institutions and all highly liquid investments, such as U.S. Treasury Bills and Notes, with original maturities of 90 days or less are considered cash and cash equivalents.

RHODE ISLAND HOUSING AND MORTGAGE FINANCE CORPORATION NOTES TO FINANCIAL STATEMENTS FOR THE YEARS ENDED JUNE 30, 2019 AND 2018
23
F. Investments
Investments held by the Corporation consist of those permitted by the various bond resolutions and the Corporation’s investment policy. Investments include securities of the U.S. Government and of U.S. Government agencies, securities guaranteed by the U.S. Government and U.S. Government agencies, savings accounts and guaranteed investment contracts.
In accordance with GASB Statement No. 31 (GASB 31), money market investments having a remaining maturity of one year or less at time of purchase are reported at amortized cost if the fair value of such investments is not significantly affected by the impairment of the credit standing of the issuer or by other factors. Investments in nonparticipating interest earning investment contracts, such as nonnegotiable and nontransferable guaranteed investment contracts, which are redeemable at contract or stated value rather than fair value based on current market rates and certificates of deposit with redemption terms that do not consider market rates, are reported at cost or amortized cost provided that the fair value of such contracts is not significantly affected by the impairment of the credit standing of the issuer or other factors. Investments not reported at cost or amortized cost are reported at fair value in accordance with GASB No. 31. The fair value of securities is provided by an investment trustee as reported by recognized pricing firms. The reported amounts of investments not otherwise reported at fair value approximate their fair value.
All investment income, including changes in the fair value of investments, is reported as revenue in the Corporation’s statements of revenues, expenses and changes in net position and in the Trust’s statement of changes in fiduciary net assets. The Corporation records a liability for the portion of investment income that is rebateable to the U.S Government under Section 103A of the Internal Revenue Code, as amended (the Code) for tax-exempt bonds sold after 1981. The Code requires that such excess investment income be remitted to the Internal Revenue Service (IRS). Such rebateable investment income is included in accounts payable and accrued liabilities in the accompanying statements of net position and recorded within operating expenses in the statement of revenues, expenses and changes in net position.
G. Bond Issuance Costs, Premiums, Discounts and Early Retirements
In accordance with GASB Statement No. 65, costs associated with issuing bonds are reported in the combining statement of revenues, expenses and changes in net position in the year the bond is issued. In addition, when refinancing debt, the costs associated with the refinanced bond are also reported in the combining statements of revenues, expenses and changes in net position in the year in which the bond is refinanced.
Premiums and discounts are capitalized and amortized using a method that approximates the interest method over the life of the related issue or to the date the Corporation has the option to redeem the bonds.
The Corporation periodically retires bonds prior to their redemption date. Any premium paid on the call related to the early retirement of bonds that are not refunded is reported in the combining statements of revenues, expenses and changes in net position.

RHODE ISLAND HOUSING AND MORTGAGE FINANCE CORPORATION NOTES TO FINANCIAL STATEMENTS FOR THE YEARS ENDED JUNE 30, 2019 AND 2018
24
H. Other Assets
Other assets of the Corporation are principally comprised of property and equipment, certain other real estate owned, and deferred servicing costs related to service release premiums paid to participating originating lenders for origination of single-family loans. The Corporation depreciates property and equipment on a straight-line basis over the assets’ estimated lives, which range from 3-40 years.
The Corporation states its other real estate owned acquired through or in lieu of foreclosure at the lower of cost or fair value less the cost to sell. Fair value of such assets is determined based on independent appraisals and other relevant factors. Other real estate owned in the Single-Family Fund is partially insured or guaranteed by outside parties and it is anticipated that the Corporation will recover substantially all the balance of these assets through such insurance and from proceeds from the sale of the underlying properties. The Corporation holds such properties for subsequent sale in a manner that will allow maximization of value. Carrying costs relating to other real estate owned are recorded in the Operating Fund.
I. Total Other Postemployment Benefits Other than Pensions (OPEB) Liability
The total OPEB liability is measured as the portion of the actuarial present value of projected benefits that is attributed to past periods of employee service. The total OPEB liability is measured as of a date (measurement date) no earlier than the end of the employer’s prior fiscal year and no later than the end of the current fiscal year, consistently applied from period to period. The measurement date for the reported liability was June 30, 2018.
J. Deferred Inflows and Outflows of Resources
Deferred outflows of resources represent the consumption of net assets that are applicable to a future reporting period. Deferred inflows of resources represent the acquisition of net assets that are applicable to a future reporting period. At June 30, 2019 and 2018, the Corporation’s deferred outflows of resources consist of the change in fair value of derivatives and loan origination costs, as described below. In addition, deferred inflows and outflows were recorded for OPEB for June 30, 2019 and 2018 as described below.
Fair values of both hedging derivatives and investment derivatives (if any) are presented on the combining statements of net position either as a derivative liability (negative fair value) or as a derivative asset (positive fair value). The difference between the notional amount and fair value of the derivatives that are determined to be effective hedges is recorded as a deferred inflow or outflow of resources on the Corporation’s combining statements of net position. The Corporation currently has one type of derivative instrument outstanding: mortgage-backed security forward contracts.
The Corporation also reports deferred outflows and inflows related to Other Post Employment Benefits (OPEB). Deferred outflows and inflows of resources related to OPEB results from differences between expected and actual experience, changes in assumptions or other inputs and payments. Deferred outflows are included in OPEB expense in a systematic and rational manner over a period equal to the average of the expected remaining service lives of all employees that are provided with benefits through the pension plan (active employees and inactive employees).
The Corporation also reports a deferred inflow of resources related to OPEB. That deferred inflow results from contributions made subsequent to the measurement date.

RHODE ISLAND HOUSING AND MORTGAGE FINANCE CORPORATION NOTES TO FINANCIAL STATEMENTS FOR THE YEARS ENDED JUNE 30, 2019 AND 2018
25
K. Net Position
Net position is classified into three components: net investment in capital assets, restricted and unrestricted. Net investment in capital assets represents the net book value of all capital assets reduced by the outstanding balances of bonds and other debt and deferred inflows of resources, if any, used to acquire, construct or improve these assets, and increased by deferred outflows of resources related to those assets, if any. Restricted net position consists of restricted assets that have been limited in use as specified either externally by creditors, contributors, laws, or government regulations, or internally by enabling legislation or law. Restricted assets are reduced by liabilities and deferred inflows of resources related to the restricted assets. Unrestricted net position consists of amounts not included in net investment in capital assets or restricted net position.
The Corporation classifies all net position amounts associated with its bond resolutions as restricted net position. Under bond indentures, all assets assigned to these programs are pledged for the benefit of the bondholders of each program; consequently, the Corporation classifies all such amounts, while retained in the bond programs, as restricted. Transfers from the bond programs to the Operating Fund are made when transfers are approved and authorized by the Corporation’s management and such amounts are not specifically required to be retained within the bond program. Transfers during the years ended June 30, 2019 and 2018 include cash transfers for reimbursement of activities in support of the bond programs.
Restricted net position in the Operating Fund is comprised of the amount of assets required to be pledged as collateral to a lender in excess of outstanding amounts borrowed as well as assets restricted for federal programs. At June 30, 2019 and 2018, restricted amounts totaled $2,229,025 and $4,398,681, respectively.
L. Interest Income on Loans
The Corporation presents two categories of interest income. The first category, “interest income on loans,” represents the interest component of the mortgagors’ payments due to all mortgage servicing entities (including the Corporation’s Operating Fund). The second category, “interest income attributable to internal servicing activities,” represents compensation earned for mortgage servicing for those loans serviced by the Corporation. Together, these two components comprise interest income on loans owned by the Corporation.
M. Use of Estimates
Management has made several estimates and assumptions relating to the reporting of assets and liabilities and revenues and expenses and disclosure of contingent assets and liabilities when preparing the financial statements in conformity with accounting principles generally accepted in the United States of America. Actual results could differ from those estimates.
N. Fee and Grant Revenue
Recognition of grant revenue is based on the susceptibility of accrual as determined by the legal and contractual requirements established by each grantor. For grants not restrictive as to specific purposes and revocable only for failure to comply with general prescribed requirements, revenues are recognized when actually received. Where expenditure is the prime factor in determining eligibility, grant revenue is recognized as allowable expenditures are made. Fee income is accrued as earned and includes fees received from loan originations, securitization premiums, loan servicing fees and Section 8 administrative fees received from the U.S. Department of Housing and Urban Development (HUD), including administrative fees that are paid by HUD to the Corporation under the Performance-Based Contract Administration (PBCA) contract for certain Section 8 projects throughout Rhode Island.

RHODE ISLAND HOUSING AND MORTGAGE FINANCE CORPORATION NOTES TO FINANCIAL STATEMENTS FOR THE YEARS ENDED JUNE 30, 2019 AND 2018
26
O. Recent Accounting Pronouncements
Effective for the fiscal year ended June 30, 2019, the Corporation adopted the provisions of GASB Statement No. 88, Certain Disclosures Related to Debt, including Direct Borrowing and Direct Placements (GASB 88). Note 7, Bonds and Notes Payable, includes GASB 88 disclosures for changes in long-term obligations, debt service requirements as of the statement of net position date as well as unused balances on the various line of credit facilities.
2. RESTRICTED ASSETS
Certain assets are restricted by covenants and agreements as a result of transactions including bond sales, mortgages generated with lending institutions and funding provided by HUD programs. All assets in the Single-Family and Multi-Family Funds are restricted. Restricted assets in the Operating Fund include cash and cash equivalents, investments, loans and other assets. At June 30, 2019 and 2018, restricted assets in the Operating Fund totaled $592,133,139 and $547,456,506, respectively.
3. LOANS RECEIVABLE
The Corporation provides single-family mortgage loans to qualified borrowers in the State. The mortgage loans are generally required to be insured through the Federal Housing Administration (FHA), guaranteed by the Department of Veterans Administration (VA) or USDA Rural Development or conventionally financed with traditional primary mortgage insurance. Under the single-family program guidelines, conventionally financed single-family mortgage loans with an initial loan-to-value ratio of greater than 80% are insured by private mortgage insurance carriers. As these loans amortize and the loan-to-value ratio falls below 80%, the private mortgage insurance coverage may be terminated.
At June 30, 2019 and 2018, the single-family mortgage loan balances in the Single-Family Fund are insured, subject to maximum insurable limits described below:
2019 2018 Private Mortgage Insurance $ 191,948,517 $ 238,451,775 FHA Insurance 186,373,446 189,331,234 VA Guaranteed 5,986,966 6,673,943 USDA/RD Guaranteed 7,932,415 9,369,394 Uninsured 179,392,965 178,206,883 Total $ 571,634,309 $ 622,033,229

RHODE ISLAND HOUSING AND MORTGAGE FINANCE CORPORATION NOTES TO FINANCIAL STATEMENTS FOR THE YEARS ENDED JUNE 30, 2019 AND 2018
27
The FHA program insures the repayment of the unpaid principal amount of the mortgage upon foreclosure and conveyance of title to the Secretary of HUD. The insurance proceeds are usually paid in cash, but at the discretion of the Secretary, may be settled through issuance of twenty-year debentures. The VA mortgage loan guarantee covers from 25% up to 50% of the original principal amount of a loan up to a maximum of $60,000 depending on the loan amount. Private mortgage insurers must be qualified to insure mortgages purchased by the Federal Home Loan Mortgage Corporation or the Federal National Mortgage Association (FNMA) and must be authorized to do business in the State. Private mortgage insurance typically covers between 6% and 35% of claims depending upon the premium plan and coverage selected when the loan is originated. The risk exists that if these private mortgage insurance companies are not able to honor claims, these loans would be considered uninsured.
The Corporation has entered into a risk-sharing agreement with HUD whereby HUD will provide partial mortgage insurance on affordable multi-family housing developments financed by the Corporation. The risk of loss to the Corporation varies from 10% to 50% depending on the level of participation by HUD. In the Multi-Family Fund and Operating Fund, loan balances at June 30, 2019 of $298,102,656 and $148,911,119, respectively, and at June 30, 2018 of $305,167,516 and $120,578,275, respectively, are insured under such agreements subject to maximum participation limits. At June 30, 2019 and 2018, loan balances of $17,905,043 and $18,099,805, respectively, in the Trust are also insured under such agreements.
In May 2012, the Corporation entered into an agreement with FNMA whereby single-family mortgage loans originated under the Corporation’s program guidelines may be sold directly to FNMA or pooled into a mortgage-backed security that will be guaranteed by FNMA. As of June 30, 2019, 2,277 loans had been sold directly to FNMA and eight mortgage-backed securities had been issued. As of June 30, 2018, 1,818 loans had been sold directly to FNMA and eight mortgage-backed securities had been issued.
In the Single-Family Fund, 95% and 96% of the loan portfolio is in first lien position for the fiscal years ended June 30, 2019 and 2018, respectively. In the Multi-Family Fund, 99% of the loan portfolio is in first lien position for the fiscal years ended June 30, 2019 and 2018. For the years ended June 30, 2019 and 2018, 49% and 47%, respectively, of the Operating Fund’s loan portfolio is in first lien position, while 47% and 49%, respectively, of the Affordable Housing Trust’s loan portfolio is in first lien position.
The payment of interest by borrowers on certain loans recorded in the Corporation’s Operating Fund, Single-Family Fund and Multi-Family Fund is deferred and is payable by borrowers only from available cash flow, as defined in the loan agreements or other specified sources. Interest income on such loans is recorded only when received from the borrower. For the years ended June 30, 2019 and 2018, interest received under such deferred loan arrangements was $297,756 and $359,465, respectively, in the Operating Fund and $526,036 and $316,197, respectively, in the Single-Family Fund. In addition, the Corporation administers certain federal and state loan programs, which are either deferred forgivable loans or noninterest bearing. Loans under these programs totaled $219,588,463 and $210,852,660 at June 30, 2019 and 2018, respectively.

RHODE ISLAND HOUSING AND MORTGAGE FINANCE CORPORATION NOTES TO FINANCIAL STATEMENTS FOR THE YEARS ENDED JUNE 30, 2019 AND 2018
28
At June 30, 2019 and 2018, principal outstanding under such deferred loan arrangements is as follows:
2019 2018 Operating Fund: Single-family loans $ 63,982,446 $ 64,861,308 Multi-family loans 217,191,760 204,074,604 Subtotal 281,174,206 268,935,912 Single-Family Fund: Single-family loans 14,374,615 15,521,530 Total $ 295,548,821 $ 284,457,442
Certain loans recorded in the Corporation’s Operating Fund and Single-Family Fund are on nonaccrual status due to delinquency over 90 days. At June 30, 2019 and 2018, principal outstanding under such nonaccrual status loans is as follows:
2019 2018 Operating Fund: Single-family loans $ 6,970,884 $ 5,645,314 Multi-family loans - - Subtotal 6,970,884 5,645,314 Single-Family Fund: Single-family loans 17,100,856 16,001,827 Total $ 24,071,740 $ 21,647,141
A summary of the changes in the allowance for loan losses is as follows:
2019 2018 Balance at beginning of year $ 39,800,000 $ 35,500,000 Loans charged off, net of recoveries (1,076,674) (1,279,059) Write-down of REO properties (103,816) (453,006) Provision for loan losses 3,380,490 6,032,065 Balance at End of Year $ 42,000,000 $ 39,800,000
In addition to the allowance for loan losses, the Corporation maintains an escrow account funded by certain mortgage lenders (the Mortgage Lender’s Reserve Account). This Mortgage Lender’s Reserve Account equals a percentage of the outstanding principal balance of certain mortgage loans purchased from an applicable mortgage lender and is available to the Corporation in the event the proceeds realized upon the default and foreclosure of any covered mortgage loan is less than the amount due to the Corporation. At June 30, 2019 and 2018, the Mortgage Lender’s Reserve Account totaled $362,581 and $364,663, respectively.

RHODE ISLAND HOUSING AND MORTGAGE FINANCE CORPORATION NOTES TO FINANCIAL STATEMENTS FOR THE YEARS ENDED JUNE 30, 2019 AND 2018
29
4. CASH AND CASH EQUIVALENTS AND INVESTMENTS
Cash and Cash Equivalents
The Corporation assumes levels of custodial credit risk for its cash and cash equivalents. Custodial credit risk is the risk that in the event of a financial institution failure, the Corporation’s deposits may not be returned to it. Cash and cash equivalents are exposed to custodial credit risk as follows: a) uninsured and uncollateralized; b) uninsured and collateralized with securities held by the financial institution trust departments in the Corporation’s or Trust’s name; and c) uninsured and collateralized with securities held by financial institution trust departments or agents which are not held in the Corporation’s or Trust’s name.
The State requires that certain uninsured deposits of the State and State Agencies be collateralized. Section 35-10.1-7 of the General Laws of the State, dealing with the collateralization of public deposits, requires all time deposits with maturities of greater than 60 days and all deposits in institutions that do not meet its minimum capital standards as required by its Federal regulator be collateralized. The Corporation does not have any additional policy regarding custodial credit risk for its deposits.
Cash and cash equivalents of the Corporation were exposed to custodial credit risk at June 30, 2019 and 2018 as follows:
Rhode Island Housing and Mortgage Finance Corporation
June 30, 2019 Book Total Bank Balance Insured A C Balance Cash deposits-operating $ 47,627,445 $ 3,109,575 $ 2,188,665 $ 51,928,358 $ 57,226,598 Cash deposits-single family
1,183,634
Cash deposits-multi- family funds 350,349 Cash deposits-escrows 57,982,696 57,982,696 57,982,696 Total deposits 107,144,124 3,109,575 2,188,665 109,911,054 115,209,294 Money market mutual funds 209,479,728 209,479,728
Total Cash and Cash Equivalents $ 316,623,852 $ 3,109,575 $ 2,188,665 $ 109,911,054 $ 324,689,022

RHODE ISLAND HOUSING AND MORTGAGE FINANCE CORPORATION NOTES TO FINANCIAL STATEMENTS FOR THE YEARS ENDED JUNE 30, 2019 AND 2018
30
Rhode Island Housing and Mortgage Finance Corporation - Private Purpose Trust
June 30, 2019 Book Total Bank Balance Insured A C Balance Cash deposits $ 42,840,089 $ 250,000 $ $ 42,590,089 $ 42,840,089 Money market mutual funds
10,695,158 10,695,158
Total Cash and Cash Equivalents $ 53,535,247 $ 250,000 $ - $ 42,590,089 $ 53,535,247
Rhode Island Housing and Mortgage Finance Corporation
June 30, 2018 Book Total Bank Balance Insured A C Balance Cash deposits-operating $ 37,504,919 $ 2,912,832 $ 1,235,297 $ 42,728,407 $ 46,876,536 Cash deposits-single family
1,262,263
Cash deposits-multi- family funds 809,881 378,940 378,940 Cash deposits-escrows 61,572,415 61,572,415 61,572,415 Total deposits 101,149,478 2,912,832 1,614,237 104,300,822 108,827,891 Money market mutual funds
124,478,359 124,478,359
Total Cash and Cash Equivalents $ 225,627,837 $ 2,912,832 $ 1,614,237 $ 104,300,822 $ 233,306,250
Rhode Island Housing and Mortgage Finance Corporation - Private Purpose Trust
June 30, 2018 Book Total Bank Balance Insured A C Balance Cash deposits $ 32,581,798 $ 250,000 $ $ 32,331,798 $ 32,581,798 Money market mutual funds
10,695,158 10,695,158
Total Cash and Cash Equivalents $ 43,276,956 $ 250,000 $ - $ 32,331,798 $ 43,276,956

RHODE ISLAND HOUSING AND MORTGAGE FINANCE CORPORATION NOTES TO FINANCIAL STATEMENTS FOR THE YEARS ENDED JUNE 30, 2019 AND 2018
31
Cash and cash equivalents in the Single-Family Fund and Multi-Family Fund are principally invested in short-term U.S. Government money market funds. At June 30, 2019, $7,598,134 in the Operating Fund, $135,805,745 in the Single-Family Fund, $66,075,849 in the Multi-Family Fund and $10,695,158 in the Trust was invested in short-term U.S. Government money market funds. At June 30, 2018, $9,444,478 in the Operating Fund, $63,967,957 in the Single-Family Fund, $51,065,924 in the Multi-Family Fund and $10,695,158 in the Trust was invested in short-term U.S. Government money market funds. The funds are rated AAA and invested only in U.S. Treasuries, U.S. Agencies and repurchase agreements collateralized by U.S. Treasury and Agency securities. Since the funds offer a floating rate that tends to move with other market U.S. risk-free rates, there is substantially no interest rate risk associated with these short-term investments. Because of the quality of the underlying securities in the asset pool and the institutions involved in the management and custody, there is no material credit or custodial risk in this portfolio. These investments are used as temporary cash management instruments. The fair value of these money market funds reflects the net asset value reported by the fund administrator which is a stable $1 per unit. The underlying investments which are short-term cash equivalent typed investments are generally carried at amortized cost which approximates fair value. There are no withdrawal limitations for the money market mutual funds.
Investments
The first objective of the Corporation in implementing its investment program is preservation of capital. All investments are to be made in a manner to minimize any risk which would jeopardize the safety of the principal invested. The second objective is to maintain sufficient liquidity in a manner that matches cash flow requirements. The third objective is to maximize yield after first satisfying the first two objectives. Other major considerations include diversification of risk and maintenance of credit ratings.
Interest rate risk is the risk that changes in interest rates will adversely affect the fair value of an investment in a debt instrument. As a means of limiting its exposure to fair value losses arising from rising interest rates, the Board of Commissioners’ (the Board) approved investment policy for the Corporation’s Operating Fund limits the maximum maturities or repricing maturities as follows:
Maturity Maximum investment Less than one year 100% One to five years 25% Greater than five years 0%
At June 30, 2019 and 2018, the Operating Fund holds two investments with a maturity of greater than five years. These investments are marketable securities that are pledged as collateral to a lender for borrowings.
While each of the bond resolutions contains investment policies which describe acceptable investments, there are no specific policies for percentage maximum investments with respect to the Single-Family Fund, Multi-Family Fund and the Trust (collectively referred to as the Other Funds). Nonetheless, the Corporation attempts to match asset and liability maturities as closely as practicable. The Corporation manages interest rate risk by considering many variables such as mortgage prepayment frequency and expected asset lives and then utilizing interest sensitivity gap (segmented time distribution) and simulation analysis.

RHODE ISLAND HOUSING AND MORTGAGE FINANCE CORPORATION NOTES TO FINANCIAL STATEMENTS FOR THE YEARS ENDED JUNE 30, 2019 AND 2018
32
At June 30, 2019 and 2018, the distribution of investments by remaining or re-pricing maturity is as follows:
June 30, 2019 1 Year or
Less >1 to 5 Years >5 Years Total Operating Fund: U.S. Government Obligations $ 4,357,128 $ $ 2,310,652 $ 6,667,780 Single-Family Fund: U.S. Government Obligations 157,914,500 157,914,500 U.S. Agency Obligations 16,586,100 16,586,100 Guaranteed Investment Contracts 2,883,495 2,883,495 Total Single-Family Fund - - 177,384,095 177,384,095 Multi-Family Fund: U.S. Government Obligations U.S. Agency Obligations 2,913,825 2,913,825 GICs Total Multi-Family Fund - 2,913,825 - 2,913,825 Escrows* 95,292,178 95,292,178 Subtotal 99,649,306 2,913,825 179,694,747 282,257,878 Trust: U.S. Agency Obligations 48,115 48,115
Total $ 99,697,421 $ 2,913,825 $ 179,694,747 $ 282,305,993

RHODE ISLAND HOUSING AND MORTGAGE FINANCE CORPORATION NOTES TO FINANCIAL STATEMENTS FOR THE YEARS ENDED JUNE 30, 2019 AND 2018
33
June 30, 2018 1 Year or
Less >1 to 5 Years >5 Years Total Operating Fund: U.S. Government Obligations $ 5,547,182 $ $ 2,472,203 $ 8,019,385 Single-Family Fund: U.S. Government Obligations 54,393,221 54,393,221 U.S. Agency Obligations 17,594,885 17,594,885 Guaranteed Investment Contracts 2,883,495 2,883,495 Total Single-Family Fund - - 74,871,601 74,871,601 Multi-Family Fund: U.S. Government Obligations 4,363,358 4,363,358 U.S. Agency Obligations 1,677,166 2,927,637 4,604,803
Total Multi-Family Fund
6,040,524 2,927,637 - 8,968,161 Escrows* 76,934,382 15,707,086 92,641,468 Subtotal 88,522,088 18,634,723 77,343,804 184,500,615 Trust: U.S. Agency Obligations 50,479 50,479
Total $ 88,572,567 $ 18,634,723 $ 77,343,804 $ 184,551,094
* Included in the tables above are escrow funds relating to homeowners and to multi-family
developments. The Corporation is not exposed to interest rate risk relating to escrows since the income and market gains or losses on these investments flow directly into the respective escrow deposit liability accounts.
Included in investments are mortgage-backed securities backed by government-insured single-family mortgage loans originated under the Corporation’s program guidelines. These securities are pass-through securities which require monthly payments by an FHA-approved or Fannie Mae-approved lender and are guaranteed by either the Government National Mortgage Association (GNMA) or FNMA. The securities are subject to interest rate risk due to prepayments before maturity and the fair value of the securities which will vary with the change in market interest rates. The Corporation does not expect to realize a loss on the sale of the securities as they are intended to be held to maturity. The securities are held by the Single-Family and Operating Funds and are carried at fair value totaling $176,811,251 and $74,460,309 at June 30, 2019 and 2018, respectively.
The Corporation categorizes its fair value measurements within the fair value hierarchy established by generally accepted accounting principles. The hierarchy is based on the valuation inputs used to measure the fair value of the asset. Level 1 inputs are quoted prices in active markets for identical assets. Level 2 inputs are observable market-based inputs or unobservable inputs that are corroborated by market data. Level 3 inputs are unobservable inputs that are not corroborated by market data.

RHODE ISLAND HOUSING AND MORTGAGE FINANCE CORPORATION NOTES TO FINANCIAL STATEMENTS FOR THE YEARS ENDED JUNE 30, 2019 AND 2018
34
The Corporation has recurring fair value measurements in the form of fixed income securities (U.S. Treasuries, mortgage-backed securities and obligations of government-sponsored enterprises) as of June 30, 2019 of $101,959,959 in the Operating Fund, $174,500,600 in the Single-Family, $2,913,824 in the Multi-Family Fund, and $48,115 in the Trust that are valued using quoted market prices (Level 1 inputs). Included in Operating Fund investments are fair value measurements for escrow funds relating to homeowners and to multi-family developments. The Corporation does not measure the fair value of guaranteed investment contracts in the amount of $2,883,495 in the Single-Family Fund as of June 30, 2019.
The Corporation had recurring fair value measurements in the same form as of June 30, 2018 of $100,660,853 in the Operating Fund, $71,988,106 in the Single-Family fund, $8,968,161 in the Multi-Family Fund and $50,479 in the Trust that are valued using quoted market prices (Level 1 inputs). Included in Operating Fund investments were fair value measurements for escrow funds relating to homeowners and to multi-family developments. The Corporation does not measure the fair value of guaranteed investment contracts in the amount of $2,883,495 in the Single-Family Fund as of June 30, 2018.
Credit risk is the risk that an issuer or other counterparty to an investment will not fulfill its obligations. The current Board-approved policy requires all investments in the Operating Fund to be rated at least Single A by a nationally recognized rating agency. Each of the bonded resolutions in the Single-Family Fund and Multi-Family Fund contains policies that generally require investments that do not impair the existing ratings on the related bonds. The Trust has no minimum rating requirements.
At June 30, 2019 and 2018, investments, excluding investments relating to escrow accounts for which the credit risk is that of the party for whom the escrow is held rather than that of the Corporation, are rated by Standard & Poor’s or Moody’s Investors Service as follows:
June 30, 2019 Rating AA+/Aaa Unrated
Investment U.S. Agencies GICS Operating Fund $ $ Single-Family Fund 16,586,100 2,883,495 Multi-Family Fund 2,913,825 Trust 48,116 June 30, 2018
Rating AA+/Aaa Unrated Investment U.S. Agencies GICS
Operating Fund $ $ Single-Family Fund 17,594,886 2,883,495 Multi-Family Fund 4,604,804 Trust 50,479

RHODE ISLAND HOUSING AND MORTGAGE FINANCE CORPORATION NOTES TO FINANCIAL STATEMENTS FOR THE YEARS ENDED JUNE 30, 2019 AND 2018
35
Concentration of credit risk is the risk of loss attributed to the magnitude of an investment in a single issuer regardless of its credit history. The Board-approved policy for the Operating Fund limits the amount that may be invested with any one issuer as follows:
United States Government Obligations 100% of portfolio United States Agency Obligations 100% of portfolio Repurchase Agreements 50% of portfolio Collective Short-Term Funds 25% of portfolio All other investments 10% of portfolio
Although there are no specific concentration policies for maximum percentage of investments, the Corporation attempts to diversify as much as possible given the limited number of issuers of AAA-rated investments.
At June 30, 2019 and 2018, all Operating Fund investments were invested in U.S. Government and Agency securities, with no concentration of more than 5% of total Operating Fund investments in any particular agency for which the investments were not secured by the U.S. Government.
At June 30, 2019 and 2018, investment concentrations of 5% or more of each respective fund’s total investments, excluding investments relating to escrow accounts for which the concentration of credit risk is that of the party for whom the escrow is held rather than that of the Corporation, are as follows:
June 30, 2019
Issuer Single-Family
Fund Multi-Family
Fund Trust Federal Home Loan Bank $ $ 826,295 $ Federal Farm Credit Bank 2,087,530 Federal National Mtg. Assoc. 16,586,100 48,116
June 30, 2018
Issuer
Single-Family Fund
Multi-Family Fund Trust
Federal Home Loan Bank $ $ 2,085,390 $ Federal Farm Credit Bank 2,519,414 Federal National Mtg. Assoc. 17,594,886 50,479
Custodial credit risk is the risk that, in the event of the failure of the counterparty, the Corporation will not be able to recover the value of its investments or collateral securities that are in the possession of an outside party. The policy in the Operating Fund is that all purchases are held in a safekeeping or custodial account at an approved safekeeping agent of the Corporation in the Corporation’s name. At June 30, 2019 and 2018, there were no investments in the Operating Fund subject to custodial credit risk.
There are no other specific custodial credit risk policies for the other funds. Most of the Corporation’s investments in other funds are either in Guaranteed Investment Contracts (GICs) in bonded resolutions, which are direct investments not subject to custodial credit risk, or in accounts managed by a financial advisory firm with underlying investments restricted to U.S. Government and Agency securities. At June 30, 2019 and 2018, there were no investments in any of the other funds subject to custodial credit risk.

RHODE ISLAND HOUSING AND MORTGAGE FINANCE CORPORATION NOTES TO FINANCIAL STATEMENTS FOR THE YEARS ENDED JUNE 30, 2019 AND 2018
36
As established in the Board-approved investment policy, the Corporation can enter into interest rate swap agreements and other similar interest rate related derivative instruments to reduce interest rate mismatches between its loan and investment assets and its bond and note liabilities. These types of derivative instruments expose the Corporation to certain risks including credit risk, interest rate risk and counterparty risk. At June 30, 2019 and 2018, the Corporation was not party to any interest rate swap agreements. At June 30, 2019, the Corporation had entered into certain commitments to sell loans, which expose the Corporation to interest rate risk as discussed further in Note 9.
5. ACCOUNTS RECEIVABLE
Accounts receivables for the years ended June 30, 2019 and 2018 were as follows:
2019 2018 Accounts receivable Due from federal government $ 1,313,304 $ 1,342,354 Tax sale receivables 4,890,806 5,527,258 Accounts 6,184,399 4,935,795 Total receivables 12,388,509 11,805,406 Allowance (1,069,495) (1,112,455) Receivables, Net $ 11,319,014 $ 10,692,951
6. OTHER ASSETS
Other assets, net, consisted of the following at June 30, 2019 and 2018:
2019 2018 Real estate owned $ 4,635,785 $ 5,120,698 Capital assets (depreciable), net 8,909,022 9,337,163 Purchased mortgage servicing rights and excess servicing, net
8,223,025
6,103,062
Other assets and control accounts (87,762) (26,491) Total $ 21,680,070 $ 20,534,432
Depreciation expense related to capital assets for the years ended June 30, 2019 and 2018 was $886,461 and $909,112, respectively.
Amortization expense related to purchased mortgage servicing rights for the years ended June 30, 2019 and 2018 was $ 1,146,101 and $910,599, respectively.
Other assets of the Trust consisted of federal program properties totaling $403,137 and $459,500 at June 30, 2019 and 2018, respectively.

RHODE ISLAND HOUSING AND MORTGAGE FINANCE CORPORATION NOTES TO FINANCIAL STATEMENTS FOR THE YEARS ENDED JUNE 30, 2019 AND 2018
37
Capital asset activity for the years ended June 30, 2019 and 2018 is as follows:
Balance July 1, 2018
Additions/ (Deletions)
Balance June 30, 2019
Capital Assets: Furniture $ 1,378,844 $ 42,482 $ 1,421,326 Office equipment 954,213 - 954,213 Computers 7,720,117 197,237 7,917,353 Buildings and improvements 14,914,872 218,601 15,133,474 24,968,046 458,320 25,426,366 Less accumulated depreciation (15,630,883) (886,461) (16,517,344) Capital Assets, Net $ 9,337,163 $ (428,141) $ 8,909,022
Balance July 1, 2017
Additions/ (Deletions)
Balance June 30, 2018
Capital Assets: Furniture $ 1,306,680 $ 72,164 $ 1,378,844 Office equipment 914,440 39,773 954,213 Computers 7,322,315 397,802 7,720,117 Buildings and improvements 14,476,640 438,232 14,914,872 24,020,075 947,972 24,968,046 Less accumulated depreciation (14,721,771) (909,112) (15,630,883) Capital Assets, Net $ 9,298,304 $ 38,859 $ 9,337,163
7. BONDS AND NOTES PAYABLE
The Corporation issues serial bonds and term bonds under various bond resolutions to provide permanent financing for the origination or purchase from participating originating lenders of single-family loans, to provide permanent financing for qualified housing developments, and to provide financing for other purposes.
The Corporation obtains principally first and second mortgage liens on real property financed. The Corporation assigns such liens to the respective bonds when the mortgage loans are permanently financed using bond proceeds. Bonds and notes are secured by related revenues and assets of the respective programs in which the related bonds and notes payable are reported.
The provisions of the applicable trust indentures require or allow for the redemption of bonds by the Corporation through the use of unexpended bond proceeds and excess funds accumulated primarily through the prepayment of mortgage loans. All outstanding bonds are subject to redemption at the option of the Corporation, in whole or in part at any time after certain dates, as specified in the respective bond series indentures. Principal and interest on substantially all bonds is payable semi-annually.

RHODE ISLAND HOUSING AND MORTGAGE FINANCE CORPORATION NOTES TO FINANCIAL STATEMENTS FOR THE YEARS ENDED JUNE 30, 2019 AND 2018
38
The Corporation is required by the IRS as well as its various bond resolutions to comply with certain tax code provisions and bond covenants. The most significant of these include the following: all debt payments must be current, annual reports and budgets must be filed with the trustee, and the Corporation must comply with various restrictions on investment earnings from bond proceeds. The Corporation’s management believes it was in compliance with these covenants as of June 30, 2019.
Bonds and notes payable at June 30, 2019 and 2018 are as follows:
2019 2018 Operating Fund Bonds and Notes: Federal Home Loan Bank Due 2019 to 2026, interest from 0.00% to 2.72% $ 11,175,000 $ 11,675,000 Federal Financing Bank Due 2056 to 2059, interest from 2.239% to 4.640% 142,440,667 113,247,094 General Obligation Bonds Series 2018: Mandatory tender bonds, due 2032, interest at 3.12% 5,000,000 5,000,000 Notes Payable, due 2027 to 2048, interest from 2.75% to 6.25% 16,085,730 14,172,891 Lines of Credit, payable on demand, interest from 3.21% to 3.40% 71,009,000 66,009,000 Total Operating Fund 245,710,397 210,103,985 Single-Family Fund: Homeownership Opportunity Bonds: Series 10-A: Term bonds, due 2022 to 2027, interest at 6.50% 980,000 990,000 Series 15-A: Term bonds, due 2024, interest at 6.85% 380,000 380,000 Series 46-T: Term bonds, due 2034, interest at variable rate 15,000,000 15,000,000 Series 48-T: Term bonds, due 2034, interest at variable rate 15,000,000 15,000,000 Series 58-A: Term bonds, due 2023, interest at 5.05% 955,000 6,620,000 Series 61-A: Serial bonds, due 2020 to 2023, interest from 2.40% to 3.05% 12,265,000 12,265,000
Series 61-B: Term bonds, due 2026 to 2037, interest from 3.45% to 4.10% 6,755,000 6,755,000 Series 61-C: Serial bonds, due 2019 to 2020, interest from 2.90% to 3.00% 4,090,000 13,530,000 Series 62-A: Serial bonds, due 2019 to 2021, interest from 2.50% to 3.125% 1,770,000 3,390,000 Series 62-B: Serial bonds, due 2021 to 2022, interest from 3.125% to 3.25% 4,025,000 4,025,000 Term bonds, due 2024 to 2028, interest from 3.50% to 4.00% 8,930,000 9,615,000 12,955,000 13,640,000

RHODE ISLAND HOUSING AND MORTGAGE FINANCE CORPORATION NOTES TO FINANCIAL STATEMENTS FOR THE YEARS ENDED JUNE 30, 2019 AND 2018
39
2019 2018 Series 62-C: Serial bonds, due 2019 to 2022, interest from 3.20% to 3.875% $ 5,610,000 $ 7,455,000 Term bonds, due 2022, interest at 3.875% 8,245,000 10,280,000 13,855,000 17,735,000 Series 63-A: Term bonds, due 2027 to 2040, interest from 3.50% to 4.00% 10,440,000 11,695,000 Series 63-B: Term bonds, due 2032, interest from 3.80% 1,135,000 1,690,000 Series 63-C: Serial bonds, due 2019 to 2022, interest from 2.85% to 3.50% 4,845,000 6,515,000 Term bonds, due 2025, interest at 3.75% 3,680,000 3,680,000 8,525,000 10,195,000 Series 63-T: Term bonds, due 2042, interest at variable rate 22,455,000 Series 64-T: Serial bonds, due 2018, interest at 2.58% 2,360,000 Term bonds, due 2023 to 2034, interest from 3.00% to 4.00% 26,210,000 32,390,000 26,210,000 34,750,000 Series 65-T: Serial bonds, due 2019 to 2025, interest from 2.563% to 3.886% 22,930,000 27,235,000 Term bonds, due 2029 to 2039, interest from 2.913% to 4.433% 13,770,000 21,190,000 36,700,000 48,425,000 Series 66 A-1: Term bonds, due 2033, interest at 4.00% 12,715,000 16,900,000 Series 66 A-2: Term bonds, due 2032, interest at 4.00% 3,450,000 5,060,000 Series 66-B: Term bonds, due 2045, interest at variable rate 15,000,000 Series 66 C-2: Serial bonds, due 2019 to 2026, interest from 2.05% to 3.65% 15,360,000 17,320,000 Series 67-A: Term bonds, due 2041, interest at 3.55% 5,235,000 5,375,000 Series 67-B: Term bonds, due 2026 to 2046, interest from 2.40% to 3.55% 8,055,000 9,345,000 Series 67-C: Serial bonds, due 2019 to 2027, interest from 1.50% to 3.00% 13,005,000 13,890,000 Term bonds, due 2030 to 2038, interest from 3.25% to 3.50% 13,765,000 16,400,000 26,770,000 30,290,000 Series 68-B: Term bonds, due 2031 to 2046, interest from 3.00% to 3.40% 38,470,000 38,700,000 Series 68-C: Serial bonds, due 2019 to 2026, interest from 1.45% to 2.65% 36,980,000 40,775,000 Term bonds, due 2031 to 2039, interest from 3.15% to 3.50% 85,860,000 95,145,000 122,840,000 135,920,000 Series 69-A: Serial bonds, due 2019 to 2029, interest from 1.90% to 3.50% 13,770,000 Series 69-B: Term bonds, due 2033 to 2048, interest from 3.55% to 4.00% 82,475,000

RHODE ISLAND HOUSING AND MORTGAGE FINANCE CORPORATION NOTES TO FINANCIAL STATEMENTS FOR THE YEARS ENDED JUNE 30, 2019 AND 2018
40
2019 2018 Series 69-T: Serial bonds, due 2019 to 2024, interest from 2.70% to 3.40% $ 7,445,000 $ Series 70: Serial bonds, due 2020 to 2031, interest from 1.40% to 2.55% 31,025,000 Term bonds, due 2034 to 2049, interest from 2.80% to 4.00% 91,725,000 122,750,000 - Unamortized bond premium 10,324,853 6,737,194 Subtotal 636,674,853 515,162,194 Home Funding Bonds: Series 1-A: Serial bonds, due 2019 to 2027, interest from 3.875% to 4.625% 1,955,000 3,180,000 Series 2, Subseries 2A: Term bonds, due 2041, interest at 3.16% 14,155,000 15,920,000 Series 2, Subseries 2B: Term bonds, due 2041, interest at 2.63% 11,880,000 13,380,000 Series 2, Subseries 2C: Term bonds, due 2041, interest at 2.73% 21,930,000 23,950,000 Series 3: Serial bonds, due 2019 to 2020, interest from 3.05% to 3.20% 1,695,000 2,765,000 Term bonds, due 2025, interest at 4.00% 205,000 1,405,000 1,900,000 4,170,000 Series 4: Serial bonds, due 2019 to 2022, interest from 2.90% to 3.50% 2,585,000 3,680,000 Series 5: Term bonds, due 2028 to 2040, interest from 2.75% to 3.45% 25,095,000 26,670,000 Unamortized bond premium 481,656 514,966 Subtotal 79,981,656 91,464,966 Total Single-Family Fund 716,656,509 606,627,160 Multi-Family Fund: Housing Bonds: 2001 Series B-2T: Term bonds, due 2031, interest at variable rate 2,905,000 3,060,000 2003 Series A-2T: Term bonds, due 2034, interest at variable rate 17,330,000 17,985,00 2003 Series B-2T: Term bonds, due 2035, interest at variable rate 8,140,000 8,275,000 Unamortized bond discount (83,235) (87,411) Subtotal 28,291,765 29,232,589 Multi-Family Funding Bonds: 2009 Series A, Subseries 2009A-1: Term bonds, due 2051, interest at 3.01% 51,000,000 51,000,000 2009 Series A, Subseries 2009A-2: Term bonds, due 2051, interest at 2.32% 14,100,000 14,100,000

RHODE ISLAND HOUSING AND MORTGAGE FINANCE CORPORATION NOTES TO FINANCIAL STATEMENTS FOR THE YEARS ENDED JUNE 30, 2019 AND 2018
41
2019 2018 2010 Series A: Serial bonds, due 2019 to 2021, interest from 3.75% to 4.00% $ 1,760,000 $ 2,390,000 Term bonds, due 2025 to 2035, interest from 4.625% to 5.25% 15,550,000 15,550,000 17,310,000 17,940,000 2011 Series A: Term bonds, due 2021 to 2032, interest from 3.125% to 4.625% 4,015,000 4,215,000 Subtotal 86,425,000 87,255,000 Multi-Family Development Bonds: 2010 Series 1:
Serial bonds, due 2019 to 2021, interest from 3.875% to 4.25% 200,000 270,000 2013 Series 1-AB: Serial bonds, due 2019 to 2023, interest from 1.90% to 2.85% 2,295,000 2,720,000 Term bonds, due 2027 to 2048, interest from 3.25% to 4.125% 30,905,000 30,905,000 33,200,000 33,625,000 2013 Series 2-T: Serial bonds, due 2019 to 2023, interest from 2.239% to 3.218% 9,320,000 11,125,000 Term bonds, due 2027 to 2031, interest from 3.768% to 4.456% 17,610,000 17,610,000 26,930,000 28,735,000 2013 Series 3-B: Serial bonds, due 2019 to 2024, interest from 2.25% to 3.85% 210,000 240,000 Term bonds, due 2028, interest at 4.375% 190,000 190,000 400,000 430,000 2013 Series 3-C: Term bonds, due 2028, interest at 4.375% 5,085,000 5,085,000 2013 Series 3-D: Serial bonds, due 2019 to 2024, interest from 2.75% to 4.35% 1,480,000 1,480,000 Term bonds, due 2024, interest at 4.00% 7,665,000 9,220,000 9,145,000 10,700,000 2013 Series 4-T: Serial bonds, due 2018, interest at 2.774% 140,000 Term bonds, due 2023, interest at 4.207% 1,350,000 1,480,000 1,350,000 1,620,000 2014 Series 2-T: Term bonds, due 2019 to 2027, interest from 2.481% to 3.823% 13,215,000 14,640,000 2014 Series 3-A: Term bond, due 2018, interest of 1.35% 430,000 2014 Series 3-B: Serial bonds, due 2019 to 2025, interest from 1.70% to 2.95% 1,500,000 1,685,000 Term bonds, due 2029 to 2049, interest from 3.40% to 4.125% 13,715,000 13,715,000
15,215,000 15,400,000 2016 Series 1-B: Serial bonds, due 2019 to 2026, interest from 1.05% to 2.650% 1,315,000 1,455,000 Term bonds, due 2031 to 2056, interest from 3.15% to 4.10% 15,350,000 15,350,000 16,665,000 16,805,000 2016 Series 1-C: Serial bonds, due 2019 to 2026, interest from 1.35% to 3.00% 3,500,000 3,850,000 Term bonds, due 2031 to 2041, interest from 3.50% to 4.10% 15,170,000 15,170,000 18,670,000 19,020,000 2017 Series 1-A: Term bonds, due 2047, interest at 1.70% 10,885,000 15,560,000 2017 Series 1-B: Term bonds, due 2052, interest at 4.20% 1,710,000 1,725,000

RHODE ISLAND HOUSING AND MORTGAGE FINANCE CORPORATION NOTES TO FINANCIAL STATEMENTS FOR THE YEARS ENDED JUNE 30, 2019 AND 2018
42
2019 2018 2017 Series 2-T: Serial bonds, due 2019 to 2028, interest from 1.834% to 3.639% $ 8,965,000 $ 9,770,000 Term bonds, due 2032 interest at 4.069% 3,900,000 3,900,000 12,865,000 13,670,000 2017 Series 3-T: Term bonds, due 2020, interest at 0.00% 7,600,000 7,600,000 2017 Series 4-A: Term bonds, due 2056, interest from 1.85% to 1.95% 17,585,000 2017 Series 4-B: Serial bonds, due 2020 to 2028, interest from 1.85% to 3.05% 2,725,000 2,725,000 Term bonds, due 2032 to 2037, interest from 3.35% to 3.80% 31,620,000 31,620,000 34,345,000 34,345,000 Unamortized bond discount (35,807) (37,720) Subtotal 207,444,193 237,207,280 Multi-Family Mortgage Revenue Bonds and Notes: Series 2006 (University Heights Project): Term bonds, due 2039, interest at variable rate 26,700,000 26,700,000 Series 2006 (Sutterfield Project): Term bonds, due 2039, interest at variable rate 7,000,000 7,000,000 Series 2006 (The Groves): Term bonds, due 2040, interest at variable rate 27,350,000 Series 2015 (Charles Place): Note payable, due 2045, interest at 4.16% 24,511,077 24,894,817 Series 2016 (EPN): Note payable, due 2033, interest at 4.07% 15,528,121 15,700,000 Note payable, due 2019, interest at variable rate 2,328,597 15,528,121 18,028,597 Series 2017 (Colony House): Note payable, due 2050, interest at variable rate 13,864,500 13,864,500
Series 2017 (Lippitt Mill Apartments): Note payable, due 2035, interest at variable rate 6,568,479 3,482,292 Series 2017A-B (Oxford Place Gardens): Note Payable, due 2020, interest at variable rate 8,017,617 3,065,604 Note Payable bond, due 2035, interest at variable rate 3,132,300 3,132,300 11,149,917 6,197,904 Series 2018 (Curtis Arms): Note payable, due 2051, interest at 4.99% 14,000,000 Subtotal 119,322,094 127,518,110 Total Multi-Family Fund 441,483,052 481,212,979 Total Bonds and Notes Payable $ 1,403,849,958 $ 1,297,944,124

RHODE ISLAND HOUSING AND MORTGAGE FINANCE CORPORATION NOTES TO FINANCIAL STATEMENTS FOR THE YEARS ENDED JUNE 30, 2019 AND 2018
43
The Operating Fund’s lines of credit were established with financial institutions primarily to make funds available for the origination, or purchase from participating originating lenders, of single-family loans prior to the time such loans are funded by bond proceeds received by the issuance of bonds under the Single-Family Fund. At June 30, 2019, the Corporation may borrow up to a maximum of $110,000,000 under various revolving loan agreements expiring between August 2019 and January 2020. Borrowings under the lines of credit are payable on demand and are unsecured. One of the lines of credit, in the outstanding amount of $4,000,000, has a variable interest rate, which was 3.398% at June 30, 2019. The outstanding remaining lines of credit of $67,009,000 have fixed rates which range from 3.215% - 3.402% at June 30, 2019. The Corporation has combined additional availability on the various lines of credit facilities in the amount of $37,591,000 at June 30, 2019.
The Corporation entered into a standby letter of credit agreement with a financial institution whereby the financial institution guarantees payment not exceeding $1,400,000 to the beneficiary in the event of a request for drawing made by the beneficiary.
The schedule below includes amounts required for debt service sinking funds for each fiscal year relating to the respective bonds and notes as of June 30, 2019 (dollars in thousands):
Operating Fund Single-Family Multi-Family Bonds/Notes Fund Bonds Fund Bonds/Notes Principal Interest Principal Interest Principal Interest 2020 $ 68,393 $ 5,980 $ 31,635 $ 25,700 $ 17,348 $ 15,211 2021 1,458 5,556 35,845 25,514 18,618 14,800 2022 1,526 5,512 34,980 24,500 10,625 14,326 2023 1,597 5,467 31,220 15,158 11,315 13,103 2024 6,672 5,344 26,595 22,516 11,800 13,611 2025-2029 25,638 24,665 132,675 100,482 57,385 61,810 2030-2034 17,331 20,744 139,150 78,662 50,985 52,199 2035-2039 21,806 17,038 135,230 19,762 108,745 42,151 2040-2044 20,202 13,819 66,840 35,268 36,085 29,360 2045-2049 26,380 10,405 68,420 13,242 56,053 20,493 2050-2054 30,310 6,125 3,260 100 59,833 3,774 2055-2059 24,398 1,444 2,810 198 $ 245,711 $ 122,099 $ 705,850 $ 360,904 $ 441,602 $ 281,036
Homeownership Opportunity Bonds Series 46-T, 48-T, and Housing Bonds 2001 Series B-2T, 2003 Series A-2T and 2003 Series B-2T bear interest at taxable rates established monthly or quarterly, which range from 2.822% - 2.912% at June 30, 2019. Certain Multi-Family Mortgage Revenue Bonds bear interest at tax-exempt rates established weekly, which were 2.080% at June 30, 2019. One Multi-Family Mortgage Revenue Bond bears interest at a variable rate established monthly, bearing a rate of 3.586% at June 30, 2019. One bond bears interest daily with a rate of 4.154% at June 30, 2019.

RHODE ISLAND HOUSING AND MORTGAGE FINANCE CORPORATION NOTES TO FINANCIAL STATEMENTS FOR THE YEARS ENDED JUNE 30, 2019 AND 2018
44
Debt service requirements on long-term debt at June 30, 2019 are as follows (dollars in thousands):
Business-Type Activities
Bonds Notes from Direct
Borrowings and Direct Placements
Principal Interest Principal Interest
2020 $ $ 156 $ 75,024 $ 2,366 2021 156 444 758 2022 156 465 737 2023 156 487 715 2024 5,000 78 510 692
2025-2029 18,125 3,070 2030-2034 3,659 2,287 2035-2039 3,742 1,363 2040-2044 2,642 472 2045-2049 772 41
Total $ 5,000 $ 702 $ 105,870 $ 12,500
Bonds and notes payable activity for the year ended June 30, 2019 is as follows:
Beginning Balance Additions Reductions Ending Balance
Bonds and notes payable:
General obligation bonds $ 5,000,000 $ 5,000,000 $ (5,000,000) $ 5,000,000 Unsecured notes 66,009,000 317,000,000 (312,000,000) 71,009,000 Secured notes 139,094,985 35,535,181 (4,928,771) 169,701,395 Revenue bonds 1,087,840,139 248,478,199 (178,178,775) 1,158,139,563 $ 1,297,944,124 $ 606,013,380 $ (500,107,546) $ 1,403,849,958
Bonds and notes payable activity for the year ended June 30, 2018 is as follows:
Beginning Balance Additions Reductions Ending Balance
Bonds and notes payable:
General obligation bonds $ 5,000,000 $ $ $ 5,000,000 Unsecured notes 61,009,000 319,000,000 (314,000,000) 66,009,000 Secured notes 105,533,249 41,640,000 (8,078,264) 139,094,985 Revenue bonds 1,164,995,908 61,610,196 (138,765,965) 1,087,840,139 $ 1,336,538,157 $ 422,250,196 $ (460,844,229) $ 1,297,944,124

RHODE ISLAND HOUSING AND MORTGAGE FINANCE CORPORATION NOTES TO FINANCIAL STATEMENTS FOR THE YEARS ENDED JUNE 30, 2019 AND 2018
45
Changes in long-term obligations relating to direct placements for the year ended June 30, 2019 are as follows:
Beginning Balance
Additions
Reductions
Ending Balance
Due within One Year
Business-Type Activities: General obligations bonds $ 5,000,000 $ 5,000,000 $ (5,000,000) $ 5,000,000 $ Notes from direct borrowings and direct placements
99,456,892
322,235,181
(315,822,343)
105,869,730
75,024,181
Total $ 104,456,892 $ 327,235,181 $ (320,822,343) $ 110,869,730 $ 75,024,181
The agreements related to the notes from direct borrowings and direct placements of $105,869,730 include certain provisions and results in the event of default. For the various lines of credit, which total $82,184,000, the interest rate could increase up to a maximum of 5% over the current rate and the outstanding lines may become due immediately at the discretion of the respective lenders. For the notes payable, which total $16,085,730, the principal and related interest would become due immediately. The remaining $7,600,000 is a direct placement bond that does not contain any default provisions.
8. COMMITMENTS AND CONTINGENCIES
The Corporation is party to financial instruments with off-balance-sheet risk in connection with its commitments to provide financing. Such commitments expose the Corporation to credit risk in excess of the amounts recognized in the accompanying combining statements of net position. The Corporation’s exposure to credit loss in the event of nonperformance by the borrowers is represented by the contractual amount of such instruments. The Corporation uses the same credit policies in making commitments as it does for on-balance-sheet instruments.
Total credit exposure as a result of loan commitments at June 30, 2019 is as follows:
Operating Fund $ 89,884,130 Trust 2,382,364Multifamily 2,455,16 Total $ 94,721,654
Commitments to extend credit are agreements to lend to a borrower as long as there is no violation of any condition established in the contract. Commitments generally have fixed expiration dates or other termination clauses. The Corporation evaluates each borrower’s creditworthiness on a case-by-case basis. Interest rates on approved loan commitments are principally fixed rates.
The Corporation has entered into contracts with multiple developments under the Neighborhood Opportunities Program to fund projects over the next seven years for a total of $6,445,531, subject to the availability of funds. As of June 30, 2019, $4,719,852 has been paid under these contracts.

RHODE ISLAND HOUSING AND MORTGAGE FINANCE CORPORATION NOTES TO FINANCIAL STATEMENTS FOR THE YEARS ENDED JUNE 30, 2019 AND 2018
46
The Corporation is party to certain claims and lawsuits which are being contested, certain of which the Corporation and respective legal counsel are unable to determine the likelihood of an unfavorable outcome or the amount or range of potential loss. In the opinion of management, the ultimate liability with respect to these actions and claims will not have a material adverse effect on either the financial position or the results of operations of the Corporation.
The Corporation is exposed to various risks of loss related to torts; theft of, damage to, or destruction of assets; errors or omissions; injuries to employees; or acts of God for which the Corporation carries commercial insurance. Neither the Corporation nor its insurers have settled any claims which exceeded the Corporation’s insurance coverage in any of the last three fiscal years. There have been no significant reductions in any insurance coverage from amounts in the prior year. The Corporation also is self-insured for unemployment compensation, and no accrual has been recorded in the accompanying financial statements for claims expected to arise from services rendered on or before June 30, 2019, because the Corporation officials are of the opinion that, based on prior experience, such claims will not be material.
9. DERIVATIVE INSTRUMENTS
In July 2013, the Corporation converted its loan funding platform from a mortgage revenue bond program to a program primarily financed through the sale of whole loans and mortgage-backed securities guaranteed by FNMA and GNMA as to timely payment of principal and interest. The securities represent pools of qualified first mortgage loans originated by the Corporation approved lenders. Under this program, the Corporation periodically enters into forward contracts to sell the securities to investors before the securities are ready for delivery (referred to as a to-be-announced or TBA Mortgage-Backed Security Contract). The Corporation enters into TBA Mortgage-Backed Security Contracts to hedge the interest rate risk for loan commitments made to originating mortgage lenders. TBA Mortgage-Backed Security Contracts are derivative instruments due to one or more of the following factors that are not designated at the time the Corporation and the investor enter into the transaction: settlement factors; the reference rates or interest rates the security will bear; and notional amounts in the form of the principal amount of the future Mortgage-Backed Securities. In addition, payment to the Corporation by the investor is not required until the investor receives the security, enabling the investor to take a position on interest rates without making a payment. Finally, the TBA Mortgage-Backed Security Contracts may be “net settled” because neither party is required to deliver or purchase an asset to settle the TBA Mortgage-Backed Securities Contract.
At June 30, 2019, TBA Mortgage-Backed Securities Contracts with a total notional amount of $14,972,640 and fair market values totaling $15,552,705 were outstanding, resulting in a hedging instrument of $580,064. These contracts are valued using quoted market prices (Level 1 inputs) and the fair values of such contracts are included in the combining statements of net position as deferred outflows of resources. In addition, the Corporation entered into commitments to sell loans to Fannie Mae with a total notional amount of $17,000,000 and fair market values totaling $17,524,051, resulting in a hedging instrument of $524,051. These contracts are valued using quoted market prices (Level 1 inputs) and the fair values of such contracts are also included in the combining statements of net position as deferred outflows of resources.
At June 30, 2018, TBA Mortgage-Backed Securities Contracts with a total notional amount of $80,000,000 and fair market values totaling $83,183,753 were outstanding, resulting in a hedging instrument of $3,183,753. These contracts are valued using quoted market prices (Level 1 inputs) and the fair values of such contracts are included in the combining statements of net position as deferred

RHODE ISLAND HOUSING AND MORTGAGE FINANCE CORPORATION NOTES TO FINANCIAL STATEMENTS FOR THE YEARS ENDED JUNE 30, 2019 AND 2018
47
outflows of resources. In addition, the Corporation entered into commitments to sell loans to Fannie Mae with a total notional amount of $32,460,000 and fair market values totaling $33,455,600 resulting in a hedging instrument of $995,600. These contracts are valued using quoted market prices (Level 1 inputs) and the fair values of such contracts are also included in the combining statements of net position as deferred outflows of resources.
10. EMPLOYEE BENEFITS
Employee Benefit Plan
The Corporation has adopted an employee retirement plan created in accordance with Internal Revenue Code Section 401(a). The Corporation’s 401(a) money Purchase Pension Plan (the Plan) is a defined contribution plan, administered by ICMA Retirement Corporation. Regular full-time employees who meet certain requirements as to length of service are eligible. The Corporation contributes a set percentage of an employee’s annual eligible compensation to the Plan. The contribution requirements, and benefit provisions, are established and may be amended by management of the Corporation along with the Board of Commissioners. Contributions to the Plan for the years ended June 30, 2019 and 2018 totaled $668,529 and $1,413,591, respectively. The assets of the Plan were placed under a separate trust agreement for the benefit of the applicable employees and, therefore, are neither an asset nor a liability of the Corporation.
Post-Employment Healthcare Plan
The Rhode Island Housing Retiree Healthcare Plan (RIHRHP) is a single-employer defined benefit healthcare plan administered by the Corporation. RIHRHP provides medical insurance benefits to eligible employees who retire from active full-time employment based on years of service and age.
RIHRHP currently pays for postemployment healthcare benefits on a pay-as-you-go basis. As of June 30, 2019, RIHRHP has not established a trust fund to irrevocably segregate assets to fund liability associated with the postemployment benefits, which would require the reporting of a trust fund in accordance with GASB guidelines. Administration costs are financed from current operations. RIHRHP does not issue a stand-alone financial report.
Employees become eligible at 28 years of service or at age 59½ with 10 years of service. RIHRHP pays a percentage of the cost of insurance, ranging from 50% to 100%, based on a combination of years of service and age. The benefit provisions are established and may be amended by management of the Corporation along with the Board of Commissioners.
Membership in the plan consisted of the following at June 30, 2017, the date of the last actuarial valuation.
Inactive Plan Members or Beneficiaries Currently Receiving Benefits 24 Inactive Plan Member Entitled to But Not Yet Receiving Benefits 0 Active Plan Members 225 Total Plan Members 249
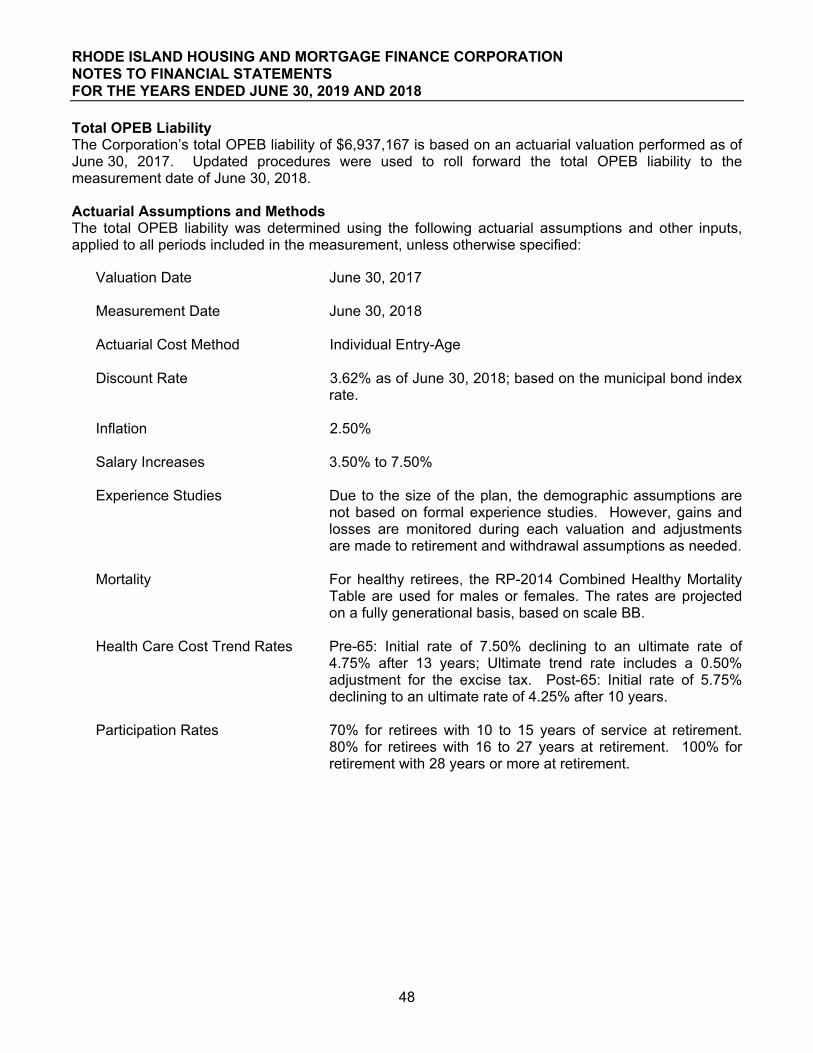
RHODE ISLAND HOUSING AND MORTGAGE FINANCE CORPORATION NOTES TO FINANCIAL STATEMENTS FOR THE YEARS ENDED JUNE 30, 2019 AND 2018
48
Total OPEB Liability The Corporation’s total OPEB liability of $6,937,167 is based on an actuarial valuation performed as of June 30, 2017. Updated procedures were used to roll forward the total OPEB liability to the measurement date of June 30, 2018.
Actuarial Assumptions and Methods The total OPEB liability was determined using the following actuarial assumptions and other inputs, applied to all periods included in the measurement, unless otherwise specified:
Valuation Date June 30, 2017 Measurement Date June 30, 2018 Actuarial Cost Method Individual Entry-Age Discount Rate 3.62% as of June 30, 2018; based on the municipal bond index
rate. Inflation 2.50% Salary Increases 3.50% to 7.50% Experience Studies Due to the size of the plan, the demographic assumptions are
not based on formal experience studies. However, gains and losses are monitored during each valuation and adjustments are made to retirement and withdrawal assumptions as needed.
Mortality For healthy retirees, the RP-2014 Combined Healthy Mortality
Table are used for males or females. The rates are projected on a fully generational basis, based on scale BB.
Health Care Cost Trend Rates Pre-65: Initial rate of 7.50% declining to an ultimate rate of
4.75% after 13 years; Ultimate trend rate includes a 0.50% adjustment for the excise tax. Post-65: Initial rate of 5.75% declining to an ultimate rate of 4.25% after 10 years.
Participation Rates 70% for retirees with 10 to 15 years of service at retirement.
80% for retirees with 16 to 27 years at retirement. 100% for retirement with 28 years or more at retirement.

RHODE ISLAND HOUSING AND MORTGAGE FINANCE CORPORATION NOTES TO FINANCIAL STATEMENTS FOR THE YEARS ENDED JUNE 30, 2019 AND 2018
49
Schedule of Changes in Total OPEB Liability and Related Ratios Fiscal Year Ended June 30, 2019
FY 2019 Total OPEB liability Service cost $ 537,100 Interest on total OPEB liability Difference between expected and actual experience of the total OPEB liability
233,195
4,859 Changes in assumptions (72,478) Benefit payments (94,763) Net change in total OPEB liability 607,913 Total OPEB liability - beginning 6,329,254 Total OPEB liability - ending $ 6,937,167 Covered payroll $ 16,562,167 Total OPEB liability as a percentage of covered payroll
41.89%
Changes of assumptions reflect a change in the discount rate from 3.56% as of June 30, 2017 to 3.62% as of June 30, 2018.
The total OPEB liability of $6,937,167 is included with accounts payable and accrued liabilities in the Operating Fund.
Sensitivity of Total OPEB Liability to the Discount Rate Assumption
Regarding the sensitivity of the total OPEB liability to changes in the discount rate, the following presents the plan’s total OPEB liability, calculated using the current discount rate as well as what the plan’s total OPEB liability would be if it were calculated using a discount rate that is one percentage point lower or one percentage point higher:
Current Discount 1% Decrease Rate 1% Increase (2.62%) (3.62%) (4.62%) Total OPEB Liability $ 8,283,218 $ 6,937,167 $ 5,862,506

RHODE ISLAND HOUSING AND MORTGAGE FINANCE CORPORATION NOTES TO FINANCIAL STATEMENTS FOR THE YEARS ENDED JUNE 30, 2019 AND 2018
50
Sensitivity of Total OPEB Liability to the Healthcare Cost Trend Rate Assumption
Regarding the sensitivity of the total OPEB liability to changes in the healthcare cost trend rates, the following presents the plan’s total OPEB liability, calculated using the assumed trend rates as well as what the plan’s total OPEB liability would be if it were calculated using a trend rate that is one percent lower or one percent higher:
Current Discount 1% Decrease Rate 1% Increase (6.50%) (7.50%) (8.50%) Total OPEB Liability $ 5,555,809 $ 6,937,167 $ 8,798,626
Deferred Outflows and Deferred Inflows Related to OPEB
For the fiscal year ended June 30, 2019, RIHRHP recognized OPEB expense of $697,099. At June 30, 2019, RIHRHP reported deferred outflows of resources and deferred inflows of resources related to OPEB from the following sources:
Deferred Outflows Deferred Inflows of Resources of Resources Difference between expected and actual experience $ 4,426 $
Changes in assumptions 685,684 Contributions subsequent to the measurement date
134,837
Total $ 139,263 $ 685,684
As of June 30, 2018:
Deferred Outflows Deferred Inflows of Resources of Resources Difference between expected and actual experience $ $
Changes in assumptions 686,835 Contributions subsequent to the measurement date
94,763
Total $ 94,763 $ 686,835
Amounts reported as deferred outflows of resources related to contributions after the measurement date will be recognized as a reduction of the total OPEB liability in the subsequent year.

RHODE ISLAND HOUSING AND MORTGAGE FINANCE CORPORATION NOTES TO FINANCIAL STATEMENTS FOR THE YEARS ENDED JUNE 30, 2019 AND 2018
51
Amounts reported as deferred outflows of resources and deferred inflows of resources related to OPEB will be recognized in OPEB expenses as follows: Deferred Outflows and Deferred Inflows to be Recognized in Future OPEB Expense
Year Ending June 30 Net Deferred
Outflows/(Inflows) 2020 $ (73,196) 2021 (73,196) 2022 (73,196) 2023 (73,196) 2024 (73,196) Thereafter (315,278) Total $ (681,258)
11. SUBSEQUENT EVENTS
The Corporation has instructed its trustee to redeem the following bonds outstanding:
Date of Call Principal Program Outstanding August 5, 2019 Multi-Family Development Bonds $ 10,005,000 October 1, 2019 Multi-Family Development Bonds 10,885,000 October 1, 2019 Homeownership Opportunity Bonds 12,530 000 October 1, 2019 Home Funding Bonds 4,525,000
12. PRIOR PERIOD ADJUSTMENT AND RESTATEMENT
The following restatements were recorded to the beginning net position of the governmental activities as a result of implementation of GASB Statement No. 75, Accounting and Financial Reporting for Postemployment Benefits Other than Pensions:
Net Position
Balance as previously reported June 30, 2017 $ (313,371,301)
Eliminate Net OPEB Obligation reported per GASB No. 45 (4,729,231) Record Total OPEB Liability per GASB No. 75 6,346,529 Record Deferred Outflow per GASB No. 75 (76,424)
Balance July 1, 2017, as Restated $ (311,830,427)

RHODE ISLAND HOUSING AND MORTGAGE FINANCE CORPORATION(A COMPONENT UNIT OF THE STATE OF RHODE ISLAND)SCHEDULE OF CHANGES IN TOTAL OPEB LIABILITY AND RELATED RATIOS FOR THE LAST TWO FISCAL YEARS
2019 2018
Total OPEB liability: Service cost $ 537,100 $ 619,903 Interest 233,195 193,253 Changes of benefit terms Differences between expected and actual experience 4,859 Changes of assumptions and other inputs (72,478) (754,007) Benefit payments (94,763) (76,424)
Net change in total OPEB liability 607,913 (17,275) Total OPEB liability - beginning 6,329,254 6,346,529
Total OPEB Liability - Ending $ 6,937,167 $ 6,329,254
Covered payroll $ 16,562,167 $ 13,634,804
Total OPEB liability as a percentage of covered-employee payroll 41.89% 46.42%
* This schedule is intended to show information for ten years. Additional years’ information will be displayed as it becomes available.
52

RHODE ISLAND HOUSING AND MORTGAGE FINANCE CORPORATION(A COMPONENT UNIT OF THE STATE OF RHODE ISLAND)COMBINING STATEMENTS OF NET POSITION - SINGLE-FAMILY FUNDJUNE 30, 2019 AND 2018
2019 2018 2019 2018
Assets:Loans receivable $ 541,001,357 $ 587,057,676 $ 30,632,952 $ 34,975,553 Less allowance for loan losses (10,000,000) (9,800,000)
Loans receivable, net 531,001,357 577,257,676 30,632,952 34,975,553
Investments 130,663,001 20,044,445 46,721,094 54,827,156 Accrued interest-loans 1,903,956 2,069,075 106,245 117,018 Accrued interest-investments 418,098 89,260 150,807 175,747 Cash and cash equivalents 126,969,078 57,658,711 10,020,301 7,571,510 Other assets, net 3,014,286 3,673,528 15,272 20,360 Interfund receivable (payable) (390,622) 18,597 18,597
Total assets 793,579,154 660,792,695 87,665,268 97,705,941
Deferred Outflows of Resources:Loan origination costs 4,241 4,497
Total deferred outflows of resources 4,241 4,497 - -
Combined Assets and Deferred Outflows of Resources $ 793,583,395 $ 660,797,192 $ 87,665,268 $ 97,705,941
Liabilities and Net Position
Liabilities:Bonds and notes payable $ 636,674,853 $ 515,162,194 $ 79,981,656 $ 91,464,966 Accrued interest payable on bonds and notes 6,788,312 4,229,659 711,581 775,231 Fees, net 133,118 149,735
Total liabilities 643,596,283 519,541,588 80,693,237 92,240,197
Net Position:Net position, restricted 149,987,112 141,255,604 6,972,031 5,465,744
Total Liabilities and Net Position $ 793,583,395 $ 660,797,192 $ 87,665,268 $ 97,705,941
Homeownership Opportunity Bond Program Home Funding Bond Program
53

RHODE ISLAND HOUSING AND MORTGAGE FINANCE CORPORATION (A COMPONENT UNIT OF THE STATE OF RHODE ISLAND) COMBINING STATEMENTS OF NET POSITION - SINGLE-FAMILY FUND JUNE 30, 2019 AND 2018
2019 2018
Assets:Loans receivable $ 571,634,309 $ 622,033,229 Less allowance for loan losses (10,000,000) (9,800,000)
Loans receivable, net 561,634,309 612,233,229
Investments 177,384,095 74,871,601 Accrued interest-loans 2,010,201 2,186,093 Accrued interest-investments 568,905 265,007 Cash and cash equivalents 136,989,379 65,230,221 Other assets, net 3,029,558 3,693,888 Interfund receivable (payable) (372,025) 18,597
Total assets 881,244,422 758,498,636
Deferred Outflows of Resources:Loan origination costs 4,241 4,497
Total deferred outflows of resources 4,241 4,497
Combined Assets and Deferred Outflows of Resources $ 881,248,663 $ 758,503,133
Liabilities and Net Position:
Liabilities:Bonds and notes payable $ 716,656,509 $ 606,627,160 Accrued interest payable on bonds and notes 7,499,893 5,004,890 Fees, net 133,118 149,735
Total liabilities 724,289,520 611,781,785
Net Position:Net position, restricted 156,959,143 146,721,348
Total Liabilities and Net Position $ 881,248,663 $ 758,503,133
Single-Family Fund Totals
54

RHODE ISLAND HOUSING AND MORTGAGE FINANCE CORPORATION (A COMPONENT UNIT OF THE STATE OF RHODE ISLAND) COMBINING STATEMENTS OF REVENUES, EXPENSES AND CHANGES IN NET POSITION - SINGLE-FAMILY FUNDFOR THE YEARS ENDED JUNE 30, 2019 AND 2018
2019 2018 2019 2018
Operating Revenues:Interest income on loans $ 24,861,496 $ 27,188,764 $ 1,309,973 $ 1,485,421 Earnings on investments:
Interest on investments 3,495,900 1,279,582 2,157,167 2,468,602 Net increase (decrease) in fair value of investments 5,593,947 57,589 613,370 (1,980,347)
Total operating revenues 33,951,343 28,525,935 4,080,510 1,973,676
Operating Expenses:Interest expense 19,357,455 16,695,756 2,564,090 3,100,906 Provision for loan losses 406,784 773,656 REO expenditures 218,219 (171,043) 6,201 Bond issuance costs 2,054,844 5,045 Depreciation and amortization of other assets 1,908 3,688 5,088 5,088 Loan costs 256 260
Total operating expenses 22,039,466 17,302,317 2,574,223 3,112,195
Operating Income (Loss) 11,911,877 11,223,618 1,506,287 (1,138,519)
Transfers In (Out) (3,180,369)
Total Change in Net Position 8,731,508 11,223,618 1,506,287 (1,138,519)
Net Position - Beginning of Year 141,255,604 130,031,986 5,465,744 6,604,263
Net Position - End of Year $ 149,987,112 $ 141,255,604 $ 6,972,031 $ 5,465,744
Home Funding Bond Program
Homeownership Opportunity Bond Program
55

RHODE ISLAND HOUSING AND MORTGAGE FINANCE CORPORATION (A COMPONENT UNIT OF THE STATE OF RHODE ISLAND) COMBINING STATEMENTS OF REVENUES, EXPENSES AND CHANGES IN NET POSITION - SINGLE-FAMILY FUNDFOR THE YEARS ENDED JUNE 30, 2019 AND 2018
2019 2018
Operating Revenues:Interest income on loans $ 26,171,469 $ 28,674,185 Earnings on investments:
Interest on investments 5,653,067 3,748,184 Net increase (decrease) in fair value of investments 6,207,317 (1,922,758)
Total operating revenues 38,031,853 30,499,611
Operating Expenses:Interest expense 21,921,545 19,796,662 Provision for loan losses 406,784 773,656 REO expenditures 218,219 (164,842) Bond issuance costs 2,059,889 - Depreciation and amortization of other assets 6,996 8,776 Loan costs 256 260
Total operating expenses 24,613,689 20,414,512
Operating Income (Loss) 13,418,164 10,085,099
Transfers In (Out) (3,180,369) -
Total Change in Net Position 10,237,795 10,085,099
Net Position - Beginning of Year 146,721,348 136,636,249
Net Position - End of Year $ 156,959,143 $ 146,721,348
Single-Family Fund Total
56

RHODE ISLAND HOUSING AND MORTGAGE FINANCE CORPORATION(A COMPONENT UNIT OF THE STATE OF RHODE ISLAND)COMBINING STATEMENTS OF NET POSITION - MULTI-FAMILY FUNDJUNE 30, 2019 AND 2018
2019 2018 2019 2018
Assets:Loans receivable $ $ 31,740,115 $ 32,340,847 Less allowance for loan losses
Loans receivable, net - - 31,740,115 32,340,847
Investments 630,766 1,774,486 Accrued interest-loans 197,694 204,721 Accrued interest-investments 1,618 9,090 16,417 Cash and cash equivalents 5,605,441 5,436,916 Interfund receivable (payable)
Total Assets $ - $ 1,618 $ 38,183,106 $ 39,773,387
Liabilities and Net Position
Liabilities:Bonds and notes payable $ $ $ 28,291,765 $ 29,232,589 Accrued interest payable on bonds and notes (76,611) (13,487) Accounts payable and accrued liabilitiesEscrow deposits
Total liabilities - - 28,215,154 29,219,102
Net Position:Net position, restricted - 1,618 9,967,952 10,554,285
Total Liabilities and Net Position $ - $ 1,618 $ 38,183,106 $ 39,773,387
Multi-Family Housing Bond Housing Bond Program
57

RHODE ISLAND HOUSING AND MORTGAGE FINANCE CORPORATION(A COMPONENT UNIT OF THE STATE OF RHODE ISLAND)COMBINING STATEMENTS OF NET POSITION - MULTI-FAMILY FUNDJUNE 30, 2019 AND 2018
2019 2018 2019 2018
Assets:Loans receivable $ 119,322,094 $ 127,529,895 $ 86,496,193 $ 87,317,844 Less allowance for loan losses
Loans receivable, net 119,322,094 127,529,895 86,496,193 87,317,844
Investments Accrued interest-loans 383,994 424,477 460,420 464,798 Accrued interest-investments Cash and cash equivalents 5,195,653 4,839,424 9,593,513 8,962,727 Interfund receivable (payable)
Total Assets $ 124,901,741 $ 132,793,796 $ 96,550,126 $ 96,745,369
Liabilities and Net Position
Liabilities:Bonds and notes payable $ 119,322,094 $ 127,518,110 $ 86,425,000 $ 87,255,000 Accrued interest payable on bonds and notes 352,121 697,818 719,952 727,130 Accounts payable and accrued liabilitiesEscrow deposits 5,195,653 4,889,950
Total liabilities 124,869,868 133,105,878 87,144,952 87,982,130
Net Position:Net position, restricted 31,873 (312,082) 9,405,174 8,763,239
Total Liabilities and Net Position $ 124,901,741 $ 132,793,796 $ 96,550,126 $ 96,745,369
Multi-Family Mortgage Revenue Multi-Family Funding Bond
58

RHODE ISLAND HOUSING AND MORTGAGE FINANCE CORPORATION(A COMPONENT UNIT OF THE STATE OF RHODE ISLAND)COMBINING STATEMENTS OF NET POSITION - MULTI-FAMILY FUNDJUNE 30, 2019 AND 2018
Multi-Family Development Bonds2019 2018 2019 2018
Assets:Loans receivable $ 219,408,590 $ 261,157,784 $ 456,966,992 $ 508,346,370 Less allowance for loan losses
Loans receivable, net 219,408,590 261,157,784 456,966,992 508,346,370
Investments 2,283,058 7,193,675 2,913,824 8,968,161 Accrued interest-loans 1,183,186 1,361,418 2,225,294 2,455,414 Accrued interest-investments 5,790 23,408 14,880 41,443 Cash and cash equivalents 46,031,591 32,636,739 66,426,198 51,875,806 Interfund receivable (payable) 375,775 (5,500) 375,775 (5,500)
Total Assets $ 269,287,990 $ 302,367,524 $ 528,922,963 $ 571,681,694
Liabilities and Net Position
Liabilities:Bonds and notes payable $ 207,444,193 $ 237,207,280 $ 441,483,052 $ 481,212,979 Accrued interest payable on bonds and notes 1,738,133 1,885,973 2,733,595 3,297,434 Accounts payable and accrued liabilities 88,438 75,926 88,438 75,926 Escrow deposits 11,790,000 5,195,653 16,679,950
Total liabilities 209,270,764 250,959,179 449,500,738 501,266,289
Net Position:Net position, restricted 60,017,226 51,408,345 79,422,225 70,415,405
Total Liabilities and Net Position $ 269,287,990 $ 302,367,524 $ 528,922,963 $ 571,681,694
Multi-Family Fund Total
59

RHODE ISLAND HOUSING AND MORTGAGE FINANCE CORPORATION(A COMPONENT UNIT OF THE STATE OF RHODE ISLAND)COMBINING STATEMENTS OF REVENUES, EXPENSES AND CHANGES IN NET POSITION - MULTI-FAMILY FUNDFOR THE YEARS ENDED JUNE 30, 2019 AND 2018
2019 2018 2019 2018
Operating Revenues:Interest income on loans $ $ $ 2,240,186 $ 2,310,413
Earnings on investments:Interest on investments (1,618) 915 195,500 115,879 Net decrease in fair value of investments (35,447) (108,251)
Total operating revenues (1,618) 915 2,400,239 2,318,041
Operating expenses:Interest expense 752,991 426,504 Other administrative expenses 33,581 34,661 Arbitrage rebate 134,712 Bond issuance costsLoan costs 29,180 74,380
Total operating expenses - - 815,752 670,257
Operating Income (1,618) 915 1,584,487 1,647,784
Transfers Out (915) (2,170,820) (2,325,620)
Total Change in Net Position (1,618) - (586,333) (677,836)
Net Position - Beginning of Year 1,618 1,618 10,554,285 11,232,121
Net Position - End of Year $ - $ 1,618 $ 9,967,952 $ 10,554,285
Multi-Family Housing Bond Program Housing Bond Program
60

RHODE ISLAND HOUSING AND MORTGAGE FINANCE CORPORATION(A COMPONENT UNIT OF THE STATE OF RHODE ISLAND)COMBINING STATEMENTS OF REVENUES, EXPENSES AND CHANGES IN NET POSITION - MULTI-FAMILY FUNDFOR THE YEARS ENDED JUNE 30, 2019 AND 2018
2019 2018 2019 2018
Operating Revenues:Interest income on loans $ 4,703,901 $ 3,662,281 $ 5,549,396 $ 5,600,425
Earnings on investments:Interest on investments 73 189,641 95,512 Net increase (decrease) in fair value of investments
Total operating revenues 4,703,974 3,662,281 5,739,037 5,695,937
Operating Expenses:Interest expense 3,950,115 3,558,601 2,897,102 2,923,644 Other administrative expenses Arbitrage rebate Bond issuance costs Loan costs 229,486 110,889
Total operating expenses 3,950,115 3,558,601 3,126,588 3,034,533
Operating Income 753,859 103,680 2,612,449 2,661,404
Transfers Out (409,904) (350,168) (1,970,514) (2,289,111)
Total Change in Net Position 343,955 (246,488) 641,935 372,293
Net Position - Beginning of Year (312,082) (65,594) 8,763,239 8,390,946
Net Position - End of Year $ 31,873 $ (312,082) $ 9,405,174 $ 8,763,239
Multi-Family Mortgage Revenue Multi-Family Funding Bond
61

(A COMPONENT UNIT OF THE STATE OF RHODE ISLAND)COMBINING STATEMENTS OF REVENUES, EXPENSES AND CHANGES IN NET POSITION - MULTI-FAMILY FUNDFOR THE YEARS ENDED JUNE 30, 2019 AND 2018
2019 2018 2019 2018
Operating Revenues:Interest income on loans $ 15,147,273 $ 15,531,831 $ 27,640,756 $ 27,104,950
Earnings on investments:Interest on investments 932,000 637,853 1,315,596 850,159 Net decrease in fair value of investments (20,412) (141,822) (55,859) (250,073)
Total operating revenues 16,058,861 16,027,862 28,900,493 27,705,036
Operating Expenses:Interest expense 7,545,823 8,040,663 15,146,031 14,949,412 Other administrative expenses 33,581 34,661 Arbitrage rebate 12,513 (91,177) 12,513 43,535 Bond issuance costs (375,775) 34,003 (375,775) 34,003 Loan costs 436,792 490,561 695,458 675,830
Total operating expenses 7,619,353 8,474,050 15,511,808 15,737,441
Operating Income 8,439,508 7,553,812 13,388,685 11,967,595
Transfers In (Out) 169,373 155,258 (4,381,865) (4,810,556)
Total Change in Net Position 8,608,881 7,709,070 9,006,820 7,157,039
Net Position - Beginning of Year 51,408,345 43,699,275 70,415,405 63,258,366
Net Position, End of Year $ 60,017,226 $ 51,408,345 $ 79,422,225 $ 70,415,405
Multi-Family Development Bonds Multi-Family Total
RHODE ISLAND HOUSING AND MORTGAGE FINANCE CORPORATION
62