Embed Size (px)
Citation preview

Građevinar 2/2013
99GRAĐEVINAR 65 (2013) 2, 99-109
UDK 666.031.3.001.8:532.13
Andraž Hočevar, MCEIgmat d.d.Building materials [email protected]
Franci Kavčič, MSc.CEIgmat d.d.Building materials [email protected]
Prof. Violeta Bokan-Bosiljkov, PhD. CEUniversity of LjubljanaFaculty of Civil Engineering and Geodesy [email protected]
Preliminary noteAndraž Hočevar, Franci Kavčič, Violeta Bokan-Bosiljkov
Rheological parameters of fresh concrete – comparison of rheometers
The comparison of rheological parameters for 26 different types of fresh concrete, measured with two co-axial cylinder rheometers ConTec Viscometer 5 and ICAR Rheometer, is presented in the paper. The consistency by slump test and flow table test was also measured. Statistical analyses of results show good correlation between the two rheometers for the yield stress and plastic viscosity. During this study, a strong correlation was established between the yield stress and workability, while the correlation is weak between the workability and plastic viscosity.
Key words:rheology, fresh concrete, rheometers, comparison, analysis of variance
Prethodno priopćenjeAndraž Hočevar, Franci Kavčič, Violeta Bokan-Bosiljkov
Reološki parametri svježih betona – usporedba reometara
U radu se prikazuje usporedba reoloških parametara 26 različitih svježih betona mjerenih pomoću dva koaksijalna cilindrična reometra ConTec Viscometer 5 i ICAR Rheometer. Provedeno je i mjerenje konzistencije slijeganjem i konzistencije rasprostiranjem. Statističke analize dobivenih rezultata pokazuju dobru korelaciju između dva reometra za granicu tečenja i plastičnu viskoznost. Provedenim istraživanjem ustanovljena je jaka korelacija između granice tečenja i obradivosti te slaba korelacija između obradivosti i plastične viskoznosti.
Ključne riječi:reologija, svježi beton, reometri, usporedba, analiza varijance
Vorherige MitteilungAndraž Hočevar, Franci Kavčič, Violeta Bokan-Bosiljkov
Rheologische Parameter frischen Betons – Rheometervergleich
In der vorliegenden Arbeit ist der Vergleich rheologischer Parameter 26 verschiedener Mischungen frischen Betons dargestellt, die durch Messungen mit Hilfe zwei koaxialer zylindrischer Rheometer (ConTec Viscometer 5 und ICAR Rheometer) ermittelt worden sind. Außerdem sind Konsistenzmessungen mittels Slump-Tests und Ausbreitversuche durchgeführt worden. Die statistische Analyse der erhaltenen Resultate weist auf eine zufriedenstellende Korrelation der zwei Rheometer in Bezug auf die Streckgrenze und auf die plastische Viskosität hin. Durch die gegebene Studie ist eine bedeutende Korrelation der Streckgrenze und der Verarbeitbarkeit, sowie eine schwache Korrelation der Verarbeitbarkeit und der plastischen Viskosität festgestellt worden.
Schlüsselwörter:Rheologie, frischer Beton, Rheometer, Vergleich, Varianzanalyse
Rheological parameters of fresh concrete – comparison of rheometers
Primljen / Received: 16.11.2012.
Ispravljen / Corrected: 15.2.2013.
Prihvaćen / Accepted: 21.2.2013.
Dostupno online / Available online: 15.3.2013.
Authors:

Građevinar 2/2013
100 GRAĐEVINAR 65 (2013) 2, 99-109
Andraž Hočevar, Franci Kavčič, Violeta Bokan-Bosiljkov
1. Introduction
It has been observed over time that the workability of fresh concrete is a complex property. Tattersall and Banfill [1] point out that workability tests can be misleading and that they can be interpreted in a number of ways. They divide workability tests into three levels. At the first level tests are described only in comparative terms mostly based on subjective assessment, and so the concrete is described as being highly workable, semi-dry, etc. The second level is based on empirical tests, such as the slump test, flow table test, Vebe test, etc., which have been around for many years and are still widely used. These tests are very much dependent on the operator. We would like to move to the third level which is based on fundamental physical quantities. The values obtained with these tests are in no way dependent on a particular apparatus or on geometry of the apparatus. This means that two materials with the same constants will behave in exactly the same way. Lots of different approaches have been used to find a suitable third level test, and it seems that tests based on the established rheological techniques are the most promising ones [1].To measure rheological parameters of fresh concrete, we cannot take the established rheological tests that are used in other industries and be satisfied. We must modify the measuring equipment and theoretical models so that they are adjusted to concrete, which is a special sort of fluid. Different researchers developed a variety of different rheological tests for concrete. The best known ones are coaxial cylinders rheometers, parallel plate rheometers, and rheometers with impellers, which can be separated by geometry [2]. It is important that fundamental results can be extracted out of these apparatuses. Due to complex geometries of certain vanes and cylinders this is not always possible. For some apparatuses, calibration procedures were carried out to get fundamental results, whereas for other apparatuses fundamental results can be calculated [3]. To extract fundamental results out of actual measurements of torque and rotational velocity, we need to take into account geometry of the test equipment and make some assumptions [4]. Since different apparatuses apply different geometries, we cannot directly compare fundamental results of these apparatuses. Different comparisons have been made in order to establish a correlation between different apparatuses [2, 5, 6] and to make improvements in the science of concrete rheology. Correlations that have been established are reported to be encouraging [7], but the situation is still far from perfect. Some work on calibration material has to be done as well. Oil is fine for calibrating plastic viscosity, but it is not suitable for granular material such as concrete [5]. Test results obtained by two different concrete rheometers, i.e. by the non-portable ConTec Viscometer 5 and the portable ICAR Rheometer, are compared in this paper. The first one is produced by ConTec/ Steyputaekni ehf from Iceland, and
the second one is produced by Germann Instruments. The comparison was made at the laboratory of the Faculty of Civil and Geodetic Engineering, University of Ljubljana, where the same concrete batch was simultaneously tested. The ICAR Rheometer, provided by Institute IGMAT, has not as yet been mentioned in the available literature with regard to comparison of concrete rheometers [2, 5, 6].
2. Rheology of fresh concrete
Rheology is generally defined as "a science of deformation and flow of matter". It deals with the relationships between stress, strain, rate of strain and time, and it is a broad branch of science. Concrete rheology exhibits a complex behavior, both in fresh and hardened state [1]. Only fresh concrete will be considered in the paper. Its flow is so complicated because it is a complex suspension of particles. Particles of coarse aggregate are dispersed in mortar and within mortar, particles of fine aggregate are dispersed in cement paste and within cement paste, cement particles are dispersed in water. This is why we cannot describe rheological behavior of fresh concrete with the Newtonian viscosity function, which is the simplest equation for describing the flow behavior of liquids. The Bingham model, which is the simplest form of non-Newtonian model, is most frequently used. It is mostly satisfactory for describing the behavior of ordinary concrete. However, some types of concrete, especially the self-compacting concrete, exhibit different kinds of behavior [3, 8], and so we apply different non-Newtonian models to describe their behavior [9]. The flow curve of the Bingham model is as linear as the Newtonian one, but instead of passing through the origin, it intercepts the stress axis. This intercept shows that there is a stress, i.e. yield stress, which is needed for flow to occur. The Bingham equation Eq. (1) can be written as [1]:
τ τ µ γ= + ⋅0
.
(1)
where:t - shear stress [Pa]t0 - yield stress [Pa]γ.
- shear rate [s-1]m - plastic viscosity [Pa·s]
The yield stress and plastic viscosity are constants that are needed to describe flow properties. This equation is not directly applicable as a measurement method. Out of these other applicable equations can be set. We can find a solution to describe the behavior of the Bingham material between rotating cylinders or in a tube. The first one is the one we are interested in when talking about measurements in coaxial cylinders viscometers. In the system formed of two coaxial cylinders we measure torque that is required to prevent one of the cylinders from turning (only one cylinder is usually rotated). The relationship between the measured torque and angular velocity of the rotating cylinder

Građevinar 2/2013
101GRAĐEVINAR 65 (2013) 2, 99-109
Rheological parameters of fresh concrete – comparison of rheometers
MixturesComposition CR1 CR1a CR1b CR1c CL1 CL1a CL1b CL1c
CEM I 42,5 R - - - - 400 400 400 400
CEM II/A-M (LL-S) 42,5 R 400 400 400 400 - - - -
Fine aggregate [kg] 953 953 953 953 953 953 953 953
Coarse aggregate [kg] 782 782 782 782 782 782 782 782
W/Cef 0.50 0.50 0.50 0.50 0.50 0.50 0.50 0.50
Water [kg] 212 212 212 212 212 212 212 212
Super plasticizer [%] - 0.10 0.20 0.30 - 0.10 0.20 0.30
CRA1a* CRA1b* CRA1c* CG1a* CG1b* CG1c* CV1a* CV1b* CV1c*
CEM I 42,5 R - - - 400 400 400 400 400 400
CEM II/A-M (LL-S) 42,5 R 400 400 400 - - - - - -
Fine aggregate [kg] 953 953 953 953 953 953 953 953 953
Coarse aggregate [kg] 782 782 782 782 782 782 782 782 782
W/Cef 0.50 0.50 0.50 0.62 0.62 0.62 0.53 0.56 0.59
Water [kg] 212 212 212 259 259 259 224 236 247
Super plasticizer [%] 0.10 0.10 0.10 - - - - - -
Entraining agent [%] 0.04 0.06 0.05 - - - - - -
Viscosity agent [%] - - - 0,10 0,15 0,20 - - -
CZ1a CZ1b CZ1c CM1a CM1b CM1c CT1a CT1b CT1c
Replacing cement [%] 20 40 60 5 10 2.5 10 20 5
CEM I 42,5 R 320 240 160 380 360 390 360 320 380
Fine aggregate [kg] 953 953 953 953 953 953 953 953 953
Coarse aggregate [kg] 782 782 782 782 782 782 782 782 782
W/Cef 0.50 0.50 0.50 0.50 0.50 0.50 0.50 0.50 0.50
Water [kg] 212 212 212 212 212 212 212 212 212
Super plasticizer [%] 0.20 0.20 0.20 0.30 0.30 0.30 0.50 0.50 0.50
Tuff [kg] - - - - - - 32 64 16
Silica fume [kg] - - - 14.50 29.00 7.25 - - -
Blast-furnace slag [kg] 76 152 228 - - - - - -
* Volume of concrete for the composition is higher than 1m3
is plotted on the graph. Based on this, parameters are derived for the Reiner-Riwlin equation, which is a basic equation for computing fundamental Bingham parameters out of rheological measurements [1, 10]. Different authors and different equipment manufacturers use slightly different computations [4, 10], but they all use a few assumptions.The rheology of fresh concrete affects its compacting and casting ability, and it helps us understand concrete in more detail, namely with regard to interactions in the fresh concrete
structure. The size and shape of aggregate grains influence concrete viscosity, just as other ingredients have an effect on other rheological properties [11].
3. Materials and testing3.1. MaterialsVarious concrete mixtures were designed in order to compare the results of the two rheometers. All mixtures were prepared
Table 1. Proportions of concrete mixtures
Građevinar 2/2013
102 GRAĐEVINAR 65 (2013) 2, 99-109
Andraž Hočevar, Franci Kavčič, Violeta Bokan-Bosiljkov
using locally available materials. Two types of cements used originated from different Slovenian cement factories, and were designated as CEM II/A-M (LL-S) 42,5 R and CEM I 42,5 R (SIST EN 197-1), with relative densities of 3.01 and 3.08 g/cm3, respectively. The specific surface of cements used amounted to 4300 cm2/g and 3760 cm2/g, respectively. The aggregate used was crushed limestone aggregate with the relative density of 2.7 g/cm3. The coarse aggregate was a combination of 4-8 and 8-16 mm fractions, and the fine aggregate was a combination of 0-2 and 0-4 mm fractions. Particle size distributions of the fractions and their combinations, determined according to SIST EN 933-1: 2012, are given in Figure 1. The shape index of coarse aggregate (SIST EN 933-4:2008) corresponds to Class SI15 (SIST EN 12620:2002 + A1:2008). The polycarboxylate-based super plasticizer, air entraining agent, and viscosity agent, were used as chemical admixtures. We also used mineral additives, such as the natural zeolite tuff, silica fume, and ground granulated blast-furnace slag with relative densities of 2.41 g/cm3, 2.20 g/cm3 and 2.86 g/cm3, respectively. In total, 26 different mixtures of fresh concrete were prepared. We can combine them into groups of three mixtures. In each group, the quantity of only one constituent was varied. A detailed information about the mixtures is given in Table 1. The aggregate used was dry and it absorbed on an average 0.69 % of water, which was added to the effective water content. Proportions of chemical admixtures are given as a percentage of the total amount of cement and mineral additive, and they replace a certain quantity of cement. The composition of mixtures CRA1a to CRA1c, CG1a to CG1c, and CV1a to CV1c, was obtained in such way that the entrained air content and a higher water content (above W/Cef=0.5) were added to 1m3 of the reference composition (CR1). Thus, the volume of these mixtures was higher than 1m3.
Figure 1. Aggregate grading
3.2. Rheometers and workability tests
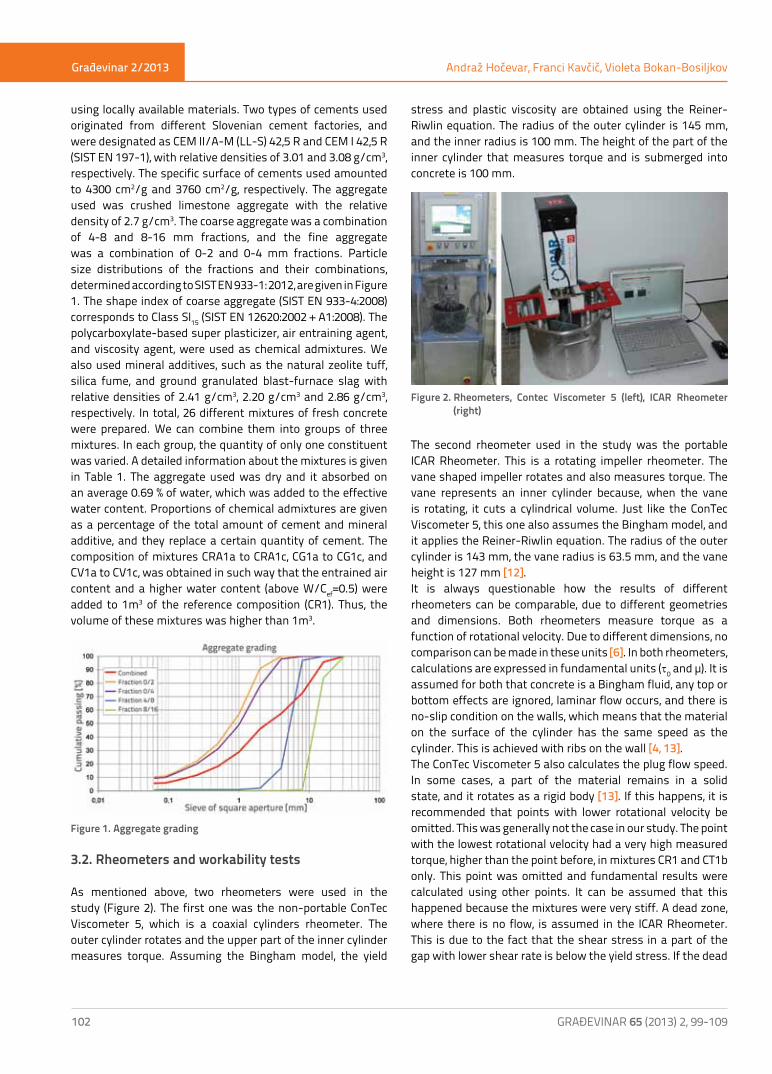
As mentioned above, two rheometers were used in the study (Figure 2). The first one was the non-portable ConTec Viscometer 5, which is a coaxial cylinders rheometer. The outer cylinder rotates and the upper part of the inner cylinder measures torque. Assuming the Bingham model, the yield
stress and plastic viscosity are obtained using the Reiner-Riwlin equation. The radius of the outer cylinder is 145 mm, and the inner radius is 100 mm. The height of the part of the inner cylinder that measures torque and is submerged into concrete is 100 mm.
The second rheometer used in the study was the portable ICAR Rheometer. This is a rotating impeller rheometer. The vane shaped impeller rotates and also measures torque. The vane represents an inner cylinder because, when the vane is rotating, it cuts a cylindrical volume. Just like the ConTec Viscometer 5, this one also assumes the Bingham model, and it applies the Reiner-Riwlin equation. The radius of the outer cylinder is 143 mm, the vane radius is 63.5 mm, and the vane height is 127 mm [12]. It is always questionable how the results of different rheometers can be comparable, due to different geometries and dimensions. Both rheometers measure torque as a function of rotational velocity. Due to different dimensions, no comparison can be made in these units [6]. In both rheometers, calculations are expressed in fundamental units (t0 and µ). It is assumed for both that concrete is a Bingham fluid, any top or bottom effects are ignored, laminar flow occurs, and there is no-slip condition on the walls, which means that the material on the surface of the cylinder has the same speed as the cylinder. This is achieved with ribs on the wall [4, 13]. The ConTec Viscometer 5 also calculates the plug flow speed. In some cases, a part of the material remains in a solid state, and it rotates as a rigid body [13]. If this happens, it is recommended that points with lower rotational velocity be omitted. This was generally not the case in our study. The point with the lowest rotational velocity had a very high measured torque, higher than the point before, in mixtures CR1 and CT1b only. This point was omitted and fundamental results were calculated using other points. It can be assumed that this happened because the mixtures were very stiff. A dead zone, where there is no flow, is assumed in the ICAR Rheometer. This is due to the fact that the shear stress in a part of the gap with lower shear rate is below the yield stress. If the dead
Figure 2. Rheometers, Contec Viscometer 5 (left), ICAR Rheometer (right)

Građevinar 2/2013
103GRAĐEVINAR 65 (2013) 2, 99-109
Rheological parameters of fresh concrete – comparison of rheometers
zone appears, then our calculation should be corrected. The ICAR Rheometer does that automatically using the effective radius method. It is assumed that the transition radius between the flowing zone and the dead zone can be correctly calculated. Rheological parameters are still calculated via the Reiner-Riwlin equation, but the effective radius is inserted instead of the outer radius. As this equation cannot be solved analytically, it has to be solved with iterations [4]. In this study, the decision was made to compare results as obtained from the equipment, with no further calculations except for the omission of some points. Also, there was no need to complement the Bingham model with other rheological models, because normal concrete has usually no tendency to behave like a shear thickening material. Formulae for non-linear rheological properties are described in various literature references [6, 9, 14, 15]. We also ignored the fact that the size of the gap between the inner and the outer cylinder is important and has a big influence on the results [16]. This decision was made due to the fact that ICAR Rheometer (gap is about twice as wide as the one of ConTec) calculates an effective radius and this actually narrows the gap. Slump tests and flow table tests were carried out on each concrete mixture in parallel to rheometer measurements. These tests were made according to European standards SIST EN 12350-2:2009 and SIST EN 12350-5:2009, respectively. Workability test results were compared with rheological properties of concretes.
3.3. Test procedure
Mixtures used in this study had a volume of 40 liters. All dry constituents (coarse and fine aggregate, cement and mineral additives, if any) were first mixed for one minute in the laboratory concrete mixer. Water was slowly added during the mixing process: first one half of the water, and then liquid chemical admixtures diluted with about 0.3 liter of water. After that, the rest of the water was added. This took an another minute. After all water was added, the concrete was mixed for another three minutes. The total mixing time was 5 minutes.Immediately after the mixing, the slump and flow table spreading values were measured, and the flow value was determined. Tests on both rheometers were conducted in parallel with workability tests. Rheometer containers were filled at the concrete mixer location, and were then moved to rheometer positions. This could be the cause for the concrete’s consolidation, and so the concrete was remixed with a flat rod prior to measurements. Three measurements were made on each mixture and, before each measurement, the concrete was remixed with a flat rod. Each mixture was made only once. A similar procedure was used for both rheometers. First they apply a pre-shearing period at the top rotational velocity of the test, after which they reduce rotational velocity in steps. They generate a T-N point at every rotational velocity N, for the part
of the velocity step where they presume that torque T is at the steady state. An average of torque T measured at steady state is calculated. The ConTec Viscometer 5 has a pre-shearing period of 5 seconds and then 8 steps of 5 seconds, from a rotational velocity 0.49 rps going down to 0.01 rps. It omits the first 2 seconds of every step. It also measures an indication of segregation, but this was not part of our investigation. Numbers for ICAR Rheometer are pre-shearing of 20 seconds at the velocity of 0.5 rps, and 7 steps of 5 seconds from the rotational velocity of 0.5 rps down to 0.05 rps. It omits the first 1.5 seconds of every step.
3.4. Statistical analysis
In the study we were predominantly interested in the comparison of the results obtained with the two rheometers. We started our statistical analysis with simple calculation of R2 values for the correlation of rheological properties measured with different testing equipment and with simple observation "mixture by mixture" to see if the measurements from different rheometers are synchronized. We also applied the statistical method ANOVA (analysis of variance), which we assumed to be a proper tool to compare this kind of data. This method divides variance of larger number of data points to variances of smaller groups of data that are put together in groups with similar influences, which causes differences compared to other groups. The objective of the analysis is to check if the differences inside each group are small enough and explainable, compared to the differences inside other groups [17].
4. Results and discussion4.1. Results
The basic parameters of the Bingham model, yield stress and plastic viscosity, which were obtained with the two rheometers for a particular concrete mixture, are given in Table 2 as average values of three measurements, along with the results of both workability tests. It should be noted that it was not always possible to perform measurements on all mixtures, or to perform all repetitions on a particular mixture, due to limitations of the testing equipment used. When using ConTec Viscometer 5, mixtures CR1, CR1a and CT1b were measured only once, without repetitions. By applying the ICAR Rheometer, no measurement was made for the mixture CR1 while only the first measurement, without repetitions, was made for mixtures CR1a, CR1b and CT1b. Therefore, we omitted these four mixtures from our analysis. Only two repetitions were possible on three additional mixtures, but we do feel safe to consider them for the analysis. We will show later on why we needed more than one measurement of rheological parameters on a particular concrete mixture.

Građevinar 2/2013
104 GRAĐEVINAR 65 (2013) 2, 99-109
Andraž Hočevar, Franci Kavčič, Violeta Bokan-Bosiljkov
Figure 3. "Mixture by mixture" for yield stress and both rheometers
CR1 CR1a CR1b CR1c CL1 CL1a CL1b CL1c
t0
[Pa]Visco 5 580.0 348.3 208.0 38.6 488.5 365.1 193.9 140.5
ICAR - 746.4 196.4 67.7 692.3 714.0 416.2 240.3
m [Pa·s]
Visco 5 65.6 42.5 30.9 13.6 61.3 47.1 31.1 26.5
ICAR - 19.1 23.6 9.8 50.3 25.1 22.9 21.5
Slump [mm] 70 150 225 240 110 150 165 190
Flow value [mm] 410 500 540 670 430 470 510 545
CRA1a CRA1b CRA1c CG1a CG1b CG1c CV1a CV1b CV1c
t0
[Pa]Visco 5 231.5 136.2 181.2 194.0 214.8 266.9 310.6 235.7 121.2
ICAR 431.5 207.3 321.5 362.8 467.8 448.3 502.3 404.4 229.5
m [Pa·s]
Visco 5 31.4 23.5 24.3 26.8 25.5 33.7 46.4 40.9 21.2
ICAR 20.9 15.6 18.3 18.1 15.7 19.5 30.4 26.7 14.8
Slump [mm] 100 165 165 190 185 175 160 160 210
Flow value [mm] 400 580 520 530 500 475 480 485 545
CZ1a CZ1b CZ1c CM1a CM1b CM1c CT1a CT1b CT1c
t0
[Pa]Visco 5 170.5 183.4 141.0 337.7 578.5 187.7 203.2 881.4 57.7
ICAR 247.8 363.9 252.3 557.2 918.5 299.3 309.2 1476.1 86.5
m [Pa·s]
Visco 5 38.6 42.2 36.3 44.8 45.7 47.2 35.8 54.7 32.7
ICAR 28.4 28.4 30.0 35.3 36.7 27.8 24.0 19.7 32.1
Slump [mm] 180 170 190 110 90 150 170 50 250
Flow value [mm] 535 525 545 465 430 490 485 370 635
Table 2. Rheological measurement and workability test results

Građevinar 2/2013
105GRAĐEVINAR 65 (2013) 2, 99-109
Rheological parameters of fresh concrete – comparison of rheometers
4.1.1. Time influence and mixture comparison
The basic "mixture by mixture" comparison between two different rheometers for yield stress and plastic viscosity are shown in Figures 3 and 4, respectively. The dashed lines are repetitions 1, 2 and 3, and the solid line is an average value of all three repetitions. Repetitions 1, 2 and 3 were plotted to assess if there were any time influence. Every measurement took about a minute and a half, plus two minutes for concrete remixing. One measurement was made at about every 4 minutes. It can be seen from Figures 3 and 4 that there is no time influence in such a short period of time. There is also no possibility of thixotropic behavior because of constant mixing of concrete. It can be seen from the results that the ICAR Rheometer gives higher results for yield stress and lower results for plastic viscosity, when compared to the ConTec Viscometer 5. The yield stress is on an average 42 % higher with the standard deviation of 7 %, while the plastic viscosity is on an average 43 % lower with the standard deviation of 20 %. It is interesting that worse repeatability can be observed in Figure 4 for plastic viscosity results (especially for ICAR Rheometer), which is also shown with high standard deviation for a difference between averages of both rheometers for plastic viscosities. Based on this observation, we can expect lower correlation between both rheometers with respect to plastic viscosities. Although there is significant difference between absolute values of yield stress and plastic viscosity obtained with the two rheometers for each of 22 mixtures included in the "mixture by mixture" comparison, the rheometers detect changes in mixtures in the same way. The comparison of "mixture by mixture" diagrams (Figures 3 and 4) obtained with ConTec and ICAR rheometers shows that lines representing average values of yield stress or plastic viscosity are often almost parallel, and that they always follow the same trend.
Both rheometers detected higher SP demand of cement CEM I, compared to CEM II. In mixtures where SP, AE, and water were varied, we can observe a distinct decrease in values of both rheological parameters. It is known, using rheograph, that SP should reduce predominantly yield stress, AE predominantly plastic viscosity, while water reduces both parameters [11]. This was also confirmed in our study, with both rheometers. An increase in GGBS content did not significantly alter rheological properties of the concrete mixture, while SF and tuff contributed predominantly to the increase in yield stress. It is known that SF usually decreases plastic viscosity when added in smaller amounts. When the amount of SF is increased, the yield stress and plastic viscosity increase slightly [11]. In our study, we observed only an increase in yield stress while there was no significant change in plastic viscosity.
4.1.2. Correlating rheometers
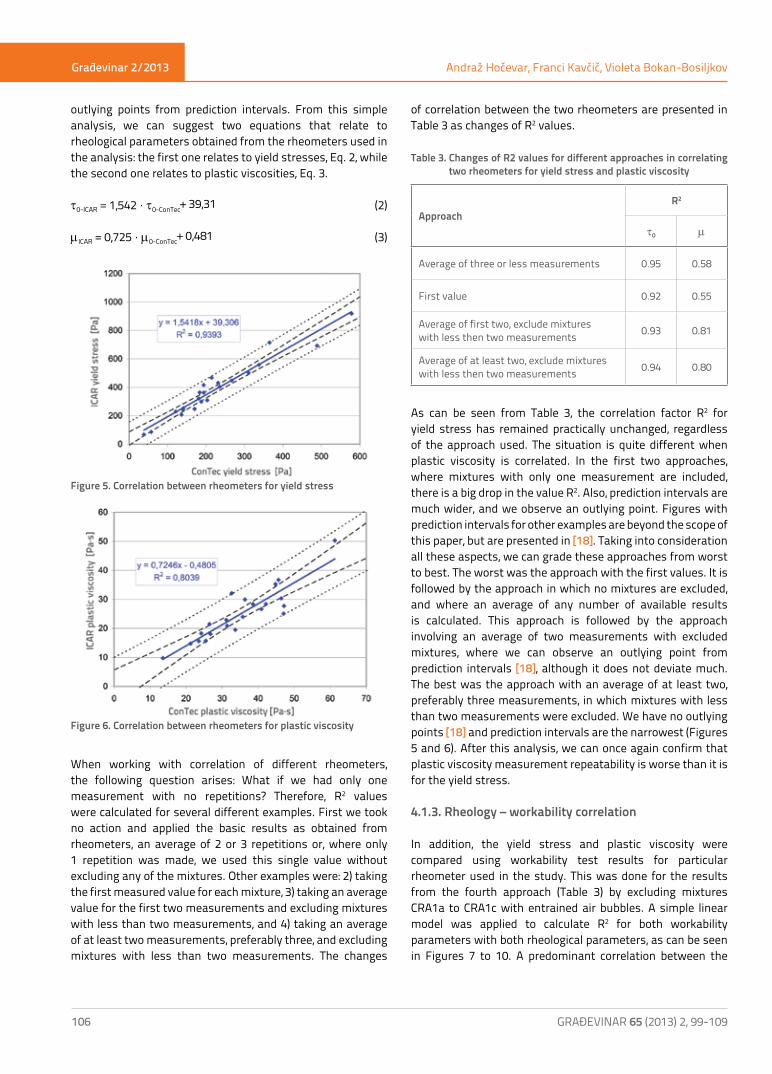
The correlation between two rheometers for yield stress and plastic viscosity is shown in Figures 5 and 6. These correlations are calculated from 22 mixtures that were included in the analysis. In each figure, the dashed line represents a 95 % confidence interval and the dotted line represents a 95 % prediction interval for the linear regressed line. They are both based on t-distribution. Confidence intervals are boundaries where it can be assumed with a 95% confidence that the regressed line actually exists within these boundaries. The prediction intervals are boundaries where there is a 95 % probability that the next measured value will fall between these boundaries.A very good correlation between the rheometers was obtained for yield stress, while a good correlation was achieved for plastic viscosity. The correlation for plastic viscosity is worse than the correlation for yield stress, which was expected, as noted earlier in this paper in Section 4.1.1. We have no
Figure 4. "Mixture by mixture" for plastic viscosity and both rheometers
Građevinar 2/2013
106 GRAĐEVINAR 65 (2013) 2, 99-109
Andraž Hočevar, Franci Kavčič, Violeta Bokan-Bosiljkov
outlying points from prediction intervals. From this simple analysis, we can suggest two equations that relate to rheological parameters obtained from the rheometers used in the analysis: the first one relates to yield stresses, Eq. 2, while the second one relates to plastic viscosities, Eq. 3.
t0-ICAR = 1,542 · t0-ConTec+ 39,31 (2)
mICAR = 0,725 · m0-ConTec+ 0,481 (3)
When working with correlation of different rheometers, the following question arises: What if we had only one measurement with no repetitions? Therefore, R2 values were calculated for several different examples. First we took no action and applied the basic results as obtained from rheometers, an average of 2 or 3 repetitions or, where only 1 repetition was made, we used this single value without excluding any of the mixtures. Other examples were: 2) taking the first measured value for each mixture, 3) taking an average value for the first two measurements and excluding mixtures with less than two measurements, and 4) taking an average of at least two measurements, preferably three, and excluding mixtures with less than two measurements. The changes
of correlation between the two rheometers are presented in Table 3 as changes of R2 values.
Table 3. Changes of R2 values for different approaches in correlating two rheometers for yield stress and plastic viscosity
As can be seen from Table 3, the correlation factor R2 for yield stress has remained practically unchanged, regardless of the approach used. The situation is quite different when plastic viscosity is correlated. In the first two approaches, where mixtures with only one measurement are included, there is a big drop in the value R2. Also, prediction intervals are much wider, and we observe an outlying point. Figures with prediction intervals for other examples are beyond the scope of this paper, but are presented in [18]. Taking into consideration all these aspects, we can grade these approaches from worst to best. The worst was the approach with the first values. It is followed by the approach in which no mixtures are excluded, and where an average of any number of available results is calculated. This approach is followed by the approach involving an average of two measurements with excluded mixtures, where we can observe an outlying point from prediction intervals [18], although it does not deviate much. The best was the approach with an average of at least two, preferably three measurements, in which mixtures with less than two measurements were excluded. We have no outlying points [18] and prediction intervals are the narrowest (Figures 5 and 6). After this analysis, we can once again confirm that plastic viscosity measurement repeatability is worse than it is for the yield stress.
4.1.3. Rheology – workability correlation
In addition, the yield stress and plastic viscosity were compared using workability test results for particular rheometer used in the study. This was done for the results from the fourth approach (Table 3) by excluding mixtures CRA1a to CRA1c with entrained air bubbles. A simple linear model was applied to calculate R2 for both workability parameters with both rheological parameters, as can be seen in Figures 7 to 10. A predominant correlation between the
ApproachR2
t0 m
Average of three or less measurements 0.95 0.58
First value 0.92 0.55
Average of first two, exclude mixtures with less then two measurements 0.93 0.81
Average of at least two, exclude mixtures with less then two measurements 0.94 0.80
Figure 5. Correlation between rheometers for yield stress
Figure 6. Correlation between rheometers for plastic viscosity

Građevinar 2/2013
107GRAĐEVINAR 65 (2013) 2, 99-109
Rheological parameters of fresh concrete – comparison of rheometers
slump and yield stress can be found in literature [19-21] since there is a strong relationship between these two parameters for normal concrete. At the slump test, the concrete sample slumps down by the action of gravity and stops slumping when the shear stress becomes less than yield stress t0 [19]. It can be seen from results presented in Figures 7 and 8 that the obtained yield stress - slump correlation is 0.82 for the ConTec rheometer, and 0.77 for the ICAR rheometer, while the yield stress - flow correlation is 0.73 for both rheometers. R2 equal to 0.82 obtained with the ConTec rheometer for the yield stress-slump correlation is in agreement with the results presented by Wallevik [19], where R2 for a similar content of paste in concrete is 0.84. In addition, the correlating equation (y=-0.265·x+245) is close to the one obtained in our study (Figure 7). In his study Wallevik applied the BML rheometer with the same radius of the inner and outer cylinders as in the case of the ConTec Viscometer 5 rheometer.By correlating the plastic viscosity µ to the workability test results (Figures 9 and 10), it was established that the R2 values are much lower in all cases. R2 was 0.61 and 0.43 for the plastic viscosity - slump correlation, while it was 0.54 and
0.28 for the plastic viscosity-flow value correlation, for the ConTec and ICAR rheometer, respectively. Lower correlation between plastic viscosity and workability parameters is in agreement with the results reported in [19-20].
4.2. Analysis of variance for comparison of rheometers
As mentioned above, the analysis of variance was applied in the comparison of rheometers. Null hypotheses are that a change of mixture of concrete and a change of rheometer do not have a statistical influence on the result, and we do that for the yield stress and plastic viscosity. The F-test was calculated for the mentioned 22 mixtures. Table 4 presents the results that are calculated with a probability for confirming null hypothesis of 0.01. It can be seen that the null hypotheses can be rejected with a high level of confidence (F statistics are much greater than critical values). Calculated reverse critical probabilities for confirming null hypotheses are in the range from 1.4×e-40 to 9.4×e-28, which are very small, negligible numbers. These results show us that rheometers can detect
Figure 7. Correlation between workability parameters and yield stress (ConTec reometar)
Figure 8. Correlation between workability parameters and yield stress (ICAR reometar)
Figure 10. Correlation between workability parameters and plastic viscosity (ICAR reometar)
Figure 9. Correlation between workability parameters and plastic viscosity (ConTec reometar)

Građevinar 2/2013
108 GRAĐEVINAR 65 (2013) 2, 99-109
Andraž Hočevar, Franci Kavčič, Violeta Bokan-Bosiljkov
differences between different mixtures, and that measuring with different rheometers will give us different results. This is also confirmed by the fact that F statistic values for the mixture to rheometer interaction are small.
Table 4. ANOVA results
This analysis did not give us a comparison of rheometers. Therefore, we proceeded by applying the analysis of variance separately for each rheometer and each rheological parameter. Null hypothesis is that a change of mixture does not have a statistical influence on the result. We calculated F-test from the same 22 mixtures as before with the probability of 0.01 for confirming the null hypothesis. Results given in Table 5 show that we can reject the null hypothesis for each case. Additionally, we can see that we can reject this with higher confidence for the ConTec Viscometer 5 than for the ICAR Rheometer. The same is true for rejecting hypothesis for yield stress as for rejecting hypothesis for plastic viscosities. This tells us that ICAR Rheometer results deviate more within measurements of a particular mixture, and that plastic viscosity results deviate more than yield stress results.
Table 5. ANOVA results for each rheometer and each rheological parameter
5. Conclusions
The aim of the experimental and analytical study presented in the paper was to correlate two coaxial cylinders rheometers in order to determine their ability to measure rheological properties of fresh concrete mixtures with slump values between 50 and 250 mm, and flow values between 370 and 670 mm. There are some differences between the rheometers used in this study. These include basic
geometry, test procedure, and calculation of fundamental results from the results obtained from testing equipment. Nevertheless, the decision was made not to make any additional recalculations of results and to compare the results that a user gets when making measurements. The following main conclusions can be made based on results obtained in this study: - ICAR Rheometer has lower repeatability than the ConTec
Viscometer 5, - both rheometers have lower repeatability when measuring
plastic viscosity than when measuring yield stress, - rheometers used in the study give different absolute
values for yield stress and for plastic viscosity; the ICAR Rheometer gives on an average 42 % higher values for yield stress and on an average 43 % lower values for plastic viscosity when compared to the ConTec Viscometer 5,
- both rheometers detect changes in concrete mixtures in the same way,
- changes in concrete mixtures were not always detected in the same way as reported in literature,
- good correlations between the rheometers were established for both rheological parameters when measurements were repeated for each mixture three times in a row,
- there is no time influence between these three repetitions, - equations for relationship between rheometers are given
in this paper (Eq. 2 and Eq. 3), with R2 equaling 0.94 for yield stress, and 0.80 for plastic viscosity,
- correlations between the workability test results and rheological parameters are as expected – a good correlation was obtained for the yield stress (the yield stress-slump correlation was 0.82 for the ConTec and 0.77 for the ICAR rheometer, and the yield stress-flow value correlation was 0.73 for both rheometers) while the correlation was not so good for the plastic viscosity (the plastic viscosity-slump correlation was 0.61 and 0.43, and the plastic viscosity-flow value correlation was 0.54 and 0.28, for the ConTec and ICAR rheometer, respectively).
The above conclusions are based on observations and statistical analysis, such as prediction and confidence intervals, and analysis of variance. Results presented in this paper are only valid for ordinary concretes with similar matrix volume and aggregates. For future work, it would be advisable to study concretes with different matrix volumes and different aggregates, and also special concretes, such as the SCC concrete.
Acknowledgement
The operation was partly financed by the European Union, European Social Fund.At this point the authors would also like to thank students Nejc and Bojan who helped with the experimental analysis during their diploma work.
Rheological parameter Rheometer Fstat Fcrit
t0 [Pa]ConTec 150.73
2.30ICAR 20.92
m [Pa·s]ConTec 48.22
ICAR 12.55
Fstat Fcrit
t0 [Pa]
Mixture 51.82 2.07
Rheometer 277.40 6.93
Interaction 3.50 2.07
m [Pa·s]
Mixture 42.63 2.07
Rheometer 255.36 6.93
Interaction 2.80 2.07

Građevinar 2/2013
109GRAĐEVINAR 65 (2013) 2, 99-109
Rheological parameters of fresh concrete – comparison of rheometers
REFERENCES[1] Tattersall, G.H., Banfill, P.F.G.: The rheology of fresh concrete,
First edition, Pitman, Boston, London, Melbourne, 1983.[2] Ferraris, C.F., Brower, L.E.: Comparison of concrete rheometers:
International tests at LCPC (Nantes, France) in October, 2000, Research report, NIST, 2001.
[3] Feys, D., Verhoeven, R., De Schutter, G.: Fresh self compacting concrete, a shear thickening material, Cement and Concrete Research, 38 (2008) 7, pp. 920-929.
[4] Koehler, E.P., Fowler, D.W.: Development of a Portable Rheometer for Fresh Portland Cement Concrete, Research report, ICAR, 2004.
[5] Ferraris, C.F., Brower, L.E.: Comparison of concrete rheometers: International tests at MB (Cleveland OH, USA) in May, 2003, Research report, NIST, 2004.
[6] Feys, D., Heirman, G., De Schutter, G., Verhoeven, R., Vandewalle, L., Van Gemert, D.: Comparison of two concrete rheometers for shear thickening behaviour of SCC, Fifth International RILEM Symposium on Self-Compacting Concrete - SCC 2007, Ghent, Belgium, pp. 365-370, 2007.
[7] Banfill, P.F.G.: The rheology of fresh cement and concrete - a review, 11th International Cement Chemistry Congress, Durban, pp. 136-149, 2003.
[8] Feys, D., Verhoeven, R., De Schutter, G.: Why is fresh self-compacting concrete shear thickening?, Cement and Concrete Research, 39 (2009) 6, pp. 510-523.
[9] Feys, D., Verhoeven, R., De Schutter, G.: Evaluation of time independent rheological models applicable to fresh self-compacting concrete, Applied Rheology, 17 (2007) 5, 56244, pp. 1-10.
[10] Wallevik, J.E.: The Bingham-Model, Retrieving the Bingham parameters when using the coaxial cylinders viscometer, Lecture notes for the ICI rheocenter rheology course, Innovation center Iceland, Reykjavik, 2009.
[11] Wallevik, O.H.: Introduction to rheology of fresh concrete, Innovation center Iceland, Reykjavik, 2009.
[12] Koehler, E.P., Fowler, D.W.: Development and Use of a Portable Rheometer for Concrete, Supplementary Proceedings of the Eighth CANMET/ACI International Conference on Recent Advances in Concrete Technology, Montreal, Canada, pp. p. 53-72, 2006.
[13] Wallevik, J.E.: Rheology of particle suspensions, fresh concrete, mortar, and cement paste with various lignosulfonates, The Norwegian university of science and technology, Trondheim, 2003.
[14] Ferguson, J., Kemblowski, Z.: Applied fluid rheology, Elsevier science publishers LTD, Essex, 1991.
[15] Nehdi, M., Rahman, M.A.: Effect of geometry and surface friction of test accessory on oscilatory rheological properties of cement pastes, Aci Materials Journal, 101 (2004) 5, pp. 416-424.
[16] Barnes, H.A., Hutton, J.F., Walters, K.: An introduction to rheology, Elsevier science publishers B.V., Amsterdam, 1989.
[17] Hays, W.L.: Statistics, Harcourt Brace College Publishers, Fort Worth, 1994.
[18] Hočevar, A.: Statistical analysis: effect of number of repetitions, Igmat, 2012.
[19] Wallevik, J.E.: Relationship between the Bingham parameters and slump, Cement and Concrete Research, 36 (2006) 7, pp. 1214-1221.
[20] Ferraris, C.F., de Larrard, F.: Testing and modelling of fresh concrete rheology, Research report, NIST, 1998.
[21] Murata, J., Kukawa, H.: Viscosity equation for fresh concrete, Aci Materials Journal, 89 (1992) 3, pp. 230-237.