Embed Size (px)
Citation preview

Nucleon Structure Functions, Fz(r, Q’) and xF:,(z, Q’),
from v-Fe Scattering at the Fermilab Tevatron
SRMishra
Harvard University, Cambridge, MA, 02138.
Representing the CCFR Collaboration
S.R.Mishra, ’ W.C.Leung, P.Z.Quintas, 2 F.Sciulh,
C.Arroyo, K.T.Bachmann,s R.E.Blair,’ C.Foudas,’ B.J.King, W.C.Lefmann,
E.Oltman, a S.A.Rabinowitz, W.G.Seligman, M.H.Shaevitz
Columbia University, New York, NY 10027
F.S.Merritt, M.J.Oreglia, B.A.Schumm”
University of Chicago, Chicago, IL 60837
R.H.Bernstein, F. Borcherding, H.E.Fisk, M.J.Lamm,
W.Marsh, K.W.B.Merritt, H.Schellman, ’ D.D.Yovanovitch
Fermilab, Batavia, IL 60510
A.Bodek, H.S.Budd, P. de Barbara, W.K.Sakumoto
University of Rochester, Rochester, NY 14627
P.H.Sandler, W.H.Smith
University of Wisconsin, Madison, WI 53706.
‘Present Address: Harvard University, Cambridge, MA 02136.
*Address aner Jan. 1992: Fermilab, Batavia, IL 60510.
‘Present address: Widener University, Chester, PA 19013.
“Present address: Argonne National Laboratory, Argonne, IL 60439.
“P~sent sddrrss: University of Wisconsin, Madison, WI 53706.
GPresent address: Lawrence Berkeley Laboratory, Berkeley, CA 94720
‘Present address: Northwestern University, Evanston, IL 60206.
0 S. Mishra 1992
-907-
Abstract: We present precision measurements of nucleon structure functions, Fl(z, Q’)
and xFa(r,Q2) from a sample of 1,320,OOO v,,-Fe and 280,000 F,,-Fe high-energy
charged current interactions at the Fermilab Tevatron. The CCFR measurements of
xF:r(r,Q’) agree in magnitude but differ in Q* dependence, at small z, when com-
Qared to the CDHSW data; and show for the first time a Qz evolution consistent
with PQCD. The xFs measurement leads to an accurate determination of the Gross-
Llewellyn Smith sum rule: SGLS = J, I ’ *d+ = 2.50 f 0.018( stat.) f 0.078( syst.).
Our measurements of Fr(r,Q?) agree well with those from SLAC (eN) and BCDMS
(pN) experiments, and lead to a precise test of the mean-square charge prediction
by the Quark Parton Model. These data, however, differ from the CDHSW (vFe)
and EMC (pN) data. Measurements of the scaling violation of the CCFR Fr are
also in good agreement with the theory. The preliminary value of Am, from the
non-singlet evolution with Q* > 15 GeVr, is 213 f 29(stat.) f 4l(syst.) MeV.
1: Introduction
High energy neutrino uniquely elucidate hadron structure. The parity-conserving
and parity-violating amplitudes of v-interactions lead to a simultaneous determina-
tion of Fr(r, Q’) and xFs(z, Q2). Th ese structure functions, in the standard model,
are directly related to the momentum densities of the constituent quarks. The
differential cross section for the v-N charged-current process (CC), v,,(n) + N +
p-(p’) + X, in terms of the Lorentz invariant structure functions Fr, 2xF,, and xF,r
is:
incident neutrino energy, s = 2E,M + Ad* is the v-N center of mass energy, Q* is the
square of the four-momentum transfer to the nucleon, the scaling variable y = w
is the fractional energy transferred to the hadronic vertex, and z = &v, the
Bjorken scaling variable, is the fractional momentum carried by the struck quark.
The structure function 2xFr is expressed in terms of Fr and R = u~/ur , the ratio of
total absorption cross sections for longitudinal and transverse polarized U’ bosons by
2xF,(+,Qr) = a x Fz(z, Q’). F rom the sums and differences of the differential
cross sections of the v-N and n-N interactions, the “parity conserving” Fr(z, Q’) and
the “parity violating” xFs(z,Q*) t s ructure functions are extracted. In the Quark-
Parton Mode1 (QPM), Fr is the sum of all interacting nucleon constituents; and XFJ
is the difference of quark and anti-quark densities or the valence quark density of
the nucleon.
Perturbative QCD predicts the amount of scaling violation (the Q’ dependence)
from the measured t-dependence of structure functions at fixed Q’, and one ad-
ditional unknown: the strong coupling parameter, Q, [l]. The magnitude of the
measured scaling violations can be directly compared to the predictions, and lead
to a precise determination of the QCD mass parameter a, or Am. One critical
prediction is the Qr-dependence of the non-singlet structure function xF.1, since its
evolution is independent of the unknown gluon distribution and, therefore, can be
used as an unambiguous test of PQCD. Until now this prediction has not met the
test of experimental comparison.[2] Finally, a simultaneous analysis of Fr and xF:r
permits the delineation of the gluon evolution, and leads to an accurate determina-
tion of the gluon structure function.
2: CCFR Detector and v Beam
Structure functions on an iron target wereextracted from data taken by the Columbia- where Gr is the weak Fermi coupling constant, M is the nucleon mass, E, is the
-408-

Chicago-Fermilab-Rochester (CCFR) 11 b co a oration during two runs in the Fermilab
Tevatron neutrino Quadrupole-Triplet beam (QTB).[3,4,5] The QTB delivered v,,
and v,, in the ratio of z l/2, with energies from 30 to 600 GeV, at the CCFR
detector.[6] To ensure hadron shower containment and high track reconstruction ef-
ficiency, fiducial cuts were imposed upon the 3.7 million muon triggers: transverse .
event vertex within a square of 2.54m x 2.54m, longitudinal event vertex at least
4.4m upstream of the downstream end of the target, and selection on the muon
track to assure containment by the toroidal spectrometer. To delineate only regions
of high efficiency, two kinematic cuts, Ep > 15GeV and B,, < 0.150 rad, were also
imposed upon the reconstructed muons. After these selections, there remained a CC
sample of 1,320,OOO v~- and 280,000 ii,-induced events - an increase by a factor of
11 (18) in v,,(“,,) event statistics, and a factor 2.5 increase in mean E,, over earlier
CCFR Narrow Band Beam (NBB) samples.[‘l]
Accurate measurements of structure functions in deep inelastic lepton experi-
ments depend critically upon a good understanding of calibrations and energy reso-
lutions. Measurements of the scaling violations are particularly sensitive to miscal-
ibrations of either the hadron or muon energies (I& or E,,). For example, a 1%
miscalibration can cause a 50 MeV mismeasurement of Am, but these errors enter
with opposite signs. Thus if both E ,,,,d and E,, were in error by the same amount,
the error in Am will be small. Therefore, while it is important that the hadron and
muon energy calibrations and resolution functions be well known, it is crucial that
the energy scales be cross-calibrated to minimize energy uncertainty as a source of
error.
The CCFR detector was calibrated in two detailed test runs, using charged
particle beams of well defined momenta.161 The detector was calibrated using charged
particle test beams. A hadron beam, at several different energies, was directed into
the target carts at different positions. Each beam particle was momentum analyzed
to =z 1%. These data were used to calibrate the calorimeter to about 1% and to
determine the calorimeter resolution function.[6] [In two test runs, separated by
three years, the energy calibration constant, normalized to muon response, varied
by z 0.3%.] Test beam muons were used to calibrate the toroid spectrometer to
z (.5% - .6%), to determine the resolution function for muons, and to keep track
of the time-dependent calibration changes of the calorimeter.[6]
The relative calibration of Ehad to E,, can be checked from the Y data by plotting
<~;~~~~::.” as a function of y = Ehad/Evtr, If the hadron and muon energy scales
are correct, the ratio will be unity for all y. If not, the two energy scales must be
adjusted. To satisfy this constraint, calibration adjustments of E,, -( E,, x 0.995 and
E hnd -+ Ehn,j x 1.016 were chosen; these adjustments are consistent with the known
calibration uncertainty. Figure 1 shows the relative calibration after adjustment by
these two parameters. The error on the relative calibration remains (Z 0.5%) the
dominant systematic error in the determination of Am.
3: Absolute and Relative Flux
No direct measurement of the neutrino flux was possible in the QTB. Absolute
normalization of the flux, relevant for tests of the QPM sum rule predictionsJ2j was
chosen so that the neutrino-nucleon total cross-section equaled the world average
of the iron target experiments, &” = (.676 f .014) x 10-“s cm’ E,(CeV).[8,9] The
relative flux determination, i.e., the ratio of fluxes among energies and between
ij and v,,, relevant for measurements of scaling violation and tests of Quantum
Chromodynamics (QCD) predictions, was determined directly from th- neutrino
data using two techniques as discussed below.
-409-

The two methods used to extract the relative flux [iP(E)] were: the fixed v-cut
method and y-intercept method.[lO] The two techniques yielded consistent measures
of cP(E).
The fixed v-cut method uses the most general form for the differential cross
section for the V-A neutrino nucleon interaction which requires that the number of
events with v < vu in a E, bin, h’(v < vu), is proportional to the relative flux @(Ey)
at that bin, up to corrections of order of O(vu/Eu):
n/(v < vu) = Cip(E,)v, [A+ ($3 + (z)‘C + O($‘] . (2)
The parameter, v,,, was chosen to be 20 GeV to simultaneously optimize statistical
precision while keeping corrections small. There are 426,000 v- and 146,000 ti-
induced events in the fixed v-cut flux analysis.
The y-intercept method comes from a simple helicity argument: the differential
cross sections, da/Edy, for v- and z-induced events should be equal for forward
scattering and independent of energy, i.e., as y-+0.
[k%]v=” = [-j!j$]v=, = Constant. (3)
Thus, in a plot of number of events versus y, the y-intercept obtained from a fit to the entire y-region is proportional to the relative flux. The fixed u-cut and y-
intercept methods of 8(E) determination typically agreed to about 1.5% with no
measureable systematic difference. A smoothing procedure was applied to minimize
the effects of point-to-point flux variations.[4,5]
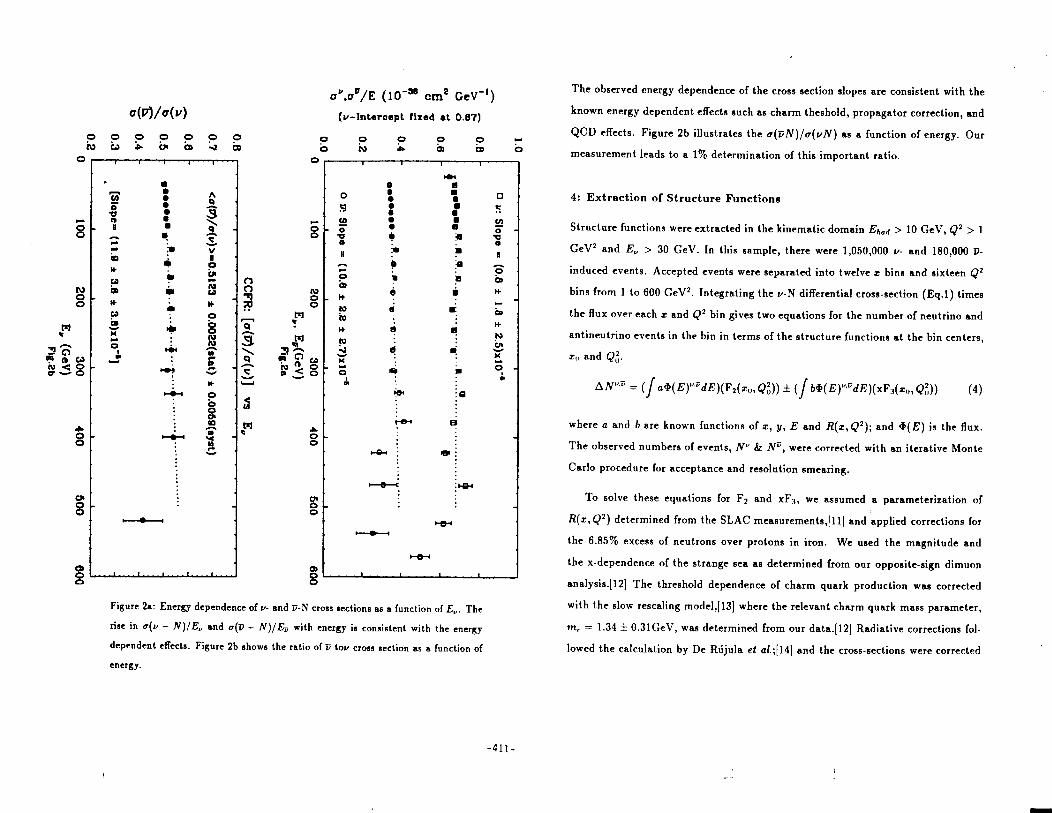
Determination of relative flux permits us to measure the energy dependence of
v,,- and ii,,-N total cross sections. (Note that the abosute level of a(vN) is assumed
from the earlier measurements.) Figure 2a shows the slope of the neutrino cross
section, u”~~/E”~~ as a function of neutrino energy. Region beyond 220 GeV is new.
-410-
I I
1
0 Y: Slops
= (0.8
f 1.6
f 2.5)x10-*
1 I
!I 4 onm
~o.o.R..n..R..m..,..y...,
. . . . l....R . . !? . . . . . b . . . . . . . . . . . . . . . . .._..
P P
oroomoo*.,~..O
..m..o..o...a
. v...Q.."
*A ., . . . . . .
. .
. . . . . . .
b ‘i
0.2 t
a* .3
0 VI Slope =
(10.6 f
2.2 i
2.7)x10d b
0.0 t 0
100 200
300 400
600 800
E,. E&M’)
Fig.2a
CCFR: [u(@/u(u)]
vs E,
0.6-. .
. .
1.. .
. I..
. .
I.. .
I.. .
. ,
. .
.
0.7 -
w7)/o(v)>=O.5123
i 0.0022(slal)
t 0.0069(syst)
T 0.8
-
X 0.5 _ l 000o0m
....R-t. 2
,,.* ..*... l ,... r..,$
_... f . . . . . . . . . I........... ......
g 0.4
I 0.3
rsloPc= (11.9
f 3.6
t 3.g)x10-‘]
.
0.2 ,
1 1
I ,
0 100
200 300
400 500
E, (G
eV) Flg.Zb
I 600
for the massive W-boson propagator. The charm-threshold, strange sea, and radia-
tive corrections were largely independent of Q r. For Fz, they ranged from *lo% at
x = .015, to f3% at z = 0.125, to TiE at z = 0.65 over our QZ range. For xF:r they
ranged from z’% ,,% at x = .015, to $i% at z = 0.125, to iig at z = 0.65. We have
excluded the highest z-bin, 0.7 < z 5 1.0, due to its susceptibility to Fermi motion
(which was not included in the smearing correction).
5: xF3(z, Q’) Results
5.1: Comparison of the CCFR and the CDHSW Measurements of XFJ
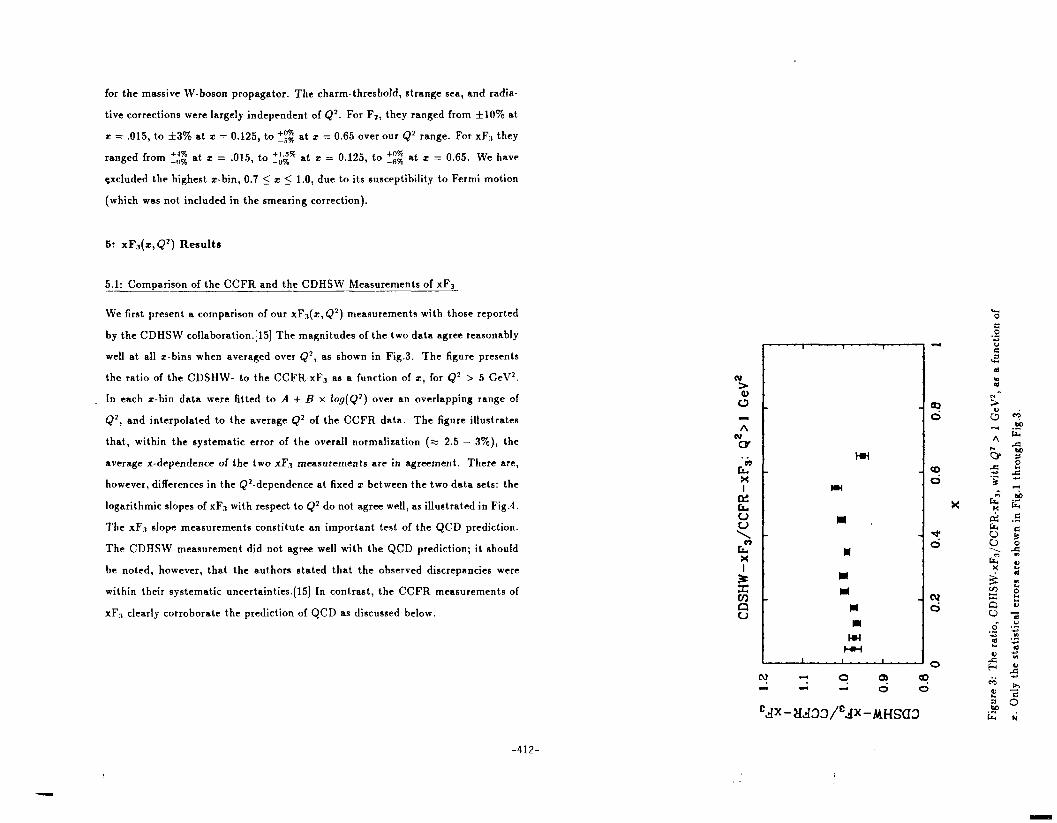
We first present a comparison of our xFB(t, Q’) measurements with those reported
by the CDHSW collaboration.[l5] The magnitudes of the two data agree reasonably
well at all t-bins when averaged over Q*, as shown in Fig.3. The figure presents
the ratio of the CDSHW- to the CCFR-xFs as a function of z, for Q’ > 5 GeV’.
In each x-bin data were fitted to A + B x Iog(Q’) over an overlapping range of
Q', and interpolated to the average QZ of the CCFR data. The figure illustrates
that, within the systematic error of the overall normalization (z 2.5 - 3%), the
average x-dependence of the two xFs measurements are in agreement. There are,
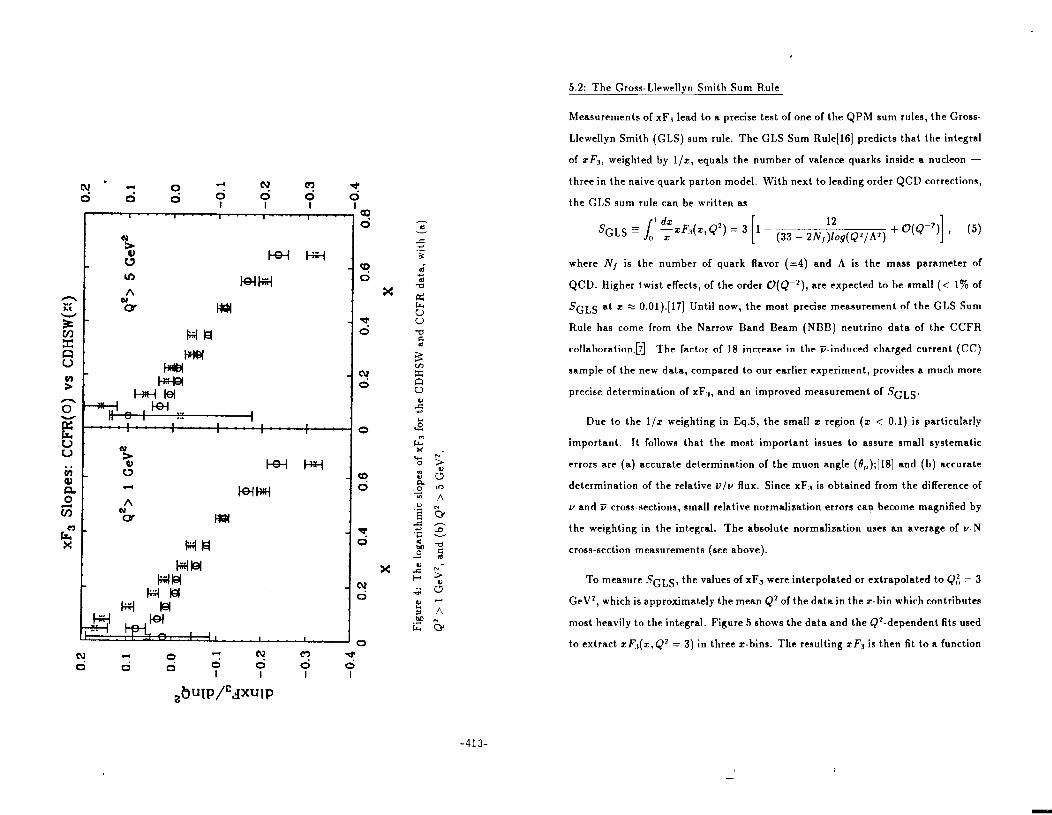
however, differences in the Qz-dependence at fixed z between the two data sets: the
logarithmic slopes of xFs with respect to Q* do not agree well, as illustrated in Fig.4.
The xF:, slope measurements constitute an important test of the QCD prediction.
The CDHSW measurement did not agree well with the QCD prediction; it should
be noted, however, that the authors stated that the observed discrepancies were
within their systematic uncertainties.[l5] I n contrast, the CCFR measurements of
xF, clearly corroborate the prediction of QCD as discussed below.
-412-
5.2: The Gross-Llewellvn Smith Sum Rule
Measurements of xF3 lead to a precise test of one of the QPM sum rules, the Gross-
Llewellyn Smith (GLS) sum rule. The GLS Sum Rule[lG] predicts that the integral
of zF3, weighted by l/z, equals the number of valence quarks inside a nucleon -
three in the naive quark parton model. With next to leading order QCD corrections,
the GLS sum rule can be written as
SGLS = 1 - (33 _ 2N,f;og(Q2,A2) + O(Q-'1 1 7 (5)
where NJ is the number of quark flavor (=4) and A is the mass parameter of
QCD. Higher twist effects, of the order O(Q-‘), are expected to be small (< 1% of
SGLS at = z 0.01).[17] Until now, the most precise measurement of the GLS Sum
Rule has come from the Narrow Band Beam (NBB) neutrino data of the CCFR
collaboration.[7] The factor of 18 increase in the o-induced charged current (CC)
sample of the new data, compared to our earlier experiment, provides a much more
precise determination of xF,r, and an improved measurement of SGLS.
Due to the l/z weighting in Eq.5, the small I region (x < 0.1) is particularly
important. It follows that the most important issues to assure small systematic
errors are (a) accurate determination of the muon angle (@,,);[I81 and (b) accurate
determination of the relative P/U flux. Since xF:r is obtained from the difference of
v and v cross-sections, small relative normalization errors can become magnified by
the weighting in the integral. The absolute normalization uses an average of v-N
cross-section measurements (see above).
To measure SGLS, the values of xF:r were interpolated or extrapolated to Q:l = 3
GrV2, which is approximately the mean Q* of the data in the z-bin which contributes
most heavily to the integral. Figure 5 shows the data and the Qz-dependent fits used
to extract zF,,(z,Qr = 3) in three z-bins. The resulting rF, is then fit to a function
-413-

.
cr! -! 0 0
of the form: f(z) = Az’(l - 2)’ (b > 0). The best fit values are A = 5.976 f 0.148,
b = 0.766 f 0.010, and c = 3.101 Z&Z 0.036. The integral of the fit weighted by l/z
gives the SGbS. Figure 6 shows the measured xFs(x) at Q2 = 3 GeV’, as a function
of t, the fits and their integrals. The measurement of the sum rule yields:[19]
SGLS = J,’ +dz = 2.50 zk O.O18(stat.) .
Fitting different functional forms to our data,[4] gives an answer within fl% -
1.5% of the above. We estimate fO.040 to be the systematic error on SGJ,S due
to fitting. The dominant systematic error of the measurement comes from the
uncertainty in determining the absolute level of the flux, which is 2.2%. The other
two systematic errors are 1.5% from uncertainties in relativep to v flux measurement
and 1% from uncertainties in E, calibration.(4] The systematic errors are detailed
in Table 1. Our value for SGbs is:
SGbg = /,I Gdx = 2.50 rt 0.018( stat.) f 0.078( syst.) .
The theoretical prediction of SGbS, for the measured A = 213 f 50 MeV from
the evolution of the non-singlet structure function,[5] is 2.66 f 0.04 (Eq.5). The
prediction, assuming negligible contributions from higher twist effects, target mass
corrections,[20] and higher order QCD corrections, is within 1.8 standard deviation
of our measurement. The world status of SGbS measurements is shown in Fig.7.
5.3: The Q2-Evolution of the Non-Singlet Structure Function
Structure functions evolve in PQCD according to the equations [l]
(7)
--

00’0 k -----__--.------_-----------------------------------------------------------------
;::rrf ()
DQ’O
i- i
‘tt .a’

.
dP(r, Q’) = as(Q7 ’ dln Qr I[ ?r I J’qq(z,as)F”(f,Q’) + P,~(z,u.)G(~,Q~)] dz(8)
where the P,J are the predicted “splitting functions”. The non-singlet evolution
depends only on the measured structure functions, the known splitting function,
and Q,. The singlet equation is more complicated: its evolution is coupled with that
of the gluons. Only the non-singlet evolution can be computed without resorting
to assumptions about the dependence of the gluons on z and Q*. Because P,(z)
passes through zero, the left-hand side of Eq.7 is predicted to pass through zero at
about z = 0.11, independent of Q,. This statement is valid in leading order; in next-
to-leading order, all curves parametrized by differing Am pass through a common
point near zero at z = 0.11. A comparison of this prediction with experiment
is a fundamental test of PQCD which has not yet been demonstrated. The high
statistics CDHSW data[l5] do not agree well with the predicted dependence of the
scaling violations on z, although the authors state that the discrepancies are within
their systematic errors. Previous CCFR data lacked the statistical power to offer a
conclusive test.[7] The new CCFR data, on the other hand, show an evolution very
consistent with PQCD.
We used a modified version of the Duke and Owens program to do a next-to-
leading order QCD analysis with target mass correction.[22] Applying cuts on Q’
to eliminate the non-perturbative region and z < .7 to remove the highest z bin
(where resolution corrections are sensitive to Fermi motion), best QCD fits to the
data were obtained as illustrated in Fig.8 (for QZ >5 GeVs) and discussed below.
Figure 8 shows our new data along with the curve through the points predicted
by the theory. A good visual representation of structure function evolution compares
the magnitude of the Qz-dependence of the data in each z-bin with the dependence
predicted by the fit. This is shown by plotting the “slopes” (= $-$$a) as a function

GO
’0
01’0
09’0
2: 00’1
”
00’9
00’0 1

Table 2: Antiquarks and Substitution Fits: Fits are with QZ > 15 GeV’, and
values of Am are in MeV. The xZ/Deg. of freedom ($/dof) is close to unity in all
four cases.
no substitution
h 179 f 36
220 f 34
213 f 29
215 f 25
xz/dof
53.5153
55.3153
55.3153
50.9153
-418-

0.4 does not significantly change Am; the above substitution yields, A,, = 215f25
MeV (x2=50.9/53). Using 2+F, instead of FZ in this fit changes Am by $1 MeV.
The systematic errors on Am are shown in Table 3. The energy scale error comes
from changing both the hadron and muon energies by 1% in Ihe same direction. As
explaine’d above, the errors from a correlated energy change tend to cancel, resulting
in an error of z 10 MeV. The largest error comes from a possible miscalibration of
EJ,,,~ with respect to E,. The statistics of the relative calibration data allow a 0.6%
variation of the two energy scales from the ideal which results in a 48 MeV systematic
error (36 MeV for the fit with F,). The last two errors come from varying the two
assumptions of the absolute normalization. The fit with xF:l alone shows a greater
dependence on these assumptions because it is formed from differences of neutrino
and antineutrino event sums, while F? is derived from the sum of the two.
6: F2(r,QZ) Results
6.1: The Mean-Square Charge Test
The QPM relates the measurement of FZ in o-N scattering to those determined from
the charged lepton, e-N or p-N, scattering. The ratio of the two is a measure of the
mean-square quark charge (in units of the square of the electron charge).[2]
Table 3: Systematic Errors in Am: Values are in MeV. The Fz data are substi-
tuted for xF3 for z 2 0.5.
ERROR xF3 only XFJ t Fz
Energy Scale f9 f19
Rel. Calibr. f48 f36
A UUK fll f6
AffZ”luYN 520 f2
TOTAL SYSTEM f54 f41
Here the small x-dependent correction in parenthesis is due to the asymmetry of the
strange and charm sea of the nucleon. The F k” data were multiplied by (18/5) times
the strange sea correction, and plotted in Fig.10. The comparison of the CCFR-Fe
data (solid circle) to those of SLAC-‘D’ (diamond),[23] BCDMS‘D (square),[24]
-419-
--

.
EMC-Fe (cross),[25] and CDHSW-Fe (fuzzy cross)(l5] is shown (Fig.10) in a few
illustrative z-bins as a function of Q*. For this comparison, the deuterium data
were further corrected for the difference between the light and heavy nuclei using
the measured ratio Fr(Fe)/Fr(D) as a function of z.[23] This correction spanned a
range from +4% at x = 0.12, to -4% at x = 0.4, to -12% at t = 0.6.
Figure 10 shows good agreement between the SLAC and the CCFR measure-
ments of Fr. These are the first measurements showing substantial overlap with the
precise low-Q2 SLAC data. At higher Q 2, the CCFR data are in good agreement
with those of BCDMS‘D’, and BCDMS-C data;[24] the latter, however, exist only
in the limited range 0.25 5 z 5 0.80, and for clarity are not shown in Fig.10. The
EMC-Fe data tend to be systematically lower in magnitude by about 7%; and a
display steeper dependence on Q’ at low z than those of CCFR.
The CDHSW data in the range 0.1 5 x < 0.275, tend to lie lower than those
from this experiment - the disagreement being primarily in the low-Q’ range of the
x-bins. Although the extracted Fr(+, Q’) d e en u p d p on model dependent corrections
which are not precisely the same in the two experiments, it should be noted that
the corrections in the discrepant r-bins in Fig.10 are no larger than f2-4%. The
origin of this z- and Q’ dependent disagreement is not understood. The two data
sets, however, show better agreement for z 5 0.1 and t 2 0.35.
The mean-square charge test, or the comparison of the CCFR Fz with those
of the muon scattering experiments, is summarized in Fig.11. Data from each p
experiment are corrected using Eq.10, and the muon-to-neutrino Fr ratio is formed
in each x-bin averaged over the overlapping QZ range with Q’ > 5 GeV*. The
resulting ratios are plotted as a function of x in Fig.11. It should be noted that
the CCFR data span a larger range of than any of the experiments shown in the
-420-

I 1 t
j.. I ...... - .. . - ........ _ .> ................. ... i
figure. Systematic errors due to calibration and relative normalization are shown in
the figure; absolute normalization errors are not shown. The BCDMS/CCFR ratios
are in good agreement with the expected mean square charge. The EMC-Fe/CCFR
ratios are systematically lower by about 7% than the prediction, and show reasonable
agreement as a function of z; although, due to the averaging over the Q’ range, the
slope discrepancy tends to be obscured. The EMC-‘D’/CCFR ratios show similar
characteristics and are not shown for clarity in Fig.11. The results of the mean-
square charge test are contained in Table 4. The conclusions of this test do not
change for a relaxed (> 1 GeVr), or a more stringent (> 20 GeV*) Qz-cut.
6.2: The Q2-Evolution of the Singlet Structure Function
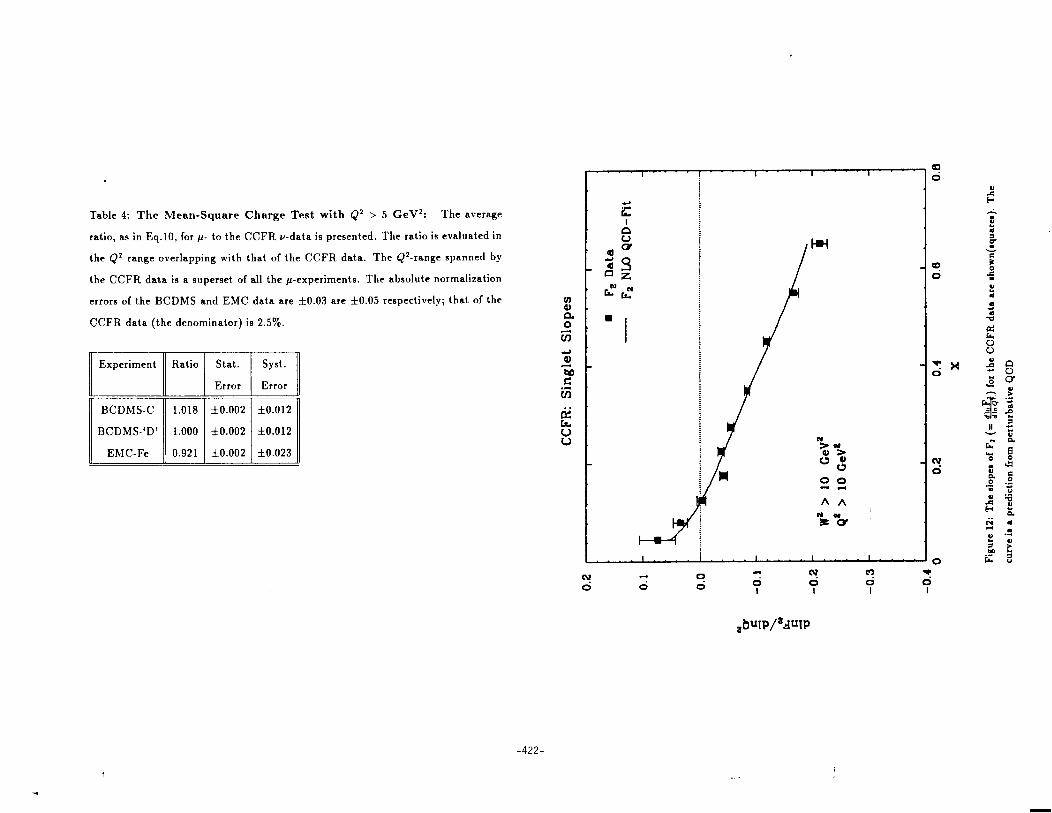
We have also done preliminary QCD fits evolving Fr, and (Fr & xFs) simultaneously.
The quality of these fits is satisfactory; e.g.,for Am = 211 MeV and G(z) =
A(1 - E)‘, the PQCD precitions fit the Fr data well as illustrated in Fig.12. Our
Fr data resolves some of the earlier controversies concerning QCD evolution of F:,
in nuclear targets.121 The full QCD fit to Fr, with Q’ > 5 GeV2 cut, is shown
in Fig.13 - we observe satisfactory agreement between the data and theory. The
values of Am from Fz fits are consistent with Eq.9. It must be pointed out that
any value of Am from such a fit is correlated with the z-dependences of the gluon
and antiquark distributions. Th e a g reement of the Q’ evolution of Fs and xF:,
with PQCD bodes well for a combined analysis, or simult’aneous evolution, of the
two structure functions leading to a better understanding of the gluon structure
function and its evolution.
7: Conclusion
We have presented precision measurements of the nucleon structure functions Fr
-421-
.
Table 4: The Mean-Square Charge Test with Qz > 5 GeVz: The average
ratio, as in Eq.10, for p- to the CCFR v-data is presented. The ratio is evaluated in
the Q* range overlapping with that of the CCFR data. The Qr-range spanned by
the CCFR data is a superset of all the p-experiments. The absolute normalization
errors of the BCDMS and EMC data are f0.03 are ztO.05 respectively; that of the
CCFR data (the denominator) is 2.5%.
-9 0
-*Ix 0
..cu 6
-422-

d 1 w
.9 a s
SO’0
01’0
OS’0
00’1 2
0 + WC=) szI’=x
* I
6 e
6
. 0 -
(0Xx) ow-x ID-
* p
:
0 - (LX) slw==
00’9
00’01

References
[l] G.Altarelli and G.Parisi, Nucl. Phys. B120:298, 1977.
[2] SRMishra and F.Sciulli, Annu. Reu. Nucl. Part. Sci. 39, 259(1989).
(3],SRMishra el al., Nevis Preprint # 1459; submitted to Phys. Rev. Lelt.
[4] W.C.Leung et al., Nevis Preprint # 1460; submitted to Phys. Rev. Lett. Also
see W.C.Leung, Ph.D. Thesis, Columbia University, 1991.
[5] P.Z.Quintaa et al., Nevis Preprint # 1461; submitted to Phys. Rev. Lett. Also
see P.Z.Quintas, Ph.D. Thesis, Columbia University, 1991.
[S] W.K.Sakumoto et al., Nucl. Inst. Meth. A294, 179(1990); B.J.King el al., Nucl.
Inst. Meth. A302, 254( 1991).
[7] D.B.MacFarlane et al., Z.Phys. C26, l(1984); E.Oltman el al., Accepted for
publication in Z.Phys.C.
]8] CCFR: R.E.BI air cl al., Phys. Rev. Letl. 51, 343(1983); CCFR: P.Auchincloss
et al., Z. Phys. C48, 411(1990).
191 CDHSW: P.Berge et al., 2. Phys. C35, 443(1987).
[lo] P.Auchincloss et al., Z.Phys. C48, 411(1990); P.Z.Quintas et al., in prepa-
ration. Also see, S.R.Mishra,“Probing Nucleon Structure with v-N Experiment”,
Nevis Preprint #1426, review talk presented at the “Workshop on Hadron Struc-
ture Functions and Parton Distributions”, Fermilab, Batavia, April( 1990), World
Scientific, Ed.D.Geesaman et al.
[ll] S.Dasu el al., Phys. Rev. Lett. 61, 1061, 1988; L.W.Whitlow el al., Phys.Lett.
eB250, 193( 1990).
[12] C.Foudas et al., Phys. Rev. Letl. 64:1207, 1990; M.Shaevitz, review talk at
Neutrino ‘90.
1131 H.Georgi and H.D.Politzer, Phys. Rev. Dl4, 1829, 1976; R.M.Barnett, Phys.
Rev. Lelt. 36, 1163, 1976.
(14) A.De Rlijula et al., Nucl. Phys. B154:394, 1979. We have estimated the effect
of using the more detailed radiative correction calculation by D.Yu.Bardin et al.,
JZNR-E2-86-260 (1986). The difference between the two corrections was generally
very small, except at the lowest (z = 0.015) and the highest (z = 0.65) x-bins.
Our structure function results would, thus, change by a few percent if the Bardin’s
instead of the De Rlijula’s calculation were used. In a future publication we shah
present our results with Bardin’s calculation.
[15] CDHSW: P.Berge et al., Z. Phya. C49, 187(1991).
[lS] D.J.Gross and C.H.Llewyllyn Smith, Nucl. Phys. B14,337(1969); W.A.Bardeen
et al., Phys. Rev. D18,3998 (1978).
[17] B.A.Iijima and R.Jaffe, MIT Preprint CTP993, 1983; R.Jaffe private communi-
cation.
[18] Small t events have small angles. The muon angle resolution of the CCFR
detector is about 1.3mrad at the mean E,, of 100GeV; for details see W.K.Sakumoto
et al., Nucl. Inst. Meth. A294, 179(1990).
[19] Cur present value of SGLS (2.50) is lower than the earlier preliminary presen-
tations (2.66) [see S.R.Mishra, Talk at Lepton-Photon, 1991, Geneva]. Two small
changes in the assumptias of the analysis lowered SGLS. These changes, we be-
lieve, are more accurate than those employed earlier. See Ref.[7].
1201 S.R.Mishra,“Probing Nucleon Structure with v-N Experiment”, Nevis Preprint
-424-

#1426, review talk presented at the “Workshop on Hadron Structure Functions and
Parton Distributions”, Fermilab, Batavia, Apri1(1990), World Scientific, Ed.D.Geesaman
et al.
1211 Measurements of SGLS: a)CDHS: J.G.H.deGroot et al., Phys. tett. B82,
292(1979); b)CHARM: F.Bergsma el al., Phys. Lett. B123,269(1983); c)CCFRR:
D.B.MacFarlane et al., Z.Phys. C26, l(1984); d)WA25: D.Allasia et al., Phydett.
B135, 231(1984), ibid, Z.Phys. C28, 321(1985).
1221 A.Deveto et al., Phys. Rev. D27:508, 1983.
[23] SLAC: A.Bodek et al., Phys.Reu.Lett.. 50, 1431(1983); 51, 534(1983).
[24] BCDMS: A.C.Benvenuti et al., Phydett. B237,592(1990) (D-target); A.C.Benvenuti
et al., Phys.Lett. B195, 91(1987) (C-target).
1251 EMC: J.J.Aubert el al., Nucl.Phya. B272, 158(1986) (Fe Target); J.Ashman
et al., Phys.Lett. B202, 603(1988) (D Target). The additional low-x deuterium
data were obtained from S.J.Wimpenny.
-425-