Embed Size (px)
Citation preview

Reynolds and Berridge Emotional environments retune valence in nucleus accumbens
1
Supplementary figures
Figure S1. Environmental preferences. Environmental self-administration tests revealed a linear preference hierarchy for environments: Home> Standard > Stressful. Rats much preferred to receive sound and light levels of their Home environment (which was dark and quiet) over Standard lab environment (A; preferences shown for each successive 15-min time bin in a 1-hr test). Conversely, rats strongly avoided levels of the Stressful environment (which contained loud Iggy Pop music and bright lights) relative to Standard environment (B; **p<.001 compared to Standard).
Figure S2. Additional Fos plume controls. Surgical implantation of a microinjection cannula produces a very small Fos plume, perhaps due to gliosis, even without an actual microinjection. This can be seen by comparing to Fos expression in medial shell of a ‘virgin brain’ that has had no surgery. Implantation-induced local Fos may contribute to Fos elevation in vehicle & DNQX plumes. Therefore for the purpose of mapping function zones here, we used the comparison of DNQX plumes versus vehicle plumes, because that comparison was also used to contrast behavioral effects.
*
A. DNQX microinjection B.Vehicle microinjection
F. DNQX-injector tip plume
>400%
>300%
>200%
Above control
C. Injector tip control
*
D.Virgin control
*
G.Vehicle-injector tip plume
* *
340 μmAbsolute counts
>5
>3
>1
* **
E. DNQX-vehicle plume
*
340 μm
Context preferenceA. Home vs. Standard
15-min time bin1 2 3 4
)ces(e
miT
0
200
400
600
800
1,000HomeStandard
B. Standard vs. Stressful
15-min time bin1 2 3 4
)ces(e
miT
0
200
400
600
800
1,000StandardStressful
**
** ** **
**
** ** **

Reynolds and Berridge Emotional environments retune valence in nucleus accumbens
2
Figure S3 Coronal and horizontal summary maps of valence zones produced by DNQX microinjections. Coronal maps indicate appetitive zones may be biased dorsally in the rostral half of medial shell, while defensive zones may be biased ventrally in the caudal half (similar to sagittal maps). Horizontal maps confirm rostrocaudal conclusions about localization of valence functions. Coronal and horizontal sections adapted from Paxinos and Watson, 1997.
0 1 2 3123
Home
0 1 2123
Standard
0 1 2 312
Stressful
AcbSh
BNST
AOP
VDB
0 0.5 1.0 1.5Midline
AcbC
Medial Lateral
0
0.5
1.0
1.5
2.0
2.5
3.0
Bregma
Rostral
Caudal
AcbSh
BNST
AOP
VDB
AcbC
AcbSh
BNST
AOP
VDB
AcbC
Standard StressfulHome
Coronal valence maps
Horizontal valencemaps
3

Reynolds and Berridge Emotional environments retune valence in nucleus accumbens
3
Figure S4. Horizontal maps for ingestive and defensive behaviors. The horizontal perspective on data in Figur e 2 of main paper.
AcbSh
BNST
AOP
VDB
0 0.5 1.0 1.5Midline
AcbC
Medial Lateral
0
0.5
1.0
1.5
2.0
2.5
3.0
Bregma
Rostral
Caudal
AcbSh
BNST
AOP
VDB
0 0.5 1.0 1.5Midline
AcbC
Medial Lateral
0
0.5
1.0
1.5
2.0
2.5
3.0
Bregma
Rostral
Caudal
BNST
AOP
VDB
AcbSh
0 0.5 1.0 1.5Midline
AcbC
Medial Lateral
0
0.5
1.0
1.5
2.0
2.5
3.0
Bregma
Rostral
Caudal BNST
AOP
0 0.5 1.0 1.5Midline
AcbSh
VDB
AcbC
Medial Lateral
0
0.5
1.0
1.5
2.0
2.5
3.0
Bregma
Rostral
Caudal
AcbSh
BNST
AOP
VDB
0 0.5 1.0 1.5Midline
AcbC
Medial Lateral
0
0.5
1.0
1.5
2.0
2.5
3.0
Bregma
Rostral
Caudal
AcbSh
BNST
AOP
VDB
0 0.5 1.0 1.5Midline
AcbC
Medial Lateral
0
0.5
1.0
1.5
2.0
2.5
3.0
Bregma
Rostral
Caudal
Stressful
Standard
Home
A. Horizontalingestion maps
B. Horizontal defensivetreading maps
Reynolds and Berridge Emotional environments retune valence in nucleus accumbens
4
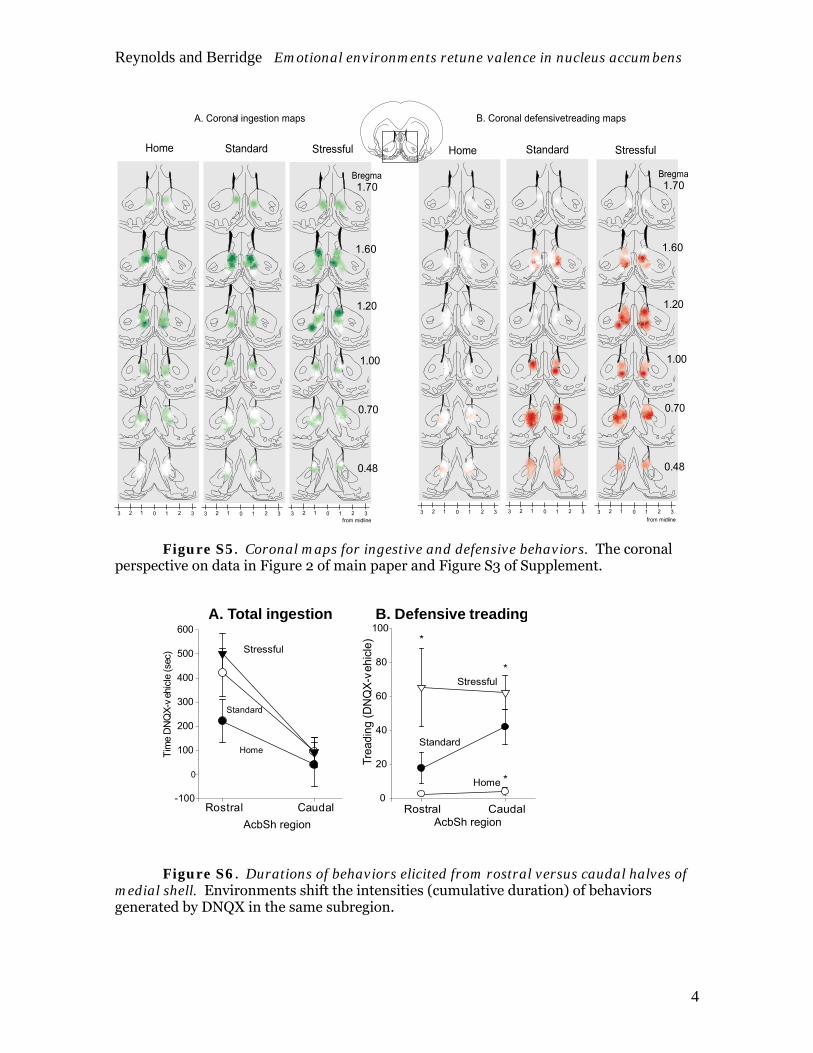
Figure S5. Coronal maps for ingestive and defensive behaviors. The coronal perspective on data in Figure 2 of main paper and Figure S3 of Supplement.
A. Total ingestion
Rostral Caudal
Tim
eD
NX
Q-v
ehic
le(s
ec)
-100
0
100
200
300
400
500
600
Home
Standard
Rostral Caudal
)elcihev-XQ
ND(
gnidaerT
0
20
40
60
80
100
Home
Standard
Stressful
*
*
B. Defensive treading
*
Stressful
AcbSh region AcbSh region
Figure S6. Durations of behaviors elicited from rostral versus caudal halves of medial shell. Environments shift the intensities (cumulative duration) of behaviors generated by DNQX in the same subregion.
0.48
0.70
1.00
1.20
1.60
1.70Bregma
0 1 2 3123
Stressful
0 1 2 3123
Standard
0 1 2 3123
Home
from midline0 1 2 3123
Stressful
0.48
0.70
1.00
1.20
1.60
1.70Bregma
0 1 2 3123
Standard
0 1 2 3123
Home
from midline
A. Coronal ingestion maps B. Coronal defensivetreading maps
Reynolds and Berridge Emotional environments retune valence in nucleus accumbens
5
Time (min)0 5 10 15 20 25 30 35 40 45 50 55 60
)elcihev
evobatnecre
p(noitsegnI
0
500
1,000
1,500
2,000
2,500 Ingestion )elcihev
evobatnecre
p(gnidaerT
-200
0
200
400
600
800
1,00
1,200
1,400Treading
A. Mixed sites behavior time course B. Minutes of 'mixed' or 'pure' valenceduring min 11-30
Mixed 12%
Pure 88%
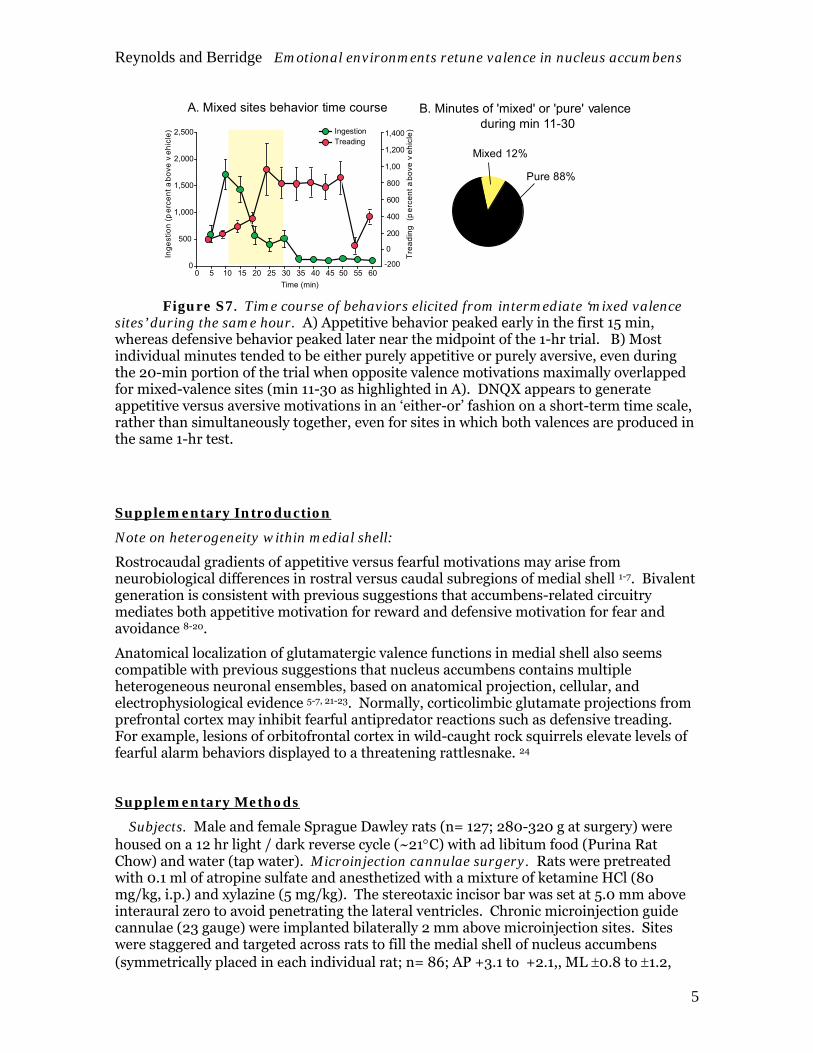
Figure S7. Time course of behaviors elicited from intermediate ‘mixed valence sites’ during the same hour. A) Appetitive behavior peaked early in the first 15 min, whereas defensive behavior peaked later near the midpoint of the 1-hr trial. B) Most individual minutes tended to be either purely appetitive or purely aversive, even during the 20-min portion of the trial when opposite valence motivations maximally overlapped for mixed-valence sites (min 11-30 as highlighted in A). DNQX appears to generate appetitive versus aversive motivations in an ‘either-or’ fashion on a short-term time scale, rather than simultaneously together, even for sites in which both valences are produced in the same 1-hr test.
Supplementary Introduction
Note on heterogeneity within medial shell:
Rostrocaudal gradients of appetitive versus fearful motivations may arise from neurobiological differences in rostral versus caudal subregions of medial shell 1-7. Bivalent generation is consistent with previous suggestions that accumbens-related circuitry mediates both appetitive motivation for reward and defensive motivation for fear and avoidance 8-20.
Anatomical localization of glutamatergic valence functions in medial shell also seems compatible with previous suggestions that nucleus accumbens contains multiple heterogeneous neuronal ensembles, based on anatomical projection, cellular, and electrophysiological evidence 5-7, 21-23. Normally, corticolimbic glutamate projections from prefrontal cortex may inhibit fearful antipredator reactions such as defensive treading. For example, lesions of orbitofrontal cortex in wild-caught rock squirrels elevate levels of fearful alarm behaviors displayed to a threatening rattlesnake. 24
Supplementary Methods
Subjects. Male and female Sprague Dawley rats (n= 127; 280-320 g at surgery) were housed on a 12 hr light / dark reverse cycle (~21°C) with ad libitum food (Purina Rat Chow) and water (tap water). Microinjection cannulae surgery. Rats were pretreated with 0.1 ml of atropine sulfate and anesthetized with a mixture of ketamine HCl (80 mg/kg, i.p.) and xylazine (5 mg/kg). The stereotaxic incisor bar was set at 5.0 mm above interaural zero to avoid penetrating the lateral ventricles. Chronic microinjection guide cannulae (23 gauge) were implanted bilaterally 2 mm above microinjection sites. Sites were staggered and targeted across rats to fill the medial shell of nucleus accumbens (symmetrically placed in each individual rat; n= 86; AP +3.1 to +2.1,, ML ±0.8 to ±1.2,

Reynolds and Berridge Emotional environments retune valence in nucleus accumbens
6
DV-5.5 to -5.7 bregma). Microinjection cannulae were anchored to the skull with screws and acrylic cement, and a stainless steel obturator was inserted into each microinjection guide cannulae to help prevent occlusions. Each rat received prophylactic penicillin (aquacillin; 45,000 U, i.m.) after surgery. At least 7 days were allowed for recovery before behavioral testing.
Drugs and Intracerebral Microinjections. To allow for optimal modulation of drug-elicited behavior by environmental context, a 250 ng dose per microinjection (500 ng bilateral dose per rat) was selected to reliably elicit motivated behaviors at low to moderate intensities, based on a previous study 25. The AMPA/kainate glutamate receptor antagonist, DNQX (6,7-dinitroquinoxaline-2,3(1H,4H)-dione; Sigma, St. Louis, MO) was dissolved in 50% DMSO / 50% 0.15 M saline (250 ng / 0.5 μl). DMSO/saline was also used for vehicle control microinjections. Microinjection cannulae (29 gauge) extended 2.0 mm beyond the ventral tip of the guide, and were attached to a syringe pump via PE-20 tubing. The animals were gently hand-held while they were bilaterally infused with a microinjection volume of 0.5 μl at a rate of 0.30 μl / min. After infusion, the injectors remained in place for an additional 60 sec to allow for drug diffusion before their withdrawal and replacement of the obturators. The rat was placed immediately afterwards in chambers for behavioral testing. Each rat received DNQX or vehicle microinjections in counterbalanced order, spaced 48 hrs apart.
Environments & Behavioral Testing. Home environment was designed to be familiar and comfortable. Rats were tested individually in the room and cages they lived in, under dim red lighting appropriate to their reverse light cycle (red lighting only; 5-10 lux within cage), and very low noise (65-70 decibels within cage, primarily static noise from ventilation systems). Rats were briefly removed a few feet from their home cage for microinjections prior to behavioral tests (approximately 5 min), and then returned and left undisturbed in their Home cage during testing. Behavior was videotaped for later analysis.
Standard lab environment was designed to be of moderate valence and equivalent to previous studies. Rats were tested in conventional laboratory test rooms illuminated by standard white fluorescent ceiling lights (intensity 550-650 lux), and slight ambient noise (sound intensity 65-70 decibels measured within cage). Rats were placed in their home cage on a transport cart immediately prior to testing, moved down a hallway 30 m to the animal testing room, given microinjections and placed into the clean test chamber in lab.
The Stressful environment was designed to be over-stimulating and potentially avoided. Similar to Standard described above, but with additional incandescent lamps brightly illuminating the test chamber (1,000-1,300 lux within cage). Additional sound, chosen to be discordant and unpredictable, was presented continuously during the test (loud punk rock music, 80-86 decibels measured within rat’s chamber; continuous full-album soundtrack from “King Biscuit Flower Hour presents Iggy Pop” [2001] by the musician Iggy Pop, tracks 1-17).
Testing for environmental preference. To independently confirm relative preference ranks for the 3 environments, rats (n=16; not used for mapping study) were given 1-hr free-choice preference tests, between pairs of either Home/Lab environments or Lab/Stressful environments. Choices were made in a 3-compartment place preference apparatus containing two large chambers (28 x 21 x 21 cm, which differed in wall brightness and floor texture), surrounding a smaller central compartment (12 x 21 x 21 cm). Entry into an end-compartment activated a switch that activated an assigned environmental stimulation/valence condition. Rats could change their environment at any moment by moving to the far opposite end compartment, or continue to receive their current environment by remaining in the proximal 2 compartments. Rats chose between Home (dim 6-10 lux red lighting; quiet 60-70 dB within chamber) versus Standard (room

Reynolds and Berridge Emotional environments retune valence in nucleus accumbens
7
lighting 600-700 lux; quiet 60-70 dB) levels of light and sound (n=8); or between Standard versus Stressful levels (bright 1,000-1,200 lux; loud 80-85 dB sound; n=8; the track began from where it had left off each time the rat re-activated the Iggy Pop album). Crossings were continuously monitored by infrared photobeam detectors at the entrance to each compartment. Each session was videotaped and later scored for cumulative time spent in each compartment in 15-min bins (a rat was considered to be in a particular compartment whenever its head and both forelimbs were across the threshold). For statistical analysis, each comparison group was analyzed by 2-way ANOVA for duration (in sec) spent in each Environment (Home, Standard, or Stressful) versus Time (4 15-min bins of test session), with post hoc test performed with Bonferroni.
Testing for environmental modulation. Fear/feeding behaviors elicited by DNQX microinjection were tested on a between-subject comparison in the 3 environments described above (n=87): Home (n=31), Standard (n=27), and Stressful (n=29). Each rat was tested in a single environment (to avoid confounds of contrast or habituation effects across serial presentations), and function maps of medial shell were contrasted on a between-subject basis across environments.
Test chambers were transparent plastic tub cages (23 x 20 x 45 cm) containing pre-weighed food placed on the cage floor (~20 g chow pellets), a water spout, and clean wood shavings spread 2.0 cm in depth across the chamber floor (except in home condition where shavings had been lived in for 12 hr to provide familiar odor). In the Stressful condition the Iggy Pop album played continuously for 1 hr. Our previous studies found that such wood shavings can be used by a rat for defensive treading behavior after DNQX or muscimol microinjections in medial shell, during which the shavings are typically piled into mounds often positioned between the rat and its perceived threat, such as the transparent front wall that revealed the experimenter 25. Each rat was habituated for 4 consecutive days to handling and 1-hr exposure to its chamber environment before behavioral testing, and received a vehicle microinjection on the final habituation day.
Behavioral tests of fear and feeding. We simultaneously measured appetitive eating behavior and defensive treading behavior using the 60-min behavioral test described in our previous studies 25, 26. The behavior of each rat was videotaped for later off-line analysis of behavioral quantities. To measure grams of food eaten, the remaining food pellets were re-weighed after the 60 min test. The bedding and floor of the cage were also inspected for any food crumbs, which were separated and weighed (but this check never revealed more than a minimal dusting of crumbs, i.e. <0.5 gm).
Videoscoring. Videotaped behaviors were scored by an experimenter who was blind to drug treatment. Behavior was analyzed for cumulative time spent in sec: 1) eating duration (scored whenever a rat’s mouth touched or showed continual rhythmic chewing movements), 2) drinking duration (tongue in contact with water spout), 3) defensive treading duration (alternating movements of both forepaws or of a single forepaw forward-and backward, rapidly repeated and emitted in continuous bouts of at least 1 sec, which shoved or sprayed the wood shavings forward), 4) grooming duration (licking of the forepaws or body, or face washing via paw strokes), as well as incidents of 5) locomotion (across entire length of chamber), and 6) rears (vertical rise on hindlegs). Histology. Rats used for behavioral testing received equivalent microinjections of India ink after anesthesia, were perfused transcardially, and their brains sliced and processed for cresyl violet staining to determine locations of microinjection sites.
Fos plume measurement of local drug impact & spread. To assess the spread and density of neuronal activation, Fos plumes caused by a DNQX microinjection were assessed by c-fos immunohistochemistry, using an immunofluorescence modification of a Fos plume mapping tool27-30, in separate rats that were treated identically as in behavioral tests. Different groups received either DNQX microinjections (n=8) or vehicle microinjections

Reynolds and Berridge Emotional environments retune valence in nucleus accumbens
8
(n=8). Two additional control groups received cannulae implantation and insertion of injector tips but no actual microinjection (injector tip controls; n=4) or no surgery at all (virgin controls; n=4). An immunofluorescent modification was used because it reveals Fos plumes around the microinjection tract more vividly than DAB staining, in part because immunofluorescence has near-zero levels of non-specific background labeling. Adjacent sections were immunoperoxidase processed for DAB because that original Fos plume technique best allows identification of anatomical landmarks relative to Fos plumes, and thus best allows identification of the anatomical site of a plume within the accumbens shell.
Fos-like protein immunohistochemistry. Ninety minutes after microinjection, rats were deeply anesthetized with sodium pentobarbital prior to transcardial perfusion. Brains were removed and placed in 4% formaldehyde overnight, and then transferred to 30% sucrose. Two adjacent series of 40 μm sections were sliced through the coronal plane with a sliding microtome and stored in 0.1 M SPB (sodium phosphate buffer, pH 7.4). Allternate series of sections were processed for immunoperoxidase and immunofluorescence.
For immunofluorescence processing, sections were immersed in succession with gentle agitation and intervening rinses in SPB-Trition containing: 1) 5% NDS for 30 min, 2) 5% NDS and goat anti-cfos (1:500) overnight at 4°C, 3) 5% NDS, and 4) 5%NDS and donkey anti-goat AlexaFluor 488 (excitation=488 nm, emission=519 nm; Molecular Probes-Invitrogen, Carlsbad, CA) for 1 hr. Sections were then mounted, air-dried, and coverslipped with ProLong Gold antifade reagent (Molecular Probes Invitrogen, Eugene, OR). For immunoperoxidase processing, tissue sections were processed as described previously27-29.
Fos plume identification. Fos-like immunoreactivity was visualized using a Leica microscope equipped for both brightfield and fluorescence microscopy. A filter with an excitation band at 480-505 nm and an emission band at 505-545 nm was used for fluorescence visualization. Our procedure for measuring drug-induced Fos plumes immediately surrounding a local microinjection site was modified slightly from that previously described 27, 29. Briefly, because guide cannulae were implanted at a backwards angle to avoid the lateral ventricles, the largest fos plume was located just caudal to the track of tissue damage cause by the cannulae and injector tip, where a small focal point of necrosis was still evident surrounded by the fos plume. This was taken to be the center, and fos-labeled cells were individually counted within successive blocks (68 μm x 68 μm) along each of 8 radial arms emanating from it (0°, 45º, 90º, 135º, 180º, 225º, 270º, 315º) with 5x-10x magnification (Fig. 2).
Fos plume assessment. Zones of Fos elevation were classified as either intense (central plume; >10 times increase in Fos over virgin controls in medial shell; > 4 times increase over the levels produced by vehicle microinjections at equivalent locations), moderate (intermediate plume; >5 times increase over virgin controls, and >3 times over vehicle controls), and mild (outer plume; >3 times over virgin controls and >2 times over vehicle controls). Note: DMSO added to saline for vehicle itself mildly stimulated Fos expression compared to saline microinjection alone ((1, 165)=22.2; p<.005), which lowered vehicle-relative Fos increases produced by DNQX, and so a slightly lower criteria for Fos elevation over vehicle was used than in some earlier studies 27-29.
Mapping procedure of microinjection plumes for localization of function. Cannulae placements from rats used in behavioral experiments were plotted by identifying the midway point on the vertical line between the bottom of the cannula and the ventral edge of the ink 180º below, and plotting on a coronal atlas. The same dorsal-ventral and medial-lateral coordinates were used for plotting in sagittal and horizontal planes, and the anterior-posterior coordinate was taken from the coronal page or from the midpoint

Reynolds and Berridge Emotional environments retune valence in nucleus accumbens
9
between two adjacent atlas pages (if the slice appeared intermediate between atlas sections; +0.1 to 0.2 mm accuracy31).
Functional Fos plume mapping of microinjection effects on behavior. Fos plumes
were measured to have approximately 0.01 to 1.5 mm3 volumes surrounding sites of DNQX microinjections (compared to vehicle or sham microinjections; Figure 1 and Supplementary Figure 2). DNQX Fos plumes contained intense centers, where the density of Fos-expressing neurons was elevated >4X over vehicle, of 0.009 mm3 volume (0.13 mm radius), surrounded by middle and outer halos of 0.5 to 1.7 mm3 volume (0.5 mm middle radius of >3X Fos elevation; 0.74 mm outer radius of >2X elevation).
Colors for symbols and halos were assigned to represent the magnitude of behavioral effects produced by DNQX (250 ng) microinjections at each microinjection site. The sagittal plane best represents the entire rostrocaudal and dorsoventral extent of medial shell and so was used to map Fos plumes and localization of functions 31. Functional maps were plotted separately for Home, Standard, and Stressful contexts using the stereotaxic atlas of Paxinos and Watson, 1997.
To assess valence reversals of a location induced by environments, site centers were placed into 0.2 mm2 identified squares in medial shell [checkerboard 8 X 10]. We divided the entire medial shell into (63 sagittal squares in medial shell; each square 0.2 mm X 0.2 mm in sagittal view; 8 squares per row and 10 per column=80 squares minus squares falling outside boundaries of the shell= 63 shell squares). Each square-location was assigned a dominant valence based on behavioral data from each environment.
Statistical analysis. Each behavior was first examined by 3-way ANOVA (Drug,
Environment, Site). To examine how DNQX altered behavior in each environment, behavior elicited at each anatomical site was examined by 2-way repeated measures ANOVA (one-factor repetition) for Environment and Drug. To examine differences in magnitude of behavior elicited in each environment, DNQX-vehicle scores were computed and examined by two-way ANOVA (Environment by Site). When significant differences were found, data was further analyzed with 1-way ANOVA, followed by post hoc tests performed by Bonferroni. Analysis of proportion of animals displaying behaviors was performed by Chi-Squared test.
Supplementary Results
Fos plume identification of DNQX sphere of influence. DNQX elevated local Fos expression >200% in roughly a 0.02 to 0.4 mm3 volume around the microinjection site (Figure 2). In a typical Fos plume, DNQX stimulated > 4 times elevation in Fos over vehicle-control levels in an intense inner zone of 0.13 ± .021 mm radius (corresponding to 0.002 mm3 spherical volume; volume =4/3 radius3). The intense center was surrounded by an intermediate zone of 0.50 ± .071 mm radius (0.125 mm3 volume) of >3 times Fos elevation over vehicle, and by an outer zone of 0.74 ± .057 mm radius (0.405 mm3 volume) of >2 times Fos elevation.
Thus, given that the entire medial shell volume is ~2.87-mm3, each DNQX plume center filled ~0.07% of total medial shell, its intermediate halo sphere filled ~4.4% of medial shell, and its outer halo sphere filled 14% of medial shell. Microinjections near borders of the shell may have filled less shell if they partially penetrated into other neighboring structures, such as the medial core or bed nucleus of the stria terminalis. However, observed penetration of those adjacent structures was never deeper than 0.5 mm, and was only by outer plumes of mild Fos elevation. We concluded that the intense centers, and the bulk of all Fos plumes were contained in the medial shell for data reported here.

Reynolds and Berridge Emotional environments retune valence in nucleus accumbens
10
Valence reversal of sites (2mm2 location squares). In the caudal half of shell, 58% of locations were purely ingestive during the Home condition, but these dropped to 0% in Standard and Stressful conditions. Conversely, the number of locations in the caudal half of shell that were purely fearful roughly tripled from 27% in Standard condition to 71% in the Stressful condition that contained bright light and Iggy Pop sound (and were cut in half to 13% in Home condition). Some valence switches extended into rostral shell: 20% of rostral locations generated purely fearful behavior after DNQX under Stressful condition, compared to 0% in Standard and Home conditions.
Purity vs. within-site mixture of positive-negative valence. For intermediate ‘mixed valence sites’ that generated both positive-valenced and negative-valenced behaviors in Stressful or Standard conditions, we assessed whether both eating and treading behaviors were generated simultaneously, sequentially, or in alternation by examining the time course of behavior. A sequential organization was revealed: appetitive behavior typically emerged first within a few minutes after DNQX microinjections, and later was replaced by aversive behaviors after 20-30 min (Figure 6). For example, eating peaked at 400% elevation in the first 20 min (Stressful, DNQX, mixed-valence sites) and subsequently dropped rapidly down to near zero for the final 30 min (ANOVA (Time) F(11,194)=17.86; p<.001). By contrast, defensive treading did not peak until approximately 30 min, and subsequently remained high until 60 min (F(11,251)=4.54; p<.001). Even within the transitional period between 11-30 min, nearly all minutes (88%) for any given rat were either ‘purely ingestive’ or ‘purely defensive’. Thus most of the valence mixture during transition came from combining together data contributed by different rats. The pattern suggested that the valence of motivated behavior typically switched from food intake to defensive treading in a particular minute sometime within the 30 min after DNQX microinjection, and then remained consistently defensive. The effect of Home environment was to prevent temporal shifts from appetitive to defensive for intermediate shell sites. Conversely, the effect of the Stressful condition that contained loud Iggy Pop sound and bright light was to expand the range of sites that shifted, and to increase the proportion and intensity of purely defensive sites as described below. While the mechanism for temporal shifts remains unclear, it is conceivable that high local DNQX dose might facilitate appetitive behavior soon after the microinjection, while later a greater anatomical spread might facilitate defensive valence. Alternatively, the temporal transition might arise from larger corticolimbic circuit-level factors.
Target of positive ingestive behaviors: eating versus drinking. Overall, the amount of eating behavior stimulated by DNQX in rostral shell remained similar across all three environments because the Stressful condition converted purely ingestive sites into mixed sites that still elicited ingestion as well as fearful behavior (ANOVA (Environment x Drug) F(2,83)=2.45; p=.10).
DNQX-motivated appetitive behavior also was redirected among food versus water targets by environment. In Standard and Stressful conditions, ingestive behavior was almost purely eating (directed towards food pellets), but ingestion became expanded in Home condition to include drinking too (directed toward the water spout; F(2,41)=3.32; p<.05). In Standard or Stressful conditions, only 15% of rostral sites evoked any DNQX-stimulated drinking at all (and overall water intake was not enhanced by DNQX) whereas 80% - 90% of rostral sites supported DNQX-stimulated increases in food intake (Standard= F(1,23)=17.23; p<.01; Stressful = (F(1,29)=32.38; p<.001). In Home condition, 100% of rostral sites supported DNQX increases in drinking (F(2,83)=4.35; p<.05). Of those, 60% of rostral sites evoked only drinking behavior (and no food intake), whereas 40% evoked increases in both eating and drinking behaviors (incidence analysis z=3.19; p=.001). The duration of DNQX-stimulated eating behavior was consequently less in Home condition than in other conditions (F(2,41)=4.81; p<.05), perhaps due to competition from increased drinking. That pattern kept the total cumulative duration of

Reynolds and Berridge Emotional environments retune valence in nucleus accumbens
11
ingestive behavior (eating + drinking) elicited by DNQX at sites in the rostral half of shell similar across all 3 conditions (Suppl Fig. 1). These results support suggestions that DNQX-stimulation of eating may reflect a flexible motivation to ingest, rather than specific hunger for food 21, 32.
Other Behaviors. No rostrocaudal effects of DNQX were found for locomotion, rearing, or grooming behaviors.
Behavior after vehicle microinjections. Rats ate less than 50% of DNQX-evoked levels in Home environment after vehicle microinjections. However, rats still ate, drank and groomed more in Home condition than they did after vehicle in Standard lab or Stressful conditions (ANOVA (Environment) F(2,85)= 6.17 to 12.01; p<.001). Conversely, when tested in Stressful condition rats emitted only 14% levels of defensive treading behavior after vehicle microinjections compared to DNQX, but still more than after vehicle microinjections in Home or Standard conditions (F(2,85)=6.39; p<.01). Supplementary References 1. Alheid, G.F., et al. in The Basal Ganglia IV (ed. G. Percheron, J.S. McKenzie & J.
Feger) 95-107 (Plenum Press, New York, 1994). 2. Heimer, L., et al. J Neuropsychiatry Clin Neurosci 9, 354-381. (1997). 3. Reynolds, S.M. & Zahm, D.S. J Neurosci 25, 11757-11767 (2005). 4. Zahm, D.S., Grosu, S., Irving, J.C. & Williams, E.A. Brain Res 978, 141-154 (2003). 5. Berridge, C.W., Stratford, T.L., Foote, S.L. & Kelley, A.E. Synapse 27, 230-241.
(1997). 6. De Souza, E.B., et al. J Neurosci 5, 3189-3203. (1985). 7. Delfs, J.M., Zhu, Y., Druhan, J.P. & Aston-Jones, G.S. Brain Res 806, 127-140.
(1998). 8. Cardinal, R.N., Parkinson, J.A., Hall, J. & Everitt, B.J. Neurosci Biobehav Rev 26,
321-352. (2002). 9. Kalivas, P.W. & Volkow, N.D. Am J Psychiatry 162, 1403-1413 (2005). 10. Price, J.L. J Comp Neurol 493, 132-139 (2005). 11. Schoenbaum, G., Roesch, M.R. & Stalnaker, T.A. Trends Neurosci 29, 116-124
(2006). 12. Barch, D.M. Schizophr Bull 31, 875-881 (2005). 13. Salamone, J.D. Behavioural brain research 61, 117-133. (1994). 14. Horvitz, J.C. Behavioural brain research 137, 65-74 (2002). 15. Levita, L., Dalley, J.W. & Robbins, T.W. Behavioural brain research 137, 115-127
(2002). 16. Volkow, N.D. & Wise, R.A. Nature neuroscience 8, 555-560 (2005). 17. Kringelbach, M.L. Neuroscience 126, 807-819 (2004). 18. Alvarez, E.O. & Ruarte, M.B. Behavioural brain research 123, 143-153. (2001). 19. Ploghaus, A., et al. J Neurosci 21, 9896-9903. (2001). 20. Zald, D.H. & Pardo, J.V. Neuroimage 16, 746-753. (2002). 21. Carelli, R.M., Ijames, S.G. & Crumling, A.J. J Neurosci 20, 4255-4266. (2000). 22. Pennartz, C.M., Groenewegen, H.J. & Lopes da Silva, F.H. Progress in
neurobiology 42, 719-761. (1994). 23. Voorn, P., Gerfen, C.R. & Groenewegen, H.J. J Comp Neurol 289, 189-201. (1989). 24. Ennis, M. & Coss, R.G. Behav Neurosci 120, 1299-1307 (2006). 25. Reynolds, S.M. & Berridge, K.C. Eur J Neurosci 17, 2187-2200 (2003). 26. Reynolds, S.M. & Berridge, K.C. J Neurosci 21, 3261-3270. (2001). 27. Peciña, S. & Berridge, K.C. Brain Research 863, 71-86 (2000). 28. Pecina, S., Schulkin, J. & Berridge, K.C. BMC Biol 4, 8 (2006).

Reynolds and Berridge Emotional environments retune valence in nucleus accumbens
12
29. Smith, K.S. & Berridge, K.C. J Neurosci 25, 8637-8649 (2005). 30. Pecina, S. & Berridge, K.C. J Neurosci 25, 11777-11786 (2005). 31. Paxinos, G. & Watson, C. The Rat brain in stereotaxic coordinates (Academic
Press, San Diego, 1998). 32. Hanlon, E.C., Baldo, B.A., Sadeghian, K. & Kelley, A.E. Psychopharmacology 172,
241-247 (2004).