Embed Size (px)
Citation preview

REVISED GEOTECHNICAL INVESTIGATION REPORT
GYMNASIUM EXPANSION PACIFIC HIGH SCHOOL
CITY OF SAN BERNARDINO, SAN BERNARDINO COUNTY, CALIFORNIA
CONVERSE PROJECT NO. 18-81-134-03
Prepared For: SAN BERNARDINO CITY UNIFIED SCHOOL DISTRICT
Mr. Thomas Pace Director of Facilities 956 West 9th Street
San Bernardino, CA 92411
Presented By: CONVERSE CONSULTANTS
2021 Rancho Drive, Suite 1 Redlands, CA 92373
909-796-0544
May 6, 2019
Converse Consultants Geotechnical Engineering, Environmental & Groundwater Science, Inspection & Testing Services
2021 Rancho Drive, Suite 1, Redlands CA 92373
Telephone: (909) 796-0544 ♦ Facsimile: (909) 796-7675 ♦ www.converseconsultants.com
May 6, 2019 Mr. Thomas Pace Director of Facilities San Bernardino City Unified School District 956 West 9th Street San Bernardino, CA 92411 Subject: REVISED GEOTECHNICAL INVESTIGATION REPORT
GYMNASIUM EXPANSION Pacific High School 1020 Pacific Street
City of San Bernardino, San Bernardino County, California Converse Project No. 18-81-134-03
Dear Mr. Pace: Converse Consultants (Converse) has prepared this report to present the results of our geotechnical investigation conducted for the gymnasium expansion located at 1020 Pacific Street, northern side of the existing Pacific High School in the City of San Bernardino, San Bernardino County, California. This report was prepared in accordance with our Proposal dated August 28, 2018 and your Assignment of Project dated September 18, 2018.
Based on our field investigations, laboratory testing and engineering analysis, we conclude that the site is suitable for the proposed development from a geotechnical standpoint provided the recommendations presented in this report are incorporated during the design and construction of the project. We appreciate the opportunity to be of service to San Bernardino City Unified School District (SBCUSD). Should have any questions, please do not hesitate to contact us at 909-796-0544. CONVERSE CONSULTANTS
Hashmi S. E. Quazi, PhD, PE, GE Principal Engineer/Regional Manager Dist.: 4/Addressee ZA/JB/SM/HSQ/KVG

Revised Geotechnical Investigation Report Gymnasium Expansion
Pacific High School 1020 Pacific Street
City of San Bernardino, San Bernardino County, California May 6, 2019
Page ii
Converse Consultants M:\JOBFILE\2018\81\18-81-134 SBCUSD, New Diesel Technology Center\Report\18-81-134-03_RGIR
PROFESSIONAL CERTIFICATION
This report has been prepared by the following professionals whose seals and signatures appear hereon. The findings, recommendations, specifications and professional opinions contained in this report were prepared in accordance with the generally accepted professional engineering and engineering geologic principle and practice in this area of Southern California. We make no other warranty, either expressed or implied.
Zahangir Alam, PhD, EIT Jay Burnham, PG Senior Staff Engineer Senior Staff Geologist
Hashmi S. E. Quazi, PhD, PE, GE Scot Mathis, PG, CEG Principal Engineer Senior Geologist
Revised Geotechnical Investigation Report Gymnasium Expansion
Pacific High School 1020 Pacific Street
City of San Bernardino, San Bernardino County, California May 6, 2019
Page iii
Converse Consultants M:\JOBFILE\2018\81\18-81-134 SBCUSD, New Diesel Technology Center\Report\18-81-134-03_RGIR
EXECUTIVE SUMMARY The following is a summary of our geotechnical investigation, conclusions and recommendations as presented in this report. Please refer to the pertinent section of the attached report for complete conclusions and recommendations. In the event of a conflict between this summary and the report, or an omission in the summary, the report shall prevail. It is planned to demolish approximately 2,200 square feet front entry and construct a
new 6,920 square feet lobby with supporting amenities as a part of existing gymnasium expansion. The addition of building will likely be a combination of steel, concrete and masonry with shallow foundation and slab-on-grade. The structural loads are not known at this time but are anticipated to be moderate.
The project site is located at the northern side of the Pacific High School, which has
a street address of 1020 Pacific Street in the City of San Bernardino, San Bernardino County, California. We anticipate the existing building is serviced by underground water and sewer pipeline. The high school is bounded by Pacific Street to the south, Perris Hill Park Road to the west, open land to the north, and residential property to the east. The high school consists of multiple one- and two-story structures, tennis, baseball and basketball courts, a football field, and parking lots. The project site is relatively flat, with an elevation of approximately 1,132 feet above mean sea level (amsl). Perris Hill, with an approximate peak elevation of 1,300 feet amsl, is located approximately 650 feet northeast of the site. The coordinates for the project site are approximately 34.1298° north latitude and 117.2635° west longitude. The area surrounding the buildings is covered with landscaping and paved with asphalt/cement concrete.
Our scope of work was developed based on CGS – Note 48 and included project
set-up, subsurface exploration, laboratory testing, engineering analysis, and preparation of this report.
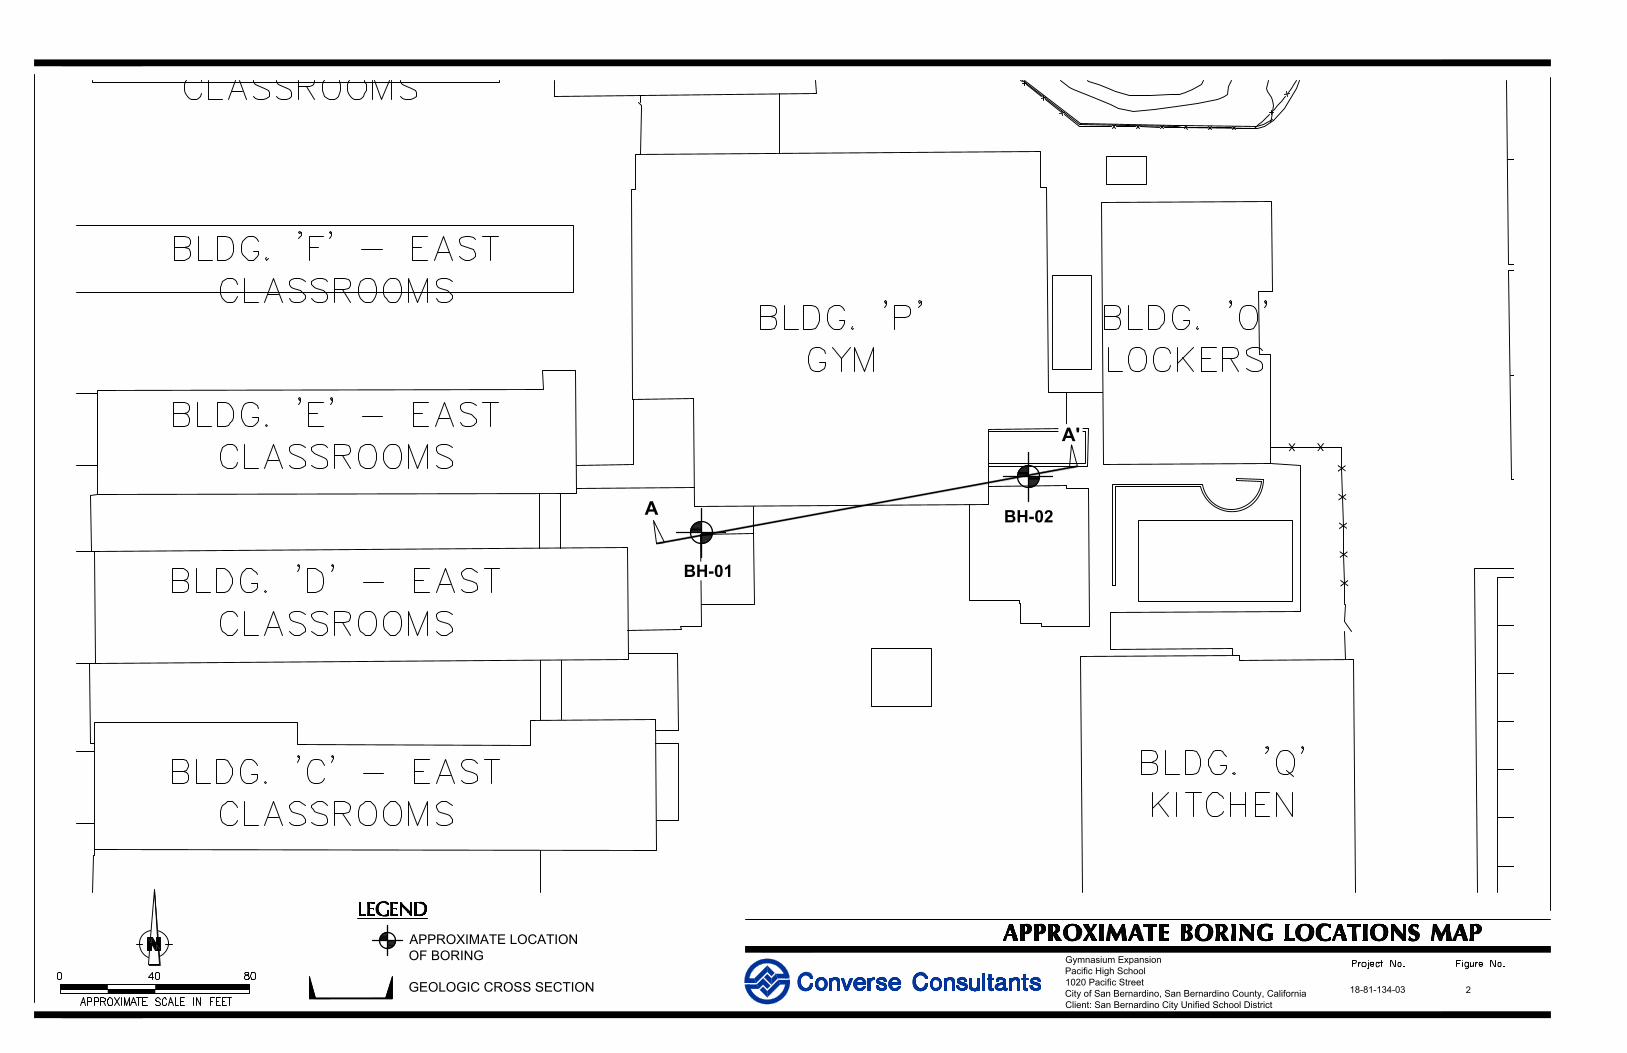
Two exploratory borings (BH-01 and BH-02) were drilled on October 2, 2018 to
investigate the subsurface conditions at the site. The borings were advanced to maximum planned depths of 21.5 and 51.5 feet bgs.
The subsurface soil at the project site consisted primarily of unconsolidated alluvial
soils as a mixture of sand and silt. A sand layer was observed at depths between 30.0 to 35.0 and 20.0 to 21.5 feet bgs in borings BH-01 and BH-02, respectively. A gravelly sand layer was observed at depth between 35.0 to 51.5 feet bgs in boring BH-01. Based on hammer blow counts, the upper 10 feet soils are loose to medium dense. Relative compaction of the upper 10 feet soils varies from 78 to 86 percent.

Revised Geotechnical Investigation Report Gymnasium Expansion
Pacific High School 1020 Pacific Street
City of San Bernardino, San Bernardino County, California May 6, 2019
Page iv
Converse Consultants M:\JOBFILE\2018\81\18-81-134 SBCUSD, New Diesel Technology Center\Report\18-81-134-03_RGIR
Groundwater was not encountered in our exploratory borings to a maximum explored depth of 51.5 feet bgs. Several of the referenced groundwater wells have been monitored for many decades and display a trend of long-term decline in local groundwater levels, likely due to groundwater pumping and development of the area. Considering regional development and sustained groundwater usage, groundwater levels are unlikely to return to the historically shallow levels. Current groundwater is generally expected to be deeper than 50 feet bgs and the historical high groundwater is approximately 38 feet bgs. Based on the current groundwater condition, dewatering is not expected to be required during construction of the building. It should be noted that the groundwater level could vary depending upon the seasonal precipitation and possible groundwater pumping activity in the site vicinity. Shallow perched groundwater may be present locally, particularly following precipitation.
The site is not located within a San Bernardino County or State of California
Earthquake Fault Zone. There are no known active faults projecting toward or extending across the project site. The potential for surface rupture resulting from the movement of nearby major faults is not known with certainty but is considered low.
Based on a site-specific dynamic settlement analysis, the site has a liquefaction
induced settlement potential of up to 1.85 inches. Based on the flat nature of the proposed site configuration, lateral spreading is not
considered a risk. Lateral spreading, Landsliding, seiches, tsunamis, and earthquake-induced flooding is considered to be low.
The expansion index (EI) of the upper 5 feet sample was 5, corresponding to very
low expansion potential. The sulfate contents of the sampled soils correspond to American Concrete Institute
(ACI) exposure category S0 for these sulfate concentrations. No concrete type restrictions are specified for exposure category S0. A minimum compressive strength of 2,500 psi is recommended. The chloride contents of the sampled soils correspond to American Concrete Institute (ACI) exposure category C1 (concrete is exposed to moisture, but not to external sources of chlorides). For exposure category C1, ACI provides concrete compressive strength of at least 2,500 psi and a maximum chloride content of 0.3 percent.
The measured value of the minimum electrical resistivities of the sample when saturated were 1,213 to 6,548 Ohm-cm for the site. This indicates that the soils tested are corrosive to moderately corrosive to ferrous metals in contact with the soil. A corrosion engineer should be consulted for corrosion mitigation measures for ferrous metals in contact with the soil.
Revised Geotechnical Investigation Report Gymnasium Expansion
Pacific High School 1020 Pacific Street
City of San Bernardino, San Bernardino County, California May 6, 2019
Page v
Converse Consultants M:\JOBFILE\2018\81\18-81-134 SBCUSD, New Diesel Technology Center\Report\18-81-134-03_RGIR
Prior to the start of any earthwork, the site of the proposed gymnasium expansion should be cleared of all vegetation (if any) and debris. The existing front entry of the building will need to be demolished. All materials resulting from clearing, grubbing, and demolition operations should be removed from the site. All existing underground utilities and appurtenances should be located at the site. Such utilities should either be protected in-place or removed and replaced during construction as required by the project specifications. All excavations should be conducted in such a manner as not to cause loss of bearing and/or lateral support of existing structures or utilities.
Based on our subsurface exploration, we anticipate that the site soils will be
excavatable with conventional heavy-duty earthworking equipment. Excavated onsite earth materials cleared of deleterious matter can be moisture
conditioned and re-used as compacted fill. Footings and slab should be placed on at least 24 inches of compacted fill or 5 feet
below ground surface, whichever is deeper. The change in depth of the overexcavation below the footings and slabs-on-grade should be transitioned by a gradual slope (maximum 3:1). The overexcavation should extend to at least 2 feet beyond the footprint of the footings and slab.
Fill soils should be placed on scarified and recompacted excavation bottoms, moisture
conditioned, and compacted to at least 90 percent of the laboratory maximum dry density.
The existing gymnasium building is supported on conventional continuous shallow foundation systems. The new gymnasium lobby expansion will also be supported on conventional continuous shllow foundation systems. New footings abutting existing footings should have adhesive dowel connections to mitigate differential settlement. New footings should be conservatively sized to carry all new construction loads, without reliance on existing footings. The structural engineer should provide appropriate measures that are compatible to the existing and new foundations systems.
Footings should be at least 18 inches in width and embedded to at least 18 inches
below the lowest adjacent grade. The footing dimensions and reinforcement should be based on structural design. Continuous and isolated footings can be designed based on an allowable net bearing capacity of 2,000 psf.
The total settlement of shallow footings from static structural loads and short-term
settlement of properly compacted fill is anticipated to be 1 inch or less. The differential settlement resulting from static loads is anticipated to be 0.5 inches or less over a horizontal distance of 40 feet.

Revised Geotechnical Investigation Report Gymnasium Expansion
Pacific High School 1020 Pacific Street
City of San Bernardino, San Bernardino County, California May 6, 2019
Page vi
Converse Consultants M:\JOBFILE\2018\81\18-81-134 SBCUSD, New Diesel Technology Center\Report\18-81-134-03_RGIR
We estimate that the project site has the potential for up to 5.1 inches of dry seismic settlement with up to 1.85 inches of liquefaction induced settlement during a large earthquake. The soil profile at the site is almost similar. So, we anticipate that the total settlement will be uniform. We recommend that the planned structure be designed conservatively in anticipation of dynamic differential settlement of 0.7 inches in 40 horizontal feet. Generally, the static and dynamic settlement does not occur at the same time. For design purpose, the structural engineer should decide whether static and dynamic settlement will be combined or not.
Lateral earth pressures design parameters are presented in the text of this report. Recommendations for temporary sloped excavations are provided in the text of this
report. Based on our investigation, it is our professional opinion that the proposed location is suitable for construction of the proposed gymnasium expansion provided the recommendations presented in this geotechnical investigation report are considered in the planning, design and construction of the project.

Revised Geotechnical Investigation Report Gymnasium Expansion
Pacific High School 1020 Pacific Street
City of San Bernardino, San Bernardino County, California May 6, 2019
Page vii
Converse Consultants M:\JOBFILE\2018\81\18-81-134 SBCUSD, New Diesel Technology Center\Report\18-81-134-03_RGIR
TABLE OF CONTENTS
1.0 INTRODUCTION ---------------------------------------------------------------------------------- 1
2.0 PROJECT DESCRIPTION -------------------------------------------------------------------- 1
3.0 SITE DESCRIPTION ---------------------------------------------------------------------------- 1
4.0 SCOPE OF WORK ------------------------------------------------------------------------------- 2
4.1 PROJECT SET-UP -------------------------------------------------------------------------- 2 4.2 SUBSURFACE EXPLORATION ------------------------------------------------------------- 3 4.3 LABORATORY TESTING -------------------------------------------------------------------- 3 4.4 ENGINEERING ANALYSES AND GEOTECHNICAL REPORT PREPARATION ----------- 3
5.0 SITE CONDITIONS ------------------------------------------------------------------------------ 3
5.1 SURFACE PROFILE ------------------------------------------------------------------------- 4 5.2 SUBSURFACE PROFILE -------------------------------------------------------------------- 4 5.3 GROUNDWATER ---------------------------------------------------------------------------- 4 5.4 SUBSURFACE VARIATIONS ---------------------------------------------------------------- 6 5.5 EXCAVATABILITY --------------------------------------------------------------------------- 6 5.6 FLOODING ----------------------------------------------------------------------------------- 6
6.0 GEOLOGIC SETTING --------------------------------------------------------------------------- 6
6.1 REGIONAL GEOLOGY ---------------------------------------------------------------------- 6 6.2 SITE GEOLOGY ----------------------------------------------------------------------------- 7
7.0 FAULTING AND SEISMICITY----------------------------------------------------------------- 7
7.1 FAULTING ------------------------------------------------------------------------------------ 7 7.2 HISTORIC SEISMICITY --------------------------------------------------------------------- 9 7.3 SITE-SPECIFIC SEISMIC ANALYSIS ------------------------------------------------------ 9 7.4 SECONDARY EFFECTS OF SEISMIC ACTIVITY ---------------------------------------- 12
8.0 LABORATORY TEST RESULTS ---------------------------------------------------------- 14
8.1 PHYSICAL TESTING ---------------------------------------------------------------------- 14 8.2 CHEMICAL TESTING - CORROSIVITY EVALUATION ----------------------------------- 15
9.0 SITE GRADING/EARTHWORK RECOMMENDATIONS ---------------------------- 15
9.1 GENERAL --------------------------------------------------------------------------------- 15 9.2 REMEDIAL GRADING -------------------------------------------------------------------- 16 9.3 ENGINEERED FILL ----------------------------------------------------------------------- 17 9.4 COMPACTED FILL PLACEMENT -------------------------------------------------------- 17 9.5 SHRINKAGE AND SUBSIDENCE -------------------------------------------------------- 18 9.6 SITE DRAINAGE ------------------------------------------------------------------------- 18

Revised Geotechnical Investigation Report Gymnasium Expansion
Pacific High School 1020 Pacific Street
City of San Bernardino, San Bernardino County, California May 6, 2019
Page viii
Converse Consultants M:\JOBFILE\2018\81\18-81-134 SBCUSD, New Diesel Technology Center\Report\18-81-134-03_RGIR
10.0 DESIGN RECOMMENDATIONS ----------------------------------------------------------- 19
10.1 SHALLOW FOUNDATION DESIGN PARAMETERS -------------------------------------- 19 10.2 MODULUS OF SUBGRADE REACTION -------------------------------------------------- 20 10.3 LATERAL EARTH PRESSURES AND RESISTANCE TO LATERAL LOADS ------------ 20 10.4 SLABS-ON-GRADE ----------------------------------------------------------------------- 21 10.5 SETTLEMENT ----------------------------------------------------------------------------- 22 10.6 EXPANSION POTENTIAL ----------------------------------------------------------------- 22 10.7 SOIL CORROSIVITY ---------------------------------------------------------------------- 22
11.0 CONSTRUCTION RECOMMENDATIONS ----------------------------------------------- 23
11.1 GENERAL ---------------------------------------------------------------------------------- 23 11.2 TEMPORARY SLOPED EXCAVATIONS ------------------------------------------------- 24
12.0 GEOTECHNICAL SERVICES DURING CONSTRUCTION ------------------------- 24
13.0 CLOSURE ---------------------------------------------------------------------------------------- 24
14.0 REFERENCES ---------------------------------------------------------------------------------- 26
FIGURES Following Page No.
Figure No.1, Approximate Site Location Map .................................................................. 1 Figure No. 2, Approximate Boring Locations Map ................................................................ 3 Figure No. 3, Geologic Cross Sections A-A’ ........................................................................ .4 Figure No. 4, FEMA Flood Hazard Map ................................................................................ 6 Figure No. 5, Regional Geologic Map ............................................................................. 7 Figure No. 6, Fault Hazard Map ...................................................................................... 7 Figure No. 7, Site-Specific Design Response Spectrum ............................................... 11 Figure No. 8, San Bernardino County Liquefaction Hazard Map ................................... 13
TABLES Page No.
Table No. 1, Existing Pavement Sections ....................................................................... 4 Table No. 2, Summary of USGS Groundwater Depth Data ............................................. 5 Table No. 3, Seismic Characteristics of Nearby Active Faults ......................................... 8 Table No. 4, 2016 CBC Mapped Acceleration Parameters ........................................... 10 Table No. 5, Probabilistic Response Spectrum Data .................................................... 10 Table No. 6, Site Specific Response Spectrum Data .................................................... 11 Table No. 7, Site Specific Seismic Design Parameters ................................................. 12 Table No. 8, Overexcavation Depths............................................................................. 16 Table No. 9, Recommended Foundation Parameters ................................................... 19 Table No. 10, Active and At-Rest Earth Pressures ....................................................... 20 Table No. 11, Slope Ratios for Temporary Excavations ................................................ 24
Revised Geotechnical Investigation Report Gymnasium Expansion
Pacific High School 1020 Pacific Street
City of San Bernardino, San Bernardino County, California May 6, 2019
Page ix
Converse Consultants M:\JOBFILE\2018\81\18-81-134 SBCUSD, New Diesel Technology Center\Report\18-81-134-03_RGIR
APPENDICES Appendix A .............................................................................................. Field Exploration Appendix B ............................................................................ Laboratory Testing Program Appendix C ......................................................................... Dynamic Settlement Analysis Appendix D ..................................................................................... EZ-Frisk Output Files

Revised Geotechnical Investigation Report Gymnasium Expansion
Pacific High School 1020 Pacific Street
City of San Bernardino, San Bernardino County, California May 6, 2019
Page 1
Converse Consultants M:\JOBFILE\2018\81\18-81-134 SBCUSD, New Diesel Technology Center\Report\18-81-134-03_RGIR
1.0 INTRODUCTION This report presents the results of our geotechnical investigation performed for improvements to the gymnasium located at 1020 Pacific Street, northeast corner of the existing Pacific High School in the City of San Bernardino, San Bernardino County, California. The approximate location of the site is shown on Figure No. 1, Approximate Site Location Map. Our scope of services was based on California Geological Survey - Note 48 (CGS, 2013). The purposes of this investigation were to determine the nature and engineering properties of the subsurface soils and to provide recommendations for site earthwork, and design and construction of foundations for the proposed building addition. This report is prepared for the project described herein and is intended for use solely by San Bernardino City Unified School District (SBCUSD) and their authorized agents for design purposes. It should not be used as a bidding document but may be made available to the potential contractors for information on factual data only. For bidding purposes, the contractors should be responsible for making their own interpretation of the data contained in this report. 2.0 PROJECT DESCRIPTION It is planned to demolish approximately 2,200 square feet front entry and construct a new 6,920 square feet lobby with supporting amenities as a part of existing gymnasium expansion. The addition of building will likely be a combination of steel, concrete and masonry with shallow foundation and slab-on-grade. The structural loads are not known at this time but are anticipated to be moderate. 3.0 SITE DESCRIPTION The project site is located at the northern side of the Pacific High School, which has a street address of 1020 Pacific Street in the City of San Bernardino, San Bernardino County, California. The existing gymnasium building covers 19,500 square feet. The area surrounding the buildings is covered with landscaping and paved with asphalt/cement concrete. We anticipate the existing building is serviced by underground utility pipeline including water and sewer. Photograph No 1 depicts the present site conditions.

Converse Consultants
Project No
FIGURE
1
Approximate Site Location Map18-81-134-03
Project:Location:
Client:
Gymnasium ExpansionPacific High School1020 Pacific StreetCity of San Bernardino, San Bernardino County, CaliforniaSan Bernardino City Unified School District
Legend
Map a portion of: U.S. GEOLOGICAL SURVEY (USGS), US Topo 7.5-minute map for San Bernardino North, California, dated March 17, 2015, scale 1:24,000.
Pacific High School
Approximate Project Area
Thousand Feet
0 2 4

Revised Geotechnical Investigation Report Gymnasium Expansion
Pacific High School 1020 Pacific Street
City of San Bernardino, San Bernardino County, California May 6, 2019
Page 2
Converse Consultants M:\JOBFILE\2018\81\18-81-134 SBCUSD, New Diesel Technology Center\Report\18-81-134-03_RGIR
Photograph No 1: Present front side conditions of the gymnasium
The high school is bounded by Pacific Street to the south, Perris Hill Park Road to the west, open land to the north, and residential property to the east. The high school consists of multiple one- and two-story structures, tennis, baseball and basketball courts, a football field, and parking lots. The project site is relatively flat, with an elevation of approximately 1,132 feet above mean sea level (amsl). Perris Hill, with an approximate peak elevation of 1,300 feet amsl, is located approximately 650 feet northeast of the site. The coordinates for the project site are approximately 34.1298° north latitude and 117.2635° west longitude. 4.0 SCOPE OF WORK The scope of Converse’s investigation included the tasks described in the following sections.
4.1 Project Set-up
The project set-up consisted of the following tasks. Conducted a site reconnaissance and marked the exploration locations, such that
equipment access to all the locations was available. Notified Underground Service Alert (USA) at least 48 hours prior to field work to clear
the exploration locations of any conflict with existing underground utilities.

Revised Geotechnical Investigation Report Gymnasium Expansion
Pacific High School 1020 Pacific Street
City of San Bernardino, San Bernardino County, California May 6, 2019
Page 3
Converse Consultants M:\JOBFILE\2018\81\18-81-134 SBCUSD, New Diesel Technology Center\Report\18-81-134-03_RGIR
Requested clearance of exploration locations for active underground utilities by a representative from the SBCUSD.
Engaged California licensed driller to drill exploratory borings. 4.2 Subsurface Exploration Two exploratory borings (BH-01 and BH-02) were drilled on October 2, 2018 to investigate the subsurface conditions at the site. The borings were advanced to maximum planned depths of 21.5 and 51.5 feet bgs. Approximate boring locations are indicated in Figure No. 2, Approximate Boring Locations Map. For a description of the field exploration and sampling program see Appendix A, Field Exploration. 4.3 Laboratory Testing Representative samples of the site soils were tested in the laboratory to aid in the classification and to evaluate relevant engineering properties. The tests performed included the following. • In Situ Moisture Content and Dry Density (ASTM Standard D2216) • Expansion Index (ASTM D4829) • Soil Corrosivity (California Tests 643, 422, and 417) • Grain Size Distribution (ASTM Standard C136) • Maximum Dry Density and Optimum Moisture Content (ASTM Standard D1557) • Direct Shear Strength (ASTM Standard D3080) • Consolidation (ASTM Standard D2435)
For in situ moisture and density data, see the Logs of Borings in Appendix A, Field Exploration. For a description of the other laboratory test methods and test results, see Appendix B, Laboratory Testing Program. 4.4 Engineering Analyses and Geotechnical Report Preparation Data obtained from the field exploration and laboratory testing program was compiled and evaluated. Geotechnical analyses of the compiled data was performed and this report was prepared to present our findings, conclusions and recommendations for the proposed project. 5.0 SITE CONDITIONS A general description of the subsurface conditions and various materials encountered during our field exploration are presented in this section.
XX
XX
X
XX
BH-02
BH-01
A'
A
18-81-134-03
Gymnasium ExpansionPacific High School 1020 Pacific Street
City of San Bernardino, San Bernardino County, California
Client: San Bernardino City Unified School District
APPROXIMATE LOCATION
OF BORING
GEOLOGIC CROSS SECTION 2

Revised Geotechnical Investigation Report Gymnasium Expansion
Pacific High School 1020 Pacific Street
City of San Bernardino, San Bernardino County, California May 6, 2019
Page 4
Converse Consultants M:\JOBFILE\2018\81\18-81-134 SBCUSD, New Diesel Technology Center\Report\18-81-134-03_RGIR
5.1 Surface Profile The surface around the existing building was paved with asphalt concrete. The measured thicknesses of asphalt concrete are presented in the following table. Table No. 1, Existing Pavement Sections
Boring No. Depth (ft) Asphalt Concrete Thickness (in.)
Aggregate Base Thickness (in.)
BH-01 51.5 4.0 0.0
BH-02 21.5 3.0 0.0 5.2 Subsurface Profile Based on the exploratory borings and laboratory test results, the subsurface soil at the project site consisted primarily of unconsolidated alluvial soils as a mixture of sand and silt. A sand layer was observed at depths between 30.0 to 35.0 and 20.0 to 21.5 feet bgs in borings BH-01 and BH-02, respectively. A gravelly sand layer was observed at depth between 35.0 to 51.5 feet bgs in boring BH-01. Based on hammer blow counts, the upper 10 feet soils are loose to medium dense. Relative compaction of the upper 10 feet soils varies from 78 to 86 percent. For a detailed description of the subsurface materials encountered in the exploratory borings, see Drawings No. A-2 and A-3, Logs of Borings, in Appendix A, Field Exploration. Fill soils were not identified in our subsurface exploration; however, the site has been previously graded for the existing building and fill soil may be present. If present, the fill soils were likely derived from on-site sources and are similar to the native alluvial soils in composition and density. Figure No. 3, Geologic Cross Sections A-A’, illustrates the subsurface profile at the site. For a detailed description of the subsurface materials encountered in the exploratory borings, see Appendix A, Field Exploration. 5.3 Groundwater Groundwater was not encountered during the field investigation at depths of up to approximately 51.5 feet bgs. Regional databases were reviewed to estimate expected groundwater conditions in the vicinity of the proposed gymnasium expansion. The following data was found on the GeoTracker website (SWRCB, 2018). • SAN BERNARDINO COUNTY MEDICAL CENTER (Site No. T0607100621), located
approximately 2,300 feet southwest of the project site, reported groundwater at depths ranging from 170 to 195 feet bgs in 2001.

1130
1120
1110
1100
1080
1090
ELE
VA
TIO
N IN
F
EE
T
ELE
VA
TIO
N IN
F
EE
T
1130
1120
1110
1100
1080
1090
SM
ML
SM
ALLUVIUM
BH-01
BH-02
1140 1140
TD=51.5'
SP
SM
SP
SM
ML
CONCESSION
STORAGE
CONCESSION
A'A
NEW GYM LOBBY
TD=21.5'
18-81-134-03
Gymnasium ExpansionPacific High School1020 Pacific StreetCity of San Bernardino, San Bernardino County, CAFor: San Bernardino City Unified School District
PROFILE
HORIZONTAL: 1"=20'
VERTICAL: 1"=20'
3

Revised Geotechnical Investigation Report Gymnasium Expansion
Pacific High School 1020 Pacific Street
City of San Bernardino, San Bernardino County, California May 6, 2019
Page 5
Converse Consultants M:\JOBFILE\2018\81\18-81-134 SBCUSD, New Diesel Technology Center\Report\18-81-134-03_RGIR
• MOBIL #18-ELG (Site No. T0607100426), located approximately 1.05 miles southwest of the project site reported groundwater at a depth of 150.5 feet bgs in 2006.
• SHELL SERVICE STATION (Site No. T0607101303), located approximately 1.2 miles northeast of the project site, reported groundwater at depths ranging from 200 to 250 feet bgs in 2004.
Data in the following table was found on the National Water Information System (USGS, 2018a). Due to the number of sites with available data in the project area, sites closest to the proposed alignment were selected. Table No. 2, Summary of USGS Groundwater Depth Data
Site No. Location Groundwater Depth Range (ft. bgs)
Date Range
340743117162001 400 feet east of 16th St and Crestview Ave. (5*)-253.72 1904-2008
340801117162101 Northeast of E. 20th St. and Crestview Ave. 198 1971
340815117154301 North of E. 23rd St. and N. Newport Ave. 38-81 1915-1949
340811117151601 Northeast of E. Highland Ave. and Mountain Ave. 59 1947
340807117162401 Southwest of E. Highland Ave. and Valencia Ave. 218 1970
340737117163801 East of E. Gilbert St. and N. Waterman Ave. 226 1970
340820117164001 North of N. Waterman Ave. and E. 23rd St. 110.3-265 1949-1967
340823117154301 100 feet east of 26th St. and Alameda Ave. 98 1950
340825117155601 Southwest of E. 27th St. and Lawrence Ave. 72-120 1927-1943
340810117162301 300 feet west of E Highland Ave. and Valencia Ave. 42-59 1910-1916
*Based on review of historical groundwater data in the wells listed above, it has been determined that the high groundwater level of -5 feet BGS is doubtful, and therefore, Site No. 340743117162001 has been removed from consideration of the highest historical groundwater level.
Several of the referenced groundwater wells have been monitored for many decades and display a trend of long-term decline in local groundwater levels, likely due to groundwater pumping and development of the area. Considering regional development and sustained groundwater usage, groundwater levels are unlikely to return to the historically shallow levels. Current groundwater is generally expected to be deeper than 50 feet BGS. The historical high groundwater level was approximately 38 feet bgs. Based on the current and historical groundwater conditions, dewatering is not expected to be required during construction of the building. It should be noted that the groundwater level could vary

Revised Geotechnical Investigation Report Gymnasium Expansion
Pacific High School 1020 Pacific Street
City of San Bernardino, San Bernardino County, California May 6, 2019
Page 6
Converse Consultants M:\JOBFILE\2018\81\18-81-134 SBCUSD, New Diesel Technology Center\Report\18-81-134-03_RGIR
depending upon the seasonal precipitation and possible groundwater pumping activity in the site vicinity. Shallow perched groundwater may be present locally, particularly following precipitation. 5.4 Subsurface Variations Based on results of the subsurface exploration and our experience, some variations in the continuity and nature of subsurface conditions within the project site should be anticipated. Because of the uncertainties involved in the nature and depositional characteristics of the earth material at the site, care should be exercised in interpolating or extrapolating subsurface conditions between or beyond the boring locations. 5.5 Excavatability The surface and subsurface soil materials for the proposed development are expected to be excavatable by conventional heavy-duty earth moving equipment. The phrase “conventional heavy-duty excavation equipment” is intended to include commonly used equipment such as excavators, scrapers, and trenching machines. It does not include hydraulic hammers (“breakers”), jackhammers, blasting, or other specialized equipment and techniques used to excavate hard earth materials. Selection of an appropriate excavation equipment models should be done by an experienced earthwork contractor. 5.6 Flooding The site is located in an area with reduced flood risk due to levee (FEMA, 2008). The levee is located along the channel west of the campus that runs north-south. The site is located within flood Zone X (500-year flood plain) identified by San Bernardino County (San Bernardino County, 2010a). Figure No. 4, FEMA Flood Hazard Map represents the flood hazard of the project site. 6.0 GEOLOGIC SETTING The regional and local geology are discussed in the following subsections. 6.1 Regional Geology The proposed project site is located within the Northern Peninsular Ranges Geomorphic Province of Southern California. The Peninsular Ranges Geomorphic Province consists of a series of northwest-trending mountain ranges and valleys bounded on the north by the San Bernardino and San Gabriel Mountains, on the west by the Los Angeles Basin, and on the southwest by the Pacific Ocean.

Converse Consultants
Project No
FIGURE
18-81-134-03
4
FEMA Flood Hazard Map
Approximate Project Area
Explanation
Thousand Feet
Special flood hazard areas subject to inundation by the 1% annual chance flood.
No base flood elevations determined.
Areas determined to be outside the 0.2% annual chance floodplain or areas of reduced flood risk due to levee.
ZONE A
ZONE X
Other flood areas.
0 0.5 1
Pacific High School
ZONE X
Project:Location:
Client:
Gymnasium ExpansionPacific High School1020 Pacific StreetCity of San Bernardino, San Bernardino County, CaliforniaSan Bernardino City Unified School District

Revised Geotechnical Investigation Report Gymnasium Expansion
Pacific High School 1020 Pacific Street
City of San Bernardino, San Bernardino County, California May 6, 2019
Page 7
Converse Consultants M:\JOBFILE\2018\81\18-81-134 SBCUSD, New Diesel Technology Center\Report\18-81-134-03_RGIR
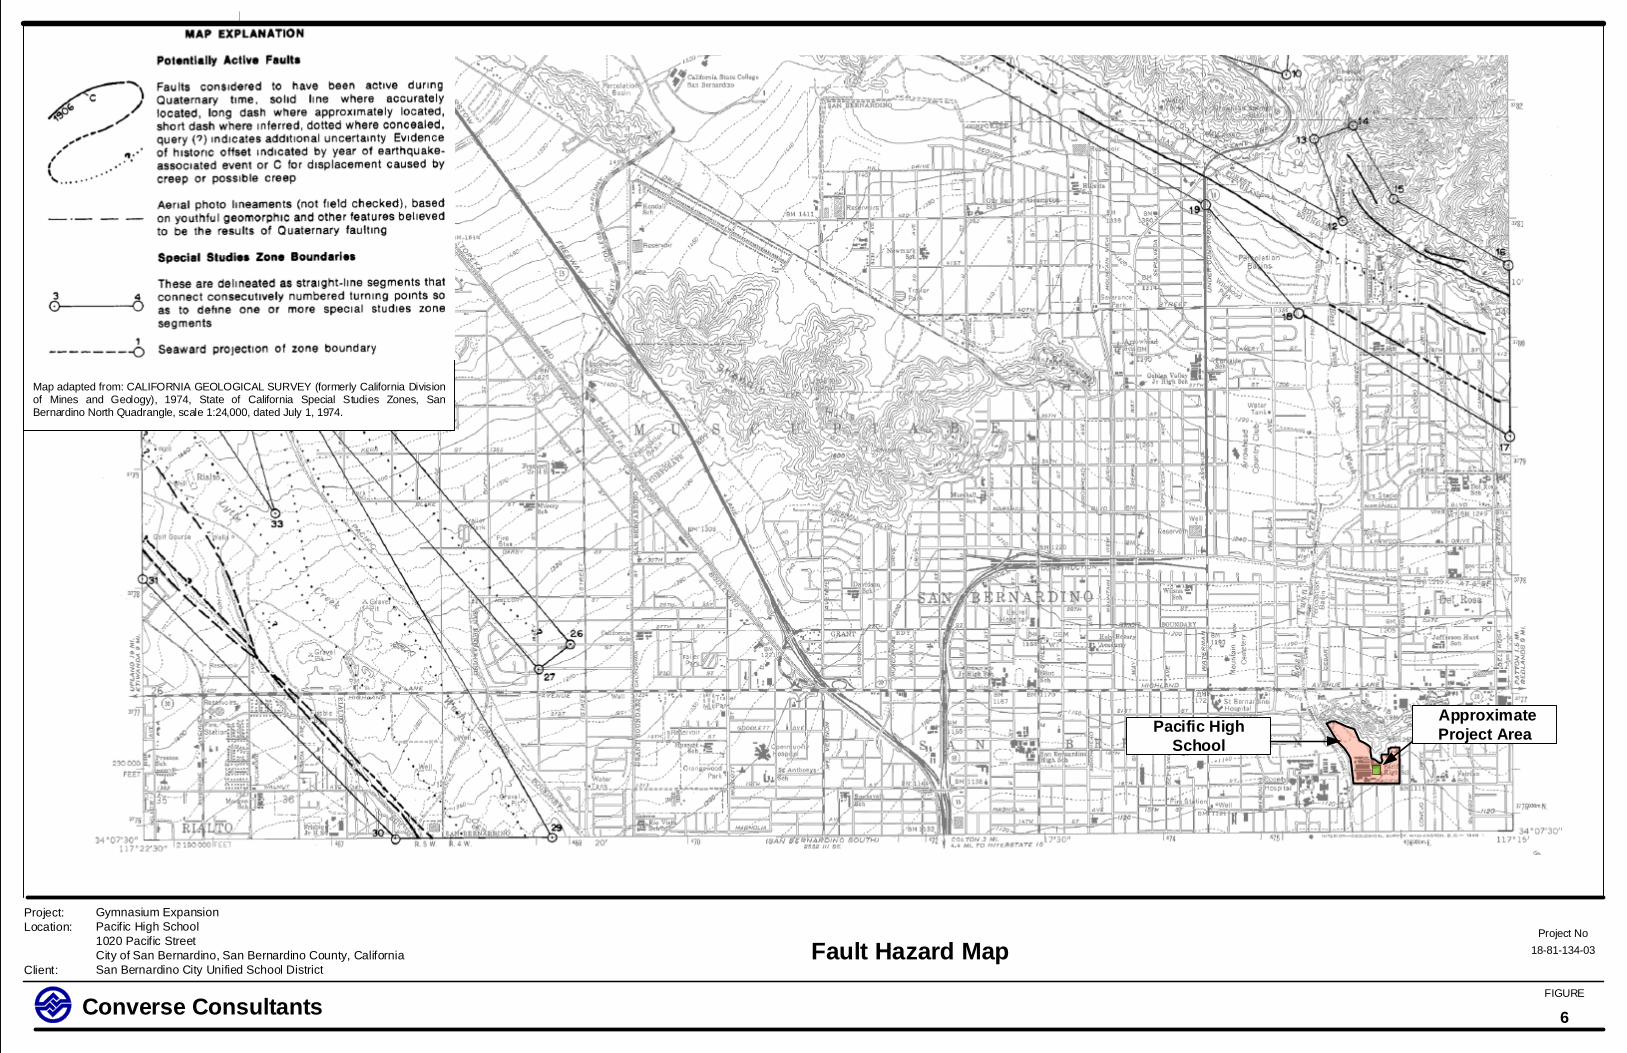
The province is a seismically active region characterized by a series of northwest-trending strike-slip faults. The most prominent of the nearby fault zones include the San Jacinto, San Andreas, and Cucamonga Fault Zones, all of which have been known to be active during Quaternary time. Topography within the province is generally characterized by broad alluvial valleys separated by linear mountain ranges. This northwest-trending linear fabric is created by the regional faulting within the granitic basement rock of the Southern California Batholith. Broad, linear, alluvial valleys have been formed by erosion of these principally granitic mountain ranges. Figure No. 5, Regional Geologic Map, depicts the geologic setting of the project site. 6.2 Site Geology The project site is situated at the foot of Perris Hill near the central portion of the San Bernardino Valley, which is bounded by the San Bernardino Mountains and the San Andreas fault to the north, and the San Timoteo Badlands and the San Jacinto fault to the south. Perris Hill, which bounds the school to the north and is located roughly 650 feet east-northeast of the project area is comprised of the Pelona Schist. The Pelona Schist is a mica schist metamorphosed from petroliths of sedimentary and pyroclastic rocks (Dibblee and Minch, 2004). Based on the proximity of Perris Hill to the project site, the Pelona Schist is likely located below the site at an unknown depth. The maximum elevation of Perris Hill is approximately 1,300 feet, nearly 170 feet higher than the project site. The project site is underlain by alluvial fan deposits primarily consisting of unconsolidated to slightly consolidated silt, sand and gravel. Cretaceous-aged schist bedrock outcrops approximately 150 feet north-northeast of the project site and likely underlies the site at depth. (Dibblee and Minch, 2004; Morton and Miller, 2006). 7.0 FAULTING AND SEISMICITY Discussion of faulting and seismicity is presented in the following sections. 7.1 Faulting The site is not located within a San Bernardino County or State of California Earthquake Fault Zone (San Bernardino, 2010b; CGS, 1974). There are no known active faults projecting toward or extending across the project site. See Figure No. 6, Fault Hazard Map for more details. The potential for surface rupture resulting from the movement of nearby major faults is not known with certainty but is considered low.

Project No
FIGURE
18-81-134-03
5
Regional Geologic Map
Map a portion of: MORTON, D.M. and MILLER, F.K., 2006, Geologic Map of the San Bernardino and Santa Ana 30' x 60' Quadrangles, California, U.S. Geological Survey Open-File Report 2006-1217, scale 1:100,000.
Converse Consultants
Project:Location:
Client:
Gymnasium ExpansionPacific High School1020 Pacific StreetCity of San Bernardino, San Bernardino County, CaliforniaSan Bernardino City Unified School District
Pacific HighSchool
Qw
Qyf3
LegendVery Young Wash Deposits (Active Washes)
Very Young Wash Deposits (Slight Terraces inActive Wash Margins)
Pelona Schist
Young Alluvial-fan Deposits (Unit 2): Coarse-grained sand to bouldery alluvial deposits.
Young Alluvial-fan Deposits (Unit 3): Silt, sand, andcoarse-grained sand to bouldery alluvial deposits.
Young Alluvial-fan Deposits (Unit 4): Silt, sand, andcoarse-grained sand to bouldery alluvial deposits.
Young Alluvial-fan Deposits (Unit 5): Coarse-grained sand to bouldery alluvial deposits.
Old Alluvial-fan Deposits (Unit 3): Moderately towell-consolidated sand and gravel.
Thousand Feet
0 1 2 3
Strike and Dip ofInclined Foliation
ApproximateProject Area
Converse Consultants
Project No
FIGURE
18-81-134-03
6
Fault Hazard MapProject:Location:
Client:
Gymnasium ExpansionPacific High School1020 Pacific StreetCity of San Bernardino, San Bernardino County, CaliforniaSan Bernardino City Unified School District
Pacific HighSchool
ApproximateProject Area
Map adapted from: CALIFORNIA GEOLOGICAL SURVEY (formerly California Divisionof Mines and Geology), 1974, State of California Special Studies Zones, SanBernardino North Quadrangle, scale 1:24,000, dated July 1, 1974.

Revised Geotechnical Investigation Report Gymnasium Expansion
Pacific High School 1020 Pacific Street
City of San Bernardino, San Bernardino County, California May 6, 2019
Page 8
Converse Consultants M:\JOBFILE\2018\81\18-81-134 SBCUSD, New Diesel Technology Center\Report\18-81-134-03_RGIR
The proposed site is situated in a seismically active region. As is the case for most areas of Southern California, ground shaking resulting from earthquakes associated with nearby and more distant faults may occur at the project site. During the life of the project, seismic activity associated with active faults can be expected to generate moderate to strong ground shaking at the site. The following table contains a list of active and potentially active faults within 100 kilometers of the subject site. The fault parameters and distances presented in the following table are based on the output from EQFAULT (Blake, 2000), revised in accordance with CGS fault parameters (Cao et. al., 2003). Table No. 3, Seismic Characteristics of Nearby Active Faults
Fault Name Approximate Distance miles (km)
Moment Magnitude (Mw)
San Andreas - Southern 3.9 (6.3) 7.4 San Andreas - San Bernardino 3.9 (6.3) 7.5 San Jacinto-San Bernardino 5.2 (8.3) 6.7 San Jacinto-San Jacinto Valley 8.1 (13.1) 6.9 Cleghorn 10.2 (16.4) 6.5 North Frontal Fault Zone (West) 10.8 (17.4) 7.2 Cucamonga 11.7 (18.8) 6.9 San Andreas – Mojave 19.8 (31.8) 7.4 San Andreas - 1857 Rupture 19.8 (31.8) 7.8 San Jose 24.8 (39.9) 6.4 Sierra Madre 26.4 (42.5) 7.2 Chino-Central Ave. (Elsinore) 27.3 (43.9) 6.7 North Frontal Fault Zone (East) 27.8 (44.8) 6.7 Helendale - S. Lockhardt 28.0 (45.0) 7.3 Elsinore-Glen Ivy 28.5 (45.8) 6.8 Whittier 28.7 (46.2) 6.8 Pinto Mountain 31.4 (50.5) 7.2 San Jacinto-Anza 33.5 (53.9) 7.2 Elsinore-Temecula 34.1 (54.8) 6.8 Clamshell-Sawpit 35.5 (57.1) 6.5 Elysian Park Thrust 36.0 (58.0) 6.7 Lenwood-Lockhart-Old Woman Sprgs 39.0 (62.8) 7.5 Raymond 42.8 (68.9) 6.5 Johnson Valley (Northern) 43.2 (69.5) 6.7 Compton Thrust 47.1 (75.8) 6.8 San Andreas - Coachella 47.7 (76.7) 7.2 Verdugo 47.7 (76.7) 6.9 Landers 48.0 (77.3) 7.3 Burnt Mtn. 49.2 (79.2) 6.5 Eureka Peak 49.8 (80.2) 6.4 Emerson So. - Copper Mtn. 50.0 (80.5) 7.0 Newport-Inglewood (L.A.Basin) 52.4 (84.3) 7.1 Newport-Inglewood (Offshore) 52.6 (84.6) 7.1

Revised Geotechnical Investigation Report Gymnasium Expansion
Pacific High School 1020 Pacific Street
City of San Bernardino, San Bernardino County, California May 6, 2019
Page 9
Converse Consultants M:\JOBFILE\2018\81\18-81-134 SBCUSD, New Diesel Technology Center\Report\18-81-134-03_RGIR
Fault Name Approximate Distance miles (km)
Moment Magnitude (Mw)
Elsinore-Julian 54.0 (86.9) 7.1 Gravel Hills - Harper Lake 55.0 (88.5) 7.1 Hollywood 55.4 (89.2) 6.4 Calico - Hidalgo 56.0 (90.1) 7.3 San Gabriel 59.6 (95.9) 7.2 Sierra Madre (San Fernando) 60.2 (96.9) 6.7 Pisgah-Bullion Mtn.-Mesquite Lk 61.0 (98.2) 7.3 7.2 Historic Seismicity An analysis of the seismic history of the site was conducted using the computer program EQSEARCH, (Blake, 2000), and attenuation relationships proposed by Bozorgnia et. al. (1999) for Pleistocene alluvium soil conditions. A total of 91 earthquakes and aftershocks with a moment magnitude of 5.0 or greater have been recorded within a distance of 100 kilometers from the site since the year 1800. Three earthquakes producing estimated ground accelerations at the site ranging from 0.233 g to 0.269 g were reported between the years of 1858 and 1923. These events are poorly documented but were apparently on the San Jacinto Fault within approximately 14 miles of the site and had estimated magnitudes ranging from 5.3 to 7. All other historical earthquakes have produced ground accelerations at the site of 0.2 g or less. 7.3 Site-Specific Seismic Analysis A site-specific response spectrum was developed for the project for a Maximum Considered Earthquake (MCE), defined as a horizontal peak ground acceleration that has a 2 percent probability of being exceeded in 50 years (return period of approximately 2,475 years). The controlling source was determined to be the USGS 2008 California Gridded Source, with an MCE of Mw 7.0 and a deterministic peak ground acceleration (PGA) of 0.99g. In accordance with ASCE 7-10, Section 21.2 the site-specific response spectra can be taken as the lesser of the probabilistic maximum rotated component of MCE ground motion and the 84th percentile of deterministic maximum rotated component of MCE ground motion response spectra. The design response spectra can be taken as 2/3 of site-specific MCE response spectra but should not be lower than 80 percent of CBC general response spectra. The risk coefficient CR has been incorporated at each spectral response period for which the acceleration was computed in accordance with ASCE 7-10, Section 21.2.1.1. The 2016 CBC mapped acceleration parameters are provided in the following table. These parameters were determined using the United States Geological Survey U.S. Seismic Design Maps website application (USGS, 2018b), and in accordance with ASCE 7-10 Sections 11.4, 11.6, 11.8 and 21.2.

Revised Geotechnical Investigation Report Gymnasium Expansion
Pacific High School 1020 Pacific Street
City of San Bernardino, San Bernardino County, California May 6, 2019
Page 10
Converse Consultants M:\JOBFILE\2018\81\18-81-134 SBCUSD, New Diesel Technology Center\Report\18-81-134-03_RGIR
Table No. 4, 2016 CBC Mapped Acceleration Parameters Parameter Value Parameter Value Site Class D Seismic Design Category E
Ss 2.108 CRS 1.008 S1 1.026 CR1 0.965 Fa 1 0.08 Fv/Fa 0.120 Fv 1.5 0.4 Fv/Fa 0.600
SMS 2.108 T0 0.146 SM1 1.539 TS 0.730 SDS 1.405 TL 8 SD1 1.026
A site-specific response analysis, using faults within 100 kilometers of the site, was developed using the computer program EZ-FRISK v. 7.65 by Risk Engineering (2012) and the 2008 USGS Fault Model database. Attenuation relationships proposed by Boore and Atkinson (2008), Campbell and Bozorgnia (2008), Chiou and Youngs (2008) were used in the analysis. These attenuation relationships are based on Next Generation Attenuation (NGA) project model. Maximum rotated components were determined using Huang (2008) method. An average shear wave velocity at upper 30 meters of soil profile (Vs30) of 270 meters per second, depth to bedrock of with a shear wave velocity 1,000 meters per second at 150 meters below grade, and depth of bedrock where the shear wave velocity is 2,500 meters per second at 3,000 meters below grade were selected for EZ-Frisk Analysis. The probabilistic response spectrum results and peak ground acceleration for each attenuation relationship are presented in the following table. Table No. 5, Probabilistic Response Spectrum Data
Attenuation Relationship
Probabilistic Mean
Boore-Atkinson (2008)
Campbell-Bozorgnia
(2008)
Chiou-Youngs (2007)
Peak Ground Acceleration (g) 1.303 1.236 1.173 1.467
Spectral Period (sec) 2% in 50yr Probabilistic Spectral Acceleration (g)
0.03 1.390 1.335 1.224 1.575 0.05 1.548 1.469 1.367 1.767 0.10 2.144 2.165 1.825 2.351 0.20 2.721 2.737 2.325 3.040 0.30 2.847 2.927 2.391 3.158 0.40 2.823 2.953 2.410 3.055

Revised Geotechnical Investigation Report Gymnasium Expansion
Pacific High School 1020 Pacific Street
City of San Bernardino, San Bernardino County, California May 6, 2019
Page 11
Converse Consultants M:\JOBFILE\2018\81\18-81-134 SBCUSD, New Diesel Technology Center\Report\18-81-134-03_RGIR
Spectral Period (sec) 2% in 50yr Probabilistic Spectral Acceleration (g)
0.50 2.771 2.923 2.493 2.877 0.75 2.567 2.687 2.429 2.583 1.00 2.322 2.182 2.334 2.433 2.00 1.517 1.353 1.707 1.472 3.00 1.111 1.064 1.204 1.053 4.00 0.860 0.817 0.965 0.786
Applicable response spectra data are presented in the table below and on Figure No. 7, Site-Specific Design Response Spectrum. These curves correspond to response values obtained from above attenuation relations for horizontal elastic single-degree-of-freedom systems with equivalent viscous damping of 5 percent of critical damping. Table No. 6, Site Specific Response Spectrum Data
Perio
d (s
ec)
2% in
50y
r Pr
obab
ilist
ic
Spec
tral
A
ccel
erat
ion
(g)
Ris
k C
oeffi
cien
t C
R
Prob
abili
stic
M
CE R
Spe
ctra
l A
ccel
erat
ion
(g)
84th
Per
cent
ile
Det
erm
inis
tic
MC
E R
espo
nse
Spec
tra,
(g)
Det
erm
inis
tic
CB
C L
ower
Le
vel,
(g)
Site
Spe
cific
M
CE R
Spe
ctra
l A
ccel
erat
ion
(g)
80%
CB
C D
esig
n R
espo
nse
Spec
trum
Site
Spe
cific
D
esig
n Sp
ectr
al
Acc
eler
atio
n (g
)
0.03 1.390 1.008 1.401 1.062 0.225 1.062 0.588 0.71 0.05 1.548 1.008 1.560 1.169 0.375 1.169 0.681 0.78 0.10 2.144 1.008 2.161 1.531 0.750 1.531 0.912 1.02 0.20 2.721 1.008 2.743 1.981 1.500 1.981 1.124 1.32 0.30 2.847 1.003 2.854 2.112 1.500 2.112 1.124 1.41 0.40 2.823 0.997 2.815 2.163 1.500 2.163 1.124 1.44 0.50 2.771 0.992 2.748 2.145 1.500 2.145 1.124 1.43 0.75 2.567 0.978 2.512 2.007 1.200 2.007 1.094 1.34 1.00 2.322 0.965 2.241 1.858 0.900 1.858 0.821 1.24 2.00 1.517 0.965 1.464 1.358 0.450 1.358 0.410 0.91 3.00 1.111 0.965 1.072 1.068 0.300 1.068 0.274 0.71 4.00 0.860 0.965 0.830 0.834 0.225 0.830 0.205 0.55
The site-specific design response parameters are provided in the following table. These parameters were determined from design response spectra presented in table above and following guidelines of ASCE 7-10 Section 21.4.

Note: Calculated using EZFRISK program Risk Engineering, version 7.65and USGS 2008 fault model database.
SITE SPECIFIC DESIGN RESPONSE SPECTRUMProject Number:
18-81-134-03
Figure No.
7Converse Consultants
0
1
2
3
0 1 2 3 4
Spec
tral
Acc
eler
atio
n (g
)
PERIOD (sec)
Design Response Spectrum
Probabilistic MCE_R Spectrum
Deterministic Spectrum
80% of CBC Spectrum
Project:Location:
Client:
Gymnasium ExpansionPacific High School1020 Pacific StreetCity of Moreno Valley, Riverside County, CaliforniaSan Bernardino City Unified School District

Revised Geotechnical Investigation Report Gymnasium Expansion
Pacific High School 1020 Pacific Street
City of San Bernardino, San Bernardino County, California May 6, 2019
Page 12
Converse Consultants M:\JOBFILE\2018\81\18-81-134 SBCUSD, New Diesel Technology Center\Report\18-81-134-03_RGIR
Table No. 7, Site Specific Seismic Design Parameters
Parameter Value (5% Damping)
Lower Limit, 80% of CBC Design Spectra
Site-Specific 0.2-second period Spectral Response Acceleration, SMS 1.981 1.688
Site-Specific1-second period Spectral Response Acceleration, SM1 2.716 1.231
Site-Specific Design Spectral Response Acceleration for short period SDS 1.321 1.124
Site-Specific Design Spectral Response Acceleration for 1-second period, SD1 1.811 0.821
The EZ-FRISK output files have been included in Appendix D, EZ-FRISK Output Files at the end of this report. 7.4 Secondary Effects of Seismic Activity In general, secondary effects of seismic activity include surface fault rupture, soil liquefaction, landslides, lateral spreading, and differential settlement due to seismic shaking, tsunamis, seiches, and earthquake-induced flooding. The site-specific potential for each of these seismic hazards is discussed in the following sections. Surface Fault Rupture: The site is not located within a San Bernardino County or State of California Earthquake Fault Zone (San Bernardino, 2010b; CGS, 1974). Based on review of available geologic information, no major surface fault crosses through or extends towards the site (Morton and Miller, 2006). The potential for surface rupture resulting from the movement of nearby major faults, or currently unknown faults, is not known with certainty but is considered low. Liquefaction: Liquefaction is defined as the phenomenon in which a cohesionless soil mass within the upper 50 feet of the ground surface, suffers a substantial reduction in its shear strength, due the development of excess pore pressures. During earthquakes, excess pore pressures in saturated soil deposits may develop as a result of induced cyclic shear stresses, resulting in liquefaction. Soil liquefaction generally occurs in submerged granular soils and non-plastic silts during or after strong ground shaking. There are several general requirements for liquefaction to occur. They are as follows. Soils must be submerged. Soils must be primarily granular. Soils must be loose to medium-dense. Ground motion must be intense. Duration of shaking must be sufficient for the soils to lose shear resistance.

Revised Geotechnical Investigation Report Gymnasium Expansion
Pacific High School 1020 Pacific Street
City of San Bernardino, San Bernardino County, California May 6, 2019
Page 13
Converse Consultants M:\JOBFILE\2018\81\18-81-134 SBCUSD, New Diesel Technology Center\Report\18-81-134-03_RGIR
The site is not located in an area designated by San Bernardino County as susceptible to liquefaction (San Bernardino County, 2010b). See Figure 8, San Bernardino County Liquefaction Hazard Map for more details. The current groundwater depth is greater than 50 feet bgs and historical groundwater depth was at 38 feet bgs. Based on a site-specific liquefaction analysis presented in Appendix C, Dynamic Settlement Analysis, liquefaction potential at the project site is up to 1.85 inches. Seismic Settlement: Dynamic dry settlement may occur in loose, granular, unsaturated soils during a large seismic event. Based on a site-specific settlement analysis presented in Appendix C, Dynamic Settlement Analysis, we estimate that the site will have the potential for up to 5.1 inches of total dry seismic settlement. Lateral Spreading: Seismically induced lateral spreading involves primarily lateral movement of earth materials over underlying materials which are liquefied due to ground shaking. It differs from the slope failure in that complete ground failure involving large movement does not occur due to the relatively smaller gradient of the initial ground surface. Lateral spreading is demonstrated by near-vertical cracks with predominantly horizontal movement of the soil mass involved. Due to the relatively flat nature of the project site and low potential for liquefaction the potential for lateral spreading is considered to be low. Landslides: Seismically induced landslides and other slope failures are common occurrences during or soon after earthquakes. Perris Hill, which is adjacent to Pacific High School, is designated by San Bernardino County as moderately to highly susceptible to landsliding. The toe of the closest flank of Perris Hill is located approximately 180 feet north-northeast of the proposed gymnasium expansion. The average slope ratio of the closest flank is approximately 4H:1V (horizontal:vertical). The height of the closest slope is approximately 40 feet. The hill ascends further to the north approximately 120 feet in height with an average slope ratio of 5H:1V. Based on review of geologic mapping (Dibblee and Minch, 2004), foliation within the Pelona Schist that comprises Perris Hill dips between 12 and 35 degrees south to southeast, away from the proposed new building. Since the building is west to southwest of the hill, it is lateral to the predominant failure direction. Furthermore, a failure surface dipping 15 to 30 degrees out of slope on a 4:1 slope will not daylight and is unlikely to produce a major slope failure. Due to the distance from Perris Hill, height of Perris Hill in the vicinity of the site, strike and dip of foliation in the Pelona Schist, overall relief, landsliding on Perris Hill is not expected to affect the proposed building. Due to the relatively flat nature of the site, the potential for on-site landsliding is considered to be low.

Converse ConsultantsFIGURE
8
San Bernardino County Liquefaction Hazard Map
Project:Location:
Client:
Gymnasium ExpansionPacific High School1020 Pacific StreetCity of San Bernardino, San Bernardino County, CaliforniaSan Bernardino City Unified School District
Project No18-81-134-03
Approximate Project Area
Pacific High School
Explanation
Thousand Feet
0 0.5 1
Generalized LiquefactionSusceptiblity
Map adapted from: SAN BERNARDINO COUNTY, 2010b, San Bernardino County General Plan Geologic Hazard Overlays, Map Sheet FH22C, scale 1:24,000, dated March 9, 2010.

Revised Geotechnical Investigation Report Gymnasium Expansion
Pacific High School 1020 Pacific Street
City of San Bernardino, San Bernardino County, California May 6, 2019
Page 14
Converse Consultants M:\JOBFILE\2018\81\18-81-134 SBCUSD, New Diesel Technology Center\Report\18-81-134-03_RGIR
Tsunamis: Tsunamis are large waves generated in open bodies of water by fault displacement or major ground movement. Due to the inland location of the site, tsunamis are not considered to be a risk. Seiches: Seiches are large waves generated in enclosed bodies of water in response to ground shaking. Seiching could potentially occur in the channel located west of the campus or in bodies of water located on the campus. Earthquake-Induced Flooding: Dams or other water-retaining structures may fail as a result of large earthquakes. The project site is not located within a designated dam inundation zone (San Bernardino County, 2010a). Due to the distance from any large dams or other water-retaining structures, the risk for earthquake-induced flooding at the project site is considered low. 8.0 LABORATORY TEST RESULTS Results of the various laboratory tests are presented in Appendix B, Laboratory Testing Program, except for the results of in situ moisture and dry density tests which are presented on the Logs of Borings in Appendix A, Field Exploration. The results are also discussed below. 8.1 Physical Testing The results of laboratory tests on samples obtained from the site is presented below. The results of laboratory tests on samples obtained from the site is presented below. In-situ Moisture and Dry Density – Results of in-situ moisture and dry density tests
performed in accordance with ASTM Standard D2216 and ASTM Standard 7263 are presented on the Logs of Borings in Appendix A, Field Exploration. Dry densities of upper 10 feet soils of the proposed site ranged from 100 to 110 pcf with moisture contents ranging from 6 to 8 percent. Results are presented in the log of borings in Appendix A, Field Exploration.
Expansion Index (EI) – One representative sample from the upper 5 feet soils was tested to evaluate the expansion potential in accordance with ASTM Standard D4829. The test result showed an EI of 5, indicating very low expansion potential.
Grain Size Analysis – Two representative samples were tested to determine the relative grain size distribution in accordance with the ASTM Standard C136. The test results are graphically presented in Drawing No. B-1, Grain Size Distribution Results. The results suggest the soils are typically silty sand.
Maximum Dry Density and Optimum Moisture Content – Typical moisture-density relationship test of two representative bulk samples were conducted in accordance with ASTM D1557. The results presented are in Drawing No. B-2, Moisture-Density Relationship Results, in Appendix B, Laboratory Testing Program. The laboratory maximum dry densities were 127.5 and 128.0 pounds per cubic foot (pcf) and the optimum moisture contents were 9.0 and 9.5 percent.

Revised Geotechnical Investigation Report Gymnasium Expansion
Pacific High School 1020 Pacific Street
City of San Bernardino, San Bernardino County, California May 6, 2019
Page 15
Converse Consultants M:\JOBFILE\2018\81\18-81-134 SBCUSD, New Diesel Technology Center\Report\18-81-134-03_RGIR
Direct Shear – Two direct shear tests were performed in accordance with ASTM Standard D3080 on relatively undisturbed ring samples. The results of the direct shear tests are presented in Drawings No. B-3 and B-4, Direct Shear Test Results in Appendix B, Laboratory Testing Program.
Consolidation Test – Two consolidation tests were performed on relatively undisturbed samples of the site soil, in accordance to ASTM Standard D2435. The test results are shown on Drawings No. B-5 and B-6, Consolidation Test Results, in Appendix B, Laboratory Testing Program.
For additional information on the subsurface conditions, see the Logs of Borings in Appendix A, Field Exploration. 8.2 Chemical Testing - Corrosivity Evaluation Two representative soil samples were tested to determine minimum electrical resistivity, pH, and chemical content, including soluble sulfate and chloride concentrations. The purpose of these tests was to determine the corrosion potential of site soils when placed in contact with common construction materials. These tests were performed by AP Engineering and Testing, Inc. (Pomona, CA) in accordance with California Test Methods 643, 422, and 417. The test results are summarized below and are presented in Appendix B, Laboratory Testing Program. The pH measurements of the samples were 7.3 and 9.1. The sulfate contents of the samples were 0.003 and 0.03 percent by weight. The chloride concentrations of the samples were 32 and 200 ppm. The minimum electrical resistivities when saturated were 1,213 and 6,548 Ohm-cm. 9.0 SITE GRADING/EARTHWORK RECOMMENDATIONS Recommendations for site preparation and remedial grading and estimates of shrinkage and subsidence are provided in the following sections. 9.1 General This section contains our general recommendations regarding earthwork and grading recommendations for the proposed development. These recommendations are based on the results of our field exploration, laboratory testing, our experience with similar projects, and data evaluation as presented in the preceding sections. These recommendations may need to be modified based on observation of the actual field conditions during grading. It is our understanding that the proposed structure will be constructed at or near grade. The earthwork for the structure based on the anticipated shallow foundations will consist of remedial grading, fill placement, and facility utility connection backfill.

Revised Geotechnical Investigation Report Gymnasium Expansion
Pacific High School 1020 Pacific Street
City of San Bernardino, San Bernardino County, California May 6, 2019
Page 16
Converse Consultants M:\JOBFILE\2018\81\18-81-134 SBCUSD, New Diesel Technology Center\Report\18-81-134-03_RGIR
Prior to the start of any earthwork, the site of the proposed gymnasium expansion should be cleared of all vegetation (if any) and debris. The existing front entry of the building will need to be demolished. All materials resulting from clearing, grubbing, and demolition operations should be removed from the site. All existing underground utilities and appurtenances should be located at the site. Such utilities should either be protected in-place or removed and replaced during construction as required by the project specifications. All excavations should be conducted in such a manner as not to cause loss of bearing and/or lateral support of existing structures or utilities. All debris, deleterious material, and surficial soils containing roots and perishable materials (if any) should be stripped and removed from the site. Deleterious material, including organics, concrete, and debris generated during excavation, should not be placed as fill. The final bottom surfaces of all excavations should be observed and approved by the project geotechnical consultant prior to placing any fill. Based on these observations, removal of localized areas deeper than those documented may be required during grading. Therefore, some variations in the depth and lateral extent of excavation recommended in this report should be anticipated. 9.2 Remedial Grading Building footings and slabs-on-grade should be uniformly supported by compacted fill. In order to provide uniform support, structural areas should be overexcavated, scarified, and recompacted as follows. Table No. 8, Overexcavation Depths
Structure/Pavement Minimum Excavation Depth
Building Footings 24 inches below footings or 5 feet below ground surface, whichever is deeper
Slab-on-grade 24 inches below slab The change in depth of the overexcavation below the footings and slabs-on-grade should be transitioned by a gradual slope. The overexcavation should extend to at least 2 feet beyond the footprint of the building and at least 1 foot beyond the edge of pavement. The overexcavation bottom should be scarified and compacted as described in Section 9.4, Compacted Fill Placement. If isolated pockets of very soft, loose, eroded, or pumping soil are encountered, the unstable soil should be excavated as needed to expose undisturbed, firm, and unyielding soils.

Revised Geotechnical Investigation Report Gymnasium Expansion
Pacific High School 1020 Pacific Street
City of San Bernardino, San Bernardino County, California May 6, 2019
Page 17
Converse Consultants M:\JOBFILE\2018\81\18-81-134 SBCUSD, New Diesel Technology Center\Report\18-81-134-03_RGIR
The contractor should determine the best manner to conduct the excavations, such that there are no losses of bearing and/or lateral support to the existing structures or utilities. Consideration should be given to using slot cuts or other excavation methods which preserve lateral support during excavation operations near the existing school buildings. 9.3 Engineered Fill No fill or aggregate base should be placed until excavations and/or natural ground preparation have been observed by the geotechnical consultant. The native soils encountered within the project site are generally considered suitable for re-use as compacted fill. Excavated soils should be processed, including cleaning roots and debris, removal of oversized particles, mixing, and moisture conditioning, before placing as compacted fill. On-site soils used as fill should meet the following criteria. No particles larger than 3 inches in largest dimension. Rocks larger than 1 inch should not be placed within the upper 12 inches of
subgrade soils. Free of all organic matter, debris, or other deleterious material. Expansion index of 30 or less. Sand Equivalent greater than 15 (greater than 30 for pipe bedding). Imported materials, if required, should meet the following criteria prior to being used as compacted fill. Predominantly granular No particles larger than 3 inches in largest dimension. Free of organic material, loam, trash, or other deleterious material. Expansion index of 30 or less. Contain less than 30 percent by weight retained in 3/4-inch sieve. Contain less than 40 percent fines (passing #200 sieve). Any imported fills should be tested and approved by geotechnical representative prior to delivery to the site. 9.4 Compacted Fill Placement All surfaces to receive structural fills should be scarified to a depth of 12 inches. The soil should be moisture conditioned to within ±3 percent of optimum moisture content for coarse soils and 0 to 2 percent above optimum moisture content for fine soils. The scarified soils should be recompacted to at least 90 percent of the laboratory maximum dry density.

Revised Geotechnical Investigation Report Gymnasium Expansion
Pacific High School 1020 Pacific Street
City of San Bernardino, San Bernardino County, California May 6, 2019
Page 18
Converse Consultants M:\JOBFILE\2018\81\18-81-134 SBCUSD, New Diesel Technology Center\Report\18-81-134-03_RGIR
Fill soils should be thoroughly mixed and moisture conditioned to within ±3 percent of optimum moisture content for coarse soils and 0 to 2 percent above optimum moisture content for fine soils. Fill soils should be evenly spread in horizontal lifts not exceeding 8 inches in uncompacted thickness. All fill placed at the site should be compacted to at least 90 percent of the laboratory maximum dry densities as determined by ASTM Standard D1557 test method, unless a higher compaction is specified herein. To reduce differential settlement, variations in the soil type, degree of compaction and thickness of the engineered fill placed underneath the foundations should be minimized. Fill materials should not be placed, spread or compacted during unfavorable weather conditions. When site grading is interrupted by heavy rain, filling operations should not resume until the geotechnical consultant approves the moisture and density conditions of the previously placed fill. 9.5 Shrinkage and Subsidence The volume of excavated and recompacted soils may be expected to increase or decrease as a result of grading. The shrinkage would depend on, among other factors, the depth of cut and/or fill, and the grading method and equipment utilized. For preliminary estimation, shrinkage factors for various units of earth material at the site may be taken as presented below. The shrinkage factor (defined as a percentage of soil volume reduction when moisture
conditioned and compacted to the average of 92 percent relative compaction) for the upper 5 feet of soils is estimated to range from 6 to 16 percent. An average value of 11 percent may be used for preliminary earthwork planning.
Subsidence (defined as the settlement of native materials from the equipment load applied during grading) would depend on the construction methods including type of equipment utilized. For estimation purposes, ground subsidence may be taken as 0.1 feet.
Although these values are only approximate, they represent our best estimates of the factors to be used to calculate lost volume that may occur during grading. If more accurate shrinkage and subsidence factors are needed, it is recommended that field-testing using the actual equipment and grading techniques be conducted. 9.6 Site Drainage Adequate positive drainage should be provided away from the structure to prevent ponding and to reduce percolation of water into structural backfill. A desirable slope for surface drainage is 2 percent in landscaped areas and 1 percent in paved areas. Planters and landscaped areas adjacent to the building perimeter should be designed to minimize water infiltration into the subgrade soils. Gutters and downspouts should be

Revised Geotechnical Investigation Report Gymnasium Expansion
Pacific High School 1020 Pacific Street
City of San Bernardino, San Bernardino County, California May 6, 2019
Page 19
Converse Consultants M:\JOBFILE\2018\81\18-81-134 SBCUSD, New Diesel Technology Center\Report\18-81-134-03_RGIR
installed on the roofs of the structures, and runoff should be directed to the storm drain through non-erosive devices. 10.0 DESIGN RECOMMENDATIONS The existing gymnasium building is supported on conventional continuous shallow foundation systems. The new gymnasium lobby expansion will also be supported on conventional continuous shallow foundation systems. New footings abutting existing footings should have adhesive dowel connections to mitigate differential settlement. New footings should be conservatively sized to carry all new construction loads, without reliance on existing footings. The structural engineer should provide appropriate measures to compatible the existing and new foundations systems. Recommendations for the design and construction of the proposed building are presented in the following sections. The recommendations provided are based on the assumption that, in preparing the site, the above earthwork recommendations will be implemented. 10.1 Shallow Foundation Design Parameters The proposed structure may be supported on continuous spread footing and/or isolated spread footings. The design of the shallow foundations should be based on the recommended parameters presented in the table below. Table No. 9, Recommended Foundation Parameters
Parameter Value
Minimum continuous spread footing width 18 inches Minimum isolated footing width 18 inches Minimum continuous or isolated footing depth of embedment below lowest adjacent grade 18 inches
Allowable net bearing capacity 2,000 psf The allowable net bearing capacity is defined as the maximum allowable net bearing pressure on the ground. It is obtained by dividing the net ultimate bearing capacity by a safety factor. The ultimate bearing capacity is the bearing stress at which ground fails by shear or experiences a limiting amount of settlement at the foundation. The net ultimate bearing capacity is obtained by subtracting the total overburden pressure on a horizontal plane at the foundation level from the ultimate bearing capacity. The footing dimensions and reinforcement should be based on structural design. The allowable bearing capacity can be increased by 500 psf with each foot of additional embedment and 150 psf with each foot of additional width up to a maximum of 2,500 psf.

Revised Geotechnical Investigation Report Gymnasium Expansion
Pacific High School 1020 Pacific Street
City of San Bernardino, San Bernardino County, California May 6, 2019
Page 20
Converse Consultants M:\JOBFILE\2018\81\18-81-134 SBCUSD, New Diesel Technology Center\Report\18-81-134-03_RGIR
The net allowable bearing values indicated above are for the dead load and frequently applied live loads and are obtained by applying a factor of safety of 3.0 to the net ultimate bearing capacity. If normal code requirements are applied for design, the above vertical bearing value may be increased by 33 percent for short duration loading, which will include loading induced by wind or seismic forces. 10.2 Modulus of Subgrade Reaction For the subject project, design of the structure supported on subgrade prepared in accordance with the recommendations provided in this report may be based on a soil modulus of subgrade reaction of 150 kips per cubic feet (kcf), this assumes that soils, similar to the on-site soils will be utilized for import. 10.3 Lateral Earth Pressures and Resistance to Lateral Loads In the following subsections, the lateral earth pressures and resistance to lateral loads are estimated by using on-site native soils strength parameters obtained from laboratory testing. 10.3.1 Active Earth Pressures The active earth pressure behind any buried wall or foundation depends primarily on the allowable wall movement, type of backfill materials, backfill slopes, wall or foundation inclination, surcharges, and any hydrostatic pressures. The recommended lateral earth pressures for level backfill profile for the site are presented in the following table. Table No. 10, Active and At-Rest Earth Pressures
Loading Conditions Lateral Earth Pressure (psf/ft depth)
Active earth conditions (wall is free to deflect at least 0.001 radian) 40 At-rest (wall is restrained) 60
These pressures assume a level ground surface behind the walls for a distance greater than the walls height, no surcharge and no hydrostatic pressure. If water pressure is allowed to build up behind the walls, the active pressures should be reduced by 50 percent and added to a full hydrostatic pressure to compute the design pressures against the walls. 10.3.2 Passive Earth Pressure Resistance to lateral loads can be assumed to be provided by friction acting at the base of foundations and by passive earth pressure. Coefficients of friction of 0.40 between mass concrete and soil, 0.35 between formed concrete and soil, and 0.25 between steel and soil may be used. A passive earth pressure of 200 psf per foot of depth may be used for
Revised Geotechnical Investigation Report Gymnasium Expansion
Pacific High School 1020 Pacific Street
City of San Bernardino, San Bernardino County, California May 6, 2019
Page 21
Converse Consultants M:\JOBFILE\2018\81\18-81-134 SBCUSD, New Diesel Technology Center\Report\18-81-134-03_RGIR
the sides of footings poured against recompacted native soils. A factor of safety of 1.5 was applied in calculating passive earth pressure. The maximum value of the passive earth pressure should be limited to 2,000 psf. These lateral resistances may be increased by 33 percent for seismic forces. Due to the low overburden stress of the soil at shallow depth, the upper one foot of passive resistance should be neglected unless the soil is confined by pavement or slab. Vertical and lateral bearing values indicated above are for the total dead loads and frequently applied live loads. If normal code requirements are applied for design, the above vertical bearing and lateral resistance values may be increased by 33 percent for short duration loading, which will include the effect of wind or seismic forces. 10.4 Slabs-on-Grade Slabs-on-grade should be supported on properly compacted fill. Compacted fill used to support slabs-on-grade should be placed and compacted in accordance with Section 9.4 Compacted Fill Placement. Slabs-on-grade should have a minimum thickness of 4 inches for support of nominal ground-floor live loads. Minimum reinforcement for slabs-on-grade should be No. 4 reinforcing bars, spaced at 18-inches on-center each way. Structural design elements of slabs-on-grade, including but not limited to thickness, reinforcement, joint spacing of more heavily-loaded slabs will be dependent upon the anticipated loading conditions and the modulus of subgrade reaction of the supporting materials and should be designed by a structural engineer. Slabs should be designed and constructed as promulgated by the American Concrete Institute (ACI) and the Portland Cement Association (PCA). Care should be taken during concrete placement to avoid slab curling. Prior to the slab pour, all utility trenches should be properly backfilled and compacted. Subgrade for slabs-on-grade should be firm and uniform. All loose or disturbed soils including under-slab utility trench backfill should be recompacted. In hot weather, the contractor should take appropriate curing precautions after placement of concrete to minimize cracking or curling of the slabs. The potential for slab cracking may be lessened by the addition of fiber mesh to the concrete and/or control of the water/cement ratio. Concrete should be cured by protecting it against loss of moisture and rapid temperature change for at least 7 days after placement. Moist curing, waterproof paper, white polyethylene sheeting, white liquid membrane compound, or a combination thereof may be used after finishing operations have been completed. The edges of concrete slabs exposed after removal of forms should be immediately protected to provide continuous curing.

Revised Geotechnical Investigation Report Gymnasium Expansion
Pacific High School 1020 Pacific Street
City of San Bernardino, San Bernardino County, California May 6, 2019
Page 22
Converse Consultants M:\JOBFILE\2018\81\18-81-134 SBCUSD, New Diesel Technology Center\Report\18-81-134-03_RGIR
10.5 Settlement The total settlement of shallow footings from static structural loads and short-term settlement of properly compacted fill is anticipated to be 1 inch or less. The differential settlement resulting from static loads is anticipated to be 0.5 inches or less over a horizontal distance of 40 feet. Our analysis of the potential dynamic settlement is presented in Appendix C, Dynamic Settlement Analysis. We estimate that the project site has the potential for up to 5.1 inches of dry seismic settlement with up to 1.85 inches of liquefaction induced settlement during a large earthquake. The soil profile across the site is relatively similar. So, we anticipate that the total settlement will be uniform. We recommend that the planned structure be designed conservatively in anticipation of dynamic differential settlement of 0.7 inches in 40 horizontal feet. Generally, the static and dynamic settlement does not occur at the same time. For design purpose, the structural engineer should decide whether static and dynamic settlement will be combined or not. 10.6 Expansion Potential Expansive soils are characterized by their ability to undergo significant volume change (shrink or swell) due to variations in moisture content. Changes in soil moisture content can result from rainfall, landscape irrigation, utility leakage, roof drainage, perched groundwater, drought, or other factors and may cause unacceptable settlement or heave of structures, concrete slabs supported-on-grade, or pavements supported over these materials. Expansion index of the upper 5 feet of on-site soil was 5, indicating very low expansion potential. During construction grading will mix and relocate the site soils, and additional fill soils may be added. The expansion potential of the finish-grade soils should be tested at the completion of grading. Shallow foundations should be designed to accommodate the anticipated soil expansion. 10.7 Soil Corrosivity Two representative samples of the site soils were evaluated for corrosivity with respect to common construction materials such as concrete and steel. The test results are presented in Appendix B, Laboratory Testing Program and design recommendations pertaining to soil corrosivity are presented below. The sulfate contents of the sampled soils correspond to American Concrete Institute (ACI) exposure category S0 for these sulfate concentrations (ACI 318-14, Table 19.3.1.1). No concrete type restrictions are specified for exposure category S0 (ACI

Revised Geotechnical Investigation Report Gymnasium Expansion
Pacific High School 1020 Pacific Street
City of San Bernardino, San Bernardino County, California May 6, 2019
Page 23
Converse Consultants M:\JOBFILE\2018\81\18-81-134 SBCUSD, New Diesel Technology Center\Report\18-81-134-03_RGIR
318-14, Table 19.3.2.1). A minimum compressive strength of 2,500 psi is recommended. We anticipate that concrete structures such as footings, slabs, and flatwork will be exposed to moisture from precipitation and irrigation. Based on the site locations and the results of chloride testing of the site soils, we do not anticipate that concrete structures will be exposed to external sources of chlorides, such as deicing chemicals, salt, brackish water, or seawater. ACI specifies exposure category C1 where concrete is exposed to moisture, but not to external sources of chlorides (ACI 318-14, Table 19.3.1.1). ACI provides concrete design recommendations in ACI 318-14, Table 19.3.2.1, including a compressive strength of at least 2,500 psi and a maximum chloride content of 0.3 percent. The measured value of the minimum electrical resistivities of the samples when saturated were 1,213 to 6,548 Ohm-cm for the site. This indicates that the soils tested of the site are corrosive to moderately corrosive to ferrous metals in contact with the soil (Romanoff, 1957). Converse does not practice in the area of corrosion consulting. A qualified corrosion consultant should provide appropriate corrosion mitigation measures for any ferrous metals in contact with the site and site soils. 11.0 CONSTRUCTION RECOMMENDATIONS Temporary sloped excavation and shoring design recommendations are presented in the following sections. 11.1 General Both sloped and vertical braced excavations can be considered for the foundations at the proposed project site. Recommendations pertaining to temporary excavations are presented in this section. Depending on the sequence of construction, excavations may be required near existing streets or structures, which may require vertical side wall excavation. Where the side of the excavation is a vertical cut, it should be adequately supported by temporary shoring to protect workers and any adjacent structures. All applicable requirements of the California Construction and General Industry Safety Orders, the Occupational Safety and Health Act, and the Construction Safety Act should be met. The soils exposed in cuts should be observed during excavation by the geotechnical consultant and the competent person designated by the contractor. If potentially unstable soil conditions are encountered, modifications of slope ratios for temporary cuts may be required.

Revised Geotechnical Investigation Report Gymnasium Expansion
Pacific High School 1020 Pacific Street
City of San Bernardino, San Bernardino County, California May 6, 2019
Page 24
Converse Consultants M:\JOBFILE\2018\81\18-81-134 SBCUSD, New Diesel Technology Center\Report\18-81-134-03_RGIR
11.2 Temporary Sloped Excavations Temporary open-cut may be constructed with side slopes as recommended in the following table. Temporary cuts encountering soft and wet fine-grained soils; dry loose, cohesionless soils or loose fill from trench backfill may have to be constructed at a flatter gradient than presented below. Table No. 11, Slope Ratios for Temporary Excavations
Soil Type OSHA Soil Type Depth of Excavation (ft)
Recommended Maximum Slope (Horizontal:Vertical)¹
Silty Sand (SM) C 0-10 1.5:1 1 Slope ratio assumed to be uniform from top to toe of slope. For steeper temporary construction slopes or deeper excavations, or unstable soil encountered during the excavation, shoring or trenches should be provided by the contractor to protect the workers in the excavation. Design recommendations for temporary shoring can be provided if necessary. Surfaces exposed in slope excavations should be kept moist but not saturated to retard raveling and sloughing during construction. Adequate provisions should be made to protect the slopes from erosion during periods of rainfall. Surcharge loads, including construction materials, should not be placed within 5 feet of the unsupported slope edge. Stockpiled soils with a height higher than 6 feet will require greater distance from excavation edges. 12.0 GEOTECHNICAL SERVICES DURING CONSTRUCTION The project geotechnical consultant should review plans and specifications as the project design progresses. Such review is necessary to identify design elements, assumptions, or new conditions which require revisions or additions to our geotechnical recommendations. The project geotechnical consultant should be present to observe conditions during construction. Geotechnical observation and testing should be performed as needed to verify compliance with project specifications. Additional geotechnical recommendations may be required based on subsurface conditions encountered during construction.
13.0 CLOSURE This report is prepared for the project described herein and is intended for use solely by San Bernardino City Unified School District and their authorized agents, to assist in the design and construction of the proposed project. Our findings and recommendations were obtained in accordance with generally accepted professional principles practiced in geotechnical engineering. We make no other warranty, either expressed or implied.

Revised Geotechnical Investigation Report Gymnasium Expansion
Pacific High School 1020 Pacific Street
City of San Bernardino, San Bernardino County, California May 6, 2019
Page 25
Converse Consultants M:\JOBFILE\2018\81\18-81-134 SBCUSD, New Diesel Technology Center\Report\18-81-134-03_RGIR
Converse Consultants is not responsible or liable for any claims or damages associated with interpretation of available information provided to others. Site exploration identifies actual soil conditions only at those points where samples are taken, when they are taken. Data derived through sampling and laboratory testing is extrapolated by Converse employees who render an opinion about the overall soil conditions. Actual conditions in areas not sampled may differ. In the event that changes to the project occur, or additional, relevant information about the project is brought to our attention, the recommendations contained in this report may not be valid unless these changes and additional relevant information are reviewed and the recommendations of this report are modified or verified in writing. In addition, the recommendations can only be finalized by observing actual subsurface conditions revealed during construction. Converse cannot be held responsible for misinterpretation or changes to our recommendations made by others during construction. As the project evolves, continued consultation and construction monitoring by a qualified geotechnical consultant should be considered an extension of geotechnical investigation services performed to date. The geotechnical consultant should review plans and specifications to verify that the recommendations presented herein have been appropriately interpreted, and that the design assumptions used in this report are valid. Where significant design changes occur, Converse may be required to augment or modify the recommendations presented herein. Subsurface conditions may differ in some locations from those encountered in the explorations, and may require additional analyses and, possibly, modified recommendations. Design recommendations given in this report are based on the assumption that the recommendations contained in this report are implemented. Additional consultation may be prudent to interpret Converse's findings for contractors, or to possibly refine these recommendations based upon the review of the actual site conditions encountered during construction. If the scope of the project changes, if project completion is to be delayed, or if the report is to be used for another purpose, this office should be consulted.
Revised Geotechnical Investigation Report Gymnasium Expansion
Pacific High School 1020 Pacific Street
City of San Bernardino, San Bernardino County, California May 6, 2019
Page 26
Converse Consultants M:\JOBFILE\2018\81\18-81-134 SBCUSD, New Diesel Technology Center\Report\18-81-134-03_RGIR
14.0 REFERENCES AMERICAN CONCRETE INSTITUTE (ACI), 2014, Building Code Requirements for
Structural Concrete (ACI 318-14) and Commentary, October 2014. BLAKE, T. F., 2000, EQFAULT and EQSEARCH Computer Programs for Performing
Probabilistic, and Seismic Coefficient Analysis and Historical Earthquake Search. CALIFORNIA BUILDING STANDARDS COMMISSION (CBSC), 2016, California Building
Code (CBC). CALIFORNIA GEOLOGICAL SURVEY (CGS, 1974) (formerly California Division of
Mines and Geology), 1974, State of California Special Studies Zones, San Bernardino North Quadrangle, scale 1:24,000, dated July 1, 1974.
CALIFORNIA GEOLOGICAL SURVEY (CGS), 2008, Guidelines for Evaluating and
Mitigating Seismic Hazards in California, Special Publication 117A, dated September 11, 2008.
CALIFORNIA GEOLOGICAL SURVEY (CGS, 2013), Note 48, Checklist for the Review
of Engineering Geology and Seismology Reports for California Public Schools, Hospitals, and Essential Services Structures, dated October 2013.
CALIFORNIA STATE WATER RESOURCES CONTROL BOARD (SWRCB), 2018,
GeoTracker database (http://geotracker.waterboards.ca.gov/), accessed October 11, 2018.
CAO, T., BRYANT, W.A., ROWSHANDEL, B., BRANUM, D., and WILLS, C.J., 2003, The
Revised 2002 California Probabilistic Seismic Hazard Maps, (http://www.consrv.ca.gov/cgs/rghm/psha/fault_parameters/pdf/Documents/2002_CA_Hazard_Maps.pdf), dated June 2003.
CIVILTECH SOFTWARE, 2011, LiquefyPro: Liquefaction and Settlement Analysis
Software, version 5.2E. DAS, B.M., 2011, Principles of Foundation Engineering, Seventh Edition, published by
Global Engineering, 2011. DIBBLEE, T.W., and MINCH, J.A., 2004, Geologic Map of the San Bernardino
North/north 1/2 of San Bernardino South Quadrangles, San Bernardino and Riverside County, California, Dibblee Geological Foundation Map DF-127, scale 1:24,000.

Revised Geotechnical Investigation Report Gymnasium Expansion
Pacific High School 1020 Pacific Street
City of San Bernardino, San Bernardino County, California May 6, 2019
Page 27
Converse Consultants M:\JOBFILE\2018\81\18-81-134 SBCUSD, New Diesel Technology Center\Report\18-81-134-03_RGIR
FEDERAL EMERGENCY MANAGEMENT AGENCY (FEMA), 2008, Flood Insurance Rate Map, Riverside County, California and Incorporated Areas, Map No. 06065C0745G, dated August 28, 2008.
MORTON, D.M. and MILLER, F.K., 2006, Geologic Map of the San Bernardino and
Santa Ana 30' x 60' Quadrangles, California, U.S. Geological Survey Open-File Report 2006-1217, scale 1:100,000.
RISK ENGINEERING, INC., 2012, EZ-FRISK: Software for Earthquake Ground Motion
Estimation, version 7.65. SAN BERNARDINO COUNTY, 2010a, San Bernardino County General Plan Hazard
Overlays, Map Sheet FH22B, scale 1:24,000, dated March 9, 2010. SAN BERNARDINO COUNTY, 2010b, San Bernardino County General Plan Geologic
Hazard Overlays, Map Sheet FH22C, scale 1:24,000, dated March 9, 2010. ROMANOFF, MELVIN, 1957, Underground Corrosion, National Bureau of Standards
Circular 579, dated April 1957. U.S. GEOLOGICAL SURVEY (USGS), 2018a, National Water Information System: Web
Interface (http://nwis.waterdata.usga.gov/nwis/gwlevels), accessed on October 11, 2018.
U.S. GEOLOGICAL SURVEY (USGS), 2018b, U.S. Seismic Design Maps Application
(http://geohazards.usgs.gov/designmaps/us/application.php), accessed on October 11, 2018.
Appendix AField Exploration
Revised Geotechnical Investigation Report Gymnasium Expansion
Pacific High School 1020 Pacific Street
City of San Bernardino, San Bernardino County, California May 6, 2019
Page A-1
Converse Consultants M:\JOBFILE\2018\81\18-81-134 SBCUSD, New Diesel Technology Center\Report\18-81-134-03_RGIR
APPENDIX A
FIELD EXPLORATION
Our field investigation included a site reconnaissance and a subsurface exploration program consisting of drilling soil borings. During the site reconnaissance, the surface conditions were noted, and the approximate locations of the test borings were established by reference to existing site and boundary features. The mapped locations should be considered accurate only to the degree implied by the method used to locate the borings. Two exploratory borings (BH-01 and BH-02) were drilled on October 2, 2018 to investigate the subsurface conditions at the site. The borings were drilled to their planned maximum depths of 21.5 and 51.5 feet bgs. The borings were advanced using a truck-mounted drill rig equipped with 8-inch diameter hollow-stem augers for soils sampling. Encountered materials were continuously logged by a Converse geologist and classified in the field by visual classification in accordance with the Unified Soil Classification System. Where appropriate, the field descriptions and classifications have been modified to reflect laboratory test results. Relatively undisturbed samples were obtained using California Modified Samplers (2.4 inches inside diameter and 3.0 inches outside diameter) lined with thin sample rings. The steel ring sampler was driven into the bottom of the borehole with successive drops of a 140-pound driving weight falling 30 inches. Blow counts at each sample interval are presented on the boring logs. Samples were retained in brass rings (2.4 inches inside diameter and 1.0 inch in height) and carefully sealed in waterproof plastic containers for shipment to the Converse laboratory. Bulk samples of typical soil types were also obtained. Standard Penetration Testing (SPT) was also performed in accordance with the ASTM Standard D1586 test method in boring BH-02 at depth of 20 feet bgs and in boring BH-01 at depths of 20, 30, 40, and 50 feet bgs using a standard (1.4 inches inside diameter and 2.0 inches outside diameter) split-barrel sampler. The mechanically driven hammer for the SPT sampler was 140 pounds, falling 30 inches for each blow. The recorded blow counts for every 6 inches for a total of 1.5 feet of sampler penetration are shown on the Logs of Borings. The exact depths at which material changes occur cannot always be established accurately. Unless a more precise depth can be established by other means, changes in material conditions that occur between drive samples are indicated on the logs at the top of the next drive sample.

Revised Geotechnical Investigation Report Gymnasium Expansion
Pacific High School 1020 Pacific Street
City of San Bernardino, San Bernardino County, California May 6, 2019
Page A-2
Converse Consultants M:\JOBFILE\2018\81\18-81-134 SBCUSD, New Diesel Technology Center\Report\18-81-134-03_RGIR
Following the completion of logging and sampling, the borings were backfilled with soil cuttings and tamped. If construction is delayed, the surface may settle over time. So, we recommend the owner monitor the boring locations and backfill any depressions that might occur or provide protection around the boring locations to prevent trip and fall injuries from occurring near the area of any potential settlement. For a key to soil symbols and terminology used in the boring logs, refer to Drawing No. A-1, Unified Soil Classification and Key to Boring Log Symbols. For logs of borings, see Drawings No. A-2 and A-3, Logs of Borings.

1
A-1Drawing No.Project No.
18-81-134-03
Gymnasium Expansion
Northern Edge of the Pacific High School
1020 Pacific Street
City of San Bernardino, San Bernardino County, California For: San Bernardino City Unified School District
Project ID: 18-81-134-03.GPJ; Template: KEY
(LITTLE OR NO FINES)
INORGANIC SILTS AND VERYFINE SANDS, ROCK FLOUR,SILTY OR CLAYEY FINESANDS OR CLAYEY SILTSWITH SLIGHT PLASTICITY
LIQUID LIMIT LESS
THAN 50
SILTY GRAVELS, GRAVEL - SAND- SILT MIXTURES
OH
SC
SILTS AND
CLAYS
MORE THAN 50% OF
COARSE FRACTION
PASSING ON NO. 4
SIEVE
MORE THAN 50% OF
MATERIAL IS
LARGER THAN NO.
200 SIEVE SIZE
SILTY SANDS, SAND - SILTMIXTURES
POORLY-GRADED SANDS,GRAVELLY SAND, LITTLE ORNO FINES
(LITTLE OR NO FINES)
OL
WELL-GRADED GRAVELS,GRAVEL - SAND MIXTURES,LITTLE OR NO FINES
SANDS WITHFINES
CL
HIGHLY ORGANIC SOILS PT
MORE THAN 50% OF
MATERIAL IS
SMALLER THAN NO.
200 SIEVE SIZE
SM
WELL-GRADED SANDS,GRAVELLY SANDS, LITTLEOR NO FINES
(APPRECIABLE AMOUNTOF FINES)
SP
26-50
SW
COARSEGRAINED
SOILS
POORLY-GRADED GRAVELS,GRAVEL - SAND MIXTURES,LITTLE OR NO FINES
CLAYEY GRAVELS, GRAVEL -SAND - CLAY MIXTURES
SAMPLE TYPE
LETTER
INORGANIC CLAYS OF LOW TOMEDIUM PLASTICITY,GRAVELLY CLAYS, SANDYCLAYS, SILTY CLAYS, LEANCLAYS
ORGANIC CLAYS OF MEDIUM TOHIGH PLASTICITY, ORGANICSILTS
SANDAND
SANDYSOILS
INORGANIC SILTS, MICACEOUSOR DIATOMACEOUS FINESAND OR SILTY SOILS
SOIL CLASSIFICATION CHART
UNIFIED SOIL CLASSIFICATION AND KEY TO BORING LOG SYMBOLS
MORE THAN 50% OF
COARSE FRACTION
RETAINED ON NO. 4
SIEVE
PlasticityGrain Size AnalysisPassing No. 200 SieveSand EquivalentExpansion IndexCompaction CurveHydrometerDisturb
CLASSIFICATIONpimawaseeimaxhDist.
ConsolidationCollapse TestResistance (R) ValueChemical AnalysisElectrical ResistivityPermeabilitySoil Cement
Pocket PenetrometerDirect ShearDirect Shear (single point)Unconfined CompressionTriaxial CompressionVane Shear
STRENGTH
pdsds*uctxvs
ccolrcaerpermsc
(APPRECIABLE AMOUNTOF FINES)
GC
DESCRIPTIONS
BORING LOG SYMBOLS
NOTE: DUAL SYMBOLS ARE USED TO INDICATE BORDERLINE SOIL CLASSIFICATIONS
LABORATORY TESTING ABBREVIATIONS
TEST TYPE
(Results shown in Appendix B)
ORGANIC SILTS AND ORGANICSILTY CLAYS OF LOWPLASTICITY
FINE
GRAINED
SOILS
SILTS AND
CLAYS
ML
TYPICAL
Split barrel sampler in accordance withASTM D-1586-84 Standard Test Method
SPT (N)
No recovery
BULK SAMPLE
GROUNDWATER WHILE DRILLING
GROUNDWATER AFTER DRILLING
40 - 60 60 - 80< 20
4 - 11 11 - 30 31 - 50 > 50< 5 5 - 12 13 - 35 36 - 60 > 60
RelativeDensity (%)
Very LooseConsistency
2-4 9-15 16-30CA Sampler
> 30> 503-6 7-12 13-25
MH
GM
GW
SYMBOLS
PEAT, HUMUS, SWAMP SOILSWITH HIGH ORGANICCONTENTS
LIQUID LIMIT
GREATER THAN 50
MAJOR DIVISIONS
STANDARD PENETRATION TEST
Dense
< 4SPT (N)CA Sampler
Very DenseLoose Medium
20 - 40
Apparant Density
5-8< 2< 3> 80
CH
GRAVELSWITHFINES
Soft Medium Stiff Very StiffVery Soft Hard
DRIVE SAMPLE 2.42" I.D. sampler (CMS).
DRIVE SAMPLE
CLEANSANDS
GRAVELAND
GRAVELLYSOILS
CLEANGRAVELS
INORGANIC CLAYS OF HIGHPLASTICITY
GP
CLAYEY SANDS, SAND - CLAYMIXTURES
GRAPH
Converse Consultants

7/9/11
5/7/5
3/5/8
9/10/12
4/6/7
12/32/38
10/15/21
ei, ca, erma, max
ds
c
4" ASPHALT CONCRETE/NO AGGREGATE BASE
ALLUVIUMSILTY SAND (SM): fine to coarse-grained, dark brown.
SANDY SILT (ML): fine to coarse-grained sand, traceclay, dark brown.
SILTY SAND (SM): fine to medium-grained, brown.
SAND (SP): fine to coarse-grained, trace silt, brown.
7
7
17
13
8
110
106
112
108
120
Mike Maldonado Scot Mathis
BLO
WS
MO
IST
UR
E
DR
Y U
NIT
WT
.(p
cf)
SUMMARY OF SUBSURFACE CONDITIONS
Checked By:
DR
IVE
10/2/2018 Logged by:
Dep
th (
ft)
Gymnasium ExpansionPacific High School1020 Pacific StreetCity of San Bernardino, San Bernardino County, CaliforniaFor: San Bernardino City Unified School District
OT
HE
R
5
10
15
20
25
30
18-81-134-03 A-2a
Drawing No.
Log of Boring No. BH-01
1132Ground Surface Elevation (ft):G
raph
icLo
gSUMMARY OF SUBSURFACE CONDITIONS
This log is part of the report prepared by Converse for this projectand should be read together with the report. This summary appliesonly at the location of the boring and at the time of drilling.Subsurface conditions may differ at other locations and may changeat this location with the passage of time. The data presented is asimplification of actual conditions encountered.D
epth
(ft)
SAMPLES
Gra
phic
Log
Dates Drilled:
8" HOLLOW STEM AUGEREquipment:
Project No.
NOT ENCOUNTERED
Driving Weight and Drop: 140 lbs / 30 in
Depth to Water (ft):
BU
LK
Converse Consultants
Project ID: 18-81-134-03.GPJ; Template: LOG

12/33/43
15/18/20
25/50-5"
30/33/32
End of boring at 51.5 feet bgs.No groundwater encountered.Borehole backfilled with soil cuttings, tamped, andsurface patched with asphalt concrete on 10/2/18.
ALLUVIUMSAND (SP): fine to coarse-grained, few gravel up to 1.5"
in largest dimension, trace silt., brown.
2
2
107
108
Mike Maldonado Scot Mathis
BLO
WS
MO
IST
UR
E
DR
Y U
NIT
WT
.(p
cf)
SUMMARY OF SUBSURFACE CONDITIONS
Checked By:
DR
IVE
10/2/2018 Logged by:
Dep
th (
ft)
Gymnasium ExpansionPacific High School1020 Pacific StreetCity of San Bernardino, San Bernardino County, CaliforniaFor: San Bernardino City Unified School District
OT
HE
R
40
45
50
18-81-134-03 A-2b
Drawing No.
Log of Boring No. BH-01
1132Ground Surface Elevation (ft):G
raph
icLo
gSUMMARY OF SUBSURFACE CONDITIONS
This log is part of the report prepared by Converse for this projectand should be read together with the report. This summary appliesonly at the location of the boring and at the time of drilling.Subsurface conditions may differ at other locations and may changeat this location with the passage of time. The data presented is asimplification of actual conditions encountered.D
epth
(ft)
SAMPLES
Gra
phic
Log
Dates Drilled:
8" HOLLOW STEM AUGEREquipment:
Project No.
NOT ENCOUNTERED
Driving Weight and Drop: 140 lbs / 30 in
Depth to Water (ft):
BU
LK
Converse Consultants
Project ID: 18-81-134-03.GPJ; Template: LOG

10/13/12
4/9/11
5/8/13
5/11/14
9/12/13
ca, er,ma, max
ds
c
End of boring at 21.5 feet bgs.No groundwater encountered.Borehole backfilled with soil cuttings, tamped, andsurface patched with asphalt concrete on 10/2/18.
3" ASPHALT CONCRETE/NO AGGREGATE BASE
ALLUVIUMSILTY SAND (SM): fine to medium-grained, brown.
SANDY SILT (ML): fine-grained sand, brown.
SILTY SAND (SM): fine to coarse-grained, yellowishbrown.
SAND (SP): fine to medium-grained, light brown.
8
6
13
7
109
100
106
109
Mike Maldonado Scot Mathis
BLO
WS
MO
IST
UR
E
DR
Y U
NIT
WT
.(p
cf)
SUMMARY OF SUBSURFACE CONDITIONS
Checked By:
DR
IVE
10/2/2018 Logged by:
Dep
th (
ft)
Gymnasium ExpansionPacific High School1020 Pacific StreetCity of San Bernardino, San Bernardino County, CaliforniaFor: San Bernardino City Unified School District
OT
HE
R
5
10
15
20
18-81-134-03 A-3
Drawing No.
Log of Boring No. BH-02
1131Ground Surface Elevation (ft):G
raph
icLo
gSUMMARY OF SUBSURFACE CONDITIONS
This log is part of the report prepared by Converse for this projectand should be read together with the report. This summary appliesonly at the location of the boring and at the time of drilling.Subsurface conditions may differ at other locations and may changeat this location with the passage of time. The data presented is asimplification of actual conditions encountered.D
epth
(ft)
SAMPLES
Gra
phic
Log
Dates Drilled:
8" HOLLOW STEM AUGEREquipment:
Project No.
NOT ENCOUNTERED
Driving Weight and Drop: 140 lbs / 30 in
Depth to Water (ft):
BU
LK
Converse Consultants
Project ID: 18-81-134-03.GPJ; Template: LOG

Appendix BLaboratory Testing Program

Revised Geotechnical Investigation Report Gymnasium Expansion
Pacific High School 1020 Pacific Street
City of San Bernardino, San Bernardino County, California May 6, 2019
Page B-1
Converse Consultants M:\JOBFILE\2018\81\18-81-134 SBCUSD, New Diesel Technology Center\Report\18-81-134-03_RGIR
APPENDIX B
LABORATORY TESTING PROGRAM Tests were conducted in our laboratory on representative soil samples for the purpose of classification and evaluation of their relevant physical characteristics and engineering properties. The amount and selection of tests were based on the geotechnical requirements of the project. Summaries of the various laboratory tests conducted for this project and test results are presented below. Moisture Content and Dry Density In-situ dry density and moisture content tests were performed on relatively undisturbed ring samples, in accordance to ASTM Standard D2216 and ASTM D7263 to aid soils classification and to provide qualitative information on strength and compressibility characteristics of the site soils. For test results, see the Logs of Borings in Appendix A, Field Exploration. Expansion Index Test One representative bulk soil sample was tested to evaluate the expansion potential. The test was conducted in accordance with ASTM Standard D4829. The test result is presented in the following table. Table No. B-1, Expansion Index Test Result
Soil Corrosivity Tests Two representative soil samples were tested to determine minimum electrical resistivity, pH, and chemical content, including soluble sulfate and chloride concentrations. The purpose of these tests was to determine the corrosion potential of site soils when placed in contact with common construction materials. These tests were performed by AP Engineering and Testing, Inc. (Pomona, CA) in accordance to California Test Methods CT643, 422, and 417. Test results are presented in the table below.
Boring No.
Depth (feet) Soil Description Expansion
Index Expansion Potential
BH-01 1-5 Silty Sand (SM) 5 Very Low
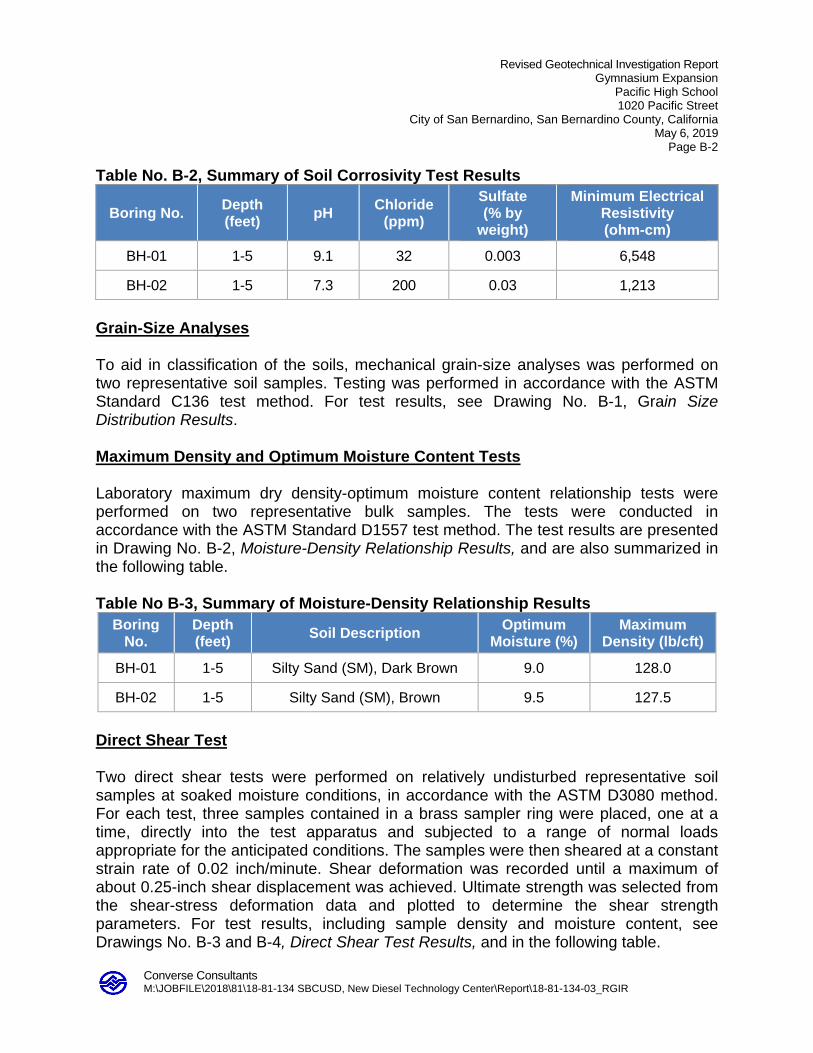
Revised Geotechnical Investigation Report Gymnasium Expansion
Pacific High School 1020 Pacific Street
City of San Bernardino, San Bernardino County, California May 6, 2019
Page B-2
Converse Consultants M:\JOBFILE\2018\81\18-81-134 SBCUSD, New Diesel Technology Center\Report\18-81-134-03_RGIR
Table No. B-2, Summary of Soil Corrosivity Test Results
Boring No. Depth (feet) pH Chloride
(ppm) Sulfate (% by
weight)
Minimum Electrical Resistivity (ohm-cm)
BH-01 1-5 9.1 32 0.003 6,548
BH-02 1-5 7.3 200 0.03 1,213 Grain-Size Analyses To aid in classification of the soils, mechanical grain-size analyses was performed on two representative soil samples. Testing was performed in accordance with the ASTM Standard C136 test method. For test results, see Drawing No. B-1, Grain Size Distribution Results. Maximum Density and Optimum Moisture Content Tests Laboratory maximum dry density-optimum moisture content relationship tests were performed on two representative bulk samples. The tests were conducted in accordance with the ASTM Standard D1557 test method. The test results are presented in Drawing No. B-2, Moisture-Density Relationship Results, and are also summarized in the following table. Table No B-3, Summary of Moisture-Density Relationship Results
Boring No.
Depth (feet) Soil Description Optimum
Moisture (%) Maximum
Density (lb/cft)
BH-01 1-5 Silty Sand (SM), Dark Brown 9.0 128.0
BH-02 1-5 Silty Sand (SM), Brown 9.5 127.5 Direct Shear Test Two direct shear tests were performed on relatively undisturbed representative soil samples at soaked moisture conditions, in accordance with the ASTM D3080 method. For each test, three samples contained in a brass sampler ring were placed, one at a time, directly into the test apparatus and subjected to a range of normal loads appropriate for the anticipated conditions. The samples were then sheared at a constant strain rate of 0.02 inch/minute. Shear deformation was recorded until a maximum of about 0.25-inch shear displacement was achieved. Ultimate strength was selected from the shear-stress deformation data and plotted to determine the shear strength parameters. For test results, including sample density and moisture content, see Drawings No. B-3 and B-4, Direct Shear Test Results, and in the following table.

Revised Geotechnical Investigation Report Gymnasium Expansion
Pacific High School 1020 Pacific Street
City of San Bernardino, San Bernardino County, California May 6, 2019
Page B-3
Converse Consultants M:\JOBFILE\2018\81\18-81-134 SBCUSD, New Diesel Technology Center\Report\18-81-134-03_RGIR
Table No. B-4, Summary of Direct Shear Test Results
Boring No.
Depth (feet)
Soil Description
Peak Strength Parameters Friction Angle
(degrees) Cohesion
(psf)
BH-01 5.0-6.5 Silty Sand (SM) 33 100
BH-02 5.0-6.5 Silty Sand (SM) 32 150 Consolidation Tests Two consolidation tests were conducted in accordance with ASTM Standard D2435 method. Data obtained from this test performed on two relatively undisturbed ring samples were used to evaluate the settlement characteristics of the on-site soils under load. Preparation for this test involved trimming the sample, placing it in a 1-inch-high brass ring, and loading it into the test apparatus, which contained porous stones to accommodate drainage during testing. Normal axial loads were applied to one end of the sample through the porous stones, and the resulting deflections were recorded at various time periods. The load was increased after the sample reached a reasonable state of equilibrium. Normal loads were applied at a constant load-increment ratio, successive loads being generally twice the preceding load. For test result, including sample density and moisture content, see Drawings No. B-5 and B-6, Consolidation Test Results. Sample Storage Soil samples stored in our laboratory will be discarded 30 days after the date of this report, unless this office receives a specific request to retain the samples for a longer period.

0
5
10
15
20
25
30
35
40
45
50
55
60
65
70
75
80
85
90
95
100
0.0010.010.1110100
4 200
Drawing No.
PE
RC
EN
T F
INE
R B
Y W
EIG
HT
100
GRAIN SIZE DISTRIBUTION RESULTS
coarse
6 5020
%Gravel
Description PI Cc
mediumfine
0.079
Depth (ft) D100 %Sand %Clay
4
U.S. SIEVE OPENING IN INCHES
coarse
2
SILTY SAND (SM)
SILTY SAND (SM)
Depth (ft) Cu
141 3
SILT OR CLAY
U.S. SIEVE NUMBERS
3/8
GRAVEL
140
COBBLES
Project No.
1-5
1-5
D10 %Silt
Boring No. PL
18-81-134-03
10
BH-01
BH-02
BH-01
BH-02
58.0
68.0
0.145
0.288
1-5
1-5
Gymnasium Expansion
Northern Edge of the Pacific High School
1020 Pacific Street
City of San Bernardino, San Bernardino County, California
For: San Bernardino City Unified School District
6 30 403
HYDROMETER
42.0
29.0
D30
SAND
4.75
25
Boring No. D60
LL
0.0
3.0
1683/4
GRAIN SIZE IN MILLIMETERS
1.5 1/2
fine
60
Project ID: 18-81-134-03.GPJ; Template: GRAIN SIZE
Converse Consultants B-1

90
95
100
105
110
115
120
125
130
135
140
145
150
0 5 10 15 20 25 30
DR
Y D
EN
SIT
Y,
pcf
MOISTURE-DENSITY RELATIONSHIP RESULTS
B-2Drawing No.
2.802.702.60
9.0
9.5
WATER CONTENT, %
DEPTH (ft) DESCRIPTIONASTM
TEST METHODOPTIMUMWATER, %
MAXIMUM DRYDENSITY, pcf
BH-01
BH-02
128.0
127.5
1-5
1-5
Curves of 100% Saturationfor Specific Gravity Equal to:
Project No.18-81-134-03
SYMBOL BORING NO.
SILTY SAND (SM), Dark Brown
SILTY SAND (SM), Brown
D1557- A
D1557- A
Gymnasium Expansion
Northern Edge of the Pacific High School
1020 Pacific Street
City of San Bernardino, San Bernardino County, California For: San Bernardino City Unified School DistrictProject ID: 18-81-134-03.GPJ; Template: COMPACTION
Converse Consultants

0
500
1,000
1,500
2,000
2,500
3,000
3,500
4,000
0 1,000 2,000 3,000 4,000
DESCRIPTION :
SURCHARGE PRESSURE, psf
33:
Project No.18-81-134-03
:
:
5.0-6.5
DRY DENSITY (pcf)
DIRECT SHEAR TEST RESULTS
:BORING NO.
SILTY SAND (SM)
B-3
: 6.9
100
115.7
Drawing No.
COHESION (psf)
BH-01
NOTE: Ultimate Strength.
DEPTH (ft)
MOISTURE CONTENT (%)
SH
EA
R S
TR
EN
GT
H,
psf
FRICTION ANGLE (degrees)
:
Gymnasium Expansion
Northern Edge of the Pacific High School
1020 Pacific Street
City of San Bernardino, San Bernardino County, California
For: San Bernardino City Unified School District
Converse Consultants
Project ID: 18-81-134-03.GPJ; Template: DIRECT SHEAR

0
500
1,000
1,500
2,000
2,500
3,000
3,500
4,000
0 1,000 2,000 3,000 4,000
DESCRIPTION :
SURCHARGE PRESSURE, psf
32:
Project No.18-81-134-03
:
:
5.0-6.5
DRY DENSITY (pcf)
DIRECT SHEAR TEST RESULTS
:BORING NO.
SILTY SAND (SM)
B-4
: 7.5
150
108.7
Drawing No.
COHESION (psf)
BH-02
NOTE: Ultimate Strength.
DEPTH (ft)
MOISTURE CONTENT (%)
SH
EA
R S
TR
EN
GT
H,
psf
FRICTION ANGLE (degrees)
:
Gymnasium Expansion
Northern Edge of the Pacific High School
1020 Pacific Street
City of San Bernardino, San Bernardino County, California
For: San Bernardino City Unified School District
Converse Consultants
Project ID: 18-81-134-03.GPJ; Template: DIRECT SHEAR

0
2
4
6
8
10100 1,000 10,000 105
NOTE: SOLID CIRCLES INDICATE READINGS AFTER ADDITION OF WATER
MOISTURECONTENT (%)
DRY DENSITY(pcf)
BH-01BORING NO.
SILTY SAND (SM)
Project No.18-81-134-03
VOIDRATIO
DEPTH (ft)
CONSOLIDATION TEST RESULTS
INITIAL
FINAL
Drawing No.
DESCRIPTION :
:
B-5
STRESS, psf
PERCENTSATURATION
ST
RA
IN,
%
: 7.5-9.0
Gymnasium ExpansionNorthern Edge of the Pacific High School1020 Pacific StreetCity of San Bernardino, San Bernardino County, California For: San Bernardino City Unified School District
Project ID: 18-81-134-03.GPJ; Template: CONSOLIDATION
Converse Consultants
7
17
106
112
33
100
0.560)
0.474

0
2
4
6
8
10100 1,000 10,000 105
NOTE: SOLID CIRCLES INDICATE READINGS AFTER ADDITION OF WATER
MOISTURECONTENT (%)
DRY DENSITY(pcf)
BH-02BORING NO.
SILTY SAND (SM)
Project No.18-81-134-03
VOIDRATIO
DEPTH (ft)
CONSOLIDATION TEST RESULTS
INITIAL
FINAL
Drawing No.
DESCRIPTION :
:
B-6
STRESS, psf
PERCENTSATURATION
ST
RA
IN,
%
: 7.5-9.0
Gymnasium ExpansionNorthern Edge of the Pacific High School1020 Pacific StreetCity of San Bernardino, San Bernardino County, California For: San Bernardino City Unified School District
Project ID: 18-81-134-03.GPJ; Template: CONSOLIDATION
Converse Consultants
6 100
16 114
24
100 0.446
0.654

Appendix CDynamic Settlement Analysis

Revised Geotechnical Investigation Report Gymnasium Expansion
Pacific High School 1020 Pacific Street
City of San Bernardino, San Bernardino County, California May 6, 2019
Page C-1
Converse Consultants M:\JOBFILE\2018\81\18-81-134 SBCUSD, New Diesel Technology Center\Report\18-81-134-03_RGIR
APPENDIX C
DYNAMIC SETTLEMENT ANALYSIS
The subsurface data obtained from the boring (BH-01) drilled during the field investigation was used to evaluate liquefaction potential and dry seismic settlement due to densification of relatively loose sediments subjected to ground shaking during earthquakes. The liquefaction analyses were performed using LiquefyPro (Civiltech, 2011). Based on our site-specific seismic analysis, presented in Section 7.3, Site-Specific Seismic Analysis, of this report, a mean earthquake magnitude of M7.0 and peak ground acceleration (PGA) of 0.99g, where g is the acceleration due to gravity, were selected for this analysis. This PGA is the site-specific MCE-based PGA determined in accordance with ASCE 7-10 Section 21.5.3. Analysis was conducted for a factor of safety of 1.3. The result of our analysis is presented on Plate C-1 and summarized in the following table. Table C-1, Estimated Dynamic Settlements
Location Groundwater Conditions
Groundwater Depth (feet bgs)
Dry Seismic Settlement (inches)
Liquefaction Induced Settlement (inches)
BH-01
In-situ (current) 52
5.05 1.82 During Earthquake (historical)
38
Based on our analysis, the project site has the potential for up to 5.1 inches of dry seismic settlement with up to 1.85 inches of liquefaction induced settlement. The soil profile across the site is relatively similar. So, we anticipate that the total settlement will be uniform. We recommend that the planned structure be designed in anticipation of dynamic differential settlement of 0.7 inches in 40 horizontal feet.


Liquefy.sum ******************************************************************************************************* LIQUEFACTION ANALYSIS SUMMARY Copyright by CivilTech Software www.civiltech.com ******************************************************************************************************* Font: Courier New, Regular, Size 8 is recommended for this report. Licensed to , 5/1/2019 11:45:06 AM
Input File Name: N:\2018\18‐81‐134 SBCUSD, New Diesel Technology Center\‐03\Settlement\BH‐01 his.liq Title: Gymnasium Expansion ‐ Pacific High School Subtitle: Dynamic Settlement
Surface Elev.=1132 Hole No.=BH‐01 Depth of Hole= 51.50 ft Water Table during Earthquake= 38.00 ft Water Table during In‐Situ Testing= 52.00 ft Max. Acceleration= 0.99 g Earthquake Magnitude= 7.00
Input Data: Surface Elev.=1132 Hole No.=BH‐01 Depth of Hole=51.50 ft Water Table during Earthquake= 38.00 ft Water Table during In‐Situ Testing= 52.00 ft Max. Acceleration=0.99 g Earthquake Magnitude=7.00 No‐Liquefiable Soils: CL, OL are Non‐Liq. Soil
1. SPT or BPT Calculation. 2. Settlement Analysis Method: Tokimatsu/Seed 3. Fines Correction for Liquefaction: Idriss/Seed 4. Fine Correction for Settlement: During Liquefaction* 5. Settlement Calculation in: All zones* 6. Hammer Energy Ratio, Ce = 1 7. Borehole Diameter, Cb= 1 8. Sampling Method, Cs= 1 9. User request factor of safety (apply to CSR) , User= 1.3 Plot two CSR (fs1=1, fs2=User) 10. Use Curve Smoothing: Yes* * Recommended Options
Page 1

Liquefy.sum
In‐Situ Test Data: Depth SPT gamma Fines ft pcf % ____________________________________ 0.00 50.00 130.00 45.00 5.00 50.00 130.00 45.00 6.00 13.00 118.00 45.00 7.50 8.00 113.00 45.00 10.00 8.00 132.00 51.00 15.00 14.00 122.00 45.00 20.00 13.00 122.00 45.00 25.00 45.00 130.00 45.00 30.00 36.00 109.00 8.00 35.00 49.00 109.00 8.00 40.00 38.00 109.00 8.00 45.00 32.00 110.00 8.00 50.00 50.00 110.00 8.00 ____________________________________
Output Results: Settlement of Saturated Sands=1.82 in. Settlement of Unsaturated Sands=5.05 in. Total Settlement of Saturated and Unsaturated Sands=6.87 in. Differential Settlement=3.434 to 4.532 in.
Depth CRRm CSRfs F.S. S_sat. S_dry S_all ft in. in. in. _______________________________________________________ 0.00 0.60 0.64 5.00 1.82 5.05 6.87 0.05 0.60 0.64 5.00 1.82 5.05 6.87 0.10 0.60 0.64 5.00 1.82 5.05 6.87 0.15 0.60 0.64 5.00 1.82 5.05 6.87 0.20 0.60 0.64 5.00 1.82 5.05 6.87 0.25 0.60 0.64 5.00 1.82 5.05 6.87 0.30 0.60 0.64 5.00 1.82 5.05 6.87 0.35 0.60 0.64 5.00 1.82 5.05 6.87 0.40 0.60 0.64 5.00 1.82 5.05 6.87 0.45 0.60 0.64 5.00 1.82 5.05 6.87 0.50 0.60 0.64 5.00 1.82 5.05 6.87 0.55 0.60 0.64 5.00 1.82 5.05 6.87 0.60 0.60 0.64 5.00 1.82 5.05 6.87 0.65 0.60 0.64 5.00 1.82 5.05 6.87 0.70 0.60 0.64 5.00 1.82 5.05 6.87 0.75 0.60 0.64 5.00 1.82 5.05 6.87 0.80 0.60 0.64 5.00 1.82 5.05 6.87 0.85 0.60 0.64 5.00 1.82 5.05 6.87 0.90 0.60 0.64 5.00 1.82 5.05 6.87
Page 2

Liquefy.sum 0.95 0.60 0.64 5.00 1.82 5.05 6.87 1.00 0.60 0.64 5.00 1.82 5.05 6.87 1.05 0.60 0.64 5.00 1.82 5.05 6.87 1.10 0.60 0.64 5.00 1.82 5.05 6.87 1.15 0.60 0.64 5.00 1.82 5.05 6.87 1.20 0.60 0.64 5.00 1.82 5.05 6.87 1.25 0.60 0.64 5.00 1.82 5.05 6.87 1.30 0.60 0.64 5.00 1.82 5.05 6.87 1.35 0.60 0.64 5.00 1.82 5.05 6.87 1.40 0.60 0.64 5.00 1.82 5.05 6.87 1.45 0.60 0.64 5.00 1.82 5.05 6.87 1.50 0.60 0.64 5.00 1.82 5.05 6.87 1.55 0.60 0.64 5.00 1.82 5.04 6.87 1.60 0.60 0.64 5.00 1.82 5.04 6.87 1.65 0.60 0.64 5.00 1.82 5.04 6.87 1.70 0.60 0.64 5.00 1.82 5.04 6.87 1.75 0.60 0.64 5.00 1.82 5.04 6.87 1.80 0.60 0.64 5.00 1.82 5.04 6.87 1.85 0.60 0.64 5.00 1.82 5.04 6.86 1.90 0.60 0.64 5.00 1.82 5.04 6.86 1.95 0.60 0.64 5.00 1.82 5.04 6.86 2.00 0.60 0.64 5.00 1.82 5.04 6.86 2.05 0.60 0.64 5.00 1.82 5.04 6.86 2.10 0.60 0.64 5.00 1.82 5.04 6.86 2.15 0.60 0.64 5.00 1.82 5.04 6.86 2.20 0.60 0.64 5.00 1.82 5.04 6.86 2.25 0.60 0.64 5.00 1.82 5.04 6.86 2.30 0.60 0.64 5.00 1.82 5.04 6.86 2.35 0.60 0.64 5.00 1.82 5.04 6.86 2.40 0.60 0.64 5.00 1.82 5.04 6.86 2.45 0.60 0.64 5.00 1.82 5.04 6.86 2.50 0.60 0.64 5.00 1.82 5.04 6.86 2.55 0.60 0.64 5.00 1.82 5.04 6.86 2.60 0.60 0.64 5.00 1.82 5.04 6.86 2.65 0.60 0.64 5.00 1.82 5.04 6.86 2.70 0.60 0.64 5.00 1.82 5.04 6.86 2.75 0.60 0.64 5.00 1.82 5.04 6.86 2.80 0.60 0.64 5.00 1.82 5.04 6.86 2.85 0.60 0.64 5.00 1.82 5.04 6.86 2.90 0.60 0.64 5.00 1.82 5.04 6.86 2.95 0.60 0.64 5.00 1.82 5.04 6.86 3.00 0.60 0.64 5.00 1.82 5.04 6.86 3.05 0.60 0.64 5.00 1.82 5.04 6.86 3.10 0.60 0.64 5.00 1.82 5.04 6.86 3.15 0.60 0.64 5.00 1.82 5.04 6.86 3.20 0.60 0.64 5.00 1.82 5.04 6.86 3.25 0.60 0.64 5.00 1.82 5.04 6.86 3.30 0.60 0.64 5.00 1.82 5.04 6.86
Page 3

Liquefy.sum 3.35 0.60 0.64 5.00 1.82 5.04 6.86 3.40 0.60 0.64 5.00 1.82 5.04 6.86 3.45 0.60 0.64 5.00 1.82 5.04 6.86 3.50 0.60 0.64 5.00 1.82 5.04 6.86 3.55 0.60 0.64 5.00 1.82 5.04 6.86 3.60 0.60 0.64 5.00 1.82 5.04 6.86 3.65 0.60 0.64 5.00 1.82 5.04 6.86 3.70 0.60 0.64 5.00 1.82 5.04 6.86 3.75 0.60 0.64 5.00 1.82 5.04 6.86 3.80 0.60 0.64 5.00 1.82 5.04 6.86 3.85 0.60 0.64 5.00 1.82 5.04 6.86 3.90 0.60 0.64 5.00 1.82 5.04 6.86 3.95 0.60 0.64 5.00 1.82 5.04 6.86 4.00 0.60 0.64 5.00 1.82 5.04 6.86 4.05 0.60 0.64 5.00 1.82 5.04 6.86 4.10 0.60 0.64 5.00 1.82 5.04 6.86 4.15 0.60 0.64 5.00 1.82 5.04 6.86 4.20 0.60 0.64 5.00 1.82 5.04 6.86 4.25 0.60 0.64 5.00 1.82 5.04 6.86 4.30 0.60 0.64 5.00 1.82 5.04 6.86 4.35 0.60 0.64 5.00 1.82 5.04 6.86 4.40 0.60 0.64 5.00 1.82 5.04 6.86 4.45 0.60 0.64 5.00 1.82 5.04 6.86 4.50 0.60 0.64 5.00 1.82 5.04 6.86 4.55 0.60 0.64 5.00 1.82 5.04 6.86 4.60 0.60 0.64 5.00 1.82 5.04 6.86 4.65 0.60 0.64 5.00 1.82 5.04 6.86 4.70 0.60 0.64 5.00 1.82 5.04 6.86 4.75 0.60 0.64 5.00 1.82 5.04 6.86 4.80 0.60 0.64 5.00 1.82 5.04 6.86 4.85 0.60 0.64 5.00 1.82 5.04 6.86 4.90 0.60 0.64 5.00 1.82 5.04 6.86 4.95 0.60 0.64 5.00 1.82 5.04 6.86 5.00 0.60 0.64 5.00 1.82 5.04 6.86 5.05 0.60 0.64 5.00 1.82 5.04 6.86 5.10 0.60 0.64 5.00 1.82 5.04 6.86 5.15 0.60 0.64 5.00 1.82 5.03 6.86 5.20 0.60 0.64 5.00 1.82 5.03 6.86 5.25 0.60 0.64 5.00 1.82 5.03 6.86 5.30 0.60 0.64 5.00 1.82 5.03 6.85 5.35 0.60 0.64 5.00 1.82 5.03 6.85 5.40 0.60 0.64 5.00 1.82 5.03 6.85 5.45 0.60 0.64 5.00 1.82 5.03 6.85 5.50 0.60 0.64 5.00 1.82 5.03 6.85 5.55 0.60 0.64 5.00 1.82 5.03 6.85 5.60 0.60 0.64 5.00 1.82 5.03 6.85 5.65 0.60 0.64 5.00 1.82 5.03 6.85 5.70 0.60 0.63 5.00 1.82 5.03 6.85
Page 4

Liquefy.sum 5.75 0.60 0.63 5.00 1.82 5.03 6.85 5.80 0.60 0.63 5.00 1.82 5.03 6.85 5.85 0.60 0.63 5.00 1.82 5.02 6.84 5.90 0.56 0.63 5.00 1.82 5.02 6.84 5.95 0.39 0.63 5.00 1.82 5.01 6.83 6.00 0.32 0.63 5.00 1.82 5.00 6.82 6.05 0.32 0.63 5.00 1.82 5.00 6.82 6.10 0.31 0.63 5.00 1.82 4.99 6.81 6.15 0.31 0.63 5.00 1.82 4.98 6.80 6.20 0.30 0.63 5.00 1.82 4.97 6.79 6.25 0.30 0.63 5.00 1.82 4.96 6.78 6.30 0.29 0.63 5.00 1.82 4.95 6.77 6.35 0.29 0.63 5.00 1.82 4.94 6.76 6.40 0.28 0.63 5.00 1.82 4.93 6.75 6.45 0.28 0.63 5.00 1.82 4.92 6.74 6.50 0.28 0.63 5.00 1.82 4.91 6.73 6.55 0.27 0.63 5.00 1.82 4.90 6.72 6.60 0.27 0.63 5.00 1.82 4.89 6.71 6.65 0.26 0.63 5.00 1.82 4.88 6.70 6.70 0.26 0.63 5.00 1.82 4.87 6.69 6.75 0.26 0.63 5.00 1.82 4.86 6.68 6.80 0.25 0.63 5.00 1.82 4.85 6.67 6.85 0.25 0.63 5.00 1.82 4.84 6.66 6.90 0.24 0.63 5.00 1.82 4.83 6.65 6.95 0.24 0.63 5.00 1.82 4.81 6.63 7.00 0.24 0.63 5.00 1.82 4.80 6.62 7.05 0.23 0.63 5.00 1.82 4.79 6.61 7.10 0.23 0.63 5.00 1.82 4.78 6.60 7.15 0.23 0.63 5.00 1.82 4.76 6.58 7.20 0.22 0.63 5.00 1.82 4.75 6.57 7.25 0.22 0.63 5.00 1.82 4.74 6.56 7.30 0.22 0.63 5.00 1.82 4.72 6.55 7.35 0.21 0.63 5.00 1.82 4.71 6.53 7.40 0.21 0.63 5.00 1.82 4.70 6.52 7.45 0.21 0.63 5.00 1.82 4.68 6.50 7.50 0.20 0.63 5.00 1.82 4.67 6.49 7.55 0.20 0.63 5.00 1.82 4.65 6.47 7.60 0.20 0.63 5.00 1.82 4.64 6.46 7.65 0.20 0.63 5.00 1.82 4.62 6.44 7.70 0.20 0.63 5.00 1.82 4.61 6.43 7.75 0.20 0.63 5.00 1.82 4.59 6.41 7.80 0.20 0.63 5.00 1.82 4.58 6.40 7.85 0.20 0.63 5.00 1.82 4.56 6.38 7.90 0.20 0.63 5.00 1.82 4.55 6.37 7.95 0.20 0.63 5.00 1.82 4.53 6.35 8.00 0.20 0.63 5.00 1.82 4.52 6.34 8.05 0.20 0.63 5.00 1.82 4.50 6.32 8.10 0.20 0.63 5.00 1.82 4.49 6.31
Page 5

Liquefy.sum 8.15 0.20 0.63 5.00 1.82 4.47 6.29 8.20 0.20 0.63 5.00 1.82 4.45 6.28 8.25 0.21 0.63 5.00 1.82 4.44 6.26 8.30 0.21 0.63 5.00 1.82 4.43 6.25 8.35 0.21 0.63 5.00 1.82 4.41 6.23 8.40 0.21 0.63 5.00 1.82 4.40 6.22 8.45 0.21 0.63 5.00 1.82 4.38 6.20 8.50 0.21 0.63 5.00 1.82 4.37 6.19 8.55 0.21 0.63 5.00 1.82 4.36 6.18 8.60 0.21 0.63 5.00 1.82 4.34 6.16 8.65 0.21 0.63 5.00 1.82 4.33 6.15 8.70 0.21 0.63 5.00 1.82 4.31 6.13 8.75 0.21 0.63 5.00 1.82 4.30 6.12 8.80 0.21 0.63 5.00 1.82 4.28 6.11 8.85 0.21 0.63 5.00 1.82 4.27 6.09 8.90 0.21 0.63 5.00 1.82 4.26 6.08 8.95 0.21 0.63 5.00 1.82 4.24 6.06 9.00 0.21 0.63 5.00 1.82 4.23 6.05 9.05 0.21 0.63 5.00 1.82 4.21 6.03 9.10 0.21 0.63 5.00 1.82 4.20 6.02 9.15 0.21 0.63 5.00 1.82 4.18 6.00 9.20 0.21 0.63 5.00 1.82 4.17 5.99 9.25 0.21 0.63 5.00 1.82 4.15 5.98 9.30 0.21 0.63 5.00 1.82 4.14 5.96 9.35 0.21 0.63 5.00 1.82 4.13 5.95 9.40 0.21 0.63 5.00 1.82 4.11 5.93 9.45 0.21 0.63 5.00 1.82 4.10 5.92 9.50 0.20 0.63 5.00 1.82 4.08 5.90 9.55 0.20 0.63 5.00 1.82 4.07 5.89 9.60 0.20 0.63 5.00 1.82 4.05 5.87 9.65 0.20 0.63 5.00 1.82 4.04 5.86 9.70 0.20 0.63 5.00 1.82 4.02 5.84 9.75 0.20 0.63 5.00 1.82 4.01 5.83 9.80 0.20 0.63 5.00 1.82 3.99 5.81 9.85 0.20 0.63 5.00 1.82 3.98 5.80 9.90 0.20 0.63 5.00 1.82 3.96 5.78 9.95 0.20 0.63 5.00 1.82 3.95 5.77 10.00 0.20 0.63 5.00 1.82 3.93 5.75 10.05 0.20 0.63 5.00 1.82 3.92 5.74 10.10 0.20 0.63 5.00 1.82 3.90 5.72 10.15 0.20 0.63 5.00 1.82 3.89 5.71 10.20 0.20 0.63 5.00 1.82 3.87 5.69 10.25 0.20 0.63 5.00 1.82 3.86 5.68 10.30 0.21 0.63 5.00 1.82 3.84 5.66 10.35 0.21 0.63 5.00 1.82 3.83 5.65 10.40 0.21 0.63 5.00 1.82 3.81 5.63 10.45 0.21 0.63 5.00 1.82 3.80 5.62 10.50 0.21 0.63 5.00 1.82 3.78 5.60
Page 6
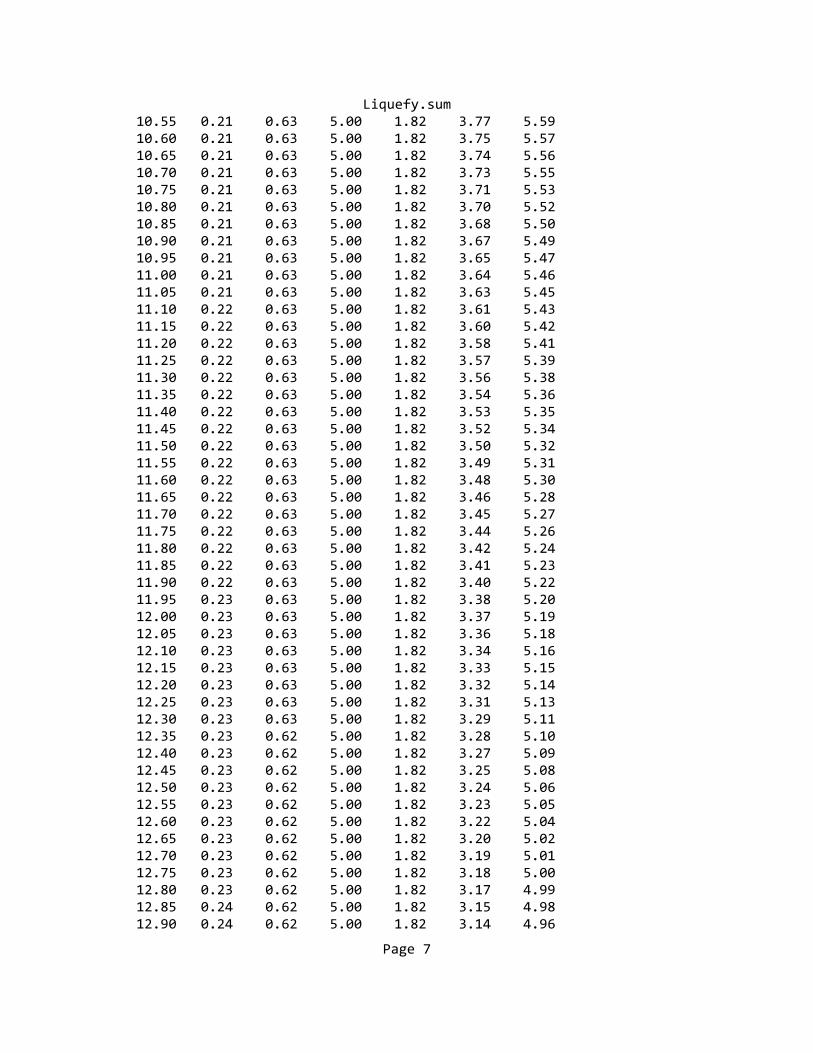
Liquefy.sum 10.55 0.21 0.63 5.00 1.82 3.77 5.59 10.60 0.21 0.63 5.00 1.82 3.75 5.57 10.65 0.21 0.63 5.00 1.82 3.74 5.56 10.70 0.21 0.63 5.00 1.82 3.73 5.55 10.75 0.21 0.63 5.00 1.82 3.71 5.53 10.80 0.21 0.63 5.00 1.82 3.70 5.52 10.85 0.21 0.63 5.00 1.82 3.68 5.50 10.90 0.21 0.63 5.00 1.82 3.67 5.49 10.95 0.21 0.63 5.00 1.82 3.65 5.47 11.00 0.21 0.63 5.00 1.82 3.64 5.46 11.05 0.21 0.63 5.00 1.82 3.63 5.45 11.10 0.22 0.63 5.00 1.82 3.61 5.43 11.15 0.22 0.63 5.00 1.82 3.60 5.42 11.20 0.22 0.63 5.00 1.82 3.58 5.41 11.25 0.22 0.63 5.00 1.82 3.57 5.39 11.30 0.22 0.63 5.00 1.82 3.56 5.38 11.35 0.22 0.63 5.00 1.82 3.54 5.36 11.40 0.22 0.63 5.00 1.82 3.53 5.35 11.45 0.22 0.63 5.00 1.82 3.52 5.34 11.50 0.22 0.63 5.00 1.82 3.50 5.32 11.55 0.22 0.63 5.00 1.82 3.49 5.31 11.60 0.22 0.63 5.00 1.82 3.48 5.30 11.65 0.22 0.63 5.00 1.82 3.46 5.28 11.70 0.22 0.63 5.00 1.82 3.45 5.27 11.75 0.22 0.63 5.00 1.82 3.44 5.26 11.80 0.22 0.63 5.00 1.82 3.42 5.24 11.85 0.22 0.63 5.00 1.82 3.41 5.23 11.90 0.22 0.63 5.00 1.82 3.40 5.22 11.95 0.23 0.63 5.00 1.82 3.38 5.20 12.00 0.23 0.63 5.00 1.82 3.37 5.19 12.05 0.23 0.63 5.00 1.82 3.36 5.18 12.10 0.23 0.63 5.00 1.82 3.34 5.16 12.15 0.23 0.63 5.00 1.82 3.33 5.15 12.20 0.23 0.63 5.00 1.82 3.32 5.14 12.25 0.23 0.63 5.00 1.82 3.31 5.13 12.30 0.23 0.63 5.00 1.82 3.29 5.11 12.35 0.23 0.62 5.00 1.82 3.28 5.10 12.40 0.23 0.62 5.00 1.82 3.27 5.09 12.45 0.23 0.62 5.00 1.82 3.25 5.08 12.50 0.23 0.62 5.00 1.82 3.24 5.06 12.55 0.23 0.62 5.00 1.82 3.23 5.05 12.60 0.23 0.62 5.00 1.82 3.22 5.04 12.65 0.23 0.62 5.00 1.82 3.20 5.02 12.70 0.23 0.62 5.00 1.82 3.19 5.01 12.75 0.23 0.62 5.00 1.82 3.18 5.00 12.80 0.23 0.62 5.00 1.82 3.17 4.99 12.85 0.24 0.62 5.00 1.82 3.15 4.98 12.90 0.24 0.62 5.00 1.82 3.14 4.96
Page 7

Liquefy.sum 12.95 0.24 0.62 5.00 1.82 3.13 4.95 13.00 0.24 0.62 5.00 1.82 3.12 4.94 13.05 0.24 0.62 5.00 1.82 3.11 4.93 13.10 0.24 0.62 5.00 1.82 3.09 4.91 13.15 0.24 0.62 5.00 1.82 3.08 4.90 13.20 0.24 0.62 5.00 1.82 3.07 4.89 13.25 0.24 0.62 5.00 1.82 3.06 4.88 13.30 0.24 0.62 5.00 1.82 3.05 4.87 13.35 0.24 0.62 5.00 1.82 3.03 4.85 13.40 0.24 0.62 5.00 1.82 3.02 4.84 13.45 0.24 0.62 5.00 1.82 3.01 4.83 13.50 0.24 0.62 5.00 1.82 3.00 4.82 13.55 0.24 0.62 5.00 1.82 2.99 4.81 13.60 0.24 0.62 5.00 1.82 2.97 4.79 13.65 0.24 0.62 5.00 1.82 2.96 4.78 13.70 0.25 0.62 5.00 1.82 2.95 4.77 13.75 0.25 0.62 5.00 1.82 2.94 4.76 13.80 0.25 0.62 5.00 1.82 2.93 4.75 13.85 0.25 0.62 5.00 1.82 2.92 4.74 13.90 0.25 0.62 5.00 1.82 2.90 4.72 13.95 0.25 0.62 5.00 1.82 2.89 4.71 14.00 0.25 0.62 5.00 1.82 2.88 4.70 14.05 0.25 0.62 5.00 1.82 2.87 4.69 14.10 0.25 0.62 5.00 1.82 2.86 4.68 14.15 0.25 0.62 5.00 1.82 2.85 4.67 14.20 0.25 0.62 5.00 1.82 2.83 4.66 14.25 0.25 0.62 5.00 1.82 2.82 4.64 14.30 0.25 0.62 5.00 1.82 2.81 4.63 14.35 0.25 0.62 5.00 1.82 2.80 4.62 14.40 0.25 0.62 5.00 1.82 2.79 4.61 14.45 0.25 0.62 5.00 1.82 2.78 4.60 14.50 0.25 0.62 5.00 1.82 2.77 4.59 14.55 0.25 0.62 5.00 1.82 2.76 4.58 14.60 0.26 0.62 5.00 1.82 2.74 4.57 14.65 0.26 0.62 5.00 1.82 2.73 4.55 14.70 0.26 0.62 5.00 1.82 2.72 4.54 14.75 0.26 0.62 5.00 1.82 2.71 4.53 14.80 0.28 0.62 5.00 1.82 2.70 4.52 14.85 0.28 0.62 5.00 1.82 2.69 4.51 14.90 0.28 0.62 5.00 1.82 2.68 4.50 14.95 0.28 0.62 5.00 1.82 2.67 4.49 15.00 0.28 0.62 5.00 1.82 2.66 4.48 15.05 0.28 0.62 5.00 1.82 2.65 4.47 15.10 0.28 0.62 5.00 1.82 2.64 4.46 15.15 0.28 0.62 5.00 1.82 2.63 4.45 15.20 0.28 0.62 5.00 1.82 2.62 4.44 15.25 0.28 0.62 5.00 1.82 2.61 4.43 15.30 0.28 0.62 5.00 1.82 2.60 4.42
Page 8

Liquefy.sum 15.35 0.28 0.62 5.00 1.82 2.59 4.41 15.40 0.28 0.62 5.00 1.82 2.58 4.40 15.45 0.28 0.62 5.00 1.82 2.57 4.39 15.50 0.28 0.62 5.00 1.82 2.56 4.38 15.55 0.28 0.62 5.00 1.82 2.55 4.37 15.60 0.28 0.62 5.00 1.82 2.54 4.36 15.65 0.28 0.62 5.00 1.82 2.53 4.35 15.70 0.28 0.62 5.00 1.82 2.52 4.34 15.75 0.28 0.62 5.00 1.82 2.51 4.33 15.80 0.28 0.62 5.00 1.82 2.50 4.32 15.85 0.28 0.62 5.00 1.82 2.49 4.31 15.90 0.27 0.62 5.00 1.82 2.48 4.30 15.95 0.27 0.62 5.00 1.82 2.47 4.29 16.00 0.27 0.62 5.00 1.82 2.46 4.28 16.05 0.27 0.62 5.00 1.82 2.45 4.27 16.10 0.27 0.62 5.00 1.82 2.44 4.26 16.15 0.27 0.62 5.00 1.82 2.43 4.25 16.20 0.27 0.62 5.00 1.82 2.42 4.24 16.25 0.27 0.62 5.00 1.82 2.41 4.23 16.30 0.27 0.62 5.00 1.82 2.40 4.22 16.35 0.27 0.62 5.00 1.82 2.39 4.21 16.40 0.27 0.62 5.00 1.82 2.38 4.20 16.45 0.27 0.62 5.00 1.82 2.37 4.19 16.50 0.27 0.62 5.00 1.82 2.36 4.18 16.55 0.27 0.62 5.00 1.82 2.35 4.17 16.60 0.27 0.62 5.00 1.82 2.34 4.16 16.65 0.27 0.62 5.00 1.82 2.33 4.15 16.70 0.27 0.62 5.00 1.82 2.32 4.14 16.75 0.27 0.62 5.00 1.82 2.31 4.13 16.80 0.27 0.62 5.00 1.82 2.30 4.12 16.85 0.27 0.62 5.00 1.82 2.29 4.11 16.90 0.26 0.62 5.00 1.82 2.27 4.10 16.95 0.26 0.62 5.00 1.82 2.26 4.08 17.00 0.26 0.62 5.00 1.82 2.25 4.07 17.05 0.26 0.62 5.00 1.82 2.24 4.06 17.10 0.26 0.62 5.00 1.82 2.23 4.05 17.15 0.26 0.62 5.00 1.82 2.22 4.04 17.20 0.26 0.62 5.00 1.82 2.21 4.03 17.25 0.26 0.62 5.00 1.82 2.20 4.02 17.30 0.26 0.62 5.00 1.82 2.19 4.01 17.35 0.26 0.62 5.00 1.82 2.18 4.00 17.40 0.26 0.62 5.00 1.82 2.17 3.99 17.45 0.26 0.62 5.00 1.82 2.16 3.98 17.50 0.26 0.62 5.00 1.82 2.15 3.97 17.55 0.26 0.62 5.00 1.82 2.13 3.96 17.60 0.26 0.62 5.00 1.82 2.12 3.94 17.65 0.26 0.62 5.00 1.82 2.11 3.93 17.70 0.26 0.62 5.00 1.82 2.10 3.92
Page 9

Liquefy.sum 17.75 0.26 0.62 5.00 1.82 2.09 3.91 17.80 0.26 0.62 5.00 1.82 2.08 3.90 17.85 0.26 0.62 5.00 1.82 2.07 3.89 17.90 0.26 0.62 5.00 1.82 2.06 3.88 17.95 0.26 0.62 5.00 1.82 2.05 3.87 18.00 0.26 0.62 5.00 1.82 2.04 3.86 18.05 0.25 0.62 5.00 1.82 2.02 3.85 18.10 0.25 0.62 5.00 1.82 2.01 3.83 18.15 0.25 0.62 5.00 1.82 2.00 3.82 18.20 0.25 0.62 5.00 1.82 1.99 3.81 18.25 0.25 0.62 5.00 1.82 1.98 3.80 18.30 0.25 0.62 5.00 1.82 1.97 3.79 18.35 0.25 0.62 5.00 1.82 1.96 3.78 18.40 0.25 0.62 5.00 1.82 1.95 3.77 18.45 0.25 0.62 5.00 1.82 1.93 3.76 18.50 0.25 0.62 5.00 1.82 1.92 3.74 18.55 0.25 0.62 5.00 1.82 1.91 3.73 18.60 0.25 0.62 5.00 1.82 1.90 3.72 18.65 0.25 0.62 5.00 1.82 1.89 3.71 18.70 0.25 0.62 5.00 1.82 1.88 3.70 18.75 0.25 0.62 5.00 1.82 1.87 3.69 18.80 0.25 0.62 5.00 1.82 1.85 3.68 18.85 0.25 0.62 5.00 1.82 1.84 3.66 18.90 0.25 0.62 5.00 1.82 1.83 3.65 18.95 0.25 0.62 5.00 1.82 1.82 3.64 19.00 0.25 0.61 5.00 1.82 1.81 3.63 19.05 0.25 0.61 5.00 1.82 1.80 3.62 19.10 0.25 0.61 5.00 1.82 1.79 3.61 19.15 0.25 0.61 5.00 1.82 1.77 3.59 19.20 0.25 0.61 5.00 1.82 1.76 3.58 19.25 0.25 0.61 5.00 1.82 1.75 3.57 19.30 0.24 0.61 5.00 1.82 1.74 3.56 19.35 0.24 0.61 5.00 1.82 1.73 3.55 19.40 0.24 0.61 5.00 1.82 1.72 3.54 19.45 0.24 0.61 5.00 1.82 1.70 3.52 19.50 0.24 0.61 5.00 1.82 1.69 3.51 19.55 0.24 0.61 5.00 1.82 1.68 3.50 19.60 0.24 0.61 5.00 1.82 1.67 3.49 19.65 0.24 0.61 5.00 1.82 1.66 3.48 19.70 0.24 0.61 5.00 1.82 1.65 3.47 19.75 0.24 0.61 5.00 1.82 1.64 3.46 19.80 0.24 0.61 5.00 1.82 1.62 3.44 19.85 0.24 0.61 5.00 1.82 1.61 3.43 19.90 0.24 0.61 5.00 1.82 1.60 3.42 19.95 0.24 0.61 5.00 1.82 1.59 3.41 20.00 0.24 0.61 5.00 1.82 1.58 3.40 20.05 0.24 0.61 5.00 1.82 1.56 3.39 20.10 0.25 0.61 5.00 1.82 1.55 3.37
Page 10

Liquefy.sum 20.15 0.25 0.61 5.00 1.82 1.54 3.36 20.20 0.26 0.61 5.00 1.82 1.53 3.35 20.25 0.26 0.61 5.00 1.82 1.52 3.34 20.30 0.27 0.61 5.00 1.82 1.51 3.33 20.35 0.27 0.61 5.00 1.82 1.50 3.32 20.40 0.27 0.61 5.00 1.82 1.49 3.31 20.45 0.28 0.61 5.00 1.82 1.49 3.31 20.50 0.28 0.61 5.00 1.82 1.48 3.30 20.55 0.29 0.61 5.00 1.82 1.47 3.29 20.60 0.29 0.61 5.00 1.82 1.46 3.28 20.65 0.30 0.61 5.00 1.82 1.45 3.28 20.70 0.30 0.61 5.00 1.82 1.45 3.27 20.75 0.31 0.61 5.00 1.82 1.44 3.26 20.80 0.31 0.61 5.00 1.82 1.43 3.26 20.85 0.32 0.61 5.00 1.82 1.43 3.25 20.90 0.32 0.61 5.00 1.82 1.42 3.24 20.95 0.33 0.61 5.00 1.82 1.42 3.24 21.00 0.33 0.61 5.00 1.82 1.41 3.23 21.05 0.34 0.61 5.00 1.82 1.41 3.23 21.10 0.35 0.61 5.00 1.82 1.40 3.22 21.15 0.35 0.61 5.00 1.82 1.39 3.22 21.20 0.36 0.61 5.00 1.82 1.39 3.21 21.25 0.37 0.61 5.00 1.82 1.39 3.21 21.30 0.37 0.61 5.00 1.82 1.38 3.20 21.35 0.38 0.61 5.00 1.82 1.38 3.20 21.40 0.39 0.61 5.00 1.82 1.37 3.19 21.45 0.40 0.61 5.00 1.82 1.37 3.19 21.50 0.41 0.61 5.00 1.82 1.36 3.18 21.55 0.41 0.61 5.00 1.82 1.36 3.18 21.60 0.43 0.61 5.00 1.82 1.36 3.18 21.65 0.44 0.61 5.00 1.82 1.35 3.17 21.70 0.45 0.61 5.00 1.82 1.35 3.17 21.75 0.47 0.61 5.00 1.82 1.34 3.16 21.80 0.49 0.61 5.00 1.82 1.34 3.16 21.85 0.53 0.61 5.00 1.82 1.34 3.16 21.90 0.60 0.61 5.00 1.82 1.33 3.15 21.95 0.60 0.61 5.00 1.82 1.33 3.15 22.00 0.60 0.61 5.00 1.82 1.33 3.15 22.05 0.60 0.61 5.00 1.82 1.32 3.14 22.10 0.60 0.61 5.00 1.82 1.32 3.14 22.15 0.60 0.61 5.00 1.82 1.32 3.14 22.20 0.60 0.61 5.00 1.82 1.32 3.14 22.25 0.60 0.61 5.00 1.82 1.31 3.13 22.30 0.60 0.61 5.00 1.82 1.31 3.13 22.35 0.60 0.61 5.00 1.82 1.31 3.13 22.40 0.60 0.61 5.00 1.82 1.30 3.12 22.45 0.60 0.61 5.00 1.82 1.30 3.12 22.50 0.60 0.61 5.00 1.82 1.30 3.12
Page 11

Liquefy.sum 22.55 0.60 0.61 5.00 1.82 1.30 3.12 22.60 0.60 0.61 5.00 1.82 1.29 3.11 22.65 0.60 0.61 5.00 1.82 1.29 3.11 22.70 0.60 0.61 5.00 1.82 1.29 3.11 22.75 0.60 0.61 5.00 1.82 1.29 3.11 22.80 0.60 0.61 5.00 1.82 1.29 3.11 22.85 0.60 0.61 5.00 1.82 1.28 3.10 22.90 0.60 0.61 5.00 1.82 1.28 3.10 22.95 0.60 0.61 5.00 1.82 1.28 3.10 23.00 0.60 0.61 5.00 1.82 1.28 3.10 23.05 0.60 0.61 5.00 1.82 1.28 3.10 23.10 0.60 0.61 5.00 1.82 1.27 3.09 23.15 0.60 0.61 5.00 1.82 1.27 3.09 23.20 0.60 0.61 5.00 1.82 1.27 3.09 23.25 0.60 0.61 5.00 1.82 1.27 3.09 23.30 0.60 0.61 5.00 1.82 1.27 3.09 23.35 0.60 0.61 5.00 1.82 1.26 3.09 23.40 0.60 0.61 5.00 1.82 1.26 3.08 23.45 0.60 0.61 5.00 1.82 1.26 3.08 23.50 0.60 0.61 5.00 1.82 1.26 3.08 23.55 0.60 0.61 5.00 1.82 1.26 3.08 23.60 0.60 0.61 5.00 1.82 1.26 3.08 23.65 0.60 0.61 5.00 1.82 1.26 3.08 23.70 0.60 0.61 5.00 1.82 1.25 3.07 23.75 0.60 0.61 5.00 1.82 1.25 3.07 23.80 0.60 0.61 5.00 1.82 1.25 3.07 23.85 0.60 0.61 5.00 1.82 1.25 3.07 23.90 0.60 0.61 5.00 1.82 1.25 3.07 23.95 0.60 0.61 5.00 1.82 1.25 3.07 24.00 0.60 0.61 5.00 1.82 1.25 3.07 24.05 0.60 0.61 5.00 1.82 1.24 3.07 24.10 0.60 0.61 5.00 1.82 1.24 3.06 24.15 0.60 0.61 5.00 1.82 1.24 3.06 24.20 0.60 0.61 5.00 1.82 1.24 3.06 24.25 0.60 0.61 5.00 1.82 1.24 3.06 24.30 0.60 0.61 5.00 1.82 1.24 3.06 24.35 0.60 0.61 5.00 1.82 1.24 3.06 24.40 0.60 0.61 5.00 1.82 1.24 3.06 24.45 0.60 0.61 5.00 1.82 1.23 3.05 24.50 0.60 0.61 5.00 1.82 1.23 3.05 24.55 0.60 0.61 5.00 1.82 1.23 3.05 24.60 0.60 0.61 5.00 1.82 1.23 3.05 24.65 0.60 0.61 5.00 1.82 1.23 3.05 24.70 0.60 0.61 5.00 1.82 1.23 3.05 24.75 0.60 0.61 5.00 1.82 1.23 3.05 24.80 0.60 0.61 5.00 1.82 1.23 3.05 24.85 0.60 0.61 5.00 1.82 1.22 3.04 24.90 0.60 0.61 5.00 1.82 1.22 3.04
Page 12

Liquefy.sum 24.95 0.60 0.61 5.00 1.82 1.22 3.04 25.00 0.60 0.61 5.00 1.82 1.22 3.04 25.05 0.60 0.61 5.00 1.82 1.22 3.04 25.10 0.60 0.61 5.00 1.82 1.22 3.04 25.15 0.60 0.61 5.00 1.82 1.22 3.04 25.20 0.60 0.61 5.00 1.82 1.22 3.04 25.25 0.60 0.61 5.00 1.82 1.21 3.03 25.30 0.60 0.61 5.00 1.82 1.21 3.03 25.35 0.60 0.61 5.00 1.82 1.21 3.03 25.40 0.60 0.61 5.00 1.82 1.21 3.03 25.45 0.60 0.61 5.00 1.82 1.21 3.03 25.50 0.60 0.61 5.00 1.82 1.21 3.03 25.55 0.60 0.61 5.00 1.82 1.21 3.03 25.60 0.60 0.61 5.00 1.82 1.20 3.03 25.65 0.60 0.61 5.00 1.82 1.20 3.02 25.70 0.60 0.60 5.00 1.82 1.20 3.02 25.75 0.60 0.60 5.00 1.82 1.20 3.02 25.80 0.60 0.60 5.00 1.82 1.20 3.02 25.85 0.60 0.60 5.00 1.82 1.20 3.02 25.90 0.60 0.60 5.00 1.82 1.20 3.02 25.95 0.60 0.60 5.00 1.82 1.19 3.02 26.00 0.60 0.60 5.00 1.82 1.19 3.01 26.05 0.60 0.60 5.00 1.82 1.19 3.01 26.10 0.60 0.60 5.00 1.82 1.19 3.01 26.15 0.60 0.60 5.00 1.82 1.19 3.01 26.20 0.60 0.60 5.00 1.82 1.19 3.01 26.25 0.60 0.60 5.00 1.82 1.19 3.01 26.30 0.60 0.60 5.00 1.82 1.18 3.01 26.35 0.60 0.60 5.00 1.82 1.18 3.00 26.40 0.60 0.60 5.00 1.82 1.18 3.00 26.45 0.60 0.60 5.00 1.82 1.18 3.00 26.50 0.60 0.60 5.00 1.82 1.18 3.00 26.55 0.60 0.60 5.00 1.82 1.18 3.00 26.60 0.60 0.60 5.00 1.82 1.18 3.00 26.65 0.60 0.60 5.00 1.82 1.17 2.99 26.70 0.60 0.60 5.00 1.82 1.17 2.99 26.75 0.60 0.60 5.00 1.82 1.17 2.99 26.80 0.60 0.60 5.00 1.82 1.17 2.99 26.85 0.60 0.60 5.00 1.82 1.17 2.99 26.90 0.60 0.60 5.00 1.82 1.17 2.99 26.95 0.60 0.60 5.00 1.82 1.16 2.98 27.00 0.60 0.60 5.00 1.82 1.16 2.98 27.05 0.60 0.60 5.00 1.82 1.16 2.98 27.10 0.60 0.60 5.00 1.82 1.16 2.98 27.15 0.60 0.60 5.00 1.82 1.16 2.98 27.20 0.60 0.60 5.00 1.82 1.15 2.97 27.25 0.60 0.60 5.00 1.82 1.15 2.97 27.30 0.60 0.60 5.00 1.82 1.15 2.97
Page 13

Liquefy.sum 27.35 0.60 0.60 5.00 1.82 1.15 2.97 27.40 0.60 0.60 5.00 1.82 1.15 2.97 27.45 0.59 0.60 5.00 1.82 1.14 2.96 27.50 0.59 0.60 5.00 1.82 1.14 2.96 27.55 0.59 0.60 5.00 1.82 1.14 2.96 27.60 0.59 0.60 5.00 1.82 1.14 2.96 27.65 0.59 0.60 5.00 1.82 1.13 2.96 27.70 0.59 0.60 5.00 1.82 1.13 2.95 27.75 0.59 0.60 5.00 1.82 1.13 2.95 27.80 0.59 0.60 5.00 1.82 1.13 2.95 27.85 0.59 0.60 5.00 1.82 1.12 2.95 27.90 0.59 0.60 5.00 1.82 1.12 2.94 27.95 0.59 0.60 5.00 1.82 1.12 2.94 28.00 0.59 0.60 5.00 1.82 1.12 2.94 28.05 0.59 0.60 5.00 1.82 1.11 2.93 28.10 0.59 0.60 5.00 1.82 1.11 2.93 28.15 0.59 0.60 5.00 1.82 1.11 2.93 28.20 0.59 0.60 5.00 1.82 1.11 2.93 28.25 0.59 0.60 5.00 1.82 1.10 2.92 28.30 0.59 0.60 5.00 1.82 1.10 2.92 28.35 0.59 0.60 5.00 1.82 1.10 2.92 28.40 0.59 0.60 5.00 1.82 1.09 2.92 28.45 0.59 0.60 5.00 1.82 1.09 2.91 28.50 0.59 0.60 5.00 1.82 1.09 2.91 28.55 0.59 0.60 5.00 1.82 1.08 2.91 28.60 0.59 0.60 5.00 1.82 1.08 2.90 28.65 0.59 0.60 5.00 1.82 1.08 2.90 28.70 0.59 0.60 5.00 1.82 1.07 2.89 28.75 0.59 0.60 5.00 1.82 1.07 2.89 28.80 0.59 0.60 5.00 1.82 1.07 2.89 28.85 0.59 0.60 5.00 1.82 1.06 2.88 28.90 0.59 0.60 5.00 1.82 1.06 2.88 28.95 0.59 0.60 5.00 1.82 1.05 2.87 29.00 0.59 0.60 5.00 1.82 1.05 2.87 29.05 0.59 0.60 5.00 1.82 1.04 2.86 29.10 0.59 0.60 5.00 1.82 1.04 2.86 29.15 0.59 0.60 5.00 1.82 1.03 2.85 29.20 0.59 0.60 5.00 1.82 1.03 2.85 29.25 0.59 0.60 5.00 1.82 1.02 2.84 29.30 0.59 0.60 5.00 1.82 1.02 2.84 29.35 0.59 0.60 5.00 1.82 1.01 2.83 29.40 0.59 0.60 5.00 1.82 1.01 2.83 29.45 0.59 0.60 5.00 1.82 1.00 2.82 29.50 0.59 0.60 5.00 1.82 0.99 2.81 29.55 0.55 0.60 5.00 1.82 0.99 2.81 29.60 0.50 0.60 5.00 1.82 0.98 2.80 29.65 0.47 0.60 5.00 1.82 0.98 2.80 29.70 0.45 0.60 5.00 1.82 0.97 2.79
Page 14

Liquefy.sum 29.75 0.44 0.60 5.00 1.82 0.96 2.78 29.80 0.43 0.60 5.00 1.82 0.96 2.78 29.85 0.42 0.60 5.00 1.82 0.95 2.77 29.90 0.41 0.60 5.00 1.82 0.94 2.76 29.95 0.40 0.60 5.00 1.82 0.93 2.76 30.00 0.40 0.60 5.00 1.82 0.93 2.75 30.05 0.40 0.60 5.00 1.82 0.92 2.74 30.10 0.40 0.60 5.00 1.82 0.91 2.73 30.15 0.40 0.60 5.00 1.82 0.91 2.73 30.20 0.40 0.60 5.00 1.82 0.90 2.72 30.25 0.41 0.60 5.00 1.82 0.89 2.71 30.30 0.41 0.60 5.00 1.82 0.89 2.71 30.35 0.41 0.60 5.00 1.82 0.88 2.70 30.40 0.41 0.60 5.00 1.82 0.87 2.69 30.45 0.42 0.60 5.00 1.82 0.86 2.69 30.50 0.42 0.60 5.00 1.82 0.86 2.68 30.55 0.42 0.60 5.00 1.82 0.85 2.67 30.60 0.43 0.60 5.00 1.82 0.84 2.67 30.65 0.43 0.59 5.00 1.82 0.84 2.66 30.70 0.43 0.59 5.00 1.82 0.83 2.65 30.75 0.44 0.59 5.00 1.82 0.82 2.64 30.80 0.44 0.59 5.00 1.82 0.82 2.64 30.85 0.44 0.59 5.00 1.82 0.81 2.63 30.90 0.45 0.59 5.00 1.82 0.80 2.62 30.95 0.45 0.59 5.00 1.82 0.80 2.62 31.00 0.46 0.59 5.00 1.82 0.79 2.61 31.05 0.46 0.59 5.00 1.82 0.78 2.61 31.10 0.47 0.59 5.00 1.82 0.78 2.60 31.15 0.47 0.59 5.00 1.82 0.77 2.59 31.20 0.48 0.59 5.00 1.82 0.77 2.59 31.25 0.49 0.59 5.00 1.82 0.76 2.58 31.30 0.50 0.59 5.00 1.82 0.75 2.57 31.35 0.51 0.59 5.00 1.82 0.75 2.57 31.40 0.52 0.59 5.00 1.82 0.74 2.56 31.45 0.54 0.59 5.00 1.82 0.73 2.55 31.50 0.57 0.59 5.00 1.82 0.73 2.55 31.55 0.58 0.59 5.00 1.82 0.72 2.54 31.60 0.58 0.59 5.00 1.82 0.71 2.53 31.65 0.58 0.59 5.00 1.82 0.71 2.53 31.70 0.58 0.59 5.00 1.82 0.70 2.52 31.75 0.58 0.59 5.00 1.82 0.70 2.52 31.80 0.58 0.59 5.00 1.82 0.69 2.51 31.85 0.58 0.59 5.00 1.82 0.68 2.50 31.90 0.58 0.59 5.00 1.82 0.68 2.50 31.95 0.58 0.59 5.00 1.82 0.67 2.49 32.00 0.58 0.59 5.00 1.82 0.66 2.49 32.05 0.58 0.59 5.00 1.82 0.66 2.48 32.10 0.58 0.59 5.00 1.82 0.65 2.47
Page 15

Liquefy.sum 32.15 0.58 0.59 5.00 1.82 0.65 2.47 32.20 0.58 0.59 5.00 1.82 0.64 2.46 32.25 0.58 0.59 5.00 1.82 0.63 2.46 32.30 0.58 0.59 5.00 1.82 0.63 2.45 32.35 0.58 0.59 5.00 1.82 0.62 2.44 32.40 0.58 0.59 5.00 1.82 0.62 2.44 32.45 0.58 0.59 5.00 1.82 0.61 2.43 32.50 0.58 0.59 5.00 1.82 0.60 2.43 32.55 0.58 0.59 5.00 1.82 0.60 2.42 32.60 0.58 0.58 5.00 1.82 0.59 2.41 32.65 0.58 0.58 5.00 1.82 0.59 2.41 32.70 0.58 0.58 5.00 1.82 0.58 2.40 32.75 0.58 0.58 5.00 1.82 0.58 2.40 32.80 0.58 0.58 5.00 1.82 0.57 2.39 32.85 0.58 0.58 5.00 1.82 0.56 2.39 32.90 0.58 0.58 5.00 1.82 0.56 2.38 32.95 0.58 0.58 5.00 1.82 0.55 2.37 33.00 0.58 0.58 5.00 1.82 0.55 2.37 33.05 0.58 0.58 5.00 1.82 0.54 2.36 33.10 0.58 0.58 5.00 1.82 0.54 2.36 33.15 0.58 0.58 5.00 1.82 0.53 2.35 33.20 0.58 0.58 5.00 1.82 0.53 2.35 33.25 0.58 0.58 5.00 1.82 0.52 2.34 33.30 0.58 0.58 5.00 1.82 0.51 2.33 33.35 0.58 0.58 5.00 1.82 0.51 2.33 33.40 0.58 0.58 5.00 1.82 0.50 2.32 33.45 0.58 0.58 5.00 1.82 0.50 2.32 33.50 0.58 0.58 5.00 1.82 0.49 2.31 33.55 0.58 0.58 5.00 1.82 0.49 2.31 33.60 0.58 0.58 5.00 1.82 0.48 2.30 33.65 0.58 0.58 5.00 1.82 0.48 2.30 33.70 0.58 0.58 5.00 1.82 0.47 2.29 33.75 0.58 0.58 5.00 1.82 0.47 2.29 33.80 0.58 0.58 5.00 1.82 0.46 2.28 33.85 0.58 0.58 5.00 1.82 0.45 2.28 33.90 0.58 0.58 5.00 1.82 0.45 2.27 33.95 0.57 0.58 5.00 1.82 0.44 2.27 34.00 0.57 0.58 5.00 1.82 0.44 2.26 34.05 0.57 0.58 5.00 1.82 0.43 2.25 34.10 0.57 0.58 5.00 1.82 0.43 2.25 34.15 0.57 0.58 5.00 1.82 0.42 2.24 34.20 0.57 0.58 5.00 1.82 0.42 2.24 34.25 0.57 0.58 5.00 1.82 0.41 2.23 34.30 0.57 0.58 5.00 1.82 0.41 2.23 34.35 0.57 0.58 5.00 1.82 0.40 2.22 34.40 0.57 0.58 5.00 1.82 0.40 2.22 34.45 0.57 0.58 5.00 1.82 0.39 2.21 34.50 0.57 0.57 5.00 1.82 0.39 2.21
Page 16

Liquefy.sum 34.55 0.57 0.57 5.00 1.82 0.38 2.21 34.60 0.57 0.57 5.00 1.82 0.38 2.20 34.65 0.57 0.57 5.00 1.82 0.38 2.20 34.70 0.57 0.57 5.00 1.82 0.37 2.19 34.75 0.57 0.57 5.00 1.82 0.37 2.19 34.80 0.57 0.57 5.00 1.82 0.36 2.18 34.85 0.57 0.57 5.00 1.82 0.36 2.18 34.90 0.57 0.57 5.00 1.82 0.35 2.17 34.95 0.57 0.57 5.00 1.82 0.35 2.17 35.00 0.57 0.57 5.00 1.82 0.34 2.16 35.05 0.57 0.57 5.00 1.82 0.34 2.16 35.10 0.57 0.57 5.00 1.82 0.33 2.15 35.15 0.57 0.57 5.00 1.82 0.33 2.15 35.20 0.57 0.57 5.00 1.82 0.32 2.15 35.25 0.57 0.57 5.00 1.82 0.32 2.14 35.30 0.57 0.57 5.00 1.82 0.32 2.14 35.35 0.57 0.57 5.00 1.82 0.31 2.13 35.40 0.57 0.57 5.00 1.82 0.31 2.13 35.45 0.57 0.57 5.00 1.82 0.30 2.12 35.50 0.57 0.57 5.00 1.82 0.30 2.12 35.55 0.57 0.57 5.00 1.82 0.29 2.11 35.60 0.57 0.57 5.00 1.82 0.29 2.11 35.65 0.57 0.57 5.00 1.82 0.28 2.10 35.70 0.57 0.57 5.00 1.82 0.27 2.10 35.75 0.57 0.57 5.00 1.82 0.27 2.09 35.80 0.57 0.57 5.00 1.82 0.26 2.09 35.85 0.57 0.57 5.00 1.82 0.26 2.08 35.90 0.57 0.57 5.00 1.82 0.25 2.07 35.95 0.57 0.57 5.00 1.82 0.25 2.07 36.00 0.57 0.57 5.00 1.82 0.24 2.06 36.05 0.57 0.57 5.00 1.82 0.24 2.06 36.10 0.57 0.57 5.00 1.82 0.23 2.05 36.15 0.57 0.57 5.00 1.82 0.23 2.05 36.20 0.57 0.57 5.00 1.82 0.22 2.04 36.25 0.57 0.57 5.00 1.82 0.22 2.04 36.30 0.57 0.57 5.00 1.82 0.21 2.03 36.35 0.57 0.57 5.00 1.82 0.21 2.03 36.40 0.57 0.56 5.00 1.82 0.20 2.02 36.45 0.57 0.56 5.00 1.82 0.19 2.01 36.50 0.57 0.56 5.00 1.82 0.19 2.01 36.55 0.57 0.56 5.00 1.82 0.18 2.00 36.60 0.57 0.56 5.00 1.82 0.18 2.00 36.65 0.57 0.56 5.00 1.82 0.17 1.99 36.70 0.57 0.56 5.00 1.82 0.17 1.99 36.75 0.57 0.56 5.00 1.82 0.16 1.98 36.80 0.57 0.56 5.00 1.82 0.15 1.97 36.85 0.57 0.56 5.00 1.82 0.15 1.97 36.90 0.57 0.56 5.00 1.82 0.14 1.96
Page 17

Liquefy.sum 36.95 0.57 0.56 5.00 1.82 0.14 1.96 37.00 0.57 0.56 5.00 1.82 0.13 1.95 37.05 0.57 0.56 5.00 1.82 0.12 1.95 37.10 0.57 0.56 5.00 1.82 0.12 1.94 37.15 0.57 0.56 5.00 1.82 0.11 1.93 37.20 0.57 0.56 5.00 1.82 0.11 1.93 37.25 0.57 0.56 5.00 1.82 0.10 1.92 37.30 0.57 0.56 5.00 1.82 0.09 1.92 37.35 0.57 0.56 5.00 1.82 0.09 1.91 37.40 0.57 0.56 5.00 1.82 0.08 1.90 37.45 0.56 0.56 5.00 1.82 0.08 1.90 37.50 0.56 0.56 5.00 1.82 0.07 1.89 37.55 0.56 0.56 5.00 1.82 0.06 1.88 37.60 0.56 0.56 5.00 1.82 0.06 1.88 37.65 0.54 0.56 5.00 1.82 0.05 1.87 37.70 0.51 0.56 5.00 1.82 0.05 1.87 37.75 0.49 0.56 5.00 1.82 0.04 1.86 37.80 0.48 0.56 5.00 1.82 0.03 1.85 37.85 0.47 0.56 5.00 1.82 0.03 1.85 37.90 0.46 0.56 5.00 1.82 0.02 1.84 37.95 0.45 0.56 5.00 1.82 0.01 1.83 38.00 0.45 0.56 5.00 1.82 0.01 1.83 38.05 0.44 0.56 0.79* 1.82 0.00 1.82 38.10 0.43 0.56 0.78* 1.82 0.00 1.82 38.15 0.43 0.56 0.77* 1.81 0.00 1.81 38.20 0.42 0.56 0.76* 1.81 0.00 1.81 38.25 0.42 0.56 0.75* 1.80 0.00 1.80 38.30 0.42 0.56 0.75* 1.79 0.00 1.79 38.35 0.41 0.56 0.74* 1.79 0.00 1.79 38.40 0.41 0.56 0.73* 1.78 0.00 1.78 38.45 0.41 0.56 0.73* 1.78 0.00 1.78 38.50 0.40 0.56 0.72* 1.77 0.00 1.77 38.55 0.40 0.56 0.71* 1.77 0.00 1.77 38.60 0.40 0.56 0.71* 1.76 0.00 1.76 38.65 0.39 0.56 0.70* 1.76 0.00 1.76 38.70 0.39 0.56 0.70* 1.75 0.00 1.75 38.75 0.39 0.56 0.69* 1.74 0.00 1.74 38.80 0.38 0.56 0.69* 1.74 0.00 1.74 38.85 0.38 0.56 0.68* 1.73 0.00 1.73 38.90 0.38 0.56 0.68* 1.73 0.00 1.73 38.95 0.38 0.56 0.67* 1.72 0.00 1.72 39.00 0.37 0.56 0.67* 1.71 0.00 1.71 39.05 0.37 0.56 0.66* 1.71 0.00 1.71 39.10 0.37 0.56 0.66* 1.70 0.00 1.70 39.15 0.37 0.56 0.65* 1.70 0.00 1.70 39.20 0.36 0.56 0.65* 1.69 0.00 1.69 39.25 0.36 0.56 0.65* 1.68 0.00 1.68 39.30 0.36 0.56 0.64* 1.68 0.00 1.68
Page 18

Liquefy.sum 39.35 0.36 0.56 0.64* 1.67 0.00 1.67 39.40 0.35 0.56 0.63* 1.66 0.00 1.66 39.45 0.35 0.56 0.63* 1.66 0.00 1.66 39.50 0.35 0.56 0.63* 1.65 0.00 1.65 39.55 0.35 0.56 0.62* 1.64 0.00 1.64 39.60 0.35 0.56 0.62* 1.64 0.00 1.64 39.65 0.34 0.56 0.61* 1.63 0.00 1.63 39.70 0.34 0.56 0.61* 1.62 0.00 1.62 39.75 0.34 0.56 0.61* 1.62 0.00 1.62 39.80 0.34 0.56 0.60* 1.61 0.00 1.61 39.85 0.34 0.56 0.60* 1.60 0.00 1.60 39.90 0.33 0.56 0.60* 1.60 0.00 1.60 39.95 0.33 0.56 0.59* 1.59 0.00 1.59 40.00 0.33 0.56 0.59* 1.58 0.00 1.58 40.05 0.33 0.56 0.59* 1.58 0.00 1.58 40.10 0.33 0.56 0.59* 1.57 0.00 1.57 40.15 0.33 0.56 0.58* 1.56 0.00 1.56 40.20 0.33 0.56 0.58* 1.56 0.00 1.56 40.25 0.32 0.56 0.58* 1.55 0.00 1.55 40.30 0.32 0.56 0.58* 1.54 0.00 1.54 40.35 0.32 0.56 0.58* 1.54 0.00 1.54 40.40 0.32 0.56 0.57* 1.53 0.00 1.53 40.45 0.32 0.56 0.57* 1.52 0.00 1.52 40.50 0.32 0.56 0.57* 1.51 0.00 1.51 40.55 0.32 0.56 0.57* 1.51 0.00 1.51 40.60 0.32 0.56 0.57* 1.50 0.00 1.50 40.65 0.32 0.56 0.56* 1.49 0.00 1.49 40.70 0.32 0.56 0.56* 1.49 0.00 1.49 40.75 0.31 0.56 0.56* 1.48 0.00 1.48 40.80 0.31 0.56 0.56* 1.47 0.00 1.47 40.85 0.31 0.56 0.56* 1.47 0.00 1.47 40.90 0.31 0.56 0.55* 1.46 0.00 1.46 40.95 0.31 0.56 0.55* 1.45 0.00 1.45 41.00 0.31 0.56 0.55* 1.44 0.00 1.44 41.05 0.31 0.56 0.55* 1.44 0.00 1.44 41.10 0.31 0.56 0.55* 1.43 0.00 1.43 41.15 0.31 0.56 0.54* 1.42 0.00 1.42 41.20 0.31 0.56 0.54* 1.41 0.00 1.41 41.25 0.30 0.56 0.54* 1.41 0.00 1.41 41.30 0.30 0.56 0.54* 1.40 0.00 1.40 41.35 0.30 0.56 0.54* 1.39 0.00 1.39 41.40 0.30 0.56 0.54* 1.38 0.00 1.38 41.45 0.30 0.56 0.53* 1.38 0.00 1.38 41.50 0.30 0.56 0.53* 1.37 0.00 1.37 41.55 0.30 0.56 0.53* 1.36 0.00 1.36 41.60 0.30 0.56 0.53* 1.36 0.00 1.36 41.65 0.30 0.56 0.53* 1.35 0.00 1.35 41.70 0.30 0.56 0.53* 1.34 0.00 1.34
Page 19

Liquefy.sum 41.75 0.29 0.56 0.52* 1.33 0.00 1.33 41.80 0.29 0.56 0.52* 1.33 0.00 1.33 41.85 0.29 0.56 0.52* 1.32 0.00 1.32 41.90 0.29 0.56 0.52* 1.31 0.00 1.31 41.95 0.29 0.56 0.52* 1.30 0.00 1.30 42.00 0.29 0.56 0.52* 1.29 0.00 1.29 42.05 0.29 0.56 0.51* 1.29 0.00 1.29 42.10 0.29 0.56 0.51* 1.28 0.00 1.28 42.15 0.29 0.56 0.51* 1.27 0.00 1.27 42.20 0.29 0.56 0.51* 1.26 0.00 1.26 42.25 0.29 0.56 0.51* 1.26 0.00 1.26 42.30 0.28 0.56 0.51* 1.25 0.00 1.25 42.35 0.28 0.56 0.50* 1.24 0.00 1.24 42.40 0.28 0.56 0.50* 1.23 0.00 1.23 42.45 0.28 0.56 0.50* 1.23 0.00 1.23 42.50 0.28 0.56 0.50* 1.22 0.00 1.22 42.55 0.28 0.56 0.50* 1.21 0.00 1.21 42.60 0.28 0.56 0.50* 1.20 0.00 1.20 42.65 0.28 0.56 0.49* 1.19 0.00 1.19 42.70 0.28 0.56 0.49* 1.19 0.00 1.19 42.75 0.28 0.56 0.49* 1.18 0.00 1.18 42.80 0.28 0.56 0.49* 1.17 0.00 1.17 42.85 0.28 0.56 0.49* 1.16 0.00 1.16 42.90 0.27 0.56 0.49* 1.15 0.00 1.15 42.95 0.27 0.56 0.49* 1.15 0.00 1.15 43.00 0.27 0.56 0.48* 1.14 0.00 1.14 43.05 0.27 0.56 0.48* 1.13 0.00 1.13 43.10 0.27 0.56 0.48* 1.12 0.00 1.12 43.15 0.27 0.56 0.48* 1.11 0.00 1.11 43.20 0.27 0.56 0.48* 1.11 0.00 1.11 43.25 0.27 0.56 0.48* 1.10 0.00 1.10 43.30 0.27 0.56 0.48* 1.09 0.00 1.09 43.35 0.27 0.56 0.47* 1.08 0.00 1.08 43.40 0.27 0.56 0.47* 1.07 0.00 1.07 43.45 0.27 0.56 0.47* 1.07 0.00 1.07 43.50 0.27 0.56 0.47* 1.06 0.00 1.06 43.55 0.26 0.56 0.47* 1.05 0.00 1.05 43.60 0.26 0.56 0.47* 1.04 0.00 1.04 43.65 0.26 0.56 0.47* 1.03 0.00 1.03 43.70 0.26 0.56 0.46* 1.02 0.00 1.02 43.75 0.26 0.56 0.46* 1.02 0.00 1.02 43.80 0.26 0.56 0.46* 1.01 0.00 1.01 43.85 0.26 0.56 0.46* 1.00 0.00 1.00 43.90 0.26 0.56 0.46* 0.99 0.00 0.99 43.95 0.26 0.56 0.46* 0.98 0.00 0.98 44.00 0.26 0.56 0.46* 0.97 0.00 0.97 44.05 0.26 0.57 0.46* 0.97 0.00 0.97 44.10 0.26 0.57 0.45* 0.96 0.00 0.96
Page 20

Liquefy.sum 44.15 0.26 0.57 0.45* 0.95 0.00 0.95 44.20 0.25 0.57 0.45* 0.94 0.00 0.94 44.25 0.25 0.57 0.45* 0.93 0.00 0.93 44.30 0.25 0.57 0.45* 0.92 0.00 0.92 44.35 0.25 0.57 0.45* 0.92 0.00 0.92 44.40 0.25 0.57 0.45* 0.91 0.00 0.91 44.45 0.25 0.57 0.44* 0.90 0.00 0.90 44.50 0.25 0.57 0.44* 0.89 0.00 0.89 44.55 0.25 0.57 0.44* 0.88 0.00 0.88 44.60 0.25 0.57 0.44* 0.87 0.00 0.87 44.65 0.25 0.57 0.44* 0.86 0.00 0.86 44.70 0.25 0.57 0.44* 0.86 0.00 0.86 44.75 0.25 0.57 0.44* 0.85 0.00 0.85 44.80 0.25 0.57 0.44* 0.84 0.00 0.84 44.85 0.25 0.57 0.43* 0.83 0.00 0.83 44.90 0.25 0.57 0.43* 0.82 0.00 0.82 44.95 0.24 0.57 0.43* 0.81 0.00 0.81 45.00 0.24 0.57 0.43* 0.80 0.00 0.80 45.05 0.25 0.57 0.43* 0.79 0.00 0.79 45.10 0.25 0.57 0.44* 0.79 0.00 0.79 45.15 0.25 0.57 0.44* 0.78 0.00 0.78 45.20 0.25 0.57 0.44* 0.77 0.00 0.77 45.25 0.25 0.57 0.44* 0.76 0.00 0.76 45.30 0.25 0.57 0.44* 0.75 0.00 0.75 45.35 0.25 0.57 0.45* 0.74 0.00 0.74 45.40 0.25 0.57 0.45* 0.73 0.00 0.73 45.45 0.26 0.57 0.45* 0.73 0.00 0.73 45.50 0.26 0.57 0.45* 0.72 0.00 0.72 45.55 0.26 0.57 0.46* 0.71 0.00 0.71 45.60 0.26 0.57 0.46* 0.70 0.00 0.70 45.65 0.26 0.57 0.46* 0.69 0.00 0.69 45.70 0.26 0.57 0.46* 0.68 0.00 0.68 45.75 0.26 0.57 0.47* 0.68 0.00 0.68 45.80 0.26 0.57 0.47* 0.67 0.00 0.67 45.85 0.27 0.57 0.47* 0.66 0.00 0.66 45.90 0.27 0.57 0.47* 0.65 0.00 0.65 45.95 0.27 0.57 0.48* 0.64 0.00 0.64 46.00 0.27 0.57 0.48* 0.63 0.00 0.63 46.05 0.27 0.57 0.48* 0.63 0.00 0.63 46.10 0.27 0.57 0.48* 0.62 0.00 0.62 46.15 0.27 0.57 0.49* 0.61 0.00 0.61 46.20 0.28 0.57 0.49* 0.60 0.00 0.60 46.25 0.28 0.57 0.49* 0.60 0.00 0.60 46.30 0.28 0.57 0.49* 0.59 0.00 0.59 46.35 0.28 0.57 0.50* 0.58 0.00 0.58 46.40 0.28 0.57 0.50* 0.57 0.00 0.57 46.45 0.28 0.57 0.50* 0.56 0.00 0.56 46.50 0.28 0.57 0.50* 0.56 0.00 0.56
Page 21

Liquefy.sum 46.55 0.29 0.57 0.51* 0.55 0.00 0.55 46.60 0.29 0.57 0.51* 0.54 0.00 0.54 46.65 0.29 0.57 0.51* 0.53 0.00 0.53 46.70 0.29 0.57 0.51* 0.53 0.00 0.53 46.75 0.29 0.57 0.52* 0.52 0.00 0.52 46.80 0.29 0.57 0.52* 0.51 0.00 0.51 46.85 0.30 0.57 0.52* 0.50 0.00 0.50 46.90 0.30 0.57 0.53* 0.50 0.00 0.50 46.95 0.30 0.57 0.53* 0.49 0.00 0.49 47.00 0.30 0.57 0.53* 0.48 0.00 0.48 47.05 0.30 0.57 0.53* 0.48 0.00 0.48 47.10 0.30 0.57 0.54* 0.47 0.00 0.47 47.15 0.31 0.57 0.54* 0.46 0.00 0.46 47.20 0.31 0.57 0.54* 0.45 0.00 0.45 47.25 0.31 0.57 0.55* 0.45 0.00 0.45 47.30 0.31 0.57 0.55* 0.44 0.00 0.44 47.35 0.31 0.57 0.55* 0.43 0.00 0.43 47.40 0.31 0.57 0.56* 0.43 0.00 0.43 47.45 0.32 0.57 0.56* 0.42 0.00 0.42 47.50 0.32 0.57 0.56* 0.41 0.00 0.41 47.55 0.32 0.57 0.56* 0.40 0.00 0.40 47.60 0.32 0.57 0.57* 0.40 0.00 0.40 47.65 0.32 0.57 0.57* 0.39 0.00 0.39 47.70 0.33 0.57 0.57* 0.38 0.00 0.38 47.75 0.33 0.57 0.58* 0.38 0.00 0.38 47.80 0.33 0.57 0.58* 0.37 0.00 0.37 47.85 0.33 0.57 0.58* 0.36 0.00 0.36 47.90 0.33 0.57 0.59* 0.36 0.00 0.36 47.95 0.34 0.57 0.59* 0.35 0.00 0.35 48.00 0.34 0.57 0.60* 0.34 0.00 0.34 48.05 0.34 0.57 0.60* 0.34 0.00 0.34 48.10 0.34 0.57 0.60* 0.33 0.00 0.33 48.15 0.34 0.57 0.61* 0.33 0.00 0.33 48.20 0.35 0.57 0.61* 0.32 0.00 0.32 48.25 0.35 0.57 0.61* 0.31 0.00 0.31 48.30 0.35 0.57 0.62* 0.31 0.00 0.31 48.35 0.35 0.57 0.62* 0.30 0.00 0.30 48.40 0.35 0.57 0.63* 0.29 0.00 0.29 48.45 0.36 0.57 0.63* 0.29 0.00 0.29 48.50 0.36 0.57 0.64* 0.28 0.00 0.28 48.55 0.36 0.57 0.64* 0.28 0.00 0.28 48.60 0.36 0.57 0.64* 0.27 0.00 0.27 48.65 0.37 0.57 0.65* 0.26 0.00 0.26 48.70 0.37 0.57 0.65* 0.26 0.00 0.26 48.75 0.37 0.57 0.66* 0.25 0.00 0.25 48.80 0.38 0.57 0.66* 0.25 0.00 0.25 48.85 0.38 0.57 0.67* 0.24 0.00 0.24 48.90 0.38 0.57 0.67* 0.23 0.00 0.23
Page 22

Liquefy.sum 48.95 0.38 0.57 0.68* 0.23 0.00 0.23 49.00 0.39 0.57 0.69* 0.22 0.00 0.22 49.05 0.39 0.57 0.69* 0.22 0.00 0.22 49.10 0.40 0.57 0.70* 0.21 0.00 0.21 49.15 0.40 0.57 0.71* 0.21 0.00 0.21 49.20 0.40 0.57 0.71* 0.20 0.00 0.20 49.25 0.41 0.57 0.72* 0.20 0.00 0.20 49.30 0.41 0.57 0.73* 0.19 0.00 0.19 49.35 0.42 0.57 0.74* 0.19 0.00 0.19 49.40 0.42 0.57 0.75* 0.18 0.00 0.18 49.45 0.43 0.57 0.76* 0.18 0.00 0.18 49.50 0.44 0.57 0.77* 0.17 0.00 0.17 49.55 0.45 0.57 0.79* 0.17 0.00 0.17 49.60 0.46 0.57 0.81* 0.16 0.00 0.16 49.65 0.47 0.57 0.84* 0.16 0.00 0.16 49.70 0.49 0.57 0.87* 0.15 0.00 0.15 49.75 0.52 0.57 0.93* 0.15 0.00 0.15 49.80 0.53 0.56 0.94* 0.14 0.00 0.14 49.85 0.53 0.56 0.94* 0.14 0.00 0.14 49.90 0.53 0.56 0.94* 0.13 0.00 0.13 49.95 0.53 0.56 0.94* 0.13 0.00 0.13 50.00 0.53 0.56 0.94* 0.13 0.00 0.13 50.05 0.53 0.56 0.94* 0.12 0.00 0.12 50.10 0.53 0.56 0.94* 0.12 0.00 0.12 50.15 0.53 0.56 0.94* 0.11 0.00 0.11 50.20 0.53 0.56 0.94* 0.11 0.00 0.11 50.25 0.53 0.56 0.94* 0.11 0.00 0.11 50.30 0.53 0.56 0.94* 0.10 0.00 0.10 50.35 0.53 0.56 0.94* 0.10 0.00 0.10 50.40 0.53 0.56 0.94* 0.09 0.00 0.09 50.45 0.53 0.56 0.94* 0.09 0.00 0.09 50.50 0.53 0.56 0.94* 0.09 0.00 0.09 50.55 0.53 0.56 0.94* 0.08 0.00 0.08 50.60 0.53 0.56 0.94* 0.08 0.00 0.08 50.65 0.53 0.56 0.94* 0.07 0.00 0.07 50.70 0.53 0.56 0.94* 0.07 0.00 0.07 50.75 0.53 0.56 0.94* 0.06 0.00 0.06 50.80 0.53 0.56 0.94* 0.06 0.00 0.06 50.85 0.53 0.56 0.94* 0.06 0.00 0.06 50.90 0.53 0.56 0.94* 0.05 0.00 0.05 50.95 0.53 0.56 0.94* 0.05 0.00 0.05 51.00 0.53 0.56 0.94* 0.04 0.00 0.04 51.05 0.53 0.56 0.94* 0.04 0.00 0.04 51.10 0.53 0.56 0.94* 0.03 0.00 0.03 51.15 0.53 0.56 0.94* 0.03 0.00 0.03 51.20 0.53 0.56 0.94* 0.03 0.00 0.03 51.25 0.53 0.56 0.94* 0.02 0.00 0.02 51.30 0.53 0.56 0.94* 0.02 0.00 0.02
Page 23

Liquefy.sum 51.35 0.53 0.56 0.94* 0.01 0.00 0.01 51.40 0.53 0.56 0.94* 0.01 0.00 0.01 51.45 0.53 0.56 0.94* 0.00 0.00 0.00 51.50 0.53 0.56 0.94* 0.00 0.00 0.00 _______________________________________________________ * F.S.<1, Liquefaction Potential Zone (F.S. is limited to 5, CRR is limited to 2, CSR is limited to 2)
Units: Unit: qc, fs, Stress or Pressure = atm (1.0581tsf); Unit Weight = pcf; Depth = ft; Settlement = in. ____________________________________________________________________________________ 1 atm (atmosphere) = 1 tsf (ton/ft2) CRRm Cyclic resistance ratio from soils CSRsf Cyclic stress ratio induced by a given earthquake (with user request factor of safety) F.S. Factor of Safety against liquefaction, F.S.=CRRm/CSRsf S_sat Settlement from saturated sands S_dry Settlement from Unsaturated Sands S_all Total Settlement from Saturated and Unsaturated Sands NoLiq No‐Liquefy Soils
Page 24

Appendix DEZ-Frisk Output Files

File: N:\2018\18-81-134 SBCUSD, New Diesel Technology Center\-03\Site Specific Seismic Design\~_Gymnasium Expansion - Seismic Hazard Analysis.DSPDate modified: 11/02/2018 02:56:46 PM
EZ-FRISK 7.65 Build 004 Page 1 of 83
Deterministic Spectra Results using EZ-FRISK 7.65 Build 004
Largest Amplitudes of Ground Motions Considering All Sources Calculated using Weighted Mean of Attenuation Equations Amplitude Units: Acceleration (g)
Fractile: 0.84 Period Amplitude Magnitude Closest Region Controlling Source Distance(km) PGA 9.905e-001 7.00 Mw 5.00 USGS 2008 California California Gridded 0.03 1.062e+000 7.00 Mw 5.00 USGS 2008 California California Gridded 0.05 1.169e+000 7.00 Mw 5.00 USGS 2008 California California Gridded 0.1 1.531e+000 7.00 Mw 5.00 USGS 2008 California California Gridded 0.2 1.981e+000 7.00 Mw 5.00 USGS 2008 California California Gridded 0.3 2.112e+000 7.00 Mw 5.00 USGS 2008 California California Gridded 0.4 2.163e+000 7.00 Mw 5.00 USGS 2008 California California Gridded 0.5 2.145e+000 7.00 Mw 5.00 USGS 2008 California California Gridded 0.75 2.007e+000 8.20 Mw 3.79 USGS 2008 California Southern San Andreas 1 1.858e+000 8.20 Mw 3.79 USGS 2008 California Southern San Andreas 2 1.358e+000 8.20 Mw 3.79 USGS 2008 California Southern San Andreas 3 1.067e+000 8.20 Mw 3.79 USGS 2008 California Southern San Andreas 4 8.342e-001 8.20 Mw 3.79 USGS 2008 California Southern San Andreas
Fractile: Mean Period Amplitude Magnitude Closest Region Controlling Source Distance(km) PGA 6.535e-001 7.00 Mw 5.00 USGS 2008 California California Gridded 0.03 7.005e-001 7.00 Mw 5.00 USGS 2008 California California Gridded 0.05 7.712e-001 7.00 Mw 5.00 USGS 2008 California California Gridded

File: N:\2018\18-81-134 SBCUSD, New Diesel Technology Center\-03\Site Specific Seismic Design\~_Gymnasium Expansion - Seismic Hazard Analysis.DSPDate modified: 11/02/2018 02:56:46 PM
EZ-FRISK 7.65 Build 004 Page 2 of 83
0.1 1.009e+000 7.00 Mw 5.00 USGS 2008 California California Gridded 0.2 1.307e+000 7.00 Mw 5.00 USGS 2008 California California Gridded 0.3 1.391e+000 7.00 Mw 5.00 USGS 2008 California California Gridded 0.4 1.433e+000 7.00 Mw 5.00 USGS 2008 California California Gridded 0.5 1.425e+000 7.00 Mw 5.00 USGS 2008 California California Gridded 0.75 1.326e+000 8.20 Mw 3.79 USGS 2008 California Southern San Andreas 1 1.219e+000 8.20 Mw 3.79 USGS 2008 California Southern San Andreas 2 8.733e-001 8.20 Mw 3.79 USGS 2008 California Southern San Andreas 3 6.841e-001 8.20 Mw 3.79 USGS 2008 California Southern San Andreas 4 5.334e-001 8.20 Mw 3.79 USGS 2008 California Southern San Andreas
Largest Amplitudes of Ground Motions Considering Sources Calculated with Boore-Atkinson (2008) NGA USGS 2008 MRC Amplitude Units: Acceleration (g)
Fractile: 0.84 Period Amplitude Magnitude Closest Region Controlling Source Distance(km) PGA 1.052e+000 7.60 Mw 5.00 USGS 2008 California San Gorgornio Shear Gridded 0.03 1.164e+000 7.60 Mw 5.00 USGS 2008 California San Gorgornio Shear Gridded 0.05 1.305e+000 7.60 Mw 5.00 USGS 2008 California San Gorgornio Shear Gridded 0.1 1.831e+000 7.60 Mw 5.00 USGS 2008 California San Gorgornio Shear Gridded 0.2 2.357e+000 7.00 Mw 5.00 USGS 2008 California California Gridded 0.3 2.564e+000 7.00 Mw 5.00 USGS 2008 California California Gridded 0.4 2.649e+000 7.00 Mw 5.00 USGS 2008 California California Gridded 0.5 2.622e+000 7.00 Mw 5.00 USGS 2008 California California Gridded 0.75 2.320e+000 7.60 Mw 5.00 USGS 2008 California San Gorgornio Shear Gridded 1 1.849e+000 7.60 Mw 5.00 USGS 2008 California San Gorgornio Shear Gridded

File: N:\2018\18-81-134 SBCUSD, New Diesel Technology Center\-03\Site Specific Seismic Design\~_Gymnasium Expansion - Seismic Hazard Analysis.DSPDate modified: 11/02/2018 02:56:46 PM
EZ-FRISK 7.65 Build 004 Page 3 of 83
2 1.146e+000 7.60 Mw 5.00 USGS 2008 California San Gorgornio Shear Gridded 3 1.082e+000 8.20 Mw 3.79 USGS 2008 California Southern San Andreas 4 8.583e-001 8.20 Mw 3.79 USGS 2008 California Southern San Andreas
Fractile: Mean Period Amplitude Magnitude Closest Region Controlling Source Distance(km) PGA 6.943e-001 7.60 Mw 5.00 USGS 2008 California San Gorgornio Shear Gridded 0.03 7.680e-001 7.60 Mw 5.00 USGS 2008 California San Gorgornio Shear Gridded 0.05 8.613e-001 7.60 Mw 5.00 USGS 2008 California San Gorgornio Shear Gridded 0.1 1.204e+000 7.60 Mw 5.00 USGS 2008 California San Gorgornio Shear Gridded 0.2 1.555e+000 7.00 Mw 5.00 USGS 2008 California California Gridded 0.3 1.685e+000 7.00 Mw 5.00 USGS 2008 California California Gridded 0.4 1.745e+000 7.00 Mw 5.00 USGS 2008 California California Gridded 0.5 1.718e+000 7.00 Mw 5.00 USGS 2008 California California Gridded 0.75 1.504e+000 7.60 Mw 5.00 USGS 2008 California San Gorgornio Shear Gridded 1 1.198e+000 7.60 Mw 5.00 USGS 2008 California San Gorgornio Shear Gridded 2 7.297e-001 7.60 Mw 5.00 USGS 2008 California San Gorgornio Shear Gridded 3 6.903e-001 8.20 Mw 3.79 USGS 2008 California Southern San Andreas 4 5.470e-001 8.20 Mw 3.79 USGS 2008 California Southern San Andreas
Largest Amplitudes of Ground Motions Considering Sources Calculated with Campbell-Bozorgnia (2008) NGA USGS 2008 MRC Amplitude Units: Acceleration (g)
Fractile: 0.84 Period Amplitude Magnitude Closest Region Controlling Source Distance(km)

File: N:\2018\18-81-134 SBCUSD, New Diesel Technology Center\-03\Site Specific Seismic Design\~_Gymnasium Expansion - Seismic Hazard Analysis.DSPDate modified: 11/02/2018 02:56:46 PM
EZ-FRISK 7.65 Build 004 Page 4 of 83
PGA 8.404e-001 7.00 Mw 5.00 USGS 2008 California California Gridded 0.03 8.698e-001 7.00 Mw 5.00 USGS 2008 California California Gridded 0.05 9.546e-001 7.00 Mw 5.00 USGS 2008 California California Gridded 0.1 1.202e+000 7.00 Mw 5.00 USGS 2008 California California Gridded 0.2 1.541e+000 7.00 Mw 5.00 USGS 2008 California California Gridded 0.3 1.652e+000 7.00 Mw 5.00 USGS 2008 California California Gridded 0.4 1.743e+000 7.00 Mw 5.00 USGS 2008 California California Gridded 0.5 1.838e+000 8.20 Mw 3.79 USGS 2008 California Southern San Andreas 0.75 1.993e+000 8.20 Mw 3.79 USGS 2008 California Southern San Andreas 1 2.045e+000 8.20 Mw 3.79 USGS 2008 California Southern San Andreas 2 1.729e+000 8.20 Mw 3.79 USGS 2008 California Southern San Andreas 3 1.281e+000 8.20 Mw 3.79 USGS 2008 California Southern San Andreas 4 1.024e+000 8.20 Mw 3.79 USGS 2008 California Southern San Andreas
Fractile: Mean Period Amplitude Magnitude Closest Region Controlling Source Distance(km) PGA 5.545e-001 7.00 Mw 5.00 USGS 2008 California California Gridded 0.03 5.739e-001 7.00 Mw 5.00 USGS 2008 California California Gridded 0.05 6.298e-001 7.00 Mw 5.00 USGS 2008 California California Gridded 0.1 7.930e-001 7.00 Mw 5.00 USGS 2008 California California Gridded 0.2 1.017e+000 7.00 Mw 5.00 USGS 2008 California California Gridded 0.3 1.090e+000 7.00 Mw 5.00 USGS 2008 California California Gridded 0.4 1.159e+000 7.00 Mw 5.00 USGS 2008 California California Gridded 0.5 1.232e+000 8.20 Mw 3.79 USGS 2008 California Southern San Andreas 0.75 1.325e+000 8.20 Mw 3.79 USGS 2008 California Southern San Andreas 1 1.347e+000 8.20 Mw 3.79 USGS 2008 California Southern San Andreas 2 1.117e+000 8.20 Mw 3.79 USGS 2008 California Southern San Andreas 3 8.277e-001 8.20 Mw 3.79 USGS 2008 California Southern San Andreas

File: N:\2018\18-81-134 SBCUSD, New Diesel Technology Center\-03\Site Specific Seismic Design\~_Gymnasium Expansion - Seismic Hazard Analysis.DSPDate modified: 11/02/2018 02:56:46 PM
EZ-FRISK 7.65 Build 004 Page 5 of 83
4 6.612e-001 8.20 Mw 3.79 USGS 2008 California Southern San Andreas
Largest Amplitudes of Ground Motions Considering Sources Calculated with Chiou-Youngs (2007) NGA USGS 2008 MRC Amplitude Units: Acceleration (g)
Fractile: 0.84 Period Amplitude Magnitude Closest Region Controlling Source Distance(km) PGA 1.131e+000 7.60 Mw 5.00 USGS 2008 California San Gorgornio Shear Gridded 0.03 1.209e+000 7.60 Mw 5.00 USGS 2008 California San Gorgornio Shear Gridded 0.05 1.318e+000 7.60 Mw 5.00 USGS 2008 California San Gorgornio Shear Gridded 0.1 1.670e+000 7.60 Mw 5.00 USGS 2008 California San Gorgornio Shear Gridded 0.2 2.123e+000 7.60 Mw 5.00 USGS 2008 California San Gorgornio Shear Gridded 0.3 2.231e+000 7.60 Mw 5.00 USGS 2008 California San Gorgornio Shear Gridded 0.4 2.262e+000 8.20 Mw 3.79 USGS 2008 California Southern San Andreas 0.5 2.222e+000 8.20 Mw 3.79 USGS 2008 California Southern San Andreas 0.75 2.055e+000 8.20 Mw 3.79 USGS 2008 California Southern San Andreas 1 1.939e+000 8.20 Mw 3.79 USGS 2008 California Southern San Andreas 2 1.204e+000 8.20 Mw 3.79 USGS 2008 California Southern San Andreas 3 8.384e-001 8.20 Mw 3.79 USGS 2008 California Southern San Andreas 4 6.202e-001 8.20 Mw 3.79 USGS 2008 California Southern San Andreas
Fractile: Mean Period Amplitude Magnitude Closest Region Controlling Source Distance(km) PGA 7.465e-001 7.60 Mw 5.00 USGS 2008 California San Gorgornio Shear Gridded 0.03 7.974e-001 7.60 Mw 5.00 USGS 2008 California San Gorgornio Shear Gridded 0.05 8.693e-001 7.60 Mw 5.00 USGS 2008 California San Gorgornio Shear Gridded

File: N:\2018\18-81-134 SBCUSD, New Diesel Technology Center\-03\Site Specific Seismic Design\~_Gymnasium Expansion - Seismic Hazard Analysis.DSPDate modified: 11/02/2018 02:56:46 PM
EZ-FRISK 7.65 Build 004 Page 6 of 83
0.1 1.102e+000 7.60 Mw 5.00 USGS 2008 California San Gorgornio Shear Gridded 0.2 1.400e+000 7.60 Mw 5.00 USGS 2008 California San Gorgornio Shear Gridded 0.3 1.472e+000 7.60 Mw 5.00 USGS 2008 California San Gorgornio Shear Gridded 0.4 1.505e+000 8.20 Mw 3.79 USGS 2008 California Southern San Andreas 0.5 1.490e+000 8.20 Mw 3.79 USGS 2008 California Southern San Andreas 0.75 1.374e+000 8.20 Mw 3.79 USGS 2008 California Southern San Andreas 1 1.279e+000 8.20 Mw 3.79 USGS 2008 California Southern San Andreas 2 7.763e-001 8.20 Mw 3.79 USGS 2008 California Southern San Andreas 3 5.342e-001 8.20 Mw 3.79 USGS 2008 California Southern San Andreas 4 3.920e-001 8.20 Mw 3.79 USGS 2008 California Southern San Andreas
Largest Amplitudes of Ground Motions for Each Source
Source: Burnt MtnRegion: USGS 2008 California Closest Distance: 73.45 km Amplitude Units: Acceleration (g) Magnitude: 6.80 Mw Fractile: 0.84 Column 1: Spectral Period Column 2: Acceleration (g) for: Weighted Mean of Attenuation Equations Column 3: Acceleration (g) for: Boore-Atkinson (2008) NGA USGS 2008 MRC Column 4: Acceleration (g) for: Campbell-Bozorgnia (2008) NGA USGS 2008 MRC Column 5: Acceleration (g) for: Chiou-Youngs (2007) NGA USGS 2008 MRC
1 2 3 4 5 PGA 1.243e-001 1.665e-001 1.123e-001 9.417e-002

File: N:\2018\18-81-134 SBCUSD, New Diesel Technology Center\-03\Site Specific Seismic Design\~_Gymnasium Expansion - Seismic Hazard Analysis.DSPDate modified: 11/02/2018 02:56:46 PM
EZ-FRISK 7.65 Build 004 Page 7 of 83
0.03 1.269e-001 1.664e-001 1.166e-001 9.780e-002 0.05 1.388e-001 1.744e-001 1.312e-001 1.107e-001 0.1 1.935e-001 2.342e-001 1.831e-001 1.633e-001 0.2 2.792e-001 3.582e-001 2.559e-001 2.234e-001 0.3 2.848e-001 3.663e-001 2.676e-001 2.206e-001 0.4 2.736e-001 3.612e-001 2.501e-001 2.094e-001 0.5 2.611e-001 3.470e-001 2.411e-001 1.953e-001 0.75 2.099e-001 2.768e-001 1.950e-001 1.578e-001 1 1.727e-001 2.264e-001 1.585e-001 1.332e-001 2 8.653e-002 1.155e-001 7.768e-002 6.643e-002 3 5.286e-002 6.742e-002 4.966e-002 4.149e-002 4 3.902e-002 5.083e-002 3.727e-002 2.895e-002
Fractile: Mean Column 1: Spectral Period Column 2: Acceleration (g) for: Weighted Mean of Attenuation Equations Column 3: Acceleration (g) for: Boore-Atkinson (2008) NGA USGS 2008 MRC Column 4: Acceleration (g) for: Campbell-Bozorgnia (2008) NGA USGS 2008 MRC Column 5: Acceleration (g) for: Chiou-Youngs (2007) NGA USGS 2008 MRC
1 2 3 4 5 PGA 8.203e-002 1.098e-001 7.413e-002 6.214e-002 0.03 8.375e-002 1.098e-001 7.692e-002 6.453e-002 0.05 9.156e-002 1.151e-001 8.655e-002 7.306e-002 0.1 1.275e-001 1.539e-001 1.208e-001 1.077e-001 0.2 1.842e-001 2.363e-001 1.688e-001 1.474e-001 0.3 1.876e-001 2.407e-001 1.765e-001 1.456e-001 0.4 1.808e-001 2.378e-001 1.663e-001 1.381e-001 0.5 1.720e-001 2.274e-001 1.601e-001 1.284e-001

File: N:\2018\18-81-134 SBCUSD, New Diesel Technology Center\-03\Site Specific Seismic Design\~_Gymnasium Expansion - Seismic Hazard Analysis.DSPDate modified: 11/02/2018 02:56:46 PM
EZ-FRISK 7.65 Build 004 Page 8 of 83
0.75 1.369e-001 1.794e-001 1.282e-001 1.030e-001 1 1.123e-001 1.467e-001 1.037e-001 8.644e-002 2 5.545e-002 7.355e-002 5.021e-002 4.260e-002 3 3.383e-002 4.301e-002 3.208e-002 2.639e-002 4 2.491e-002 3.239e-002 2.407e-002 1.828e-002
Source: Calico-HidalgoRegion: USGS 2008 California Closest Distance: 89.59 km Amplitude Units: Acceleration (g) Magnitude: 7.40 Mw Fractile: 0.84 Column 1: Spectral Period Column 2: Acceleration (g) for: Weighted Mean of Attenuation Equations Column 3: Acceleration (g) for: Boore-Atkinson (2008) NGA USGS 2008 MRC Column 4: Acceleration (g) for: Campbell-Bozorgnia (2008) NGA USGS 2008 MRC Column 5: Acceleration (g) for: Chiou-Youngs (2007) NGA USGS 2008 MRC
1 2 3 4 5 PGA 1.386e-001 1.715e-001 1.213e-001 1.230e-001 0.03 1.425e-001 1.751e-001 1.251e-001 1.272e-001 0.05 1.551e-001 1.845e-001 1.386e-001 1.421e-001 0.1 2.074e-001 2.327e-001 1.826e-001 2.067e-001 0.2 2.856e-001 3.040e-001 2.621e-001 2.906e-001 0.3 3.013e-001 3.209e-001 2.878e-001 2.952e-001 0.4 2.943e-001 3.263e-001 2.753e-001 2.814e-001 0.5 2.928e-001 3.281e-001 2.822e-001 2.680e-001

File: N:\2018\18-81-134 SBCUSD, New Diesel Technology Center\-03\Site Specific Seismic Design\~_Gymnasium Expansion - Seismic Hazard Analysis.DSPDate modified: 11/02/2018 02:56:46 PM
EZ-FRISK 7.65 Build 004 Page 9 of 83
0.75 2.588e-001 2.953e-001 2.555e-001 2.256e-001 1 2.252e-001 2.553e-001 2.235e-001 1.969e-001 2 1.287e-001 1.496e-001 1.299e-001 1.067e-001 3 8.719e-002 1.036e-001 8.785e-002 7.009e-002 4 6.504e-002 7.667e-002 6.790e-002 5.054e-002
Fractile: Mean Column 1: Spectral Period Column 2: Acceleration (g) for: Weighted Mean of Attenuation Equations Column 3: Acceleration (g) for: Boore-Atkinson (2008) NGA USGS 2008 MRC Column 4: Acceleration (g) for: Campbell-Bozorgnia (2008) NGA USGS 2008 MRC Column 5: Acceleration (g) for: Chiou-Youngs (2007) NGA USGS 2008 MRC
1 2 3 4 5 PGA 9.145e-002 1.132e-001 8.004e-002 8.117e-002 0.03 9.400e-002 1.156e-001 8.254e-002 8.390e-002 0.05 1.023e-001 1.217e-001 9.144e-002 9.378e-002 0.1 1.366e-001 1.529e-001 1.205e-001 1.364e-001 0.2 1.884e-001 2.006e-001 1.729e-001 1.917e-001 0.3 1.985e-001 2.109e-001 1.899e-001 1.948e-001 0.4 1.950e-001 2.148e-001 1.831e-001 1.871e-001 0.5 1.933e-001 2.150e-001 1.875e-001 1.774e-001 0.75 1.691e-001 1.915e-001 1.680e-001 1.479e-001 1 1.466e-001 1.654e-001 1.463e-001 1.282e-001 2 8.259e-002 9.527e-002 8.396e-002 6.855e-002 3 5.582e-002 6.610e-002 5.675e-002 4.462e-002 4 4.155e-002 4.886e-002 4.384e-002 3.194e-002

File: N:\2018\18-81-134 SBCUSD, New Diesel Technology Center\-03\Site Specific Seismic Design\~_Gymnasium Expansion - Seismic Hazard Analysis.DSPDate modified: 11/02/2018 02:56:46 PM
EZ-FRISK 7.65 Build 004 Page 10 of 83
Source: California GriddedRegion: USGS 2008 California Closest Distance: 5.00 km Amplitude Units: Acceleration (g) Magnitude: 7.00 Mw Fractile: 0.84 Column 1: Spectral Period Column 2: Acceleration (g) for: Weighted Mean of Attenuation Equations Column 3: Acceleration (g) for: Boore-Atkinson (2008) NGA USGS 2008 MRC Column 4: Acceleration (g) for: Campbell-Bozorgnia (2008) NGA USGS 2008 MRC Column 5: Acceleration (g) for: Chiou-Youngs (2007) NGA USGS 2008 MRC
1 2 3 4 5 PGA 9.905e-001 1.037e+000 8.404e-001 1.099e+000 0.03 1.062e+000 1.145e+000 8.698e-001 1.173e+000 0.05 1.169e+000 1.283e+000 9.546e-001 1.281e+000 0.1 1.531e+000 1.780e+000 1.202e+000 1.626e+000 0.2 1.981e+000 2.357e+000 1.541e+000 2.046e+000 0.3 2.112e+000 2.564e+000 1.652e+000 2.121e+000 0.4 2.163e+000 2.649e+000 1.743e+000 2.097e+000 0.5 2.145e+000 2.622e+000 1.802e+000 2.010e+000 0.75 1.889e+000 2.293e+000 1.616e+000 1.759e+000 1 1.579e+000 1.767e+000 1.408e+000 1.561e+000 2 7.887e-001 9.069e-001 7.428e-001 7.788e-001 3 5.030e-001 5.658e-001 4.546e-001 4.887e-001 4 3.644e-001 4.096e-001 3.454e-001 3.383e-001
Fractile: Mean

File: N:\2018\18-81-134 SBCUSD, New Diesel Technology Center\-03\Site Specific Seismic Design\~_Gymnasium Expansion - Seismic Hazard Analysis.DSPDate modified: 11/02/2018 02:56:46 PM
EZ-FRISK 7.65 Build 004 Page 11 of 83
Column 1: Spectral Period Column 2: Acceleration (g) for: Weighted Mean of Attenuation Equations Column 3: Acceleration (g) for: Boore-Atkinson (2008) NGA USGS 2008 MRC Column 4: Acceleration (g) for: Campbell-Bozorgnia (2008) NGA USGS 2008 MRC Column 5: Acceleration (g) for: Chiou-Youngs (2007) NGA USGS 2008 MRC
1 2 3 4 5 PGA 6.535e-001 6.842e-001 5.545e-001 7.250e-001 0.03 7.005e-001 7.553e-001 5.739e-001 7.743e-001 0.05 7.712e-001 8.467e-001 6.298e-001 8.450e-001 0.1 1.009e+000 1.170e+000 7.930e-001 1.073e+000 0.2 1.307e+000 1.555e+000 1.017e+000 1.350e+000 0.3 1.391e+000 1.685e+000 1.090e+000 1.399e+000 0.4 1.433e+000 1.745e+000 1.159e+000 1.395e+000 0.5 1.425e+000 1.718e+000 1.208e+000 1.347e+000 0.75 1.246e+000 1.486e+000 1.075e+000 1.175e+000 1 1.034e+000 1.145e+000 9.280e-001 1.029e+000 2 5.064e-001 5.777e-001 4.801e-001 5.019e-001 3 3.220e-001 3.609e-001 2.937e-001 3.114e-001 4 2.326e-001 2.610e-001 2.230e-001 2.138e-001
Source: ChinoRegion: USGS 2008 California Closest Distance: 43.18 km Amplitude Units: Acceleration (g) Magnitude: 6.80 Mw Fractile: 0.84

File: N:\2018\18-81-134 SBCUSD, New Diesel Technology Center\-03\Site Specific Seismic Design\~_Gymnasium Expansion - Seismic Hazard Analysis.DSPDate modified: 11/02/2018 02:56:46 PM
EZ-FRISK 7.65 Build 004 Page 12 of 83
Column 1: Spectral Period Column 2: Acceleration (g) for: Weighted Mean of Attenuation Equations Column 3: Acceleration (g) for: Boore-Atkinson (2008) NGA USGS 2008 MRC Column 4: Acceleration (g) for: Campbell-Bozorgnia (2008) NGA USGS 2008 MRC Column 5: Acceleration (g) for: Chiou-Youngs (2007) NGA USGS 2008 MRC
1 2 3 4 5 PGA 2.006e-001 2.605e-001 1.770e-001 1.643e-001 0.03 2.073e-001 2.640e-001 1.852e-001 1.726e-001 0.05 2.296e-001 2.791e-001 2.114e-001 1.983e-001 0.1 3.278e-001 3.809e-001 3.091e-001 2.934e-001 0.2 4.507e-001 5.544e-001 4.155e-001 3.822e-001 0.3 4.431e-001 5.486e-001 4.142e-001 3.665e-001 0.4 4.197e-001 5.368e-001 3.856e-001 3.366e-001 0.5 3.965e-001 5.106e-001 3.678e-001 3.112e-001 0.75 3.151e-001 4.023e-001 2.947e-001 2.484e-001 1 2.580e-001 3.251e-001 2.408e-001 2.083e-001 2 1.287e-001 1.633e-001 1.200e-001 1.029e-001 3 7.895e-002 9.516e-002 7.723e-002 6.446e-002 4 5.814e-002 7.123e-002 5.817e-002 4.503e-002
Fractile: Mean Column 1: Spectral Period Column 2: Acceleration (g) for: Weighted Mean of Attenuation Equations Column 3: Acceleration (g) for: Boore-Atkinson (2008) NGA USGS 2008 MRC Column 4: Acceleration (g) for: Campbell-Bozorgnia (2008) NGA USGS 2008 MRC Column 5: Acceleration (g) for: Chiou-Youngs (2007) NGA USGS 2008 MRC
1 2 3 4 5
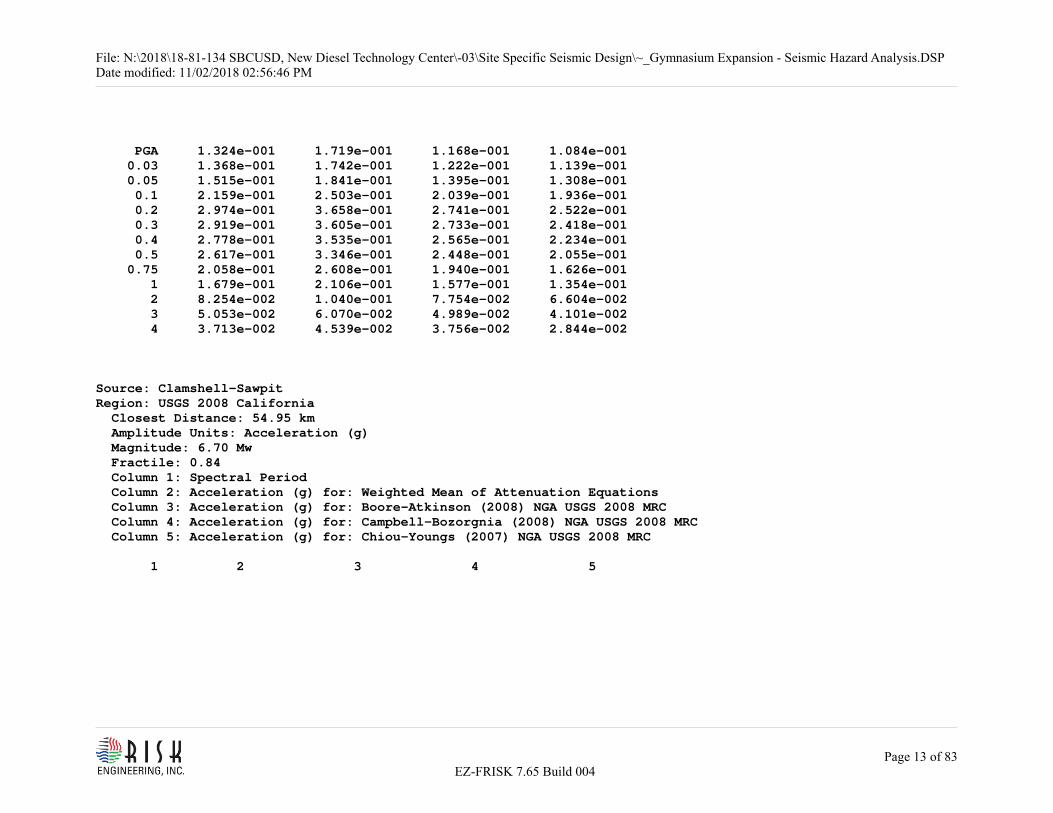
File: N:\2018\18-81-134 SBCUSD, New Diesel Technology Center\-03\Site Specific Seismic Design\~_Gymnasium Expansion - Seismic Hazard Analysis.DSPDate modified: 11/02/2018 02:56:46 PM
EZ-FRISK 7.65 Build 004 Page 13 of 83
PGA 1.324e-001 1.719e-001 1.168e-001 1.084e-001 0.03 1.368e-001 1.742e-001 1.222e-001 1.139e-001 0.05 1.515e-001 1.841e-001 1.395e-001 1.308e-001 0.1 2.159e-001 2.503e-001 2.039e-001 1.936e-001 0.2 2.974e-001 3.658e-001 2.741e-001 2.522e-001 0.3 2.919e-001 3.605e-001 2.733e-001 2.418e-001 0.4 2.778e-001 3.535e-001 2.565e-001 2.234e-001 0.5 2.617e-001 3.346e-001 2.448e-001 2.055e-001 0.75 2.058e-001 2.608e-001 1.940e-001 1.626e-001 1 1.679e-001 2.106e-001 1.577e-001 1.354e-001 2 8.254e-002 1.040e-001 7.754e-002 6.604e-002 3 5.053e-002 6.070e-002 4.989e-002 4.101e-002 4 3.713e-002 4.539e-002 3.756e-002 2.844e-002
Source: Clamshell-SawpitRegion: USGS 2008 California Closest Distance: 54.95 km Amplitude Units: Acceleration (g) Magnitude: 6.70 Mw Fractile: 0.84 Column 1: Spectral Period Column 2: Acceleration (g) for: Weighted Mean of Attenuation Equations Column 3: Acceleration (g) for: Boore-Atkinson (2008) NGA USGS 2008 MRC Column 4: Acceleration (g) for: Campbell-Bozorgnia (2008) NGA USGS 2008 MRC Column 5: Acceleration (g) for: Chiou-Youngs (2007) NGA USGS 2008 MRC
1 2 3 4 5

File: N:\2018\18-81-134 SBCUSD, New Diesel Technology Center\-03\Site Specific Seismic Design\~_Gymnasium Expansion - Seismic Hazard Analysis.DSPDate modified: 11/02/2018 02:56:46 PM
EZ-FRISK 7.65 Build 004 Page 14 of 83
PGA 1.574e-001 2.043e-001 1.387e-001 1.293e-001 0.03 1.620e-001 2.061e-001 1.447e-001 1.351e-001 0.05 1.785e-001 2.166e-001 1.645e-001 1.544e-001 0.1 2.541e-001 2.965e-001 2.375e-001 2.282e-001 0.2 3.611e-001 4.569e-001 3.240e-001 3.024e-001 0.3 3.668e-001 4.801e-001 3.279e-001 2.924e-001 0.4 3.440e-001 4.543e-001 3.045e-001 2.730e-001 0.5 3.253e-001 4.346e-001 2.890e-001 2.524e-001 0.75 2.582e-001 3.465e-001 2.282e-001 2.000e-001 1 2.052e-001 2.672e-001 1.836e-001 1.646e-001 2 9.056e-002 1.130e-001 8.828e-002 7.043e-002 3 5.349e-002 6.197e-002 5.628e-002 4.222e-002 4 3.829e-002 4.353e-002 4.221e-002 2.914e-002
Fractile: Mean Column 1: Spectral Period Column 2: Acceleration (g) for: Weighted Mean of Attenuation Equations Column 3: Acceleration (g) for: Boore-Atkinson (2008) NGA USGS 2008 MRC Column 4: Acceleration (g) for: Campbell-Bozorgnia (2008) NGA USGS 2008 MRC Column 5: Acceleration (g) for: Chiou-Youngs (2007) NGA USGS 2008 MRC
1 2 3 4 5 PGA 1.039e-001 1.348e-001 9.153e-002 8.529e-002 0.03 1.069e-001 1.360e-001 9.550e-002 8.916e-002 0.05 1.178e-001 1.429e-001 1.086e-001 1.018e-001 0.1 1.674e-001 1.949e-001 1.567e-001 1.506e-001 0.2 2.383e-001 3.015e-001 2.138e-001 1.996e-001 0.3 2.416e-001 3.155e-001 2.164e-001 1.930e-001 0.4 2.273e-001 2.992e-001 2.026e-001 1.803e-001

File: N:\2018\18-81-134 SBCUSD, New Diesel Technology Center\-03\Site Specific Seismic Design\~_Gymnasium Expansion - Seismic Hazard Analysis.DSPDate modified: 11/02/2018 02:56:46 PM
EZ-FRISK 7.65 Build 004 Page 15 of 83
0.5 2.144e-001 2.849e-001 1.922e-001 1.660e-001 0.75 1.685e-001 2.246e-001 1.501e-001 1.306e-001 1 1.334e-001 1.731e-001 1.202e-001 1.068e-001 2 5.805e-002 7.195e-002 5.706e-002 4.515e-002 3 3.424e-002 3.953e-002 3.636e-002 2.685e-002 4 2.446e-002 2.774e-002 2.726e-002 1.840e-002
Source: CleghornRegion: USGS 2008 California Closest Distance: 16.10 km Amplitude Units: Acceleration (g) Magnitude: 6.80 Mw Fractile: 0.84 Column 1: Spectral Period Column 2: Acceleration (g) for: Weighted Mean of Attenuation Equations Column 3: Acceleration (g) for: Boore-Atkinson (2008) NGA USGS 2008 MRC Column 4: Acceleration (g) for: Campbell-Bozorgnia (2008) NGA USGS 2008 MRC Column 5: Acceleration (g) for: Chiou-Youngs (2007) NGA USGS 2008 MRC
1 2 3 4 5 PGA 4.123e-001 4.397e-001 3.837e-001 4.134e-001 0.03 4.342e-001 4.587e-001 4.040e-001 4.400e-001 0.05 4.865e-001 4.926e-001 4.644e-001 5.023e-001 0.1 7.020e-001 6.930e-001 6.980e-001 7.150e-001 0.2 9.223e-001 9.658e-001 8.938e-001 9.073e-001 0.3 8.963e-001 9.522e-001 8.553e-001 8.814e-001 0.4 8.608e-001 9.530e-001 8.102e-001 8.194e-001

File: N:\2018\18-81-134 SBCUSD, New Diesel Technology Center\-03\Site Specific Seismic Design\~_Gymnasium Expansion - Seismic Hazard Analysis.DSPDate modified: 11/02/2018 02:56:46 PM
EZ-FRISK 7.65 Build 004 Page 16 of 83
0.5 8.097e-001 9.136e-001 7.657e-001 7.499e-001 0.75 6.569e-001 7.322e-001 6.173e-001 6.212e-001 1 5.452e-001 5.902e-001 5.140e-001 5.315e-001 2 2.791e-001 2.980e-001 2.682e-001 2.712e-001 3 1.734e-001 1.742e-001 1.740e-001 1.720e-001 4 1.268e-001 1.286e-001 1.310e-001 1.206e-001
Fractile: Mean Column 1: Spectral Period Column 2: Acceleration (g) for: Weighted Mean of Attenuation Equations Column 3: Acceleration (g) for: Boore-Atkinson (2008) NGA USGS 2008 MRC Column 4: Acceleration (g) for: Campbell-Bozorgnia (2008) NGA USGS 2008 MRC Column 5: Acceleration (g) for: Chiou-Youngs (2007) NGA USGS 2008 MRC
1 2 3 4 5 PGA 2.720e-001 2.901e-001 2.532e-001 2.728e-001 0.03 2.865e-001 3.027e-001 2.666e-001 2.903e-001 0.05 3.210e-001 3.250e-001 3.064e-001 3.314e-001 0.1 4.626e-001 4.554e-001 4.606e-001 4.718e-001 0.2 6.085e-001 6.372e-001 5.897e-001 5.986e-001 0.3 5.905e-001 6.258e-001 5.643e-001 5.815e-001 0.4 5.705e-001 6.275e-001 5.389e-001 5.450e-001 0.5 5.379e-001 5.988e-001 5.131e-001 5.019e-001 0.75 4.309e-001 4.747e-001 4.079e-001 4.102e-001 1 3.558e-001 3.823e-001 3.374e-001 3.477e-001 2 1.792e-001 1.898e-001 1.734e-001 1.744e-001 3 1.110e-001 1.111e-001 1.124e-001 1.095e-001 4 8.092e-002 8.196e-002 8.461e-002 7.620e-002

File: N:\2018\18-81-134 SBCUSD, New Diesel Technology Center\-03\Site Specific Seismic Design\~_Gymnasium Expansion - Seismic Hazard Analysis.DSPDate modified: 11/02/2018 02:56:46 PM
EZ-FRISK 7.65 Build 004 Page 17 of 83
Source: CucamongaRegion: USGS 2008 California Closest Distance: 17.31 km Amplitude Units: Acceleration (g) Magnitude: 6.70 Mw Fractile: 0.84 Column 1: Spectral Period Column 2: Acceleration (g) for: Weighted Mean of Attenuation Equations Column 3: Acceleration (g) for: Boore-Atkinson (2008) NGA USGS 2008 MRC Column 4: Acceleration (g) for: Campbell-Bozorgnia (2008) NGA USGS 2008 MRC Column 5: Acceleration (g) for: Chiou-Youngs (2007) NGA USGS 2008 MRC
1 2 3 4 5 PGA 3.909e-001 4.086e-001 3.590e-001 4.050e-001 0.03 4.120e-001 4.270e-001 3.782e-001 4.308e-001 0.05 4.615e-001 4.572e-001 4.356e-001 4.917e-001 0.1 6.691e-001 6.473e-001 6.601e-001 6.999e-001 0.2 8.873e-001 9.296e-001 8.458e-001 8.865e-001 0.3 8.741e-001 9.586e-001 8.054e-001 8.581e-001 0.4 8.269e-001 9.276e-001 7.582e-001 7.950e-001 0.5 7.772e-001 8.929e-001 7.096e-001 7.290e-001 0.75 6.264e-001 7.221e-001 5.607e-001 5.965e-001 1 5.048e-001 5.546e-001 4.602e-001 4.995e-001 2 2.286e-001 2.340e-001 2.322e-001 2.197e-001 3 1.368e-001 1.284e-001 1.491e-001 1.330e-001 4 9.741e-002 8.839e-002 1.118e-001 9.201e-002

File: N:\2018\18-81-134 SBCUSD, New Diesel Technology Center\-03\Site Specific Seismic Design\~_Gymnasium Expansion - Seismic Hazard Analysis.DSPDate modified: 11/02/2018 02:56:46 PM
EZ-FRISK 7.65 Build 004 Page 18 of 83
Fractile: Mean Column 1: Spectral Period Column 2: Acceleration (g) for: Weighted Mean of Attenuation Equations Column 3: Acceleration (g) for: Boore-Atkinson (2008) NGA USGS 2008 MRC Column 4: Acceleration (g) for: Campbell-Bozorgnia (2008) NGA USGS 2008 MRC Column 5: Acceleration (g) for: Chiou-Youngs (2007) NGA USGS 2008 MRC
1 2 3 4 5 PGA 2.579e-001 2.696e-001 2.368e-001 2.672e-001 0.03 2.718e-001 2.817e-001 2.495e-001 2.842e-001 0.05 3.045e-001 3.017e-001 2.874e-001 3.244e-001 0.1 4.409e-001 4.254e-001 4.355e-001 4.618e-001 0.2 5.855e-001 6.134e-001 5.581e-001 5.849e-001 0.3 5.759e-001 6.300e-001 5.314e-001 5.662e-001 0.4 5.480e-001 6.108e-001 5.043e-001 5.288e-001 0.5 5.157e-001 5.853e-001 4.752e-001 4.867e-001 0.75 4.106e-001 4.681e-001 3.704e-001 3.932e-001 1 3.292e-001 3.593e-001 3.020e-001 3.263e-001 2 1.467e-001 1.490e-001 1.501e-001 1.411e-001 3 8.761e-002 8.188e-002 9.634e-002 8.461e-002 4 6.221e-002 5.633e-002 7.220e-002 5.810e-002
Source: ElsinoreRegion: USGS 2008 California Closest Distance: 43.43 km Amplitude Units: Acceleration (g) Magnitude: 7.85 Mw

File: N:\2018\18-81-134 SBCUSD, New Diesel Technology Center\-03\Site Specific Seismic Design\~_Gymnasium Expansion - Seismic Hazard Analysis.DSPDate modified: 11/02/2018 02:56:46 PM
EZ-FRISK 7.65 Build 004 Page 19 of 83
Fractile: 0.84 Column 1: Spectral Period Column 2: Acceleration (g) for: Weighted Mean of Attenuation Equations Column 3: Acceleration (g) for: Boore-Atkinson (2008) NGA USGS 2008 MRC Column 4: Acceleration (g) for: Campbell-Bozorgnia (2008) NGA USGS 2008 MRC Column 5: Acceleration (g) for: Chiou-Youngs (2007) NGA USGS 2008 MRC
1 2 3 4 5 PGA 3.142e-001 3.783e-001 2.445e-001 3.197e-001 0.03 3.312e-001 4.021e-001 2.542e-001 3.373e-001 0.05 3.657e-001 4.301e-001 2.846e-001 3.825e-001 0.1 4.928e-001 5.411e-001 3.879e-001 5.493e-001 0.2 6.156e-001 5.916e-001 5.328e-001 7.224e-001 0.3 6.279e-001 6.075e-001 5.615e-001 7.147e-001 0.4 6.085e-001 6.091e-001 5.435e-001 6.727e-001 0.5 6.029e-001 6.142e-001 5.732e-001 6.214e-001 0.75 5.563e-001 5.851e-001 5.566e-001 5.273e-001 1 4.950e-001 5.016e-001 5.201e-001 4.635e-001 2 3.081e-001 3.171e-001 3.507e-001 2.565e-001 3 2.236e-001 2.528e-001 2.468e-001 1.711e-001 4 1.687e-001 1.875e-001 1.941e-001 1.246e-001
Fractile: Mean Column 1: Spectral Period Column 2: Acceleration (g) for: Weighted Mean of Attenuation Equations Column 3: Acceleration (g) for: Boore-Atkinson (2008) NGA USGS 2008 MRC Column 4: Acceleration (g) for: Campbell-Bozorgnia (2008) NGA USGS 2008 MRC Column 5: Acceleration (g) for: Chiou-Youngs (2007) NGA USGS 2008 MRC

File: N:\2018\18-81-134 SBCUSD, New Diesel Technology Center\-03\Site Specific Seismic Design\~_Gymnasium Expansion - Seismic Hazard Analysis.DSPDate modified: 11/02/2018 02:56:46 PM
EZ-FRISK 7.65 Build 004 Page 20 of 83
1 2 3 4 5 PGA 2.073e-001 2.496e-001 1.613e-001 2.109e-001 0.03 2.185e-001 2.653e-001 1.677e-001 2.226e-001 0.05 2.413e-001 2.838e-001 1.878e-001 2.524e-001 0.1 3.247e-001 3.556e-001 2.559e-001 3.625e-001 0.2 4.062e-001 3.903e-001 3.515e-001 4.767e-001 0.3 4.138e-001 3.993e-001 3.705e-001 4.715e-001 0.4 4.034e-001 4.011e-001 3.615e-001 4.475e-001 0.5 4.003e-001 4.025e-001 3.824e-001 4.161e-001 0.75 3.649e-001 3.793e-001 3.669e-001 3.484e-001 1 3.231e-001 3.250e-001 3.408e-001 3.034e-001 2 1.979e-001 2.020e-001 2.267e-001 1.650e-001 3 1.432e-001 1.613e-001 1.594e-001 1.090e-001 4 1.079e-001 1.195e-001 1.254e-001 7.875e-002
Source: Elysian Park (Upper)Region: USGS 2008 California Closest Distance: 77.36 km Amplitude Units: Acceleration (g) Magnitude: 6.70 Mw Fractile: 0.84 Column 1: Spectral Period Column 2: Acceleration (g) for: Weighted Mean of Attenuation Equations Column 3: Acceleration (g) for: Boore-Atkinson (2008) NGA USGS 2008 MRC Column 4: Acceleration (g) for: Campbell-Bozorgnia (2008) NGA USGS 2008 MRC Column 5: Acceleration (g) for: Chiou-Youngs (2007) NGA USGS 2008 MRC
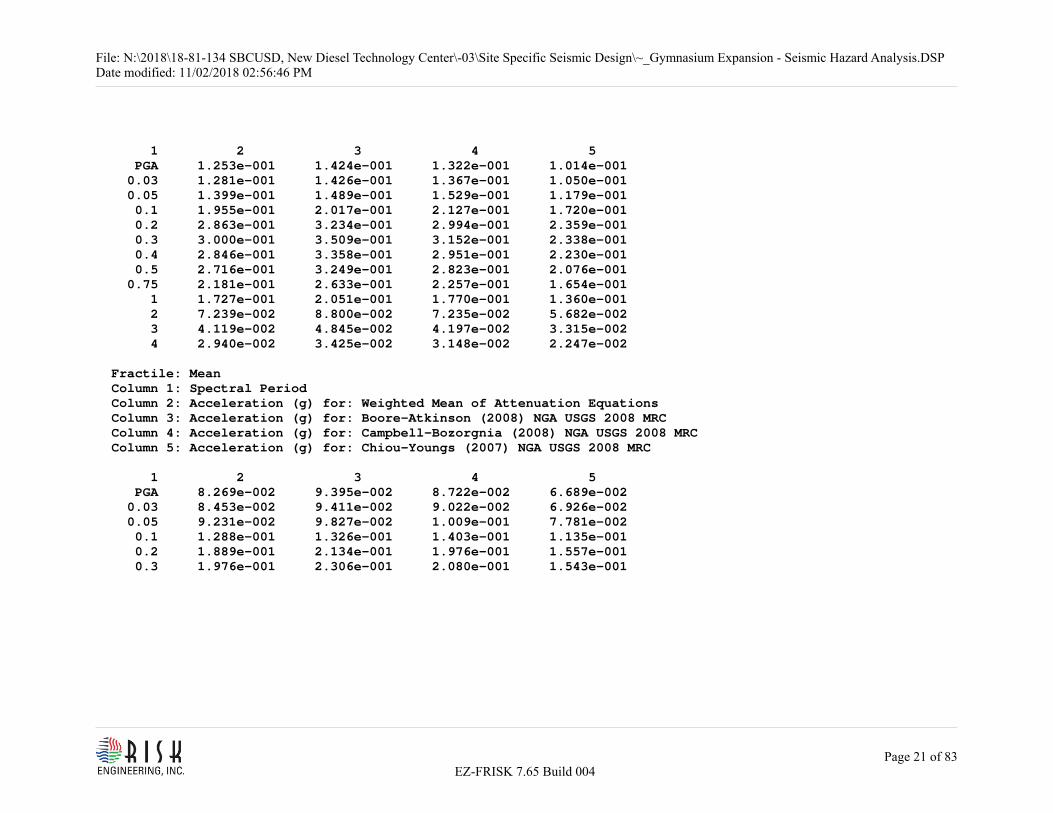
File: N:\2018\18-81-134 SBCUSD, New Diesel Technology Center\-03\Site Specific Seismic Design\~_Gymnasium Expansion - Seismic Hazard Analysis.DSPDate modified: 11/02/2018 02:56:46 PM
EZ-FRISK 7.65 Build 004 Page 21 of 83
1 2 3 4 5 PGA 1.253e-001 1.424e-001 1.322e-001 1.014e-001 0.03 1.281e-001 1.426e-001 1.367e-001 1.050e-001 0.05 1.399e-001 1.489e-001 1.529e-001 1.179e-001 0.1 1.955e-001 2.017e-001 2.127e-001 1.720e-001 0.2 2.863e-001 3.234e-001 2.994e-001 2.359e-001 0.3 3.000e-001 3.509e-001 3.152e-001 2.338e-001 0.4 2.846e-001 3.358e-001 2.951e-001 2.230e-001 0.5 2.716e-001 3.249e-001 2.823e-001 2.076e-001 0.75 2.181e-001 2.633e-001 2.257e-001 1.654e-001 1 1.727e-001 2.051e-001 1.770e-001 1.360e-001 2 7.239e-002 8.800e-002 7.235e-002 5.682e-002 3 4.119e-002 4.845e-002 4.197e-002 3.315e-002 4 2.940e-002 3.425e-002 3.148e-002 2.247e-002
Fractile: Mean Column 1: Spectral Period Column 2: Acceleration (g) for: Weighted Mean of Attenuation Equations Column 3: Acceleration (g) for: Boore-Atkinson (2008) NGA USGS 2008 MRC Column 4: Acceleration (g) for: Campbell-Bozorgnia (2008) NGA USGS 2008 MRC Column 5: Acceleration (g) for: Chiou-Youngs (2007) NGA USGS 2008 MRC
1 2 3 4 5 PGA 8.269e-002 9.395e-002 8.722e-002 6.689e-002 0.03 8.453e-002 9.411e-002 9.022e-002 6.926e-002 0.05 9.231e-002 9.827e-002 1.009e-001 7.781e-002 0.1 1.288e-001 1.326e-001 1.403e-001 1.135e-001 0.2 1.889e-001 2.134e-001 1.976e-001 1.557e-001 0.3 1.976e-001 2.306e-001 2.080e-001 1.543e-001

File: N:\2018\18-81-134 SBCUSD, New Diesel Technology Center\-03\Site Specific Seismic Design\~_Gymnasium Expansion - Seismic Hazard Analysis.DSPDate modified: 11/02/2018 02:56:46 PM
EZ-FRISK 7.65 Build 004 Page 22 of 83
0.4 1.881e-001 2.211e-001 1.963e-001 1.469e-001 0.5 1.790e-001 2.130e-001 1.877e-001 1.363e-001 0.75 1.423e-001 1.707e-001 1.485e-001 1.078e-001 1 1.123e-001 1.329e-001 1.159e-001 8.815e-002 2 4.641e-002 5.605e-002 4.676e-002 3.642e-002 3 2.636e-002 3.090e-002 2.711e-002 2.108e-002 4 1.878e-002 2.183e-002 2.032e-002 1.419e-002
Source: Eureka PeakRegion: USGS 2008 California Closest Distance: 79.99 km Amplitude Units: Acceleration (g) Magnitude: 6.70 Mw Fractile: 0.84 Column 1: Spectral Period Column 2: Acceleration (g) for: Weighted Mean of Attenuation Equations Column 3: Acceleration (g) for: Boore-Atkinson (2008) NGA USGS 2008 MRC Column 4: Acceleration (g) for: Campbell-Bozorgnia (2008) NGA USGS 2008 MRC Column 5: Acceleration (g) for: Chiou-Youngs (2007) NGA USGS 2008 MRC
1 2 3 4 5 PGA 1.042e-001 1.372e-001 9.865e-002 7.659e-002 0.03 1.062e-001 1.371e-001 1.023e-001 7.919e-002 0.05 1.160e-001 1.440e-001 1.149e-001 8.918e-002 0.1 1.619e-001 1.946e-001 1.602e-001 1.311e-001 0.2 2.368e-001 3.037e-001 2.249e-001 1.819e-001 0.3 2.440e-001 3.141e-001 2.359e-001 1.821e-001

File: N:\2018\18-81-134 SBCUSD, New Diesel Technology Center\-03\Site Specific Seismic Design\~_Gymnasium Expansion - Seismic Hazard Analysis.DSPDate modified: 11/02/2018 02:56:46 PM
EZ-FRISK 7.65 Build 004 Page 23 of 83
0.4 2.339e-001 3.071e-001 2.200e-001 1.747e-001 0.5 2.229e-001 2.948e-001 2.104e-001 1.633e-001 0.75 1.779e-001 2.342e-001 1.675e-001 1.319e-001 1 1.456e-001 1.913e-001 1.343e-001 1.112e-001 2 7.199e-002 9.677e-002 6.405e-002 5.515e-002 3 4.373e-002 5.602e-002 4.078e-002 3.438e-002 4 3.207e-002 4.172e-002 3.059e-002 2.389e-002
Fractile: Mean Column 1: Spectral Period Column 2: Acceleration (g) for: Weighted Mean of Attenuation Equations Column 3: Acceleration (g) for: Boore-Atkinson (2008) NGA USGS 2008 MRC Column 4: Acceleration (g) for: Campbell-Bozorgnia (2008) NGA USGS 2008 MRC Column 5: Acceleration (g) for: Chiou-Youngs (2007) NGA USGS 2008 MRC
1 2 3 4 5 PGA 6.873e-002 9.056e-002 6.509e-002 5.054e-002 0.03 7.006e-002 9.046e-002 6.747e-002 5.225e-002 0.05 7.657e-002 9.504e-002 7.583e-002 5.884e-002 0.1 1.067e-001 1.279e-001 1.057e-001 8.652e-002 0.2 1.563e-001 2.004e-001 1.484e-001 1.200e-001 0.3 1.607e-001 2.064e-001 1.557e-001 1.200e-001 0.4 1.545e-001 2.022e-001 1.463e-001 1.148e-001 0.5 1.467e-001 1.932e-001 1.397e-001 1.070e-001 0.75 1.160e-001 1.518e-001 1.101e-001 8.591e-002 1 9.462e-002 1.239e-001 8.789e-002 7.205e-002 2 4.613e-002 6.164e-002 4.140e-002 3.534e-002 3 2.798e-002 3.574e-002 2.635e-002 2.186e-002 4 2.048e-002 2.659e-002 1.975e-002 1.509e-002

File: N:\2018\18-81-134 SBCUSD, New Diesel Technology Center\-03\Site Specific Seismic Design\~_Gymnasium Expansion - Seismic Hazard Analysis.DSPDate modified: 11/02/2018 02:56:46 PM
EZ-FRISK 7.65 Build 004 Page 24 of 83
Source: Gravel Hills-Harper LkRegion: USGS 2008 California Closest Distance: 88.42 km Amplitude Units: Acceleration (g) Magnitude: 7.10 Mw Fractile: 0.84 Column 1: Spectral Period Column 2: Acceleration (g) for: Weighted Mean of Attenuation Equations Column 3: Acceleration (g) for: Boore-Atkinson (2008) NGA USGS 2008 MRC Column 4: Acceleration (g) for: Campbell-Bozorgnia (2008) NGA USGS 2008 MRC Column 5: Acceleration (g) for: Chiou-Youngs (2007) NGA USGS 2008 MRC
1 2 3 4 5 PGA 1.181e-001 1.499e-001 1.074e-001 9.703e-002 0.03 1.208e-001 1.512e-001 1.110e-001 1.002e-001 0.05 1.314e-001 1.586e-001 1.236e-001 1.122e-001 0.1 1.786e-001 2.058e-001 1.662e-001 1.638e-001 0.2 2.540e-001 2.948e-001 2.369e-001 2.302e-001 0.3 2.662e-001 3.100e-001 2.560e-001 2.327e-001 0.4 2.589e-001 3.120e-001 2.423e-001 2.223e-001 0.5 2.533e-001 3.080e-001 2.413e-001 2.106e-001 0.75 2.149e-001 2.628e-001 2.069e-001 1.750e-001 1 1.824e-001 2.219e-001 1.743e-001 1.511e-001 2 9.816e-002 1.220e-001 9.299e-002 7.949e-002 3 6.342e-002 7.770e-002 6.128e-002 5.128e-002 4 4.714e-002 5.813e-002 4.675e-002 3.653e-002

File: N:\2018\18-81-134 SBCUSD, New Diesel Technology Center\-03\Site Specific Seismic Design\~_Gymnasium Expansion - Seismic Hazard Analysis.DSPDate modified: 11/02/2018 02:56:46 PM
EZ-FRISK 7.65 Build 004 Page 25 of 83
Fractile: Mean Column 1: Spectral Period Column 2: Acceleration (g) for: Weighted Mean of Attenuation Equations Column 3: Acceleration (g) for: Boore-Atkinson (2008) NGA USGS 2008 MRC Column 4: Acceleration (g) for: Campbell-Bozorgnia (2008) NGA USGS 2008 MRC Column 5: Acceleration (g) for: Chiou-Youngs (2007) NGA USGS 2008 MRC
1 2 3 4 5 PGA 7.794e-002 9.894e-002 7.088e-002 6.402e-002 0.03 7.970e-002 9.977e-002 7.322e-002 6.610e-002 0.05 8.673e-002 1.046e-001 8.153e-002 7.401e-002 0.1 1.177e-001 1.352e-001 1.097e-001 1.081e-001 0.2 1.676e-001 1.945e-001 1.563e-001 1.519e-001 0.3 1.754e-001 2.037e-001 1.689e-001 1.535e-001 0.4 1.713e-001 2.054e-001 1.612e-001 1.473e-001 0.5 1.670e-001 2.019e-001 1.603e-001 1.390e-001 0.75 1.403e-001 1.704e-001 1.360e-001 1.145e-001 1 1.187e-001 1.438e-001 1.141e-001 9.822e-002 2 6.295e-002 7.771e-002 6.010e-002 5.103e-002 3 4.060e-002 4.956e-002 3.958e-002 3.264e-002 4 3.011e-002 3.704e-002 3.019e-002 2.308e-002
Source: Helendale-So LockhartRegion: USGS 2008 California Closest Distance: 45.30 km Amplitude Units: Acceleration (g)

File: N:\2018\18-81-134 SBCUSD, New Diesel Technology Center\-03\Site Specific Seismic Design\~_Gymnasium Expansion - Seismic Hazard Analysis.DSPDate modified: 11/02/2018 02:56:46 PM
EZ-FRISK 7.65 Build 004 Page 26 of 83
Magnitude: 7.40 Mw Fractile: 0.84 Column 1: Spectral Period Column 2: Acceleration (g) for: Weighted Mean of Attenuation Equations Column 3: Acceleration (g) for: Boore-Atkinson (2008) NGA USGS 2008 MRC Column 4: Acceleration (g) for: Campbell-Bozorgnia (2008) NGA USGS 2008 MRC Column 5: Acceleration (g) for: Chiou-Youngs (2007) NGA USGS 2008 MRC
1 2 3 4 5 PGA 2.508e-001 3.106e-001 2.061e-001 2.357e-001 0.03 2.619e-001 3.230e-001 2.148e-001 2.480e-001 0.05 2.896e-001 3.434e-001 2.424e-001 2.829e-001 0.1 3.994e-001 4.462e-001 3.396e-001 4.126e-001 0.2 5.191e-001 5.523e-001 4.633e-001 5.418e-001 0.3 5.219e-001 5.589e-001 4.780e-001 5.288e-001 0.4 5.004e-001 5.549e-001 4.549e-001 4.914e-001 0.5 4.866e-001 5.461e-001 4.598e-001 4.540e-001 0.75 4.223e-001 4.799e-001 4.111e-001 3.759e-001 1 3.631e-001 4.020e-001 3.624e-001 3.248e-001 2 2.059e-001 2.304e-001 2.144e-001 1.729e-001 3 1.397e-001 1.605e-001 1.454e-001 1.131e-001 4 1.044e-001 1.194e-001 1.124e-001 8.143e-002
Fractile: Mean Column 1: Spectral Period Column 2: Acceleration (g) for: Weighted Mean of Attenuation Equations Column 3: Acceleration (g) for: Boore-Atkinson (2008) NGA USGS 2008 MRC Column 4: Acceleration (g) for: Campbell-Bozorgnia (2008) NGA USGS 2008 MRC Column 5: Acceleration (g) for: Chiou-Youngs (2007) NGA USGS 2008 MRC
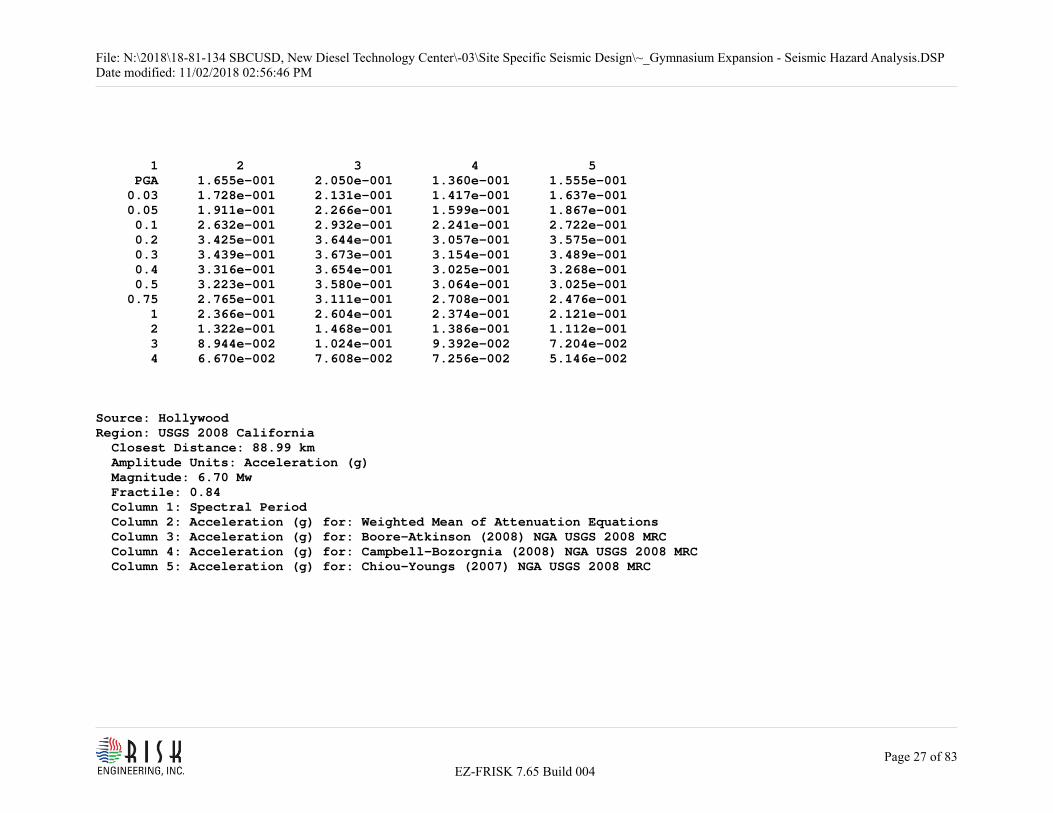
File: N:\2018\18-81-134 SBCUSD, New Diesel Technology Center\-03\Site Specific Seismic Design\~_Gymnasium Expansion - Seismic Hazard Analysis.DSPDate modified: 11/02/2018 02:56:46 PM
EZ-FRISK 7.65 Build 004 Page 27 of 83
1 2 3 4 5 PGA 1.655e-001 2.050e-001 1.360e-001 1.555e-001 0.03 1.728e-001 2.131e-001 1.417e-001 1.637e-001 0.05 1.911e-001 2.266e-001 1.599e-001 1.867e-001 0.1 2.632e-001 2.932e-001 2.241e-001 2.722e-001 0.2 3.425e-001 3.644e-001 3.057e-001 3.575e-001 0.3 3.439e-001 3.673e-001 3.154e-001 3.489e-001 0.4 3.316e-001 3.654e-001 3.025e-001 3.268e-001 0.5 3.223e-001 3.580e-001 3.064e-001 3.025e-001 0.75 2.765e-001 3.111e-001 2.708e-001 2.476e-001 1 2.366e-001 2.604e-001 2.374e-001 2.121e-001 2 1.322e-001 1.468e-001 1.386e-001 1.112e-001 3 8.944e-002 1.024e-001 9.392e-002 7.204e-002 4 6.670e-002 7.608e-002 7.256e-002 5.146e-002
Source: HollywoodRegion: USGS 2008 California Closest Distance: 88.99 km Amplitude Units: Acceleration (g) Magnitude: 6.70 Mw Fractile: 0.84 Column 1: Spectral Period Column 2: Acceleration (g) for: Weighted Mean of Attenuation Equations Column 3: Acceleration (g) for: Boore-Atkinson (2008) NGA USGS 2008 MRC Column 4: Acceleration (g) for: Campbell-Bozorgnia (2008) NGA USGS 2008 MRC Column 5: Acceleration (g) for: Chiou-Youngs (2007) NGA USGS 2008 MRC

File: N:\2018\18-81-134 SBCUSD, New Diesel Technology Center\-03\Site Specific Seismic Design\~_Gymnasium Expansion - Seismic Hazard Analysis.DSPDate modified: 11/02/2018 02:56:46 PM
EZ-FRISK 7.65 Build 004 Page 28 of 83
1 2 3 4 5 PGA 9.185e-002 1.190e-001 8.940e-002 6.714e-002 0.03 9.345e-002 1.187e-001 9.249e-002 6.915e-002 0.05 1.018e-001 1.245e-001 1.036e-001 7.739e-002 0.1 1.412e-001 1.675e-001 1.428e-001 1.133e-001 0.2 2.094e-001 2.656e-001 2.022e-001 1.603e-001 0.3 2.187e-001 2.789e-001 2.145e-001 1.627e-001 0.4 2.108e-001 2.746e-001 2.003e-001 1.574e-001 0.5 2.017e-001 2.652e-001 1.920e-001 1.480e-001 0.75 1.621e-001 2.126e-001 1.533e-001 1.205e-001 1 1.331e-001 1.745e-001 1.228e-001 1.020e-001 2 6.611e-002 8.892e-002 5.846e-002 5.096e-002 3 4.021e-002 5.158e-002 3.721e-002 3.183e-002 4 2.952e-002 3.850e-002 2.791e-002 2.214e-002
Fractile: Mean Column 1: Spectral Period Column 2: Acceleration (g) for: Weighted Mean of Attenuation Equations Column 3: Acceleration (g) for: Boore-Atkinson (2008) NGA USGS 2008 MRC Column 4: Acceleration (g) for: Campbell-Bozorgnia (2008) NGA USGS 2008 MRC Column 5: Acceleration (g) for: Chiou-Youngs (2007) NGA USGS 2008 MRC
1 2 3 4 5 PGA 6.061e-002 7.853e-002 5.899e-002 4.430e-002 0.03 6.166e-002 7.833e-002 6.103e-002 4.562e-002 0.05 6.717e-002 8.213e-002 6.832e-002 5.106e-002 0.1 9.302e-002 1.101e-001 9.421e-002 7.475e-002 0.2 1.381e-001 1.752e-001 1.334e-001 1.057e-001
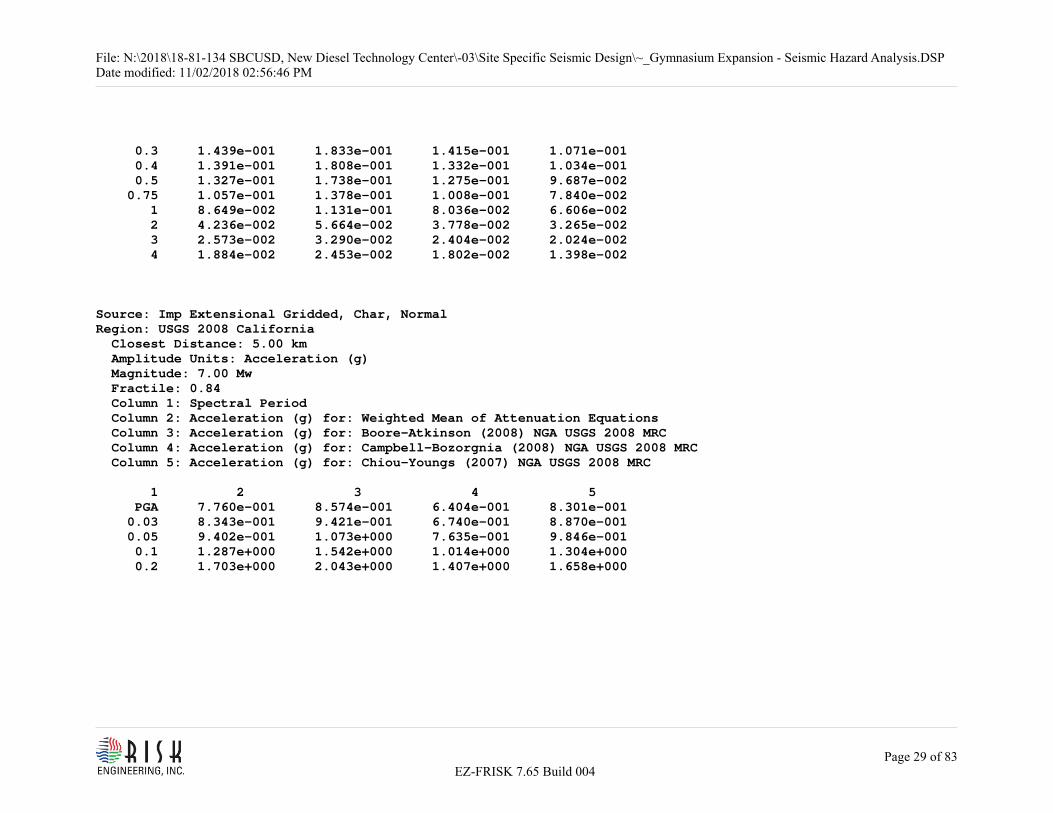
File: N:\2018\18-81-134 SBCUSD, New Diesel Technology Center\-03\Site Specific Seismic Design\~_Gymnasium Expansion - Seismic Hazard Analysis.DSPDate modified: 11/02/2018 02:56:46 PM
EZ-FRISK 7.65 Build 004 Page 29 of 83
0.3 1.439e-001 1.833e-001 1.415e-001 1.071e-001 0.4 1.391e-001 1.808e-001 1.332e-001 1.034e-001 0.5 1.327e-001 1.738e-001 1.275e-001 9.687e-002 0.75 1.057e-001 1.378e-001 1.008e-001 7.840e-002 1 8.649e-002 1.131e-001 8.036e-002 6.606e-002 2 4.236e-002 5.664e-002 3.778e-002 3.265e-002 3 2.573e-002 3.290e-002 2.404e-002 2.024e-002 4 1.884e-002 2.453e-002 1.802e-002 1.398e-002
Source: Imp Extensional Gridded, Char, NormalRegion: USGS 2008 California Closest Distance: 5.00 km Amplitude Units: Acceleration (g) Magnitude: 7.00 Mw Fractile: 0.84 Column 1: Spectral Period Column 2: Acceleration (g) for: Weighted Mean of Attenuation Equations Column 3: Acceleration (g) for: Boore-Atkinson (2008) NGA USGS 2008 MRC Column 4: Acceleration (g) for: Campbell-Bozorgnia (2008) NGA USGS 2008 MRC Column 5: Acceleration (g) for: Chiou-Youngs (2007) NGA USGS 2008 MRC
1 2 3 4 5 PGA 7.760e-001 8.574e-001 6.404e-001 8.301e-001 0.03 8.343e-001 9.421e-001 6.740e-001 8.870e-001 0.05 9.402e-001 1.073e+000 7.635e-001 9.846e-001 0.1 1.287e+000 1.542e+000 1.014e+000 1.304e+000 0.2 1.703e+000 2.043e+000 1.407e+000 1.658e+000

File: N:\2018\18-81-134 SBCUSD, New Diesel Technology Center\-03\Site Specific Seismic Design\~_Gymnasium Expansion - Seismic Hazard Analysis.DSPDate modified: 11/02/2018 02:56:46 PM
EZ-FRISK 7.65 Build 004 Page 30 of 83
0.3 1.750e+000 2.073e+000 1.472e+000 1.705e+000 0.4 1.783e+000 2.166e+000 1.505e+000 1.679e+000 0.5 1.747e+000 2.111e+000 1.520e+000 1.610e+000 0.75 1.451e+000 1.600e+000 1.326e+000 1.428e+000 1 1.225e+000 1.222e+000 1.160e+000 1.293e+000 2 6.632e-001 6.066e-001 6.821e-001 7.008e-001 3 4.174e-001 3.567e-001 4.546e-001 4.410e-001 4 3.078e-001 2.726e-001 3.454e-001 3.055e-001
Fractile: Mean Column 1: Spectral Period Column 2: Acceleration (g) for: Weighted Mean of Attenuation Equations Column 3: Acceleration (g) for: Boore-Atkinson (2008) NGA USGS 2008 MRC Column 4: Acceleration (g) for: Campbell-Bozorgnia (2008) NGA USGS 2008 MRC Column 5: Acceleration (g) for: Chiou-Youngs (2007) NGA USGS 2008 MRC
1 2 3 4 5 PGA 5.120e-001 5.658e-001 4.226e-001 5.477e-001 0.03 5.505e-001 6.216e-001 4.447e-001 5.853e-001 0.05 6.204e-001 7.077e-001 5.038e-001 6.496e-001 0.1 8.476e-001 1.013e+000 6.691e-001 8.603e-001 0.2 1.123e+000 1.348e+000 9.281e-001 1.094e+000 0.3 1.153e+000 1.362e+000 9.713e-001 1.125e+000 0.4 1.181e+000 1.426e+000 1.001e+000 1.117e+000 0.5 1.160e+000 1.383e+000 1.019e+000 1.079e+000 0.75 9.564e-001 1.037e+000 8.797e-001 9.525e-001 1 8.023e-001 7.914e-001 7.634e-001 8.520e-001 2 4.263e-001 3.864e-001 4.408e-001 4.516e-001 3 2.674e-001 2.275e-001 2.937e-001 2.809e-001

File: N:\2018\18-81-134 SBCUSD, New Diesel Technology Center\-03\Site Specific Seismic Design\~_Gymnasium Expansion - Seismic Hazard Analysis.DSPDate modified: 11/02/2018 02:56:46 PM
EZ-FRISK 7.65 Build 004 Page 31 of 83
4 1.966e-001 1.737e-001 2.230e-001 1.931e-001
Source: Imp Extensional Gridded, Char, Strike SlipRegion: USGS 2008 California Closest Distance: 5.00 km Amplitude Units: Acceleration (g) Magnitude: 7.00 Mw Fractile: 0.84 Column 1: Spectral Period Column 2: Acceleration (g) for: Weighted Mean of Attenuation Equations Column 3: Acceleration (g) for: Boore-Atkinson (2008) NGA USGS 2008 MRC Column 4: Acceleration (g) for: Campbell-Bozorgnia (2008) NGA USGS 2008 MRC Column 5: Acceleration (g) for: Chiou-Youngs (2007) NGA USGS 2008 MRC
1 2 3 4 5 PGA 9.164e-001 1.037e+000 6.964e-001 1.016e+000 0.03 9.864e-001 1.145e+000 7.293e-001 1.085e+000 0.05 1.097e+000 1.283e+000 8.186e-001 1.190e+000 0.1 1.455e+000 1.780e+000 1.055e+000 1.529e+000 0.2 1.858e+000 2.301e+000 1.346e+000 1.927e+000 0.3 1.923e+000 2.376e+000 1.406e+000 1.988e+000 0.4 1.970e+000 2.505e+000 1.450e+000 1.955e+000 0.5 1.932e+000 2.455e+000 1.474e+000 1.867e+000 0.75 1.676e+000 2.101e+000 1.296e+000 1.630e+000 1 1.432e+000 1.695e+000 1.141e+000 1.461e+000 2 7.887e-001 9.069e-001 6.804e-001 7.788e-001 3 5.030e-001 5.658e-001 4.546e-001 4.887e-001

File: N:\2018\18-81-134 SBCUSD, New Diesel Technology Center\-03\Site Specific Seismic Design\~_Gymnasium Expansion - Seismic Hazard Analysis.DSPDate modified: 11/02/2018 02:56:46 PM
EZ-FRISK 7.65 Build 004 Page 32 of 83
4 3.644e-001 4.096e-001 3.454e-001 3.383e-001
Fractile: Mean Column 1: Spectral Period Column 2: Acceleration (g) for: Weighted Mean of Attenuation Equations Column 3: Acceleration (g) for: Boore-Atkinson (2008) NGA USGS 2008 MRC Column 4: Acceleration (g) for: Campbell-Bozorgnia (2008) NGA USGS 2008 MRC Column 5: Acceleration (g) for: Chiou-Youngs (2007) NGA USGS 2008 MRC
1 2 3 4 5 PGA 6.047e-001 6.842e-001 4.595e-001 6.703e-001 0.03 6.508e-001 7.553e-001 4.812e-001 7.160e-001 0.05 7.240e-001 8.467e-001 5.401e-001 7.852e-001 0.1 9.582e-001 1.170e+000 6.960e-001 1.009e+000 0.2 1.226e+000 1.519e+000 8.879e-001 1.272e+000 0.3 1.267e+000 1.562e+000 9.277e-001 1.311e+000 0.4 1.305e+000 1.650e+000 9.646e-001 1.301e+000 0.5 1.283e+000 1.609e+000 9.884e-001 1.252e+000 0.75 1.104e+000 1.362e+000 8.606e-001 1.088e+000 1 9.373e-001 1.098e+000 7.509e-001 9.629e-001 2 5.064e-001 5.776e-001 4.398e-001 5.019e-001 3 3.220e-001 3.609e-001 2.937e-001 3.114e-001 4 2.326e-001 2.610e-001 2.230e-001 2.138e-001
Source: Imp Extensional Gridded, GR, NormalRegion: USGS 2008 California Closest Distance: 5.01 km

File: N:\2018\18-81-134 SBCUSD, New Diesel Technology Center\-03\Site Specific Seismic Design\~_Gymnasium Expansion - Seismic Hazard Analysis.DSPDate modified: 11/02/2018 02:56:46 PM
EZ-FRISK 7.65 Build 004 Page 33 of 83
Amplitude Units: Acceleration (g) Magnitude: 7.00 Mw Fractile: 0.84 Column 1: Spectral Period Column 2: Acceleration (g) for: Weighted Mean of Attenuation Equations Column 3: Acceleration (g) for: Boore-Atkinson (2008) NGA USGS 2008 MRC Column 4: Acceleration (g) for: Campbell-Bozorgnia (2008) NGA USGS 2008 MRC Column 5: Acceleration (g) for: Chiou-Youngs (2007) NGA USGS 2008 MRC
1 2 3 4 5 PGA 7.724e-001 8.480e-001 6.399e-001 8.293e-001 0.03 8.302e-001 9.310e-001 6.734e-001 8.861e-001 0.05 9.353e-001 1.059e+000 7.629e-001 9.837e-001 0.1 1.282e+000 1.530e+000 1.014e+000 1.303e+000 0.2 1.698e+000 2.032e+000 1.406e+000 1.657e+000 0.3 1.746e+000 2.062e+000 1.471e+000 1.704e+000 0.4 1.778e+000 2.154e+000 1.503e+000 1.678e+000 0.5 1.742e+000 2.100e+000 1.518e+000 1.608e+000 0.75 1.447e+000 1.591e+000 1.324e+000 1.426e+000 1 1.222e+000 1.215e+000 1.159e+000 1.292e+000 2 6.616e-001 6.038e-001 6.811e-001 6.999e-001 3 4.165e-001 3.551e-001 4.539e-001 4.403e-001 4 3.071e-001 2.714e-001 3.449e-001 3.051e-001
Fractile: Mean Column 1: Spectral Period Column 2: Acceleration (g) for: Weighted Mean of Attenuation Equations Column 3: Acceleration (g) for: Boore-Atkinson (2008) NGA USGS 2008 MRC Column 4: Acceleration (g) for: Campbell-Bozorgnia (2008) NGA USGS 2008 MRC

File: N:\2018\18-81-134 SBCUSD, New Diesel Technology Center\-03\Site Specific Seismic Design\~_Gymnasium Expansion - Seismic Hazard Analysis.DSPDate modified: 11/02/2018 02:56:46 PM
EZ-FRISK 7.65 Build 004 Page 34 of 83
Column 5: Acceleration (g) for: Chiou-Youngs (2007) NGA USGS 2008 MRC
1 2 3 4 5 PGA 5.096e-001 5.595e-001 4.222e-001 5.472e-001 0.03 5.478e-001 6.143e-001 4.443e-001 5.847e-001 0.05 6.171e-001 6.990e-001 5.034e-001 6.490e-001 0.1 8.446e-001 1.005e+000 6.689e-001 8.596e-001 0.2 1.121e+000 1.341e+000 9.278e-001 1.093e+000 0.3 1.150e+000 1.355e+000 9.707e-001 1.124e+000 0.4 1.178e+000 1.419e+000 9.999e-001 1.116e+000 0.5 1.157e+000 1.376e+000 1.018e+000 1.078e+000 0.75 9.538e-001 1.032e+000 8.786e-001 9.513e-001 1 8.003e-001 7.874e-001 7.624e-001 8.510e-001 2 4.253e-001 3.846e-001 4.402e-001 4.510e-001 3 2.668e-001 2.265e-001 2.932e-001 2.805e-001 4 1.962e-001 1.730e-001 2.227e-001 1.928e-001
Source: Imp Extensional Gridded, GR, Strike SlipRegion: USGS 2008 California Closest Distance: 5.01 km Amplitude Units: Acceleration (g) Magnitude: 7.00 Mw Fractile: 0.84 Column 1: Spectral Period Column 2: Acceleration (g) for: Weighted Mean of Attenuation Equations Column 3: Acceleration (g) for: Boore-Atkinson (2008) NGA USGS 2008 MRC Column 4: Acceleration (g) for: Campbell-Bozorgnia (2008) NGA USGS 2008 MRC

File: N:\2018\18-81-134 SBCUSD, New Diesel Technology Center\-03\Site Specific Seismic Design\~_Gymnasium Expansion - Seismic Hazard Analysis.DSPDate modified: 11/02/2018 02:56:46 PM
EZ-FRISK 7.65 Build 004 Page 35 of 83
Column 5: Acceleration (g) for: Chiou-Youngs (2007) NGA USGS 2008 MRC
1 2 3 4 5 PGA 9.121e-001 1.026e+000 6.958e-001 1.015e+000 0.03 9.814e-001 1.131e+000 7.287e-001 1.084e+000 0.05 1.091e+000 1.267e+000 8.179e-001 1.189e+000 0.1 1.449e+000 1.766e+000 1.055e+000 1.528e+000 0.2 1.853e+000 2.289e+000 1.345e+000 1.926e+000 0.3 1.918e+000 2.364e+000 1.405e+000 1.986e+000 0.4 1.965e+000 2.492e+000 1.449e+000 1.954e+000 0.5 1.927e+000 2.443e+000 1.473e+000 1.865e+000 0.75 1.671e+000 2.090e+000 1.294e+000 1.628e+000 1 1.428e+000 1.686e+000 1.139e+000 1.459e+000 2 7.866e-001 9.027e-001 6.795e-001 7.777e-001 3 5.017e-001 5.632e-001 4.539e-001 4.880e-001 4 3.635e-001 4.078e-001 3.449e-001 3.378e-001
Fractile: Mean Column 1: Spectral Period Column 2: Acceleration (g) for: Weighted Mean of Attenuation Equations Column 3: Acceleration (g) for: Boore-Atkinson (2008) NGA USGS 2008 MRC Column 4: Acceleration (g) for: Campbell-Bozorgnia (2008) NGA USGS 2008 MRC Column 5: Acceleration (g) for: Chiou-Youngs (2007) NGA USGS 2008 MRC
1 2 3 4 5 PGA 6.018e-001 6.767e-001 4.591e-001 6.697e-001 0.03 6.475e-001 7.464e-001 4.808e-001 7.153e-001 0.05 7.201e-001 8.362e-001 5.397e-001 7.845e-001 0.1 9.547e-001 1.160e+000 6.958e-001 1.008e+000

File: N:\2018\18-81-134 SBCUSD, New Diesel Technology Center\-03\Site Specific Seismic Design\~_Gymnasium Expansion - Seismic Hazard Analysis.DSPDate modified: 11/02/2018 02:56:46 PM
EZ-FRISK 7.65 Build 004 Page 36 of 83
0.2 1.223e+000 1.510e+000 8.876e-001 1.271e+000 0.3 1.264e+000 1.554e+000 9.272e-001 1.310e+000 0.4 1.301e+000 1.641e+000 9.638e-001 1.299e+000 0.5 1.279e+000 1.601e+000 9.874e-001 1.250e+000 0.75 1.100e+000 1.355e+000 8.596e-001 1.087e+000 1 9.347e-001 1.092e+000 7.500e-001 9.617e-001 2 5.051e-001 5.749e-001 4.392e-001 5.012e-001 3 3.212e-001 3.593e-001 2.932e-001 3.110e-001 4 2.320e-001 2.599e-001 2.227e-001 2.135e-001
Source: Johnson Valley (No)Region: USGS 2008 California Closest Distance: 68.98 km Amplitude Units: Acceleration (g) Magnitude: 6.90 Mw Fractile: 0.84 Column 1: Spectral Period Column 2: Acceleration (g) for: Weighted Mean of Attenuation Equations Column 3: Acceleration (g) for: Boore-Atkinson (2008) NGA USGS 2008 MRC Column 4: Acceleration (g) for: Campbell-Bozorgnia (2008) NGA USGS 2008 MRC Column 5: Acceleration (g) for: Chiou-Youngs (2007) NGA USGS 2008 MRC
1 2 3 4 5 PGA 1.375e-001 1.821e-001 1.224e-001 1.082e-001 0.03 1.408e-001 1.829e-001 1.271e-001 1.125e-001 0.05 1.542e-001 1.921e-001 1.431e-001 1.275e-001 0.1 2.146e-001 2.561e-001 1.997e-001 1.879e-001

File: N:\2018\18-81-134 SBCUSD, New Diesel Technology Center\-03\Site Specific Seismic Design\~_Gymnasium Expansion - Seismic Hazard Analysis.DSPDate modified: 11/02/2018 02:56:46 PM
EZ-FRISK 7.65 Build 004 Page 37 of 83
0.2 3.040e-001 3.785e-001 2.782e-001 2.552e-001 0.3 3.092e-001 3.861e-001 2.905e-001 2.512e-001 0.4 2.965e-001 3.811e-001 2.722e-001 2.362e-001 0.5 2.842e-001 3.675e-001 2.645e-001 2.206e-001 0.75 2.314e-001 2.977e-001 2.175e-001 1.790e-001 1 1.919e-001 2.448e-001 1.791e-001 1.519e-001 2 9.830e-002 1.273e-001 9.067e-002 7.695e-002 3 6.132e-002 7.645e-002 5.877e-002 4.874e-002 4 4.540e-002 5.744e-002 4.446e-002 3.430e-002
Fractile: Mean Column 1: Spectral Period Column 2: Acceleration (g) for: Weighted Mean of Attenuation Equations Column 3: Acceleration (g) for: Boore-Atkinson (2008) NGA USGS 2008 MRC Column 4: Acceleration (g) for: Campbell-Bozorgnia (2008) NGA USGS 2008 MRC Column 5: Acceleration (g) for: Chiou-Youngs (2007) NGA USGS 2008 MRC
1 2 3 4 5 PGA 9.075e-002 1.201e-001 8.075e-002 7.136e-002 0.03 9.292e-002 1.207e-001 8.386e-002 7.420e-002 0.05 1.018e-001 1.268e-001 9.442e-002 8.413e-002 0.1 1.414e-001 1.683e-001 1.318e-001 1.240e-001 0.2 2.006e-001 2.497e-001 1.836e-001 1.684e-001 0.3 2.037e-001 2.537e-001 1.917e-001 1.657e-001 0.4 1.961e-001 2.509e-001 1.810e-001 1.563e-001 0.5 1.874e-001 2.409e-001 1.758e-001 1.454e-001 0.75 1.510e-001 1.930e-001 1.430e-001 1.170e-001 1 1.248e-001 1.586e-001 1.172e-001 9.868e-002 2 6.302e-002 8.107e-002 5.860e-002 4.938e-002

File: N:\2018\18-81-134 SBCUSD, New Diesel Technology Center\-03\Site Specific Seismic Design\~_Gymnasium Expansion - Seismic Hazard Analysis.DSPDate modified: 11/02/2018 02:56:46 PM
EZ-FRISK 7.65 Build 004 Page 38 of 83
3 3.925e-002 4.877e-002 3.796e-002 3.101e-002 4 2.899e-002 3.661e-002 2.871e-002 2.167e-002
Source: LandersRegion: USGS 2008 California Closest Distance: 76.41 km Amplitude Units: Acceleration (g) Magnitude: 7.40 Mw Fractile: 0.84 Column 1: Spectral Period Column 2: Acceleration (g) for: Weighted Mean of Attenuation Equations Column 3: Acceleration (g) for: Boore-Atkinson (2008) NGA USGS 2008 MRC Column 4: Acceleration (g) for: Campbell-Bozorgnia (2008) NGA USGS 2008 MRC Column 5: Acceleration (g) for: Chiou-Youngs (2007) NGA USGS 2008 MRC
1 2 3 4 5 PGA 1.627e-001 2.054e-001 1.376e-001 1.452e-001 0.03 1.679e-001 2.104e-001 1.423e-001 1.509e-001 0.05 1.835e-001 2.221e-001 1.585e-001 1.699e-001 0.1 2.475e-001 2.823e-001 2.121e-001 2.480e-001 0.2 3.347e-001 3.626e-001 3.006e-001 3.408e-001 0.3 3.474e-001 3.762e-001 3.250e-001 3.409e-001 0.4 3.367e-001 3.786e-001 3.102e-001 3.213e-001 0.5 3.326e-001 3.773e-001 3.169e-001 3.035e-001 0.75 2.917e-001 3.359e-001 2.859e-001 2.533e-001 1 2.527e-001 2.875e-001 2.505e-001 2.200e-001 2 1.438e-001 1.670e-001 1.461e-001 1.183e-001

File: N:\2018\18-81-134 SBCUSD, New Diesel Technology Center\-03\Site Specific Seismic Design\~_Gymnasium Expansion - Seismic Hazard Analysis.DSPDate modified: 11/02/2018 02:56:46 PM
EZ-FRISK 7.65 Build 004 Page 39 of 83
3 9.735e-002 1.157e-001 9.883e-002 7.751e-002 4 7.264e-002 8.569e-002 7.639e-002 5.584e-002
Fractile: Mean Column 1: Spectral Period Column 2: Acceleration (g) for: Weighted Mean of Attenuation Equations Column 3: Acceleration (g) for: Boore-Atkinson (2008) NGA USGS 2008 MRC Column 4: Acceleration (g) for: Campbell-Bozorgnia (2008) NGA USGS 2008 MRC Column 5: Acceleration (g) for: Chiou-Youngs (2007) NGA USGS 2008 MRC
1 2 3 4 5 PGA 1.074e-001 1.355e-001 9.082e-002 9.579e-002 0.03 1.108e-001 1.388e-001 9.392e-002 9.954e-002 0.05 1.211e-001 1.466e-001 1.046e-001 1.121e-001 0.1 1.630e-001 1.855e-001 1.400e-001 1.636e-001 0.2 2.208e-001 2.392e-001 1.984e-001 2.249e-001 0.3 2.289e-001 2.472e-001 2.145e-001 2.250e-001 0.4 2.231e-001 2.493e-001 2.064e-001 2.137e-001 0.5 2.197e-001 2.473e-001 2.107e-001 2.011e-001 0.75 1.907e-001 2.177e-001 1.881e-001 1.662e-001 1 1.645e-001 1.863e-001 1.640e-001 1.433e-001 2 9.225e-002 1.063e-001 9.441e-002 7.598e-002 3 6.233e-002 7.380e-002 6.384e-002 4.935e-002 4 4.641e-002 5.461e-002 4.932e-002 3.529e-002
Source: Lenwood-Lockhart-Old Woman SpringsRegion: USGS 2008 California

File: N:\2018\18-81-134 SBCUSD, New Diesel Technology Center\-03\Site Specific Seismic Design\~_Gymnasium Expansion - Seismic Hazard Analysis.DSPDate modified: 11/02/2018 02:56:46 PM
EZ-FRISK 7.65 Build 004 Page 40 of 83
Closest Distance: 62.06 km Amplitude Units: Acceleration (g) Magnitude: 7.50 Mw Fractile: 0.84 Column 1: Spectral Period Column 2: Acceleration (g) for: Weighted Mean of Attenuation Equations Column 3: Acceleration (g) for: Boore-Atkinson (2008) NGA USGS 2008 MRC Column 4: Acceleration (g) for: Campbell-Bozorgnia (2008) NGA USGS 2008 MRC Column 5: Acceleration (g) for: Chiou-Youngs (2007) NGA USGS 2008 MRC
1 2 3 4 5 PGA 2.057e-001 2.585e-001 1.681e-001 1.905e-001 0.03 2.137e-001 2.676e-001 1.744e-001 1.992e-001 0.05 2.348e-001 2.836e-001 1.950e-001 2.256e-001 0.1 3.180e-001 3.606e-001 2.643e-001 3.292e-001 0.2 4.179e-001 4.415e-001 3.694e-001 4.426e-001 0.3 4.280e-001 4.526e-001 3.937e-001 4.377e-001 0.4 4.132e-001 4.532e-001 3.765e-001 4.099e-001 0.5 4.069e-001 4.512e-001 3.865e-001 3.829e-001 0.75 3.595e-001 4.056e-001 3.537e-001 3.191e-001 1 3.126e-001 3.460e-001 3.145e-001 2.771e-001 2 1.809e-001 2.038e-001 1.897e-001 1.493e-001 3 1.244e-001 1.456e-001 1.296e-001 9.818e-002 4 9.309e-002 1.077e-001 1.006e-001 7.092e-002
Fractile: Mean Column 1: Spectral Period Column 2: Acceleration (g) for: Weighted Mean of Attenuation Equations Column 3: Acceleration (g) for: Boore-Atkinson (2008) NGA USGS 2008 MRC

File: N:\2018\18-81-134 SBCUSD, New Diesel Technology Center\-03\Site Specific Seismic Design\~_Gymnasium Expansion - Seismic Hazard Analysis.DSPDate modified: 11/02/2018 02:56:46 PM
EZ-FRISK 7.65 Build 004 Page 41 of 83
Column 4: Acceleration (g) for: Campbell-Bozorgnia (2008) NGA USGS 2008 MRC Column 5: Acceleration (g) for: Chiou-Youngs (2007) NGA USGS 2008 MRC
1 2 3 4 5 PGA 1.357e-001 1.706e-001 1.109e-001 1.257e-001 0.03 1.410e-001 1.765e-001 1.151e-001 1.314e-001 0.05 1.549e-001 1.872e-001 1.287e-001 1.489e-001 0.1 2.095e-001 2.370e-001 1.744e-001 2.172e-001 0.2 2.757e-001 2.913e-001 2.438e-001 2.921e-001 0.3 2.820e-001 2.975e-001 2.598e-001 2.888e-001 0.4 2.738e-001 2.984e-001 2.504e-001 2.726e-001 0.5 2.692e-001 2.957e-001 2.572e-001 2.545e-001 0.75 2.352e-001 2.630e-001 2.328e-001 2.098e-001 1 2.036e-001 2.242e-001 2.060e-001 1.808e-001 2 1.161e-001 1.298e-001 1.226e-001 9.596e-002 3 7.970e-002 9.285e-002 8.372e-002 6.252e-002 4 5.948e-002 6.866e-002 6.496e-002 4.482e-002
Source: Mojave Shear GriddedRegion: USGS 2008 California Closest Distance: 41.35 km Amplitude Units: Acceleration (g) Magnitude: 7.60 Mw Fractile: 0.84 Column 1: Spectral Period Column 2: Acceleration (g) for: Weighted Mean of Attenuation Equations Column 3: Acceleration (g) for: Boore-Atkinson (2008) NGA USGS 2008 MRC
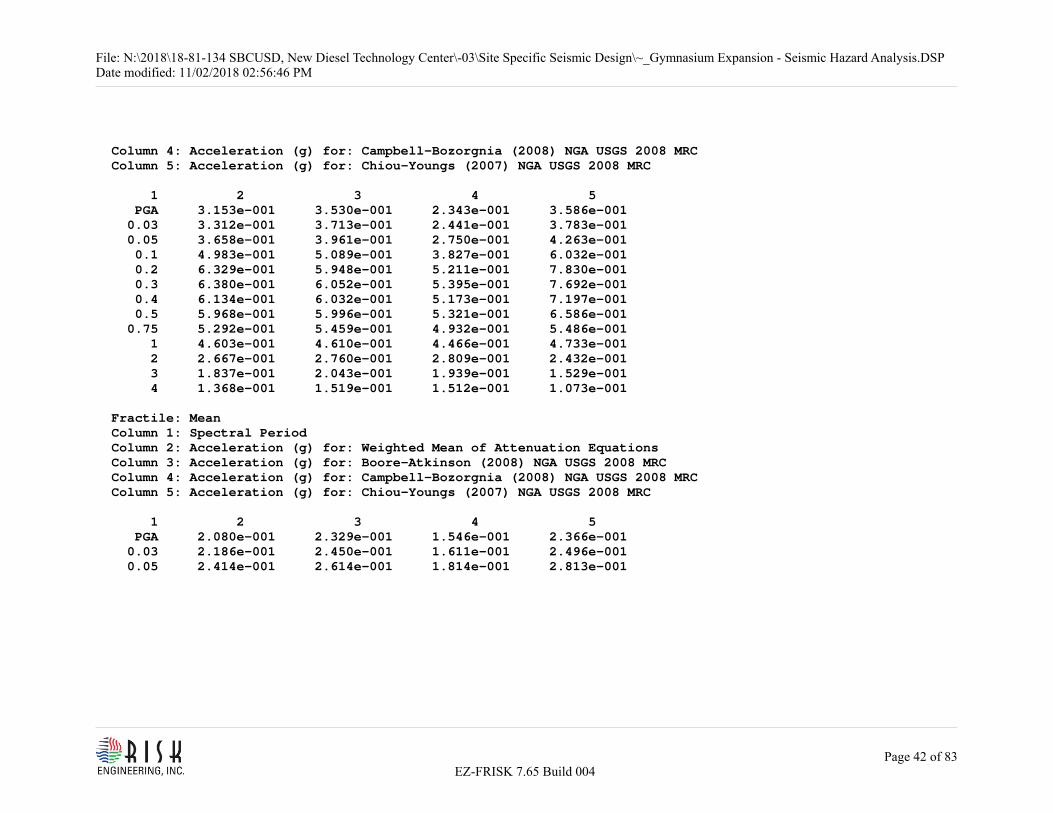
File: N:\2018\18-81-134 SBCUSD, New Diesel Technology Center\-03\Site Specific Seismic Design\~_Gymnasium Expansion - Seismic Hazard Analysis.DSPDate modified: 11/02/2018 02:56:46 PM
EZ-FRISK 7.65 Build 004 Page 42 of 83
Column 4: Acceleration (g) for: Campbell-Bozorgnia (2008) NGA USGS 2008 MRC Column 5: Acceleration (g) for: Chiou-Youngs (2007) NGA USGS 2008 MRC
1 2 3 4 5 PGA 3.153e-001 3.530e-001 2.343e-001 3.586e-001 0.03 3.312e-001 3.713e-001 2.441e-001 3.783e-001 0.05 3.658e-001 3.961e-001 2.750e-001 4.263e-001 0.1 4.983e-001 5.089e-001 3.827e-001 6.032e-001 0.2 6.329e-001 5.948e-001 5.211e-001 7.830e-001 0.3 6.380e-001 6.052e-001 5.395e-001 7.692e-001 0.4 6.134e-001 6.032e-001 5.173e-001 7.197e-001 0.5 5.968e-001 5.996e-001 5.321e-001 6.586e-001 0.75 5.292e-001 5.459e-001 4.932e-001 5.486e-001 1 4.603e-001 4.610e-001 4.466e-001 4.733e-001 2 2.667e-001 2.760e-001 2.809e-001 2.432e-001 3 1.837e-001 2.043e-001 1.939e-001 1.529e-001 4 1.368e-001 1.519e-001 1.512e-001 1.073e-001
Fractile: Mean Column 1: Spectral Period Column 2: Acceleration (g) for: Weighted Mean of Attenuation Equations Column 3: Acceleration (g) for: Boore-Atkinson (2008) NGA USGS 2008 MRC Column 4: Acceleration (g) for: Campbell-Bozorgnia (2008) NGA USGS 2008 MRC Column 5: Acceleration (g) for: Chiou-Youngs (2007) NGA USGS 2008 MRC
1 2 3 4 5 PGA 2.080e-001 2.329e-001 1.546e-001 2.366e-001 0.03 2.186e-001 2.450e-001 1.611e-001 2.496e-001 0.05 2.414e-001 2.614e-001 1.814e-001 2.813e-001

File: N:\2018\18-81-134 SBCUSD, New Diesel Technology Center\-03\Site Specific Seismic Design\~_Gymnasium Expansion - Seismic Hazard Analysis.DSPDate modified: 11/02/2018 02:56:46 PM
EZ-FRISK 7.65 Build 004 Page 43 of 83
0.1 3.283e-001 3.344e-001 2.525e-001 3.980e-001 0.2 4.176e-001 3.925e-001 3.438e-001 5.166e-001 0.3 4.204e-001 3.978e-001 3.560e-001 5.075e-001 0.4 4.066e-001 3.972e-001 3.440e-001 4.787e-001 0.5 3.964e-001 3.930e-001 3.549e-001 4.414e-001 0.75 3.472e-001 3.539e-001 3.250e-001 3.627e-001 1 3.004e-001 2.987e-001 2.926e-001 3.099e-001 2 1.713e-001 1.758e-001 1.816e-001 1.565e-001 3 1.177e-001 1.303e-001 1.253e-001 9.737e-002 4 8.740e-002 9.680e-002 9.763e-002 6.779e-002
Source: Newport-InglewoodRegion: USGS 2008 California Closest Distance: 84.08 km Amplitude Units: Acceleration (g) Magnitude: 7.50 Mw Fractile: 0.84 Column 1: Spectral Period Column 2: Acceleration (g) for: Weighted Mean of Attenuation Equations Column 3: Acceleration (g) for: Boore-Atkinson (2008) NGA USGS 2008 MRC Column 4: Acceleration (g) for: Campbell-Bozorgnia (2008) NGA USGS 2008 MRC Column 5: Acceleration (g) for: Chiou-Youngs (2007) NGA USGS 2008 MRC
1 2 3 4 5 PGA 1.565e-001 1.941e-001 1.332e-001 1.425e-001 0.03 1.614e-001 1.993e-001 1.374e-001 1.477e-001 0.05 1.760e-001 2.104e-001 1.523e-001 1.654e-001

File: N:\2018\18-81-134 SBCUSD, New Diesel Technology Center\-03\Site Specific Seismic Design\~_Gymnasium Expansion - Seismic Hazard Analysis.DSPDate modified: 11/02/2018 02:56:46 PM
EZ-FRISK 7.65 Build 004 Page 44 of 83
0.1 2.350e-001 2.639e-001 2.006e-001 2.406e-001 0.2 3.179e-001 3.317e-001 2.870e-001 3.350e-001 0.3 3.337e-001 3.479e-001 3.149e-001 3.386e-001 0.4 3.255e-001 3.532e-001 3.020e-001 3.214e-001 0.5 3.243e-001 3.560e-001 3.120e-001 3.051e-001 0.75 2.895e-001 3.246e-001 2.872e-001 2.569e-001 1 2.535e-001 2.815e-001 2.547e-001 2.245e-001 2 1.475e-001 1.678e-001 1.525e-001 1.223e-001 3 1.014e-001 1.196e-001 1.041e-001 8.065e-002 4 7.576e-002 8.820e-002 8.078e-002 5.832e-002
Fractile: Mean Column 1: Spectral Period Column 2: Acceleration (g) for: Weighted Mean of Attenuation Equations Column 3: Acceleration (g) for: Boore-Atkinson (2008) NGA USGS 2008 MRC Column 4: Acceleration (g) for: Campbell-Bozorgnia (2008) NGA USGS 2008 MRC Column 5: Acceleration (g) for: Chiou-Youngs (2007) NGA USGS 2008 MRC
1 2 3 4 5 PGA 1.033e-001 1.281e-001 8.787e-002 9.399e-002 0.03 1.065e-001 1.315e-001 9.068e-002 9.742e-002 0.05 1.161e-001 1.388e-001 1.005e-001 1.092e-001 0.1 1.548e-001 1.734e-001 1.324e-001 1.588e-001 0.2 2.097e-001 2.189e-001 1.894e-001 2.210e-001 0.3 2.199e-001 2.286e-001 2.077e-001 2.234e-001 0.4 2.157e-001 2.326e-001 2.008e-001 2.138e-001 0.5 2.143e-001 2.333e-001 2.074e-001 2.022e-001 0.75 1.893e-001 2.104e-001 1.890e-001 1.686e-001 1 1.651e-001 1.824e-001 1.667e-001 1.463e-001

File: N:\2018\18-81-134 SBCUSD, New Diesel Technology Center\-03\Site Specific Seismic Design\~_Gymnasium Expansion - Seismic Hazard Analysis.DSPDate modified: 11/02/2018 02:56:46 PM
EZ-FRISK 7.65 Build 004 Page 45 of 83
2 9.466e-002 1.069e-001 9.858e-002 7.857e-002 3 6.494e-002 7.627e-002 6.723e-002 5.135e-002 4 4.840e-002 5.621e-002 5.216e-002 3.686e-002
Source: North Frontal (East)Region: USGS 2008 California Closest Distance: 44.27 km Amplitude Units: Acceleration (g) Magnitude: 7.00 Mw Fractile: 0.84 Column 1: Spectral Period Column 2: Acceleration (g) for: Weighted Mean of Attenuation Equations Column 3: Acceleration (g) for: Boore-Atkinson (2008) NGA USGS 2008 MRC Column 4: Acceleration (g) for: Campbell-Bozorgnia (2008) NGA USGS 2008 MRC Column 5: Acceleration (g) for: Chiou-Youngs (2007) NGA USGS 2008 MRC
1 2 3 4 5 PGA 2.289e-001 2.852e-001 1.900e-001 2.115e-001 0.03 2.381e-001 2.926e-001 1.985e-001 2.231e-001 0.05 2.631e-001 3.081e-001 2.255e-001 2.558e-001 0.1 3.718e-001 4.152e-001 3.245e-001 3.756e-001 0.2 5.058e-001 5.890e-001 4.390e-001 4.893e-001 0.3 5.109e-001 6.180e-001 4.434e-001 4.713e-001 0.4 4.815e-001 5.955e-001 4.161e-001 4.329e-001 0.5 4.602e-001 5.782e-001 4.047e-001 3.977e-001 0.75 3.802e-001 4.829e-001 3.367e-001 3.209e-001 1 3.091e-001 3.768e-001 2.823e-001 2.681e-001

File: N:\2018\18-81-134 SBCUSD, New Diesel Technology Center\-03\Site Specific Seismic Design\~_Gymnasium Expansion - Seismic Hazard Analysis.DSPDate modified: 11/02/2018 02:56:46 PM
EZ-FRISK 7.65 Build 004 Page 46 of 83
2 1.448e-001 1.681e-001 1.479e-001 1.185e-001 3 8.875e-002 9.891e-002 9.556e-002 7.178e-002 4 6.406e-002 7.017e-002 7.190e-002 5.011e-002
Fractile: Mean Column 1: Spectral Period Column 2: Acceleration (g) for: Weighted Mean of Attenuation Equations Column 3: Acceleration (g) for: Boore-Atkinson (2008) NGA USGS 2008 MRC Column 4: Acceleration (g) for: Campbell-Bozorgnia (2008) NGA USGS 2008 MRC Column 5: Acceleration (g) for: Chiou-Youngs (2007) NGA USGS 2008 MRC
1 2 3 4 5 PGA 1.511e-001 1.882e-001 1.254e-001 1.396e-001 0.03 1.571e-001 1.931e-001 1.310e-001 1.472e-001 0.05 1.736e-001 2.033e-001 1.488e-001 1.688e-001 0.1 2.449e-001 2.729e-001 2.141e-001 2.478e-001 0.2 3.337e-001 3.886e-001 2.896e-001 3.229e-001 0.3 3.366e-001 4.061e-001 2.926e-001 3.110e-001 0.4 3.189e-001 3.921e-001 2.768e-001 2.879e-001 0.5 3.043e-001 3.790e-001 2.696e-001 2.645e-001 0.75 2.486e-001 3.131e-001 2.217e-001 2.111e-001 1 2.013e-001 2.441e-001 1.849e-001 1.749e-001 2 9.293e-002 1.070e-001 9.559e-002 7.616e-002 3 5.684e-002 6.309e-002 6.173e-002 4.570e-002 4 4.094e-002 4.472e-002 4.642e-002 3.166e-002
Source: North Frontal (West)

File: N:\2018\18-81-134 SBCUSD, New Diesel Technology Center\-03\Site Specific Seismic Design\~_Gymnasium Expansion - Seismic Hazard Analysis.DSPDate modified: 11/02/2018 02:56:46 PM
EZ-FRISK 7.65 Build 004 Page 47 of 83
Region: USGS 2008 California Closest Distance: 17.78 km Amplitude Units: Acceleration (g) Magnitude: 7.20 Mw Fractile: 0.84 Column 1: Spectral Period Column 2: Acceleration (g) for: Weighted Mean of Attenuation Equations Column 3: Acceleration (g) for: Boore-Atkinson (2008) NGA USGS 2008 MRC Column 4: Acceleration (g) for: Campbell-Bozorgnia (2008) NGA USGS 2008 MRC Column 5: Acceleration (g) for: Chiou-Youngs (2007) NGA USGS 2008 MRC
1 2 3 4 5 PGA 5.140e-001 5.253e-001 4.249e-001 5.918e-001 0.03 5.470e-001 5.589e-001 4.447e-001 6.374e-001 0.05 6.094e-001 6.002e-001 5.040e-001 7.240e-001 0.1 8.579e-001 8.333e-001 7.367e-001 1.004e+000 0.2 1.112e+000 1.109e+000 9.569e-001 1.269e+000 0.3 1.124e+000 1.183e+000 9.412e-001 1.247e+000 0.4 1.081e+000 1.164e+000 9.070e-001 1.173e+000 0.5 1.040e+000 1.144e+000 8.937e-001 1.081e+000 0.75 8.938e-001 1.003e+000 7.771e-001 9.016e-001 1 7.456e-001 7.806e-001 6.822e-001 7.741e-001 2 3.692e-001 3.680e-001 3.888e-001 3.507e-001 3 2.288e-001 2.331e-001 2.464e-001 2.068e-001 4 1.630e-001 1.650e-001 1.811e-001 1.429e-001
Fractile: Mean Column 1: Spectral Period Column 2: Acceleration (g) for: Weighted Mean of Attenuation Equations

File: N:\2018\18-81-134 SBCUSD, New Diesel Technology Center\-03\Site Specific Seismic Design\~_Gymnasium Expansion - Seismic Hazard Analysis.DSPDate modified: 11/02/2018 02:56:46 PM
EZ-FRISK 7.65 Build 004 Page 48 of 83
Column 3: Acceleration (g) for: Boore-Atkinson (2008) NGA USGS 2008 MRC Column 4: Acceleration (g) for: Campbell-Bozorgnia (2008) NGA USGS 2008 MRC Column 5: Acceleration (g) for: Chiou-Youngs (2007) NGA USGS 2008 MRC
1 2 3 4 5 PGA 3.392e-001 3.466e-001 2.804e-001 3.905e-001 0.03 3.609e-001 3.688e-001 2.934e-001 4.206e-001 0.05 4.021e-001 3.960e-001 3.326e-001 4.777e-001 0.1 5.653e-001 5.476e-001 4.861e-001 6.622e-001 0.2 7.335e-001 7.316e-001 6.314e-001 8.375e-001 0.3 7.403e-001 7.772e-001 6.210e-001 8.228e-001 0.4 7.166e-001 7.662e-001 6.033e-001 7.805e-001 0.5 6.912e-001 7.496e-001 5.992e-001 7.250e-001 0.75 5.877e-001 6.502e-001 5.139e-001 5.989e-001 1 4.874e-001 5.057e-001 4.479e-001 5.085e-001 2 2.372e-001 2.344e-001 2.513e-001 2.258e-001 3 1.465e-001 1.487e-001 1.592e-001 1.317e-001 4 1.041e-001 1.052e-001 1.169e-001 9.029e-002
Source: Pinto MtnRegion: USGS 2008 California Closest Distance: 50.70 km Amplitude Units: Acceleration (g) Magnitude: 7.30 Mw Fractile: 0.84 Column 1: Spectral Period Column 2: Acceleration (g) for: Weighted Mean of Attenuation Equations

File: N:\2018\18-81-134 SBCUSD, New Diesel Technology Center\-03\Site Specific Seismic Design\~_Gymnasium Expansion - Seismic Hazard Analysis.DSPDate modified: 11/02/2018 02:56:46 PM
EZ-FRISK 7.65 Build 004 Page 49 of 83
Column 3: Acceleration (g) for: Boore-Atkinson (2008) NGA USGS 2008 MRC Column 4: Acceleration (g) for: Campbell-Bozorgnia (2008) NGA USGS 2008 MRC Column 5: Acceleration (g) for: Chiou-Youngs (2007) NGA USGS 2008 MRC
1 2 3 4 5 PGA 2.203e-001 2.785e-001 1.830e-001 1.995e-001 0.03 2.291e-001 2.873e-001 1.905e-001 2.094e-001 0.05 2.527e-001 3.046e-001 2.149e-001 2.387e-001 0.1 3.490e-001 3.971e-001 3.003e-001 3.497e-001 0.2 4.609e-001 5.085e-001 4.121e-001 4.620e-001 0.3 4.640e-001 5.143e-001 4.269e-001 4.509e-001 0.4 4.443e-001 5.098e-001 4.048e-001 4.182e-001 0.5 4.312e-001 4.996e-001 4.061e-001 3.878e-001 0.75 3.692e-001 4.314e-001 3.571e-001 3.192e-001 1 3.152e-001 3.604e-001 3.104e-001 2.747e-001 2 1.750e-001 2.024e-001 1.777e-001 1.448e-001 3 1.167e-001 1.367e-001 1.194e-001 9.415e-002 4 8.705e-002 1.017e-001 9.190e-002 6.751e-002
Fractile: Mean Column 1: Spectral Period Column 2: Acceleration (g) for: Weighted Mean of Attenuation Equations Column 3: Acceleration (g) for: Boore-Atkinson (2008) NGA USGS 2008 MRC Column 4: Acceleration (g) for: Campbell-Bozorgnia (2008) NGA USGS 2008 MRC Column 5: Acceleration (g) for: Chiou-Youngs (2007) NGA USGS 2008 MRC
1 2 3 4 5 PGA 1.454e-001 1.837e-001 1.207e-001 1.316e-001 0.03 1.511e-001 1.895e-001 1.257e-001 1.382e-001

File: N:\2018\18-81-134 SBCUSD, New Diesel Technology Center\-03\Site Specific Seismic Design\~_Gymnasium Expansion - Seismic Hazard Analysis.DSPDate modified: 11/02/2018 02:56:46 PM
EZ-FRISK 7.65 Build 004 Page 50 of 83
0.05 1.668e-001 2.010e-001 1.418e-001 1.575e-001 0.1 2.300e-001 2.610e-001 1.981e-001 2.307e-001 0.2 3.041e-001 3.355e-001 2.719e-001 3.049e-001 0.3 3.057e-001 3.380e-001 2.817e-001 2.975e-001 0.4 2.944e-001 3.357e-001 2.693e-001 2.782e-001 0.5 2.852e-001 3.274e-001 2.704e-001 2.578e-001 0.75 2.416e-001 2.797e-001 2.351e-001 2.099e-001 1 2.053e-001 2.335e-001 2.033e-001 1.792e-001 2 1.123e-001 1.289e-001 1.149e-001 9.305e-002 3 7.475e-002 8.717e-002 7.714e-002 5.995e-002 4 5.561e-002 6.483e-002 5.934e-002 4.267e-002
Source: Pisgah-Bullion Mtn-Mesquite LkRegion: USGS 2008 California Closest Distance: 97.99 km Amplitude Units: Acceleration (g) Magnitude: 7.30 Mw Fractile: 0.84 Column 1: Spectral Period Column 2: Acceleration (g) for: Weighted Mean of Attenuation Equations Column 3: Acceleration (g) for: Boore-Atkinson (2008) NGA USGS 2008 MRC Column 4: Acceleration (g) for: Campbell-Bozorgnia (2008) NGA USGS 2008 MRC Column 5: Acceleration (g) for: Chiou-Youngs (2007) NGA USGS 2008 MRC
1 2 3 4 5 PGA 1.183e-001 1.449e-001 1.078e-001 1.023e-001 0.03 1.212e-001 1.471e-001 1.111e-001 1.053e-001

File: N:\2018\18-81-134 SBCUSD, New Diesel Technology Center\-03\Site Specific Seismic Design\~_Gymnasium Expansion - Seismic Hazard Analysis.DSPDate modified: 11/02/2018 02:56:46 PM
EZ-FRISK 7.65 Build 004 Page 51 of 83
0.05 1.315e-001 1.545e-001 1.229e-001 1.172e-001 0.1 1.759e-001 1.959e-001 1.615e-001 1.701e-001 0.2 2.477e-001 2.672e-001 2.330e-001 2.429e-001 0.3 2.638e-001 2.853e-001 2.570e-001 2.491e-001 0.4 2.589e-001 2.914e-001 2.452e-001 2.401e-001 0.5 2.573e-001 2.931e-001 2.495e-001 2.293e-001 0.75 2.258e-001 2.615e-001 2.223e-001 1.934e-001 1 1.955e-001 2.257e-001 1.920e-001 1.689e-001 2 1.099e-001 1.304e-001 1.082e-001 9.126e-002 3 7.337e-002 8.785e-002 7.254e-002 5.972e-002 4 5.466e-002 6.523e-002 5.583e-002 4.293e-002
Fractile: Mean Column 1: Spectral Period Column 2: Acceleration (g) for: Weighted Mean of Attenuation Equations Column 3: Acceleration (g) for: Boore-Atkinson (2008) NGA USGS 2008 MRC Column 4: Acceleration (g) for: Campbell-Bozorgnia (2008) NGA USGS 2008 MRC Column 5: Acceleration (g) for: Chiou-Youngs (2007) NGA USGS 2008 MRC
1 2 3 4 5 PGA 7.808e-002 9.558e-002 7.116e-002 6.750e-002 0.03 7.995e-002 9.706e-002 7.330e-002 6.950e-002 0.05 8.678e-002 1.019e-001 8.109e-002 7.731e-002 0.1 1.159e-001 1.288e-001 1.066e-001 1.123e-001 0.2 1.634e-001 1.763e-001 1.538e-001 1.603e-001 0.3 1.738e-001 1.875e-001 1.696e-001 1.644e-001 0.4 1.714e-001 1.919e-001 1.631e-001 1.593e-001 0.5 1.698e-001 1.921e-001 1.657e-001 1.515e-001 0.75 1.475e-001 1.695e-001 1.462e-001 1.267e-001

File: N:\2018\18-81-134 SBCUSD, New Diesel Technology Center\-03\Site Specific Seismic Design\~_Gymnasium Expansion - Seismic Hazard Analysis.DSPDate modified: 11/02/2018 02:56:46 PM
EZ-FRISK 7.65 Build 004 Page 52 of 83
1 1.272e-001 1.462e-001 1.256e-001 1.099e-001 2 7.053e-002 8.302e-002 6.995e-002 5.861e-002 3 4.697e-002 5.604e-002 4.686e-002 3.802e-002 4 3.492e-002 4.157e-002 3.605e-002 2.713e-002
Source: Puente HillsRegion: USGS 2008 California Closest Distance: 56.80 km Amplitude Units: Acceleration (g) Magnitude: 7.10 Mw Fractile: 0.84 Column 1: Spectral Period Column 2: Acceleration (g) for: Weighted Mean of Attenuation Equations Column 3: Acceleration (g) for: Boore-Atkinson (2008) NGA USGS 2008 MRC Column 4: Acceleration (g) for: Campbell-Bozorgnia (2008) NGA USGS 2008 MRC Column 5: Acceleration (g) for: Chiou-Youngs (2007) NGA USGS 2008 MRC
1 2 3 4 5 PGA 2.206e-001 2.417e-001 2.023e-001 2.178e-001 0.03 2.282e-001 2.468e-001 2.096e-001 2.283e-001 0.05 2.504e-001 2.591e-001 2.343e-001 2.579e-001 0.1 3.470e-001 3.428e-001 3.261e-001 3.722e-001 0.2 4.752e-001 4.827e-001 4.528e-001 4.900e-001 0.3 4.880e-001 5.130e-001 4.737e-001 4.772e-001 0.4 4.623e-001 4.960e-001 4.495e-001 4.412e-001 0.5 4.452e-001 4.856e-001 4.440e-001 4.061e-001 0.75 3.736e-001 4.135e-001 3.802e-001 3.271e-001
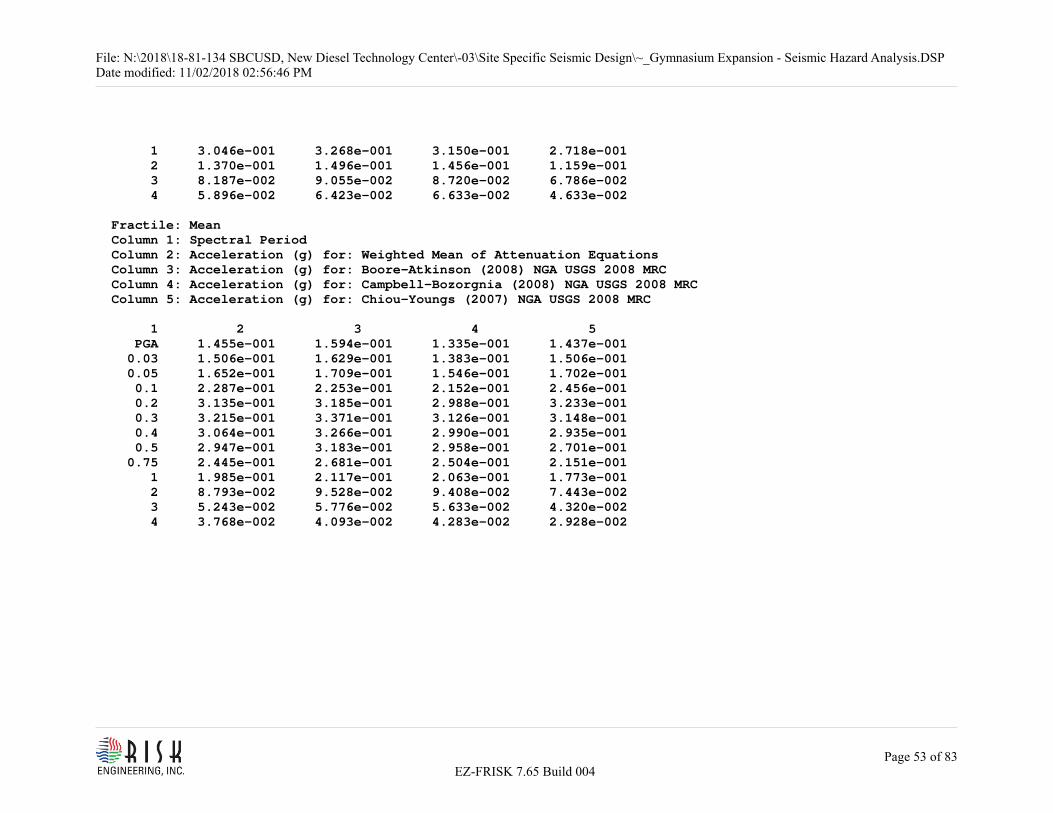
File: N:\2018\18-81-134 SBCUSD, New Diesel Technology Center\-03\Site Specific Seismic Design\~_Gymnasium Expansion - Seismic Hazard Analysis.DSPDate modified: 11/02/2018 02:56:46 PM
EZ-FRISK 7.65 Build 004 Page 53 of 83
1 3.046e-001 3.268e-001 3.150e-001 2.718e-001 2 1.370e-001 1.496e-001 1.456e-001 1.159e-001 3 8.187e-002 9.055e-002 8.720e-002 6.786e-002 4 5.896e-002 6.423e-002 6.633e-002 4.633e-002
Fractile: Mean Column 1: Spectral Period Column 2: Acceleration (g) for: Weighted Mean of Attenuation Equations Column 3: Acceleration (g) for: Boore-Atkinson (2008) NGA USGS 2008 MRC Column 4: Acceleration (g) for: Campbell-Bozorgnia (2008) NGA USGS 2008 MRC Column 5: Acceleration (g) for: Chiou-Youngs (2007) NGA USGS 2008 MRC
1 2 3 4 5 PGA 1.455e-001 1.594e-001 1.335e-001 1.437e-001 0.03 1.506e-001 1.629e-001 1.383e-001 1.506e-001 0.05 1.652e-001 1.709e-001 1.546e-001 1.702e-001 0.1 2.287e-001 2.253e-001 2.152e-001 2.456e-001 0.2 3.135e-001 3.185e-001 2.988e-001 3.233e-001 0.3 3.215e-001 3.371e-001 3.126e-001 3.148e-001 0.4 3.064e-001 3.266e-001 2.990e-001 2.935e-001 0.5 2.947e-001 3.183e-001 2.958e-001 2.701e-001 0.75 2.445e-001 2.681e-001 2.504e-001 2.151e-001 1 1.985e-001 2.117e-001 2.063e-001 1.773e-001 2 8.793e-002 9.528e-002 9.408e-002 7.443e-002 3 5.243e-002 5.776e-002 5.633e-002 4.320e-002 4 3.768e-002 4.093e-002 4.283e-002 2.928e-002

File: N:\2018\18-81-134 SBCUSD, New Diesel Technology Center\-03\Site Specific Seismic Design\~_Gymnasium Expansion - Seismic Hazard Analysis.DSPDate modified: 11/02/2018 02:56:46 PM
EZ-FRISK 7.65 Build 004 Page 54 of 83
Source: Puente Hills (Coyote Hills)Region: USGS 2008 California Closest Distance: 61.41 km Amplitude Units: Acceleration (g) Magnitude: 6.90 Mw Fractile: 0.84 Column 1: Spectral Period Column 2: Acceleration (g) for: Weighted Mean of Attenuation Equations Column 3: Acceleration (g) for: Boore-Atkinson (2008) NGA USGS 2008 MRC Column 4: Acceleration (g) for: Campbell-Bozorgnia (2008) NGA USGS 2008 MRC Column 5: Acceleration (g) for: Chiou-Youngs (2007) NGA USGS 2008 MRC
1 2 3 4 5 PGA 1.774e-001 2.035e-001 1.750e-001 1.536e-001 0.03 1.824e-001 2.055e-001 1.814e-001 1.603e-001 0.05 1.999e-001 2.148e-001 2.033e-001 1.816e-001 0.1 2.794e-001 2.880e-001 2.850e-001 2.652e-001 0.2 3.944e-001 4.337e-001 3.961e-001 3.534e-001 0.3 4.063e-001 4.617e-001 4.126e-001 3.446e-001 0.4 3.842e-001 4.450e-001 3.886e-001 3.192e-001 0.5 3.686e-001 4.317e-001 3.771e-001 2.969e-001 0.75 3.016e-001 3.557e-001 3.114e-001 2.377e-001 1 2.421e-001 2.784e-001 2.512e-001 1.969e-001 2 1.054e-001 1.224e-001 1.095e-001 8.429e-002 3 6.155e-002 6.991e-002 6.468e-002 5.004e-002 4 4.438e-002 4.983e-002 4.892e-002 3.438e-002
Fractile: Mean Column 1: Spectral Period

File: N:\2018\18-81-134 SBCUSD, New Diesel Technology Center\-03\Site Specific Seismic Design\~_Gymnasium Expansion - Seismic Hazard Analysis.DSPDate modified: 11/02/2018 02:56:46 PM
EZ-FRISK 7.65 Build 004 Page 55 of 83
Column 2: Acceleration (g) for: Weighted Mean of Attenuation Equations Column 3: Acceleration (g) for: Boore-Atkinson (2008) NGA USGS 2008 MRC Column 4: Acceleration (g) for: Campbell-Bozorgnia (2008) NGA USGS 2008 MRC Column 5: Acceleration (g) for: Chiou-Youngs (2007) NGA USGS 2008 MRC
1 2 3 4 5 PGA 1.170e-001 1.343e-001 1.155e-001 1.014e-001 0.03 1.204e-001 1.356e-001 1.197e-001 1.058e-001 0.05 1.319e-001 1.417e-001 1.341e-001 1.198e-001 0.1 1.841e-001 1.892e-001 1.881e-001 1.750e-001 0.2 2.602e-001 2.862e-001 2.614e-001 2.332e-001 0.3 2.677e-001 3.034e-001 2.722e-001 2.274e-001 0.4 2.545e-001 2.930e-001 2.584e-001 2.121e-001 0.5 2.434e-001 2.829e-001 2.510e-001 1.964e-001 0.75 1.971e-001 2.306e-001 2.050e-001 1.557e-001 1 1.576e-001 1.803e-001 1.645e-001 1.281e-001 2 6.761e-002 7.797e-002 7.075e-002 5.410e-002 3 3.941e-002 4.460e-002 4.178e-002 3.184e-002 4 2.836e-002 3.176e-002 3.159e-002 2.172e-002
Source: Puente Hills (LA)Region: USGS 2008 California Closest Distance: 81.43 km Amplitude Units: Acceleration (g) Magnitude: 7.00 Mw Fractile: 0.84 Column 1: Spectral Period

File: N:\2018\18-81-134 SBCUSD, New Diesel Technology Center\-03\Site Specific Seismic Design\~_Gymnasium Expansion - Seismic Hazard Analysis.DSPDate modified: 11/02/2018 02:56:46 PM
EZ-FRISK 7.65 Build 004 Page 56 of 83
Column 2: Acceleration (g) for: Weighted Mean of Attenuation Equations Column 3: Acceleration (g) for: Boore-Atkinson (2008) NGA USGS 2008 MRC Column 4: Acceleration (g) for: Campbell-Bozorgnia (2008) NGA USGS 2008 MRC Column 5: Acceleration (g) for: Chiou-Youngs (2007) NGA USGS 2008 MRC
1 2 3 4 5 PGA 1.399e-001 1.575e-001 1.433e-001 1.189e-001 0.03 1.432e-001 1.587e-001 1.478e-001 1.231e-001 0.05 1.558e-001 1.653e-001 1.642e-001 1.380e-001 0.1 2.137e-001 2.175e-001 2.229e-001 2.008e-001 0.2 3.074e-001 3.281e-001 3.169e-001 2.773e-001 0.3 3.257e-001 3.594e-001 3.404e-001 2.772e-001 0.4 3.118e-001 3.516e-001 3.223e-001 2.614e-001 0.5 3.035e-001 3.469e-001 3.176e-001 2.460e-001 0.75 2.549e-001 2.953e-001 2.684e-001 2.008e-001 1 2.076e-001 2.354e-001 2.186e-001 1.686e-001 2 9.303e-002 1.071e-001 9.727e-002 7.468e-002 3 5.538e-002 6.308e-002 5.790e-002 4.515e-002 4 4.011e-002 4.496e-002 4.399e-002 3.137e-002
Fractile: Mean Column 1: Spectral Period Column 2: Acceleration (g) for: Weighted Mean of Attenuation Equations Column 3: Acceleration (g) for: Boore-Atkinson (2008) NGA USGS 2008 MRC Column 4: Acceleration (g) for: Campbell-Bozorgnia (2008) NGA USGS 2008 MRC Column 5: Acceleration (g) for: Chiou-Youngs (2007) NGA USGS 2008 MRC
1 2 3 4 5 PGA 9.229e-002 1.039e-001 9.453e-002 7.846e-002

File: N:\2018\18-81-134 SBCUSD, New Diesel Technology Center\-03\Site Specific Seismic Design\~_Gymnasium Expansion - Seismic Hazard Analysis.DSPDate modified: 11/02/2018 02:56:46 PM
EZ-FRISK 7.65 Build 004 Page 57 of 83
0.03 9.449e-002 1.047e-001 9.754e-002 8.124e-002 0.05 1.028e-001 1.091e-001 1.083e-001 9.106e-002 0.1 1.408e-001 1.429e-001 1.471e-001 1.325e-001 0.2 2.028e-001 2.165e-001 2.091e-001 1.829e-001 0.3 2.146e-001 2.362e-001 2.246e-001 1.829e-001 0.4 2.065e-001 2.315e-001 2.144e-001 1.736e-001 0.5 2.004e-001 2.273e-001 2.112e-001 1.626e-001 0.75 1.665e-001 1.915e-001 1.766e-001 1.315e-001 1 1.351e-001 1.525e-001 1.431e-001 1.097e-001 2 5.968e-002 6.824e-002 6.287e-002 4.794e-002 3 3.546e-002 4.024e-002 3.740e-002 2.874e-002 4 2.563e-002 2.865e-002 2.840e-002 1.983e-002
Source: Puente Hills (Santa Fe Springs)Region: USGS 2008 California Closest Distance: 72.99 km Amplitude Units: Acceleration (g) Magnitude: 6.70 Mw Fractile: 0.84 Column 1: Spectral Period Column 2: Acceleration (g) for: Weighted Mean of Attenuation Equations Column 3: Acceleration (g) for: Boore-Atkinson (2008) NGA USGS 2008 MRC Column 4: Acceleration (g) for: Campbell-Bozorgnia (2008) NGA USGS 2008 MRC Column 5: Acceleration (g) for: Chiou-Youngs (2007) NGA USGS 2008 MRC
1 2 3 4 5 PGA 1.357e-001 1.527e-001 1.393e-001 1.152e-001

File: N:\2018\18-81-134 SBCUSD, New Diesel Technology Center\-03\Site Specific Seismic Design\~_Gymnasium Expansion - Seismic Hazard Analysis.DSPDate modified: 11/02/2018 02:56:46 PM
EZ-FRISK 7.65 Build 004 Page 58 of 83
0.03 1.389e-001 1.531e-001 1.442e-001 1.195e-001 0.05 1.519e-001 1.601e-001 1.615e-001 1.344e-001 0.1 2.129e-001 2.172e-001 2.259e-001 1.957e-001 0.2 3.092e-001 3.456e-001 3.167e-001 2.656e-001 0.3 3.217e-001 3.725e-001 3.315e-001 2.614e-001 0.4 3.043e-001 3.553e-001 3.102e-001 2.474e-001 0.5 2.896e-001 3.429e-001 2.964e-001 2.296e-001 0.75 2.317e-001 2.768e-001 2.367e-001 1.817e-001 1 1.831e-001 2.152e-001 1.858e-001 1.486e-001 2 7.632e-002 9.200e-002 7.604e-002 6.097e-002 3 4.325e-002 5.061e-002 4.412e-002 3.507e-002 4 3.079e-002 3.574e-002 3.309e-002 2.357e-002
Fractile: Mean Column 1: Spectral Period Column 2: Acceleration (g) for: Weighted Mean of Attenuation Equations Column 3: Acceleration (g) for: Boore-Atkinson (2008) NGA USGS 2008 MRC Column 4: Acceleration (g) for: Campbell-Bozorgnia (2008) NGA USGS 2008 MRC Column 5: Acceleration (g) for: Chiou-Youngs (2007) NGA USGS 2008 MRC
1 2 3 4 5 PGA 8.953e-002 1.008e-001 9.191e-002 7.599e-002 0.03 9.165e-002 1.010e-001 9.516e-002 7.884e-002 0.05 1.003e-001 1.056e-001 1.065e-001 8.868e-002 0.1 1.403e-001 1.428e-001 1.491e-001 1.291e-001 0.2 2.040e-001 2.280e-001 2.089e-001 1.753e-001 0.3 2.119e-001 2.448e-001 2.187e-001 1.725e-001 0.4 2.011e-001 2.340e-001 2.064e-001 1.632e-001 0.5 1.909e-001 2.248e-001 1.971e-001 1.509e-001
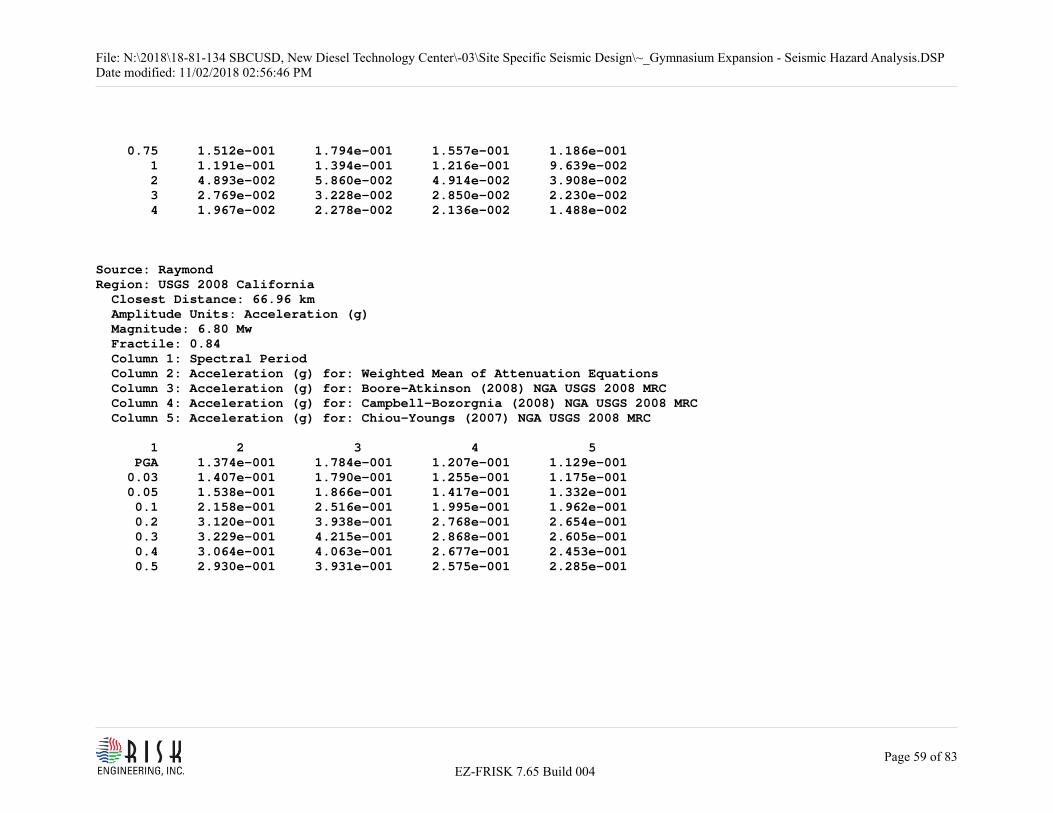
File: N:\2018\18-81-134 SBCUSD, New Diesel Technology Center\-03\Site Specific Seismic Design\~_Gymnasium Expansion - Seismic Hazard Analysis.DSPDate modified: 11/02/2018 02:56:46 PM
EZ-FRISK 7.65 Build 004 Page 59 of 83
0.75 1.512e-001 1.794e-001 1.557e-001 1.186e-001 1 1.191e-001 1.394e-001 1.216e-001 9.639e-002 2 4.893e-002 5.860e-002 4.914e-002 3.908e-002 3 2.769e-002 3.228e-002 2.850e-002 2.230e-002 4 1.967e-002 2.278e-002 2.136e-002 1.488e-002
Source: RaymondRegion: USGS 2008 California Closest Distance: 66.96 km Amplitude Units: Acceleration (g) Magnitude: 6.80 Mw Fractile: 0.84 Column 1: Spectral Period Column 2: Acceleration (g) for: Weighted Mean of Attenuation Equations Column 3: Acceleration (g) for: Boore-Atkinson (2008) NGA USGS 2008 MRC Column 4: Acceleration (g) for: Campbell-Bozorgnia (2008) NGA USGS 2008 MRC Column 5: Acceleration (g) for: Chiou-Youngs (2007) NGA USGS 2008 MRC
1 2 3 4 5 PGA 1.374e-001 1.784e-001 1.207e-001 1.129e-001 0.03 1.407e-001 1.790e-001 1.255e-001 1.175e-001 0.05 1.538e-001 1.866e-001 1.417e-001 1.332e-001 0.1 2.158e-001 2.516e-001 1.995e-001 1.962e-001 0.2 3.120e-001 3.938e-001 2.768e-001 2.654e-001 0.3 3.229e-001 4.215e-001 2.868e-001 2.605e-001 0.4 3.064e-001 4.063e-001 2.677e-001 2.453e-001 0.5 2.930e-001 3.931e-001 2.575e-001 2.285e-001

File: N:\2018\18-81-134 SBCUSD, New Diesel Technology Center\-03\Site Specific Seismic Design\~_Gymnasium Expansion - Seismic Hazard Analysis.DSPDate modified: 11/02/2018 02:56:46 PM
EZ-FRISK 7.65 Build 004 Page 60 of 83
0.75 2.369e-001 3.194e-001 2.079e-001 1.835e-001 1 1.902e-001 2.490e-001 1.690e-001 1.525e-001 2 8.585e-002 1.076e-001 8.323e-002 6.673e-002 3 5.122e-002 5.973e-002 5.349e-002 4.046e-002 4 3.705e-002 4.272e-002 4.029e-002 2.813e-002
Fractile: Mean Column 1: Spectral Period Column 2: Acceleration (g) for: Weighted Mean of Attenuation Equations Column 3: Acceleration (g) for: Boore-Atkinson (2008) NGA USGS 2008 MRC Column 4: Acceleration (g) for: Campbell-Bozorgnia (2008) NGA USGS 2008 MRC Column 5: Acceleration (g) for: Chiou-Youngs (2007) NGA USGS 2008 MRC
1 2 3 4 5 PGA 9.063e-002 1.177e-001 7.967e-002 7.448e-002 0.03 9.281e-002 1.181e-001 8.281e-002 7.750e-002 0.05 1.015e-001 1.231e-001 9.347e-002 8.790e-002 0.1 1.422e-001 1.653e-001 1.317e-001 1.295e-001 0.2 2.059e-001 2.598e-001 1.826e-001 1.751e-001 0.3 2.127e-001 2.770e-001 1.892e-001 1.719e-001 0.4 2.026e-001 2.676e-001 1.780e-001 1.621e-001 0.5 1.931e-001 2.576e-001 1.711e-001 1.504e-001 0.75 1.545e-001 2.071e-001 1.367e-001 1.199e-001 1 1.237e-001 1.613e-001 1.106e-001 9.899e-002 2 5.504e-002 6.852e-002 5.379e-002 4.280e-002 3 3.279e-002 3.810e-002 3.455e-002 2.573e-002 4 2.367e-002 2.723e-002 2.601e-002 1.777e-002

File: N:\2018\18-81-134 SBCUSD, New Diesel Technology Center\-03\Site Specific Seismic Design\~_Gymnasium Expansion - Seismic Hazard Analysis.DSPDate modified: 11/02/2018 02:56:46 PM
EZ-FRISK 7.65 Build 004 Page 61 of 83
Source: Southern San AndreasRegion: USGS 2008 California Closest Distance: 3.79 km Amplitude Units: Acceleration (g) Magnitude: 8.20 Mw Fractile: 0.84 Column 1: Spectral Period Column 2: Acceleration (g) for: Weighted Mean of Attenuation Equations Column 3: Acceleration (g) for: Boore-Atkinson (2008) NGA USGS 2008 MRC Column 4: Acceleration (g) for: Campbell-Bozorgnia (2008) NGA USGS 2008 MRC Column 5: Acceleration (g) for: Chiou-Youngs (2007) NGA USGS 2008 MRC
1 2 3 4 5 PGA 9.017e-001 8.746e-001 7.659e-001 1.065e+000 0.03 9.678e-001 9.648e-001 7.997e-001 1.139e+000 0.05 1.069e+000 1.067e+000 8.876e-001 1.252e+000 0.1 1.396e+000 1.496e+000 1.083e+000 1.615e+000 0.2 1.752e+000 1.785e+000 1.387e+000 2.088e+000 0.3 1.916e+000 2.017e+000 1.503e+000 2.229e+000 0.4 1.956e+000 1.996e+000 1.609e+000 2.262e+000 0.5 2.011e+000 1.973e+000 1.838e+000 2.222e+000 0.75 2.007e+000 1.973e+000 1.993e+000 2.055e+000 1 1.858e+000 1.591e+000 2.045e+000 1.939e+000 2 1.358e+000 1.140e+000 1.729e+000 1.204e+000 3 1.067e+000 1.082e+000 1.281e+000 8.384e-001 4 8.342e-001 8.583e-001 1.024e+000 6.202e-001
Fractile: Mean

File: N:\2018\18-81-134 SBCUSD, New Diesel Technology Center\-03\Site Specific Seismic Design\~_Gymnasium Expansion - Seismic Hazard Analysis.DSPDate modified: 11/02/2018 02:56:46 PM
EZ-FRISK 7.65 Build 004 Page 62 of 83
Column 1: Spectral Period Column 2: Acceleration (g) for: Weighted Mean of Attenuation Equations Column 3: Acceleration (g) for: Boore-Atkinson (2008) NGA USGS 2008 MRC Column 4: Acceleration (g) for: Campbell-Bozorgnia (2008) NGA USGS 2008 MRC Column 5: Acceleration (g) for: Chiou-Youngs (2007) NGA USGS 2008 MRC
1 2 3 4 5 PGA 5.950e-001 5.771e-001 5.053e-001 7.025e-001 0.03 6.386e-001 6.366e-001 5.277e-001 7.515e-001 0.05 7.052e-001 7.040e-001 5.857e-001 8.258e-001 0.1 9.201e-001 9.832e-001 7.147e-001 1.065e+000 0.2 1.156e+000 1.178e+000 9.150e-001 1.378e+000 0.3 1.263e+000 1.325e+000 9.917e-001 1.471e+000 0.4 1.296e+000 1.314e+000 1.070e+000 1.505e+000 0.5 1.338e+000 1.293e+000 1.232e+000 1.490e+000 0.75 1.326e+000 1.279e+000 1.325e+000 1.374e+000 1 1.219e+000 1.031e+000 1.347e+000 1.279e+000 2 8.733e-001 7.260e-001 1.117e+000 7.763e-001 3 6.841e-001 6.903e-001 8.277e-001 5.342e-001 4 5.334e-001 5.470e-001 6.612e-001 3.920e-001
Source: San GabrielRegion: USGS 2008 California Closest Distance: 93.75 km Amplitude Units: Acceleration (g) Magnitude: 7.30 Mw Fractile: 0.84

File: N:\2018\18-81-134 SBCUSD, New Diesel Technology Center\-03\Site Specific Seismic Design\~_Gymnasium Expansion - Seismic Hazard Analysis.DSPDate modified: 11/02/2018 02:56:46 PM
EZ-FRISK 7.65 Build 004 Page 63 of 83
Column 1: Spectral Period Column 2: Acceleration (g) for: Weighted Mean of Attenuation Equations Column 3: Acceleration (g) for: Boore-Atkinson (2008) NGA USGS 2008 MRC Column 4: Acceleration (g) for: Campbell-Bozorgnia (2008) NGA USGS 2008 MRC Column 5: Acceleration (g) for: Chiou-Youngs (2007) NGA USGS 2008 MRC
1 2 3 4 5 PGA 1.259e-001 1.564e-001 1.125e-001 1.087e-001 0.03 1.290e-001 1.590e-001 1.160e-001 1.122e-001 0.05 1.402e-001 1.671e-001 1.285e-001 1.252e-001 0.1 1.881e-001 2.125e-001 1.696e-001 1.821e-001 0.2 2.631e-001 2.876e-001 2.438e-001 2.579e-001 0.3 2.784e-001 3.046e-001 2.677e-001 2.628e-001 0.4 2.722e-001 3.096e-001 2.553e-001 2.518e-001 0.5 2.698e-001 3.101e-001 2.595e-001 2.399e-001 0.75 2.359e-001 2.751e-001 2.310e-001 2.016e-001 1 2.039e-001 2.365e-001 1.995e-001 1.756e-001 2 1.143e-001 1.360e-001 1.124e-001 9.434e-002 3 7.609e-002 9.164e-002 7.516e-002 6.148e-002 4 5.663e-002 6.805e-002 5.773e-002 4.412e-002
Fractile: Mean Column 1: Spectral Period Column 2: Acceleration (g) for: Weighted Mean of Attenuation Equations Column 3: Acceleration (g) for: Boore-Atkinson (2008) NGA USGS 2008 MRC Column 4: Acceleration (g) for: Campbell-Bozorgnia (2008) NGA USGS 2008 MRC Column 5: Acceleration (g) for: Chiou-Youngs (2007) NGA USGS 2008 MRC
1 2 3 4 5

File: N:\2018\18-81-134 SBCUSD, New Diesel Technology Center\-03\Site Specific Seismic Design\~_Gymnasium Expansion - Seismic Hazard Analysis.DSPDate modified: 11/02/2018 02:56:46 PM
EZ-FRISK 7.65 Build 004 Page 64 of 83
PGA 8.304e-002 1.032e-001 7.422e-002 7.170e-002 0.03 8.514e-002 1.049e-001 7.651e-002 7.400e-002 0.05 9.253e-002 1.103e-001 8.476e-002 8.258e-002 0.1 1.239e-001 1.396e-001 1.119e-001 1.202e-001 0.2 1.736e-001 1.898e-001 1.609e-001 1.702e-001 0.3 1.834e-001 2.002e-001 1.766e-001 1.734e-001 0.4 1.803e-001 2.038e-001 1.698e-001 1.671e-001 0.5 1.781e-001 2.033e-001 1.724e-001 1.585e-001 0.75 1.541e-001 1.784e-001 1.519e-001 1.321e-001 1 1.327e-001 1.532e-001 1.306e-001 1.142e-001 2 7.330e-002 8.664e-002 7.267e-002 6.059e-002 3 4.872e-002 5.846e-002 4.855e-002 3.914e-002 4 3.618e-002 4.337e-002 3.728e-002 2.788e-002
Source: San Gorgornio Shear GriddedRegion: USGS 2008 California Closest Distance: 5.00 km Amplitude Units: Acceleration (g) Magnitude: 7.60 Mw Fractile: 0.84 Column 1: Spectral Period Column 2: Acceleration (g) for: Weighted Mean of Attenuation Equations Column 3: Acceleration (g) for: Boore-Atkinson (2008) NGA USGS 2008 MRC Column 4: Acceleration (g) for: Campbell-Bozorgnia (2008) NGA USGS 2008 MRC Column 5: Acceleration (g) for: Chiou-Youngs (2007) NGA USGS 2008 MRC
1 2 3 4 5

File: N:\2018\18-81-134 SBCUSD, New Diesel Technology Center\-03\Site Specific Seismic Design\~_Gymnasium Expansion - Seismic Hazard Analysis.DSPDate modified: 11/02/2018 02:56:46 PM
EZ-FRISK 7.65 Build 004 Page 65 of 83
PGA 9.649e-001 1.052e+000 7.110e-001 1.131e+000 0.03 1.039e+000 1.164e+000 7.437e-001 1.209e+000 0.05 1.151e+000 1.305e+000 8.314e-001 1.318e+000 0.1 1.519e+000 1.831e+000 1.056e+000 1.670e+000 0.2 1.934e+000 2.328e+000 1.351e+000 2.123e+000 0.3 2.066e+000 2.540e+000 1.427e+000 2.231e+000 0.4 2.101e+000 2.581e+000 1.488e+000 2.235e+000 0.5 2.094e+000 2.521e+000 1.594e+000 2.167e+000 0.75 1.937e+000 2.320e+000 1.545e+000 1.946e+000 1 1.701e+000 1.849e+000 1.466e+000 1.788e+000 2 1.065e+000 1.146e+000 1.036e+000 1.013e+000 3 7.573e-001 8.855e-001 7.286e-001 6.578e-001 4 5.695e-001 6.744e-001 5.680e-001 4.660e-001
Fractile: Mean Column 1: Spectral Period Column 2: Acceleration (g) for: Weighted Mean of Attenuation Equations Column 3: Acceleration (g) for: Boore-Atkinson (2008) NGA USGS 2008 MRC Column 4: Acceleration (g) for: Campbell-Bozorgnia (2008) NGA USGS 2008 MRC Column 5: Acceleration (g) for: Chiou-Youngs (2007) NGA USGS 2008 MRC
1 2 3 4 5 PGA 6.366e-001 6.943e-001 4.691e-001 7.465e-001 0.03 6.854e-001 7.680e-001 4.907e-001 7.974e-001 0.05 7.597e-001 8.613e-001 5.486e-001 8.693e-001 0.1 1.001e+000 1.204e+000 6.970e-001 1.102e+000 0.2 1.276e+000 1.536e+000 8.914e-001 1.400e+000 0.3 1.361e+000 1.670e+000 9.416e-001 1.472e+000 0.4 1.392e+000 1.700e+000 9.899e-001 1.486e+000

File: N:\2018\18-81-134 SBCUSD, New Diesel Technology Center\-03\Site Specific Seismic Design\~_Gymnasium Expansion - Seismic Hazard Analysis.DSPDate modified: 11/02/2018 02:56:46 PM
EZ-FRISK 7.65 Build 004 Page 66 of 83
0.5 1.391e+000 1.652e+000 1.069e+000 1.452e+000 0.75 1.277e+000 1.504e+000 1.026e+000 1.301e+000 1 1.114e+000 1.198e+000 9.650e-001 1.179e+000 2 6.840e-001 7.297e-001 6.694e-001 6.528e-001 3 4.849e-001 5.648e-001 4.707e-001 4.191e-001 4 3.637e-001 4.298e-001 3.668e-001 2.945e-001
Source: San JacintoRegion: USGS 2008 California Closest Distance: 6.36 km Amplitude Units: Acceleration (g) Magnitude: 7.88 Mw Fractile: 0.84 Column 1: Spectral Period Column 2: Acceleration (g) for: Weighted Mean of Attenuation Equations Column 3: Acceleration (g) for: Boore-Atkinson (2008) NGA USGS 2008 MRC Column 4: Acceleration (g) for: Campbell-Bozorgnia (2008) NGA USGS 2008 MRC Column 5: Acceleration (g) for: Chiou-Youngs (2007) NGA USGS 2008 MRC
1 2 3 4 5 PGA 7.771e-001 7.485e-001 6.728e-001 9.101e-001 0.03 8.313e-001 8.174e-001 7.037e-001 9.728e-001 0.05 9.206e-001 8.968e-001 7.880e-001 1.077e+000 0.1 1.228e+000 1.242e+000 1.026e+000 1.417e+000 0.2 1.541e+000 1.484e+000 1.314e+000 1.824e+000 0.3 1.628e+000 1.605e+000 1.370e+000 1.907e+000 0.4 1.640e+000 1.607e+000 1.415e+000 1.900e+000
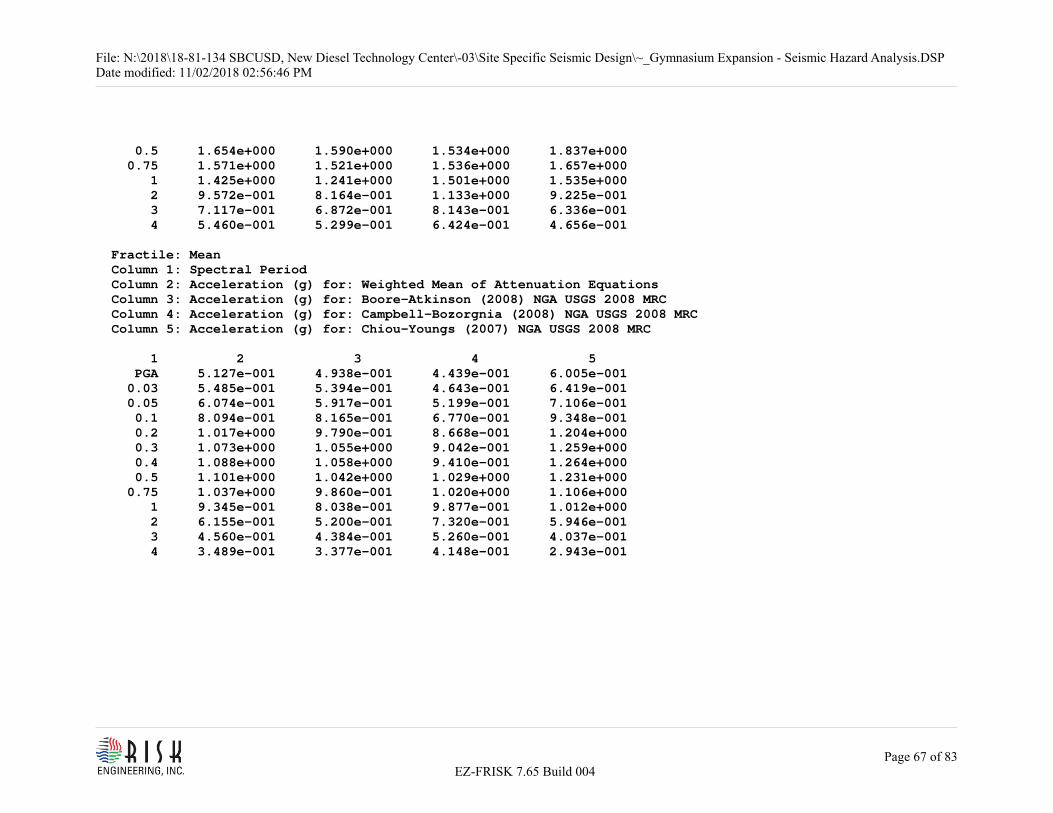
File: N:\2018\18-81-134 SBCUSD, New Diesel Technology Center\-03\Site Specific Seismic Design\~_Gymnasium Expansion - Seismic Hazard Analysis.DSPDate modified: 11/02/2018 02:56:46 PM
EZ-FRISK 7.65 Build 004 Page 67 of 83
0.5 1.654e+000 1.590e+000 1.534e+000 1.837e+000 0.75 1.571e+000 1.521e+000 1.536e+000 1.657e+000 1 1.425e+000 1.241e+000 1.501e+000 1.535e+000 2 9.572e-001 8.164e-001 1.133e+000 9.225e-001 3 7.117e-001 6.872e-001 8.143e-001 6.336e-001 4 5.460e-001 5.299e-001 6.424e-001 4.656e-001
Fractile: Mean Column 1: Spectral Period Column 2: Acceleration (g) for: Weighted Mean of Attenuation Equations Column 3: Acceleration (g) for: Boore-Atkinson (2008) NGA USGS 2008 MRC Column 4: Acceleration (g) for: Campbell-Bozorgnia (2008) NGA USGS 2008 MRC Column 5: Acceleration (g) for: Chiou-Youngs (2007) NGA USGS 2008 MRC
1 2 3 4 5 PGA 5.127e-001 4.938e-001 4.439e-001 6.005e-001 0.03 5.485e-001 5.394e-001 4.643e-001 6.419e-001 0.05 6.074e-001 5.917e-001 5.199e-001 7.106e-001 0.1 8.094e-001 8.165e-001 6.770e-001 9.348e-001 0.2 1.017e+000 9.790e-001 8.668e-001 1.204e+000 0.3 1.073e+000 1.055e+000 9.042e-001 1.259e+000 0.4 1.088e+000 1.058e+000 9.410e-001 1.264e+000 0.5 1.101e+000 1.042e+000 1.029e+000 1.231e+000 0.75 1.037e+000 9.860e-001 1.020e+000 1.106e+000 1 9.345e-001 8.038e-001 9.877e-001 1.012e+000 2 6.155e-001 5.200e-001 7.320e-001 5.946e-001 3 4.560e-001 4.384e-001 5.260e-001 4.037e-001 4 3.489e-001 3.377e-001 4.148e-001 2.943e-001

File: N:\2018\18-81-134 SBCUSD, New Diesel Technology Center\-03\Site Specific Seismic Design\~_Gymnasium Expansion - Seismic Hazard Analysis.DSPDate modified: 11/02/2018 02:56:46 PM
EZ-FRISK 7.65 Build 004 Page 68 of 83
Source: San Joaquin HillsRegion: USGS 2008 California Closest Distance: 69.20 km Amplitude Units: Acceleration (g) Magnitude: 7.10 Mw Fractile: 0.84 Column 1: Spectral Period Column 2: Acceleration (g) for: Weighted Mean of Attenuation Equations Column 3: Acceleration (g) for: Boore-Atkinson (2008) NGA USGS 2008 MRC Column 4: Acceleration (g) for: Campbell-Bozorgnia (2008) NGA USGS 2008 MRC Column 5: Acceleration (g) for: Chiou-Youngs (2007) NGA USGS 2008 MRC
1 2 3 4 5 PGA 1.738e-001 1.977e-001 1.708e-001 1.530e-001 0.03 1.789e-001 2.007e-001 1.766e-001 1.593e-001 0.05 1.954e-001 2.100e-001 1.966e-001 1.797e-001 0.1 2.688e-001 2.755e-001 2.692e-001 2.618e-001 0.2 3.762e-001 3.959e-001 3.789e-001 3.538e-001 0.3 3.931e-001 4.270e-001 4.031e-001 3.493e-001 0.4 3.746e-001 4.155e-001 3.826e-001 3.258e-001 0.5 3.644e-001 4.092e-001 3.793e-001 3.047e-001 0.75 3.083e-001 3.510e-001 3.256e-001 2.482e-001 1 2.524e-001 2.797e-001 2.690e-001 2.085e-001 2 1.152e-001 1.289e-001 1.238e-001 9.290e-002 3 6.965e-002 7.803e-002 7.439e-002 5.652e-002 4 5.054e-002 5.539e-002 5.676e-002 3.947e-002

File: N:\2018\18-81-134 SBCUSD, New Diesel Technology Center\-03\Site Specific Seismic Design\~_Gymnasium Expansion - Seismic Hazard Analysis.DSPDate modified: 11/02/2018 02:56:46 PM
EZ-FRISK 7.65 Build 004 Page 69 of 83
Fractile: Mean Column 1: Spectral Period Column 2: Acceleration (g) for: Weighted Mean of Attenuation Equations Column 3: Acceleration (g) for: Boore-Atkinson (2008) NGA USGS 2008 MRC Column 4: Acceleration (g) for: Campbell-Bozorgnia (2008) NGA USGS 2008 MRC Column 5: Acceleration (g) for: Chiou-Youngs (2007) NGA USGS 2008 MRC
1 2 3 4 5 PGA 1.147e-001 1.304e-001 1.127e-001 1.010e-001 0.03 1.180e-001 1.324e-001 1.165e-001 1.051e-001 0.05 1.289e-001 1.385e-001 1.297e-001 1.186e-001 0.1 1.771e-001 1.811e-001 1.776e-001 1.727e-001 0.2 2.482e-001 2.612e-001 2.500e-001 2.335e-001 0.3 2.590e-001 2.806e-001 2.659e-001 2.305e-001 0.4 2.482e-001 2.736e-001 2.545e-001 2.167e-001 0.5 2.409e-001 2.682e-001 2.525e-001 2.019e-001 0.75 2.016e-001 2.276e-001 2.143e-001 1.628e-001 1 1.644e-001 1.812e-001 1.762e-001 1.358e-001 2 7.393e-002 8.212e-002 8.000e-002 5.966e-002 3 4.460e-002 4.978e-002 4.806e-002 3.598e-002 4 3.230e-002 3.530e-002 3.665e-002 2.494e-002
Source: San JoseRegion: USGS 2008 California Closest Distance: 39.30 km Amplitude Units: Acceleration (g) Magnitude: 6.70 Mw

File: N:\2018\18-81-134 SBCUSD, New Diesel Technology Center\-03\Site Specific Seismic Design\~_Gymnasium Expansion - Seismic Hazard Analysis.DSPDate modified: 11/02/2018 02:56:46 PM
EZ-FRISK 7.65 Build 004 Page 70 of 83
Fractile: 0.84 Column 1: Spectral Period Column 2: Acceleration (g) for: Weighted Mean of Attenuation Equations Column 3: Acceleration (g) for: Boore-Atkinson (2008) NGA USGS 2008 MRC Column 4: Acceleration (g) for: Campbell-Bozorgnia (2008) NGA USGS 2008 MRC Column 5: Acceleration (g) for: Chiou-Youngs (2007) NGA USGS 2008 MRC
1 2 3 4 5 PGA 2.068e-001 2.652e-001 1.862e-001 1.689e-001 0.03 2.142e-001 2.697e-001 1.952e-001 1.777e-001 0.05 2.383e-001 2.869e-001 2.236e-001 2.046e-001 0.1 3.434e-001 3.961e-001 3.312e-001 3.030e-001 0.2 4.694e-001 5.741e-001 4.417e-001 3.923e-001 0.3 4.578e-001 5.640e-001 4.350e-001 3.743e-001 0.4 4.308e-001 5.450e-001 4.036e-001 3.440e-001 0.5 4.042e-001 5.152e-001 3.806e-001 3.169e-001 0.75 3.171e-001 4.010e-001 2.992e-001 2.510e-001 1 2.577e-001 3.223e-001 2.417e-001 2.091e-001 2 1.261e-001 1.594e-001 1.174e-001 1.016e-001 3 7.659e-002 9.177e-002 7.494e-002 6.306e-002 4 5.580e-002 6.747e-002 5.620e-002 4.374e-002
Fractile: Mean Column 1: Spectral Period Column 2: Acceleration (g) for: Weighted Mean of Attenuation Equations Column 3: Acceleration (g) for: Boore-Atkinson (2008) NGA USGS 2008 MRC Column 4: Acceleration (g) for: Campbell-Bozorgnia (2008) NGA USGS 2008 MRC Column 5: Acceleration (g) for: Chiou-Youngs (2007) NGA USGS 2008 MRC

File: N:\2018\18-81-134 SBCUSD, New Diesel Technology Center\-03\Site Specific Seismic Design\~_Gymnasium Expansion - Seismic Hazard Analysis.DSPDate modified: 11/02/2018 02:56:46 PM
EZ-FRISK 7.65 Build 004 Page 71 of 83
1 2 3 4 5 PGA 1.364e-001 1.750e-001 1.229e-001 1.114e-001 0.03 1.413e-001 1.780e-001 1.288e-001 1.173e-001 0.05 1.573e-001 1.893e-001 1.475e-001 1.350e-001 0.1 2.262e-001 2.603e-001 2.185e-001 1.999e-001 0.2 3.097e-001 3.788e-001 2.914e-001 2.588e-001 0.3 3.015e-001 3.707e-001 2.870e-001 2.470e-001 0.4 2.851e-001 3.588e-001 2.684e-001 2.279e-001 0.5 2.667e-001 3.377e-001 2.535e-001 2.090e-001 0.75 2.070e-001 2.600e-001 1.970e-001 1.641e-001 1 1.676e-001 2.088e-001 1.583e-001 1.359e-001 2 8.085e-002 1.015e-001 7.586e-002 6.519e-002 3 4.902e-002 5.854e-002 4.841e-002 4.010e-002 4 3.563e-002 4.300e-002 3.629e-002 2.762e-002
Source: Santa MonicaRegion: USGS 2008 California Closest Distance: 93.97 km Amplitude Units: Acceleration (g) Magnitude: 7.40 Mw Fractile: 0.84 Column 1: Spectral Period Column 2: Acceleration (g) for: Weighted Mean of Attenuation Equations Column 3: Acceleration (g) for: Boore-Atkinson (2008) NGA USGS 2008 MRC Column 4: Acceleration (g) for: Campbell-Bozorgnia (2008) NGA USGS 2008 MRC Column 5: Acceleration (g) for: Chiou-Youngs (2007) NGA USGS 2008 MRC

File: N:\2018\18-81-134 SBCUSD, New Diesel Technology Center\-03\Site Specific Seismic Design\~_Gymnasium Expansion - Seismic Hazard Analysis.DSPDate modified: 11/02/2018 02:56:46 PM
EZ-FRISK 7.65 Build 004 Page 72 of 83
1 2 3 4 5 PGA 1.458e-001 1.605e-001 1.437e-001 1.331e-001 0.03 1.497e-001 1.641e-001 1.477e-001 1.374e-001 0.05 1.623e-001 1.716e-001 1.625e-001 1.528e-001 0.1 2.165e-001 2.163e-001 2.122e-001 2.210e-001 0.2 3.041e-001 2.933e-001 3.070e-001 3.121e-001 0.3 3.293e-001 3.283e-001 3.409e-001 3.187e-001 0.4 3.202e-001 3.284e-001 3.276e-001 3.045e-001 0.5 3.205e-001 3.345e-001 3.363e-001 2.905e-001 0.75 2.866e-001 3.092e-001 3.063e-001 2.442e-001 1 2.432e-001 2.562e-001 2.632e-001 2.101e-001 2 1.208e-001 1.280e-001 1.351e-001 9.938e-002 3 7.725e-002 8.438e-002 8.479e-002 6.258e-002 4 5.649e-002 5.929e-002 6.554e-002 4.466e-002
Fractile: Mean Column 1: Spectral Period Column 2: Acceleration (g) for: Weighted Mean of Attenuation Equations Column 3: Acceleration (g) for: Boore-Atkinson (2008) NGA USGS 2008 MRC Column 4: Acceleration (g) for: Campbell-Bozorgnia (2008) NGA USGS 2008 MRC Column 5: Acceleration (g) for: Chiou-Youngs (2007) NGA USGS 2008 MRC
1 2 3 4 5 PGA 9.617e-002 1.059e-001 9.483e-002 8.782e-002 0.03 9.880e-002 1.083e-001 9.747e-002 9.066e-002 0.05 1.071e-001 1.132e-001 1.072e-001 1.009e-001 0.1 1.426e-001 1.422e-001 1.400e-001 1.458e-001 0.2 2.007e-001 1.935e-001 2.026e-001 2.059e-001 0.3 2.170e-001 2.157e-001 2.249e-001 2.103e-001

File: N:\2018\18-81-134 SBCUSD, New Diesel Technology Center\-03\Site Specific Seismic Design\~_Gymnasium Expansion - Seismic Hazard Analysis.DSPDate modified: 11/02/2018 02:56:46 PM
EZ-FRISK 7.65 Build 004 Page 73 of 83
0.4 2.122e-001 2.163e-001 2.179e-001 2.026e-001 0.5 2.118e-001 2.193e-001 2.237e-001 1.924e-001 0.75 1.874e-001 2.005e-001 2.015e-001 1.602e-001 1 1.584e-001 1.660e-001 1.723e-001 1.368e-001 2 7.755e-002 8.152e-002 8.731e-002 6.383e-002 3 4.948e-002 5.382e-002 5.478e-002 3.984e-002 4 3.611e-002 3.778e-002 4.232e-002 2.822e-002
Source: Sierra MadreRegion: USGS 2008 California Closest Distance: 43.87 km Amplitude Units: Acceleration (g) Magnitude: 7.20 Mw Fractile: 0.84 Column 1: Spectral Period Column 2: Acceleration (g) for: Weighted Mean of Attenuation Equations Column 3: Acceleration (g) for: Boore-Atkinson (2008) NGA USGS 2008 MRC Column 4: Acceleration (g) for: Campbell-Bozorgnia (2008) NGA USGS 2008 MRC Column 5: Acceleration (g) for: Chiou-Youngs (2007) NGA USGS 2008 MRC
1 2 3 4 5 PGA 2.420e-001 2.946e-001 1.983e-001 2.332e-001 0.03 2.523e-001 3.044e-001 2.070e-001 2.455e-001 0.05 2.786e-001 3.209e-001 2.347e-001 2.801e-001 0.1 3.891e-001 4.249e-001 3.339e-001 4.086e-001 0.2 5.198e-001 5.727e-001 4.527e-001 5.341e-001 0.3 5.286e-001 6.059e-001 4.612e-001 5.189e-001
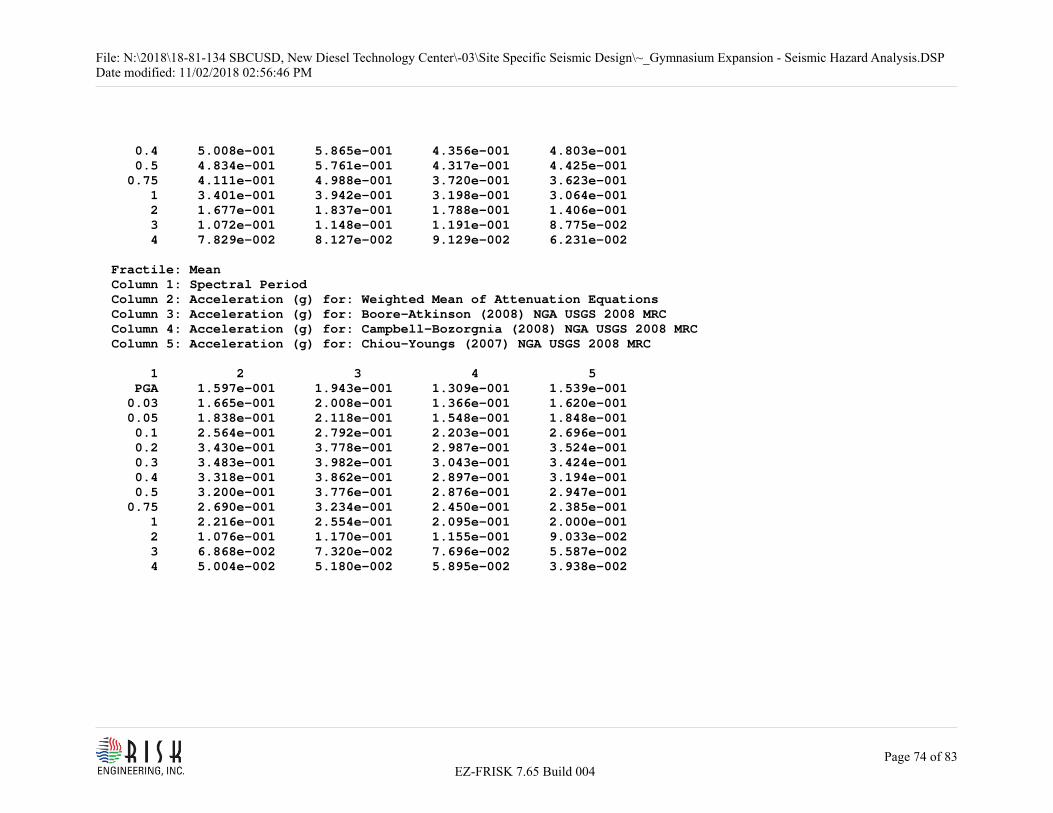
File: N:\2018\18-81-134 SBCUSD, New Diesel Technology Center\-03\Site Specific Seismic Design\~_Gymnasium Expansion - Seismic Hazard Analysis.DSPDate modified: 11/02/2018 02:56:46 PM
EZ-FRISK 7.65 Build 004 Page 74 of 83
0.4 5.008e-001 5.865e-001 4.356e-001 4.803e-001 0.5 4.834e-001 5.761e-001 4.317e-001 4.425e-001 0.75 4.111e-001 4.988e-001 3.720e-001 3.623e-001 1 3.401e-001 3.942e-001 3.198e-001 3.064e-001 2 1.677e-001 1.837e-001 1.788e-001 1.406e-001 3 1.072e-001 1.148e-001 1.191e-001 8.775e-002 4 7.829e-002 8.127e-002 9.129e-002 6.231e-002
Fractile: Mean Column 1: Spectral Period Column 2: Acceleration (g) for: Weighted Mean of Attenuation Equations Column 3: Acceleration (g) for: Boore-Atkinson (2008) NGA USGS 2008 MRC Column 4: Acceleration (g) for: Campbell-Bozorgnia (2008) NGA USGS 2008 MRC Column 5: Acceleration (g) for: Chiou-Youngs (2007) NGA USGS 2008 MRC
1 2 3 4 5 PGA 1.597e-001 1.943e-001 1.309e-001 1.539e-001 0.03 1.665e-001 2.008e-001 1.366e-001 1.620e-001 0.05 1.838e-001 2.118e-001 1.548e-001 1.848e-001 0.1 2.564e-001 2.792e-001 2.203e-001 2.696e-001 0.2 3.430e-001 3.778e-001 2.987e-001 3.524e-001 0.3 3.483e-001 3.982e-001 3.043e-001 3.424e-001 0.4 3.318e-001 3.862e-001 2.897e-001 3.194e-001 0.5 3.200e-001 3.776e-001 2.876e-001 2.947e-001 0.75 2.690e-001 3.234e-001 2.450e-001 2.385e-001 1 2.216e-001 2.554e-001 2.095e-001 2.000e-001 2 1.076e-001 1.170e-001 1.155e-001 9.033e-002 3 6.868e-002 7.320e-002 7.696e-002 5.587e-002 4 5.004e-002 5.180e-002 5.895e-002 3.938e-002

File: N:\2018\18-81-134 SBCUSD, New Diesel Technology Center\-03\Site Specific Seismic Design\~_Gymnasium Expansion - Seismic Hazard Analysis.DSPDate modified: 11/02/2018 02:56:46 PM
EZ-FRISK 7.65 Build 004 Page 75 of 83
Source: Sierra Madre (San Fernando)Region: USGS 2008 California Closest Distance: 96.29 km Amplitude Units: Acceleration (g) Magnitude: 6.70 Mw Fractile: 0.84 Column 1: Spectral Period Column 2: Acceleration (g) for: Weighted Mean of Attenuation Equations Column 3: Acceleration (g) for: Boore-Atkinson (2008) NGA USGS 2008 MRC Column 4: Acceleration (g) for: Campbell-Bozorgnia (2008) NGA USGS 2008 MRC Column 5: Acceleration (g) for: Chiou-Youngs (2007) NGA USGS 2008 MRC
1 2 3 4 5 PGA 8.513e-002 1.055e-001 8.309e-002 6.677e-002 0.03 8.659e-002 1.054e-001 8.583e-002 6.858e-002 0.05 9.390e-002 1.096e-001 9.582e-002 7.630e-002 0.1 1.298e-001 1.473e-001 1.311e-001 1.111e-001 0.2 1.968e-001 2.440e-001 1.868e-001 1.595e-001 0.3 2.123e-001 2.735e-001 1.998e-001 1.636e-001 0.4 2.040e-001 2.656e-001 1.868e-001 1.596e-001 0.5 1.969e-001 2.604e-001 1.794e-001 1.507e-001 0.75 1.606e-001 2.152e-001 1.435e-001 1.231e-001 1 1.292e-001 1.694e-001 1.150e-001 1.031e-001 2 5.796e-002 7.383e-002 5.464e-002 4.540e-002 3 3.435e-002 4.081e-002 3.477e-002 2.745e-002 4 2.469e-002 2.899e-002 2.608e-002 1.900e-002

File: N:\2018\18-81-134 SBCUSD, New Diesel Technology Center\-03\Site Specific Seismic Design\~_Gymnasium Expansion - Seismic Hazard Analysis.DSPDate modified: 11/02/2018 02:56:46 PM
EZ-FRISK 7.65 Build 004 Page 76 of 83
Fractile: Mean Column 1: Spectral Period Column 2: Acceleration (g) for: Weighted Mean of Attenuation Equations Column 3: Acceleration (g) for: Boore-Atkinson (2008) NGA USGS 2008 MRC Column 4: Acceleration (g) for: Campbell-Bozorgnia (2008) NGA USGS 2008 MRC Column 5: Acceleration (g) for: Chiou-Youngs (2007) NGA USGS 2008 MRC
1 2 3 4 5 PGA 5.617e-002 6.962e-002 5.483e-002 4.406e-002 0.03 5.714e-002 6.953e-002 5.663e-002 4.525e-002 0.05 6.196e-002 7.230e-002 6.322e-002 5.034e-002 0.1 8.554e-002 9.681e-002 8.648e-002 7.332e-002 0.2 1.298e-001 1.610e-001 1.233e-001 1.051e-001 0.3 1.398e-001 1.798e-001 1.318e-001 1.077e-001 0.4 1.346e-001 1.749e-001 1.242e-001 1.048e-001 0.5 1.295e-001 1.707e-001 1.191e-001 9.868e-002 0.75 1.047e-001 1.395e-001 9.433e-002 8.013e-002 1 8.390e-002 1.098e-001 7.520e-002 6.674e-002 2 3.714e-002 4.703e-002 3.531e-002 2.909e-002 3 2.198e-002 2.603e-002 2.246e-002 1.745e-002 4 1.577e-002 1.847e-002 1.684e-002 1.200e-002
Source: Sierra Madre ConnectedRegion: USGS 2008 California Closest Distance: 43.87 km Amplitude Units: Acceleration (g)

File: N:\2018\18-81-134 SBCUSD, New Diesel Technology Center\-03\Site Specific Seismic Design\~_Gymnasium Expansion - Seismic Hazard Analysis.DSPDate modified: 11/02/2018 02:56:46 PM
EZ-FRISK 7.65 Build 004 Page 77 of 83
Magnitude: 7.30 Mw Fractile: 0.84 Column 1: Spectral Period Column 2: Acceleration (g) for: Weighted Mean of Attenuation Equations Column 3: Acceleration (g) for: Boore-Atkinson (2008) NGA USGS 2008 MRC Column 4: Acceleration (g) for: Campbell-Bozorgnia (2008) NGA USGS 2008 MRC Column 5: Acceleration (g) for: Chiou-Youngs (2007) NGA USGS 2008 MRC
1 2 3 4 5 PGA 2.527e-001 3.048e-001 2.046e-001 2.487e-001 0.03 2.639e-001 3.164e-001 2.135e-001 2.619e-001 0.05 2.913e-001 3.340e-001 2.415e-001 2.985e-001 0.1 4.047e-001 4.387e-001 3.414e-001 4.340e-001 0.2 5.357e-001 5.753e-001 4.639e-001 5.679e-001 0.3 5.464e-001 6.108e-001 4.750e-001 5.534e-001 0.4 5.189e-001 5.927e-001 4.503e-001 5.137e-001 0.5 5.032e-001 5.855e-001 4.505e-001 4.735e-001 0.75 4.339e-001 5.163e-001 3.955e-001 3.899e-001 1 3.620e-001 4.103e-001 3.443e-001 3.312e-001 2 1.824e-001 1.955e-001 1.981e-001 1.537e-001 3 1.185e-001 1.258e-001 1.332e-001 9.653e-002 4 8.677e-002 8.900e-002 1.025e-001 6.882e-002
Fractile: Mean Column 1: Spectral Period Column 2: Acceleration (g) for: Weighted Mean of Attenuation Equations Column 3: Acceleration (g) for: Boore-Atkinson (2008) NGA USGS 2008 MRC Column 4: Acceleration (g) for: Campbell-Bozorgnia (2008) NGA USGS 2008 MRC Column 5: Acceleration (g) for: Chiou-Youngs (2007) NGA USGS 2008 MRC

File: N:\2018\18-81-134 SBCUSD, New Diesel Technology Center\-03\Site Specific Seismic Design\~_Gymnasium Expansion - Seismic Hazard Analysis.DSPDate modified: 11/02/2018 02:56:46 PM
EZ-FRISK 7.65 Build 004 Page 78 of 83
1 2 3 4 5 PGA 1.668e-001 2.011e-001 1.350e-001 1.641e-001 0.03 1.742e-001 2.088e-001 1.409e-001 1.728e-001 0.05 1.922e-001 2.204e-001 1.594e-001 1.969e-001 0.1 2.667e-001 2.883e-001 2.253e-001 2.864e-001 0.2 3.535e-001 3.796e-001 3.061e-001 3.747e-001 0.3 3.600e-001 4.014e-001 3.134e-001 3.652e-001 0.4 3.438e-001 3.903e-001 2.995e-001 3.417e-001 0.5 3.332e-001 3.837e-001 3.002e-001 3.157e-001 0.75 2.840e-001 3.347e-001 2.605e-001 2.569e-001 1 2.359e-001 2.658e-001 2.256e-001 2.164e-001 2 1.171e-001 1.245e-001 1.280e-001 9.876e-002 3 7.591e-002 8.024e-002 8.603e-002 6.146e-002 4 5.546e-002 5.672e-002 6.618e-002 4.349e-002
Source: So Emerson-Copper MtnRegion: USGS 2008 California Closest Distance: 79.94 km Amplitude Units: Acceleration (g) Magnitude: 7.10 Mw Fractile: 0.84 Column 1: Spectral Period Column 2: Acceleration (g) for: Weighted Mean of Attenuation Equations Column 3: Acceleration (g) for: Boore-Atkinson (2008) NGA USGS 2008 MRC Column 4: Acceleration (g) for: Campbell-Bozorgnia (2008) NGA USGS 2008 MRC Column 5: Acceleration (g) for: Chiou-Youngs (2007) NGA USGS 2008 MRC

File: N:\2018\18-81-134 SBCUSD, New Diesel Technology Center\-03\Site Specific Seismic Design\~_Gymnasium Expansion - Seismic Hazard Analysis.DSPDate modified: 11/02/2018 02:56:46 PM
EZ-FRISK 7.65 Build 004 Page 79 of 83
1 2 3 4 5 PGA 1.319e-001 1.698e-001 1.170e-001 1.087e-001 0.03 1.351e-001 1.716e-001 1.211e-001 1.126e-001 0.05 1.474e-001 1.802e-001 1.353e-001 1.268e-001 0.1 2.015e-001 2.348e-001 1.839e-001 1.857e-001 0.2 2.830e-001 3.322e-001 2.600e-001 2.570e-001 0.3 2.933e-001 3.449e-001 2.781e-001 2.570e-001 0.4 2.836e-001 3.448e-001 2.628e-001 2.431e-001 0.5 2.763e-001 3.385e-001 2.612e-001 2.293e-001 0.75 2.331e-001 2.865e-001 2.234e-001 1.893e-001 1 1.973e-001 2.406e-001 1.884e-001 1.629e-001 2 1.058e-001 1.314e-001 1.007e-001 8.519e-002 3 6.829e-002 8.365e-002 6.637e-002 5.487e-002 4 5.075e-002 6.254e-002 5.064e-002 3.906e-002
Fractile: Mean Column 1: Spectral Period Column 2: Acceleration (g) for: Weighted Mean of Attenuation Equations Column 3: Acceleration (g) for: Boore-Atkinson (2008) NGA USGS 2008 MRC Column 4: Acceleration (g) for: Campbell-Bozorgnia (2008) NGA USGS 2008 MRC Column 5: Acceleration (g) for: Chiou-Youngs (2007) NGA USGS 2008 MRC
1 2 3 4 5 PGA 8.700e-002 1.121e-001 7.722e-002 7.173e-002 0.03 8.914e-002 1.132e-001 7.992e-002 7.432e-002 0.05 9.729e-002 1.189e-001 8.929e-002 8.365e-002 0.1 1.327e-001 1.543e-001 1.213e-001 1.226e-001 0.2 1.868e-001 2.192e-001 1.715e-001 1.696e-001

File: N:\2018\18-81-134 SBCUSD, New Diesel Technology Center\-03\Site Specific Seismic Design\~_Gymnasium Expansion - Seismic Hazard Analysis.DSPDate modified: 11/02/2018 02:56:46 PM
EZ-FRISK 7.65 Build 004 Page 80 of 83
0.3 1.933e-001 2.267e-001 1.835e-001 1.696e-001 0.4 1.877e-001 2.271e-001 1.748e-001 1.613e-001 0.5 1.823e-001 2.219e-001 1.735e-001 1.515e-001 0.75 1.522e-001 1.857e-001 1.469e-001 1.240e-001 1 1.284e-001 1.559e-001 1.233e-001 1.059e-001 2 6.783e-002 8.372e-002 6.508e-002 5.470e-002 3 4.372e-002 5.336e-002 4.287e-002 3.493e-002 4 3.241e-002 3.986e-002 3.270e-002 2.468e-002
Source: VerdugoRegion: USGS 2008 California Closest Distance: 78.03 km Amplitude Units: Acceleration (g) Magnitude: 6.90 Mw Fractile: 0.84 Column 1: Spectral Period Column 2: Acceleration (g) for: Weighted Mean of Attenuation Equations Column 3: Acceleration (g) for: Boore-Atkinson (2008) NGA USGS 2008 MRC Column 4: Acceleration (g) for: Campbell-Bozorgnia (2008) NGA USGS 2008 MRC Column 5: Acceleration (g) for: Chiou-Youngs (2007) NGA USGS 2008 MRC
1 2 3 4 5 PGA 1.256e-001 1.610e-001 1.107e-001 1.049e-001 0.03 1.284e-001 1.618e-001 1.147e-001 1.088e-001 0.05 1.399e-001 1.685e-001 1.287e-001 1.226e-001 0.1 1.938e-001 2.241e-001 1.774e-001 1.800e-001 0.2 2.812e-001 3.460e-001 2.496e-001 2.480e-001

File: N:\2018\18-81-134 SBCUSD, New Diesel Technology Center\-03\Site Specific Seismic Design\~_Gymnasium Expansion - Seismic Hazard Analysis.DSPDate modified: 11/02/2018 02:56:46 PM
EZ-FRISK 7.65 Build 004 Page 81 of 83
0.3 2.955e-001 3.760e-001 2.638e-001 2.468e-001 0.4 2.823e-001 3.655e-001 2.475e-001 2.339e-001 0.5 2.727e-001 3.576e-001 2.412e-001 2.194e-001 0.75 2.251e-001 2.979e-001 1.989e-001 1.785e-001 1 1.828e-001 2.351e-001 1.636e-001 1.497e-001 2 8.453e-002 1.044e-001 8.248e-002 6.669e-002 3 5.121e-002 5.973e-002 5.323e-002 4.068e-002 4 3.709e-002 4.268e-002 4.016e-002 2.843e-002
Fractile: Mean Column 1: Spectral Period Column 2: Acceleration (g) for: Weighted Mean of Attenuation Equations Column 3: Acceleration (g) for: Boore-Atkinson (2008) NGA USGS 2008 MRC Column 4: Acceleration (g) for: Campbell-Bozorgnia (2008) NGA USGS 2008 MRC Column 5: Acceleration (g) for: Chiou-Youngs (2007) NGA USGS 2008 MRC
1 2 3 4 5 PGA 8.284e-002 1.063e-001 7.306e-002 6.921e-002 0.03 8.475e-002 1.068e-001 7.570e-002 7.178e-002 0.05 9.233e-002 1.112e-001 8.489e-002 8.092e-002 0.1 1.277e-001 1.473e-001 1.171e-001 1.187e-001 0.2 1.855e-001 2.283e-001 1.647e-001 1.636e-001 0.3 1.947e-001 2.471e-001 1.740e-001 1.628e-001 0.4 1.867e-001 2.407e-001 1.646e-001 1.548e-001 0.5 1.797e-001 2.344e-001 1.602e-001 1.446e-001 0.75 1.469e-001 1.932e-001 1.308e-001 1.167e-001 1 1.189e-001 1.523e-001 1.071e-001 9.723e-002 2 5.420e-002 6.651e-002 5.331e-002 4.279e-002 3 3.279e-002 3.810e-002 3.439e-002 2.588e-002

File: N:\2018\18-81-134 SBCUSD, New Diesel Technology Center\-03\Site Specific Seismic Design\~_Gymnasium Expansion - Seismic Hazard Analysis.DSPDate modified: 11/02/2018 02:56:46 PM
EZ-FRISK 7.65 Build 004 Page 82 of 83
4 2.370e-002 2.720e-002 2.593e-002 1.796e-002
Source: Extensional GriddedRegion: USGS 2008 Western US Closest Distance: 12.46 km Amplitude Units: Acceleration (g) Magnitude: 7.00 Mw Fractile: 0.84 Column 1: Spectral Period Column 2: Acceleration (g) for: Weighted Mean of Attenuation Equations Column 3: Acceleration (g) for: Boore-Atkinson (2008) NGA USGS 2008 MRC Column 4: Acceleration (g) for: Campbell-Bozorgnia (2008) NGA USGS 2008 MRC Column 5: Acceleration (g) for: Chiou-Youngs (2007) NGA USGS 2008 MRC
1 2 3 4 5 PGA 5.520e-001 5.286e-001 4.645e-001 6.631e-001 0.03 5.848e-001 5.593e-001 4.885e-001 7.067e-001 0.05 6.510e-001 6.050e-001 5.582e-001 7.897e-001 0.1 9.119e-001 8.512e-001 8.169e-001 1.068e+000 0.2 1.176e+000 1.140e+000 1.073e+000 1.346e+000 0.3 1.165e+000 1.143e+000 1.046e+000 1.338e+000 0.4 1.135e+000 1.154e+000 1.003e+000 1.272e+000 0.5 1.082e+000 1.118e+000 9.684e-001 1.179e+000 0.75 9.056e-001 9.323e-001 8.087e-001 9.882e-001 1 7.664e-001 7.561e-001 6.927e-001 8.584e-001 2 4.075e-001 4.018e-001 3.856e-001 4.357e-001 3 2.583e-001 2.510e-001 2.548e-001 2.691e-001
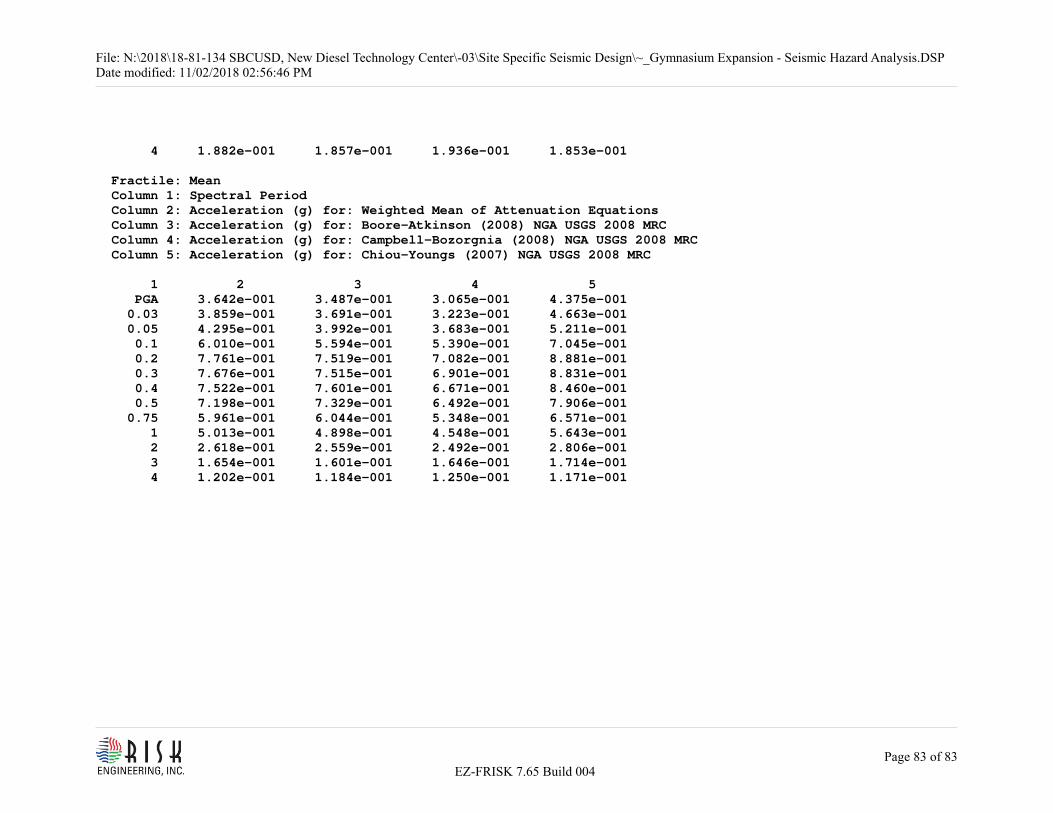
File: N:\2018\18-81-134 SBCUSD, New Diesel Technology Center\-03\Site Specific Seismic Design\~_Gymnasium Expansion - Seismic Hazard Analysis.DSPDate modified: 11/02/2018 02:56:46 PM
EZ-FRISK 7.65 Build 004 Page 83 of 83
4 1.882e-001 1.857e-001 1.936e-001 1.853e-001
Fractile: Mean Column 1: Spectral Period Column 2: Acceleration (g) for: Weighted Mean of Attenuation Equations Column 3: Acceleration (g) for: Boore-Atkinson (2008) NGA USGS 2008 MRC Column 4: Acceleration (g) for: Campbell-Bozorgnia (2008) NGA USGS 2008 MRC Column 5: Acceleration (g) for: Chiou-Youngs (2007) NGA USGS 2008 MRC
1 2 3 4 5 PGA 3.642e-001 3.487e-001 3.065e-001 4.375e-001 0.03 3.859e-001 3.691e-001 3.223e-001 4.663e-001 0.05 4.295e-001 3.992e-001 3.683e-001 5.211e-001 0.1 6.010e-001 5.594e-001 5.390e-001 7.045e-001 0.2 7.761e-001 7.519e-001 7.082e-001 8.881e-001 0.3 7.676e-001 7.515e-001 6.901e-001 8.831e-001 0.4 7.522e-001 7.601e-001 6.671e-001 8.460e-001 0.5 7.198e-001 7.329e-001 6.492e-001 7.906e-001 0.75 5.961e-001 6.044e-001 5.348e-001 6.571e-001 1 5.013e-001 4.898e-001 4.548e-001 5.643e-001 2 2.618e-001 2.559e-001 2.492e-001 2.806e-001 3 1.654e-001 1.601e-001 1.646e-001 1.714e-001 4 1.202e-001 1.184e-001 1.250e-001 1.171e-001

File: N:\2018\18-81-134 SBCUSD, New Diesel Technology Center\-03\Site Specific Seismic Design\~_Gymnasium Expansion - Seismic Hazard Analysis.PSPDate modified: 11/02/2018 02:56:36 PM
EZ-FRISK 7.65 Build 004 Page 1 of 1
Probabilistic Spectra results for EZ-FRISK 7.65 Build 004
ANNUAL FREQUENCY OF EXCEEDANCE: 4.041e-004RETURN PERIOD: 2474.9PROBABILITY OF EXCEEDENCE: 2.0% IN 50.0 YEARS Column 1: Spectral Period Column 2: Acceleration (g) for: Mean Column 3: Acceleration (g) for: Boore-Atkinson (2008) NGA USGS 2008 MRC Column 4: Acceleration (g) for: Campbell-Bozorgnia (2008) NGA USGS 2008 MRC Column 5: Acceleration (g) for: Chiou-Youngs (2007) NGA USGS 2008 MRC
1 2 3 4 5 PGA 1.303e+000 1.236e+000 1.173e+000 1.467e+000 0.03 1.390e+000 1.335e+000 1.224e+000 1.575e+000 0.05 1.548e+000 1.469e+000 1.367e+000 1.767e+000 0.1 2.144e+000 2.165e+000 1.825e+000 2.351e+000 0.2 2.721e+000 2.737e+000 2.325e+000 * 3.040e+000 0.3 2.847e+000 2.927e+000 2.391e+000 * 3.158e+000 0.4 2.823e+000 2.953e+000 2.410e+000 * 3.055e+000 0.5 2.771e+000 2.923e+000 2.493e+000 2.877e+000 0.75 2.567e+000 2.687e+000 2.429e+000 2.583e+000 1 2.322e+000 2.182e+000 2.334e+000 2.433e+000 2 1.517e+000 1.353e+000 1.707e+000 1.472e+000 3 1.111e+000 1.064e+000 1.204e+000 1.053e+000 4 8.604e-001 8.174e-001 9.649e-001 7.860e-001