Embed Size (px)
Citation preview
THE LABOR OF DIVISION:
RETURNS TO COMPULSORY MATH COURSEWORK
Joshua Goodman
Harvard Kennedy School, 79 JFK St., Cambridge, MA 02139
November 2009
ABSTRACT
Labor economists know that a year of schooling raises earnings but have little evidence on the impact of specific courses completed. I identify the impact of math coursework on earnings using the differential timing of state-level increases in high school graduation requirements as a source of exogenous variation. The increased requirements induced large increases in both the completed math coursework and earnings of blacks, particularly black males. Two-sample instrumental variable estimates suggest that each additional year of math raised blacks' earnings by 5-9%, accounting for a large fraction of the value of a year of schooling. Closer analysis suggests that much of this effect comes from black students who attend non-white schools and who will not attend college. The earnings impact of additional math coursework is robust to changes in empirical specification, is not driven by selection into the labor force, and persists when earnings are conditioned on educational attainment. The reforms close one fifth of the earnings gap between black and white males. Estimates for whites are similar to those of blacks but are much noisier due to the reforms' weaker impact on white students' coursework. These results suggest that math coursework is an important determinant of the labor market return to schooling, that simple minimum requirements largely benefit low-skilled students, and that more demanding requirements might be necessary to improve the outcomes of high-skilled students.
Acknowledgements: This paper benefited from the feedback of a great number of people, including Janet Currie, David Figlio, Ed Glaeser, Jonah Rockoff, Johannes Schmieder, Sarah Turner, and Miguel Urquiola, as well as participants of Columbia’s Applied Microeconomics Workshop, Harvard's Labor and Public Economics Workshops, the 2009 annual meeting of the American Economic Association, and the 2009 fall meeting of NBER's Education Program. Tom Bailey graciously allowed me access to the transcript data through the Community College Research Center at Columbia University's Teachers College.

Introduction and Previous Literature
An extensive literature within labor economics concludes that an additional year
of schooling raises individuals' labor market earnings by an average of roughly 10-15%
(Card, 1999; Oreopoulos, 2006). Relatively little is known about whether the content of
that additional year of schooling affects the returns to that schooling. The problem is
twofold. First, most data sets used by labor economists contain only the amount of
completed schooling, not the coursework completed during that schooling. Second,
even when the coursework completed by students is known, researchers have generally
been unable to deal with the bias arising from the non-random selection of students into
courses. I overcome the data limitations by compiling a nationally representative time
series of high school transcripts that contained detailed information on students'
completed coursework. I address selection bias by instrumenting students’ coursework
with differentially timed state-level reforms of high school graduation requirements.
These reforms, combined with unique data described in more detail below, allow for
the first clear causal estimates of the impact of coursework on labor market outcomes.
This paper builds on a large literature demonstrating the labor market return to a
year of schooling. Simple correlations between schooling and earnings are likely biased
by omission of variables such as ability and family background, so researchers have
sought instrumental variables that provide exogenous variation in individuals'
schooling attainment. Perhaps the most commonly used instruments are compulsory
schooling laws that require students to remain in school until a certain age. Changes in
such laws, or interactions between birth timing and such laws, have provided a rich set
of results, starting with Angrist and Krueger (1991) and continuing more recently with
Acemoglu and Angrist (2000), Lleras-Muney (2005) and Oreopoulos, Page and Stevens
(2006). These studies conclude that compulsory schooling laws do increase schooling
attainment and that this increased attainment in turn improves earnings, mortality
rates, and the educational progress of the children of those affected by such laws. The
causal benefit of schooling is thus clear. What is less clear is why schooling attainment
has such a large, positive impact on earnings (as well as the other outcomes measured).
The compulsory schooling laws that serve as instruments in these studies affect only the
amount of time spent in school. This paper provides the first evidence that compulsory
changes in the amount of time spent in specific courses can be a significant determinant
of the labor market return to a year of schooling.
Only a few previous studies have attempted to explore the value of specific
coursework and have met with mixed success. Altonji (1995), Levine and Zimmerman
(1995), and Rose and Betts (2004) all use longitudinal surveys of high school students to
track the relation between coursework and labor market outcomes. These papers use
various techniques to deal with selection bias, including high school fixed effects,
instrumenting for coursework with average coursework completed at the students' high
schools, and controlling flexibly for students' measured abilities. Though the results of
these papers vary substantially, the latter two find that math courses are powerful
predictors of earnings later in life, at least for some demographic subgroups. The fact
that these studies reach differing conclusions about the value of specific coursework
may in part be attributed to the imperfections in the techniques for dealing with
selection bias. High school fixed effects do not control for differences in individual
ability, results from controlling for individual ability directly may depend heavily on
functional form assumptions, and average high school courseload is not a valid
instrument as it is almost certainly correlated with other factors (such as the quality of
the high school's college guidance department) that should directly impact future
wages. One of the contributions of this paper is to deal with selection bias in a more
convincing way by employing the exogenous shock of state-level policy changes.
Whether specific coursework affects the value of a year of schooling is a critical
public policy question because it affects both the allocation of scarce public funds
within educational systems and the extent to which policymakers should view school
curricula as tools for improving the workforce. This is of particular concern given a
recent literature that attributes rising income inequality in the U.S. in part to skill-biased
technological change, as summarized in Autor and Katz (1999) and given a longer
historical perspective in Goldin and Katz (2007). One particular version of this theory,
explored by Autor, Levy and Murnane (2003) and by Goos and Manning (2007)
suggests that technology is replacing ``middling'' routinized jobs, thus polarizing the
workforce into low- and high-skilled non-routinized jobs. There is a sense that a high
quality educational system should impart to its students skills that increase their
probability of obtaining high-earning, technologically sophisticated jobs. This was
certainly the belief of the authors of the report that spurred the reforms central to this
paper. Whether specific courses are particularly effective in providing good labor
market opportunities to students is of critical importance given this country's growing
income inequality.
To preview the paper's central results, I find that The increased requirements
induced large increases in both the completed math coursework and earnings of blacks,
particularly black males. Two-sample instrumental variable estimates suggest that each
additional year of math raised blacks' earnings by 5-9%, accounting for a large fraction
of the value of a year of schooling. Closer analysis suggests that much of this effect
comes from black students who attend non-white schools and who will not attend
college. The earnings impact of additional math coursework is robust to changes in
empirical specification, is not driven by selection into the labor force, and persists when
earnings are conditioned on educational attainment. The reforms close one fifth of the
earnings gap between black and white males. Estimates for whites are similar to those
of blacks but are much noisier due to the reforms' weaker impact on white students'
coursework. These results suggest that math coursework is an important determinant of
the labor market return to schooling, that simple minimum requirements largely benefit
low-skilled students, and that more demanding requirements might be necessary to
improve the outcomes of high-skilled students.
Description of Reforms
The increased graduation requirements that serve here as the exogenous source
of variation in student coursework were prompted largely by the publication in April
1983 of ``A Nation at Risk'', the final report of President Reagan's National Commission
on Excellence in Education. The commission had been convened to address perceived
declines in quality of education received by American high school students. The first
two sentences of the report read: ``Our Nation is at risk. Our once unchallenged
preeminence in commerce, industry, science, and technological innovation is being
overtaken by competitors throughout the world.'' The report continued by mentioning
Japan, South Korea and Germany as countries making technological advances in
industries where America had historically been dominant, concluding that ``Learning is
the indispensable investment required for success in the 'information age' we are
entering.''
One of the primary causes of the educational decline cited by the commission
was that ``Secondary school curricula have been homogenized, diluted, and diffused to
the point that they no longer have a central purpose.... This curricular smorgasbord,
combined with extensive student choice, explains a great deal about where we find
ourselves today.'' Noting that American high school students earned 25% of their
credits in ``physical and health education, work experience outside the school, remedial
English and mathematics, and personal service and development courses'', the
commission proposed that state and local graduation requirements be strengthened
dramatically. Specifically, the commission recommended that ``all students seeking a
diploma be required to lay the foundations in the Five New Basics by taking the
following curriculum during their 4 years of high school: (a) 4 years of English; (b) 3
years of mathematics; (c) 3 years of science; (d) 3 years of social studies; and (e) one-half
year of computer science.''
The vast majority of states reacted to the commission's recommendations by
increasing (or imposing for the first time) the minimum number of years in various
subjects necessary for a students to receive a high school diploma, though not
necessarily to the levels that the commission had recommended. Based on documents
from the Education Commission for the States, I construct for each state and for each
graduating class of 1982 through 1994 the minimum number of math, science, social
studies, English and other courses a student would need to complete in order to receive
a high school diploma, where ``course'' refers to a full year of study. Though many
states enacted multiple increases simultaneously, I focus in this paper on the increases
in math requirements because they are the most common type of reform, because math
skills are considered a particular weakness of the American educational system, and
because prior research suggests that math coursework may be particularly important in
determining wages. I will also show that controlling for other curricular reforms has
does not substantially change the estimated impacts of the math reforms.
Figure 1 shows the timing of the math reforms enacted by the states. Only a
handful of states enacted reforms applying to classes prior to 1987. The bulk of the
reforms are roughly evenly split between the classes of 1987, 1988, and 1989, with only
two states enacting reforms after that period. This timing is explained by state
legislatures responding relatively quickly to ``A Nation at Risk'' by legislating increased
graduation requirements in year Y (where Y was generally 1983, 1984, or 1985) to apply
to students entering high school that year, and thus graduating with the class of Y+4.
Compared to the class of 1982, the class of 1994 faced higher minimum math
requirements in 41 of the 51 states in the U.S.
Table 1 categorizes states by their pre- and post-reform numbers of math courses
required for graduation, so that each cell represents a particular type of reform. The
most common reform is an increase from one to two math courses required, while the
second most common is an increase from two to three. States in the rightmost cells of
the top row are those that enacted statewide minimum graduation requirements for the
first time. The majority of states that enacted reforms thus set their new minimum at
two courses, lower than the commission's recommendation. The ten states along the
diagonal enacted no reforms during this time period.
Figure 2 provides a graphical representation of the reforms. Panels (A) and (B)
show each state's minimum math requirements at the beginning and end of the time
period in question. In 1982, the vast majority of states allowed students to graduate high
school with zero or one completed math courses, while only a handful of states required
a two course minimum and none required three. By 1994, the vast majority of states
required at least two math courses, and a number required three. Only six states set no
minimum requirements at that point in time. Panel (C) shows the different timing of the
reforms, dividing the states into those that reformed earlier (1984-1987) and those that
reformed later (1988-1990). As will be explained below, these two time periods
correspond to those available in the transcript data. There is some geographic
correlation among the early reforming states, with such states concentrated in the
southeastern and western parts of the country. To account for this, some of the
empirical specifications used below will include Census division-specific trends that
will control for any geographically differing trajectories of different parts of the country.
Though most states' reforms were one course increases, some states enacted
apparently stronger reforms by moving from no statewide minima to two- and three-
course minima. I will exploit only the differential timing of the reforms and not their
differing magnitudes to achieve identification, for two reasons. First, states that had no
requirements at the beginning of this time period, such as California, nonetheless had
very few students actually graduating with no completed math coursework. This is
likely due to local school districts setting higher minima than required by the state. It is
thus unclear whether to label California's increase from zero to two courses a stronger
reform than Virginia's increase from one to two courses. Second, some states issue
multiple types of high school diplomas that distinguish students by the difficulty of
their completed coursework. Thus, although I have categorized states by the lowest
requirements that allow graduation from high school, reforms to higher types of
diplomas sometimes occurred simultaneously, thus clouding the issue of precisely how
strong each state's reform was. The timing of the reforms is, however, less ambiguous
and, as seen in figure 2, sufficiently varied as to achieve identification.
Data
If a single data set existed containing information on high school coursework and
labor market outcomes for individuals from classes in the 1980s and 1990s, I could use
the reforms to instrument for coursework and thus derive unbiased estimates of the
impact of coursework on earnings. Unfortunately, there does not exist a single data set
containing all of this information in a way that allows me to exploit the differential
timing of the reforms spurred by ``A Nation at Risk''. The few longitudinal studies that
follow students from high school to the labor market (such as the National Longitudinal
Survey of Youth, High School and Beyond, and the National Education Longitudinal
Study) cover too few graduating classes to be useful, while most traditional data sets
used by labor economists (the Current Population Survey, the Panel Survey of Income
Dynamics) contain little or no information on high school coursework.
I solve this problem by exploiting two separate data sources, a time series of
transcript studies that I construct and Census data containing labor market outcomes.
The transcript data allow estimation of a first stage impact of the reforms on
coursework, while the Census data allows estimation of the reduced form impact of the
reforms on earnings. Combining these estimates through two-sample instrumental
variables (TSIV), as will be described in detail below, generates the impact of
coursework on earnings. The following two subsections describe the data sets in more
detail.
Transcript Data
The primary challenge in determining whether these reforms affected students'
coursework is that no data set contains detailed information on students' coursework on
a class-by-class and state-by-state basis. The federal government does, however, collect
a national sample of high school transcripts every few years through the National
Center for Education Statistics (NCES). One of the earliest such collections occurred for
the class of 1982, with the High School and Beyond Survey (HSB). Three more waves
followed for the classes of 1987, 1990 and 1994, in transcript studies associated with the
National Assessment of Educational Progress (NAEP). For each of these waves, NCES
collects from high schools around the country both a set of students' transcripts, which
list the specific courses students have completed, as well as each high school's
handbook of course descriptions. The latter allows NCES to uniformly code courses that
might otherwise have different names in different high schools, according to a scheme
known as the Secondary School Taxonomy.
I compile these four transcript collections into a single data set of roughly 70,000
students for whom I can identify their state of high school attendance and the class with
which they graduated.1
1 To my knowledge, this is the first such use of this data, perhaps because accessing the state identifiers requires obtaining a restricted-use license from NCES. This license in turn requires users to access the data on a pre-approved site that contains a secured computer. I am grateful to Professor Thomas Bailey and Matthew Heidelberg at the Community College Research Center at Teachers College, Columbia University, for allowing me to use the data through their site.
The timing of the four waves implies that the 1982 wave is a
purely pre-reform sample, the 1987 wave is a mixture of states that had and had not yet
enacted reforms, and the 1990 and 1994 waves are post-reform samples. Because the
1990 and 1994 waves include only high school graduates, I exclude high school
dropouts from the earlier waves in order to make the sample comparable over time. I
also exclude Hispanic students because using state of birth as a proxy for state of high
school in the Census data will eliminate the large fraction of Hispanic respondents born
in foreign countries. The subsequent analysis will thus focus on four separate
demographic groups (black males, black females, white males and white females)
because the reforms had differential impacts on these groups' coursework and earnings.
For each high school graduate of the classes of 1982, 1987, 1990 and 1994, the
transcript data allow construction of the number of courses for which the student
received credit in various subject areas.2
Panel (A) of table 2 shows the mean completed coursework for each group over
this entire time period. The top row reveals that black students completed nearly
identical amounts of math coursework as white students, with each group averaging
slightly more than three courses. The composition of that coursework differed greatly,
however, between black and white students, with black students and particularly black
males completing more of their coursework in basic math. This suggests that black
students are exposed to less rigorous math curricula than white students, have lower
math skills than white students, or some combination of those two factors. Panel (A)
also shows that over this time period, only 38% of black students complete at least four
years of math, compared to 43% of white students. Black students also complete fewer
total credits in other courses. All of these facts suggest substantial differences in the
high school curricula to which black and white students are exposed. Completing a
high school degree may thus imply substantial skill differences between these two
populations, hence the importance of exploring the returns to not only years of
schooling but also to specific coursework.
For simplicity, I divide math courses into two
categories, which I label basic and advanced. Basic courses are those with titles such as
vocational mathematics, consumer mathematics, basic mathematics, special education
mathematics and pre-algebra. Advanced courses include algebra I, geometry, algebra II,
pre-calculus, calculus and statistics. I also compute the total number of completed
courses in all other subjects.
Census Data
2 NCES provides a standardized unit of credit, called a Carnegie unit, that represents a standard full-year course.
Because the NAEP waves of the transcript data do not follow students beyond
high school to observe later outcomes, I turn to the 5% Public Use Microdata Sample
(PUMS) of the 2000 Census, which aims to survey 1 out of every 20 Americans.3
Outcomes of interest contained in PUMS include respondents' educational attainment,
labor force participation, earnings in the past year (i.e. 1999), and occupation.
Educational attainment is coded into four categories: high school dropouts, high school
graduates, those who attended some college but have not earned a degree, and those
who have a college degree (from a two- or four-year college). I recode incomes below
$5,000 and above $150,000 as missing to prevent outliers from unduly influencing the
results below. Respondents also report their occupation, which PUMS codes into nearly
500 categories according to the Standard Occupational Classification system. I merge
these occupations with a normalized measure of the mathematical skill required for
each occupation, which I derive from characteristics contained in the federal
government's Occupational Network Database (O-Net 4.0).4
Unlike the transcript data, the Census data does not contain information on the
state in which respondents attended high school. I therefore assume that respondents
attended high school in their reported states of birth and that they graduated in the
class of the year they turned 18 (the median and modal graduation age for Americans).
For simplicity, I then
divide occupations into those in the upper half of the mathematical skill distribution,
which I label ``skilled'' occupations, and those in the lower half, which I label
``unskilled''.
3 I accessed the data through http://usa.ipums.org/usa/, which provides a user-friendly interface and excellent documentation.
4 Specifically, O-Net contains for each occupation four measures of the importance of math, rated on a scale of one to five. These measures are the knowledge of mathematics, the skill of mathematics, the ability of mathematical reasoning, and the ability of number facility. The distinction between these categories is unclear and correlation between them is quite high, so I simply take the average of the four scores.
For comparability to the transcript data, I then limit the sample to those students who
turned 18 between 1982 and 1994. The sample thus consists of respondents who are
between 24 and 36 years of age in 2000. I avoid assigning state of high school attendance
by state of current residence due to the potential for selection bias that might arise from
high earning individuals migrating to states with improved educational systems. State
of birth, though obviously an imperfect measure of state of high school, is at least
exogenous to the reforms studied here.5
Panel (B) of table 2 shows the mean characteristics of the PUMS sample. I limit
the sample to those students who are at least high school graduates to make the sample
comparable to the transcript sample. This procedure excludes 23% of black males, 17%
of black females, and roughly 10% of white respondents. I show later that this does not
create selection bias but nonetheless run many of the subsequent regressions both
excluding and including high school dropouts. Even with the sample limited to those
with at least a high school degree, large educational disparities are immediately obvious
between black and white students and even between black males and females.
Conditional on having a high school degree, black students (and particularly black
males) are roughly half as likely to be college graduates as their white counterparts.
Though black and white women have similar labor force participation, only 77% of
black males report being in the labor force relative to 92% of white males. Only 79% of
black males report any earnings from the previous year, compared to 92% of white
As mentioned previously, because an
extremely large fraction of Hispanic respondents are born outside of the U.S., this
procedure forces me to exclude Hispanic students from the analysis.
5 Rough estimates from the 1990 PUMS suggest that over 75% of high school age students reside in their state of birth, so that measurement error is not overwhelmingly large. Assigning high school class based on current age also introduces measurement error, as some students graduate high school at earlier or later ages. These facts should bias the subsequent results toward zero, suggesting that I may be underestimating the impacts of these reforms on earnings.
males. Conditional on reporting earnings from the previous year, blacks earn $6,000 less
than whites, with the gap between black and white males closer to $8,000.
Finally, the measure of occupational math skill suggests that blacks and
particularly black males are in less skilled occupations relative to their white
counterparts. Only 36% of black males in the sample are in skilled occupations relative
to 48% of white males, as defined by the measure of mathematical skill mentioned
above. Part of this disparity is clearly due to educational differences, but even
conditional on educational attainment blacks and particularly black males are
significantly less likely to be in skilled occupations than whites. This can been seen in
figure 3, in which panel (A) shows the overall fraction of each subgroup in a skilled
occupation (the same fraction shown in the final row of table 2). Panels (B), (C) and (D)
show that even conditional on education, black males are 5-10% percentage points less
likely to be in skilled occupations than white males, and a similar or even larger gap
appears between black and white females. Assuming individuals enter occupations in
which they have comparative advantages, these figures suggest that blacks are at a
serious disadvantage with regard to the skills required by these occupations. Between
education, occupation and earnings, the overall picture is thus a consistent one of blacks
disadvantaged relative to whites and black males particularly disadvantaged.
Impact of Reforms on Coursework
Identification Strategy
As the previous literature on this topic has shown, simply comparing the
earnings of individuals with differing amounts of math coursework is likely to lead to
biased estimates of the impact of this coursework, due to omitted variables such as
ability. Previous papers have dealt with this by using instrumental variables or fixed
effects techniques that suffer from the flaws mentioned previously. I use the timing of
the math reforms induced by ``A Nation at Risk'' as a source of exogenous variation in

the math coursework students complete, thus avoiding the bias potentially plaguing
previous estimates. Identification will be achieved through the within-state changes in
math coursework, controlling for year-specific nationwide shocks. This means that
identification comes from the comparison of states whose increased requirements
applied to the class of 1987 (or earlier) to those states who increased requirements
applied to the classes of 1988-1990.
One potential concern with this strategy is that states enacting earlier reforms
may be fundamentally different than states enacting later reforms, particularly with
regard to their educational systems. If, for example, states are more likely to pass
reforms early if their students have low levels of completed math coursework, then the
estimates below might represent mean reversion rather than a true causal impact of the
reforms. To show that the date of the reforms seems plausibly exogenous to the math
coursework in a given state, columns (1) through (3) of Table 3 shows the mean initial
completed coursework (in 1982) of states by the date of their reform. The top row of
panel (A) reveals that black students completed 2.77 math courses in early-reforming
states while black students in later-reforming states completed 2.81 on average, a
statistically insignificant difference as the p-value in column (4) demonstrates. Nor was
initial coursework in those state that never enacted reforms statistically different from
the later reforming states, as shown in column (5). The next two rows show the fraction
of students in 1982 who fell below the new, higher minimum requirements that the state
would later set were nearly identical in early- and later-reforming states, as were the
average number of courses by which such students failed to meet that new minimum.
The final row of panel (A) shows that earnings in early and later reforming states were
quite similar for black graduates of the class of 1982, though the non-reforming states
did have higher mean incomes. As a result, the empirical analysis below will show
results both including and excluding the non-reforming states. Panel (B) suggests
roughly similar results for white students, though mean coursework in 1982 does differ
significantly by reform wave, so that mean reversion may be a concern for white
students.
Initial evidence that the reform timing is clearly associated with sharp breaks in
both completed coursework and earnings for black students comes from figure 4.
Panels (A) and (B) graph mean completed coursework over time, with early and later
reforming states shown separately. For simplicity, non-reforming states have been
omitted here. Panel (A) shows that, for black students, completed math coursework rose
most sharply in the early time period for early reforming states and the later time
period for later reforming states. Overall, black students' completed a remarkable 0.4
more math courses in 1994 than they did in 1982, a nearly 15% increase. Panel (B)
repeats the exercise for white students, who show even larger increases in math
coursework but somewhat less connection to the timing of the reforms.
Panels (C) and (D) show similar results with the logarithm of annual earnings as
the outcome. In panel (C), black students in the class of 1982 have nearly identical
earnings in early and later reforming states. A gap opens up, however, for classes in the
mid-1980s, where respondents from early reforming states in those classes earn more
than their classmates in later reforming states. By 1990, this gap has vanished. In panel
(D), no such gap is observable for white students. Taken as a whole, these panels
strongly suggest that the math reforms had large impacts on both the coursework and
earnings of blacks and smaller or no impacts on those of whites.
To rigorously quantify the impacts of the reforms, I run regressions of the form
iscscscisc ενµβα ++++= MathReformCourses
where Courses represents the number of courses completed by individual i in state s in
class c and MathReform indicates whether that individual was subject to an increased
math requirement. Class and state fixed effects are included so that β identifies the
within-state effect of a reform to math requirements, controlling for nationwide class-
specific shocks.
To that baseline specification I sequentially add further controls for other state-
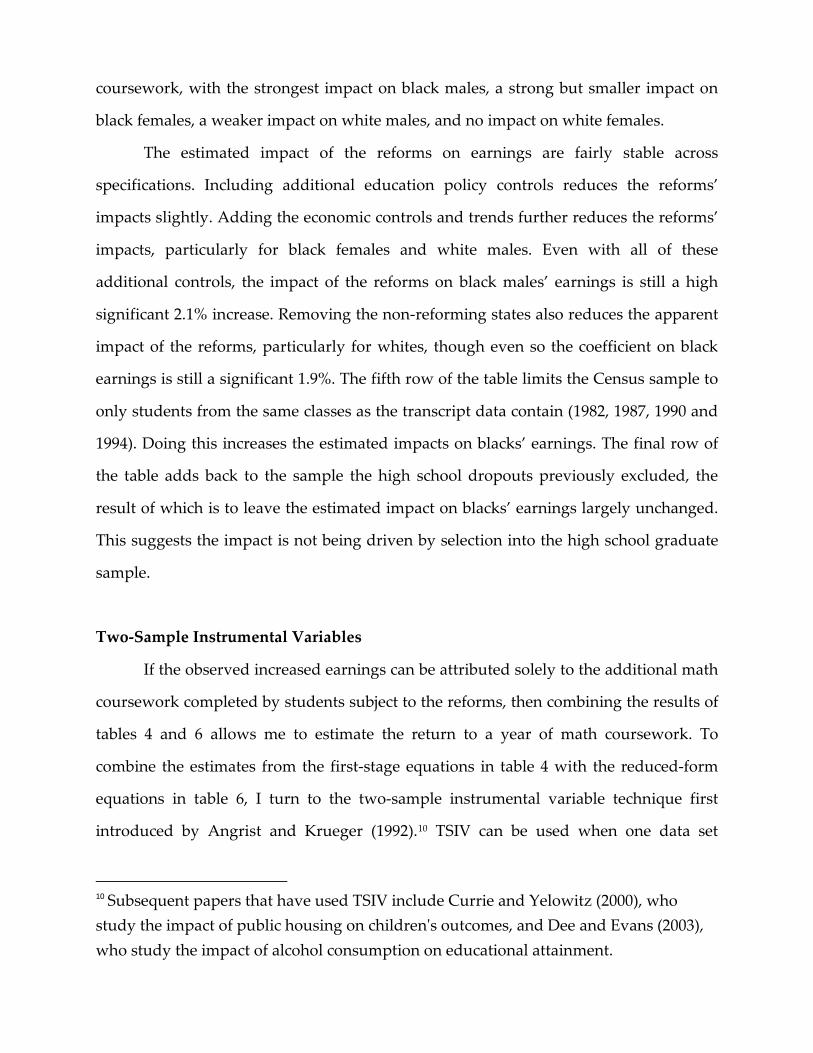
level education policies and economic conditions. These regressions thus have the form
iscscscscisc ενµφβα +++++= EdPolicyMathReformCourses
and
iscscdscscscisc c ενµκδφβα +++++++= EconomyEdPolicyMathReformCourses
Here, EdPolicy includes the total number of other course requirements, an indicator for
an exit exam requirement, and per-student expenditures and student-teacher ratios for
state s and class c.6 Economy includes the state-level poverty and unemployment rates
and κ is a vector of linear time trends by Census division d.7
Heteroskedasticity robust
standard errors are clustered by state to allow for within-state serial correlation in the
error terms, a concern raised by the now well-known result of Bertrand, Duflo and
Mullainathan (2004).
Empirical Results
Panel (A) of table 4 contains the central results for the impact of the reforms on
completed coursework. The reforms had large and highly statistically significant
impacts on black students, inducing black males to complete 0.40 more math courses
and black females to complete 0.28 more math courses. For black males, this increase
was roughly evenly split between basic and advanced courses, while for black women
advanced courses accounted for more than half of the increase. The impact of the
reforms is less strong on white students, inducing a 0.19 course rise for white males and
a statistically insignificant 0.10 course rise for white females (though white females do 6 Though some states did introduce exit exams during this time period, the timing of such reforms turns out to be largely uncorrelated with the math reforms of interest, so that inclusion of the exit exam requirement has little impact on any of the subsequent estimates.
7 Ideally, I would control for state-specific trends, but the four transcript waves represent too few data points per state with which to estimate such trends.
show a statistically significant 0.12 increase in basic math). The reforms thus had
powerful impacts on black students, particularly males, smaller impacts on white
males, and little impact on white females' coursework. Panel (A) will serve as the first-
stage estimates of the impact of the reforms on students' coursework. The reforms are
thus strong instruments for black students' coursework (with F-statistics greater than
the value of 10 recommended by Bound, Jaeger and Baker (1995)), but less so for white
students. As such, I will argue that the subsequent estimates of the impact of math
courses on earnings for blacks are clear, while those for white students are at best
suggestive.
The bottom half of panel (A) shows the impact of the reforms on the distribution
of math courses completed by students. Interestingly, much of the increase in
coursework is attributable to large (18 percentage point) drops in the number of black
students completing two or fewer math courses. Two thirds (12 percentage points) of
those students take a full four years of more of math as a result of the reforms, far above
the minima set by the state. This suggests that the state reforms induced schools to
emphasize or require amounts of math coursework beyond the state minima, perhaps
because schools did not want to be seen as simply fulfilling the bare minimum
requirements themselves.8
Panel (B) shows how the estimated impacts of the math reforms change if other
education policy controls are added, if economic controls and trends are added, or if the
sample excludes those states that did not pass reforms. The general results discussed
above hold in all four specifications. Black students are strongly affected by the reforms,
with black males more strongly affected. White males are more weakly affected and
Finally, the last row of panel (A) shows that the timing of the
math reforms is not associated with statistically significant increases in the total amount
of non-math coursework, implying that the reforms worked primarily through
increased math coursework.
8 This is yet another reason not to use the “strength” of the state reforms as the exogenous variable, as many schools seem to have pushed students beyond the specific state requirements.
white females are barely affected if at all. Panel (C) and (D) apply the four specifications
to basic and advanced math. Again, the overall picture changes little with each
specification. Black males’ increased coursework was roughly split between basic and
advanced courses, while black females’ increased coursework is generally dominated
by advanced coursework, particularly in the specification with the maximum number of
additional controls.
Table 5 explores the impact of these reforms by school type. In panel (A), I divide
schools into white and non-white schools, where the former are defined as those
schools in which more than 80% of the transcripts were collected from white students.9
Though the reforms have some impact on students in white schools, the bulk of the
impact for both black and white students come from those students in non-white
schools. Assuming that racial composition is a good proxy for socioeconomic status, this
unsurprisingly suggests that the reforms had their largest impact on the most
disadvantaged schools. Panel (B) runs a similar analysis, dividing schools into public
and private, the latter of which constitute roughly 10% of the sample. Again,
unsurprisingly, the reforms had much larger impacts on public schools, which were
legally bound by the state requirements than on private schools, which were not.
Impact of Reforms on Earnings
Identification Strategy
To quantify the impacts of the reforms on earnings, I run regressions on the
Census data identical in form to those used with the transcript data, but with earnings
as the dependent variable. The estimating equations thus look like:
iscscscisc ενµβα ++++= MathReforms)Ln(earning
9 Other measures of school racial and socioeconomic composition are not comparable across the different waves of transcript data.
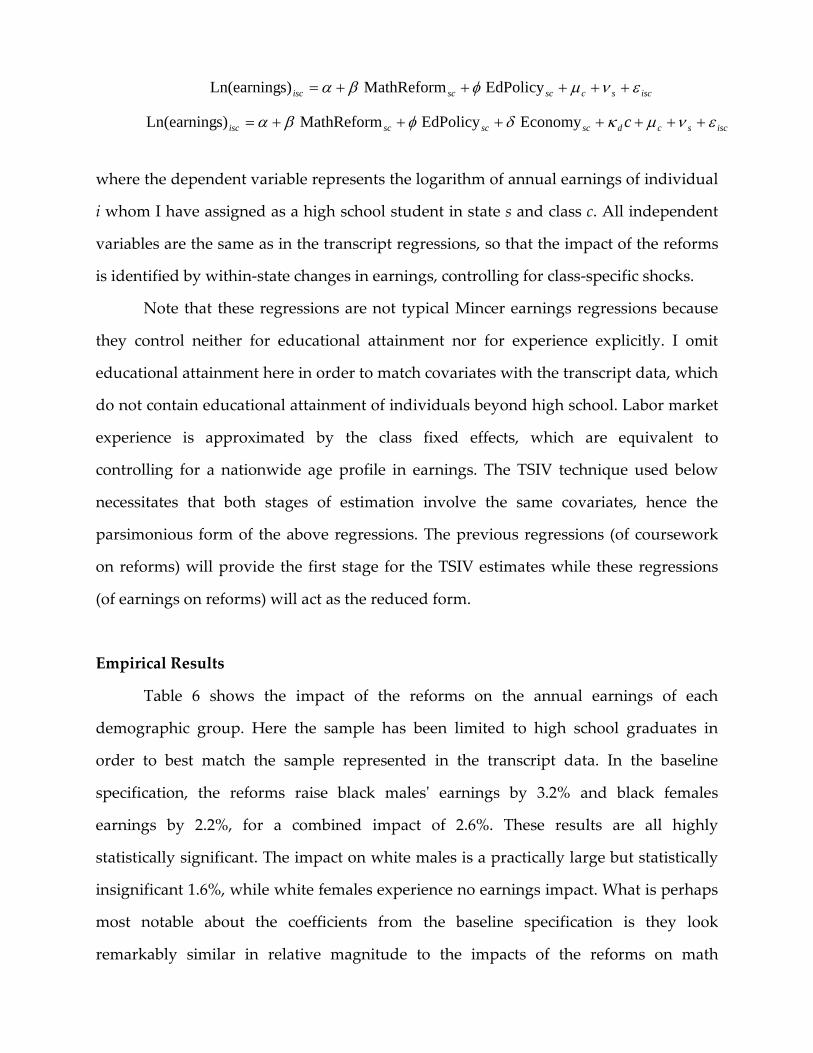
iscscscscisc ενµφβα +++++= EdPolicyMathReforms)Ln(earning
iscscdscscscisc c ενµκδφβα +++++++= EconomyEdPolicyMathReforms)Ln(earning
where the dependent variable represents the logarithm of annual earnings of individual
i whom I have assigned as a high school student in state s and class c. All independent
variables are the same as in the transcript regressions, so that the impact of the reforms
is identified by within-state changes in earnings, controlling for class-specific shocks.
Note that these regressions are not typical Mincer earnings regressions because
they control neither for educational attainment nor for experience explicitly. I omit
educational attainment here in order to match covariates with the transcript data, which
do not contain educational attainment of individuals beyond high school. Labor market
experience is approximated by the class fixed effects, which are equivalent to
controlling for a nationwide age profile in earnings. The TSIV technique used below
necessitates that both stages of estimation involve the same covariates, hence the
parsimonious form of the above regressions. The previous regressions (of coursework
on reforms) will provide the first stage for the TSIV estimates while these regressions
(of earnings on reforms) will act as the reduced form.
Empirical Results
Table 6 shows the impact of the reforms on the annual earnings of each
demographic group. Here the sample has been limited to high school graduates in
order to best match the sample represented in the transcript data. In the baseline
specification, the reforms raise black males' earnings by 3.2% and black females
earnings by 2.2%, for a combined impact of 2.6%. These results are all highly
statistically significant. The impact on white males is a practically large but statistically
insignificant 1.6%, while white females experience no earnings impact. What is perhaps
most notable about the coefficients from the baseline specification is they look
remarkably similar in relative magnitude to the impacts of the reforms on math
coursework, with the strongest impact on black males, a strong but smaller impact on
black females, a weaker impact on white males, and no impact on white females.
The estimated impact of the reforms on earnings are fairly stable across
specifications. Including additional education policy controls reduces the reforms’
impacts slightly. Adding the economic controls and trends further reduces the reforms’
impacts, particularly for black females and white males. Even with all of these
additional controls, the impact of the reforms on black males’ earnings is still a high
significant 2.1% increase. Removing the non-reforming states also reduces the apparent
impact of the reforms, particularly for whites, though even so the coefficient on black
earnings is still a significant 1.9%. The fifth row of the table limits the Census sample to
only students from the same classes as the transcript data contain (1982, 1987, 1990 and
1994). Doing this increases the estimated impacts on blacks’ earnings. The final row of
the table adds back to the sample the high school dropouts previously excluded, the
result of which is to leave the estimated impact on blacks’ earnings largely unchanged.
This suggests the impact is not being driven by selection into the high school graduate
sample.
Two-Sample Instrumental Variables
If the observed increased earnings can be attributed solely to the additional math
coursework completed by students subject to the reforms, then combining the results of
tables 4 and 6 allows me to estimate the return to a year of math coursework. To
combine the estimates from the first-stage equations in table 4 with the reduced-form
equations in table 6, I turn to the two-sample instrumental variable technique first
introduced by Angrist and Krueger (1992).10
10 Subsequent papers that have used TSIV include Currie and Yelowitz (2000), who study the impact of public housing on children's outcomes, and Dee and Evans (2003), who study the impact of alcohol consumption on educational attainment.
TSIV can be used when one data set
contains the instrument (the reforms) and endogenous regressor (coursework) and the
other data set contains the instrument (the reforms) and outcome of interest (earnings).
Both data sets must also share any other covariates to be included in the regressions. In
this case, a two-stage least squares procedure can be used, just as in usual IV estimation,
but with the first-stage estimates coming from a different data set than the second-stage
estimates. Practically, this means using the transcript data to estimate the amount of
coursework completed by students in each class and state and then imputing those
estimates to individuals in the Census data. Standard errors must then be adjusted to
account for the error introduced by imputation.
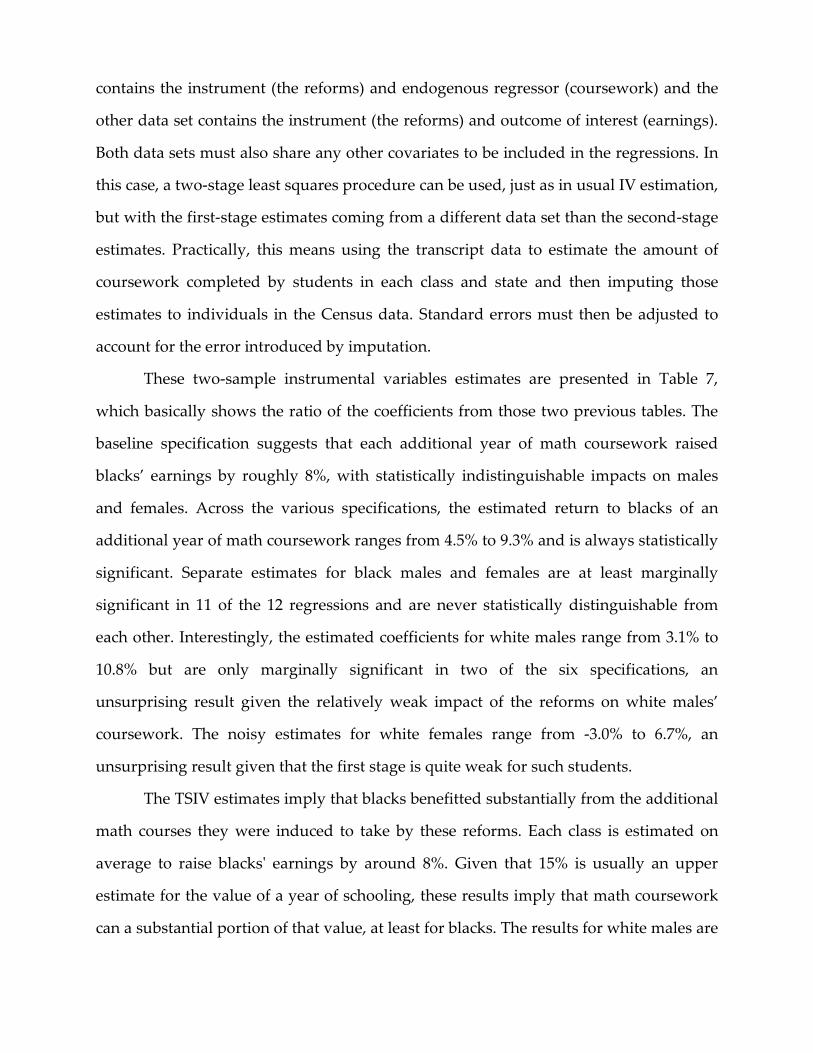
These two-sample instrumental variables estimates are presented in Table 7,
which basically shows the ratio of the coefficients from those two previous tables. The
baseline specification suggests that each additional year of math coursework raised
blacks’ earnings by roughly 8%, with statistically indistinguishable impacts on males
and females. Across the various specifications, the estimated return to blacks of an
additional year of math coursework ranges from 4.5% to 9.3% and is always statistically
significant. Separate estimates for black males and females are at least marginally
significant in 11 of the 12 regressions and are never statistically distinguishable from
each other. Interestingly, the estimated coefficients for white males range from 3.1% to
10.8% but are only marginally significant in two of the six specifications, an
unsurprising result given the relatively weak impact of the reforms on white males’
coursework. The noisy estimates for white females range from -3.0% to 6.7%, an
unsurprising result given that the first stage is quite weak for such students.
The TSIV estimates imply that blacks benefitted substantially from the additional
math courses they were induced to take by these reforms. Each class is estimated on
average to raise blacks' earnings by around 8%. Given that 15% is usually an upper
estimate for the value of a year of schooling, these results imply that math coursework
can a substantial portion of that value, at least for blacks. The results for white males are
of the same general magnitude but are only suggestive given the weakness of the
instrument for them.
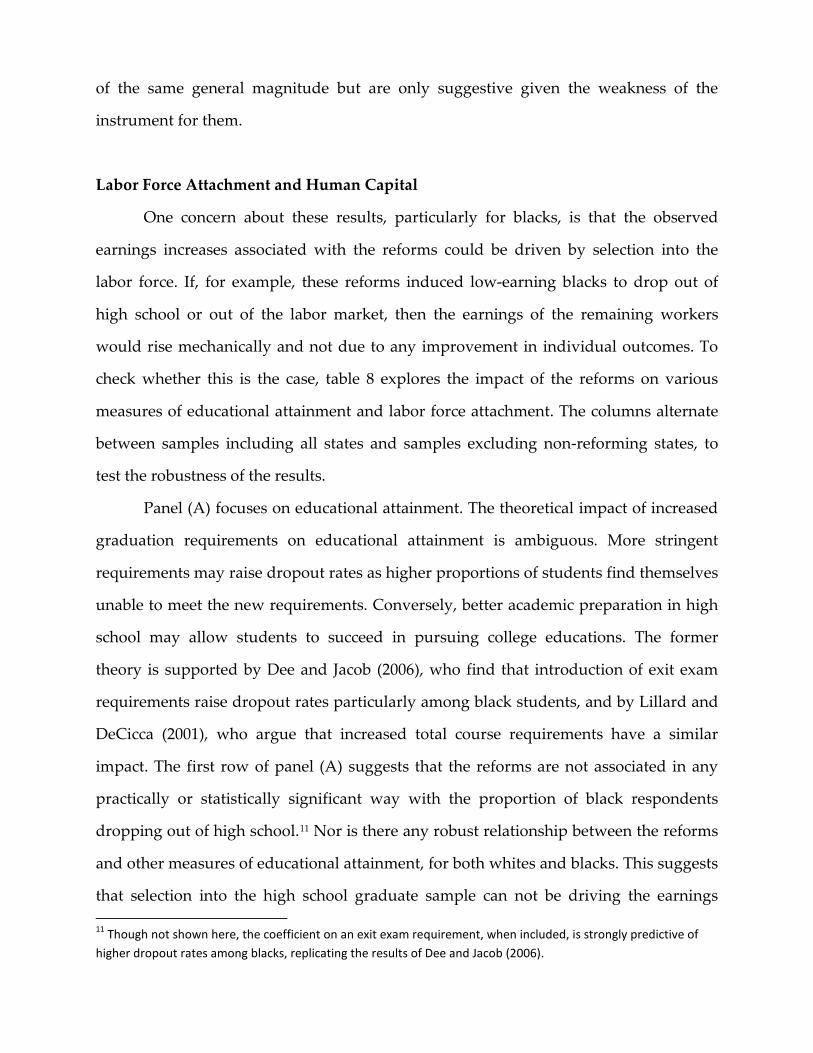
Labor Force Attachment and Human Capital
One concern about these results, particularly for blacks, is that the observed
earnings increases associated with the reforms could be driven by selection into the
labor force. If, for example, these reforms induced low-earning blacks to drop out of
high school or out of the labor market, then the earnings of the remaining workers
would rise mechanically and not due to any improvement in individual outcomes. To
check whether this is the case, table 8 explores the impact of the reforms on various
measures of educational attainment and labor force attachment. The columns alternate
between samples including all states and samples excluding non-reforming states, to
test the robustness of the results.
Panel (A) focuses on educational attainment. The theoretical impact of increased
graduation requirements on educational attainment is ambiguous. More stringent
requirements may raise dropout rates as higher proportions of students find themselves
unable to meet the new requirements. Conversely, better academic preparation in high
school may allow students to succeed in pursuing college educations. The former
theory is supported by Dee and Jacob (2006), who find that introduction of exit exam
requirements raise dropout rates particularly among black students, and by Lillard and
DeCicca (2001), who argue that increased total course requirements have a similar
impact. The first row of panel (A) suggests that the reforms are not associated in any
practically or statistically significant way with the proportion of black respondents
dropping out of high school.11
11 Though not shown here, the coefficient on an exit exam requirement, when included, is strongly predictive of higher dropout rates among blacks, replicating the results of Dee and Jacob (2006).
Nor is there any robust relationship between the reforms
and other measures of educational attainment, for both whites and blacks. This suggests
that selection into the high school graduate sample can not be driving the earnings
results and also that increased educational attainment is not likely the primary channel
driving those results.
In panel (B), which limits the sample to the high school graduates considered in
previous tables, there is no indication that the reforms are associated with changed
labor force participation rates, as measured by the probability or reporting earnings or
the employment rate. Selection on this margin is thus unlikely to be driving the
earnings results for blacks. The only slightly odd result here is that the reforms seem
associated with a substantial 1.7 percentage point drop in the number of white females
reporting earnings, though the result disappears when non-reforming states are
excluded. Though this association is almost certainly spurious, it does suggest that the
results for white females’ earnings may be biased by selection into the labor force.
Finally, panel (C) explores the impact of the reforms on occupational skill.
Though none of the results is statistically significant, it is at least suggestive that the
coefficients on black males are substantially larger than those on any other
demographic group. Overall, this table suggests both that selection bias is not driving
the earnings results and that neither educational attainment nor occupational choice are
strongly associated with the reforms.
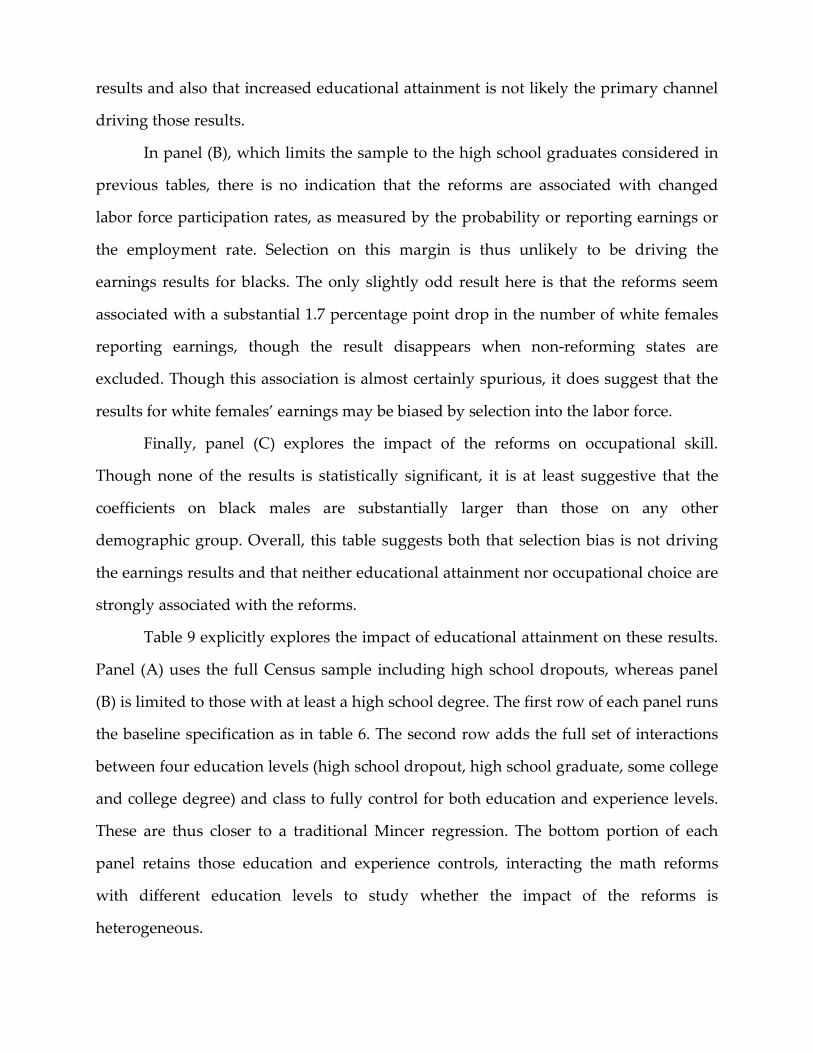
Table 9 explicitly explores the impact of educational attainment on these results.
Panel (A) uses the full Census sample including high school dropouts, whereas panel
(B) is limited to those with at least a high school degree. The first row of each panel runs
the baseline specification as in table 6. The second row adds the full set of interactions
between four education levels (high school dropout, high school graduate, some college
and college degree) and class to fully control for both education and experience levels.
These are thus closer to a traditional Mincer regression. The bottom portion of each
panel retains those education and experience controls, interacting the math reforms
with different education levels to study whether the impact of the reforms is
heterogeneous.
The top row of panel (A) shows that in most specifications, inclusion of the high
school dropouts either slightly decreases the estimated impacts of the reforms or has
little effect. In the specification where the reforms are interacted with education level,
two patterns emerge. For black males, the reforms have no impact on high school
dropouts, the largest impact on high school graduates, and smaller, statistically
insignificant impacts on those with further education. For black females, the results
consistent across specifications are the reforms’ moderate and statistically insignificant
impact on high school graduates and a larger and sometimes significant impact on
those with college degrees. The fact that high school dropouts seem unaffected by the
reforms is reassuring, as there is no particular reason to believe that the coursework of
such students should be changed by increased graduation requirements. That the
impact on black males is largest for high school graduates is also reassuring, as the
students most affected by such increased minimum requirements are presumably those
with the lowest probability of continuing on to higher education. That black female
college graduates see an earnings increase may be attributable to the increased
advanced coursework completed by such students, though it is impossible to test this
specific hypothesis.
Panel (B) shows that the above results are basically unchanged when the sample
is limited to high school graduates. The second row of each panel should also be noted,
as they suggest that curricular reforms have an earnings impact even conditional on
educational attainment and experience, further pointing to the potential shortcoming of
traditional Mincer regressions that ignore differences in the quality of schooling.
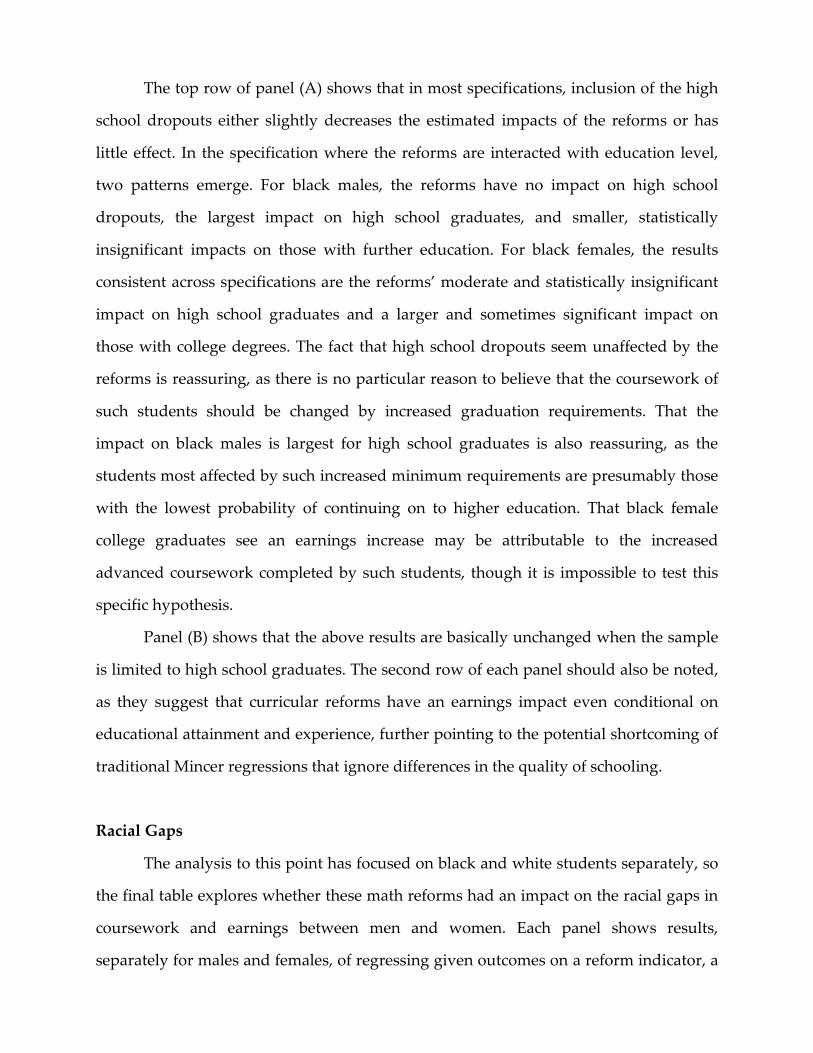
Racial Gaps
The analysis to this point has focused on black and white students separately, so
the final table explores whether these math reforms had an impact on the racial gaps in
coursework and earnings between men and women. Each panel shows results,
separately for males and females, of regressing given outcomes on a reform indicator, a
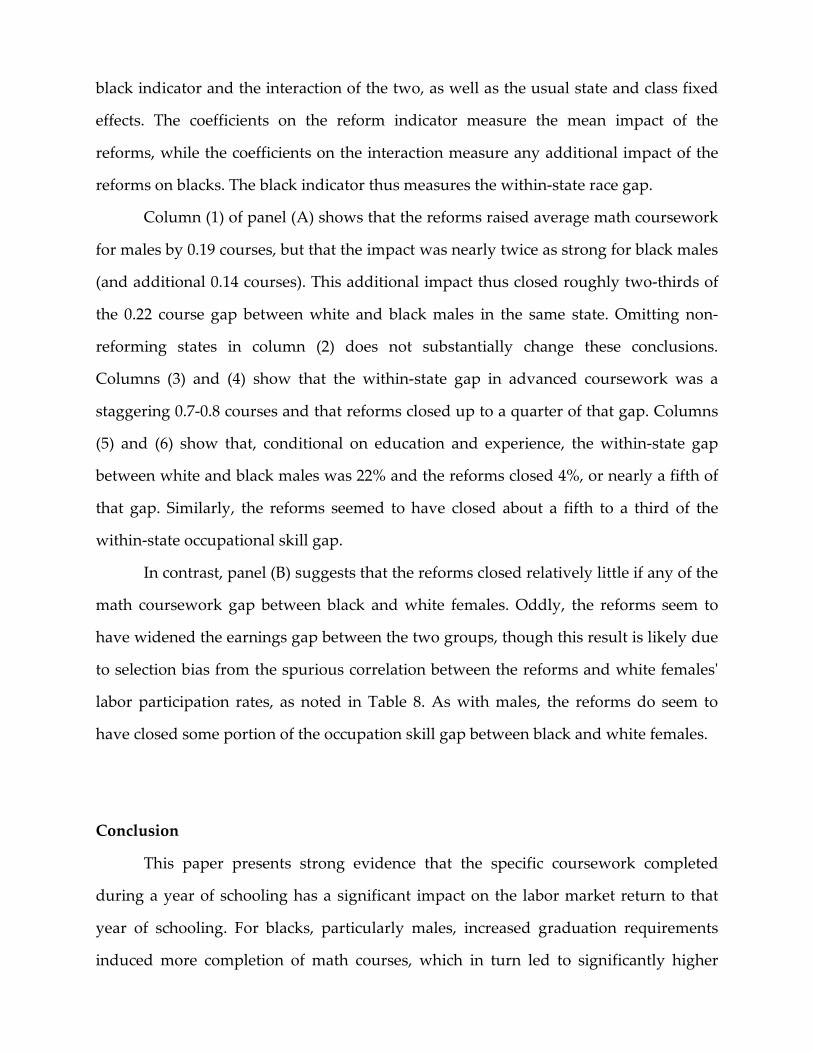
black indicator and the interaction of the two, as well as the usual state and class fixed
effects. The coefficients on the reform indicator measure the mean impact of the
reforms, while the coefficients on the interaction measure any additional impact of the
reforms on blacks. The black indicator thus measures the within-state race gap.
Column (1) of panel (A) shows that the reforms raised average math coursework
for males by 0.19 courses, but that the impact was nearly twice as strong for black males
(and additional 0.14 courses). This additional impact thus closed roughly two-thirds of
the 0.22 course gap between white and black males in the same state. Omitting non-
reforming states in column (2) does not substantially change these conclusions.
Columns (3) and (4) show that the within-state gap in advanced coursework was a
staggering 0.7-0.8 courses and that reforms closed up to a quarter of that gap. Columns
(5) and (6) show that, conditional on education and experience, the within-state gap
between white and black males was 22% and the reforms closed 4%, or nearly a fifth of
that gap. Similarly, the reforms seemed to have closed about a fifth to a third of the
within-state occupational skill gap.
In contrast, panel (B) suggests that the reforms closed relatively little if any of the
math coursework gap between black and white females. Oddly, the reforms seem to
have widened the earnings gap between the two groups, though this result is likely due
to selection bias from the spurious correlation between the reforms and white females'
labor participation rates, as noted in Table 8. As with males, the reforms do seem to
have closed some portion of the occupation skill gap between black and white females.
Conclusion
This paper presents strong evidence that the specific coursework completed
during a year of schooling has a significant impact on the labor market return to that
year of schooling. For blacks, particularly males, increased graduation requirements
induced more completion of math courses, which in turn led to significantly higher

earnings. The reforms also closed some of the occupational skill gap between blacks and
whites. In this sense, the curricular reforms succeeded at least somewhat in achieving
the curricular improvement envisioned by the authors of ``A Nation at Risk'', causing
black students to leave high school with better mathematical preparation.
The increased graduation requirements studied here did not, however, have
much impact on the majority of students. In this sense they were a failure, given that
the reforms had been suggested as a means to increase the nation's educational and
technological competitiveness on the world stage. There is little evidence that higher
minimum courseloads improved the productivity of most workers or their capacity to
enter the math-intensive occupations that preoccupied the authors of ``A Nation at
Risk''. These increased requirements did not appear to produce any additional rocket
scientists.
There are two likely explanations for this. First, the new minimum requirements
set by most states were relatively low, and most students were already completing
relatively high numbers of math courses even prior to the reforms. Second, the
graduation requirements generally specified only the number of courses necessary and
not the minimum set of skills students would need in order to graduate. As such, the
reforms focused on the amount of time spent in class rather than the specific content
learned. Students could fulfill the requirements by taking a series of low-level math
courses. Schools could enroll students in classes with advanced titles without
guaranteeing that any actual objective standards were being met in those classes. For
low-skilled groups of students, such as black males, additional low-quality courses may
have had value, but high-skilled students would have benefited little from these types
of courses.
A subsequent generation of reforms, beginning with exit exam requirements and
continuing with the No Child Left Behind Act, has moved beyond simple measurement
of time spent in class to measurement of students' skills and academic achievement.
This renewed focus on student capabilities may come closer to achieving the goals
envisioned a quarter of a century ago by the authors of ``A Nation at Risk'', and will
provide rich avenues for future research.
REFERENCES
Acemoglu, Daron and Joshua Angrist, 2000. How Large Are Human-Capital Externalities? Evidence from Compulsory Schooling Laws. NBER Macroeconomics Annual 15: 9-59.
Altonji, Joseph, 1995. The Effects of High School Curriculum on Education and Labor Market. Journal of Human Resources 30: 409-38.
Angrist, Joshua and Alan Krueger, 1991. Does Compulsory School Attendance Affect Schooling and Earnings? Quarterly Journal of Economics 106: 979-1014.
Angrist, Joshua and Alan Krueger, 1992. The Effect of Age at School Entry on Educational Attainment: An Application of Instrumental Variables with Moments from Two Samples. Journal of the American Statistical Association 87: 328-36.
Autor, David, Frank Levy and Richard Murnane, 2003. The Skill Content of Recent Technological Change: An Empirical Exploration. Quarterly Journal of Economics 118: 1279-1333.
Bertrand, Marianne, Esther Duflo and Sendhil Mullainathan, 2004. How Much Should We Trust Differences-in-Differences Estimates? Quarterly Journal of Economics 119: 249-75.
Bettinger, Eric and Bridget Terry Long, 2005. Addressing the Needs of Under-Prepared Students in Higher Education: Does College Remediation Work? National Bureau of Economic Research Working Paper 11325.
Bound, John, David Jaeger and Regina Baker, 1995. Problems with Instrumental Variables Estimation When the Correlation between the Instruments and the Endogenous Explanatory Variable Is Weak. Journal of the American Statistical Association 90: 443-50.
Card, David, 1999. The Causal Effect of Education on Earnings. In: Handbook of Labor Economics, Volume 3A: 1801-63. New York: Elsevier Science, North-Holland.
Currie, Janet and Aaron Yelowitz, 2000. Are Public Housing Projects Good for Kids? Journal of Public Economics 75: 99-124.
Dee, Thomas and William Evans, 2003. Teen Drinking and Educational Attainment: Evidence from Two-Sample Instrumental Variables Estimates. Journal of Labor Economics 21: 178-209.
Dee, Thomas and Brian Jacob, 2006. Do High School Exit Exams Influence Educational Attainment or Labor Market Performance? National Bureau of Economic Research Working Paper 12199.
Goldin, Claudia and Lawrence Katz, 2007. The Race between Education and Technology: The Evolution of U.S. Educational Wage Differentials, 1890 to 2005. National Bureau of Economic Research Working Paper 12984.
Goos, Maarten and Alan Manning, 2007. Lousy and Lovely Jobs: The Rising Polarization of Work in Britain. Review of Economics and Statistics 89: 118-33.
Heckman, James and Paul LaFontaine, 2007. The American High School Graduation Rate: Trends and Levels. National Bureau of Economic Research Working Paper 13670.
Katz, Lawrence, and David Autor, 1999. Changes in the Wage Structure and Earnings. In: Handbook of Labor Economics, Volume 3A: 1463-1555. New York: Elsevier Science, North-Holland.
Levine, Phillip and David Zimmerman, 1995. The Benefit of Additional High-School Math and Science Classes for Young Men and Women. Journal of Business and Economic Statistics 13: 137-49.
Lillard, Dean and Philip DeCicca, 2001. Higher Standards, More Dropouts? Evidence within and across Time. Economics of Education Review 20: 459-73.
Lleras-Muney, Adriana, 2005. The Relationship between Education and Adult Mortality in the United States. Review of Economic Studies 72: 189-221.
National Commission on Excellence in Education, 1983. A Nation at Risk: The Imperative for Educational Reform. Washington, D.C.: U.S. Department of Education.
Oreopoulos, Philip, Marianne Page, and Ann Huff Stevens, 2006. The Intergenerational Effects of Compulsory Schooling. Journal of Labor Economics 24: 729-60.
Rose, Heather and Julian Betts, 2004. The Effect of High School Courses on Earnings. Review of Economics and Statistics 86: 497-513.
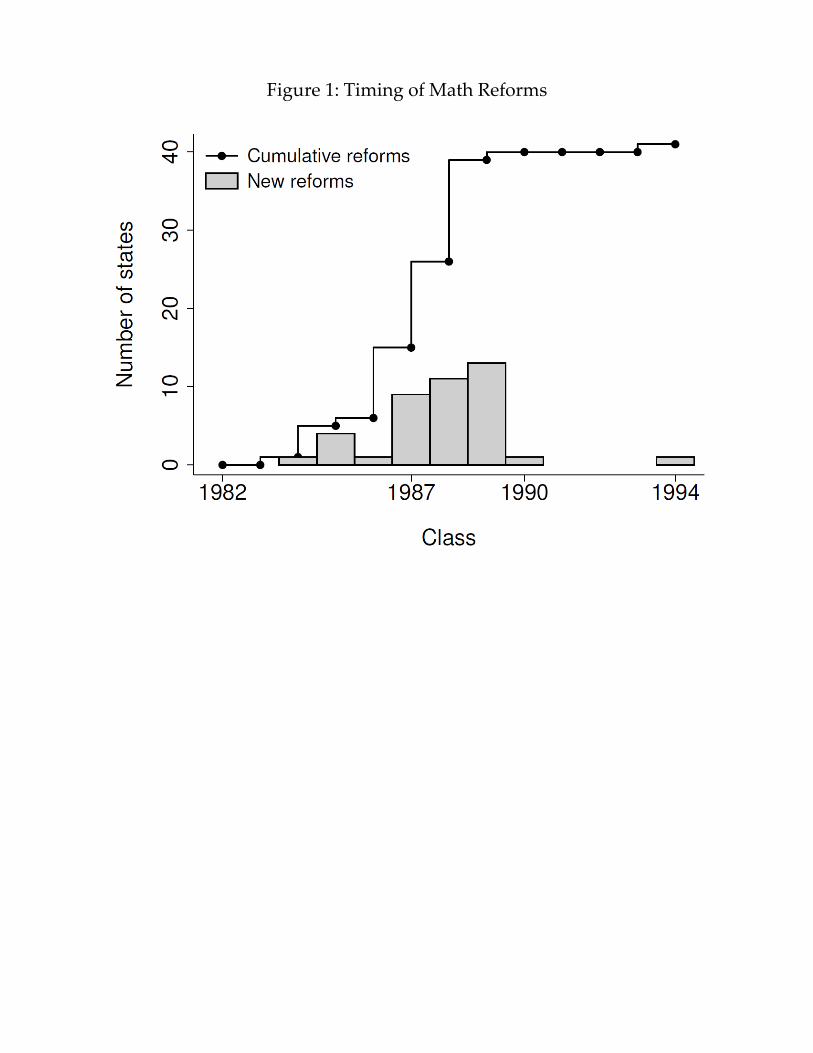
Figure 1: Timing of Math Reforms
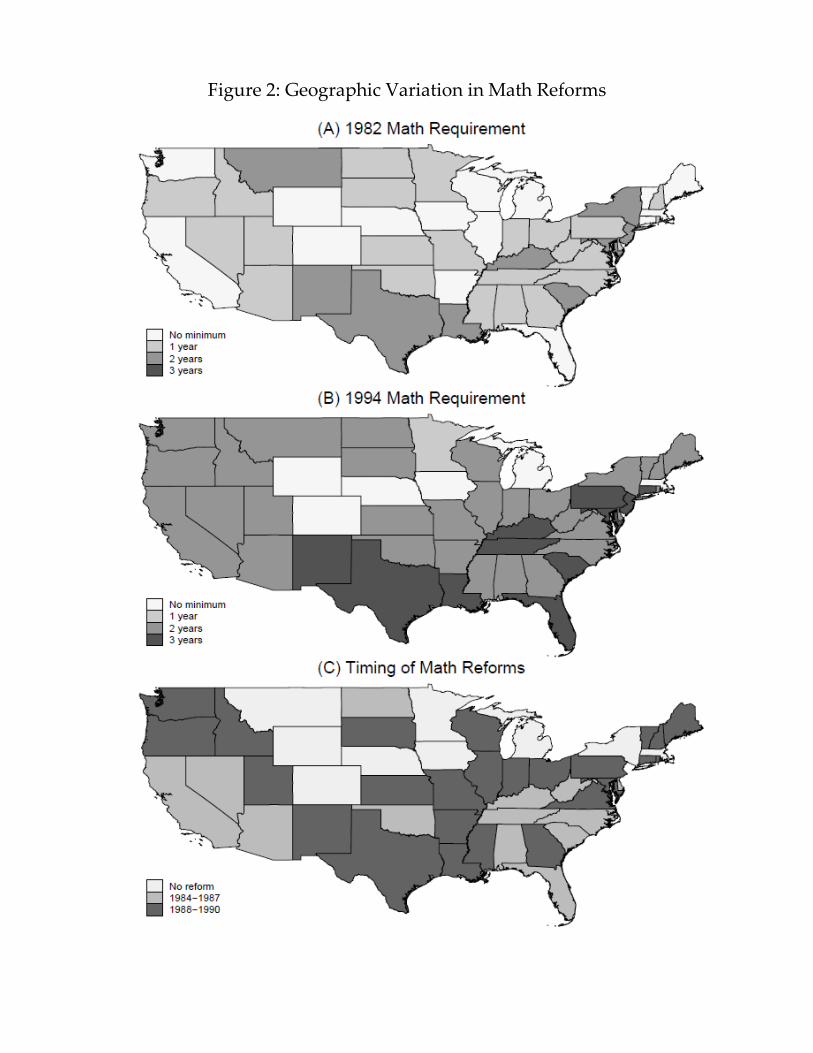
Figure 2: Geographic Variation in Math Reforms
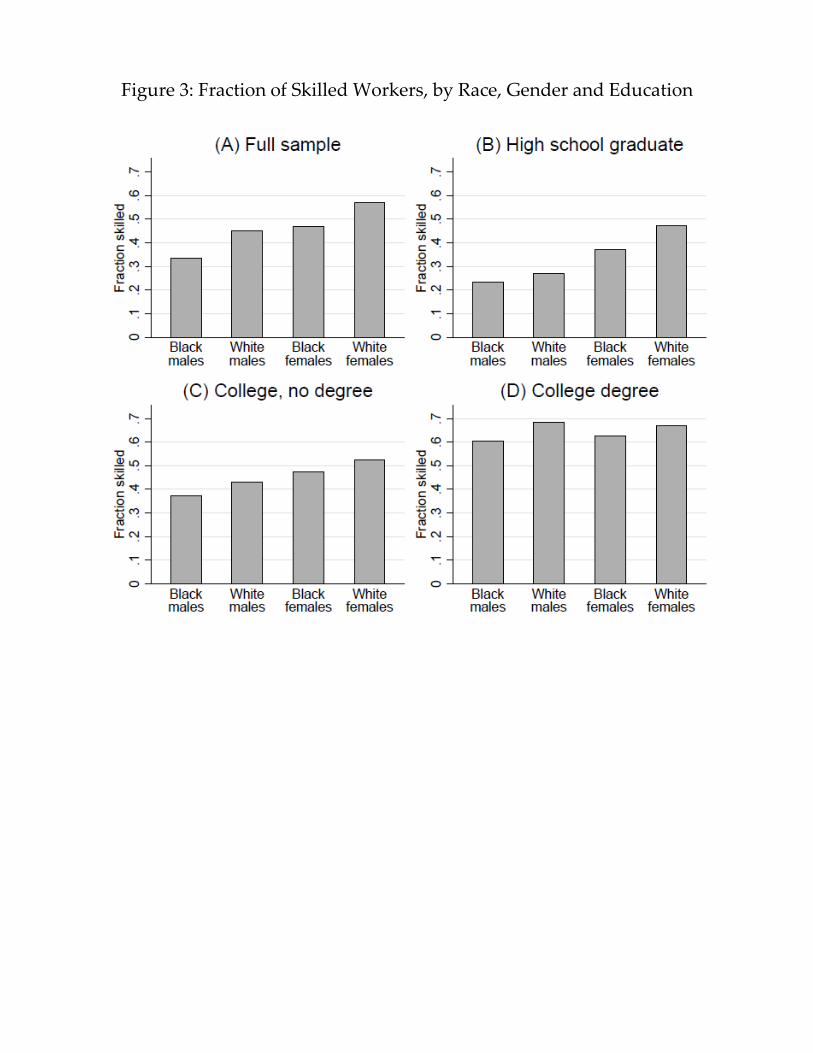
Figure 3: Fraction of Skilled Workers, by Race, Gender and Education
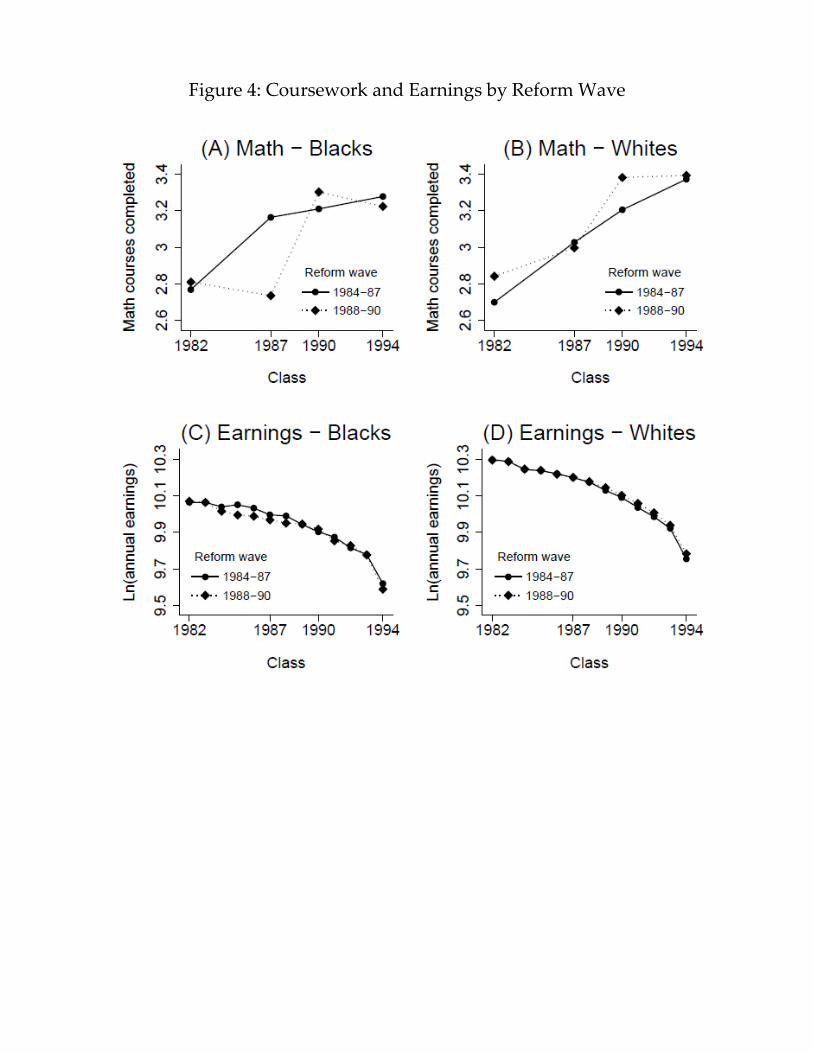
Figure 4: Coursework and Earnings by Reform Wave
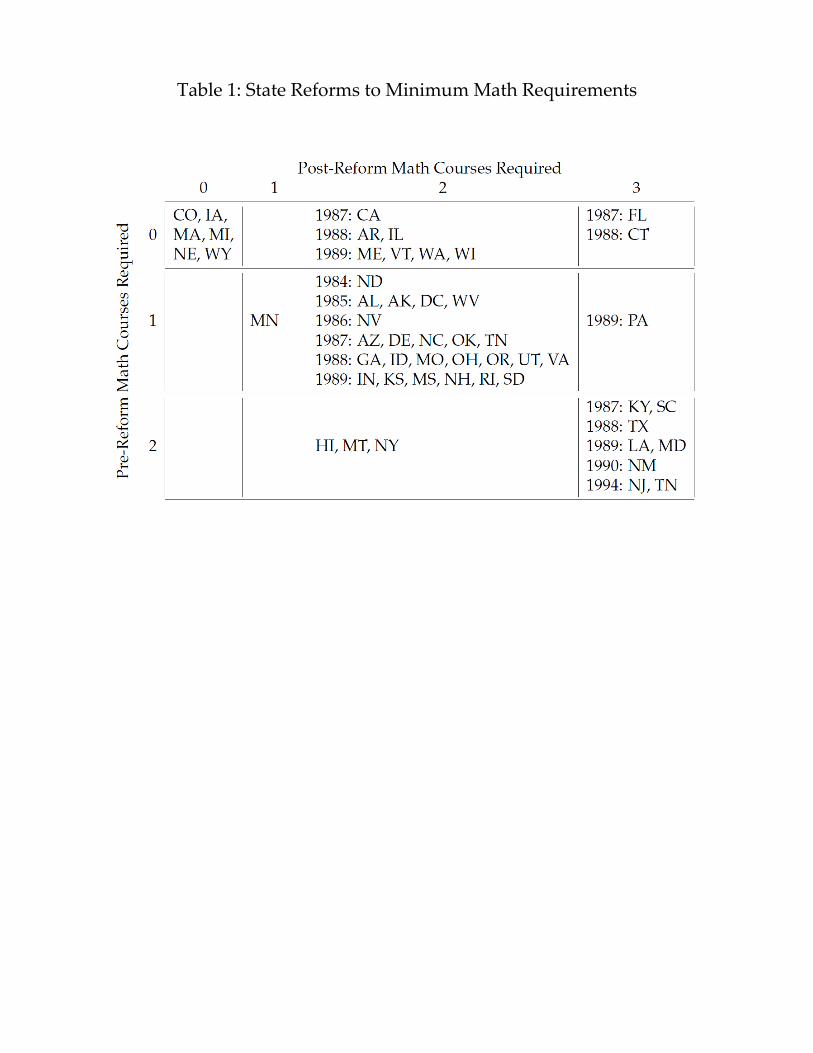
Table 1: State Reforms to Minimum Math Requirements
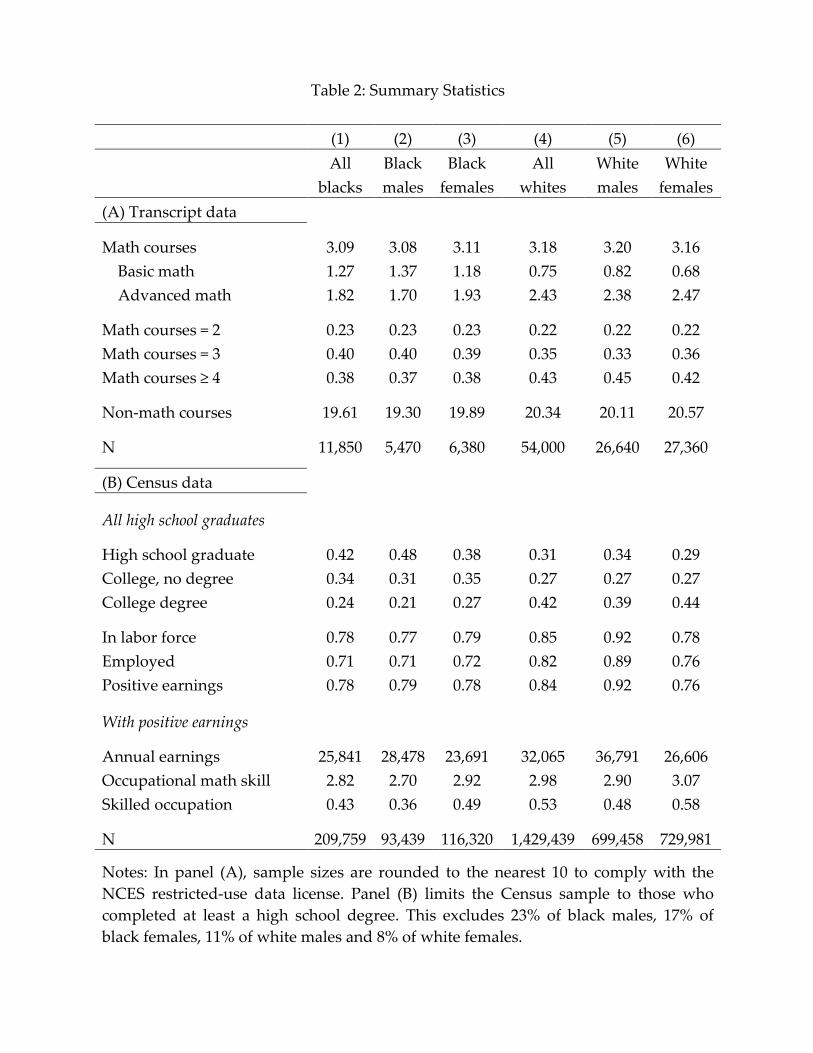
Table 2: Summary Statistics (1) (2) (3) (4) (5) (6)
All Black Black All White White
blacks males females whites males females (A) Transcript data
Math courses 3.09 3.08 3.11 3.18 3.20 3.16 Basic math 1.27 1.37 1.18 0.75 0.82 0.68 Advanced math 1.82 1.70 1.93 2.43 2.38 2.47
Math courses = 2 0.23 0.23 0.23 0.22 0.22 0.22 Math courses = 3 0.40 0.40 0.39 0.35 0.33 0.36 Math courses ≥ 4 0.38 0.37 0.38 0.43 0.45 0.42
Non-math courses 19.61 19.30 19.89 20.34 20.11 20.57
N 11,850 5,470 6,380 54,000 26,640 27,360
(B) Census data
All high school graduates High school graduate 0.42 0.48 0.38 0.31 0.34 0.29
College, no degree 0.34 0.31 0.35 0.27 0.27 0.27 College degree 0.24 0.21 0.27 0.42 0.39 0.44
In labor force 0.78 0.77 0.79 0.85 0.92 0.78 Employed 0.71 0.71 0.72 0.82 0.89 0.76 Positive earnings 0.78 0.79 0.78 0.84 0.92 0.76
With positive earnings Annual earnings 25,841 28,478 23,691 32,065 36,791 26,606
Occupational math skill 2.82 2.70 2.92 2.98 2.90 3.07 Skilled occupation 0.43 0.36 0.49 0.53 0.48 0.58
N 209,759 93,439 116,320 1,429,439 699,458 729,981
Notes: In panel (A), sample sizes are rounded to the nearest 10 to comply with the NCES restricted-use data license. Panel (B) limits the Census sample to those who completed at least a high school degree. This excludes 23% of black males, 17% of black females, 11% of white males and 8% of white females.
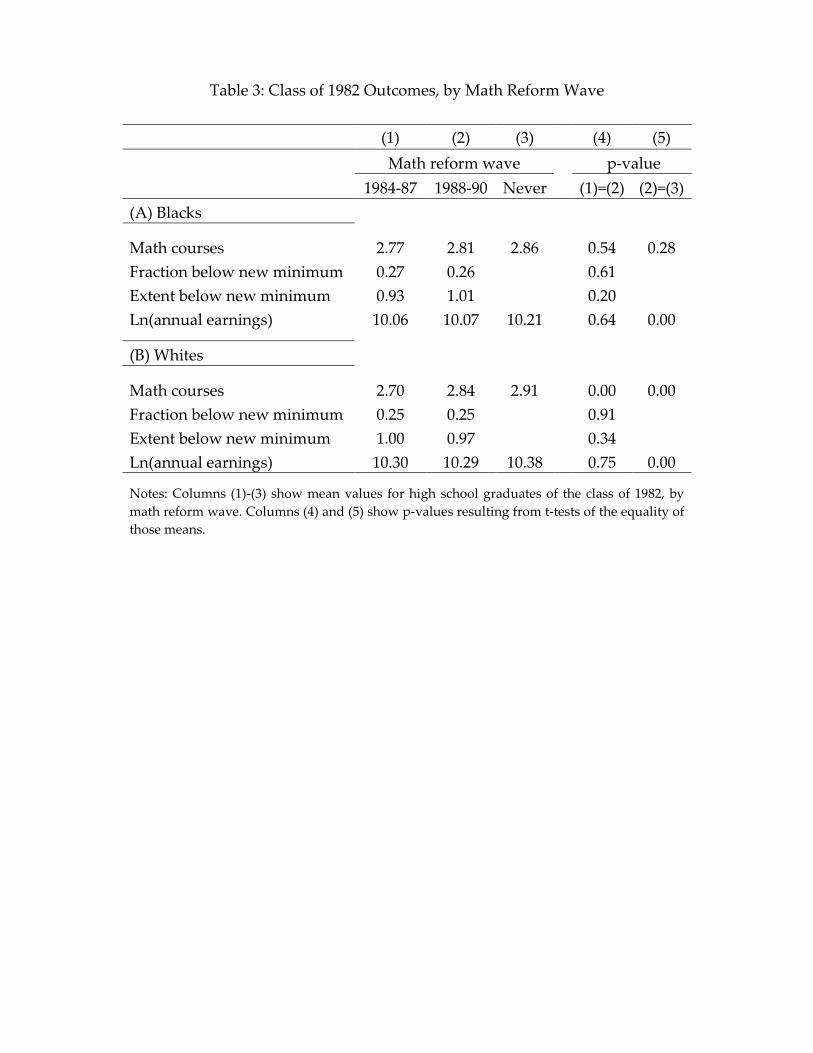
Table 3: Class of 1982 Outcomes, by Math Reform Wave
(1) (2) (3) (4) (5)
Math reform wave
p-value
1984-87 1988-90 Never (1)=(2) (2)=(3) (A) Blacks
Math courses 2.77 2.81 2.86
0.54 0.28
Fraction below new minimum 0.27 0.26
0.61 Extent below new minimum 0.93 1.01
0.20
Ln(annual earnings) 10.06 10.07 10.21
0.64 0.00
(B) Whites
Math courses 2.70 2.84 2.91
0.00 0.00 Fraction below new minimum 0.25 0.25
0.91
Extent below new minimum 1.00 0.97
0.34 Ln(annual earnings) 10.30 10.29 10.38 0.75 0.00
Notes: Columns (1)-(3) show mean values for high school graduates of the class of 1982, by math reform wave. Columns (4) and (5) show p-values resulting from t-tests of the equality of those means.
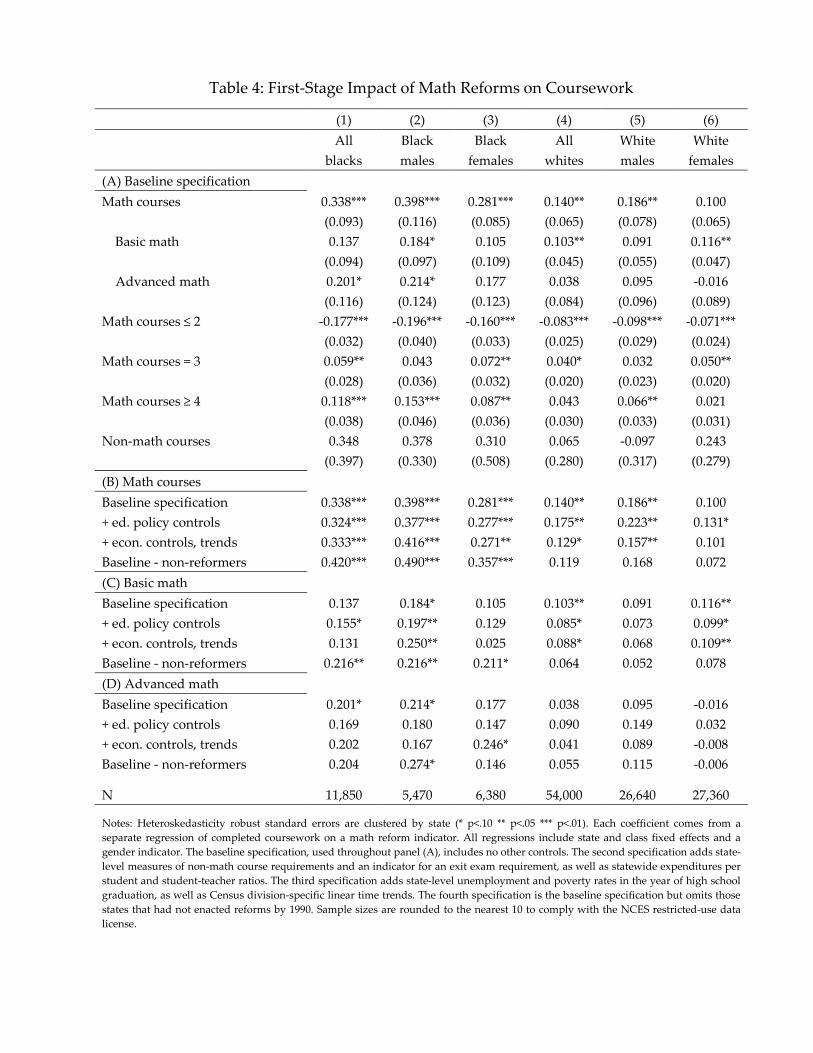
Table 4: First-Stage Impact of Math Reforms on Coursework (1) (2) (3) (4) (5) (6)
All Black Black All White White
blacks males females whites males females (A) Baseline specification
Math courses 0.338*** 0.398*** 0.281*** 0.140** 0.186** 0.100
(0.093) (0.116) (0.085) (0.065) (0.078) (0.065)
Basic math 0.137 0.184* 0.105 0.103** 0.091 0.116**
(0.094) (0.097) (0.109) (0.045) (0.055) (0.047)
Advanced math 0.201* 0.214* 0.177 0.038 0.095 -0.016
(0.116) (0.124) (0.123) (0.084) (0.096) (0.089)
Math courses ≤ 2 -0.177*** -0.196*** -0.160*** -0.083*** -0.098*** -0.071***
(0.032) (0.040) (0.033) (0.025) (0.029) (0.024)
Math courses = 3 0.059** 0.043 0.072** 0.040* 0.032 0.050**
(0.028) (0.036) (0.032) (0.020) (0.023) (0.020)
Math courses ≥ 4 0.118*** 0.153*** 0.087** 0.043 0.066** 0.021
(0.038) (0.046) (0.036) (0.030) (0.033) (0.031)
Non-math courses 0.348 0.378 0.310 0.065 -0.097 0.243
(0.397) (0.330) (0.508) (0.280) (0.317) (0.279)
(B) Math courses
Baseline specification 0.338*** 0.398*** 0.281*** 0.140** 0.186** 0.100 + ed. policy controls 0.324*** 0.377*** 0.277*** 0.175** 0.223** 0.131* + econ. controls, trends 0.333*** 0.416*** 0.271** 0.129* 0.157** 0.101 Baseline - non-reformers 0.420*** 0.490*** 0.357*** 0.119 0.168 0.072 (C) Basic math
Baseline specification 0.137 0.184* 0.105 0.103** 0.091 0.116** + ed. policy controls 0.155* 0.197** 0.129 0.085* 0.073 0.099* + econ. controls, trends 0.131 0.250** 0.025 0.088* 0.068 0.109** Baseline - non-reformers 0.216** 0.216** 0.211* 0.064 0.052 0.078 (D) Advanced math
Baseline specification 0.201* 0.214* 0.177 0.038 0.095 -0.016 + ed. policy controls 0.169 0.180 0.147 0.090 0.149 0.032 + econ. controls, trends 0.202 0.167 0.246* 0.041 0.089 -0.008 Baseline - non-reformers 0.204 0.274* 0.146 0.055 0.115 -0.006
N 11,850 5,470 6,380 54,000 26,640 27,360
Notes: Heteroskedasticity robust standard errors are clustered by state (* p<.10 ** p<.05 *** p<.01). Each coefficient comes from a separate regression of completed coursework on a math reform indicator. All regressions include state and class fixed effects and a gender indicator. The baseline specification, used throughout panel (A), includes no other controls. The second specification adds state-level measures of non-math course requirements and an indicator for an exit exam requirement, as well as statewide expenditures per student and student-teacher ratios. The third specification adds state-level unemployment and poverty rates in the year of high school graduation, as well as Census division-specific linear time trends. The fourth specification is the baseline specification but omits those states that had not enacted reforms by 1990. Sample sizes are rounded to the nearest 10 to comply with the NCES restricted-use data license.
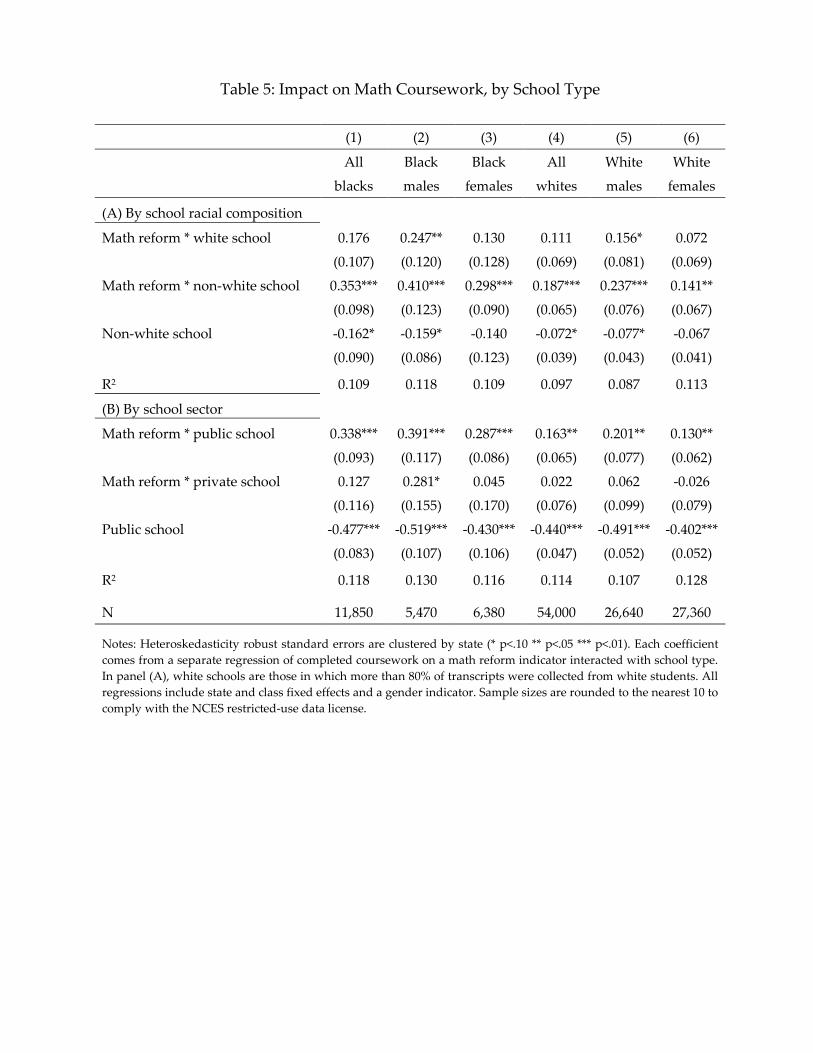
Table 5: Impact on Math Coursework, by School Type
(1) (2) (3) (4) (5) (6)
All Black Black All White White
blacks males females whites males females
(A) By school racial composition Math reform * white school 0.176 0.247** 0.130 0.111 0.156* 0.072
(0.107) (0.120) (0.128) (0.069) (0.081) (0.069)
Math reform * non-white school 0.353*** 0.410*** 0.298*** 0.187*** 0.237*** 0.141**
(0.098) (0.123) (0.090) (0.065) (0.076) (0.067)
Non-white school -0.162* -0.159* -0.140 -0.072* -0.077* -0.067
(0.090) (0.086) (0.123) (0.039) (0.043) (0.041)
R2 0.109 0.118 0.109 0.097 0.087 0.113
(B) By school sector Math reform * public school 0.338*** 0.391*** 0.287*** 0.163** 0.201** 0.130**
(0.093) (0.117) (0.086) (0.065) (0.077) (0.062)
Math reform * private school 0.127 0.281* 0.045 0.022 0.062 -0.026
(0.116) (0.155) (0.170) (0.076) (0.099) (0.079)
Public school -0.477*** -0.519*** -0.430*** -0.440*** -0.491*** -0.402***
(0.083) (0.107) (0.106) (0.047) (0.052) (0.052)
R2 0.118 0.130 0.116 0.114 0.107 0.128
N 11,850 5,470 6,380 54,000 26,640 27,360
Notes: Heteroskedasticity robust standard errors are clustered by state (* p<.10 ** p<.05 *** p<.01). Each coefficient comes from a separate regression of completed coursework on a math reform indicator interacted with school type. In panel (A), white schools are those in which more than 80% of transcripts were collected from white students. All regressions include state and class fixed effects and a gender indicator. Sample sizes are rounded to the nearest 10 to comply with the NCES restricted-use data license.

Table 6: Reduced Form Impact of Math Reforms on Ln(Annual Earnings)
(1) (2) (3) (4) (5) (6)
All Black Black All White White blacks males females whites males females Baseline specification 0.026*** 0.032*** 0.022*** 0.006 0.016 -0.004
(0.007) (0.010) (0.007) (0.007) (0.011) (0.005)
+ ed. policy controls 0.021*** 0.028*** 0.017* 0.008 0.015* 0.002
(0.007) (0.008) (0.009) (0.006) (0.008) (0.006)
+ econ. controls, trends 0.015** 0.021*** 0.010 0.004 0.008 0.000
(0.006) (0.008) (0.008) (0.004) (0.005) (0.004)
N 163,972 73,629 90,343 1,200,052 642,758 557,294
Baseline - non-reformers 0.019** 0.019* 0.019* 0.004 0.004 0.004
(0.007) (0.011) (0.010) (0.004) (0.004) (0.006)
N 135,849 60,959 74,890 876,461 470,352 406,109
Baseline, transcript classes 0.031*** 0.036** 0.029** 0.005 0.011 -0.002
(0.010) (0.015) (0.013) (0.009) (0.012) (0.008)
N 49,361 21,945 27,416 368,252 196,768 171,484
Baseline, with dropouts 0.026*** 0.027*** 0.026*** 0.009 0.019* -0.002
(0.008) (0.009) (0.008) (0.007) (0.011) (0.005)
N 188,756 87,534 101,222 1,296,571 708,157 588,414
Notes: Heteroskedasticity robust standard errors are clustered by state (* p<.10 ** p<.05 *** p<.01). Each coefficient comes from a separate regression of the logarithm of annual earnings on a math reform indicator. All regressions include state and class fixed effects and a gender indicator. The first four specifications are the same as those in Table 4. The fifth specification includes only the classes of 1982, 1987, 1990 and 1994. The sixth specification includes high school dropouts.
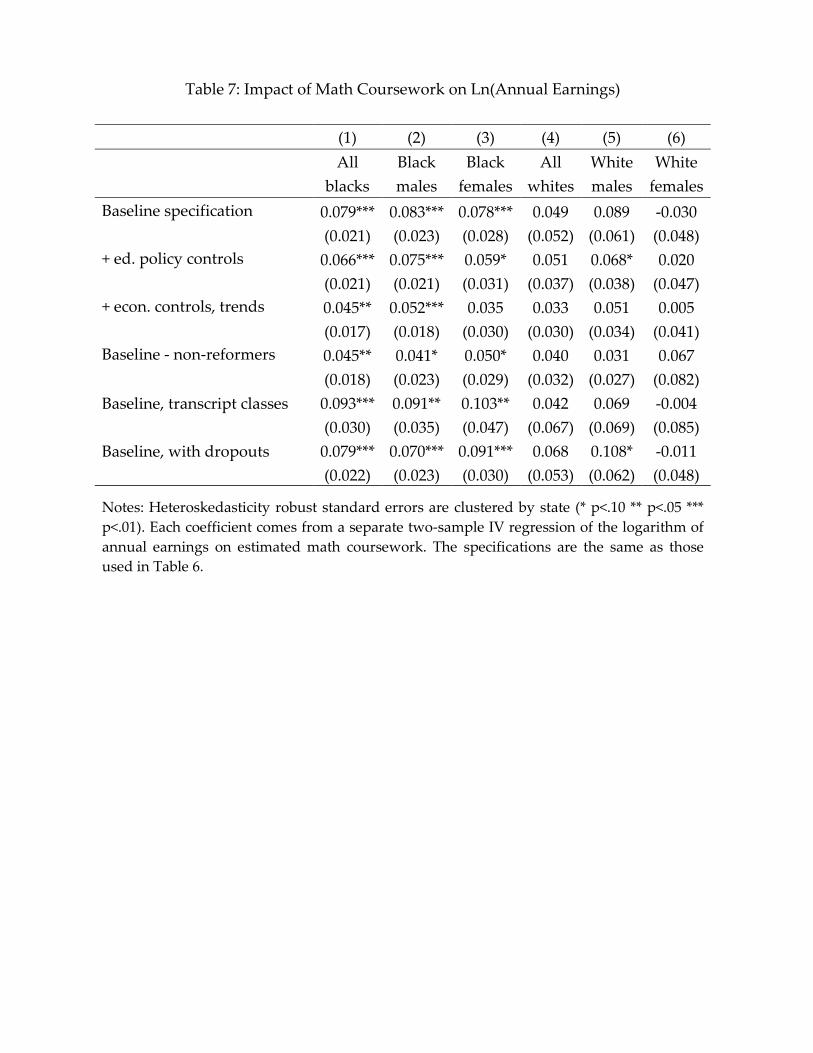
Table 7: Impact of Math Coursework on Ln(Annual Earnings)
(1) (2) (3) (4) (5) (6)
All Black Black All White White blacks males females whites males females Baseline specification 0.079*** 0.083*** 0.078*** 0.049 0.089 -0.030
(0.021) (0.023) (0.028) (0.052) (0.061) (0.048)
+ ed. policy controls 0.066*** 0.075*** 0.059* 0.051 0.068* 0.020
(0.021) (0.021) (0.031) (0.037) (0.038) (0.047)
+ econ. controls, trends 0.045** 0.052*** 0.035 0.033 0.051 0.005
(0.017) (0.018) (0.030) (0.030) (0.034) (0.041)
Baseline - non-reformers 0.045** 0.041* 0.050* 0.040 0.031 0.067
(0.018) (0.023) (0.029) (0.032) (0.027) (0.082)
Baseline, transcript classes 0.093*** 0.091** 0.103** 0.042 0.069 -0.004
(0.030) (0.035) (0.047) (0.067) (0.069) (0.085)
Baseline, with dropouts 0.079*** 0.070*** 0.091*** 0.068 0.108* -0.011 (0.022) (0.023) (0.030) (0.053) (0.062) (0.048)
Notes: Heteroskedasticity robust standard errors are clustered by state (* p<.10 ** p<.05 *** p<.01). Each coefficient comes from a separate two-sample IV regression of the logarithm of annual earnings on estimated math coursework. The specifications are the same as those used in Table 6.

Table 8: Impact of Reforms on Education, Labor Force Attachment, and Occupational Skill
(1) (2) (3) (4) (5) (6) (7) (8)
Outcome Black males Black females White males White females
(A) Full sample High school dropout -0.004 0.008 -0.005 0.001 -0.005** -0.001 0.001 0.003
(0.006) (0.008) (0.004) (0.006) (0.002) (0.002) (0.002) (0.003)
High school graduate -0.010 -0.006 -0.006 0.003 0.002 -0.001 0.001 -0.001
(0.008) (0.008) (0.006) (0.007) (0.003) (0.003) (0.003) (0.003)
College, no degree 0.006 -0.007 0.009 -0.003 0.002 -0.003 0.004 -0.001
(0.007) (0.008) (0.005) (0.006) (0.003) (0.003) (0.003) (0.003)
College degree 0.008** 0.005 0.002 -0.001 0.001 0.005 -0.007* -0.001
(0.004) (0.004) (0.005) (0.003) (0.003) (0.003) (0.004) (0.005)
N 121,203 100,234 140,595 116,864 784,855 580,940 795,065 589,373
(B) High school graduates Positive earnings 0.004 -0.008 -0.005 -0.008 -0.001 0.000 -0.017** 0.001
(0.005) (0.005) (0.005) (0.008) (0.001) (0.002) (0.007) (0.003)
Employed 0.005 0.005 -0.006 -0.015 0.003 0.001 -0.015** 0.004
(0.006) (0.007) (0.006) (0.009) (0.002) (0.002) (0.007) (0.003)
N 93,439 77,291 116,320 96,339 699,458 511,899 729,981 536,065
(C) Positive earnings Skilled 0.009 0.007 0.000 -0.001 0.001 0.004 0.003 -0.001
(0.007) (0.010) (0.004) (0.007) (0.005) (0.004) (0.003) (0.006)
Occupational math skill 0.012 0.007 0.002 0.007 -0.000 0.004 0.003 -0.002
(0.010) (0.012) (0.008) (0.013) (0.006) (0.006) (0.004) (0.007)
Observations 72,614 60,073 90,159 74,738 639,688 467,817 557,289 406,057
Exclude non-reformers X X X X
Notes: Heteroskedasticity robust standard errors are clustered by state (* p<.10 ** p<.05 *** p<.01). Each coefficient comes from a separate regression of the outcome on a math reform indicator. All regressions include state and class fixed effects and a gender indicator. Even-numbered columns omit states that had not enacted reforms by 1990.

Table 9: Impact of Reforms on Ln(Annual Earnings), by Education
(1) (2) (3) (4) (5) (6) (7) (8) Black males Black females White males White females (A) Full sample
Math reform (baseline) 0.028*** 0.014 0.026*** 0.014 0.020* 0.005 -0.001 0.004
(0.009) (0.012) (0.008) (0.010) (0.012) (0.004) (0.005) (0.005)
Math reform (+ ed./exp. controls) 0.019** 0.014 0.016** 0.011 0.011 0.004 -0.005 0.004
(0.008) (0.010) (0.008) (0.010) (0.010) (0.003) (0.004) (0.006)
Math reform * HS dropout -0.003 0.003 0.025 -0.008 0.018 -0.018 0.005 0.005
(0.013) (0.014) (0.024) (0.029) (0.027) (0.015) (0.015) (0.019)
Math reform * HS graduate 0.036*** 0.024 0.013 0.018 0.021 -0.001 0.004 0.000
(0.012) (0.024) (0.009) (0.014) (0.017) (0.005) (0.012) (0.011)
Math reform * college, no degree 0.015 0.010 0.005 -0.004 0.015 0.011 -0.004 0.000
(0.017) (0.028) (0.013) (0.020) (0.013) (0.007) (0.007) (0.011)
Math reform * college degree 0.013 0.010 0.029** 0.028 -0.002 0.010 -0.011 0.009
(0.017) (0.023) (0.013) (0.018) (0.005) (0.007) (0.006) (0.010)
N 87,601 72,587 101,256 84,250 709,708 524,359 588,828 431,618 (B) HS graduates
Math reform (baseline) 0.033*** 0.020* 0.022*** 0.018* 0.017 0.005 -0.003 0.005
(0.009) (0.011) (0.008) (0.010) (0.011) (0.005) (0.005) (0.006)
Math reform (+ ed./exp. controls) 0.026*** 0.018* 0.015** 0.016 0.011 0.004 -0.006 0.004
(0.008) (0.010) (0.008) (0.011) (0.010) (0.004) (0.004) (0.006)
Math reform * HS graduate 0.038*** 0.025 0.013 0.020 0.021 -0.005 0.003 0.000
(0.012) (0.025) (0.009) (0.015) (0.019) (0.006) (0.012) (0.011)
Math reform * college, no degree 0.018 0.012 0.005 -0.002 0.015 0.008 -0.005 0.000
(0.015) (0.027) (0.012) (0.020) (0.014) (0.007) (0.008) (0.011)
Math reform * college degree 0.014 0.011 0.029** 0.030 -0.001 0.007 -0.011* 0.009
(0.015) (0.021) (0.012) (0.018) (0.005) (0.007) (0.006) (0.010)
N 73,691 61,011 90,375 74,916 644,262 471,343 557,703 406,377
Exclude non-reformers X X X X
Notes: Heteroskedasticity robust standard errors are clustered by state (* p<.10 ** p<.05 *** p<.01). Panel (A) includes the full sample, while panel (B) excludes high school dropouts. Each column in each panel shows three regressions, all of which include state and class fixed effects and a gender indicator. The first regression shows the impact of the math reform on earnings. The second adds education and experience controls as described in the text. The third includes those controls and interacts the reform with education levels. Even-numbered columns omit states that had not enacted reforms by 1990.
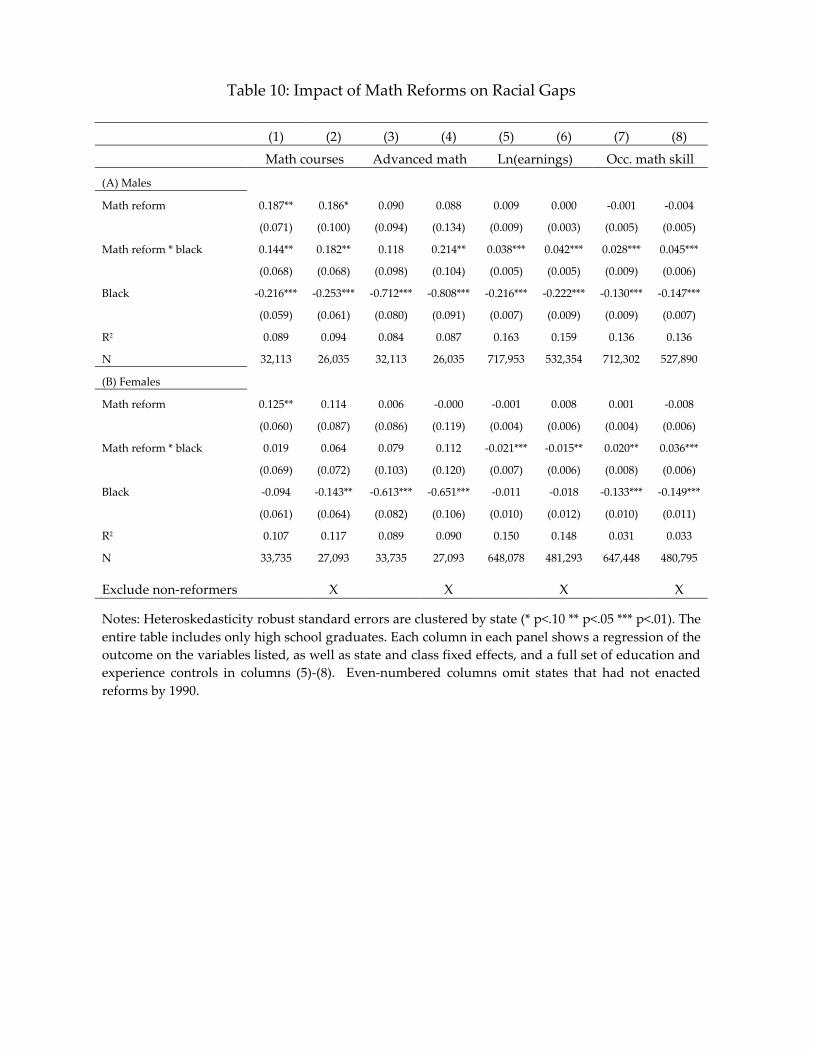
Table 10: Impact of Math Reforms on Racial Gaps
(1) (2) (3) (4) (5) (6) (7) (8)
Math courses Advanced math Ln(earnings) Occ. math skill
(A) Males Math reform 0.187** 0.186* 0.090 0.088 0.009 0.000 -0.001 -0.004
(0.071) (0.100) (0.094) (0.134) (0.009) (0.003) (0.005) (0.005)
Math reform * black 0.144** 0.182** 0.118 0.214** 0.038*** 0.042*** 0.028*** 0.045***
(0.068) (0.068) (0.098) (0.104) (0.005) (0.005) (0.009) (0.006)
Black -0.216*** -0.253*** -0.712*** -0.808*** -0.216*** -0.222*** -0.130*** -0.147***
(0.059) (0.061) (0.080) (0.091) (0.007) (0.009) (0.009) (0.007)
R2 0.089 0.094 0.084 0.087 0.163 0.159 0.136 0.136
N 32,113 26,035 32,113 26,035 717,953 532,354 712,302 527,890
(B) Females Math reform 0.125** 0.114 0.006 -0.000 -0.001 0.008 0.001 -0.008
(0.060) (0.087) (0.086) (0.119) (0.004) (0.006) (0.004) (0.006)
Math reform * black 0.019 0.064 0.079 0.112 -0.021*** -0.015** 0.020** 0.036***
(0.069) (0.072) (0.103) (0.120) (0.007) (0.006) (0.008) (0.006)
Black -0.094 -0.143** -0.613*** -0.651*** -0.011 -0.018 -0.133*** -0.149***
(0.061) (0.064) (0.082) (0.106) (0.010) (0.012) (0.010) (0.011)
R2 0.107 0.117 0.089 0.090 0.150 0.148 0.031 0.033
N 33,735 27,093 33,735 27,093 648,078 481,293 647,448 480,795
Exclude non-reformers X X X X
Notes: Heteroskedasticity robust standard errors are clustered by state (* p<.10 ** p<.05 *** p<.01). The entire table includes only high school graduates. Each column in each panel shows a regression of the outcome on the variables listed, as well as state and class fixed effects, and a full set of education and experience controls in columns (5)-(8). Even-numbered columns omit states that had not enacted reforms by 1990.