Embed Size (px)
Citation preview
To replace this image:
Right click the image and select “Change Picture » From File…”
Navigate to your preferred image and click ok.
You may need to resize the image to cover the while circle “hole”.
Don’t forget to select the graphic mask, right click and select “Bring to front” to mask the photo in the circle.
This reminder box will also be hidden.
PRICE RECALIBRATION
Retail electricity price recalibration 2021–22: standing offer prices for the supply of electricity to small customers
Report 11 of 2021, June 2021
i
ICRC | PRICE RECALIBRATION: Retail electricity price recalibration 2021–22: standing offer prices for the supply of electricity to small customers
The Independent Competition and Regulatory Commission is a Territory Authority established under the Independent Competition and Regulatory Commission Act 1997 (the ICRC Act). We are constituted under the ICRC Act by one or more standing commissioners and any associated commissioners appointed for particular purposes. Commissioners are statutory appointments. Joe Dimasi is the current Senior Commissioner who constitutes the Commission and takes direct responsibility for delivery of our outcomes.
We have responsibility for a broad range of regulatory and utility administrative matters. We are responsible under the ICRC Act for regulating and advising government about pricing and other matters for monopoly, near-monopoly and ministerially declared regulated industries, and providing advice on competitive neutrality complaints and government-regulated activities. We also have responsibility for arbitrating infrastructure access disputes under the ICRC Act
We are responsible for managing the utility licence framework in the ACT, established under the Utilities Act 2000 (Utilities Act). We are responsible for the licensing determination process, monitoring licensees’ compliance with their legislative and licence obligations and determination of utility industry codes.
Our objectives are set out in section 7 and 19L of the ICRC Act and section 3 of the Utilities Act. In discharging our objectives and functions, we provide independent robust analysis and advice.
© Australian Capital Territory, Canberra
Correspondence or other inquiries may be directed to us at the following address: Independent Competition and Regulatory Commission PO Box 161 Civic Square ACT 2608
We can be contacted at the above address, or by telephone on (02) 6205 0799. Our website is www.icrc.act.gov.au and our email address is [email protected].
ii
Table of Contents
ICRC | PRICE RECALIBRATION: Retail electricity price recalibration 2021–22: standing offer prices for the supply of electricity to small customers
Table of Contents
Executive summary 1
1. Introduction 1
2. Maximum price change for 2021–22 and impact on consumers 2
2.1 Maximum price change for 2021–22 2
2.2 Impact on consumers 4
3. Reasons for the price change 6
3.1 Network costs 7
3.2 Energy purchase cost 8
4. Comparison of electricity prices in south-eastern Australia 9
5. Annual price recalibration process 11
5.1 The assessment process 11
5.2 Calculating the value of the Y factor 12
5.3 Calculation of the change in CPI 13
5.4 Information we received from ActewAGL 13
Appendix 1 Efficient costs for 2021–22 15
A.1.1 Pricing model 15
A.1.2 Estimation of major cost categories 15
References 25
List of Figures Figure ES0.1. Estimated annual bills based on estimated prices as at 1 July 2021 for interjurisdictional customers (using 6,500 kWh) 2 Figure ES0.2. Cost components as share of total costs, 2021–22 3
Figure ES0.3. Contribution to the price increase by costs component, 2021–22 5 Figure 2.1. Cost components as share of total costs, 2021–22 4 Figure 3.1. Contribution to the price increase by costs component, 2021–22 6
iii
Table of Contents
ICRC | PRICE RECALIBRATION: Retail electricity price recalibration 2021–22: standing offer prices for the supply of electricity to small customers
Figure 4.1. Estimated annual bills based on estimated prices as at 1 July 2021 for interjurisdictional customers (using 6,500 kWh) 10
List of Tables Table ES0.1. Update of electricity cost components for 2021–22 (with 2020–21 costs for comparison) 4
Table 2.1. Update of electricity cost components for 2021–22 (with 2020–21 costs for comparison) 3 Table 2.2. Estimated annual bill changes for different types of residential customers, 2021–22 5 Table 2.3. Estimated annual bill changes for different types of small business customers, 2021–22 5 Table 5.1. Components of the cost-index model, 2021–22 12
List of Boxes Box 3.1: The background of the large-scale feed-in-tariff cost 8
1
0 Executive summary
ICRC | PRICE RECALIBRATION: Retail electricity price recalibration 2021–22: standing offer prices for the supply of electricity to small customers
Executive summary
Each year, we are required under our Price Direction for Standing Offer Prices for the Supply of Electricity to Small Customers 1 July 2020 to 30 June 2024 (the price direction) to update the maximum average percentage change by which ActewAGL can increase its regulated retail tariffs (ICRC 2020a).
This report sets out the annual price adjustment for 2021−22, in line with the price direction.
Our price recalibration for 2021–22 The price recalibration (reset) resulted in a maximum average increase in ActewAGL’s basket of standing offer tariffs for 2021–22 of 11.95%. This is a real increase (excluding inflation) of 11.30%.
Impact on customers If ActewAGL increases prices by 11.95%, this would translate to an annual bill increase of $3.76 per week for an average residential customer consuming 6,500kWh. For an average non-residential customer consuming 25,000kWh, the increase in the weekly bill will be around $14.45.
These price increases only apply to standing offers. Customers on standing offers could potentially pay less by shopping around for a better deal. Our analysis of previous years’ data shows that customers could pay less on their electricity bill by switching from a standing offer to a market offer that suits their circumstances.
We are implementing a new industry code this year which will make it easier for consumers to shop around for better offers. The new code will require retailers to compare their offers against a reference price and tell customers if they think they may have a better offer. Details on the ACT Retail Electricity (Transparency and Comparability) Code are at www.icrc.act.gov.au/energy/act-retail-electricity-transparency-andcomparability-code.
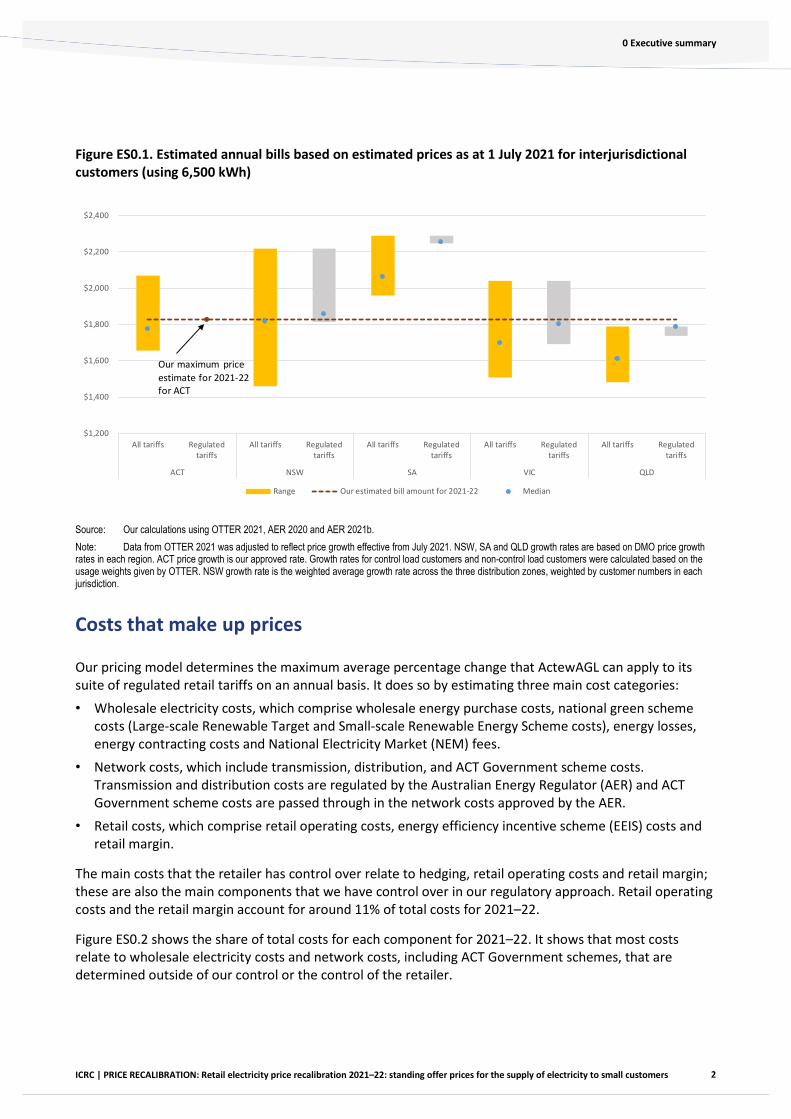
Despite these price increases, Figure ES0.1 shows that the average bill for Canberrans on standing offers will be in line with average standing offer bills in Victoria, New South Wales and Queensland.
2
0 Executive summary
ICRC | PRICE RECALIBRATION: Retail electricity price recalibration 2021–22: standing offer prices for the supply of electricity to small customers
Figure ES0.1. Estimated annual bills based on estimated prices as at 1 July 2021 for interjurisdictional customers (using 6,500 kWh)
Source: Our calculations using OTTER 2021, AER 2020 and AER 2021b. Note: Data from OTTER 2021 was adjusted to reflect price growth effective from July 2021. NSW, SA and QLD growth rates are based on DMO price growth rates in each region. ACT price growth is our approved rate. Growth rates for control load customers and non-control load customers were calculated based on the usage weights given by OTTER. NSW growth rate is the weighted average growth rate across the three distribution zones, weighted by customer numbers in each jurisdiction.
Costs that make up prices
Our pricing model determines the maximum average percentage change that ActewAGL can apply to its suite of regulated retail tariffs on an annual basis. It does so by estimating three main cost categories: • Wholesale electricity costs, which comprise wholesale energy purchase costs, national green scheme
costs (Large-scale Renewable Target and Small-scale Renewable Energy Scheme costs), energy losses, energy contracting costs and National Electricity Market (NEM) fees.
• Network costs, which include transmission, distribution, and ACT Government scheme costs. Transmission and distribution costs are regulated by the Australian Energy Regulator (AER) and ACT Government scheme costs are passed through in the network costs approved by the AER.
• Retail costs, which comprise retail operating costs, energy efficiency incentive scheme (EEIS) costs and retail margin.
The main costs that the retailer has control over relate to hedging, retail operating costs and retail margin; these are also the main components that we have control over in our regulatory approach. Retail operating costs and the retail margin account for around 11% of total costs for 2021–22.
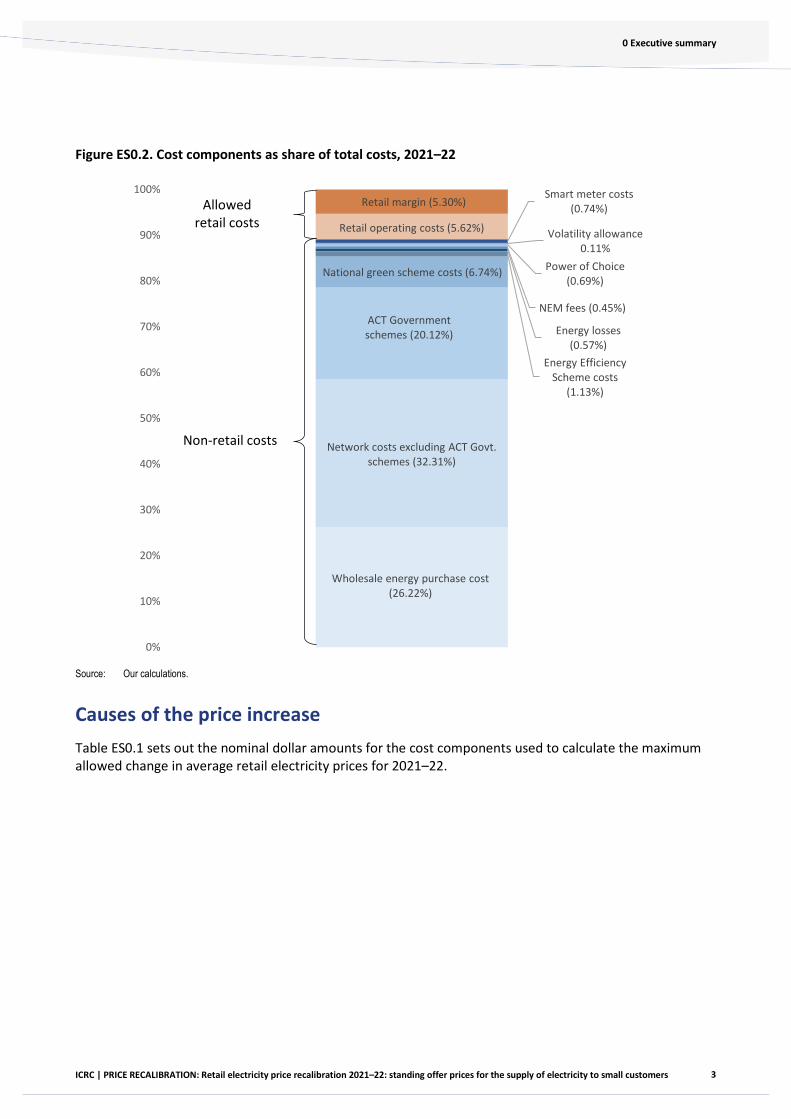
Figure ES0.2 shows the share of total costs for each component for 2021–22. It shows that most costs relate to wholesale electricity costs and network costs, including ACT Government schemes, that are determined outside of our control or the control of the retailer.
$1,200
$1,400
$1,600
$1,800
$2,000
$2,200
$2,400
All tariffs Regulatedtariffs
All tariffs Regulatedtariffs
All tariffs Regulatedtariffs
All tariffs Regulatedtariffs
All tariffs Regulatedtariffs
ACT NSW SA VIC QLD
Range Our estimated bill amount for 2021-22 Median
Our maximum price estimate for 2021-22 for ACT
3
0 Executive summary
ICRC | PRICE RECALIBRATION: Retail electricity price recalibration 2021–22: standing offer prices for the supply of electricity to small customers
Figure ES0.2. Cost components as share of total costs, 2021–22
Source: Our calculations.
Causes of the price increase Table ES0.1 sets out the nominal dollar amounts for the cost components used to calculate the maximum allowed change in average retail electricity prices for 2021–22.
Wholesale energy purchase cost(26.22%)
Network costs excluding ACT Govt. schemes (32.31%)
ACT Government schemes (20.12%)
National green scheme costs (6.74%)
Energy Efficiency Scheme costs
(1.13%)
Energy losses(0.57%)
NEM fees (0.45%)
Power of Choice(0.69%)
Volatility allowance 0.11%
Smart meter costs(0.74%)
Retail operating costs (5.62%)
Retail margin (5.30%)
0%
10%
20%
30%
40%
50%
60%
70%
80%
90%
100%
Non-retail costs
Allowedretail costs
4
0 Executive summary
ICRC | PRICE RECALIBRATION: Retail electricity price recalibration 2021–22: standing offer prices for the supply of electricity to small customers
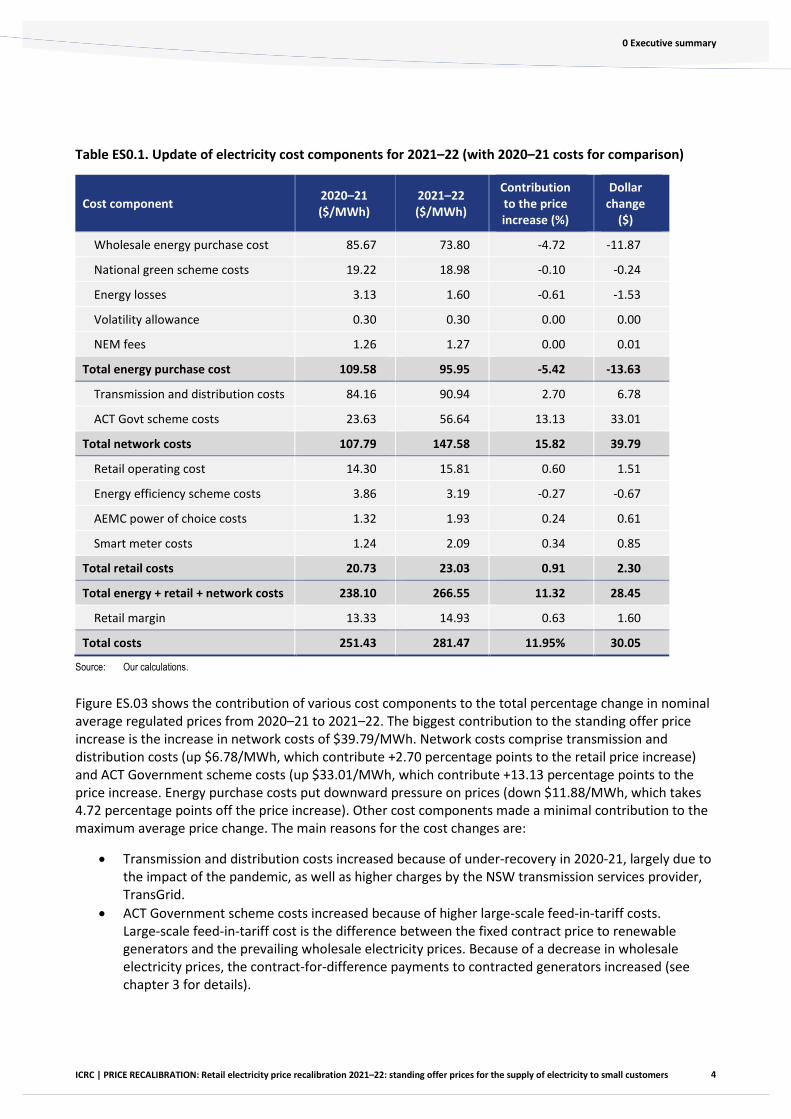
Table ES0.1. Update of electricity cost components for 2021–22 (with 2020–21 costs for comparison)
Cost component 2020–21 ($/MWh)
2021–22 ($/MWh)
Contribution to the price increase (%)
Dollar change
($)
Wholesale energy purchase cost 85.67 73.80 -4.72 -11.87
National green scheme costs 19.22 18.98 -0.10 -0.24
Energy losses 3.13 1.60 -0.61 -1.53
Volatility allowance 0.30 0.30 0.00 0.00
NEM fees 1.26 1.27 0.00 0.01
Total energy purchase cost 109.58 95.95 -5.42 -13.63
Transmission and distribution costs 84.16 90.94 2.70 6.78
ACT Govt scheme costs 23.63 56.64 13.13 33.01
Total network costs 107.79 147.58 15.82 39.79
Retail operating cost 14.30 15.81 0.60 1.51
Energy efficiency scheme costs 3.86 3.19 -0.27 -0.67
AEMC power of choice costs 1.32 1.93 0.24 0.61
Smart meter costs 1.24 2.09 0.34 0.85
Total retail costs 20.73 23.03 0.91 2.30
Total energy + retail + network costs 238.10 266.55 11.32 28.45
Retail margin 13.33 14.93 0.63 1.60
Total costs 251.43 281.47 11.95% 30.05
Source: Our calculations.
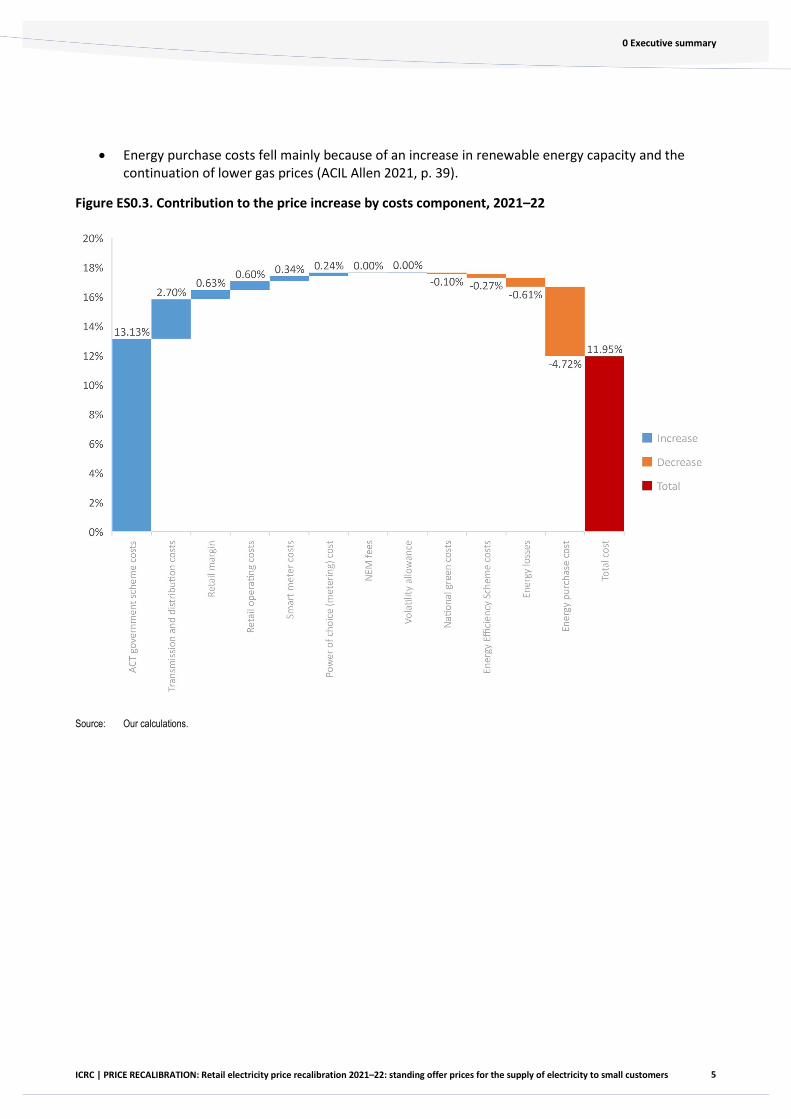
Figure ES.03 shows the contribution of various cost components to the total percentage change in nominal average regulated prices from 2020–21 to 2021–22. The biggest contribution to the standing offer price increase is the increase in network costs of $39.79/MWh. Network costs comprise transmission and distribution costs (up $6.78/MWh, which contribute +2.70 percentage points to the retail price increase) and ACT Government scheme costs (up $33.01/MWh, which contribute +13.13 percentage points to the price increase. Energy purchase costs put downward pressure on prices (down $11.88/MWh, which takes 4.72 percentage points off the price increase). Other cost components made a minimal contribution to the maximum average price change. The main reasons for the cost changes are:
• Transmission and distribution costs increased because of under-recovery in 2020-21, largely due to the impact of the pandemic, as well as higher charges by the NSW transmission services provider, TransGrid.
• ACT Government scheme costs increased because of higher large-scale feed-in-tariff costs. Large-scale feed-in-tariff cost is the difference between the fixed contract price to renewable generators and the prevailing wholesale electricity prices. Because of a decrease in wholesale electricity prices, the contract-for-difference payments to contracted generators increased (see chapter 3 for details).
5
0 Executive summary
ICRC | PRICE RECALIBRATION: Retail electricity price recalibration 2021–22: standing offer prices for the supply of electricity to small customers
• Energy purchase costs fell mainly because of an increase in renewable energy capacity and the continuation of lower gas prices (ACIL Allen 2021, p. 39).
Figure ES0.3. Contribution to the price increase by costs component, 2021–22
Source: Our calculations.
1
1 Introduction
ICRC | PRICE RECALIBRATION: Retail electricity price recalibration 2021–22: standing offer prices for the supply of electricity to small customers
1. Introduction
Our Price Direction for standing offer prices for the supply of electricity to small customers by ActewAGL from 1 July 2020 to 30 June 2024 (the price direction) requires us to recalibrate (reset) the weighted average electricity price change on an annual basis for the years 2021–22, 2022–23 and 2023–24 (ICRC 2020, p. 6).
In line with the price direction, the price reset mainly reflects updates to wholesale electricity costs, environmental scheme costs and network costs. Because these costs change over time, ActewAGL’s regulated standing offer retail electricity prices need to be updated.
This report sets out the result of our reset of the maximum price change for the supply of electricity to small customers by ActewAGL to apply in 2021–22 as specified in price direction.
The remainder of this report is structured as follows:
• Chapter 2 sets out our decision on the maximum allowed change in ActewAGL’s regulated retail electricity prices for 2021–22 and analyses the impact of the price change on customer bills.
• Chapter 3 reviews the main drivers of the price change in 2021–22. • Chapter 4 compares electricity prices between the ACT and other Australian jurisdictions. • Chapter 5 describes the annual recalibration process set out in the price direction. • Appendix 1 calculates the efficient costs of supplying electricity to customers on ActewAGL’s
regulated tariffs in accordance with our methodology and the updated inputs for 2021–22.
2
2 Maximum price chang
ICRC | PRICE RECALIBRATION: Retail electricity price recalibration 2021–22: standing offer prices for the supply of electricity to small customers
2. Maximum price change for 2021–22 and impact on consumers
This chapter presents the outcome of the price reset of the maximum allowable average percentage change that ActewAGL can adopt for its standing offer tariffs for 2021–22. It also shows the expected impact on customers.
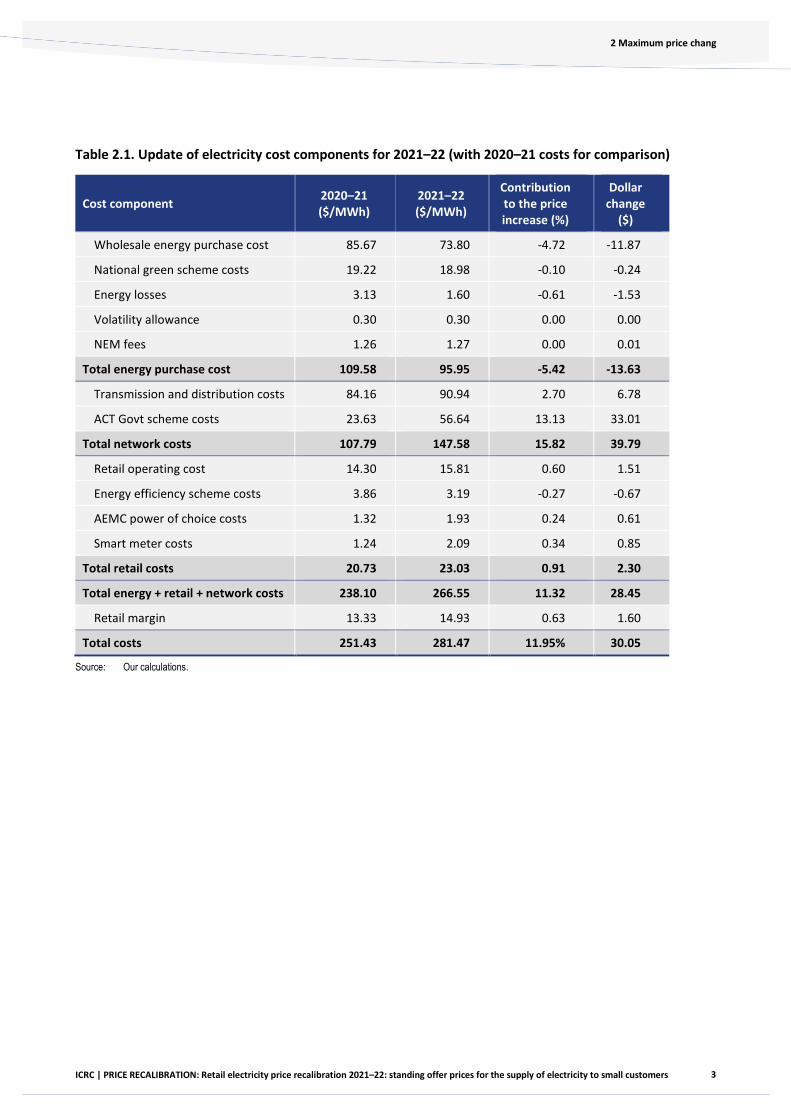
2.1 Maximum price change for 2021–22 The average nominal change in ActewAGL’s basket of regulated tariffs for 2021–22 will be an increase of 11.95%. This is equivalent to a real increase in the regulated retail price of 11.30%. Table 2.1 shows the cost components used to calculate the maximum allowable average percentage change in average regulated retail electricity prices for 2021–22.
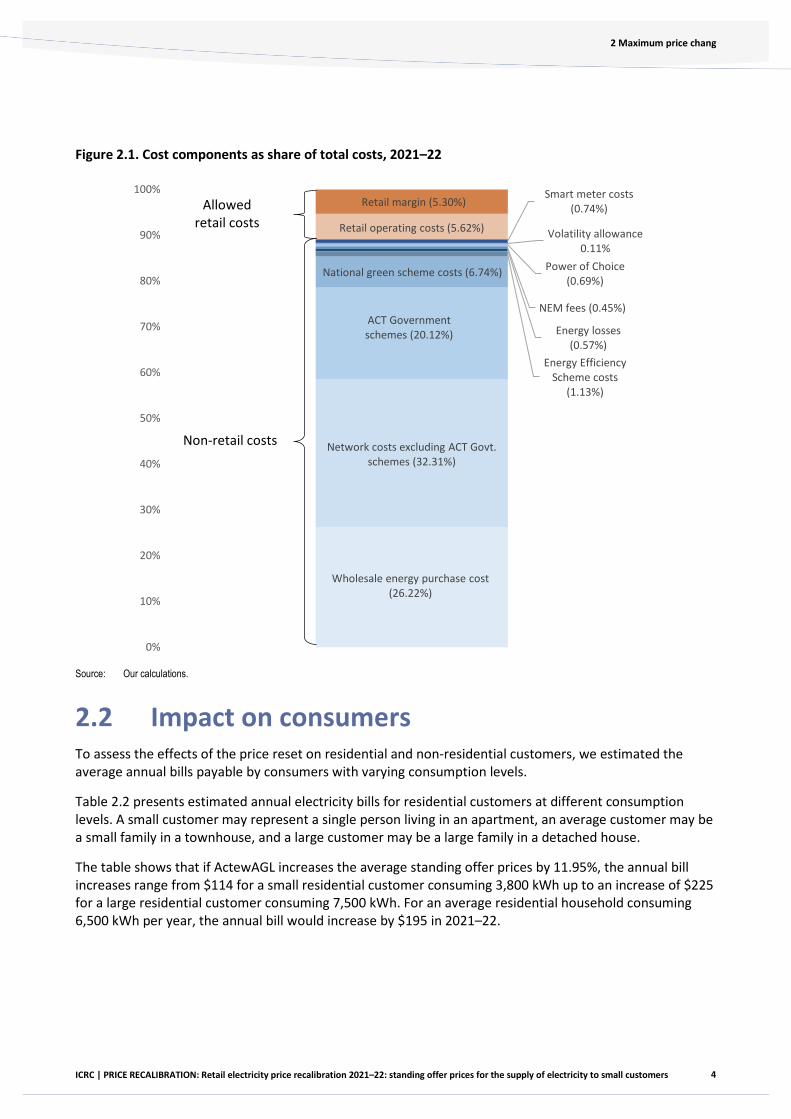
Figure 2.1 shows the share of each cost component in total costs. Most of these costs are outside of our control. These costs include:
• the direct cost of purchasing electricity from the National Electricity Market (NEM), excluding the cost of hedging strategies
• the direct cost of complying with Australian and Territory government environmental obligations • direct costs associated with energy losses in transmission and distribution • NEM fees payable to the Australian Energy Market Operator (AEMO) for operating the wholesale
market • Transmission and distribution costs • ACT Government scheme costs.
The main costs over which the retailer has control relate to hedging, retail operating costs and retail margin; these are the main cost components over which we have control. Retail operating costs and the retail margin only account for around 11% of the total costs for 2021–22.
3
2 Maximum price chang
ICRC | PRICE RECALIBRATION: Retail electricity price recalibration 2021–22: standing offer prices for the supply of electricity to small customers
Table 2.1. Update of electricity cost components for 2021–22 (with 2020–21 costs for comparison)
Cost component 2020–21 ($/MWh)
2021–22 ($/MWh)
Contribution to the price increase (%)
Dollar change
($)
Wholesale energy purchase cost 85.67 73.80 -4.72 -11.87
National green scheme costs 19.22 18.98 -0.10 -0.24
Energy losses 3.13 1.60 -0.61 -1.53
Volatility allowance 0.30 0.30 0.00 0.00
NEM fees 1.26 1.27 0.00 0.01
Total energy purchase cost 109.58 95.95 -5.42 -13.63
Transmission and distribution costs 84.16 90.94 2.70 6.78
ACT Govt scheme costs 23.63 56.64 13.13 33.01
Total network costs 107.79 147.58 15.82 39.79
Retail operating cost 14.30 15.81 0.60 1.51
Energy efficiency scheme costs 3.86 3.19 -0.27 -0.67
AEMC power of choice costs 1.32 1.93 0.24 0.61
Smart meter costs 1.24 2.09 0.34 0.85
Total retail costs 20.73 23.03 0.91 2.30
Total energy + retail + network costs 238.10 266.55 11.32 28.45
Retail margin 13.33 14.93 0.63 1.60
Total costs 251.43 281.47 11.95% 30.05
Source: Our calculations.
4
2 Maximum price chang
ICRC | PRICE RECALIBRATION: Retail electricity price recalibration 2021–22: standing offer prices for the supply of electricity to small customers
Figure 2.1. Cost components as share of total costs, 2021–22
Source: Our calculations.
2.2 Impact on consumers To assess the effects of the price reset on residential and non-residential customers, we estimated the average annual bills payable by consumers with varying consumption levels.
Table 2.2 presents estimated annual electricity bills for residential customers at different consumption levels. A small customer may represent a single person living in an apartment, an average customer may be a small family in a townhouse, and a large customer may be a large family in a detached house.
The table shows that if ActewAGL increases the average standing offer prices by 11.95%, the annual bill increases range from $114 for a small residential customer consuming 3,800 kWh up to an increase of $225 for a large residential customer consuming 7,500 kWh. For an average residential household consuming 6,500 kWh per year, the annual bill would increase by $195 in 2021–22.
Wholesale energy purchase cost(26.22%)
Network costs excluding ACT Govt. schemes (32.31%)
ACT Government schemes (20.12%)
National green scheme costs (6.74%)
Energy Efficiency Scheme costs
(1.13%)
Energy losses(0.57%)
NEM fees (0.45%)
Power of Choice(0.69%)
Volatility allowance 0.11%
Smart meter costs(0.74%)
Retail operating costs (5.62%)
Retail margin (5.30%)
0%
10%
20%
30%
40%
50%
60%
70%
80%
90%
100%
Non-retail costs
Allowedretail costs
5
2 Maximum price chang
ICRC | PRICE RECALIBRATION: Retail electricity price recalibration 2021–22: standing offer prices for the supply of electricity to small customers
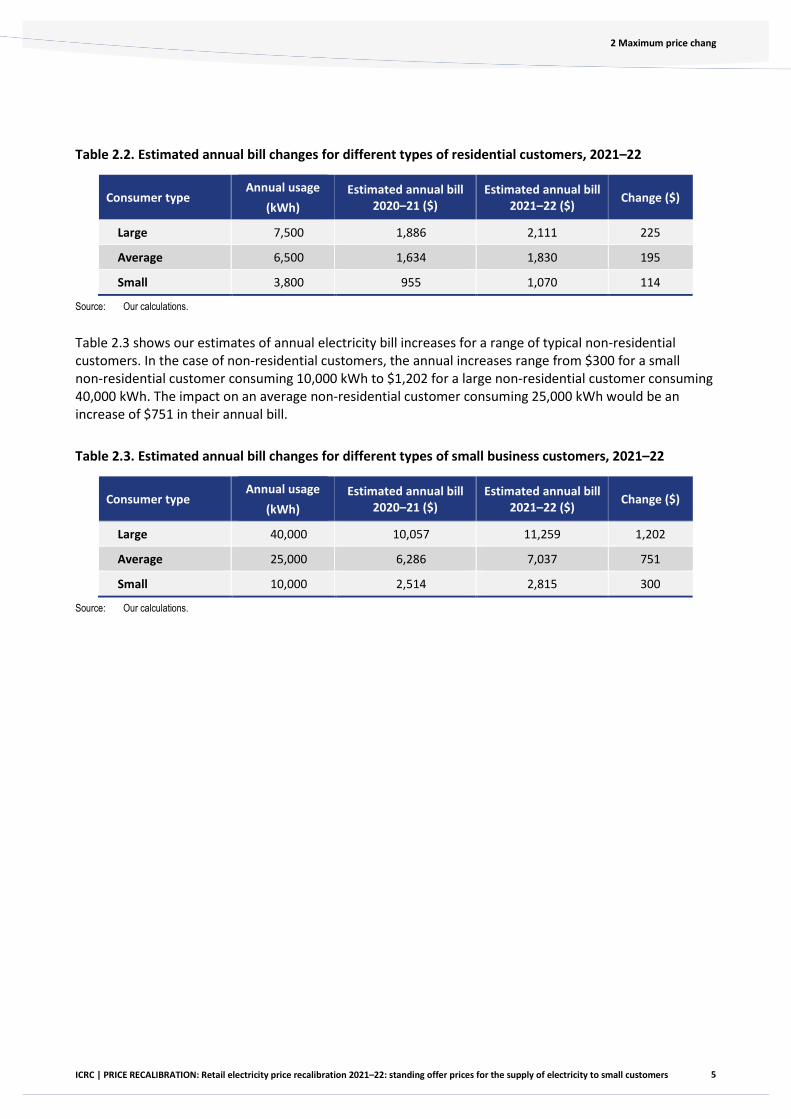
Table 2.2. Estimated annual bill changes for different types of residential customers, 2021–22
Consumer type Annual usage
(kWh) Estimated annual bill
2020–21 ($) Estimated annual bill
2021–22 ($) Change ($)
Large 7,500 1,886 2,111 225
Average 6,500 1,634 1,830 195
Small 3,800 955 1,070 114
Source: Our calculations.
Table 2.3 shows our estimates of annual electricity bill increases for a range of typical non-residential customers. In the case of non-residential customers, the annual increases range from $300 for a small non-residential customer consuming 10,000 kWh to $1,202 for a large non-residential customer consuming 40,000 kWh. The impact on an average non-residential customer consuming 25,000 kWh would be an increase of $751 in their annual bill.
Table 2.3. Estimated annual bill changes for different types of small business customers, 2021–22
Consumer type Annual usage
(kWh) Estimated annual bill
2020–21 ($) Estimated annual bill
2021–22 ($) Change ($)
Large 40,000 10,057 11,259 1,202
Average 25,000 6,286 7,037 751
Small 10,000 2,514 2,815 300
Source: Our calculations.
6
3 Reasons for the pri
ICRC | PRICE RECALIBRATION: Retail electricity price recalibration 2021–22: standing offer prices for the supply of electricity to small customers
3. Reasons for the price change
This chapter discusses the main reasons for the maximum average change in standing offer prices for 2021-22. Appendix 1 presents details about how each cost component was estimated.
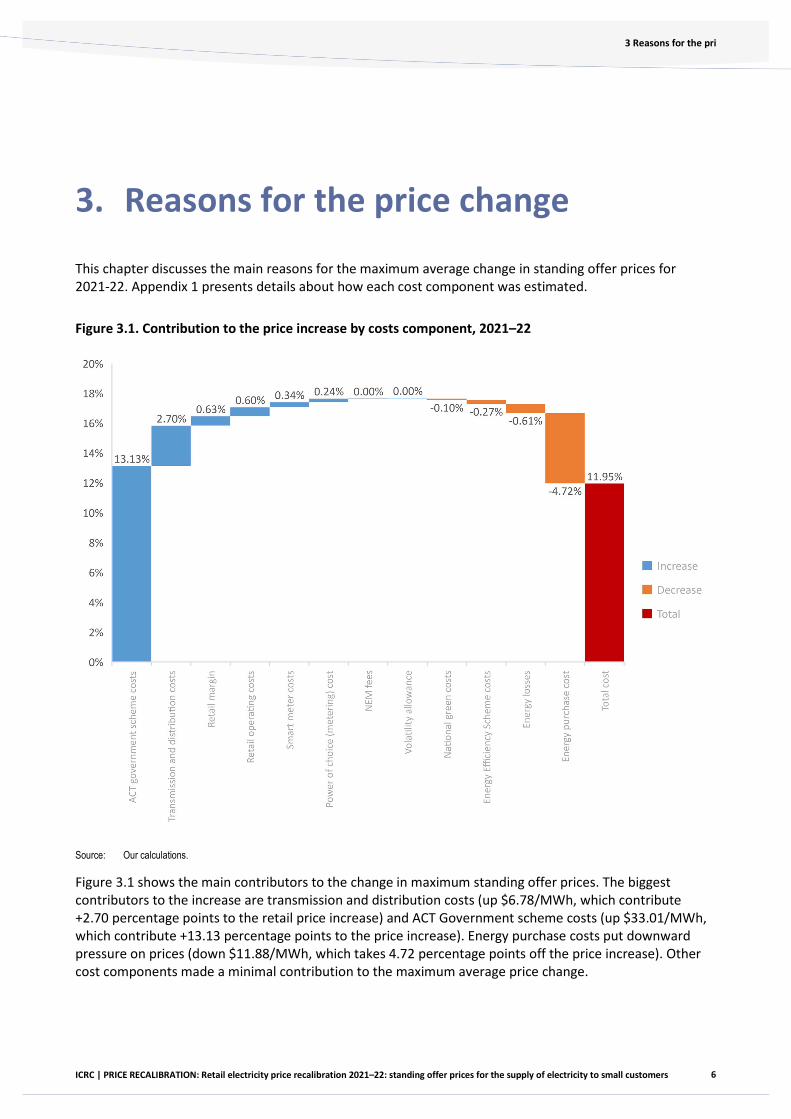
Figure 3.1. Contribution to the price increase by costs component, 2021–22
Source: Our calculations.
Figure 3.1 shows the main contributors to the change in maximum standing offer prices. The biggest contributors to the increase are transmission and distribution costs (up $6.78/MWh, which contribute +2.70 percentage points to the retail price increase) and ACT Government scheme costs (up $33.01/MWh, which contribute +13.13 percentage points to the price increase). Energy purchase costs put downward pressure on prices (down $11.88/MWh, which takes 4.72 percentage points off the price increase). Other cost components made a minimal contribution to the maximum average price change.
7
3 Reasons for the pri
ICRC | PRICE RECALIBRATION: Retail electricity price recalibration 2021–22: standing offer prices for the supply of electricity to small customers
3.1 Network costs Total network costs for standing offer customers will increase from $107.79 per MWh in 2020–21 to $147.58 per MWh in 2021–22, an increase of $39.79/MWh, which contributes +15.82 percentage points to the maximum price change.
Network costs include transmission and distribution costs and ACT Government scheme costs. Transmission and distribution costs are regulated by the AER and ACT Government scheme costs are passed through in the network costs approved by the AER.
Transmission and distribution costs These are the cost of poles and wires to transport electricity from generators to consumers. The transmission and distribution costs for standing offer customers will increase from $84.16/MWh in 2020-21 to $90.94/MWh in 2021–22, an increase of $6.78/MWh, which contributes +2.70 percentage points to the maximum price change.
On 7 May 2021, the AER approved a 5.7% increase in distribution costs and a 17.0% increase in transmission costs for the ACT’s network service provider, which is Evoenergy (AER 2021a, p 1).
The increase in distribution costs reflected an under-recovery during 2020–21. This was mainly due to the COVID-19 pandemic, which led to changes in electricity demand and reduced Evoenergy’s revenue. Specifically, the effect of decreased business usage more than offset an increase residential usage.
The increase in transmission costs mainly reflects increased charges to the NSW transmission network operator, TransGrid (up $7 million), and, to a lesser extent, an under-recovery during 2020–21 (worth $2 million). TransGrid recovers the cost of transmitting electricity to the ACT border before it becomes the responsibility of the ACT’s network services provider, Evoenergy.
ACT Government scheme costs ACT Government scheme costs increased because of a rise in the large-scale feed-in-tariff costs, which account for 83.3% of ACT Government scheme costs in 2021–22 (AER 2021a).
The large-scale feed-in-tariff costs for standing offer customers will increase from $14.92 per MWh in 2020–21 to $47.23 per MWh in 2021–22. This is mainly because of a decrease in wholesale electricity prices.
The ACT Government scheme costs for standing offer customers will increase from $23.63/MWh in 2020-21 to $56.64/MWh in 2021–22, an increase of $33.01/MWh, which contributes 13.13 percentage points to the maximum price change.
Why do lower wholesale prices increase the large-scale feed-in-tariff cost?
Under the large-scale feed-in-tariff scheme, the ACT Government sources renewable electricity from generators under contracts. The ACT Government has agreed to pay these generators a ‘contract price’ for the electricity they feed into the grid. This arrangement encouraged the contracted generators to invest in supplying renewable energy because they have certainty that they will recover the costs of their
8
3 Reasons for the pri
ICRC | PRICE RECALIBRATION: Retail electricity price recalibration 2021–22: standing offer prices for the supply of electricity to small customers
investments. The contract price is fixed and, therefore, can be above or below the wholesale spot price at any given time.
Generators contracted under this scheme receive the spot price plus the difference between the spot price and the contract price. The difference between the spot price and the contract price is called the large-scale feed-in-tariff cost. The applicable spot price for this payment is the spot price in the jurisdiction in which the generator is located.
The recent fall in wholesale spot prices means that the contracted generators received payments for the difference between the wholesale spot price and the higher contract price. Therefore, the lower wholesale prices increased the large-scale feed-in-tariff cost.
Box 3.1: The background of the large-scale feed-in-tariff cost
In 2016, the ACT Government set a target of 100 per cent renewable electricity supply in the ACT by 2020. Most of the ACT’s renewable electricity supply comes from the ACT government’s feed in tariff schemes, which include the large-scale feed-in-tariff scheme and the small and medium-scale feed-in-tariff scheme. The electricity generated under these schemes is fed into the national grid to offset the electricity ACT residents and businesses consume.
Under the large-scale feed-in-tariff scheme, the ACT Government sources renewable electricity from certain large-scale wind and solar farms with a generating capacity above 200kW. These generators are in the ACT, South Australia, Victoria and New South Wales.
On 26 February 2021, the ACT Government announced the large-scale feed-in-tariff cost for 2021-22. The cost increased from $42m in 2020–21 to $127m in 2021–22 (AER 2021a).
3.2 Energy purchase cost As shown in Figure 3.1, energy purchase costs will decrease from $85.67/MWh in 2020–21 to $73.80/MWh in 2021–22, a decrease of $11.88/MWh. This will reduce the maximum weighted average price change for 2021–22 by 4.72 percentage points.
The fall in wholesale electricity costs mainly reflects an increase in renewable energy capacity and the continuation of lower gas prices (ACIL Allen 2021, p. 39). Gas prices have fallen because of reduced gas-fired generation demand and lower international LNG export prices.
Energy purchase costs are the costs incurred by retailers in purchasing electricity from the wholesale market to meet the demand of their customers. Purchases of energy through the wholesale energy market account for around 26% of the total cost of providing retail electricity services to customers on regulated retail tariffs in the ACT.
9
4 Comparison of elect
ICRC | PRICE RECALIBRATION: Retail electricity price recalibration 2021–22: standing offer prices for the supply of electricity to small customers
4. Comparison of electricity prices in south-eastern Australia
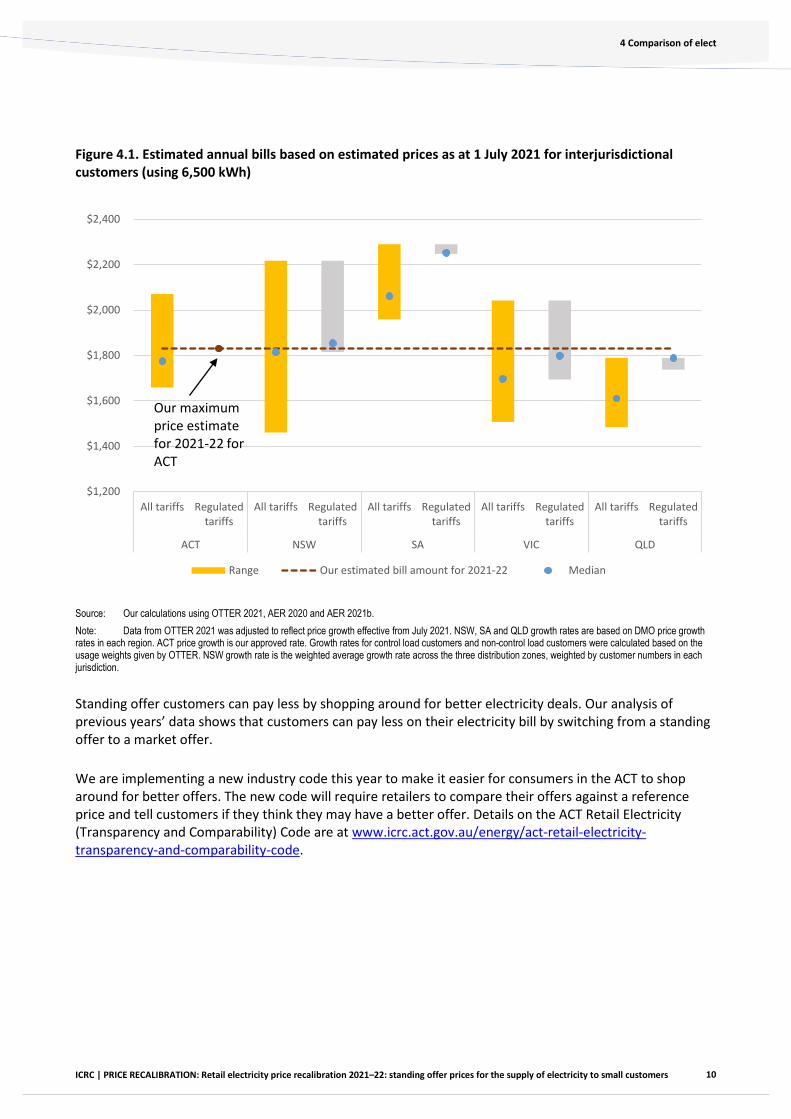
Figure 4.1 compares the maximum average bill amount for customers on standing offers consuming 6,500 kWh in 2021–22.
Despite the increase in regulated electricity prices, the average bill for Canberrans on standing offers will be in line with average standing offer bills in Victoria, New South Wales and Queensland . This is shown in figure 4.1.
However, care needs to be taken in making interstate comparisons as the regulated price increases mentioned only apply to standing offer tariffs. Many customers can pay less if they shop around for better deals on market offers.
The maximum average standing offer bill amount for the ACT reflects the 11.95% allowed increase in ActewAGL’s regulated basket of tariffs.
10
4 Comparison of elect
ICRC | PRICE RECALIBRATION: Retail electricity price recalibration 2021–22: standing offer prices for the supply of electricity to small customers
Figure 4.1. Estimated annual bills based on estimated prices as at 1 July 2021 for interjurisdictional customers (using 6,500 kWh)
Source: Our calculations using OTTER 2021, AER 2020 and AER 2021b. Note: Data from OTTER 2021 was adjusted to reflect price growth effective from July 2021. NSW, SA and QLD growth rates are based on DMO price growth rates in each region. ACT price growth is our approved rate. Growth rates for control load customers and non-control load customers were calculated based on the usage weights given by OTTER. NSW growth rate is the weighted average growth rate across the three distribution zones, weighted by customer numbers in each jurisdiction.
Standing offer customers can pay less by shopping around for better electricity deals. Our analysis of previous years’ data shows that customers can pay less on their electricity bill by switching from a standing offer to a market offer.
We are implementing a new industry code this year to make it easier for consumers in the ACT to shop around for better offers. The new code will require retailers to compare their offers against a reference price and tell customers if they think they may have a better offer. Details on the ACT Retail Electricity (Transparency and Comparability) Code are at www.icrc.act.gov.au/energy/act-retail-electricity-transparency-and-comparability-code.
$1,200
$1,400
$1,600
$1,800
$2,000
$2,200
$2,400
All tariffs Regulatedtariffs
All tariffs Regulatedtariffs
All tariffs Regulatedtariffs
All tariffs Regulatedtariffs
All tariffs Regulatedtariffs
ACT NSW SA VIC QLD
Range Our estimated bill amount for 2021-22 Median
Our maximum price estimate for 2021-22 for ACT
11
5 Annual price recali
ICRC | PRICE RECALIBRATION: Retail electricity price recalibration 2021–22: standing offer prices for the supply of electricity to small customers
5. Annual price recalibration process
This chapter explains how we reset regulated prices for 2021–22. We also describe the information we received from ActewAGL for this price recalibration.
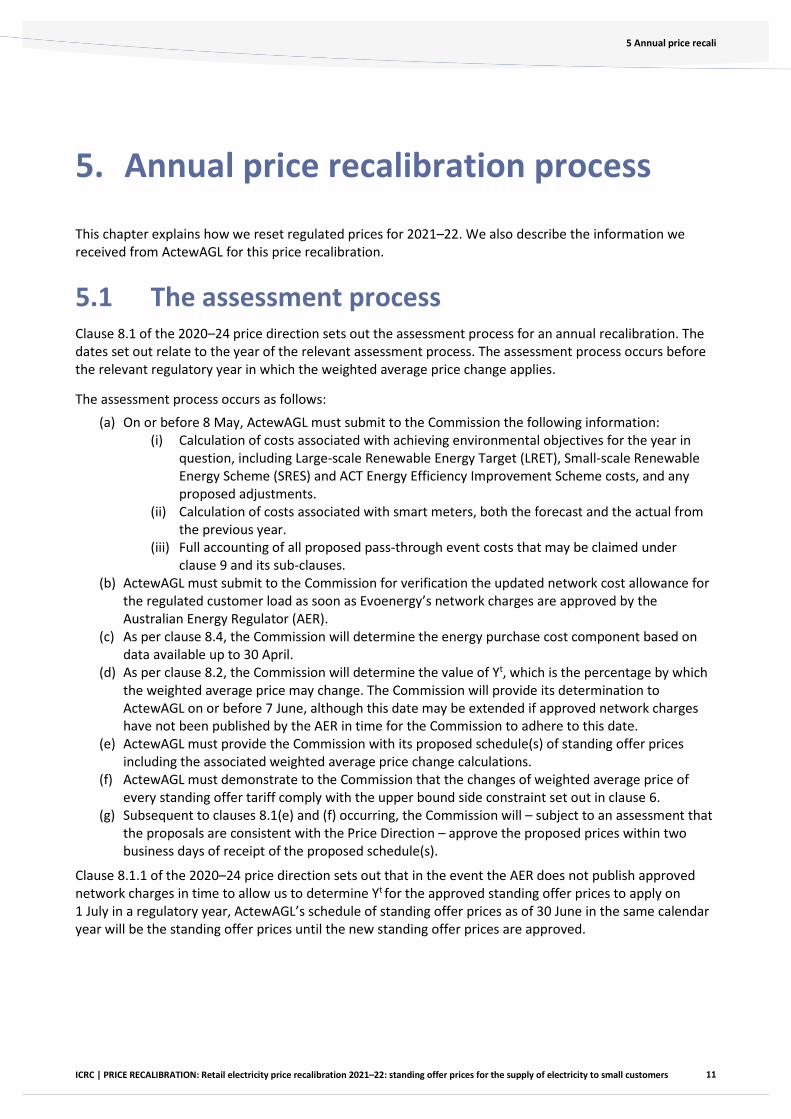
5.1 The assessment process Clause 8.1 of the 2020–24 price direction sets out the assessment process for an annual recalibration. The dates set out relate to the year of the relevant assessment process. The assessment process occurs before the relevant regulatory year in which the weighted average price change applies.
The assessment process occurs as follows: (a) On or before 8 May, ActewAGL must submit to the Commission the following information:
(i) Calculation of costs associated with achieving environmental objectives for the year in question, including Large-scale Renewable Energy Target (LRET), Small-scale Renewable Energy Scheme (SRES) and ACT Energy Efficiency Improvement Scheme costs, and any proposed adjustments.
(ii) Calculation of costs associated with smart meters, both the forecast and the actual from the previous year.
(iii) Full accounting of all proposed pass-through event costs that may be claimed under clause 9 and its sub-clauses.
(b) ActewAGL must submit to the Commission for verification the updated network cost allowance for the regulated customer load as soon as Evoenergy’s network charges are approved by the Australian Energy Regulator (AER).
(c) As per clause 8.4, the Commission will determine the energy purchase cost component based on data available up to 30 April.
(d) As per clause 8.2, the Commission will determine the value of Yt, which is the percentage by which the weighted average price may change. The Commission will provide its determination to ActewAGL on or before 7 June, although this date may be extended if approved network charges have not been published by the AER in time for the Commission to adhere to this date.
(e) ActewAGL must provide the Commission with its proposed schedule(s) of standing offer prices including the associated weighted average price change calculations.
(f) ActewAGL must demonstrate to the Commission that the changes of weighted average price of every standing offer tariff comply with the upper bound side constraint set out in clause 6.
(g) Subsequent to clauses 8.1(e) and (f) occurring, the Commission will – subject to an assessment that the proposals are consistent with the Price Direction – approve the proposed prices within two business days of receipt of the proposed schedule(s).
Clause 8.1.1 of the 2020–24 price direction sets out that in the event the AER does not publish approved network charges in time to allow us to determine Yt for the approved standing offer prices to apply on 1 July in a regulatory year, ActewAGL’s schedule of standing offer prices as of 30 June in the same calendar year will be the standing offer prices until the new standing offer prices are approved.
12
5 Annual price recali
ICRC | PRICE RECALIBRATION: Retail electricity price recalibration 2021–22: standing offer prices for the supply of electricity to small customers
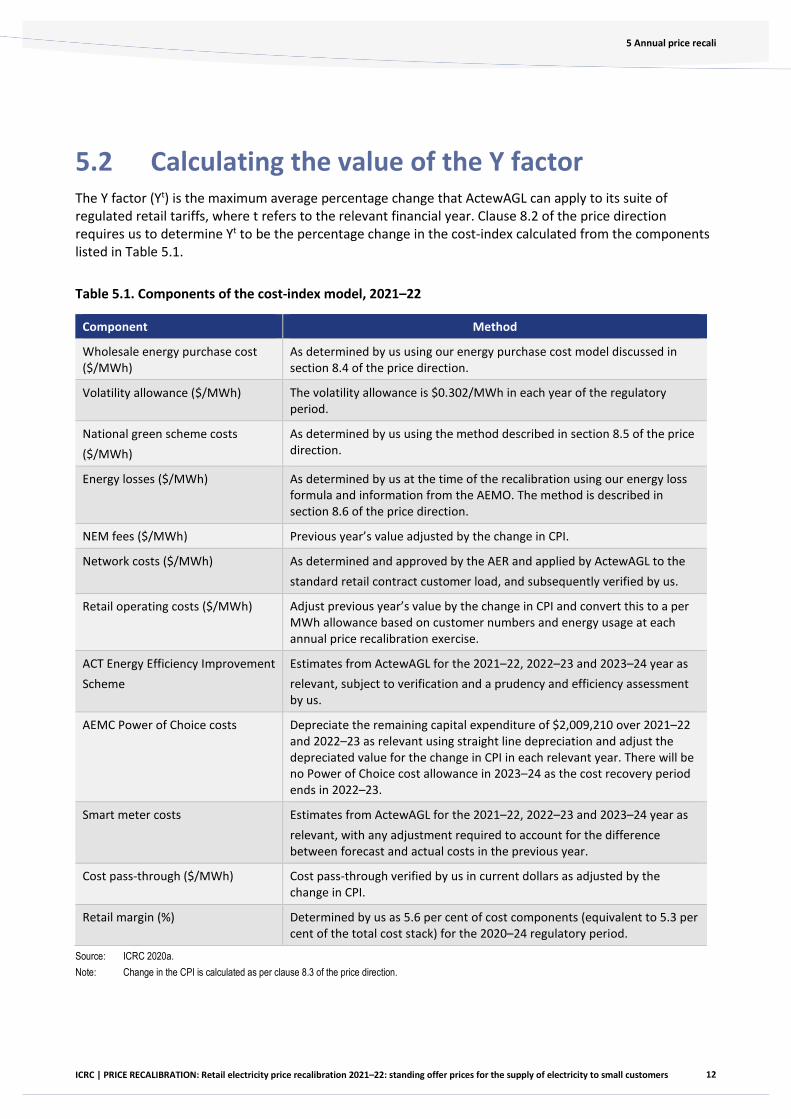
5.2 Calculating the value of the Y factor The Y factor (Yt) is the maximum average percentage change that ActewAGL can apply to its suite of regulated retail tariffs, where t refers to the relevant financial year. Clause 8.2 of the price direction requires us to determine Yt to be the percentage change in the cost-index calculated from the components listed in Table 5.1.
Table 5.1. Components of the cost-index model, 2021–22
Component Method
Wholesale energy purchase cost ($/MWh)
As determined by us using our energy purchase cost model discussed in section 8.4 of the price direction.
Volatility allowance ($/MWh) The volatility allowance is $0.302/MWh in each year of the regulatory period.
National green scheme costs ($/MWh)
As determined by us using the method described in section 8.5 of the price direction.
Energy losses ($/MWh) As determined by us at the time of the recalibration using our energy loss formula and information from the AEMO. The method is described in section 8.6 of the price direction.
NEM fees ($/MWh) Previous year’s value adjusted by the change in CPI.
Network costs ($/MWh) As determined and approved by the AER and applied by ActewAGL to the standard retail contract customer load, and subsequently verified by us.
Retail operating costs ($/MWh) Adjust previous year’s value by the change in CPI and convert this to a per MWh allowance based on customer numbers and energy usage at each annual price recalibration exercise.
ACT Energy Efficiency Improvement Scheme
Estimates from ActewAGL for the 2021–22, 2022–23 and 2023–24 year as relevant, subject to verification and a prudency and efficiency assessment by us.
AEMC Power of Choice costs Depreciate the remaining capital expenditure of $2,009,210 over 2021–22 and 2022–23 as relevant using straight line depreciation and adjust the depreciated value for the change in CPI in each relevant year. There will be no Power of Choice cost allowance in 2023–24 as the cost recovery period ends in 2022–23.
Smart meter costs Estimates from ActewAGL for the 2021–22, 2022–23 and 2023–24 year as relevant, with any adjustment required to account for the difference between forecast and actual costs in the previous year.
Cost pass-through ($/MWh) Cost pass-through verified by us in current dollars as adjusted by the change in CPI.
Retail margin (%) Determined by us as 5.6 per cent of cost components (equivalent to 5.3 per cent of the total cost stack) for the 2020–24 regulatory period.
Source: ICRC 2020a. Note: Change in the CPI is calculated as per clause 8.3 of the price direction.
13
5 Annual price recali
ICRC | PRICE RECALIBRATION: Retail electricity price recalibration 2021–22: standing offer prices for the supply of electricity to small customers
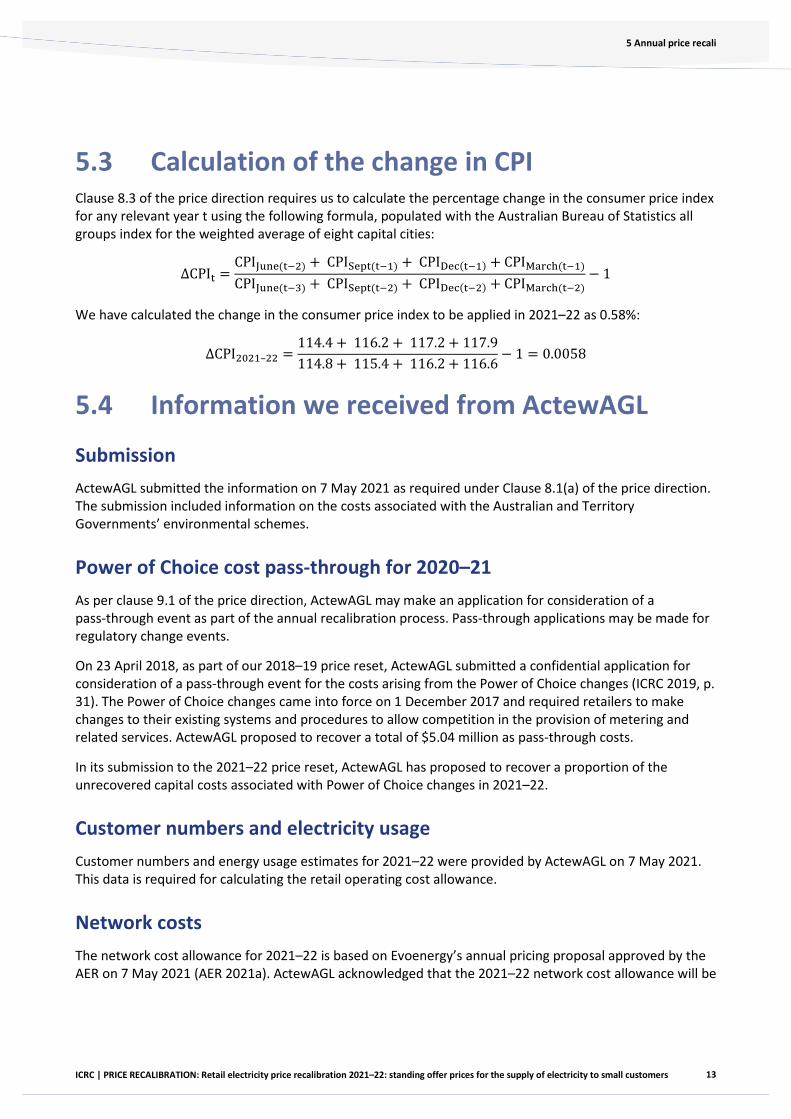
5.3 Calculation of the change in CPI Clause 8.3 of the price direction requires us to calculate the percentage change in the consumer price index for any relevant year t using the following formula, populated with the Australian Bureau of Statistics all groups index for the weighted average of eight capital cities:
∆CPIt =CPIJune(t−2) + CPISept(t−1) + CPIDec(t−1) + CPIMarch(t−1)
CPIJune(t−3) + CPISept(t−2) + CPIDec(t−2) + CPIMarch(t−2)− 1
We have calculated the change in the consumer price index to be applied in 2021–22 as 0.58%:
∆CPI2021–22 =114.4 + 116.2 + 117.2 + 117.9114.8 + 115.4 + 116.2 + 116.6
− 1 = 0.0058
5.4 Information we received from ActewAGL
Submission ActewAGL submitted the information on 7 May 2021 as required under Clause 8.1(a) of the price direction. The submission included information on the costs associated with the Australian and Territory Governments’ environmental schemes.
Power of Choice cost pass-through for 2020–21 As per clause 9.1 of the price direction, ActewAGL may make an application for consideration of a pass-through event as part of the annual recalibration process. Pass-through applications may be made for regulatory change events.
On 23 April 2018, as part of our 2018–19 price reset, ActewAGL submitted a confidential application for consideration of a pass-through event for the costs arising from the Power of Choice changes (ICRC 2019, p. 31). The Power of Choice changes came into force on 1 December 2017 and required retailers to make changes to their existing systems and procedures to allow competition in the provision of metering and related services. ActewAGL proposed to recover a total of $5.04 million as pass-through costs.
In its submission to the 2021–22 price reset, ActewAGL has proposed to recover a proportion of the unrecovered capital costs associated with Power of Choice changes in 2021–22.
Customer numbers and electricity usage Customer numbers and energy usage estimates for 2021–22 were provided by ActewAGL on 7 May 2021. This data is required for calculating the retail operating cost allowance.
Network costs The network cost allowance for 2021–22 is based on Evoenergy’s annual pricing proposal approved by the AER on 7 May 2021 (AER 2021a). ActewAGL acknowledged that the 2021–22 network cost allowance will be

14
5 Annual price recali
ICRC | PRICE RECALIBRATION: Retail electricity price recalibration 2021–22: standing offer prices for the supply of electricity to small customers
subject to our revised method for determining network costs, as outlined in our Form of Price Control Review (ICRC, 2021).
15
Appendix 1 Efficient
ICRC | PRICE RECALIBRATION: Retail electricity price recalibration 2021–22: standing offer prices for the supply of electricity to small customers
Appendix 1 Efficient costs for 2021–22
This appendix presents our calculation of the efficient costs of supplying electricity to small customers on ActewAGL’s regulated tariffs using our pricing model and methodology set out in the 2020–24 price direction.
A.1.1 Pricing model Our pricing model determines the maximum average percentage change that ActewAGL can apply to its suite of regulated retail tariffs on an annual basis. It does so by estimating three main cost categories:
• Wholesale electricity costs, which comprise wholesale energy purchase costs, national green scheme costs (LRET and SRES costs), energy losses, energy contracting costs and NEM fees.
• Network costs, which include transmission, distribution and ACT Government scheme costs. Transmission and distribution costs are regulated by the AER and ACT Government scheme costs are passed through in the network costs approved by the AER.
• Retail costs, which comprise retail operating costs, EEIS costs and retail margin.
Our estimation of each of these cost categories and their components are discussed below.
A.1.2 Estimation of major cost categories
A.1.2.1 Wholesale energy purchase cost To estimate energy purchase cost, we need estimates of contract position and contract prices (forward prices). The contract position refers to the number of base swap, peak swap and base cap contracts used in the hedging strategy.
Contract position We determine the contract position using the heuristic specified in 2020–24 price investigation.1 We applied the heuristic to the half-hourly ACT load data from 1 January 2016 to 31 December 2020. The resulting contract positions are shown in Table A1.1.
————— 1 For more details about the heuristic, see our final decision for 2020–24 price investigation.
16
Appendix 1 Efficient
ICRC | PRICE RECALIBRATION: Retail electricity price recalibration 2021–22: standing offer prices for the supply of electricity to small customers
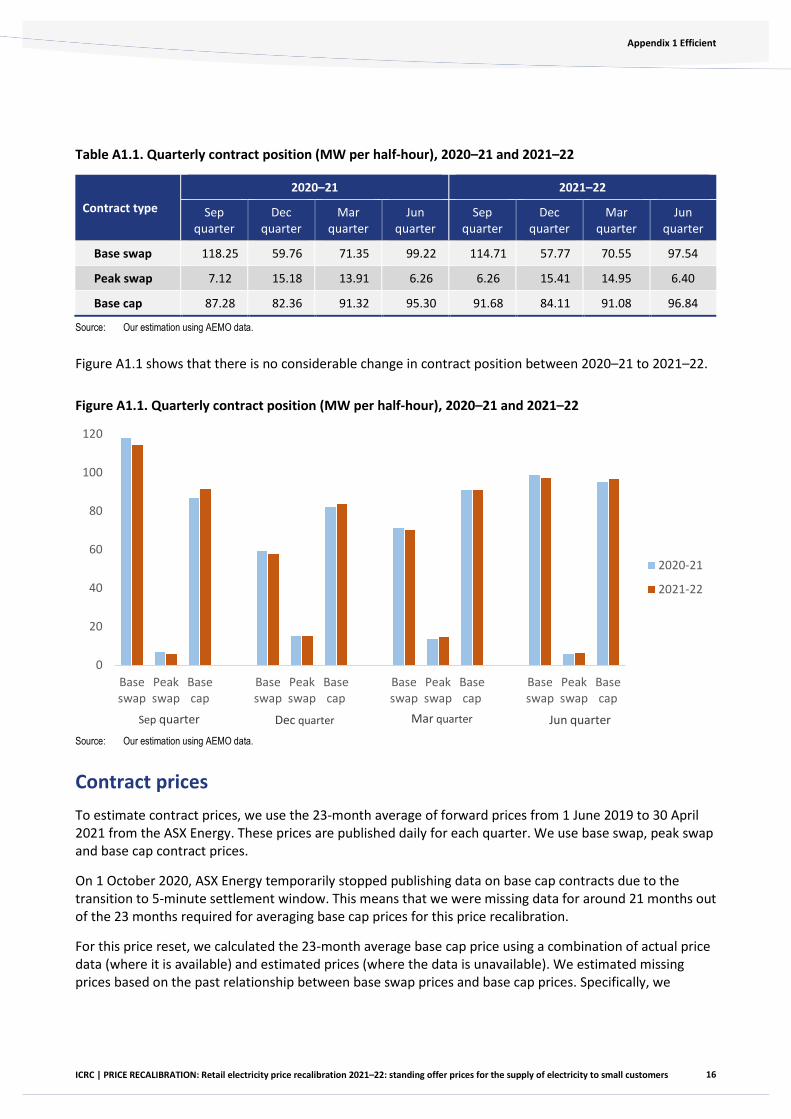
Table A1.1. Quarterly contract position (MW per half-hour), 2020–21 and 2021–22
Contract type 2020–21 2021–22
Sep quarter
Dec quarter
Mar quarter
Jun quarter
Sep quarter
Dec quarter
Mar quarter
Jun quarter
Base swap 118.25 59.76 71.35 99.22 114.71 57.77 70.55 97.54
Peak swap 7.12 15.18 13.91 6.26 6.26 15.41 14.95 6.40
Base cap 87.28 82.36 91.32 95.30 91.68 84.11 91.08 96.84
Source: Our estimation using AEMO data.
Figure A1.1 shows that there is no considerable change in contract position between 2020–21 to 2021–22.
Figure A1.1. Quarterly contract position (MW per half-hour), 2020–21 and 2021–22
Source: Our estimation using AEMO data.
Contract prices To estimate contract prices, we use the 23-month average of forward prices from 1 June 2019 to 30 April 2021 from the ASX Energy. These prices are published daily for each quarter. We use base swap, peak swap and base cap contract prices.
On 1 October 2020, ASX Energy temporarily stopped publishing data on base cap contracts due to the transition to 5-minute settlement window. This means that we were missing data for around 21 months out of the 23 months required for averaging base cap prices for this price recalibration.
For this price reset, we calculated the 23-month average base cap price using a combination of actual price data (where it is available) and estimated prices (where the data is unavailable). We estimated missing prices based on the past relationship between base swap prices and base cap prices. Specifically, we
0
20
40
60
80
100
120
Baseswap
Peakswap
Basecap
Baseswap
Peakswap
Basecap
Baseswap
Peakswap
Basecap
Baseswap
Peakswap
Basecap
2020-21
2021-22
Sep quarter Dec quarter Mar quarter Jun quarter
17
Appendix 1 Efficient
ICRC | PRICE RECALIBRATION: Retail electricity price recalibration 2021–22: standing offer prices for the supply of electricity to small customers
calculated the ratio of base cap prices to base swap prices for 2020–21 contracts. We then applied that ratio to base swap prices for 2021–22 to estimate missing base cap prices.
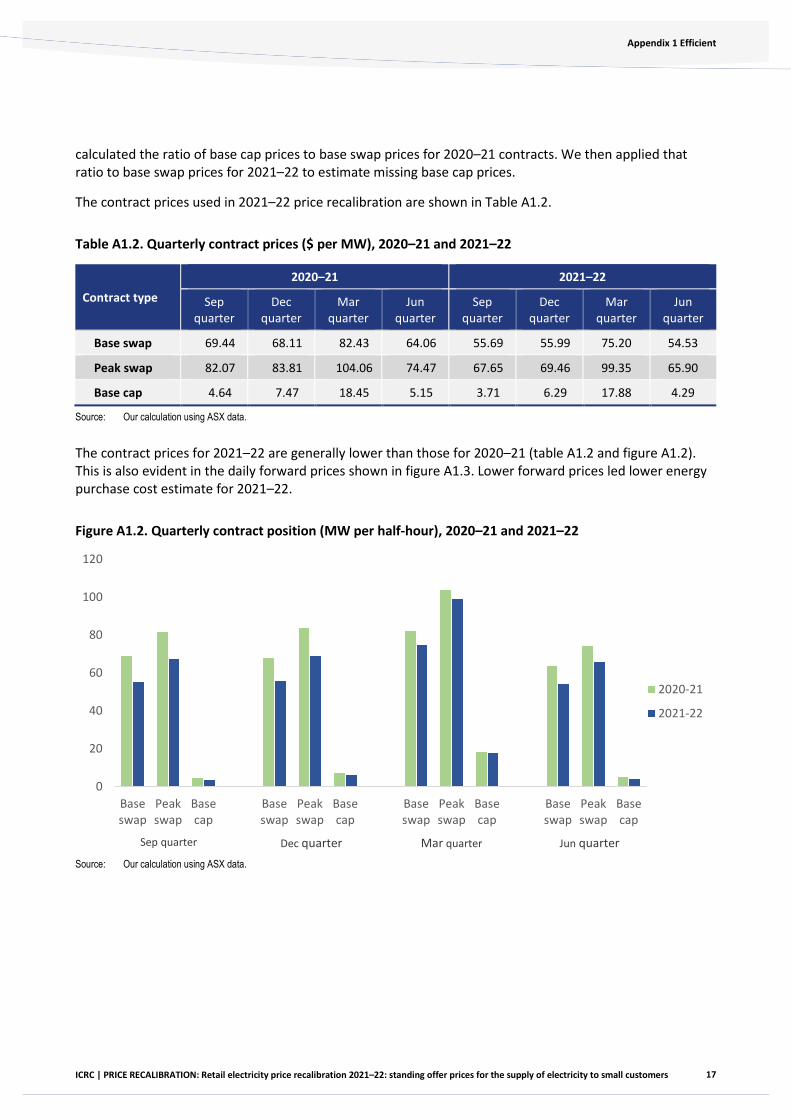
The contract prices used in 2021–22 price recalibration are shown in Table A1.2.
Table A1.2. Quarterly contract prices ($ per MW), 2020–21 and 2021–22
Contract type 2020–21 2021–22
Sep quarter
Dec quarter
Mar quarter
Jun quarter
Sep quarter
Dec quarter
Mar quarter
Jun quarter
Base swap 69.44 68.11 82.43 64.06 55.69 55.99 75.20 54.53
Peak swap 82.07 83.81 104.06 74.47 67.65 69.46 99.35 65.90
Base cap 4.64 7.47 18.45 5.15 3.71 6.29 17.88 4.29
Source: Our calculation using ASX data.
The contract prices for 2021–22 are generally lower than those for 2020–21 (table A1.2 and figure A1.2). This is also evident in the daily forward prices shown in figure A1.3. Lower forward prices led lower energy purchase cost estimate for 2021–22.
Figure A1.2. Quarterly contract position (MW per half-hour), 2020–21 and 2021–22
Source: Our calculation using ASX data.
0
20
40
60
80
100
120
Baseswap
Peakswap
Basecap
Baseswap
Peakswap
Basecap
Baseswap
Peakswap
Basecap
Baseswap
Peakswap
Basecap
2020-21
2021-22
Sep quarter Dec quarter Mar quarter Jun quarter
18
Appendix 1 Efficient
ICRC | PRICE RECALIBRATION: Retail electricity price recalibration 2021–22: standing offer prices for the supply of electricity to small customers
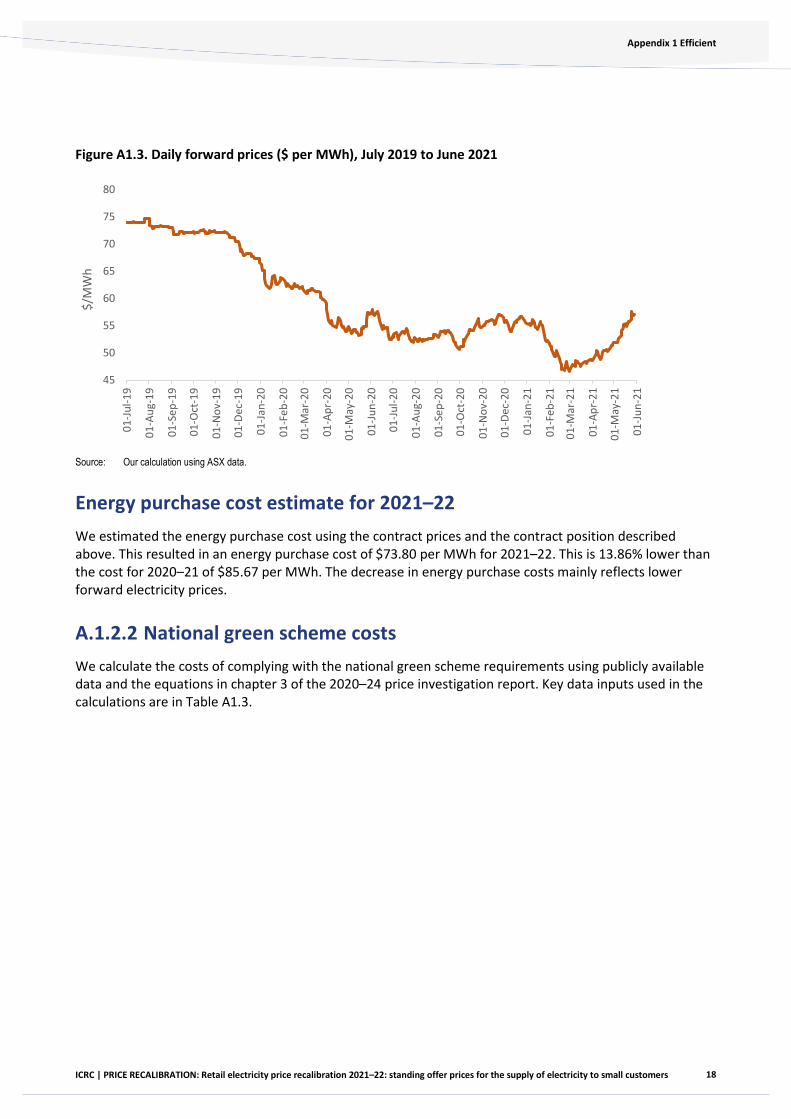
Figure A1.3. Daily forward prices ($ per MWh), July 2019 to June 2021
Source: Our calculation using ASX data.
Energy purchase cost estimate for 2021–22 We estimated the energy purchase cost using the contract prices and the contract position described above. This resulted in an energy purchase cost of $73.80 per MWh for 2021–22. This is 13.86% lower than the cost for 2020–21 of $85.67 per MWh. The decrease in energy purchase costs mainly reflects lower forward electricity prices.
A.1.2.2 National green scheme costs We calculate the costs of complying with the national green scheme requirements using publicly available data and the equations in chapter 3 of the 2020–24 price investigation report. Key data inputs used in the calculations are in Table A1.3.
45
50
55
60
65
70
75
80
01-Ju
l-19
01-A
ug-1
9
01-S
ep-1
9
01-O
ct-1
9
01-N
ov-1
9
01-D
ec-1
9
01-Ja
n-20
01-F
eb-2
0
01-M
ar-2
0
01-A
pr-2
0
01-M
ay-2
0
01-Ju
n-20
01-Ju
l-20
01-A
ug-2
0
01-S
ep-2
0
01-O
ct-2
0
01-N
ov-2
0
01-D
ec-2
0
01-Ja
n-21
01-F
eb-2
1
01-M
ar-2
1
01-A
pr-2
1
01-M
ay-2
1
01-Ju
n-21
$/M
Wh
19
Appendix 1 Efficient
ICRC | PRICE RECALIBRATION: Retail electricity price recalibration 2021–22: standing offer prices for the supply of electricity to small customers
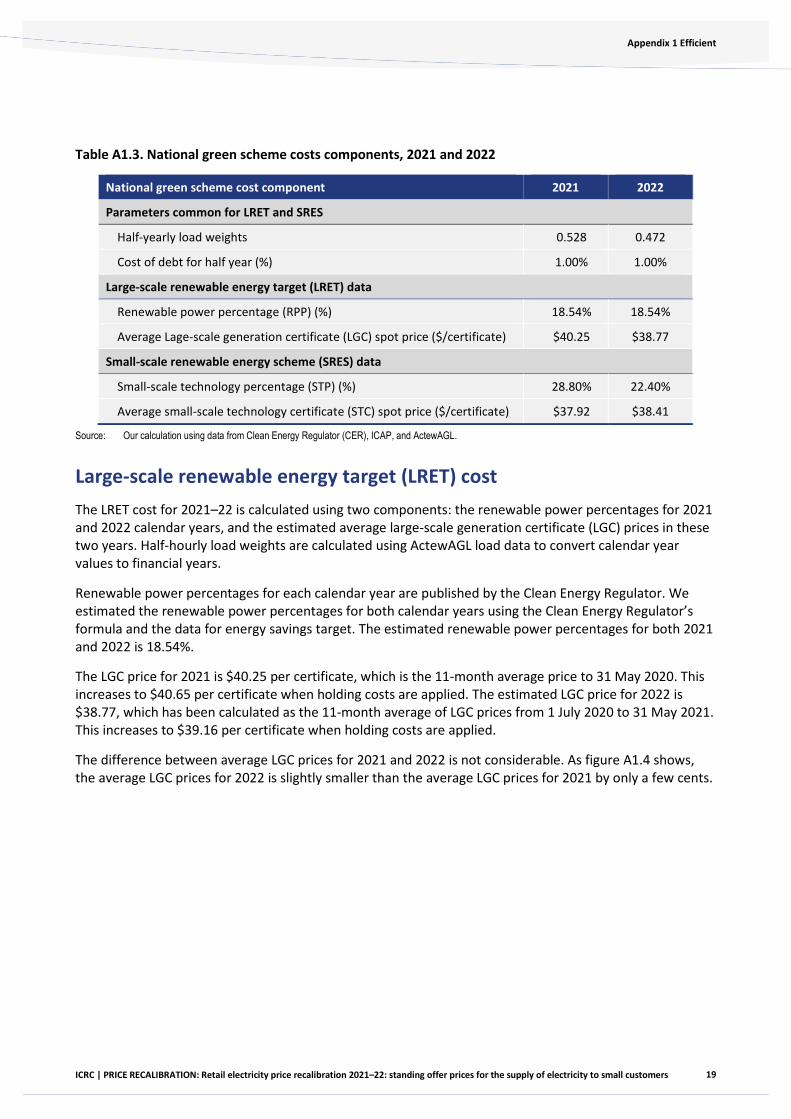
Table A1.3. National green scheme costs components, 2021 and 2022
National green scheme cost component 2021 2022
Parameters common for LRET and SRES
Half-yearly load weights 0.528 0.472
Cost of debt for half year (%) 1.00% 1.00%
Large-scale renewable energy target (LRET) data
Renewable power percentage (RPP) (%) 18.54% 18.54%
Average Lage-scale generation certificate (LGC) spot price ($/certificate) $40.25 $38.77
Small-scale renewable energy scheme (SRES) data
Small-scale technology percentage (STP) (%) 28.80% 22.40%
Average small-scale technology certificate (STC) spot price ($/certificate) $37.92 $38.41
Source: Our calculation using data from Clean Energy Regulator (CER), ICAP, and ActewAGL.
Large-scale renewable energy target (LRET) cost The LRET cost for 2021–22 is calculated using two components: the renewable power percentages for 2021 and 2022 calendar years, and the estimated average large-scale generation certificate (LGC) prices in these two years. Half-hourly load weights are calculated using ActewAGL load data to convert calendar year values to financial years.
Renewable power percentages for each calendar year are published by the Clean Energy Regulator. We estimated the renewable power percentages for both calendar years using the Clean Energy Regulator’s formula and the data for energy savings target. The estimated renewable power percentages for both 2021 and 2022 is 18.54%.
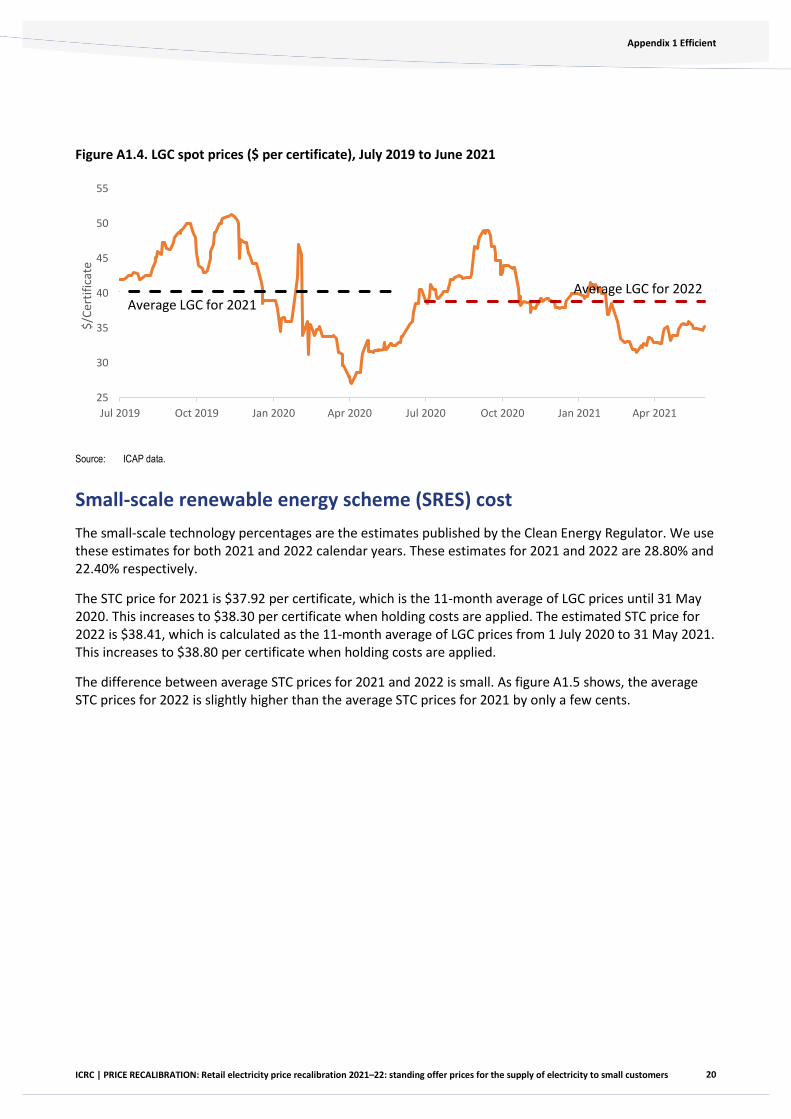
The LGC price for 2021 is $40.25 per certificate, which is the 11-month average price to 31 May 2020. This increases to $40.65 per certificate when holding costs are applied. The estimated LGC price for 2022 is $38.77, which has been calculated as the 11-month average of LGC prices from 1 July 2020 to 31 May 2021. This increases to $39.16 per certificate when holding costs are applied.
The difference between average LGC prices for 2021 and 2022 is not considerable. As figure A1.4 shows, the average LGC prices for 2022 is slightly smaller than the average LGC prices for 2021 by only a few cents.
20
Appendix 1 Efficient
ICRC | PRICE RECALIBRATION: Retail electricity price recalibration 2021–22: standing offer prices for the supply of electricity to small customers
Figure A1.4. LGC spot prices ($ per certificate), July 2019 to June 2021
Source: ICAP data.
Small-scale renewable energy scheme (SRES) cost The small-scale technology percentages are the estimates published by the Clean Energy Regulator. We use these estimates for both 2021 and 2022 calendar years. These estimates for 2021 and 2022 are 28.80% and 22.40% respectively.
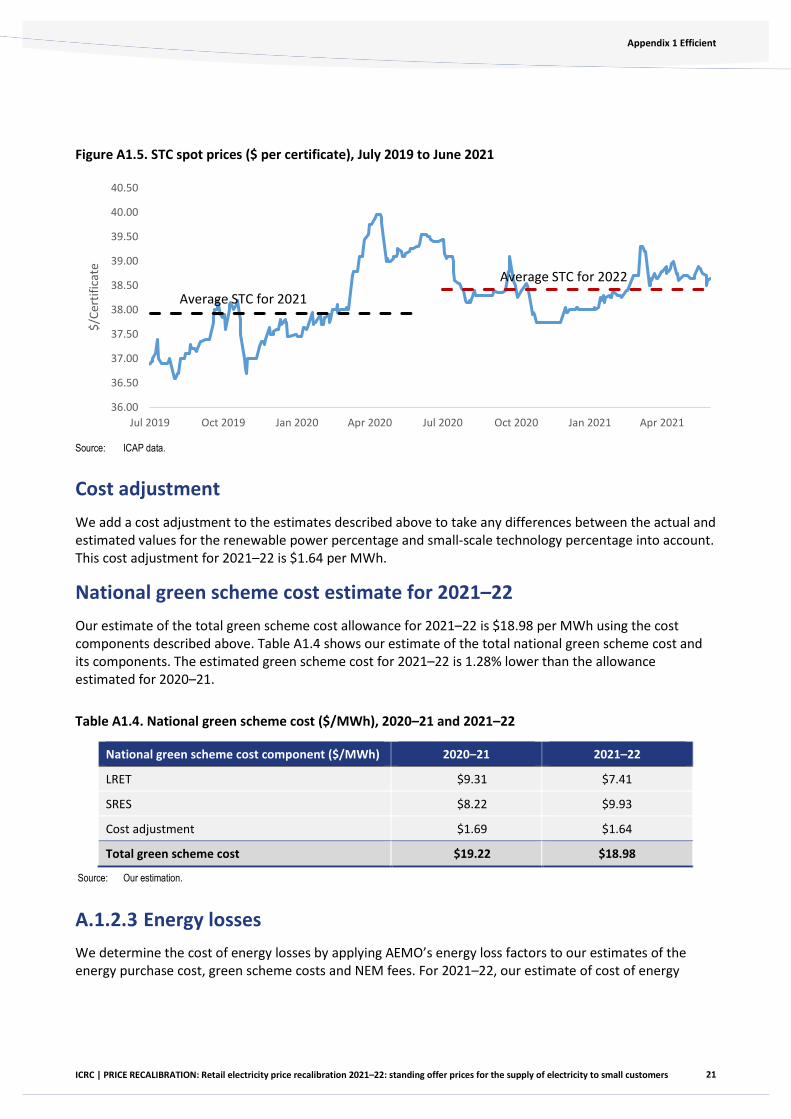
The STC price for 2021 is $37.92 per certificate, which is the 11-month average of LGC prices until 31 May 2020. This increases to $38.30 per certificate when holding costs are applied. The estimated STC price for 2022 is $38.41, which is calculated as the 11-month average of LGC prices from 1 July 2020 to 31 May 2021. This increases to $38.80 per certificate when holding costs are applied.
The difference between average STC prices for 2021 and 2022 is small. As figure A1.5 shows, the average STC prices for 2022 is slightly higher than the average STC prices for 2021 by only a few cents.
25
30
35
40
45
50
55
Jul 2019 Oct 2019 Jan 2020 Apr 2020 Jul 2020 Oct 2020 Jan 2021 Apr 2021
$/Ce
rtifi
cate
Average LGC for 2022Average LGC for 2021
21
Appendix 1 Efficient
ICRC | PRICE RECALIBRATION: Retail electricity price recalibration 2021–22: standing offer prices for the supply of electricity to small customers
Figure A1.5. STC spot prices ($ per certificate), July 2019 to June 2021
Source: ICAP data.
Cost adjustment We add a cost adjustment to the estimates described above to take any differences between the actual and estimated values for the renewable power percentage and small-scale technology percentage into account. This cost adjustment for 2021–22 is $1.64 per MWh.
National green scheme cost estimate for 2021–22 Our estimate of the total green scheme cost allowance for 2021–22 is $18.98 per MWh using the cost components described above. Table A1.4 shows our estimate of the total national green scheme cost and its components. The estimated green scheme cost for 2021–22 is 1.28% lower than the allowance estimated for 2020–21.
Table A1.4. National green scheme cost ($/MWh), 2020–21 and 2021–22
National green scheme cost component ($/MWh) 2020–21 2021–22
LRET $9.31 $7.41
SRES $8.22 $9.93
Cost adjustment $1.69 $1.64
Total green scheme cost $19.22 $18.98
Source: Our estimation.
A.1.2.3 Energy losses We determine the cost of energy losses by applying AEMO’s energy loss factors to our estimates of the energy purchase cost, green scheme costs and NEM fees. For 2021–22, our estimate of cost of energy
36.00
36.50
37.00
37.50
38.00
38.50
39.00
39.50
40.00
40.50
Jul 2019 Oct 2019 Jan 2020 Apr 2020 Jul 2020 Oct 2020 Jan 2021 Apr 2021
$/Ce
rtifi
cate
Average STC for 2021Average STC for 2022
22
Appendix 1 Efficient
ICRC | PRICE RECALIBRATION: Retail electricity price recalibration 2021–22: standing offer prices for the supply of electricity to small customers
losses is $1.60 per MWh, which is $1.53 per MWh lower than that in 2020–21. The main reason for the fall in energy losses is the lower energy purchase cost for 2021–22.
A.1.2.4 Volatility allowance In our 2020–24 price investigation, we set the volatility allowance at $0.30 per MWh for the regulatory period (ICRC 2020b). We have applied a volatility allowance of $0.30 per MWh for 2021–22.
A.1.2.5 National electricity market (NEM) fees Our final decision in 2020–24 price investigation was to determine NEM fees for the first year of the regulatory period (which is 2020–21) using cost estimates reported by AEMO (published in its final budget and fees 2019–20) and index this estimated cost by the consumer price index (CPI) for subsequent years.
Our estimated NEM fee cost for 2021–22 is $1.27 per MWh which resulted from indexing the estimated NEM fees cost for 2020–21 (which was $1.26 per MWh) by the CPI increase of 0.58%.
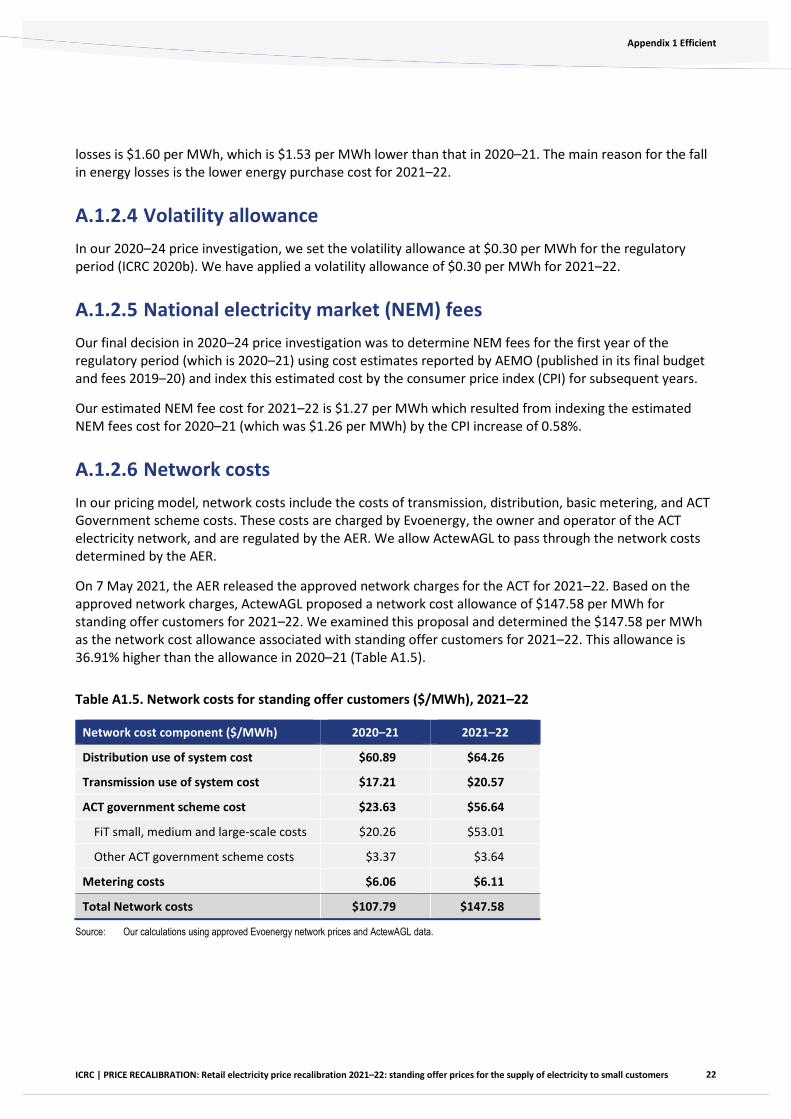
A.1.2.6 Network costs In our pricing model, network costs include the costs of transmission, distribution, basic metering, and ACT Government scheme costs. These costs are charged by Evoenergy, the owner and operator of the ACT electricity network, and are regulated by the AER. We allow ActewAGL to pass through the network costs determined by the AER.
On 7 May 2021, the AER released the approved network charges for the ACT for 2021–22. Based on the approved network charges, ActewAGL proposed a network cost allowance of $147.58 per MWh for standing offer customers for 2021–22. We examined this proposal and determined the $147.58 per MWh as the network cost allowance associated with standing offer customers for 2021–22. This allowance is 36.91% higher than the allowance in 2020–21 (Table A1.5).
Table A1.5. Network costs for standing offer customers ($/MWh), 2021–22
Network cost component ($/MWh) 2020–21 2021–22
Distribution use of system cost $60.89 $64.26
Transmission use of system cost $17.21 $20.57
ACT government scheme cost $23.63 $56.64
FiT small, medium and large-scale costs $20.26 $53.01
Other ACT government scheme costs $3.37 $3.64
Metering costs $6.06 $6.11
Total Network costs $107.79 $147.58
Source: Our calculations using approved Evoenergy network prices and ActewAGL data.
23
Appendix 1 Efficient
ICRC | PRICE RECALIBRATION: Retail electricity price recalibration 2021–22: standing offer prices for the supply of electricity to small customers
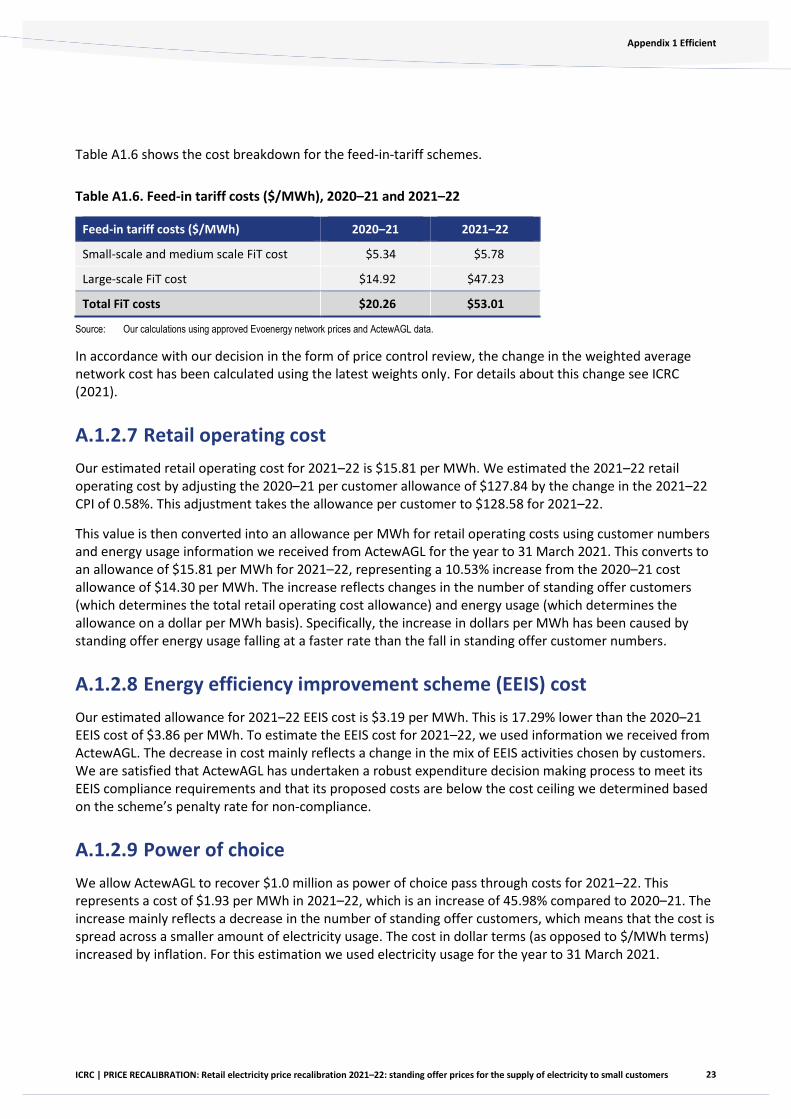
Table A1.6 shows the cost breakdown for the feed-in-tariff schemes.
Table A1.6. Feed-in tariff costs ($/MWh), 2020–21 and 2021–22
Feed-in tariff costs ($/MWh) 2020–21 2021–22
Small-scale and medium scale FiT cost $5.34 $5.78
Large-scale FiT cost $14.92 $47.23
Total FiT costs $20.26 $53.01
Source: Our calculations using approved Evoenergy network prices and ActewAGL data.
In accordance with our decision in the form of price control review, the change in the weighted average network cost has been calculated using the latest weights only. For details about this change see ICRC (2021).
A.1.2.7 Retail operating cost Our estimated retail operating cost for 2021–22 is $15.81 per MWh. We estimated the 2021–22 retail operating cost by adjusting the 2020–21 per customer allowance of $127.84 by the change in the 2021–22 CPI of 0.58%. This adjustment takes the allowance per customer to $128.58 for 2021–22.
This value is then converted into an allowance per MWh for retail operating costs using customer numbers and energy usage information we received from ActewAGL for the year to 31 March 2021. This converts to an allowance of $15.81 per MWh for 2021–22, representing a 10.53% increase from the 2020–21 cost allowance of $14.30 per MWh. The increase reflects changes in the number of standing offer customers (which determines the total retail operating cost allowance) and energy usage (which determines the allowance on a dollar per MWh basis). Specifically, the increase in dollars per MWh has been caused by standing offer energy usage falling at a faster rate than the fall in standing offer customer numbers.
A.1.2.8 Energy efficiency improvement scheme (EEIS) cost Our estimated allowance for 2021–22 EEIS cost is $3.19 per MWh. This is 17.29% lower than the 2020–21 EEIS cost of $3.86 per MWh. To estimate the EEIS cost for 2021–22, we used information we received from ActewAGL. The decrease in cost mainly reflects a change in the mix of EEIS activities chosen by customers. We are satisfied that ActewAGL has undertaken a robust expenditure decision making process to meet its EEIS compliance requirements and that its proposed costs are below the cost ceiling we determined based on the scheme’s penalty rate for non-compliance.
A.1.2.9 Power of choice We allow ActewAGL to recover $1.0 million as power of choice pass through costs for 2021–22. This represents a cost of $1.93 per MWh in 2021–22, which is an increase of 45.98% compared to 2020–21. The increase mainly reflects a decrease in the number of standing offer customers, which means that the cost is spread across a smaller amount of electricity usage. The cost in dollar terms (as opposed to $/MWh terms) increased by inflation. For this estimation we used electricity usage for the year to 31 March 2021.
24
Appendix 1 Efficient
ICRC | PRICE RECALIBRATION: Retail electricity price recalibration 2021–22: standing offer prices for the supply of electricity to small customers
The power of choice pass-through adjustment accounts for the costs that ActewAGL incurs to comply with power of choice regulatory changes. These changes, which the AEMC required to be implemented from 1 December 2017, required retailers to make changes to their existing systems and procedures to facilitate the provision of smart metering services.
A.1.2.10 Smart meter costs The smart meter cost for 2021–22 is $2.09 per MWh. This is based on ActewAGL’s smart meter costs for the 12 months to 31 March 2021.
A.1.2.11 Retail margin In our 2020–24 price investigation, we decided to apply a retail margin of 5.6% throughout the regulatory period. We calculated the $/MWh retail margin by multiplying this rate by the total $/MWh electricity cost in our cost stack. This generated a retail margin of $14.93 per MWh for 2021-22.
25
ICRC | PRICE RECALIBRATION: Retail electricity price recalibration 2021–22: standing offer prices for the supply of electricity to small customers
References
ACIL Allen (2021) Default market offer 2021–22: Report to Australian Energy Regulator, AER, Australian Government. Available at: https://www.aer.gov.au/system/files/ACIL%20Allen%20-%20DMO%202021-22%20Final%20Determination%20-%20Wholesale%20and%20environmental%20costs%20-%2019%20April%202021.pdf
AER (Australian Energy Regulator) (2020) Economic Benchmarking Results for the Australian Energy Regulator’s 2020 DNSP Annual Benchmarking Report, AER, Australian Government. Available at https://www.aer.gov.au/system/files/Distribution%20-%20Economic%20Insights%27%20benchmarking%20results%20for%20the%20AER%20-%20October%202020.pdf
AER (Australian Energy Regulator) (2021a) Network pricing proposal 2021/22, AER, Australian Government. Available at: https://www.aer.gov.au/system/files/Evoenergy_2021-22%20Electricity%20Network%20Pricing%20Proposal_13%20May%2021%20Public.pdf
AER (Australian Energy Regulator) (2021b) Default market offer prices 2021–22: final determination, AER, Australian Government. Available at: https://www.aer.gov.au/system/files/AER%20-%20Default%20Market%20Offer%20-%20Price%20determination%202021-22%20Final%20Determination%20-%2027%20April%202021.pdf
ESC (Essential Services Commission) (2020), Victorian default offer 2021: Final decision, ESC, Victorian Government, Available at: https://www.esc.vic.gov.au/sites/default/files/documents/FD%20-%20%202021%20VDO%20-%20Final%20decision%20-%2020201125.pdf
ICRC (Independent Competition and Regulatory Commission) (2018), Retail electricity price recalibration 2019–20: Final decision, ICRC, the ACT Government, available at: https://www.icrc.act.gov.au/__data/assets/pdf_file/0003/1372773/Report-6-of-2019-Electricity-Price-Reset-2019-20.pdf
ICRC (Independent Competition and Regulatory Commission) (2020a), Standing offer prices for the supply of electricity to small customers 1 July 2020 to 30 June 2024: Price direction, ICRC, the ACT Government, available at: https://www.icrc.act.gov.au/__data/assets/pdf_file/0011/1556183/Electricity-Price-Direction-2020-24.pdf
ICRC (Independent Competition and Regulatory Commission) (2020b), Retail electricity price investigation 2020–24: Final report, ICRC, the ACT Government, available at: https://www.icrc.act.gov.au/__data/assets/pdf_file/0010/1556182/Electricity-Final-Report.pdf
ICRC (Independent Competition and Regulatory Commission) (2021), Review of the retail electricity form of price control: Final report, available at https://www.icrc.act.gov.au/__data/assets/pdf_file/0011/1750277/Form-of-price-control-final-report.pdf
OTTER (Office of the Tasmanian Economic Regulator) (2021), Comparison of electricity and gas prices available to small customers in Australia, OTTER, the Tasmanian Government, available at:

26
0 References
ICRC | PRICE RECALIBRATION: Retail electricity price recalibration 2021–22: standing offer prices for the supply of electricity to small customers
https://www.economicregulator.tas.gov.au/Documents/Comparison%20of%20Electricity%20and%20Gas%20Prices%20Available%20to%20Small%20Customers%20in%20Australia%20-%20March%202021.pdf

www.icrc.act.gov.au