Embed Size (px)
Citation preview

Prepared for:
RETAIL-COMMERCIAL DISTRICT SMALL BUSINESS STUDY
EXECUTIVE SUMMARY
February 2021


Vancouver Retail-Commercial District Small Business Study | EXECUTIVE SUMMARY | 1
LIVEABLE CITY
PLANNING LTD. Andrew Yan
Consulting
Vancouver’s Retail-Commercial Small Business Study – Introduction
This executive summary is structured as follows:
1. Overview of Key Study Questions and Case Study Area Selection
2. Study Approach / Methods
3. Key Results – Six Case Study Local Shopping Areas
4. Implications and Recommendations
Vancouver’s Local Shopping Areas (LSAs) play an important role in the livability and sustainability of the
City’s neighbourhoods: they offer local goods and services within walking distance of residents; they shape
neighbourhood character and culture; and they offer direct employment and economic multiplier effects
that support other businesses in the City and region. In recent years there has been growing concern that
the City’s LSAs have been in decline as independent businesses confront an unprecedented array of
challenges including but not limited to increasing commercial property taxes and rents, higher labour costs,
and online competition. A multi-disciplinary consulting team comprised of Urban Systems Ltd., Commercial
Marketing Inc. (CMI), Liveable City Planning Ltd., Lee & Associates, and Andrew Yan Consulting (henceforth
the ‘consulting team’) was retained to study the health of six of the City’s LSAs and to identify key drivers
of change. This research, commenced in 2019, sets the stage for ongoing City programs to monitor and
support the future health and vitality of Vancouver’s LSAs.
Key Study Questions
1. Dimensions of Change: What changes have occurred in the case study areas in the last 10+ years, in
terms of tenant mix and vacancies, chain vs. independent businesses, property values and commercial
property taxes, property ownership, rents, and business viability?
2. Drivers of Change: From the direct perspective of local area business owners, property owners and
leasing agents, what do they see as the key challenges and drivers of change in their own areas?
3. Health and Vitality: What are some indicators of local shopping area health (or failing health), and how
do the six case study areas measure up?
4. City Response: How might the City monitor LSA health and vitality going forward, and how might it
support independent businesses and business area vitality?

Vancouver Retail-Commercial District Small Business Study | EXECUTIVE SUMMARY | 2
LIVEABLE CITY
PLANNING LTD. Andrew Yan
Consulting
Six Case Study Areas
Given the diversity of LSAs within Vancouver, six representative case study areas were selected using an
iterative process with City staff and approved by the Vancouver Business Improvement Area (BIA)
Partnership.1 The intent was to get a representative mix of LSAs so that the results would be generalizable
across the City. In selecting the Study areas, the general guiding principles were: (a) achieve north-south
representation; (b) achieve east-west representation; (c) select at least four areas that appear (anecdotally)
to be evidencing change or instability; (d) select at least two study areas in recent ‘Community Plan’ areas;
and (e) select at least 2 study areas that are in areas commonly perceived (anecdotally) as ‘stable’ or
‘healthy.’ Table 1 below provides a breakdown of key metrics for the six selected study areas, including
total commercial floor area, number of blocks, street frontage and storefronts, as well as the year of the
baseline commercial inventory available.2 Data collection and analysis proceeded through 2019,
completing in early 2020 (pre-dating the COVID-19 public health emergency).
Table 1: Case Study Areas
Area Floor Area at grade (square feet) - 2019
# Blocks Ground Floor
Street Frontage - Metres
Store Counts at Grade -
2019
Year of Baseline Inventory
Marpole 246,827 8 600 141 2011
Collingwood 411,300 15 1,450 203 2005
Hastings North* 484,414 10 1,550 257 2002
W. Broadway 488,528 10 1,420 255 2010
S. Granville 540,392 11 1,100 199 2006
Commercial Dr. 802,341 20 2,000 352 2005
TOTALS 2,973,802 74 8,120 1,407
*Between Victoria Drive and Renfrew Street only
1 The Vancouver BIA Partnership is a coalition representing all of the City’s 22 BIAs. 2 Baseline inventories were prepared by CMI in each reference year.

Vancouver Retail-Commercial District Small Business Study | EXECUTIVE SUMMARY | 3
LIVEABLE CITY
PLANNING LTD. Andrew Yan
Consulting
Study Approach / Methods
Preparing and Analyzing LSA Business Inventories
To assess the change in businesses over time in the six case study areas, the study team initially reviewed
City business license data, but had to dismiss the reliability of this historical data source for a variety of
reasons, including lack of historical vacancy information, lack of floor area data, and inconsistent business
classifications over time. Fortunately, over the last two decades, CMI has prepared storefront inventories
that provide valuable primary information on business mix, floor areas and vacancy for ground floor
commercial spaces in Vancouver’s LSAs.
For the current study, CMI updated detailed inventories of ground-floor street-front businesses and
vacancies for each of the six LSAs in early 2019. In each case, inventories were reviewed by the executive
directors of the relevant BIAs to confirm data accuracy. These inventories allowed the study team to
identify the dimensions of change in each LSA by business category3.
Commercial Storefront Categories
All storefront records in the historical and 2019 LSA business inventories were coded according to the
detailed classification schema outlined in Appendix B.
• CMI has historically applied a customized set of categories to each business it has inventoried.
There were 87 in total. Examples of these categories include “grocery stores,”, “men’s apparel”,
and “home furnishings.”
• For this study, CMI categories were ‘mapped’ to relevant North American Industry Classification
System (NAICS) categories and codes.
• A high-level category (see Table 2 below) was then assigned to each business record.
• Each business record was also classified by its status as a chain or independent business, using the
criteria outlined below.
3 Comparison between study areas is complicated because the timing of CMI’s historical inventories varied.

Vancouver Retail-Commercial District Small Business Study | EXECUTIVE SUMMARY | 4
LIVEABLE CITY
PLANNING LTD. Andrew Yan
Consulting
Table 2: Commercial Storefront Categories
Category What is included?
Convenience Goods Grocery stores; specialty food stores (e.g. bakeries, fish markets; green grocers); convenience stores; liquor stores; personal service stores and pharmacies; florists
Service Commercial Personal services, professional services, health services, financial services, legal services.
Comparison Goods Art, books, clothes, luggage, accessories, electronics, appliances, furniture, gifts, hobbies, toys, jeweler, lawn/garden/hardware, office supplies, optical goods, pet store, shoe store, sporting goods, general merchandisers
Food and Beverage Full-service restaurants; limited service eating places; drinking places.
Automotive Goods and Services Parts and accessories stores; repair and maintenance; auto, boat dealers.
Entertainment / Fitness / Recreation
Theatres, gyms, fitness, yoga, billiards, bowling, martial arts.
Vacant Unoccupied storefronts, regardless of lease / permitting status.
Defining Independent and Chain Businesses
This study adopts the Statistics Canada definition of chain retail (with the inclusion of franchise businesses
in that category) to allow for both consistency with other Statistics Canada data sets, and for comparability
to other jurisdictions in Canada. Both 2019 and historical storefront inventories of the six case study areas
in this study are classified in this way.
• Chain: an organization operating four or more outlets in the same industry class under the same
legal ownership.
• Independent: an organization operating one to three outlets in the same industry class under the
same legal ownership.
Vancouver Retail-Commercial District Small Business Study | EXECUTIVE SUMMARY | 5
LIVEABLE CITY
PLANNING LTD. Andrew Yan
Consulting
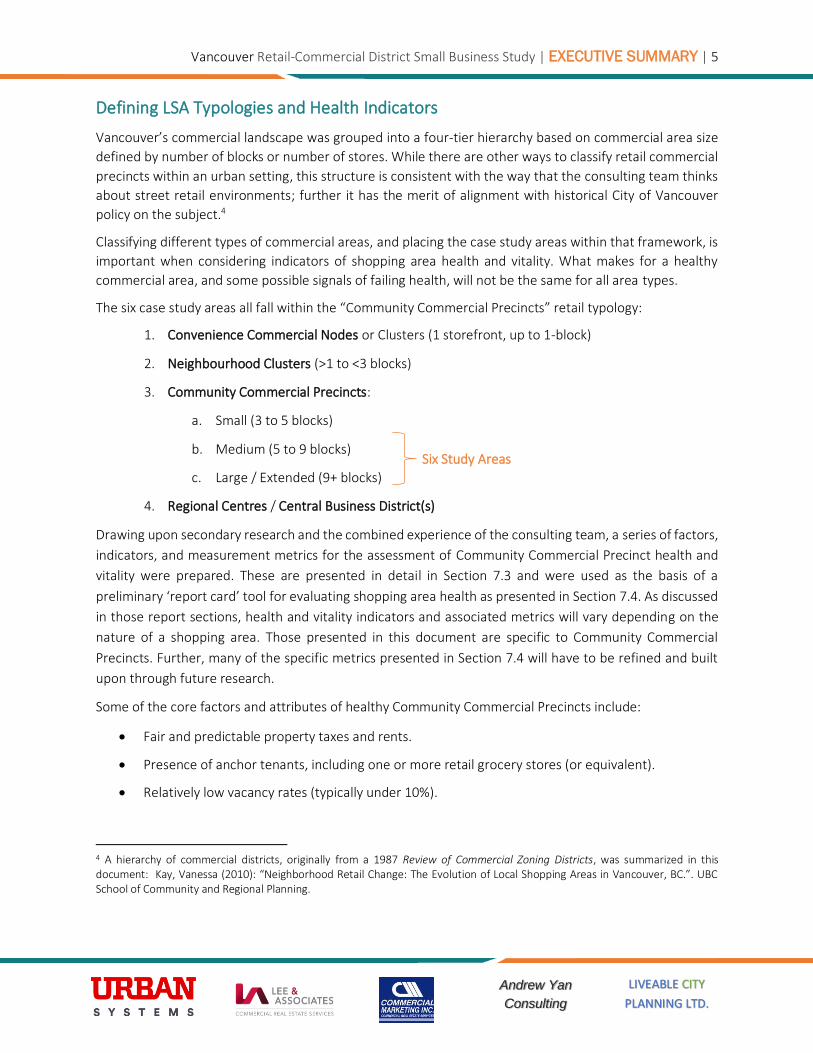
Defining LSA Typologies and Health Indicators
Vancouver’s commercial landscape was grouped into a four-tier hierarchy based on commercial area size
defined by number of blocks or number of stores. While there are other ways to classify retail commercial
precincts within an urban setting, this structure is consistent with the way that the consulting team thinks
about street retail environments; further it has the merit of alignment with historical City of Vancouver
policy on the subject.4
Classifying different types of commercial areas, and placing the case study areas within that framework, is
important when considering indicators of shopping area health and vitality. What makes for a healthy
commercial area, and some possible signals of failing health, will not be the same for all area types.
The six case study areas all fall within the “Community Commercial Precincts” retail typology:
1. Convenience Commercial Nodes or Clusters (1 storefront, up to 1-block)
2. Neighbourhood Clusters (>1 to <3 blocks)
3. Community Commercial Precincts:
a. Small (3 to 5 blocks)
b. Medium (5 to 9 blocks)
c. Large / Extended (9+ blocks)
4. Regional Centres / Central Business District(s)
Drawing upon secondary research and the combined experience of the consulting team, a series of factors,
indicators, and measurement metrics for the assessment of Community Commercial Precinct health and
vitality were prepared. These are presented in detail in Section 7.3 and were used as the basis of a
preliminary ‘report card’ tool for evaluating shopping area health as presented in Section 7.4. As discussed
in those report sections, health and vitality indicators and associated metrics will vary depending on the
nature of a shopping area. Those presented in this document are specific to Community Commercial
Precincts. Further, many of the specific metrics presented in Section 7.4 will have to be refined and built
upon through future research.
Some of the core factors and attributes of healthy Community Commercial Precincts include:
• Fair and predictable property taxes and rents.
• Presence of anchor tenants, including one or more retail grocery stores (or equivalent).
• Relatively low vacancy rates (typically under 10%).
4 A hierarchy of commercial districts, originally from a 1987 Review of Commercial Zoning Districts, was summarized in this document: Kay, Vanessa (2010): “Neighborhood Retail Change: The Evolution of Local Shopping Areas in Vancouver, BC.”. UBC School of Community and Regional Planning.
Six Study Areas

Vancouver Retail-Commercial District Small Business Study | EXECUTIVE SUMMARY | 6
LIVEABLE CITY
PLANNING LTD. Andrew Yan
Consulting
• A complementary tenant mix that is appropriate for a given local shopping area’s community role.
• Strong leadership and proactivity from the BIAs, including regular interface between leadership
and key anchor tenants and landlords.
• A clean, safe, and friendly public realm.
• Accessibility by all modes, with appropriate parking supply geared to the customer base.
• A sufficiently sized local trade area with a residential population and density to support local
businesses.
• A supportive regulatory environment including timely permitting and licensing, sufficiently
flexible zoning, and streamlined points of contact between businesses and City administration.
Preliminary health / vitality snapshots for each of the six case study areas are presented in Section 7.5, with
further detail on key issues and priorities for each study area presented in Appendix C.
Conducting LSA Business Roundtables and Surveys – Primary Research
Assisted by the BIA leadership for each study area, the study authors also engaged directly with landlords,
business owners, leasing agents, and other stakeholders and conducted roundtables and surveys to
understand their lived experiences and their perceived challenges and drivers of change. Surveys were
distributed, electronically and / or via hard copy, to business owners / operators, and to landlords, in each
of the 6 case study areas. Survey response rates varied considerably between areas, but are useful in
aggregate for identifying general trends, indicators, and drivers of change.
This primary information was supplemented by secondary research documenting current and emerging
trends that are shaping the nature of shopping streets across Canada and beyond, along with other key
data points in the case study areas such as lease rates, property values, taxation, property ownership, and
demographic and socio-economic change. Roundtable participants were asked to rank their “Top 10”
interests or concerns that most affect the viability of their businesses.
Key Results – Six Case Study Local Shopping Areas
Business Counts and Floor Areas – All Study Areas, 2019
The 2019 storefront inventory data recorded 1,407 ground floor business storefronts in the 6 case study
areas, representing nearly 3 million square feet of floor area (an average of about 2,100 sq. ft. per business).
Of these, 1,268 storefronts (approximately 2.7 million square feet of leasable space) were occupied by
active businesses. This represented 90% of the available storefronts and just over 90% of available floor
area). Independent businesses accounted for 78% of active storefronts and 62% of floor area); chain
businesses accounted for 22% of active storefronts, and 38% of floor area.

Vancouver Retail-Commercial District Small Business Study | EXECUTIVE SUMMARY | 7
LIVEABLE CITY
PLANNING LTD. Andrew Yan
Consulting
Snapshots of Distribution in 2019
• The distribution of businesses by category, and by chain status in 2019, varied considerably by
LSA:
Table 3: Distribution of Businesses by LSA, Category, and Chain Status, 2019
Collingwood
Commercial Drive
Hastings North
Marpole South
Granville West
Broadway
Chain 17.3% 15.9% 13.6% 19.9% 41.7% 18.5%
Automotive Goods & Services
0% 0% 0% 1% 0% 1%
Comparison Goods 0% 1% 1% 0% 22% 3%
Convenience Goods 7% 7% 7% 12% 13% 7%
Entertainment / Fitness / Recreation
0% 0% 0% 0% 0% 0%
Food & Beverage 8% 7% 4% 6% 6% 7%
Service Commercial 1% 1% 1% 0% 1% 0%
Independent 76.7% 79.5% 74.3% 68.8% 45.7% 66.1%
Automotive Goods & Services
0.5% 2.0% 1.5% 0.0% 0.0% 0.0%
Comparison Goods 8.4% 28.2% 16.3% 5.4% 23.3% 18.3%
Convenience Goods 41.1% 54.5% 42.6% 27.7% 10.4% 37.6%
Entertainment / Fitness / Recreation
2.0% 1.0% 1.0% 0.0% 0.0% 4.0%
Food & Beverage 18.8% 45.5% 22.8% 13.9% 10.4% 20.8%
Service Commercial 5.9% 7.4% 10.4% 1.0% 1.0% 2.5%
Vacant (including under construction)
5.9% 4.5% 12.1% 11.3% 12.6% 15.4%
Vacant (excluding under construction)
5.9% 4.5% 10.9% 11.3% 12.1% 10.6%
Figure 2: Average Store Size by Chain vs. Independent Status Figure 1: Active Storefronts, Vacancies and Under Construction, 2019

Vancouver Retail-Commercial District Small Business Study | EXECUTIVE SUMMARY | 8
LIVEABLE CITY
PLANNING LTD. Andrew Yan
Consulting
Overall Trends: More Chains, Less Independents, More Vacancy
• Across the 6 Study areas in total, between the respective base years and 2019 there was:
o An overall decline in the number of storefronts (active and vacant).
o A 7% decline in active businesses, and a decrease of active businesses as a proportion
of total storefronts, from 94% to 90%.
o A 13% decrease in the number of independent businesses, and a decrease of
independents as a proportion of total storefronts from 78% to 70%.
o A 24% increase in the number of chain businesses, and an increase of chains as a
proportion of total storefronts from 16% to 20%.
o A 58% increase in the number of vacancies, and an increase of vacancies as a
proportion of total storefronts from 6% to 10%.
Table 4: Change in Number and Proportion of Storefronts by Chain Status and Vacancy, Base Year vs. 2019
All Study Areas, # of Storefronts Absolute Change % Change
Base Year(s) 2019 Chains 230 285 55 24% Independents 1,127 983 -144 -13% Total Active Businesses 1,357 1,268 -89 -7% Vacant (excluding under construction) 88 123 35 40%
Total Active + Vacant 1,445 1,3915 -54 -4%
• To better understand the nature of change over time in business counts and vacancies, these
must be considered by retail category.
o Amidst a decrease in the number of active businesses, there was an increase (both
number and proportion) of Food & Beverage establishments across all study areas (+50
businesses, or 16% increase).
o There was relative stability in the Convenience Goods category cluster (-9 businesses,
or 2% decrease).
o There was a more substantial decrease in the Comparison Goods category cluster (-
112 businesses, or 30% decrease).
o There was a substantial increase in vacant storefronts (consistent with a decrease in
active businesses) (+35 vacancies, or 40% increase).
5 There were 16 units under construction in 2019, bringing the total to 1,407 storefronts.
Vancouver Retail-Commercial District Small Business Study | EXECUTIVE SUMMARY | 9
LIVEABLE CITY
PLANNING LTD. Andrew Yan
Consulting
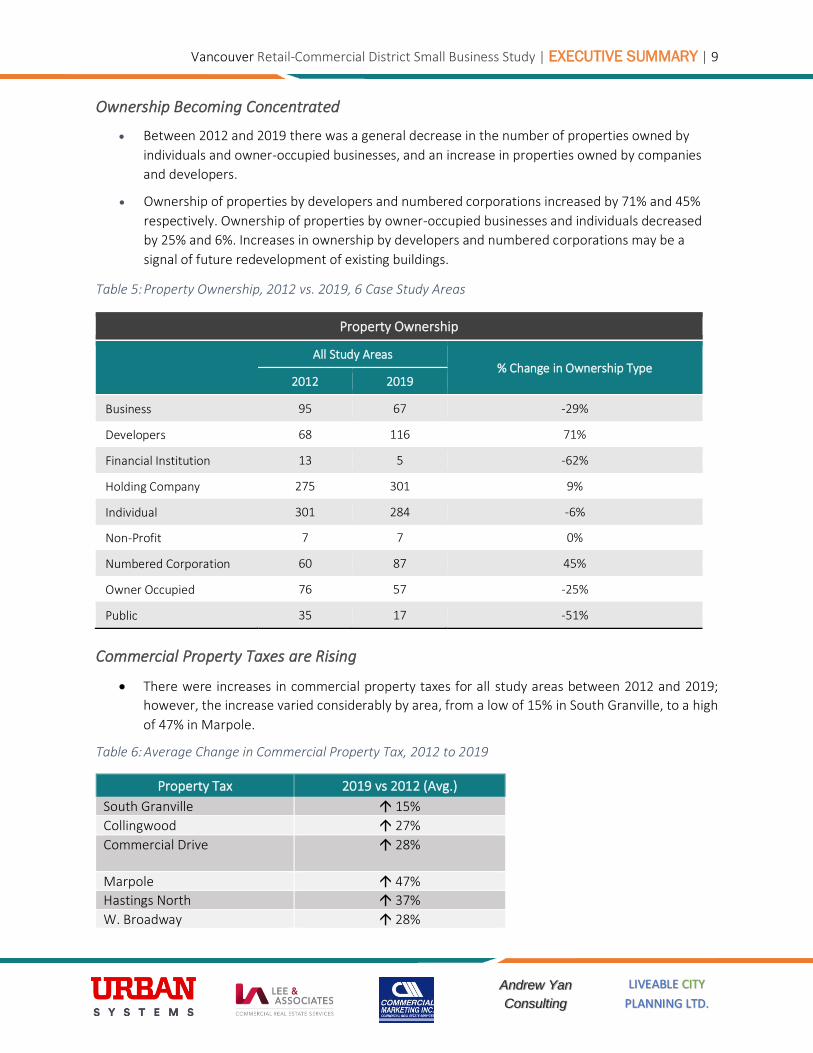
Ownership Becoming Concentrated
• Between 2012 and 2019 there was a general decrease in the number of properties owned by
individuals and owner-occupied businesses, and an increase in properties owned by companies
and developers.
• Ownership of properties by developers and numbered corporations increased by 71% and 45%
respectively. Ownership of properties by owner-occupied businesses and individuals decreased
by 25% and 6%. Increases in ownership by developers and numbered corporations may be a
signal of future redevelopment of existing buildings.
Table 5: Property Ownership, 2012 vs. 2019, 6 Case Study Areas
Property Ownership
All Study Areas
% Change in Ownership Type 2012 2019
Business 95 67 -29%
Developers 68 116 71%
Financial Institution 13 5 -62%
Holding Company 275 301 9%
Individual 301 284 -6%
Non-Profit 7 7 0%
Numbered Corporation 60 87 45%
Owner Occupied 76 57 -25%
Public 35 17 -51%
Commercial Property Taxes are Rising
• There were increases in commercial property taxes for all study areas between 2012 and 2019;
however, the increase varied considerably by area, from a low of 15% in South Granville, to a high
of 47% in Marpole.
Table 6: Average Change in Commercial Property Tax, 2012 to 2019
Property Tax 2019 vs 2012 (Avg.)
South Granville 15%
Collingwood 27%
Commercial Drive 28%
Marpole 47%
Hastings North 37%
W. Broadway 28%
Vancouver Retail-Commercial District Small Business Study | EXECUTIVE SUMMARY | 10
LIVEABLE CITY
PLANNING LTD. Andrew Yan
Consulting
Basic Commercial Rents
• Data on actual rents paid by commercial tenants (versus asking rents for vacant space) proved
difficult to collect, and only small samples were obtained through interviews and surveys.
o One notable item is that multiple survey respondents indicated that basic rents charged to
tenants have not moved much in recent years due to significant increases in additional rent
burdens (including property taxes). In some cases, property owners have reportedly
reduced basic rents to retain tenants. Again, this information is based on limited and small
sample sizes and anecdotal evidence.
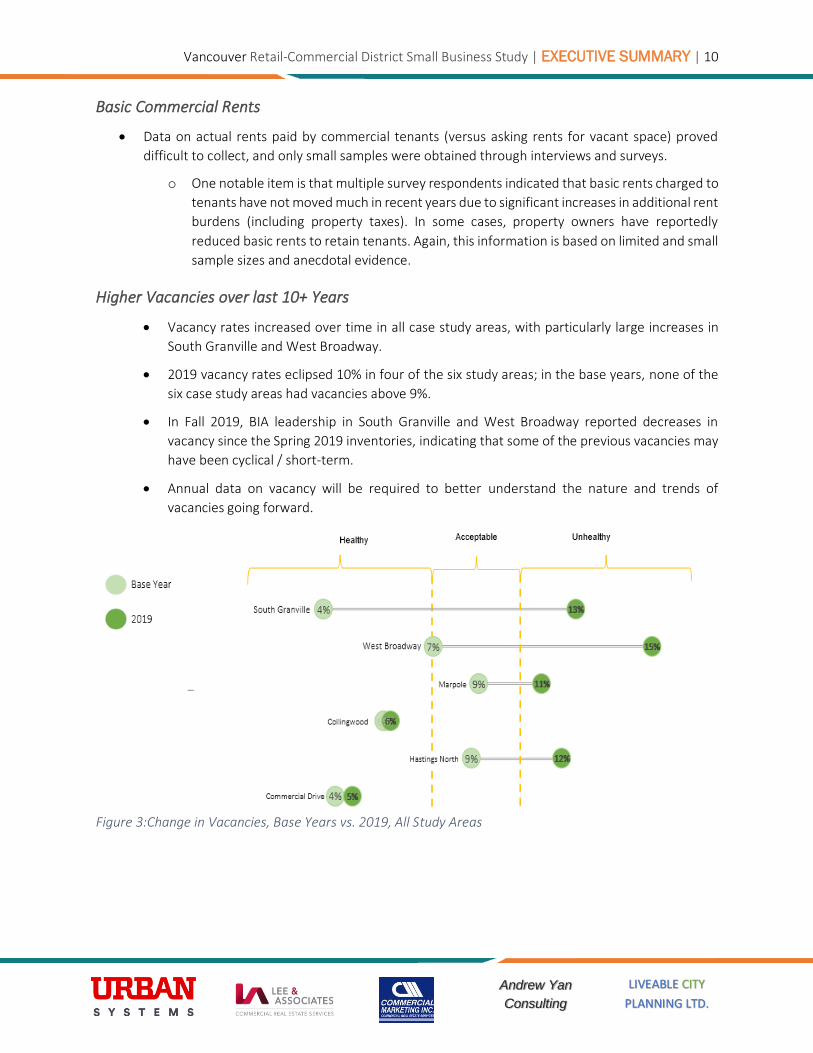
Higher Vacancies over last 10+ Years
• Vacancy rates increased over time in all case study areas, with particularly large increases in
South Granville and West Broadway.
• 2019 vacancy rates eclipsed 10% in four of the six study areas; in the base years, none of the
six case study areas had vacancies above 9%.
• In Fall 2019, BIA leadership in South Granville and West Broadway reported decreases in
vacancy since the Spring 2019 inventories, indicating that some of the previous vacancies may
have been cyclical / short-term.
• Annual data on vacancy will be required to better understand the nature and trends of
vacancies going forward.
Figure 3:Change in Vacancies, Base Years vs. 2019, All Study Areas

Vancouver Retail-Commercial District Small Business Study | EXECUTIVE SUMMARY | 11
LIVEABLE CITY
PLANNING LTD. Andrew Yan
Consulting
More Chains, Less Independents and More Vacancy, With Caveats
▪ Decrease of Independents in Most Areas: In all areas except the Marpole BIA,
independent businesses decreased as a proportion of total storefronts between the
baseline years and 2019.
▪ Increase of Chains in Most Areas: In 2 of the 6 case study areas (Marpole BIA and
Hastings North BIA), chain businesses decreased as a proportion of total storefronts
between the baseline years and 2019.
▪ Business Replaced by Vacancy: The four study areas that saw an increase in the
proportion of chain businesses (South Granville, Collingwood, Commercial and West
Broadway) also saw a decrease in the proportion of independent businesses. However,
in South Granville and West Broadway, there were also notable increases in the
proportion of vacant storefronts.
▪ Pattern Deviation in Some Areas:
• In Marpole, there was a decrease in the proportion of chains and an increase
in the proportion of independents. There was also a notable increase in
vacancy.
• In Hastings North, there was a slight decrease in both chains and
independents, and an increase in vacant storefronts.
Figure 4: Change in Proportion of Chains vs. Independent Businesses by Study Area, Base Year(s) vs. 2019
Vancouver Retail-Commercial District Small Business Study | EXECUTIVE SUMMARY | 12
LIVEABLE CITY
PLANNING LTD. Andrew Yan
Consulting
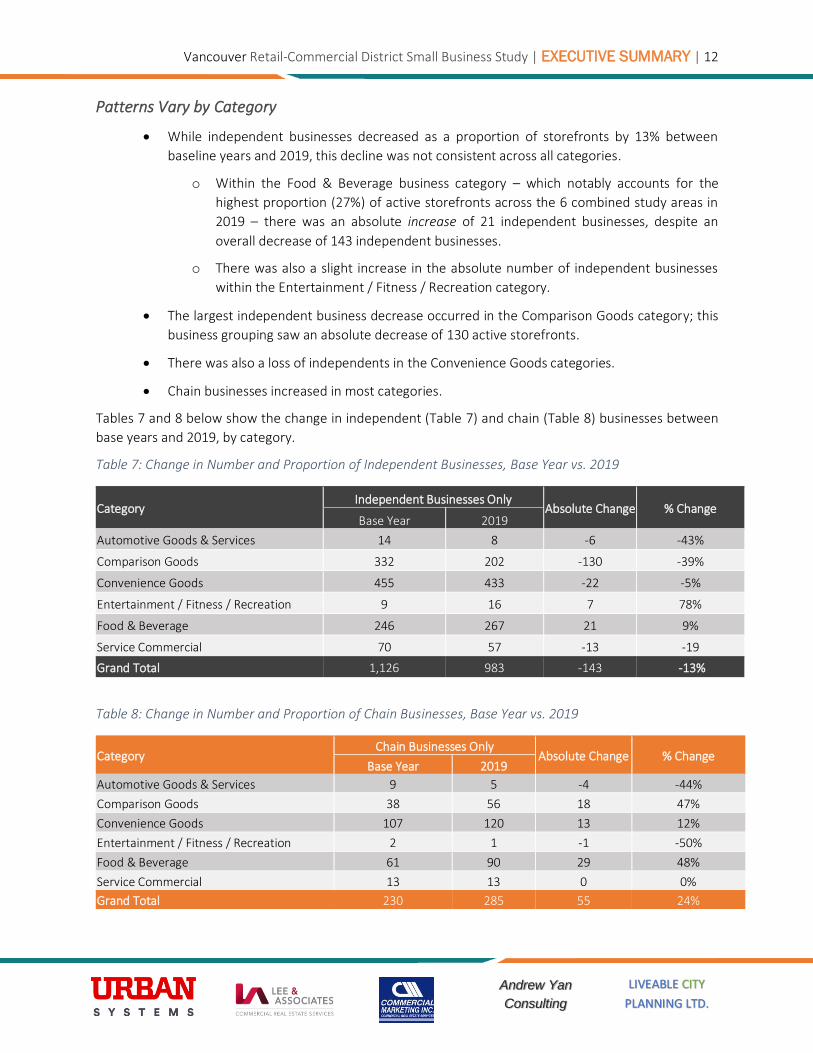
Patterns Vary by Category
• While independent businesses decreased as a proportion of storefronts by 13% between
baseline years and 2019, this decline was not consistent across all categories.
o Within the Food & Beverage business category – which notably accounts for the
highest proportion (27%) of active storefronts across the 6 combined study areas in
2019 – there was an absolute increase of 21 independent businesses, despite an
overall decrease of 143 independent businesses.
o There was also a slight increase in the absolute number of independent businesses
within the Entertainment / Fitness / Recreation category.
• The largest independent business decrease occurred in the Comparison Goods category; this
business grouping saw an absolute decrease of 130 active storefronts.
• There was also a loss of independents in the Convenience Goods categories.
• Chain businesses increased in most categories.
Tables 7 and 8 below show the change in independent (Table 7) and chain (Table 8) businesses between
base years and 2019, by category.
Table 7: Change in Number and Proportion of Independent Businesses, Base Year vs. 2019
Category Independent Businesses Only
Absolute Change % Change Base Year 2019
Automotive Goods & Services 14 8 -6 -43%
Comparison Goods 332 202 -130 -39%
Convenience Goods 455 433 -22 -5%
Entertainment / Fitness / Recreation 9 16 7 78%
Food & Beverage 246 267 21 9%
Service Commercial 70 57 -13 -19
Grand Total 1,126 983 -143 -13%
Table 8: Change in Number and Proportion of Chain Businesses, Base Year vs. 2019
Category Chain Businesses Only
Absolute Change % Change Base Year 2019
Automotive Goods & Services 9 5 -4 -44%
Comparison Goods 38 56 18 47%
Convenience Goods 107 120 13 12%
Entertainment / Fitness / Recreation 2 1 -1 -50%
Food & Beverage 61 90 29 48%
Service Commercial 13 13 0 0%
Grand Total 230 285 55 24%

Vancouver Retail-Commercial District Small Business Study | EXECUTIVE SUMMARY | 13
LIVEABLE CITY
PLANNING LTD. Andrew Yan
Consulting
• Commercial Rents (basic rents) within the study areas have not increased substantially: Anecdotal
evidence gathered from landlords and brokers on sample properties in each study area suggests that
some landlords are moderating rent increases, and in some cases are decreasing base rents, as
businesses struggle to manage the burdens of operating cost increases (e.g. property taxes, labour
costs). This may not be representative of the experience of many tenants, however, because the
sample size for this feedback was fairly limited.
• Business Revenue and Profits are Flat: While 53% of survey respondents (n = 92) indicated sales
increases in the last 2 years, only 38% indicated increased profits (n = 91). 29% of respondents to the
question of profitability indicated decreased profitability, and 25% indicated stable profitability.
Challenges and Drivers of Change: Survey Feedback
In the survey of business owners and operators, the ‘top 5’ challenges to business viability are shown in
Table 9:
Table 9: Business Owners / Operators Survey – Top 5 Challenges to Business Viability
Challenges to Business Viability (Factors)
% Indicating “significant” or “very significant”
Number of responses
City Permitting Process 87% 52
Rent / Lease Costs (including taxes)
75% 69
Overhead costs 75% 73
Labour Issues 68% 71
Financing 68% 71
In the survey of landlords and brokers, the ‘top 5’ challenges to local shopping area viability are shown in
Table 10:
Table 10: Landlords and Commercial Brokers Survey – Top 5 Challenges to Business Viability
Challenges to Business Viability (Factors)
% Indicating “significant” or “very significant”
Number of responses
Property Taxes 87% 15
City Permitting Process 85% 13
Parking / Transportation 82% 11
Overhead Costs 80% 15
Rent 75% 9
Detailed survey results are presented in Appendices F and G and are discussed in Section 6.0.

Vancouver Retail-Commercial District Small Business Study | EXECUTIVE SUMMARY | 14
LIVEABLE CITY
PLANNING LTD. Andrew Yan
Consulting
Challenges and Drivers of Change: Round Table Feedback
The direct and anecdotal feedback from local business operators and property owners is valuable in the
quest to identify key drivers of change. In face-to-face roundtable workshops, conducted in each of the six
case study areas, the most frequently cited “Top 3” challenges to business success and drivers of change
were as follows:
1. The quality of the public realm and real and perceived safety of the same;
2. Rising BC Assessment valuations and commercial property tax expenses; and
3. Adequate on-street parking.
The full list is presented in Table 11 below. Details on roundtable results by study area are found in Report
Section 6.0.
Table 11: Top 3 Business Challenges in Local Shopping Areas
% Challenge Description
23% Public Realm Quality & Safety
A surprising number of LSAs reported increasing concerns about the real and perceived safety of the public realm, maintenance and cleaning, and the impacts of mental health, addiction and homelessness. These issues were particularly notable in the Commercial Drive and Collingwood study areas.
21% Rising BC Assessment Values & Property Taxes
LSA businesses indicate that rising BC Assessment Values and Property Tax increases are stressing their financial viability.
17% Parking & Access
Competing interests and challenges allocating curb space – maintaining a balance between on-street parking, improving transit, sustainable mobility modes, loading/pickup areas, and moving traffic. Convenient parking frequently cited as a critical issue.
10% Labour
Costs. Attraction and retention of labour were identified as key issues. Shift in MSP premiums to employers. Rising cost of living challenges attraction and retention of local workforce and / or pushes up the cost of salaries.
8% Permitting & Licensing Time, Cost, Complexity. Licensing and permitting very complex, inconsistent, and difficult to understand. Long timelines needed for compliance. Lack of streamlined single point of contact with specialized knowledge at City.
8% Lease negotiations & Terms
Property ownership has become increasingly concentrated in numbered companies and developers. Due to rapid pace of change, standard demolition clauses in leases discourage long-term tenancies.
8% Population growth and Demographics
Need for more local customers. Some areas expressed concern about relatively low levels of surrounding population density, and slower-than-average growth, as factors compromising the near and longer-term prospects for local business. This issue was raised as a ‘top 3’ concern in West Broadway and Hastings North.
3% “Other”
General cost of doing business is increasing. Vacancies affect LSA attractiveness and energy.
2% Increasing Competition Online sales and competition from Regional Serving shopping are affecting sales for some businesses.

Vancouver Retail-Commercial District Small Business Study | EXECUTIVE SUMMARY | 15
LIVEABLE CITY
PLANNING LTD. Andrew Yan
Consulting
Key Observations
Following are key observations and take-aways based on analysis of available data and information received
through roundtables and surveys.
Drivers of Change Vary by Category
• Businesses in different categories each have their own unique locational and spatial requirements,
and different abilities to pay rent as well as capacities to change. Some categories like personal
services, grocery stores, restaurants and cafes, will likely be more resilient amidst broader trends
in the retail landscape such as an accelerating shift to e-commerce and changing tastes.
• Convenience-type retailers and restaurants that largely draw on neighbourhood traffic (e.g.
grocery stores, pharmacies, liquor stores, cafes and bars) may be more resilient, provided they are
adapting to trends such as takeout / delivery and curbside pickup.
• Comparison goods retailers, particularly those in sectors most exposed to e-commerce such as
electronics, housewares, furniture, and apparel face significant challenges and costs in adapting
their business models in the face of e-commerce and repositioning their bricks-and-mortar stores
to operate as part of omni-channel customer fulfillment ecosystems.
There is a future for Independent Businesses
• Independent businesses within the study areas may be in decline across nearly all categories
(except Food & Beverage), but there is a likely future for independents.
• As with any business, independents that are focused on providing an omni-channel experience and
options for their customers, building strong connections (across platforms) with their customers,
and which are in LSAs having BIAs / associations that are generally proactive in their approach to
merchandising strategy, will be more likely to succeed.
Common Issues from Roundtables, Differing Levels of Importance by Area
• Overall, differences and commonalities in terms of changes over time by area, and the main issues
reported by business owners and landlords (per roundtables and surveys), tell us that:
o There is a common ‘basket’ of issues, but rankings of importance differ by area.
o Property taxes, public realm cleanliness / public (dis)order, and concerns around parking
and access were ‘top 3’ issues identified in the roundtables.
o Business surveys identified city permitting, rent/lease costs, and overhead costs as ‘top 3’
issues, followed closely by labour issues (i.e., finding and retaining workers).
o Landlord and broker survey identified property taxes, city permitting and parking /
transportation as their ‘top 3’ issues (albeit with a much smaller survey sample size).
Vancouver Retail-Commercial District Small Business Study | EXECUTIVE SUMMARY | 16
LIVEABLE CITY
PLANNING LTD. Andrew Yan
Consulting
Implications and Recommendations
This study has developed a baseline of critical information to guide future decision making and research.
The analysis of change over time, surveys, roundtables, and other research conducted provides a basis for
action, and a strong foundation and updated baseline for further study. The research has highlighted the
breadth of issues that affect independent businesses in the City’s local shopping areas, major issues faced
by businesses of all stripes, and key requirements for their success going forward.
Some of the key preconditions for private sector adaptability in the face of macro changes and challenges
include:
• Having strong and growing local trade areas from which to draw customers.
• Supports from the City to help businesses adopt digital platforms for sales and distribution.
• Streamlined, transparent and nimble City regulations and processes for business start-ups, changes
of use, and adaptation of business models to respond to changing consumer demands.
• Predictable costs, most importantly basic and additional rents, but also staffing and merchandising.
• City investments in the public realm – cleanliness, design, placemaking and safety.
• Strong local level (e.g., BIA) leadership to help existing tenants navigate change, grow, and attract
customers as well as to proactively attract new tenants.
Greater business outreach and tracking is needed. Due to scope constraints, outreach was limited to the
BIA network and participants who could participate in the scheduled workshops. Non-English-language
surveys and workshop translation, and deeper community outreach was not available. Further outreach
and demographic segmentation to ensure indigeneity and diversity, equity, and inclusion is highly
recommended for future studies and plans. Analysis of local shopping areas’ customer base, including
geographic extent and breakdown of trade areas, is also required. Through such ongoing interface and
information exchange, businesses could be better positioned to improve their customer targeting and
adapt to a rapidly changing landscape.
The City may consider supporting independent businesses in the local shopping areas in a variety of ways.
There are many issues on which this study only briefly touches, which can and should be subjected to
further analysis. The research undertaken for this report points to the following potential action items for
consideration:
Continue Work on Fair Commercial Property Taxation
• Continue to work with provincial partners to pass legislation allowing for a split of ‘development
potential’ from ‘existing use’ in the property assessments, and to capture ‘development potential’
in a new commercial sub- class (vs. the current method of capturing all under Class 6 – Business).
• If / when a new commercial sub-class option is available, work with stakeholders to ensure the new
commercial sub-class is fair and effective in terms of (a) eligibility requirements, (b) duration of tax
relief, and (c) tax rate.

Vancouver Retail-Commercial District Small Business Study | EXECUTIVE SUMMARY | 17
LIVEABLE CITY
PLANNING LTD. Andrew Yan
Consulting
Build and Maintain a Local Shopping Area Database
• Aside from the historical and 2019 data sets for the 6 study areas presented in this document, there
has been no reliable and consistent source of comprehensive data (municipal or otherwise), that
accurately tracks the number of ground floor storefronts, vacancies, vacant frontage, or floor area
by business category in the City’s LSAs.
• The City should build upon and expand the collection of LSA tenancy and vacancy data beyond the
six study areas and update it on a regular basis to ensure that data can be compared over time with
comparable baselines for change. This work is already well underway, as a collaborative
undertaking by City staff and the consulting team. While there may be a role for individual BIAs in
this work going forward, it will need to be City-led given the variable capacity across BIAs.
• Develop clear, consistent, and documented data collection protocols including what data to collect,
how to collect, and how often to update. Consistency in method and documentation will be critical
to ensure comparability over time. Ensuring that this is done regularly (ideally once per year) will
require dedicated City resources for data collection, cleaning, analysis, and reporting. A clear ‘next
step’ involves determining what level of resources are required to do this work consistently.
• Key data points to collect and monitor should include:
o Civic address (where applicable).
o Business category with compatibility to the North American Industry Classification System
(NAICS).
o Vacancy (for lease / sale, under construction, vacant lot).
o Chain vs. independent.
o Floor Area.
• These datasets should be integrated with the City’s existing GIS parcel data and should be spatially
compatible with other analytical geographies from Statistics Canada, such as Census tracts and
dissemination areas.
• While this study has focused on ground floor storefronts, further data and analytical methodologies
will need to be developed to engage mixed use and multi-storied commercial and retail districts in
higher density neighbourhoods.
Monitor Local Shopping Area Health and Vitality
• Monitor local shopping area health and vitality using a report card tool, cognizant of the core
‘ingredients’ of local shopping area health and adaptability as outlined above and detailed in
Section 7. Section 7 of this report also provides a possible template for a report card tailored to
medium and large Community Commercial Precincts, based on principles and indicators that are
also outlined in that section – and which are summarized above.
o A single report card tool will not be effective for all types of shopping areas; a healthy
community commercial precinct has different ingredients than a neighbourhood node, or
a regional destination for instance.

Vancouver Retail-Commercial District Small Business Study | EXECUTIVE SUMMARY | 18
LIVEABLE CITY
PLANNING LTD. Andrew Yan
Consulting
• Tracking LSA health and identifying early indicators of ‘pain points’ for businesses, will require
frequent data collection on tenant mix, vacancy, asking rents, and property turnover, as well as
frequent engagement with BIAs and core tenants / landlords.6
o Frequent communication between BIA leadership and core anchor tenants – retail and
non-retail – is critical for monitoring health and vitality.
o Finding ways to engage with all the dominant business categories is also important, as each
category will face its own unique challenges.
o BIA leadership, with City support as needed, should conduct simple but consistent and
documented interviews with businesses that are closing, or relocating out of their local
shopping areas (i.e., “exit interviews”), to identify issues that may be threatening the
viability of other businesses and to document / communicate key issues.
▪ Reporting from exit interviews – conducted by the individual BIAs – should be
compiled, submitted to, and reviewed by City staff; summary reports of key
findings should be prepared and brought before both City and BIA leadership on a
regular basis (e.g., quarterly, semi-annually, annually or another reporting
frequency that makes sense for BIAs and staff).
o The nature of communication between BIA leadership and core anchor tenants, landlords
and others will likely vary area to area, depending both on BIA resources and the nature of
relationships. As such, outreach approach will need to remain flexible.
Be Flexible, Adaptable and Accommodating
The City should consider the following in support of LSA health and vitality:
• Consider building code updates that would assist both short-term conversion of existing retail stock
for temporary retail uses, and more permanent changes of use.
• Provide a simplified permitting route for small businesses, that might include a small business
ombudsperson or point of contact within City permitting, licensing and development functions that
could help small businesses from first contact to business opening.
• Ensure that zoning is responsive to rapid changes in the retail landscape. This may include broader
allowance in local shopping areas for combination businesses and functions (e.g., production,
consumption, retail sales), business co-locations, and other non-traditional uses, with
consideration to their urban design and transportation implications. The principal use may not
always be retail. This flexibility will be critical for meeting changing business and consumer needs.
• Review transportation and mobility regulations and policies. Pricing and policies related to vehicle
parking, and access for bicycles and other modes, can greatly shape the accessibility of an LSA to
6 Note that, while actual rents are the preferred data point, this data is difficult to come by. Asking rents offer a useful point of comparison between LSAs, and between different sub-areas within an LSA.

Vancouver Retail-Commercial District Small Business Study | EXECUTIVE SUMMARY | 19
LIVEABLE CITY
PLANNING LTD. Andrew Yan
Consulting
different customers. This includes policies and infrastructure for goods pickup and stopping for
motor vehicles and bicycles to reflect the changing roles and importance of urban logistics.
• New commercial units must be designed for ease of adaptability and convertibility and must be
responsive to the inevitability of business turnover and changing business needs. City staff should
review the City of Toronto’s recently released “Retail Design Manual” to determine if this type of
guide is appropriate for Vancouver.
Focus on Public Safety and Placemaking
• Continue work to address homelessness and street drug use crises, which have profound impacts
on storefront retail and services.
• Increase direct municipal investment in maintenance and cleanliness of roads, alleyways, medians,
and sidewalks. Invest in, and have policies supportive of, appropriate lighting and weather
protection to create more compelling and comfortable streets and outdoor business
environments.
• Explore opportunities for an integrated local shopping area service point person who can
coordinate effective responses around issues of public realm cleanliness, maintenance, and social
services.
• Local tactical placemaking must be used to effectively support business, community, and the
experiential economy.
Consider Direct Small Business Supports
• As noted above, consider a ‘small business ombudsperson’ or some other one-stop point of contact
to assist small business navigate City process from start to finish.
• Explore options for facilitating business’ access to professionals and experts. This may be done
through coordination with individual BIAs, or other business associations. Examples include:
o Expert workshops organized by BIAs or the City’s BIA Program.
o Making key information on ‘experts to call’ easily available as part of a one-stop business
point of contact (i.e., business ombudsperson or department dedicated to the needs of
small business).
o Connecting small businesses with lenders / loan programs.
o Assisting new or prospective businesses with business plan development, space use
requirements, site selection, lease negotiations, and other needs as required.
o Assist existing businesses with lease renewals, leasehold improvements at renewal,
reviews of comparable market rents, and relevant information regarding space design
upgrades as needed.
Note: Information sharing should be encouraged and facilitated amongst BIAs and other
business entities, to help bridge the gaps between areas of vastly different resource levels.

Vancouver Retail-Commercial District Small Business Study | EXECUTIVE SUMMARY | 20
LIVEABLE CITY
PLANNING LTD. Andrew Yan
Consulting
• Consider more direct financial support for small businesses, such as:
o Renovation / façade / tenant improvement grants related to specific regulatory
requirements.
o Funds to BIAs to test innovative ideas or conduct area-specific research in service of tenant
retention or attraction strategies.
• Consider specifically reserving spaces within larger developments for small business and / or
business incubation.
• Encourage and support programs that provide low-cost space for short-term tenancies geared
towards start-up incubation. These can become long-term tenants which can then transition into
full-time storefronts.
Improve Cooperation, Collaboration and BIA Strategy Development
• Encourage the stakeholders of each local shopping area to develop a coherent, shared vision for
the area, with short-, medium- and longer-term strategies, focusing first on tenant retention, and
second on tenant recruitment. This should be embedded within an overall actionable
merchandising strategy that has “buy in” from all parties. For such a strategy to be effective, it will
require:
o A flexible, adaptable, and accommodating City policy and process framework.
o City support (professional, financial) for area-specific research to understand limitations
and opportunities for each area as it relates to maintaining long-term area health and
vitality.
o City-led data collection and dissemination on key information critical to tenant attraction
(e.g., tenant mix, vacancies, asking rental rates, foot traffic, demographics, trade area
growth, etc.).
o This must include working closely with the BIAs to make effective use of this data.
o City-led ‘check-ins’ on local shopping area health and vitality, coordinated with BIAs as /
where appropriate. Variable resource levels across BIAs, and some areas without BIAs, will
require that most of this work be centralized, or that other efforts be made to even the
playing field.
o An annual or biannual “BIA/LSA Economic Summit” where small businesses and policy
makers can share information and experiences as well as engage and co-create solutions
and public policy recommendations.