Embed Size (px)
Citation preview
1
Business Structures of Small Commercial
Maritime Operators
July 2016

2
Business Structures of Small Commercial Maritime Operators July 2016
Financial, Economic and Statistical Analysis
Ministry of Transport
Acknowledgement
We are grateful to Statistics New Zealand and Maritime New Zealand for providing information to complete this report.

3
Overview
The Ministry of Transport (MoT) has received an inquiry from the Associate Minister of Transport
and Maritime New Zealand to analyse business structures in the small commercial maritime business
(SCMB) sector (i.e. businesses with 0–19 employees).
This report is based on data provided by Statistics NZ for specific industry codes covering fishing,
offshore aquaculture, water freight transport, water passenger transport and other water transport
support services. For the purposes of this report, entities with these industry codes make up the
commercial maritime sector.
In February 2015, the maritime sector for businesses in these specific groups consisted of around
1,893 businesses (including non-commercial organisations) with 3,190 persons employed. The
commercial sector comprised 1,890 businesses and 3,100 employees, separated into the large
commercial business sector (i.e. with 20 or more employees) and the SCMB sector. For the
remainder of this report, any reference to SCMB should be taken to mean small commercial
maritime businesses in fishing, offshore aquaculture, water transport (passenger, freight and other
water transport support services). The large commercial business sector comprised around 30
businesses with 1,780 persons employed. The SCMB sector comprised around 1,860 businesses with
1,320 persons employed.
Large commercial businesses accounted for fewer than 2% of all businesses but around 56% of all
employees, while the SCMB sector accounted for about 98% of all maritime businesses and 41% of
all employees.
The purpose of this research is to:
analyse data on business structures in the SCMB sector for these specific groups, in particular to
identify the business structures chosen by operators and the percentages of such businesses
that operate as sole traders, partnerships, companies or with other corporate forms.
identify recent changes and any trends in the type of business structures in use by commercial
operators in fishing, water transport (freight, transport and other water transport support
services) and aquaculture.
Data is sourced from Statistics New Zealand’s Business Demography Statistics and Business
Demography Survey 2013.
Main characteristics of small commercial maritime businesses in 2015
The SCMB sector accounted for 98% of all maritime businesses and 41% of maritime employees.
The SCMB sector has on average fewer than two employees per business, and 75% of them have
no employees.
Market entry (birth) and market exit (death) rates were 11% of all businesses in the SCMB sector
in 2015.
Limited liability companies, individual proprietorships, and partnerships represent about 97% of
SCMBs.

4
The fishing industry dominated the SCMB sector, accounting for 68% of businesses and 50% of
employees.
Changes in small commercial maritime businesses since 2000
Decline in the number of businesses and employees
o The overall number of businesses in the maritime sector has dropped by 20.6% from
2,283 in 2000 to 1,893. The number of businesses in the SCMB sector has dropped by
17% from 2,247 in 2000 to 1,860.
o The total number of employees in the maritime sector has dropped by 21.9% from 3,890
in 2000 to 3,190. The number of employees in the SCMB sector has dropped by 11%
from 1,480 in 2000 to 1,320.
Fishing industry dominates the small commercial maritime sector
o In 2000, the fishing industry accounted for 82% of the total number of businesses and
57% of the total number of employees in the SCMB sector. In 2015 the number of
businesses had dropped by 31% from 1,848 in 2000 to 1,269, and the number of
employees had dropped by 21% from 840 in 2000 to 660, although it remains the largest
industry in the SCMB sector.
Limited liability companies are most common
o Overall, limited liability companies, individual proprietorships, and partnerships have
been the top three forms of businesses in the SCMB sector since 2000. Together, they
account for about 97–99% of businesses in the sector.
o Businesses with individual proprietorship reduced by 50% in 2015 from 2000, dropping
from the most common form to the second most common form. In comparison, the
number of limited liability companies increased by 59%, becoming the most common
form in 2015 compared with being the second most common form in 2000.
o In particular, the proportion of limited liability companies increased dramatically for the
fishing industry (from 22% to 47%) and offshore aquaculture (from 46% to 63%)
between 2000 and 2015. The proportion of water transport limited liability companies
has remained at 72%, while the number of water transport limited liability companies
increased by 157%, from 105 in 2000 to 270 in 2015.
Most small commercial maritime businesses have no employees
o Over the past 15 years, businesses with no employees have dominated the SCMB sector.
On average, these businesses account for about 76% of the sector, while businesses with
1–5 employees represent about 20% of all businesses and 3% of all businesses have 6–
19 employees.
o The number of businesses with no employees in the fishing industry dropped
significantly from 2004 to 2009 but has remained flat since 2010. In contrast, the
number of water transport businesses with no employees increased from 2000 to 2008,
and has remained flat since 2009.
Less active market compared with 2000
o The 2015 business birth and death rate dropped by about 40% in the sector compared
with 2000. The death rate in 2007/08 increased significantly due to the global financial
crisis.

5
Contents 1. Introduction .............................................................................................................................. 7
1.1 Purpose of this research ..................................................................................................... 7
1.2 Data ................................................................................................................................... 7
1.3 Structure of this report....................................................................................................... 8
2 Overview of the maritime business sector ................................................................................. 9
3 Small commercial maritime business sector ............................................................................. 10
3.1 Overview of the small commercial maritime business sector ............................................ 10
3.2 Fishing ............................................................................................................................. 11
3.3 Offshore aquaculture ....................................................................................................... 11
3.4 Water transport ............................................................................................................... 12
3.5 Comparison between industries ....................................................................................... 13
3.5.1 Number of businesses .............................................................................................. 13
3.5.2 Number of employees .............................................................................................. 13
4 Types of businesses in the small commercial maritime business sector .................................... 15
4.1 Overview of business types in the small commercial maritime business sector ................. 15
4.2 Fishing ............................................................................................................................. 16
4.3 Offshore aquaculture ....................................................................................................... 16
4.4 Water transport ............................................................................................................... 17
4.5 Change across industries 2000–2015 ................................................................................ 19
4.5.1 Overview .................................................................................................................. 19
4.5.2 Individual proprietorship .......................................................................................... 20
4.5.3 Partnership ............................................................................................................... 21
4.5.4 Limited liability companies ....................................................................................... 22
4.5.5 Branches of companies incorporated overseas ......................................................... 23
4.5.6 Trusts/Estates........................................................................................................... 23
5 Business size ............................................................................................................................ 25
6 Business birth rate/death rate/survival rate ............................................................................. 26
7 Socio-demographic characteristics ........................................................................................... 28
8 Summary of findings ................................................................................................................ 29
8.1 Overall maritime sector .................................................................................................... 29
8.2 Small commercial maritime businesses sector in 2015 ..................................................... 29
8.3 Changes in small commercial maritime businesses sector since 2000 ............................... 30

6
Figures Figure 1: Maritime SCMBs 2000–2015 ............................................................................................. 10
Figure 2: Businesses by number of employees ................................................................................. 10
Figure 3: Fishing SCMBs 2000–2015 ................................................................................................. 11
Figure 4: Offshore aquaculture SCMBs 2000–2015 .......................................................................... 12
Figure 5: Water transport SCMBs 2000–2015 .................................................................................. 12
Figure 6: Number of businesses by industry 2000–2015 .................................................................. 13
Figure 7: Number of employees by industry 2000–2015 .................................................................. 14
Figure 8: Business types in the SCMB sector in 2015 ........................................................................ 15
Figure 9: Fishing businesses by type in 2000 .................................................................................... 16
Figure 10: Fishing businesses by type in 2015 .................................................................................. 16
Figure 11: Offshore aquaculture businesses by type in 2000 ............................................................ 17
Figure 12: Offshore Aquaculture businesses by type in 2015 ........................................................... 17
Figure 13: Water Transport businesses by type in 2000 ................................................................... 18
Figure 14: Water Transport businesses by type in 2015 ................................................................... 18
Figure 15: Business forms in 2000 .................................................................................................... 19
Figure 16: Business types in 2015 .................................................................................................... 20
Figure 17: Businesses with individual proprietorship by industry 2000–2015 ................................... 20
Figure 18: Employees by industry (individual proprietorship) 2000–2015 ........................................ 21
Figure 19: Partnerships by industry.................................................................................................. 21
Figure 20: Employees by industry — partnerships ........................................................................... 22
Figure 21: Businesses by industry — limited liability companies....................................................... 22
Figure 22: Employees by industry — limited liability companies ...................................................... 23
Figure 23: Branches of companies incorporated overseas — water transport .................................. 23
Figure 24: Businesses by industry — trusts/estates .......................................................................... 24
Figure 25: Employees by industry — trusts/estates.......................................................................... 24
Figure 26: Businesses by employment size ....................................................................................... 25
Figure 27: Businesses with zero employees by industry 2000–2015 ................................................. 25
Figure 28: Businesses births and deaths in the SCMB sector, 2001–2015 ......................................... 26
Figure 29: Employees in births and deaths of SCMBs, 2001–2015 .................................................... 27
Figure 30: Employees in births and deaths of all maritime businesses, 2001–2015 .......................... 27

7
1. Introduction The Ministry of Transport (MoT) has received an inquiry from the Associate Minister of Transport
and Maritime New Zealand to analyse the business structure of small commercial maritime
operators.
The information obtained will assist the Associate Minister and others to understand the make-up of
business structures among maritime operators, whether there have been any significant changes
over time and, to the extent that is supported by the data, the drivers or factors associated with
major changes.
The data will provide a profile of business structures in the SCMB sector.
1.1 Purpose of this research
The purpose of this research is to:
analyse data on business structures in the SCMB sector, in particular to identify the business
structures chosen by operators and the percentages that operate as sole traders,
partnerships, companies, or other corporate forms.
identify recent changes and any trends in the type of business structures in use in this sector
1.2 Data
Data was obtained from Statistics New Zealand and covers businesses and employees between
February 2000 and February 2015, in the sector as a whole, and in the SCMB sector by:
business type
industry
number of employees.
The SCMB sector is defined by industry classification and number of employees. Three categories
are used1:
zero employees
1–5 employees
6–19 employees.
Three industry codes are used2:
fishing3
1The use of these three categories is supported by the Small Business Report published in 2014 by the Ministry of Business, Innovation and Employment (MBIE). 2Statistics New Zealand advised that, in deciding the level of detail, we should keep in mind that, at a higher level of disaggregation, there is a greater chance of certain data cells with small counts being suppressed in line with their confidentiality rules. In this particular instance, the chances of this happening would be even higher because we are dealing with a small subset of businesses. Maritime New Zealand advised that we will be missing some maritime operators as in some cases there is no clear-cut industry code to separate out water-based operators from land-based operators. For example, charter fishing boats and whale watching cruises are coded under 1501000, which is Scenic and Sightseeing Transport. Similarly, water-based adventure tourism operators do not have their own code. 3This includes ANZSIC06 group A041 Fishing.

8
offshore aquaculture4
water transport5.
Public sector agencies and their employees engaged in maritime activity are excluded from data on
the SCMB sector.
The sources for all data are Business Demography Statistics from Statistics New Zealand. Sources of
business demography data are the:
Longitudinal Business Frame (LBF) which is a monthly longitudinal snapshot of Statistics New
Zealand’s Business Register6
Linked Employee-Employer Database (LEED) for employee count data. Other data is from Statistics New Zealand’s Business Demography Survey, February 2013.
1.3 Structure of this report
Section 2 presents an overview of the maritime business sector.
Sections 3 presents an overview of the SCMB sector in terms of the number of businesses and
employees by industry.
Section 4 looks at statistics and analysis of change in the types of businesses.
Section 5 looks at the size of businesses.
Section 6 looks at business birth, death, and survival rates.
Section 7 provides a brief introduction to the socio-demographic characteristics of commercial
fishing operators.
Section 8 presents summary of findings based on the available information.
4This includes ANZSIC06 classes: A020100 Longline and Rack Offshore Aquaculture and A020200 Caged Offshore Aquaculture. 5This includes ANZSIC06 classes: I4810 Water Freight Transport; I4820 Water Passenger Transport; and I521900 Other Water Transport Support Services. 6Business Register is a database of all economically significant businesses in New Zealand (mostly those with an annual GST turnover of $30,000 or more). This database is updated continuously using a combination of sources such as:
· administrative, e.g. IRD, Companies Office
· direct survey of larger and complex units, e.g. Business Register Update Survey (annual)
· feedback from Statistics New Zealand business surveys, e.g. Retail Trade Survey, Annual Enterprise Survey
· other ad hoc information, e.g. media, company reports.

9
2 Overview of the maritime business sector In 2015, the maritime business sector, including commercial businesses and non-commercial
organisations such as government agencies, regional authorities and other local authorities, was
made up of around 1,893 businesses and 3,190 employees. The largest business population was in
the commercial sector with 1,890 businesses and 3,100 employees.
The large commercial business sector (i.e. businesses with 20 employees and above) was made up of
around 30 businesses with 1,780 persons employed. The SCMB sector (i.e. businesses with 0–19
employees) comprised around 1,860 businesses with 1,320 persons employed.
The total number of businesses has dropped by 17.1% from 2,283 in 2000; the total number of
employees has dropped by 18.0% from 3,890 in 2000.
The number of businesses in the commercial sector has dropped by 17.1% from 2,280 in 2000; the
number of employees for commercial sector has dropped by 18.6% from 3,810 in 2000.
The number of businesses in the SCMB sector has dropped by 17.2% from 2,247 in 2000, while the
number of employees in the sector has dropped by 10.8% from 1,480 in 2000.
Some important characteristics include the following.
The maritime business sector was made up mainly of SCMBs. Commercial businesses
account for 99.8% of total businesses. SCMBs accounted for 98% of total businesses.
The number of non-commercial organisations is very small, fewer than six each year since
2000. Data from Statistics New Zealand indicates that there were three non-commercial
organisations as at February 2015.
Businesses with no employees represented the majority of maritime businesses, on average
accounting for 75% of total businesses between 2000 and 2015.
The large business sector accounts for fewer than 2% of maritime businesses but 56% of all
employees.
The average number of employees per business is 66 in the large commercial sector and
fewer than two employees across all commercial businesses.
For the year to February 2015, 198 newly born businesses created 40 jobs, while the data shows 25
job losses as a consequence of the death of 204 businesses over the same period. Both birth and
death rates of businesses were around 10-11% of the total number. The number of newly born
businesses in 2015 increased by 12% from 177 in 2014. In 2014, both birth and death rates of
businesses were around 9% of the total number.
The two-year survival rate for businesses created in 2013 was about 56%; the five-year survival rate
of businesses born in 2010 and still active in 2015 was 31%.

10
3 Small commercial maritime business sector
3.1 Overview of the small commercial maritime business sector
There were 1,860 businesses in the SCMB sector in 2015, down from 2,247 in 2000 (a 17%
reduction). There were 1,320 employees in the SCMB sector in 2015, down from 1,480 in 2000 (an
11% reduction). The average number of employees per business increased by 8% from 0.66 per
business in 2000 to 0.71 per business in 2015 (Figure 1).
Figure 1: Maritime SCMBs 2000–2015
Over the past 15 years, businesses with no employees have dominated the SCMB sector, making up
about 76% of all businesses. Businesses with 1–5 employees and with 6–19 employees account for
20% and 3% of all businesses, respectively.
Figure 2: Businesses by number of employees
The subsections below provide information on the change in the number of businesses and the
number of employees for the following three industries in the SCMB sector:
0.00
0.10
0.20
0.30
0.40
0.50
0.60
0.70
0.80
0
500
1000
1500
2000
2500
2000
2001
2002
2003
2004
2005
2006
2007
2008
2009
2010
2011
2012
2013
2014
2015
Ave
rage
em
plo
yees
pe
r b
usi
ne
ss
Small commercial maritime businesses 2000-2015
Businesses Employee count Average employees per business
0
500
1000
1500
2000
Businesses by number of employees
zero 1 to 5 6 to 19

11
fishing
offshore aquaculture
water transport.
3.2 Fishing
There were 1,269 fishing businesses in the SCMB sector in 2015, down from 1,848 in 2000 (a 31%
reduction). There were 660 employees in the SCMB sector in 2015, down from 840 in 2000 (a 21%
reduction).
The average number of employees per business increased by 14% from 0.45 employees per business
in 2000 to 0.52 employees per business in 2015 (Figure 3).
In the past five years, the number of businesses and the number of employees have remained
relatively stable in the fishing industry.
Figure 3: Fishing SCMBs 2000–2015
3.3 Offshore aquaculture
There were 219 offshore aquaculture businesses in the SCMB sector in 2015, down from 255 in 2000
(a 14% reduction). There were 200 employees in 2015, down from 320 in 2000 (a 38% reduction).
The average number of employees per business fell by 27% from 1.25 employees per business in
2000 to 0.91 employees per business in 2015 (Figure 4).
0.00
0.10
0.20
0.30
0.40
0.50
0.60
0.70
0
200
400
600
800
1000
1200
1400
1600
1800
2000
Ave
rage
em
plo
yees
per
bu
sin
ess
Fishing businesses 2000–2015
Businesses Employee count Average employees per business

12
Figure 4: Offshore aquaculture SCMBs 2000–2015
3.4 Water transport
There were 375 water transport businesses in the SCMB sector in 2015, compared to 144 in 2000 (a
160% increase). There were 460 employees in water transport in 2015, compared to 320 in 2000 (a
44% increase). The average number of employees per business fell by 45% from 2.22 in 2000 to 1.23
in 2015 (Figure 5).
Figure 5: Water transport SCMBs 2000–2015
Over the past five years, the number of businesses has stayed flat, but the number of employees has
varied from year to year with the number dropping in 2014 and 2015.
0.00
0.20
0.40
0.60
0.80
1.00
1.20
1.40
0
50
100
150
200
250
300
350
400
Ave
rage
em
plo
yees
pe
r b
usi
ne
ss
Offshore Aquaculture businesses 2000-2015
Businesses Employee count Average employees per business
0.00
0.50
1.00
1.50
2.00
2.50
0
100
200
300
400
500
600
2000
2001
2002
2003
2004
2005
2006
2007
2008
2009
2010
2011
2012
2013
2014
2015 Ave
rage
em
plo
yees
per
bu
sin
ess
Water Transport businesses 2000-2015
Businesses Employee count Average employees per business

13
3.5 Comparison between industries
3.5.1 Number of businesses
The fishing industry has maintained its position as the largest single SCMB group but has declined
from 82% of the SCMBs in 2000 to 68% in 2015.
In comparison, the proportion of water transport businesses rose from 6% in 2000 to 20% in 2015 (a
214% increase).
Offshore aquaculture has not changed much over the same period, at around 11–12% of the SCMBs
(Figure 6).
The three industries’ relative proportions of overall SCMB numbers have not changed over the last
five years.
Figure 6: Number of businesses by industry 2000–2015
3.5.2 Number of employees
The fishing industry had about a half of all employees in the SCMB sector. This proportion has not
changed much since 2000. It remained the largest industry in the sector in terms of the number of
employees.
Offshore aquaculture accounted for about 11% of total employees in 2015, a fall from 14% in 2000.
In comparison, the water transport proportion of employees increased by 73%, from 14% in 2000 to
25% in 2015 (Figure 7).
The three industries’ relative proportions of overall SCMB employee numbers have not changed over
the last five years.
0
500
1000
1500
2000
2500
Number of businesses by industry 2000–2015
Fishing Offshore Aquaculture Water Transport

14
Figure 7: Number of employees by industry 2000–2015
0
200
400
600
800
1000
1200
1400
1600
1800
Number of employees by industry 2000–2015
Fishing Offshore Aquaculture Water Transport

15
4 Types of businesses in the small commercial maritime business sector
4.1 Overview of business types in the small commercial maritime business sector
The pie chart below shows business types in the SCMB sector in 2015 (Figure 8). Limited liability
companies7, individual proprietorships8, and partnerships9 were the top three types in the SCMB
sector. Together, they accounted for about 97% of all sector businesses.
Other types of businesses in 2015 included branches of companies incorporated overseas10,
trusts/estates11, joint ventures and consortia12, and incorporated and unincorporated societies and
associations13.
Figure 8: Business types in the SCMB sector in 2015
7
Registered limited liability company is a trading entity registered as a company excluding co-operative companies. Excluding limited liability companies set up by local and central government. Co-operative company is a trading entity registered as a co-operative company and also including any companies declared to be co-operative by Order-in-Council. As it is most unlikely that there would be any co-operative companies in the SCMB sector, for simplicity purposes, in this report we refer to this type of business as limited liability company. 8 A trading entity which has only one responsible owner. The owner may be a working proprietor or may employ a manager or managers. 9 Partnerships are defined under the Partnership Act 1908 (or by court decision) as a relation between persons carrying on a business in common with a view to profit. It includes special partnerships, but excludes any relation between registered companies, or any other registered stock, trading or mining companies. Also excluded are partnerships between banking or insurance firms. The above exclusions should be classified to Joint Ventures and Consortia. 10
Offices and branches of companies incorporated anywhere outside New Zealand. 11
An entity registered as a Trust or deemed to be one by a Court Also includes estates formed by the death of a proprietor or partner which continue for the time being following that death. Excludes Licensing Trusts. 12
Joint ventures between companies and consortia of companies, typically of limited duration, and never between individuals. 13
Entities registered in any way as incorporated societies or as associations.
Individual Proprietorship,
534
Partnership, 270
Limited Liability
Company , 999
Branches of Companies
Incorporated Overseas (for
water transport only, not for fishing and
offshore aquaculcure), 6
Trusts/Estates, 48
Other, 54

16
4.2 Fishing
The number of individual proprietorship businesses fell by 50%, from 1,005 in 2000 to 441 in 2015.
The number of partnerships fell by 53%, from 420 in 2000 to 198 in 2015, while the number of
companies with limited liability increased by 46%, from 405 in 2000 to 591 in 2015.
In 2000, the commonest type of businesses was individual proprietorship, accounting for about 54%
of all fishing businesses. The share fell to 35% in 2015.
In 2015 the most common type of businesses was limited liability company, accounting for about
47% of all businesses in the fishing industry.
The numbers of businesses that are branches of companies incorporated overseas, joint ventures
and consortia, and incorporated and unincorporated societies and associations are confidential14.
Therefore, they are excluded from the pie charts below.
Figure 9: Fishing businesses by type in 2000
Figure 10: Fishing businesses by type in 2015
4.3 Offshore aquaculture
In 2000, the most common business type in the offshore aquaculture industry was limited liability
company, followed by partnerships and individual proprietorships (Figure 11).
14
They are not statistically material. Please see footnote 2 for more details about confidentiality.
Individual Proprietorship,
1005 Partnership,
420
Limited Liability
Company, 405
Trusts/Estates, 12
Individual Proprietorship,
441
Partnership, 198
Limited Liability
Company, 591
Trusts/Estates, 33
17
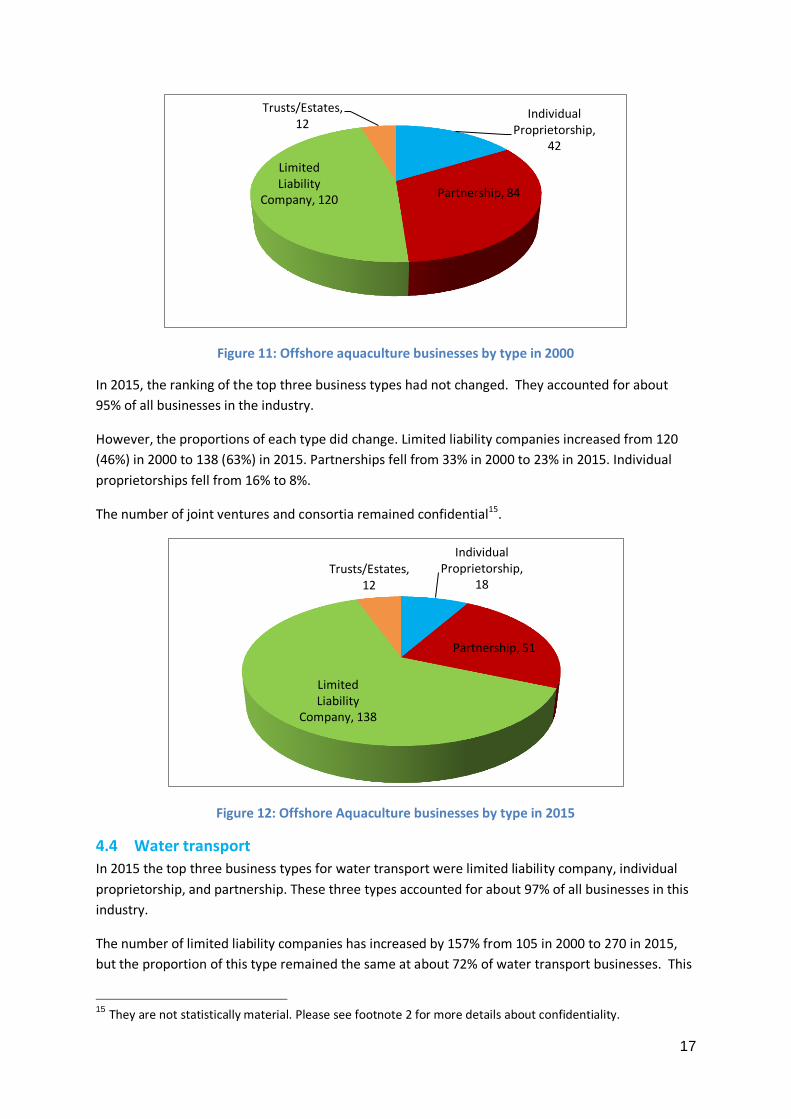
Figure 11: Offshore aquaculture businesses by type in 2000
In 2015, the ranking of the top three business types had not changed. They accounted for about
95% of all businesses in the industry.
However, the proportions of each type did change. Limited liability companies increased from 120
(46%) in 2000 to 138 (63%) in 2015. Partnerships fell from 33% in 2000 to 23% in 2015. Individual
proprietorships fell from 16% to 8%.
The number of joint ventures and consortia remained confidential15.
Figure 12: Offshore Aquaculture businesses by type in 2015
4.4 Water transport
In 2015 the top three business types for water transport were limited liability company, individual
proprietorship, and partnership. These three types accounted for about 97% of all businesses in this
industry.
The number of limited liability companies has increased by 157% from 105 in 2000 to 270 in 2015,
but the proportion of this type remained the same at about 72% of water transport businesses. This
15
They are not statistically material. Please see footnote 2 for more details about confidentiality.
Individual Proprietorship,
42
Partnership, 84
Limited Liability
Company, 120
Trusts/Estates, 12
Individual Proprietorship,
18
Partnership, 51
Limited Liability
Company, 138
Trusts/Estates, 12

18
was because the total number of businesses has increased by about 160% from 144 in 2000 to 375 in
2015.
The number of partnerships has not changed much but, because the total number of water
transport businesses increased dramatically from 2000 to 2015, the proportion of partnerships has
dropped from 12% in 2000 to 5% in 2015.
While the number of individual proprietorships increased nearly fourfold, the proportion of this type
only increased from 14% in 2000 to 20% in 2015, as the increase was outweighed by the growth in
the number of limited liability companies.
The number of joint ventures and consortia is confidential.
Figure 13: Water Transport businesses by type in 2000
Figure 14: Water Transport businesses by type in 2015
Individual Proprietorship,
21
Partnership, 18
Limited Liability
Company, 105
Branches of Companies
Incorporated Overseas, 3
Individual Proprietorship,
75 Partnership,
21
Limited Liability
Company, 270
Branches of Companies
Incorporated Overseas, 6
Trusts/Estates, 3

19
4.5 Change across industries 2000–2015
4.5.1 Overview
The pie charts below show business types between 2000 and 2015. In 2000 there were six types
within the SCMB sector: individual proprietorships, partnerships, registered limited liability
companies, branches of companies incorporated overseas, incorporated and unincorporated
societies and associations16, and trusts/estates.
In 2015 the types of structure varied from those in 2000. For example, there was a new type of
business in 2015: joint ventures and consortia17. In addition, branches of companies incorporated
overseas existed in the fishing and water transport industries in 2000. In 2015, this type of business
existed in the water transport sector only.
Overall, limited liability company, individual proprietorship, and partnership remained the top three
business types in the SCMB sector. Together, they accounted for 97% of the SCMB sector in 2015.
However, the ranking of the top two has changed. The number of individual proprietorships fell by
50% and their ranking dropped from first in 2000 to second in 2015. In comparison, the number of
limited liability companies increased by 59%, ranking top in 2015 compared with second in 2000
(Figure 15 and Figure 16). The proportion of partnerships remained unchanged.
Figure 15: Business forms in 2000
16
It is confidential but the number is not statistically material. Please see footnote 2. 17
It is confidential but the number is not statistically material. Please see footnote 2
Individual Proprietorship,
1068
Partnership, 522
Limited Liability Company, 630
Branches of Companies
Incorporated Overseas (water transport only.
Others are confidencial), 3
Trusts/Estates, 24 Other, 24

20
Figure 16: Business types in 2015
4.5.2 Individual proprietorship
In 2015, in total there were 534 businesses with individual proprietorship, down from 1,068 in 2000.
The biggest proportion was in the fishing industry, although it dropped from 94% in 2000 to 83% in
2015. The biggest change was for water transport, increasing from 3% in 2000 to 14% in 2015.
The absence of water transport and aquaculture numbers for some years in Figure 17 is due to
confidentiality18.
Figure 17: Businesses with individual proprietorship by industry 2000–2015
18
The numbers are not statistically material. For more details about confidentiality please see footnote 2.
Individual Proprietorship,
534 Partnership, 270
Limited Liability Company, 999
Branches of Companies
Incorporated Overseas (Water Transport only), 6
Trusts/Estates, 48
Other, 54
0
200
400
600
800
1000
2000 2001 2002 2003 2004 2005 2006 2007 2008 2009 2010 2011 2012 2013 2014 2015
Businesses with individual proprietorship by industry
Fishing Offshore Aquaculture Water Transport

21
Figure 18: Employees by industry (individual proprietorship) 2000–2015
4.5.3 Partnership
The number of SCMB partnerships declined by 48%, from 522 in 2000 to 270 In 2015, with numbers
dropping most in the fishing industry. The fishing industry proportion of all SCMBs dropped from
80% in 2000 to 73% in 2015 (Figure 19).
The numbers of businesses for fishing and offshore aquaculture partnerships dropped by 53% and
39% respectively from 2000 to 2015. The numbers of businesses for water transport increased by
17%.
Figure 19: Partnerships by industry
The numbers of employees for fishing and offshore aquaculture partnerships dropped by 63% and
91% respectively from 2000 to 2015. A significant increase in employees in offshore aquaculture in
2014 was followed by a corresponding drop in 2015. Other than this change, overall employees for
this type for the most recent five years have been flat. However, employees for water transport
dropped to zero in 2015 from 15 in 2000.
0
20
40
60
80
100
120
140
160
180
2000 2001 2002 2003 2004 2005 2006 2007 2008 2009 2010 2011 2012 2013 2014 2015
Employees by industry (Individual proprietorship)
Fishing Offshore Aquaculture Water Transport
0
100
200
300
400
500
2000 2001 2002 2003 2004 2005 2006 2007 2008 2009 2010 2011 2012 2013 2014 2015
Businesses with partnership by industry
Fishing Offshore Aquaculture Water Transport

22
Figure 20: Employees by industry — partnerships
4.5.4 Limited liability companies
In 2015, a total of 999 businesses were limited liability companies, up from 630 in 2000. The biggest
proportion was in the fishing industry, although the proportion dropped from 64% in 2000 to 59% in
2015. The biggest change was for water transport, increasing by 157% from 2000. The number of
limited liability water transport businesses has exceeded that for offshore aquaculture since 2003.
Water transport employees have increased from 28% of total limited liability company employment
in 2000 to 38% in 2015. Fishing industry and offshore aquaculture employee numbers rose slightly in
2014 and 2015. In contrast, water transport employee numbers have decreased in these two years.
Figure 21: Businesses by industry — limited liability companies
0
50
100
150
200
2000 2001 2002 2003 2004 2005 2006 2007 2008 2009 2010 2011 2012 2013 2014 2015
Employees by industry (for businesses with partnership)
Fishing Offshore Aquaculture Water Transport
0
200
400
600
800
2000 2001 2002 2003 2004 2005 2006 2007 2008 2009 2010 2011 2012 2013 2014 2015
Businesses by industry (limited liability companies)
Fishing Offshore Aquaculture Water Transport

23
Figure 22: Employees by industry — limited liability companies
4.5.5 Branches of companies incorporated overseas
Due to confidentiality issues19, data for this type of business is available only for water transport, for
which the number of businesses is stable. The number of employees declined until 2013 but
increased in 2014 and 2015.
Figure 23: Branches of companies incorporated overseas — water transport
4.5.6 Trusts/Estates
The number of trusts/estates operating in fishing and offshore aquaculture decreased in 2012 and
2013 respectively.
The number of employees in water transport increased significantly in 2013. The number of
employees in fishing increased significantly in 2013, but then dropped significantly in 2014 and 2015.
The change in absolute numbers was small, however.
19
For more details about confidentiality, please refer to footnote 2.
0
100
200
300
400
500
600
2000 2001 2002 2003 2004 2005 2006 2007 2008 2009 2010 2011 2012 2013 2014 2015
Employees by industry (limited liability companies )
Fishing Offshore Aquaculture Water Transport
0
20
40
60
2000200120022003200420052006200720082009201020112012201320142015
Water transport (branches of companies incorporated overseas)
Businesses Employee count

24
Figure 24: Businesses by industry — trusts/estates
Figure 25: Employees by industry — trusts/estates
0
10
20
30
40
2000 2001 2002 2003 2004 2005 2006 2007 2008 2009 2010 2011 2012 2013 2014 2015
Businesses by industry (trusts/estates)
Fishing Offshore Aquaculture Water Transport
0
5
10
15
20
25
30
35
2000 2001 2002 2003 2004 2005 2006 2007 2008 2009 2010 2011 2012 2013 2014 2015
Employees by industry (trusts/estates)
Fishing Offshore Aquaculture Water Transport

25
5 Business size Over the past 15 years, businesses with no employees have dominated the SCMB sector. They
represented about 76% of the sector. Businesses with 1–5 employees comprised about 20% of the
sector and businesses with 6–19 employees 3%.
Figure 26: Businesses by employment size
Figure 27: Businesses with zero employees by industry 2000–2015
The number of fishing businesses with zero employees declined from 2000 to 2009, with a significant
reduction over the years from 2004 to 2009.
In contrast, the number of water transport operators with no employees increased from 2000 to
2008 and has since then been stable.
0
500
1000
1500
2000
Businesses by employment size
zero 1 to 5 6 to 19
0
200
400
600
800
1000
1200
1400
1600
Businesses with zero employee by industry 2000–2015
Fishing Offshore Aquaculture Water Transport

26
6 Business birth rate/death rate/survival rate This section presents statistical data about business birth, death, and survival rates in the SCMB
sector.
Based on the February 2015 data, 198 newly born businesses created about 40 jobs and 201
business deaths produced 25 job losses. The newly born businesses in 2015 compared with 2014
increased by 12%.
In 2014, the birth and death rates of businesses were 10% of all businesses in the SCMB sector. In
2015, both rates were 11% of all businesses in the SCMB sector.
The two-year survival rate for businesses created in 2013 was about 56%; the five-year survival rate
of businesses born in 2010 and still active in 2015 was 32%.
While the business birth rate has been lower than the death rate since 2004, the number of
employees added by newly born businesses has exceeded the loss of employees from businesses
that ceased (Figure 28).
However, employee losses from businesses that ceased exceeded employee gains from births in
2007 and 2012 (Figure 30). This is likely to have been due to the global financial crisis in 2007 and
the resulting deaths of large businesses.
Figure 28: Businesses births and deaths in the SCMB sector, 2001–2015
0
50
100
150
200
250
300
350
400
20
01
20
02
20
03
20
04
20
05
20
06
20
07
20
08
20
09
20
10
20
11
20
12
20
13
20
14
20
15
Birth/death of SCMBs
SCMB sector birth ofbusinesses
SCMB sector death ofbusinesses

27
Figure 29: Employees in births and deaths of SCMBs, 2001–2015
Figure 30: Employees in births and deaths of all maritime businesses, 2001–2015
The drop in total employees in the overall maritime sector is less likely to be due to the deaths of
businesses than to existing companies reducing employee numbers.
0
20
40
60
80
100
120
14020
01
2002
2003
2004
2005
2006
2007
2008
2009
2010
2011
2012
2013
2014
2015
Change in employees due to birth/death of SCMBs
SCMB sector change inemployees due to birth ofbusinesses
SCMB sector change inemployees due to death ofbusinesses
0
50
100
150
200
250
300
350
400
2001
2002
2003
2004
2005
2006
2007
2008
2009
2010
2011
2012
2013
2014
2015
Axi
s Ti
tle
Change in employees due to birth/death of maritime businesses
All maritime businesseschange in employees due tobirth of businesses
All maritime businesschange in employees due todeath of businesses

28
7 Socio-demographic characteristics The information below refers to the socio-demographic characteristics of commercial fishing
operators, using data from the Statistics New Zealand Business Demography Survey (February 2013).
No further information has been obtained for small commercial fishing operators or for other
industries.
Fishing operators in the sector range from large commercial operators, including operators of deep
sea vessels fishing the EEZ, through to owner/operators of varying commercial size that make most
of the inshore fleet. The sector has a relatively small employment base, is overwhelmingly male with
an average age older than most other industries, self-employed, and working longer than average at
low pay.
As at February 2013, the fishing sector employed 2,546 people, of which 1,746 were employed in
commercial sea fishing and 800 in aquaculture. This figure includes only those operators with
turnover greater than $30,000.
As at February 2013, 4,740 people were employed in seafood processing. This figure includes both
on-vessel and land-based processing. Maritime New Zealand regulates processing on vessels but not
land-based processing.
In the year to 30 June 2009, the Tasman/Nelson/Marlborough/West Coast area was the largest
fishing employment region with 38% of all industry workers located there. New Zealand’s two
largest commercial fishing operators — Talleys and Sealord — operate their fleets from this region,
which is also the location of three of the country’s largest fish processing plants. The remainder of
industry employment is fairly evenly distributed throughout New Zealand’s other coastal regions.
Just over 50% of those in the industry are self-employed.
At around 80%, the sector is overwhelmingly male. This is higher than for all other industries, which
are on average 53% male.
Older workers in the sector are over-represented, with more workers in the 35–54 age group and
fewer in the 15–24 age group than for other industries.
The proportion of Māori workers in the fishing sector is almost twice that of all other industries
combined.
Workers in commercial sea fishing and aquaculture are more likely than average to work long hours.
In 2006, 62.5% of those in the industry reported that they worked more than 40 hours per week,
compared with 39.6% in the wider economy; and over 35% of people in the industry reported
working over 61 hours per week, compared with 6.9% of the general working population.
Based on discussions with Maritime New Zealand, we do not expect this profile for commercial
fishing operators to have changed dramatically since 2013.

29
8 Summary of findings
8.1 Overall maritime sector
In 2015, the maritime business sector was made up of around 1,893 businesses with 3,190 persons
employed (including three non-commercial organisations with 90 employees).
The large commercial maritime business sector was made up of around 30 businesses with 1,780
persons employed. The SCMB sector was made up of around 1,860 businesses with 1,320 persons
employed.
Some important characteristics include the following.
The maritime business sector was made up mainly of SCMBs. Commercial businesses
accounted for 99.8% of the total businesses. SCMBs accounted for 98% of the commercial
business sector.
The number of non-commercial organisations was very small. Data from Statistics New
Zealand indicates that there were three non-commercial organisations as at February 2015.
Businesses with no employees represented the majority of maritime businesses, accounting
for around 75% of total businesses between 2000 and 2015.
The large business sector accounted for fewer than 2% of maritime businesses but 56% of
employees.
The average number of employees per business in the large commercial sector is 66 and
fewer than two employees per business for all commercial businesses.
There were 40 jobs created in the year to February 2015 from 198 newly born businesses, while the
data shows 25 job losses as a consequence of the death of 204 businesses over the same period.
Both birth and death rates of businesses tend to be around 10–11% of the total number. Newly born
businesses in 2015 increased by 12% from 177 in 2014. In 2014, both birth and death rates of
businesses were around 9% of the total number.
The two-year survival rate for businesses created in 2013 was about 56%; the five-year survival rate
of businesses born in 2010 and still active in 2015 was 31%.
8.2 Small commercial maritime businesses sector in 2015
The main characteristics of the SCMB sector in 2015 were as follows.
The SCMBs accounted for 98% of all maritime businesses and 41% of all employees.
Most businesses had no employees.
o Three quarters (75%) of all businesses in February 2015 had no employees.
The market in 2015 was slightly more active than in 2014.
o New businesses in 2015 compared with 2014 increased by 12%. Both business birth and
death rates increased from 10% of the total number in SCMB sector in 2014 to 11% in
2015.
Limited liability companies, individual proprietorships, and partnerships were the top three
types in the SCMB sector. They accounted for about 97% of all SCMBs.
The fishing industry dominated the maritime sector.
o The fishing industry accounted for 68% of all SCMBs and 50% of SCMB employees.
30
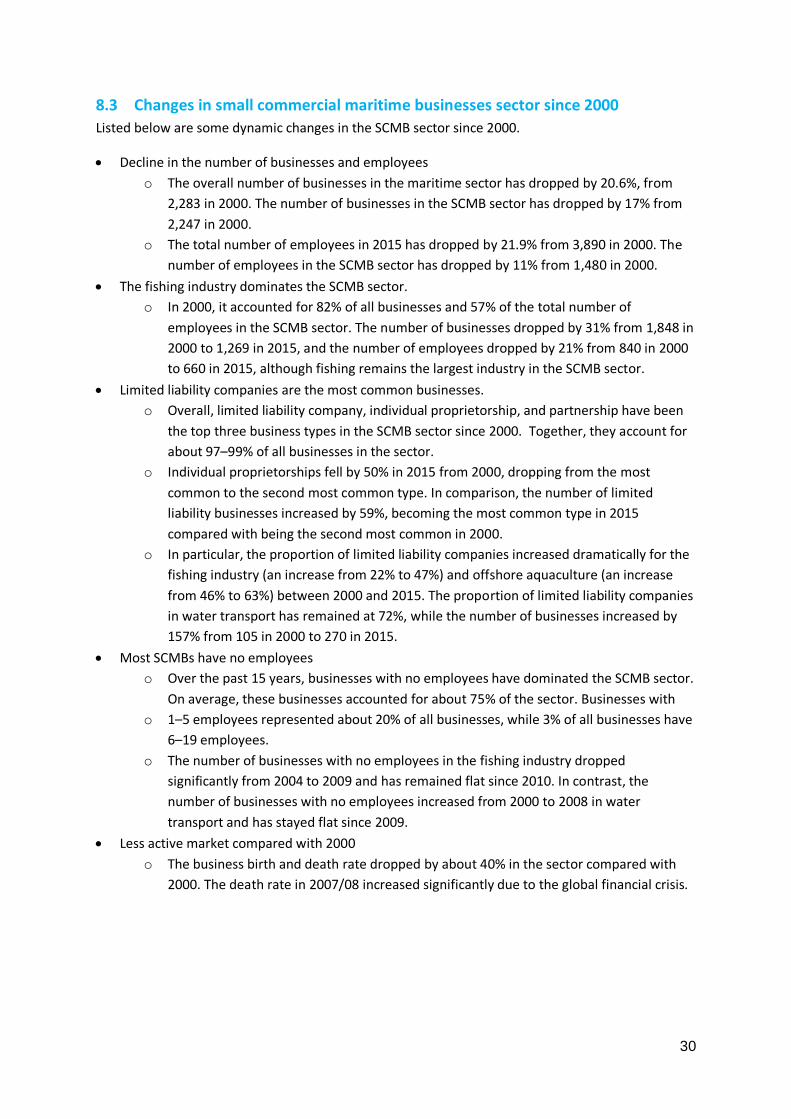
8.3 Changes in small commercial maritime businesses sector since 2000
Listed below are some dynamic changes in the SCMB sector since 2000.
Decline in the number of businesses and employees
o The overall number of businesses in the maritime sector has dropped by 20.6%, from
2,283 in 2000. The number of businesses in the SCMB sector has dropped by 17% from
2,247 in 2000.
o The total number of employees in 2015 has dropped by 21.9% from 3,890 in 2000. The
number of employees in the SCMB sector has dropped by 11% from 1,480 in 2000.
The fishing industry dominates the SCMB sector.
o In 2000, it accounted for 82% of all businesses and 57% of the total number of
employees in the SCMB sector. The number of businesses dropped by 31% from 1,848 in
2000 to 1,269 in 2015, and the number of employees dropped by 21% from 840 in 2000
to 660 in 2015, although fishing remains the largest industry in the SCMB sector.
Limited liability companies are the most common businesses.
o Overall, limited liability company, individual proprietorship, and partnership have been
the top three business types in the SCMB sector since 2000. Together, they account for
about 97–99% of all businesses in the sector.
o Individual proprietorships fell by 50% in 2015 from 2000, dropping from the most
common to the second most common type. In comparison, the number of limited
liability businesses increased by 59%, becoming the most common type in 2015
compared with being the second most common in 2000.
o In particular, the proportion of limited liability companies increased dramatically for the
fishing industry (an increase from 22% to 47%) and offshore aquaculture (an increase
from 46% to 63%) between 2000 and 2015. The proportion of limited liability companies
in water transport has remained at 72%, while the number of businesses increased by
157% from 105 in 2000 to 270 in 2015.
Most SCMBs have no employees
o Over the past 15 years, businesses with no employees have dominated the SCMB sector.
On average, these businesses accounted for about 75% of the sector. Businesses with
o 1–5 employees represented about 20% of all businesses, while 3% of all businesses have
6–19 employees.
o The number of businesses with no employees in the fishing industry dropped
significantly from 2004 to 2009 and has remained flat since 2010. In contrast, the
number of businesses with no employees increased from 2000 to 2008 in water
transport and has stayed flat since 2009.
Less active market compared with 2000
o The business birth and death rate dropped by about 40% in the sector compared with
2000. The death rate in 2007/08 increased significantly due to the global financial crisis.