Embed Size (px)
Citation preview

RESEARCH Open Access
A comparative quantitative study ofutilizing artificial intelligence on electronichealth records in the USA and China during2008–2017Xieling Chen1, Ziqing Liu2, Li Wei3, Jun Yan4, Tianyong Hao5* and Ruoyao Ding6*
From 2018 Sino-US Conference on Health InformaticsGuangzhou, China. 28 June - 01 July 2018
Abstract
Background: The application of artificial intelligence techniques for processing electronic health records data playsincreasingly significant role in advancing clinical decision support. This study conducts a quantitative comparison onthe research of utilizing artificial intelligence on electronic health records between the USA and China to discoverytheir research similarities and differences.
Methods: Publications from both Web of Science and PubMed are retrieved to explore the research status andacademic performances of the two countries quantitatively. Bibliometrics, geographic visualization, collaborationdegree calculation, social network analysis, latent dirichlet allocation, and affinity propagation clustering are applied toanalyze research quantity, collaboration relations, and hot research topics.
Results: There are 1031 publications from the USA and 173 publications from China during 2008–2017 period.The annual numbers of publications from the USA and China increase polynomially. JAMIA with 135 publications andJBI with 13 publications are the top prolific journals for the USA and China, respectively. Harvard University with101 publications and Zhejiang University with 12 publications are the top prolific affiliations for the USA andChina, respectively. Massachusetts is the most prolific region with 211 publications for the USA, while for China,Taiwan is the top 1 with 47 publications. China has relatively higher institutional and international collaborations. Ninemain research areas for the USA are identified, differentiating 7 for China.
Conclusions: There is a steadily growing presence and increasing visibility of utilizing artificial intelligence onelectronic health records for the USA and China over the years. The results of the study demonstrate the researchsimilarities and differences, as well as strengths and weaknesses of the two countries.
Keywords: Artificial intelligence, Electronic health records, Bibliometrics, Topic modelling, United States, China
* Correspondence: [email protected]; [email protected] of Computer Science, South China Normal University, Guangzhou, China6School of Information Science and Technology, Guangdong University ofForeign Studies, Guangzhou, ChinaFull list of author information is available at the end of the article
© The Author(s). 2018 Open Access This article is distributed under the terms of the Creative Commons Attribution 4.0International License (http://creativecommons.org/licenses/by/4.0/), which permits unrestricted use, distribution, andreproduction in any medium, provided you give appropriate credit to the original author(s) and the source, provide a link tothe Creative Commons license, and indicate if changes were made. The Creative Commons Public Domain Dedication waiver(http://creativecommons.org/publicdomain/zero/1.0/) applies to the data made available in this article, unless otherwise stated.
Chen et al. BMC Medical Informatics and Decision Making 2018, 18(Suppl 5):117https://doi.org/10.1186/s12911-018-0692-9

BackgroundWith the expanding use and increasing possibility ofincluding information relating to patient outcomes andfunctionality such as clinical decision support, ElectronicHealth Records (EHRs) becomes increasingly valuableinformation about patient health conditions andresponses to treatment over time [1]. The field of utiliz-ing artificial intelligence techniques on EHRs data pro-cessing has attracted increasing interests from scientificcommunity, reflected by the increasing of publicationsfrom major scientific literature databases such as Webof Science (WoS) and PubMed. The USA and China aretop 2 largest economies in the world. According toliterature retrieval in WoS, the two countries have themost publications the field in the last decade. Therefore,it is meaningful to conduct a quantitative analysis of theresearch publications from the two countries to comparetheir research similarities and differences, as well asstrengths and weaknesses.Research publication plays an important role in provid-
ing key linkage between knowledge generation, uptakeand use in the scientific process [2]. Bibliometrics involvesstatistical analysis of written publications. It has been themethod of choice for quantitative assessments of academicresearch to comprehensively explore the research ad-vances in the past and identify future research trends in aspecific field [3]. Bibliographic data from citation indexes,e.g., titles, journal, abstracts, author addresses, and etc.,are analyzed statistically to recognize the popularity andimpact of specific publications, authors, affiliations, or anentire field. Bibliometrics has been widely performed inthe evaluation of various research areas [4, 5]. Especially,it has also been adopted to the evolution of interdisciplin-ary research field, e.g., natural language processing inmedical research [6], natural language processing empow-ered mobile computing research [7], technology enhancedlanguage learning research [8], and text mining in medicalresearch [9].To that end, relevant publications in the field were re-
trieved from both WoS and PubMed to quantitativelyexplore the academic performances of the two countries
in terms of current research status, research intellectualstructures, and research focuses. Analyzing techniquesinclude bibliometrics, geographic visualization, collabor-ation degree calculation, social network analysis, latentdirichlet allocation, and affinity propagation clustering.Specifically, the following comparisons are conducted:
1) studying the quantitative distributions and growthcharacteristics of the publications, 2) identifying prolificpublication sources, authors, and affiliations, 3) explor-ing publication geographical distributions, 4) investigat-ing collaboration degrees and collaboration patterns, 5)visualizing scientific collaboration relations, and 6) dis-covering hot research topics and topic evolutions.
MethodsData sourcesThe publications in the research field during 2008–2017from WoS and PubMed databases were preferred. Witha list of search keywords determined by domain experts,as shown in Table 1, publications with “Article” typewere retrieved and downloaded as plain texts. Aftermanual review, 1031 records from the USA and 173records from China were obtained for comparison ana-lysis. Key elements including title, publication year,keywords, abstract, author address were extracted. Inaddition, corresponding affiliations and regions wereautomatically extracted from author address informa-tion. Key words from author keywords, Keywords Plus/PubMed MeSH, title, and abstract, were extracted byour developed natural language processing module.In addition to basic bibliometric analysis, the techniques
used in this paper include: geographic visualization,co-authorship index and collaboration degree calculation,social network analysis, and topic modelling analysis.
Geographic visualization analysisGeographic visualization [10] refers to a set ofvisualization technologies for supporting geospatialdata analysis. It provides ways to explore both the in-formation display and the data behind the informationitself to more readily view complex relations in images
Table 1 Search keywords related to “artificial intelligence” and “EHR”
Keywords related to “artificial intelligence” “artificial intelligence” OR “intelligent information processing” OR “machine learning” OR “pattern recognition” OR“information retrieval” OR “information extraction” OR “data mining” OR “text mining” OR “deep learning” OR“neural network” OR “natural language processing” OR “NLP” OR “semantic analysis” OR “question answering” OR“word sense disambiguation” OR “named entity recognition” OR “language modeling” OR “intelligent computing”OR “intelligent computation” OR “speech recognition” OR “smart learning” OR “knowledge graph” OR “automatedreasoning” OR “automated inference” OR “knowledge representation” OR “fuzzy logic” OR “bayesian network” OR“machine intelligence” OR “natural language generation” OR “natural language understanding” OR “bayesiannetworks” OR “neural networks” OR “classification algorithm” OR “clustering algorithm” OR “associationrule mining”
Keywords related to “EHRs” “electronic medical record” OR “clinical notes” OR “clinical summary” OR “discharge summary” OR “EMR” OR“medical data” OR “electronic patient record” OR “medical record” OR “medical records” OR “electronicmedical records” OR “electronic health record” OR “EHR” OR “electronic health records” OR “EHRs” OR“EMRs” OR “clinical note” OR “electronic patient records” OR “personal health record”
Chen et al. BMC Medical Informatics and Decision Making 2018, 18(Suppl 5):117 Page 56 of 127

[11, 12]. Geographic visualization works essentially byhelping people see the unseen more effectively in avisual environment than when using textual or numer-ical description. In this study, we apply geographicvisualization analysis to explore publication geograph-ical distributions in the USA and China, respectively.
Co-authorship index and collaboration degreeCo-authorship index shown as Eq. (1), was firstly elabo-rated by Schubert and Braun [13]. It is obtained by cal-culating proportionally the publications co-authored bysingle, two, multi- and mega-authors for different coun-tries. Here, the publications have been firstly dividedinto four categories according to author count, i.e.,single-author, two-author, multiple-author publicationswith three to four authors, and mega-author publica-tions with five or more authors.
CAI ¼ N ij=Nio� �
Noj=Noo� �� 100 ð1Þ
In the equation, Nij is the publication count co-authoredby j authors in the ith country, Nio is the publication countin the ith country, Noj is the publication count co-authoredby j authors in all countries, Noo is the publicationcount in all countries. CAI = 100 represents the aver-age level. CAI > 100 indicates higher than the average,while CAI < 100 reflects lower than the average.As a measure of scientific research’s connective rela-
tion to the level of author, affiliation, or country, the col-laboration degree can be calculated as Eq. (2) [14, 15].
CAi ¼PN
j¼1α j
Nð2Þ
In the equation, CAi indicates the collaboration degreeof the i year in the author, affiliation or country level. αjdonates the count of author, affiliation or country foreach publication. N is the annual publication count.In this study, co-authorship index is used to study col-
laboration patterns of authors, and collaboration degreeis applied to measure the scientific research’s connectiverelation to the three levels.
Social network analysisSocial network analysis (SNA) focuses on the structureof ties within, e.g., persons, organizations, or the prod-ucts of human activity or cognition such as web sites[16]. SNA works based mainly on networks and graphtheory [17], and it provides both a visual and a mathem-atical analysis of human relations. In this study, thecollaboration relations for authors, affiliations and coun-tries are explored using social network analysis. In thenetwork, the nodes are specific authors, affiliations orcountries, and the lines are the collaboration relations.
The size of node indicates the publication count of aspecific author, affiliation or country. The width of linkindicates the collaboration frequency between the twoauthors, affiliations or countries.
Topic modelling analysisTopic modeling extracts semantic information from acollection of texts using statistical algorithms. LatentDirichlet Allocation (LDA) is an improved three-layerBayesian model developed by Blei et al. [18]. In LDA,each document in the text corpus is modeled as a set ofdraws from a mixture distribution over a set of hiddentopics, where topics are assumed to be uncorrelated andeach is characterized by a distribution over words. InLDA, a word is defined as an item from a vocabularyindexed by {1,…,V}, a document is a sequence of Nwords denoted by d = (w1,…, wN), and a corpus is a col-lection of M documents denoted by D = {d1,…, dM}. Thegeneration process is as follows: 1) The term distributionβ indicating the probability of a word occurring in agiven topic is as β~Dirichlet(δ); 2) The proportions θ ofthe topic distribution for a document d are determinedby θ~Dirichlet(α); 3) A topic is chosen by the distribu-tion zi~Multinomial(θ) for each word wi in the docu-ment d, and a word is chosen from a multinomialprobability distribution conditioned on the topic zi :p(wi| zi, β). As for variational expectation-maximization,the log-likelihood for one document d ∈D is given byEq. (3), and the likelihood for Gibbs sampling estimationwith k topics is as Eq. (4).
ℓ α; βð Þ ¼ log p djα; βð Þð Þ
¼ logZ X
z
YN
i¼1p wijzi; βð Þp zijθð Þ
h in op θjαð Þdθ
ð3Þ
log p djzð Þð Þ ¼ k logΓ Vδð ÞΓ δð ÞV
!
þXk
K¼1("XV
j¼1log Γ n jð Þ
K þ δ� �� �
#
− log Γ n :ð ÞK þ Vδ
� �� �)
ð4Þ
Further, Affinity Propagation (AP) clustering is usedfor the cluster analysis of the topics identified by LDA.AP was proposed by Frey and Dueck [19] with a basis ofmessage passing. It does not require users to set clustercount in advance, but considers all data points to bepotential exemplars and transmits real-valued messagesrecursively until a set exemplars of high-quality emerges
Chen et al. BMC Medical Informatics and Decision Making 2018, 18(Suppl 5):117 Page 57 of 127

[20]. AP was found to identify clusters with lower errorrate and less time [21].AP calculates the “responsibility” r(i, k) and the “avail-
ability” a(i, k), shown as Eqs. (5) and (6) for each node iand each candidate exemplar k. r(i, k) is the suitablenessof k as an exemplar for i, while a(i, k) is the evidencethat i should choose k as an exemplar.
r i; kð Þ←s i; kð Þ− maxk 0:k 0≠k
a i; k 0ð Þ þ s i; k 0ð Þf g ð5Þ
a i; kð Þ← minf0; r k; kð Þ þX
i0:i0∉ i;kf g max 0; r i0; kð Þf ggð6Þ
In the equations, s(i, k) is the similarity between twonodes i and k. When a good set of exemplars emerges,Eqs. (5) and (6) will stop iterating. Each node i can thenbe assigned to the exemplar k that maximizes a(i, k) +r(i, k). If i = k, then i is an exemplar. Numerical oscilla-tions is controlled using a damping factor between 0and 1.In this study, words from author keywords and Key-
words Plus/PubMed MeSH, publication title, as well asabstract with weights 0.4, 0.4, and 0.2 determined by ourformer study [6] are used as analysis units in topic mod-elling analysis. Term Frequency-Inverse Document Fre-quencies (TF-IDF) is used to filter out unimportantterms.
ResultsGrowth of publicationsThe distributions of total publications by year for the USAand China are shown in Fig. 1. The publication counts forboth two countries are overall showing increasing trendsin fluctuation. The average publications during the studyperiod are 103.1 and 17.3 articles per year. The highestproductivity is observed in 2017 with a total of 205(19.88%) articles for the USA and 44 (25.43%) articles forChina. The annual growth rates reach 26.18 and 40.54%on average for the USA and China, respectively. The trendof publications for the USA is similar with the polynomialcurve (p < 0.05, R2 = 95.07%) expressed as y = 1.113636x2− 4463.762x + 4473014, while the publication trend forChina is similar with the polynomial curve (p < 0.05, R2 =84.86%) expressed as z = 0.3674242x2 − 1475.01x +1480346. With the simulation curves, the future product-ivity can be predicted. The predictive values for year 2018for the USA and China are 230 and 47, respectively.
Prolific publication sourcesThe 1031 records from the USA are published in 347unique journal or conference proceeding sources, and 92publication sources contribute to China’s 173 publica-tions. The top 16 publication sources for the USA inTable 2 account for 49.08% of the total publications, andthe 14 prolific ones for China contribute to 43.35% ofthe total publications. The top 3 publication sources forthe USA are Journal of the American Medical Informat-ics Association, Journal of Biomedical Informatics, and
Fig. 1 The distributions of total publications by year
Chen et al. BMC Medical Informatics and Decision Making 2018, 18(Suppl 5):117 Page 58 of 127

AMIA Annual Symposium Proceedings. As for China,the top 3 prolific ones are Journal of Biomedical Inform-atics, Journal of Biomedical Engineering, and Studies inHealth Technology and Informatics.
Prolific authors and affiliationsThree thousand three hundred fifty authors and 542 affili-ations from the USA contribute to the 1031 publications,and 635 authors and 208 affiliations from China for the173 publications. Table 3 shows prolific authors withJoshua C. Denny (53 publications), Hongfang Liu (36 pub-lications), Guergana Savova (34 publications), Hua Xu (32publications), and Christopher G. Chute (28 publications)as the top 5 for the USA. As for China, Buzhou Tang (7publications) and Jianbo Lei (6 publications) are the top 2.
Table 4 lists top prolific affiliations, where HarvardUniversity with 101 publications is ranked at 1st forthe USA. Other prolific affiliations include VanderbiltUniversity with 96 publications and Mayo Clinic with93 publications. As for China, the top 3 are ZhejiangUniversity, National Taiwan University, and ChinaAcademy of Chinese Medical Sciences.
Geographical distribution of publicationsWe study the concentration of researches in the USAand China at regional levels. The spatial characteristicsof the publications from the two countries are explored.46 states in the USA involve in the 1031 publicationsand 25 regions in China contribute to the 173 publications.
Table 2 Prolific publication sources
R Prolific publication sources for the USA TP P% R Prolific publication sources for China TP P%
1 Journal of the American Medical Informatics Association 135 13.09 1 Journal of Biomedical Informatics 13 7.51
2 Journal of Biomedical Informatics 96 9.31 2 Journal of Biomedical Engineering 6 3.47
3 AMIA Annual Symposium Proceedings 65 6.30 3 Studies in Health Technology and Informatics 6 3.47
4 Studies in Health Technology and Informatics 29 2.81 4 China Journal of Chinese Materia Medica 6 3.47
5 International Journal of Medical Informatics 28 2.72 5 Computer Methods and Programs in Biomedicine 5 2.89
6 PLoS One 27 2.62 6 Expert Systems with Applications 5 2.89
7 BMC Medical Informatics and Decision Making 20 1.94 7 IEEE Access 5 2.89
8 AMIA Joint Summits on Translational Science Proceedings 19 1.84 8 Journal of the American Medical Informatics Association 5 2.89
9 Applied Clinical Informatics 18 1.75 9 Artificial Intelligence in Medicine 4 2.31
10 Artificial Intelligence in Medicine 14 1.36 10 BMC Medical Informatics and Decision Making 4 2.31
11 JMIR Medical Informatics 12 1.16 11 Journal of Medical Systems 4 2.31
12 Journal of Biomedical Semantics 10 0.97 12 Knowledge-based Systems 4 2.31
13 Yearbook of Medical Informatics 9 0.87 13 PLoS One 4 2.31
14 IEEE Journal of Biomedical and Health Informatics 8 0.78 14 Chinese Journal of Integrated Traditional and Western Medicine 4 2.31
15 Journal of Medical Systems 8 0.78
16 Medical Care 8 0.78
Table 3 Top prolific authors
the USA China
Rank Name Country TP Rank Name Country TP
1 Joshua C. Denny the USA 53 1 Buzhou Tang China 7
2 Hongfang Liu the USA 36 2 Jianbo Lei China 6
3 Guergana Savova the USA 34 3 Hong-Jie Dai China 4
4 Hua Xu the USA 32 4 Huabing Zhang China 4
5 Christopher G. Chute the USA 28 5 Jingchi Jiang China 4
6 Nigam H. Shah the USA 22 6 Qingcai Chen China 4
7 Matthew Samore the USA 21 7 Simon Fong China 4
8 Isaac S. Kohane the USA 20 8 Xiaolong Wang China 4
9 Shawn N. Murphy the USA 19 9 Yi Guan China 4
10 Carol Friedman the USA 18 10 Zengjian Liu China 4
11 Peter Szolovits the USA 18 11 Zhengxing Huang China 4
Chen et al. BMC Medical Informatics and Decision Making 2018, 18(Suppl 5):117 Page 59 of 127

The geographical distributions are shown as Figs. 2 and 3,respectively. The figures display that the USA and China’publications vary widely across the whole country. As forthe USA, the top 5 prolific states are Massachusetts (211publications), New York (173 publications), California(161 publications), Minnesota (122 publications), andTennessee (102 publications). As for China, the top 5 re-gions are Taiwan (47 publications), Beijing (46 publica-tions), Guangdong (22 publications), Shanghai (17
publications), and Zhejiang (16 publications). The publica-tions authored by Chinese and the USA’s scholars areshown in Table 5 by top regions. For exploring the struc-tures and dynamics of the publications, we split the wholeperiod into two 5-year phases: 2008–2012 and 2013–2017. In the two different phases, Massachusetts, NewYork, California, and Minnesota always appear among thetop 5 for the USA. As for China, Taiwan and Beijing arealways at the top 2 places.
Alabama
ArizonaArkansas
California Colorado
Connecticut
Delaware
Florida
Georgia
Idaho
Illinois Indiana
Iowa
Kansas Kentucky
Louisiana
Maine
Maryland
MassachusettsMichigan
Minnesota
Mississippi
Missouri
Montana
Nebraska
Nevada
New hampshire
New jersey
New mexico
New York
North Carolina
North Dakota
Ohio
Oklahoma
Oregon
Pennsylvania
Rhode island
South carolina
South dakota
Tennessee
Texas
Utah
Vermont
Virginia
Washington
West Virginia
Wisconsin
Wyoming
050100150200
Pub. count
Fig. 2 Geographical distributions of the publications in the USA
Table 4 Top prolific affiliations
Rank Name Country TP Rank Name Country TP
1 Harvard University the USA 101 1 Zhejiang University China 12
2 Vanderbilt University the USA 96 2 National Taiwan University China 10
3 Mayo Clinic the USA 93 3 China Academy of Chinese Medical Sciences China 9
4 University of Utah the USA 82 4 Peking University China 8
5 Columbia University the USA 72 5 Tsinghua University China 8
6 Brigham and Women’s Hospital the USA 63 6 Chinese Academy of Sciences China 7
7 Stanford University the USA 53 7 Harbin Institute of Technology, Shenzhen China 7
8 Massachusetts General Hospital the USA 48 8 National Taiwan University Hospital China 6
9 Partners Healthcare Inc the USA 48 9 Shanghai Jiao Tong University China 6
10 University of Texas at Houston the USA 43 10 University of Macau China 6
Chen et al. BMC Medical Informatics and Decision Making 2018, 18(Suppl 5):117 Page 60 of 127

Authorship pattern and collaborationThe profiles of CAI for the USA and China have been il-lustrated in Fig. 4. It is clearly indicated that CAIs ofmulti- and mega-author publications in the researchfiled in China are slightly higher than the average. How-ever, the CAIs of multi- and mega-author publications inthe USA are lower than the average. Figure 5 shows thecollaboration degrees at the country, affiliation andauthor levels in the two countries. On the whole, theinternational collaboration degree is growing relativelyslowly than the author and affiliation collaboration de-grees. On average, 5.83 authors, 2.63 affiliations and1.18 countries participate in each publication from theUSA. As for China, on average each publication has5.79 authors, 2.84 affiliations and 1.39 countries. Theaverage degrees of affiliation and country for China’spublications are higher than that for the USA’s
publications, while the average degrees of author is onthe contrary.The collaboration among countries/regions for the
USA’s publications is then visualized as Fig. 6 (access viathe link [22]). From the figure, the USA (the largest nodein blue color) in the center of the network has the mostcollaborations with other countries/regions. The USA-China collaboration (the thickest line) is ranked at 1st.The collaboration networks among affiliations with publi-cations > = 15 (access via the link [23]) and among authorswith publications > = 12 (access via the link [24]) are alsovisualized. Furthermore, we also visualize the collabora-tions for China’s publications including country/regioncollaboration (access via the link [25]), collaborationamong affiliations with publications > = 3 (access via thelink [26]), and collaboration among authors with publica-tions > = 3 (access via the link [27]). By accessing to the
Beijing
Shanghai
Tianjin
Chongqing
Heilongjiang
Jilin
Liaoning
Inner Mongolia
Hebei
Shandong
HenanShaanxi
Gansu
Ningxia
Qinghai
Xinjiang
Anhui
Zhejiang
HunanJiangxi
HubeiSichuan
Guizhou FujianTaiwan
Guangdong
Hainan
Guangxi
Yunnan
Tibet
Hong Kong010203040
Pub. count
Fig. 3 Geographical distributions of the publications in China
Chen et al. BMC Medical Informatics and Decision Making 2018, 18(Suppl 5):117 Page 61 of 127
dynamic networks, through simply clicking the nodes,users can explore the collaboration relations for specificcountries/regions, affiliations, or authors.
Topic generation and clusteringBy setting TF-IDF value threshold as 0.1, top used termsin the author keywords, Keywords Plus/PubMed MeSH,title, and abstract of the publications are ranked by fre-quency. The top 5 terms and their frequencies for theUSA are Drug (483), Medication (411), Cancer (370),Adverse (362), and Phenotype (275), while the top termsfor China are Risk (195), Medicine (125), Drug (107),Cancer (76), and Diabetes (71). Figures 7 and 8 present
the perplexities of models fitted using Gibbs samplingwith different topic counts. The results suggest that theoptimal topic count can be set to 35 for both the USAand China. The α is then set to 0.01339416 for the USAand 0.008163102 for China. We estimate the LDAmodels using Gibbs sampling with the parameters.Potential themes are assigned to each topic throughsemantics analysis of representative terms and textintention reviewing. Table 6 displays the top 5 bestmatching topics for the USA including Drug adverseevent,Vaccine, Diabetes mellitus, Health data confidenti-ality, and Health data analysis technique, while the top5 for China are Named entity recognition, Drug adverse
Fig. 4 Sketch map of collaboration patterns reflected by CAI
Table 5 Regional distributions of publicationsCountry the USA China
PeriodNum.
2008–20171031
2008–2012269
2013–2017762
2008–2017173
2008–201238
2013–2017135
Rank Region Num. Region Num. Region Num. Region Num. Region Num. Region Num.
1 Massachusetts 211 New York 45 Massachusetts 169 Taiwan 47 Taiwan 15 Beijing 38
2 New York 173 Massachusetts 42 California 129 Beijing 46 Beijing 8 Taiwan 32
3 California 161 Minnesota 37 New York 128 Guangdong 22 Hong Kong 3 Guangdong 21
4 Minnesota 122 Tennessee 36 Minnesota 85 Shanghai 17 Sichuan 3 Shanghai 16
5 Tennessee 102 California 32 Pennsylvania 81 Zhejiang 16 Zhejiang 3 Zhejiang 13
6 Pennsylvania 98 Utah 27 Texas 68 Jiangsu 11 Heilongjiang 2 Jiangsu 10
7 Utah 90 Maryland 17 Tennessee 66 Heilongjiang 9 Macau 2 Hubei 8
8 Maryland 81 Pennsylvania 17 Maryland 64 Hubei 8 Chongqing 1 Heilongjiang 7
9 Texas 78 Washington 16 Utah 63 Chongqing 7 Gansu 1 Chongqing 6
10 Washington 72 Indiana 14 Washington 56 Sichuan 7 Guangdong 1 Henan 5
11 Illinois 51 Wisconsin 13 Ohio 42 Hong Kong 6 Jiangsu 1 Macau 4
12 Indiana 45 Illinois 11 Illinois 40 Macau 6 Shaanxi 1 Sichuan 4
13 Ohio 45 Florida 10 Indiana 31 Henan 5 Shandong 1 Hong Kong 3
14 Michigan 38 Michigan 10 Michigan 28 Shaanxi 4 Shanghai 1 Jilin 3
Chen et al. BMC Medical Informatics and Decision Making 2018, 18(Suppl 5):117 Page 62 of 127

Fig. 5 Annual collaboration degree distributions
Fig. 6 Collaboration network in country level for the USA’s publications
Chen et al. BMC Medical Informatics and Decision Making 2018, 18(Suppl 5):117 Page 63 of 127

event, Smoking, Prescription & drug, and Risk event. TheAP clustering results based on term-topic posteriorprobability matrix are shown in Figs. 9 and 10, wherethe 35 topics for the USA are categorized into 9 groups,and the 35 topics for China are categorized into 7groups. For identifying emerging research topics, wefirstly assign each publication to the topic with the high-est posterior probability. We then explore the trends ofresearch topics shown in Figs. 11 and 12. We also con-duct Mann–Kendall test [28] to examine whether topicspresent increasing or decreasing trends.
DiscussionIn this study, a comparative quantitative analysis of lit-erature of utilizing artificial intelligence on electronichealth records in the USA and China are conducted.This study identifies 1031 publications from the USAand 173 publications from China for the comparative
analysis. Significant and polynomial increases in publica-tion counts for both two countries can be found. Thisreflects a growing interest in the research field. However,the publication count of China is not at par with that ofthe USA, this can also be reflected by Tables 3 and 4,where the top prolific authors and affiliations of theUSA own relatively more publications than that ofChina. Most prolific publication sources are journals,while only some are conferences such as AMIA AnnualSymposium Proceedings, indicating a wide influence ofjournal in the research field. From the publication distri-butions in region levels, it is obvious that for both theUSA and China, most top prolific regions are also ofeconomic prosperity.From the authorship pattern analysis, it is found that
publications published by scientists in the research fieldin China prefer to work in larger collaboration groups.This is consistent with the finding of Guan and Ma [29]
Fig. 7 Left: estimated α value for the models fitted using VEM. Right: perplexities of the test data for the models fitted by using Gibbs sampling. Eachline corresponded to one of the folds in the 10-fold cross-validation for the USA’s publications
Fig. 8 Left: estimated α value for the models fitted using VEM. Right: perplexities of the test data for the models fitted by using Gibbs sampling. Eachline corresponded to one of the folds in the 10-fold cross-validation for China’s publications
Chen et al. BMC Medical Informatics and Decision Making 2018, 18(Suppl 5):117 Page 64 of 127

Table 6 15 selected top terms for the top 5 best matching topics
Country Topic Potential theme Top high frequency terms
the USA 3 Drug adverse event Drug; Adverse; Reaction; Pharmacovigilance; Safety; Signal; Adverse drug event; Interaction;allergy; Surveillance; Drug-drug; Spontaneous; Adverse drug reaction; Food and drugadministration; Drug-drug interaction
31 Vaccine Vaccine; Safety; Adverse; Surveillance; Influenza; Vaccine adverse event reporting system;Adverse Even; Syndromic; Immunization; Emergency; Inactivated; Drug; Post-licensure;Anaphylaxis; Injection
30 Diabetes mellitus Diabetes; Mellitus; Diabetic; Ensemble; Visualization; Deterioration; Fit; Neural; Type 2 diabetesmellitus; Insulin; Support vector machine; Warning; Metformin; Glucose; Nephropathy
27 Health data confidentiality De-identification; Annotation; Corpus; Protected health information; Privacy; Annotator;Confidentiality; Comorbidity; Portability; Obesity; Security; Track; Anonymization; Veteranshealth administration; Health insurance portability and accountability act
18 Health data analysis technique Semantic; Terminology; Ontology; Similarity; Biomedical; Unified medical language system; Corpus;Mapping; Topic; Redundancy; Lexicon; Reasoning; Relatedness; Lexical; Nomenclature
China 33 Named entity recognition Chinese; Entity; Word; Note; Discharge; Embedding; Annotation; Segmentation; Negation;Speculation; Conditional; Named entity recognition; Character; Deep; F-measure
23 Drug adverse event Risk; Statin; Adverse; Discontinuation; Cardiovascular; Event; Reaction; Heart; Coronary; Drug;Lipid-lowering; Medication; Therapy; Artery; Cardiovascular disease
30 Smoking Smoking; Mental; Status; Prevalence; Electric; Aged; Disorder; Open-text; Hybrid electric vehicle;CRIS-IE-Smoking; Electronic health record; Fuzzy; Logic; Bipolar; Male
26 Prescription & drug Prescription; Symptom; Medicine; Aspirin; Chinese; Knowledge base; Medication; Drug; Protective;Similarity; Diarrhoea; Gastrointestinal; Low-dose; Mucoprotective drug; Regularity
14 Risk event Congestive heart failure; Drug; Risk; Web-based; Health information exchange; Chronic; Emergencydepartment; Deficiency; Cluster; Failure; Gastritis; Real-time; Congestive; Heart; Children of severehand, foot, and mouth disease
Fig. 9 AP clustering result of the identified clusters for the USA’s publications
Chen et al. BMC Medical Informatics and Decision Making 2018, 18(Suppl 5):117 Page 65 of 127
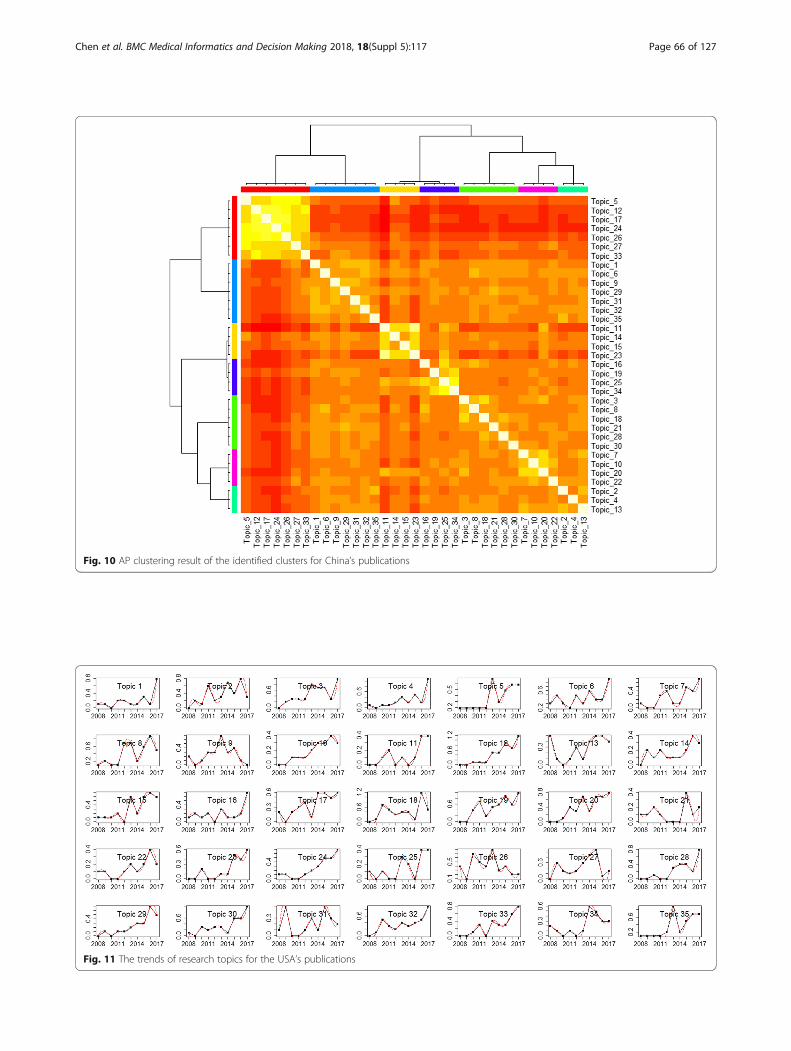
Fig. 10 AP clustering result of the identified clusters for China’s publications
Fig. 11 The trends of research topics for the USA’s publications
Chen et al. BMC Medical Informatics and Decision Making 2018, 18(Suppl 5):117 Page 66 of 127

that researchers have becoming more and more aware ofthe importance of collaboration. Comparatively, re-searchers in the USA prefer working with less collabor-ation. The collaboration degree analysis shows thatauthors or affiliations tend to collaborate more withthose within the same country. Also, there are relativelymore affiliations and countries participating in one pub-lication on average for China than that for the USA. TheUSA and China are closest collaborators for each other.Through topic modelling and clustering analysis, the
35 identified topics for the USA’s research are catego-rized into 9 areas including Thrombosis, Health dataprivacy & confidentiality, Drug adverse event & vaccine,Imaging, Disease, Audio-visual function, Application ofBayesian, Clinical data analysis technique, and Nurs-ing. Meanwhile, the 35 identified topics for China’s re-search are classified into 7 areas including Cancer,Imaging, Clinical decision support, Drug & risk event,Chinese medicine, Gestational diabetes mellitus, andClinical data analysis techniques. The results demon-strate the similarities and differences of the researchbetween the two countries. From Figs. 11 and 12, aswell as Mann–Kendall test, 20 topics for the USAincluding Diabetes mellitus, Heart failure, Health dataprivacy & confidentiality, and etc., present statisticallysignificant increasing trends at the two-sided p = 0.05level. The same is for 6 topics for China, includingNamed entity recognition, Risk event, Chinese medicine,Brain imaging, Drug adverse event, and Cancer. As anemerging focus in drug and cancer research topics,drug resistance has currently been one of the biggestobstacles in the treatment of cancers in clinical practice
[30]. Some existing examples of cancer drug resistanceresearch are as follows. Sun et al. [31] proposed a novelstochastic model connecting cellular mechanismsunderlying cancer drug resistance to population-levelpatient survival for the examination of therapy-induceddrug resistance and cancer metastasis. Sun and Hu [30]conducted a systematic review on the literature ofmathematical modeling approaches and computationalprediction methods for cancer drug resistance.In this study, there are some limitations that are inher-
ent to the database used and to search query developedby the authors. Such limitations were also encounteredin the existing bibliometric studies, e.g., [32, 33]. Firstly,despite the fact that WoS is a widely applied repositoryfor bibliometric analysis and PubMed is an importantdata source on life sciences and biomedical topics, thereare still unindexed conference proceedings and journalarticles. Secondly, we treat publications of journal andconference types equally important in the analysis ratherthan bestowing weights for publications of differenttypes. Furthermore, since no search query is 100% per-fect, thus false positive and false negative results arealways a possibility. In addition, the ranking of authorsand affiliations in the study is based on data presentedby WoS and PubMed. However, it is possible that someauthors or affiliations might have different name spellingor more than one names, which might lead to aninaccuracy in the productivity of these authors or affilia-tions. Despite all these limitations, our study is the firstto conduct a quantitative analysis of the research publi-cations of utilizing artificial intelligence on electronichealth records from the USA and China to compare
Fig. 12 The trends of research topics for China’s publications
Chen et al. BMC Medical Informatics and Decision Making 2018, 18(Suppl 5):117 Page 67 of 127

their research similarities and differences, as well asstrengths and weaknesses. The findings of our study canpotentially help relevant researchers, especially new-comers, understand and compare the research perform-ance and recent development in the USA and China,especially, as well as optimize research topic decision tokeep abreast of current research hotspots.
ConclusionsUtilizing artificial intelligence techniques on EHRsresearch is an emerging and promising field. This re-search provides a most up-to-date quantitative analysisfor exploring and comparing the research performanceand development trends of the research field from theUSA and China during the period 2008–2017. Results ofthis exploration present a comprehensive overview andan intellectual structure of the research, especially,research topics, for the two countries in the last decade.
AbbreviationsAP: Affinity propagation; EHRs: Electronic Health Records; LDA: Latent dirichletallocation; MeSH: Medical Subject Headings; SNA: Social network analysis; TF-IDF: Term Frequency-Inverse Document Frequencies; USA: United States;WoS: Web of Science
AcknowledgementsNot applicable.
FundingPublication of the article is supported by grants from National Natural ScienceFoundation of China (61772146), Guangzhou Science Technology andInnovation Commission (201803010063), Natural Science Foundation ofGuangdong Province (2018A030310051), and the Science and Technology Planof Guangzhou (201804010296).
Availability of data and materialsThe datasets used and analyzed during the current study are available fromthe corresponding author upon reasonable requests.
About this supplementThis article has been published as part of BMC Medical Informatics and DecisionMaking Volume 18 Supplement 5, 2018: Proceedings from the 2018 Sino-USConference on Health Informatics. The full contents of the supplement areavailable online at https://bmcmedinformdecismak.biomedcentral.com/articles/supplements/volume-18-supplement-5.
Authors’ contributionsXLC leaded the method application, experiment conduction and the resultanalysis. ZQL participated in the design of the research and the revision of themanuscript. LW participated in the manuscript revision. JY participated in themanuscript revision. TYH provided theoretical guidance, the key term extractionprogram development and the revision of this paper. RYD participated in themanuscript revision. All authors read and approved the final manuscript.
Ethics approval and consent to participateNot applicable.
Consent for publicationNot applicable.
Competing interestsThe authors declare that they have no competing interests.
Publisher’s NoteSpringer Nature remains neutral with regard to jurisdictional claims in publishedmaps and institutional affiliations.
Author details1College of Economics, Jinan University, Guangzhou, China. 2The SecondClinical Medical College, Guangzhou University of Chinese Medicine,Guangzhou, China. 3The First Affiliate Hospital of Guangzhou MedicalUniversity, Guangzhou, China. 4AI Lab, Yidu Cloud (Beijing) Technology Co.Ltd., Beijing, China. 5School of Computer Science, South China Normal University,Guangzhou, China. 6School of Information Science and Technology, GuangdongUniversity of Foreign Studies, Guangzhou, China.
Published: 7 December 2018
References1. Patel VL, Shortliffe EH, Stefanelli M, Szolovits P, Berthold MR, Bellazzi R,
Abu-Hanna A. The coming of age of artificial intelligence in medicine.Artif Intell Med. 2009;46(1):5–17.
2. Clements CJ, Watkins M, de Quadros C, Biellik R, Hadler J, McFarland D, et al.Researching routine immunization–do we know what we Don’t know?Vaccine. 2011;29(47):8477–82.
3. Wiysonge CS, Uthman OA, Ndumbe PM, Hussey GD. A bibliometricanalysis of childhood immunization research productivity in Africa sincethe onset of the expanded program on immunization in 1974. BMCMed. 2013;11(1):66.
4. Chen XL, Chen BY, Zhang CX, Hao TY. Discovering the recent research innatural language processing field based on a statistical approach. LectNotes Comput Sci. 2017;10676:507–17.
5. Chen XL, Weng H, Hao TY. A data-driven approach for discovering therecent research status of diabetes in China. Lect Notes Comput Sci. 2017;10594:89–101.
6. Chen XL, Xie HR, Wang FL, Liu ZQ, Xu J, Hao TY. A bibliometric analysis ofnatural language processing in medical research. BMC Med Inform DecisMak. 2018;18(1):14.
7. Chen XL, Ding RY, Xu K, Wang S, Hao TY, Zhou Y. A bibliometric review ofnatural language processing empowered mobile computing. WirelCommun Mob Comput. 2018;2018:1-21.
8. Chen XL, Hao JT, Hua SS, Hao TY. A bibliometric analysis of the researchtrends of technology enhanced language learning. Lect Notes Comput Sci.2018;11284:169–79.
9. Hao TY, Chen XL, Li GZ, Yan J. A Bibliometric analysis of text Mining inMedical Research. Soft Comput. 2018; pp. 1–18.
10. Kraak MJ, Ormeling FJ. Cartography: visualization of spatial data. 3rd ed.New York: Guilford Publications; 2010.
11. Cartwright W, Miller S, Pettit C. Geographical visualization: past, present andfuture development. J Spat Sci. 2004;49(1):25–36.
12. Dodge M, McDerby M, Turner M. Geographic visualization: concepts, toolsand applications. Chichester: Wiley; 2008.
13. Schubert A, Braun T. Relative indicators and relational charts forcomparative assessment of publication output and citation impact.Scientometrics. 1986;9(5–6):281–91.
14. Zhang K, Wang Q, Liang QM, Chen H. A bibliometric analysis ofresearch on carbon tax from 1989 to 2014. Renew Sust Energ Rev.2016;58:297–310.
15. Wei YM, Mi ZF, Zhang H. Progress of integrated assessment models forclimate policy. Syst Eng Theory Pract. 2013;33(8):1905–15.
16. McGloin JM, Kirk DS. Social network analysis. In Handbook of quantitativecriminology. New York: Springer; 2010. p. 209–24.
17. Otte E, Rousseau R. Social network analysis: a powerful strategy, also for theinformation sciences. J Inf Sci. 2002;28(6):441–53.
18. Blei DM, Ng AY, Jordan MI. Latent Dirichlet allocation. J Mach Learn Res.2003;3(Jan):993–1022.
19. Frey BJ, Dueck D. Clustering by passing messages between data points.Science. 2007;315(5814):972–6.
20. Frey BJ, Dueck D. Response to comment on “clustering by passingmessages between data points”. Science. 2008;319(5864):726.
21. El-Samak AF, Ashour W. Optimization of traveling salesman problem usingaffinity propagation clustering and genetic algorithm. J Artif Intell SoftComput Res. 2015;5(4):239–45.
Chen et al. BMC Medical Informatics and Decision Making 2018, 18(Suppl 5):117 Page 68 of 127

22. The Network of Countries/Regions for the USA. http://www.zhukun.org/haoty/resources.asp?id=JBMC2_US_country. Accessed 10 July 2018.
23. The Network Affiliations with Publications >= 15 for the USA. http://www.zhukun.org/haoty/resources.asp?id=JBMC2_US_affiliation. Accessed 10 July 2018.
24. The Network of Authors with Publications >= 12 for the USA. http://www.zhukun.org/haoty/resources.asp?id=JBMC2_US_author. Accessed 10July 2018.
25. The Network of Countries/Regions for China. http://www.zhukun.org/haoty/resources.asp?id=JBMC2_CN_country. Accessed 10 July 2018.
26. The Network of Affiliations with Publications >= 3 for China. http://www.zhukun.org/haoty/resources.asp?id=JBMC2_CN_affiliation. Accessed10 July 2018.
27. The Network of Authors with Publications >= 3 for China. http://www.zhukun.org/haoty/resources.asp?id=JBMC2_CN_author. Accessed 10 July2018.
28. Mann HB. Nonparametric tests against trend. Econometrica. 1945;13(3):245–59.29. Guan J, Ma NA. Comparative study of research performance in computer
science. Scientometrics. 2004;61(3):339–59.30. Sun X, Hu B. Mathematical Modeling and Computational prediction of
Cancer drug resistance. Brief Bioinform. 2017. pp. 1–18.31. Sun X, Bao J, Shao Y. Mathematical modeling of therapy-induced Cancer
drug resistance: connecting Cancer mechanisms to population survivalrates. Sci Rep. 2016;6:22498.
32. Sweileh M. Global research trends of World Health Organization’s top eightemerging pathogens. Glob Health. 2017;13(1):9.
33. Sweileh WM. Bibliometric analysis of literature on toxic epidermal necrolysisand Stevens-Johnson syndrome: 1940–2015. Orphanet J Rare Dis. 2017;12(1):14.
Chen et al. BMC Medical Informatics and Decision Making 2018, 18(Suppl 5):117 Page 69 of 127