Embed Size (px)
Citation preview
RESEARCH ARTICLE Open Access
Comparative phylogeography of two relatedplant species with overlapping ranges in Europe,and the potential effects of climate change ontheir intraspecific genetic diversityGemma E Beatty, Jim Provan*
Abstract
Background: The aim of the present study was to use a combined phylogeographic and species distributionmodelling approach to compare the glacial histories of two plant species with overlapping distributions, Orthiliasecunda (one-sided wintergreen) and Monotropa hypopitys (yellow bird’s nest). Phylogeographic analysis was carriedout to determine the distribution of genetic variation across the range of each species and to test whether bothcorrespond to the “classic” model of high diversity in the south, with decreasing diversity at higher latitudes, orwhether the cold-adapted O. secunda might retain more genetic variation in northern populations. In addition,projected species distributions based on a future climate scenario were modelled to assess how changes in thespecies ranges might impact on total intraspecific diversity in both cases.
Results: Palaeodistribution modelling and phylogeographic analysis using multiple genetic markers (chloroplasttrnS-trnG region, nuclear ITS and microsatellites for O. secunda; chloroplast rps2, nuclear ITS and microsatellites forM. hypopitys) indicated that both species persisted throughout the Last Glacial Maximum in southern refugia. Forboth species, the majority of the genetic diversity was concentrated in these southerly populations, whereas thosein recolonized areas generally exhibited lower levels of diversity, particularly in M. hypopitys. Species distributionmodelling based on projected future climate indicated substantial changes in the ranges of both species, with aloss of southern and central populations, and a potential northward expansion for the temperate M. hypopitys.
Conclusions: Both Orthilia secunda and Monotropa hypopitys appear to have persisted through the LGM in Europein southern refugia. The boreal O. secunda, however, has retained a larger proportion of its genetic diversity inmore northerly populations outside these refugial areas than the temperate M. hypopitys. Given that future speciesdistribution modelling suggests northern range shifts and loss of suitable habitat in the southern parts of thespecies’ current distributions, extinction of genetically diverse rear edge populations could have a significant effectin the rangewide intraspecific diversity of both species, but particularly in M. hypopitys.
BackgroundPaleoclimatic evidence indicates that the Earth’s tem-perature has been continually changing over time [1-3].The glacial and interglacial cycles that characterised theQuaternary period (ca. 2.6 MYA - present) have had asignificant effect on the distributions of species, particu-larly in the northern latitudes [4,5]. Temperate species
were generally confined to low-latitude refugia through-out glacial periods and recolonized from these areas asthe climate warmed during interglacials [6,7]. For plantspecies, however, whose spread is primarily via dispersalof seeds, the capacity to track changes in suitable habitatis limited, particularly for animal-dispersed species [8].Understanding the past movements of species may
help us understand how present and future climatechange might affect species’ ranges [9,10]. Within thelast decade, it has become evident that anthropogeni-cally induced climate change is causing shifts in the
* Correspondence: [email protected] of Biological Sciences, Queen’s University Belfast, 97 Lisburn Road,Belfast BT9 7BL, Northern Ireland
Beatty and Provan BMC Evolutionary Biology 2011, 11:29http://www.biomedcentral.com/1471-2148/11/29
© 2011 Beatty and Provan; licensee BioMed Central Ltd. This is an Open Access article distributed under the terms of the CreativeCommons Attribution License (http://creativecommons.org/licenses/by/2.0), which permits unrestricted use, distribution, andreproduction in any medium, provided the original work is properly cited.
distribution ranges of many species [11-14]. As projec-tions of carbon emissions suggest that this period of glo-bal warming will not end soon, these range shifts arelikely to continue, but where species lack the migratorycapacity to track changes in climate and available habi-tat, population extinctions may become increasingly fre-quent, particularly at species’ low-latitude range edges[14-17]. Range-edge populations have generally beenperceived as being genetically depauperate [18,19],although it has recently been suggested that some rear-edge populations may serve as reservoirs of uniquegenetic variation [20]. The processes of persistence insouthern refugia during glacial maxima followed bynorthward recolonization have led to a pattern of“southern richness versus northern purity” [21-23],where the majority of genetic variation is found inpopulations that currently occupy previous refugialareas, with a northward decrease in genetic diversity dueto progressive founder effects during the recolonizationprocess (but see [24-27]). Consequently, if rear-edgepopulations are at particular risk of extinction due tothe effects of climate change, their loss may have a dis-proportionally detrimental impact on overall levels ofwithin-species genetic diversity, and such genetic ero-sion might compromise the long-term evolutionarypotential of impacted species [28]. Assuming that spe-cies will shift their ranges north in response to globalwarming, genetically diverse southern edge populationsof temperate species may be at the greatest risk ofextinction, whereas cold-adapted species that mighthave persisted in more northerly refugia [24-27] couldconceivably retain a larger proportion of their geneticdiversity since this variation may not be concentrated inlow latitude populations.The aim of the present study was to use a combined
phylogeographic and species distribution modellingapproach to compare the glacial histories of two plantspecies, Orthilia secunda (one-sided wintergreen) andMonotropa hypopitys (yellow bird’s nest). Both speciesbelong to the Monotropoideae and have largely overlap-ping ranges in Europe (Figures 1A and 1B), as well asbeing found in North America, where they both exhibitdisjunct east/west distributions. O. secunda is generallyfound in boreal forests, whereas M. hypopitys is usuallyassociated with more temperate tree species and thus acomparison of the two should provide insights into therelative effects of climate change on a temperate speciesvs. a boreal species. Phylogeographic analysis was carriedout to determine the distribution of genetic variationacross the range of each species and to test whetherboth correspond to the “classic” model of high diversityin the south, with decreasing diversity at higher lati-tudes, or whether the cold-adapted O. secunda mightretain more genetic variation in northern populations.
In addition, projected species distributions based on afuture climate scenario were modelled to assess howchanges in the species ranges might impact on totalintraspecific diversity in both cases.
MethodsSampling and DNA extractionSamples of Orthilia secunda and Monotropa hypopityswere obtained from 35 and 19 locations respectivelythroughout Europe (Tables 1 and 2). DNA wasextracted using the Qiagen DNeasy kit. For O. secunda,206 individuals were sequenced for the chloroplast trnS-trnG intergenic spacer, 154 individuals were sequencedfor the nuclear internal transcribed spacer (ITS) region,and 218 individuals genotyped for five nuclear microsa-tellite loci. For M. hypopitys, 100 individuals weresequenced for part of the chloroplast rps2 gene, 100individuals were sequenced for the nuclear ITS region,and 111 individuals were genotyped for eight nuclearmicrosatellite loci.
Species distribution modellingEcological niche modelling (ENM) was carried out todetermine suitable climate envelopes for O. secunda andM. hypopitys in Europe for the LGM (ca. 18KYA), andthe year 2100 under a future climate scenario using themaximum entropy approach implemented in the MAX-ENT software package (V3.2.1; [29]). Species occurrencedata were downloaded from the Global BiodiversityInformation Facility data portal (http://www.gbif.org),totalling 14,221 and 8,829 occurrences for O. secundaand M. hypopitys respectively. A principal componentanalysis (PCA) was carried out on the 19 BIOCLIMvariables in the WorldClim data set [30] to remove cor-related variables, since these can lead to overfitting ofthe model. After removing variables that exhibited astrong correlation (Spearman’s rank correlation >0.5;[31]), three variables (P1 [Annual Mean Temperature],P4 [Temperature Seasonality] and P14 [Precipitationof Driest Period]) were used to generate ENMs at2.5 minute resolution using MAXENT with the defaultparameters for convergence threshold (10-5) and numberof iterations (500), and projected onto reconstructedLGM data (Community Climate System Model [CCSM];Palaeoclimate Modelling Intercomparison Project PhaseII: http://pmip2.lsce.ipsl.fr) to identify potential refugialareas. The current climate envelope was also projectedonto climate grids corresponding to the same three bio-climatic variables in the year 2100 under the NationalCentre for Atmospheric Research general circulationmodel (CCM3 model) that simulates double CO2 emis-sions [32]. Duplicate records from the same localitywere removed to reduce the effects of spatial autocorre-lation. Presence thresholds were determined using the
Beatty and Provan BMC Evolutionary Biology 2011, 11:29http://www.biomedcentral.com/1471-2148/11/29
Page 2 of 11
(A) (B)
(C) (D)
(E) (F)
(G) (H)
Figure 1 Distributions of O. secunda and M. hypopitys, and modelled LGM, current and future distributions. (A) Distribution ofO. secunda (Source: Naturhistoriska riksmuseet) (B) Distribution of M. hypopitys (Source: Naturhistoriska riksmuseet) (C) Modelled LGM (ca. 18 KYA)distribution of O. secunda (D) Modelled LGM (ca. 18 KYA) distribution of M. hypopitys (E) Modelled current distribution of O. secunda (F) Modelledcurrent distribution of M. hypopitys (G) Modelled future (2100) distribution of O. secunda (D) Modelled future (2100) distribution of M. hypopitys.
Beatty and Provan BMC Evolutionary Biology 2011, 11:29http://www.biomedcentral.com/1471-2148/11/29
Page 3 of 11
sensitivity-specificity sum maximisation approach [33]and the performance of the models were tested using25% of the occurrence data points to determine the areaunder the receiver operating characteristic (ROC) curve(AUC).
Molecular genetic analyses - O. secunda206 individuals were sequenced for the chloroplast trnS-trnG intergenic spacer. A product was amplified usingthe O. secunda-specific primers and reaction conditionsdescribed in [34]. 5 μl PCR product were resolved on1.5% agarose gels and visualised by ethidium bromidestaining, and the remaining 15 μl sequenced in bothdirections using the BigDye sequencing kit (V3.1; AppliedBiosystems) and run on an AB 3730XL DNA analyser.
154 individuals were sequenced for a section ofthe nuclear ITS region. Primers were designed fromGenBank sequence accession number AF133747:OS-ITS-F 5’-TGTTTGTACACTTGGGGAAGC-3’ andOS-ITS-R 5’-TCGCGGTCAATGTACCGTAG-3’. PCRand sequencing were carried out as described in [34],except that an annealing temperature of 55°C was usedfor the PCR.218 individuals were genotyped for five O. secunda
microsatellite loci previously described in [35]. Forwardprimers were modified by the addition of a 19 bp M13tail (5’-CACGACGTTGTAAAACGAC-3’) and reverseprimers were modified by the addition of a 7 bp tail(5’-GTGTCTT-3’). PCR was carried out in a totalvolume of 10 μl containing 100 ng genomic DNA, 10
Table 1 Orthilia secunda populations analysed in this study
Country Location Code Lat Long Ncp NITS Nmicro Collector
Austria Radmer an der Stube ATRS 47.5556 14.7861 5 2 5 Apollonie Mayr
Steiermark ATS1 47.4967 14.3522 7 5 8 Peter Schönswetter
Steiermark ATS2 47.4389 14.9233 8 7 8 Peter Schönswetter
Czech Republic Kosatky CZKO 50.3178 14.6719 7 6 7 Petr Kotlik
Estonia Jõgevamaa EEJO 58.6338 26.9453 7 2 8 Teene Talve
Nigula Nature Reserve EENN 58.0194 24.6825 7 5 8 M. Reintal
Põlvamaa EEPO 58.0956 27.0302 8 4 8 T. Oja
France Cervieres FRCE 44.8667 6.7225 7 5 8 Rolland Douzet
Sauvas FRSA 44.6004 5.9037 5 4 7 Arne Saatkamp
Station Alpine Joseph Fourier FRJF 45.0360 6.4002 6 5 8 Rolland Douzet
Ireland Correl Glen IECG 54.4372 -7.8744 4 4 4 Gemma Beatty
Cranny Burn IECB 54.9114 -6.0409 4 4 4 Gemma Beatty
Italy Valle D’Aosta ITVA 45.7125 7.1639 6 5 6 Nationaal Herbarium Nederland
Montenegro Durmitor Mountains MEDM 43.1611 19.2028 8 7 8 Anna & Michal Ronikier
Komovi Massif MEKM 42.6947 19.6672 5 4 5 Anna & Michal Ronikier
Norway Buskerud NOBU 60.1208 10.3833 8 6 8 Andreas Tribsch
Oslo NOOS 59.9939 10.7064 8 6 8 Andreas Tribsch
Selvikstaken NOSE 58.8625 6.0750 4 4 4 Andreas Tribsch
Troms Fylke NOTF 68.9500 19.7500 4 4 5 W. Paul
Poland Bialystok PLBI 53.1167 23.1167 8 4 8 Ada Wroblewska
Kielce PLKI 50.8400 20.5800 5 5 5 W. Paul
Pomorze Zachodnie PLPZ 54.0047 19.9983 7 6 8 Joanna Julia & Lech Galosz
Scotland Glen Glass SCGG 57.6816 -4.4226 4 4 4 Peter McEvoy
Glen Mhor SCGM 56.8844 -3.6315 4 4 4 Peter McEvoy
Slovakia Muranska Planina SKMP 48.7825 19.9600 8 5 8 Anna & Michal Ronikier
Nizke Tatry SKNT 48.9983 19.5875 8 5 8 Anna & Michal Ronikier
Slovensky Raj SKSR 48.9305 20.2897 2 2 2 Anna & Michal Ronikier
Zapadne Tatry SKZT 49.1453 19.7850 7 6 7 Anna & Michal Ronikier
Slovenia Kaminske Alpe SIKA 46.3922 14.6000 8 6 8 Peter Schönswetter
Sweden Flurkmark SEFL 64.1273 20.1322 8 7 8 Stefan Ericsson
Lomselenas SELO 65.1441 17.3139 8 6 8 Stefan Ericsson
Ranas SERA 59.8128 18.2883 5 1 8 Arne Anderberg
Switzerland Chasseron CHCH 46.8287 6.5508 6 6 6 Philippe Druart
Valais CHVA 46.0000 7.6833 5 5 5 Nationaal Herbarium Nederland
206 154 218
Beatty and Provan BMC Evolutionary Biology 2011, 11:29http://www.biomedcentral.com/1471-2148/11/29
Page 4 of 11

pmol of dye-labelled M13 primer (6-FAM or HEX), 1pmol of tailed forward primer, 10 pmol reverse primer,1× PCR reaction buffer, 200 μM each dNTP, 2.5 mMMgCl2 and 0.25 U GoTaq Flexi DNA polymerase (Pro-mega). PCR was carried out on a MWG Primus ther-mal cycler using the conditions described in [35] andgenotyping was carried out on an AB3730xl capillarygenotyping system. Allele sizes were scored in GENE-MAPPER V4.1 using ROX-500 size standards and werechecked by comparison with previously sized controlsamples.
Molecular genetic analyses - M. hypopitys100 individuals were sequenced for a section of the chlor-oplast rps2 gene. Primers were designed from GenBanksequence accession number AF351956 (Bidartondo andBruns 2001): MH-rps2-F 5’-TTCGCCGATTTAGTAT-CACG-3’ and MH-rps2-R 5’-GGGATTCCCAAAGTAA-TACATTCTA-3’. PCR and sequencing were carried outas described in [34].100 individuals were sequenced for a section of the
nuclear ITS region. Primers were designed from Gen-Bank sequence accession number AF384126 [36]: MH-ITS-F 5’-GGTTGGCCTACCCTTTATTTT-3’ and MH-ITS-R 5’-GAAGTAATCCAATCATAACACTGACA-3’.PCR and sequencing were carried out as described in[34], except that an annealing temperature of 55°C wasused.111 individuals were genotyped for five M. hypopitys
microsatellite loci previously described in [37] -Mono02, Mono15, Mono20, Mono21 and Mono22.
Three additional loci developed using the ISSR-cloningtechnique outlined in [38] were also used (Table 2). For-ward primers were modified by the addition of a 19 bpM13 tail (5’-CACGACGTTGTAAAACGAC-3’) andreverse primers were modified by the addition of a 7 bptail (5’-GTGTCTT-3’). PCR was carried out in a totalvolume of 10 μl containing 100 ng genomic DNA,10 pmol of dye-labelled M13 primer (6-FAM or HEX),1 pmol of tailed forward primer, 10 pmol reverseprimer, 1× PCR reaction buffer, 200 μM each dNTP,2.5 mM MgCl2 and 0.25 U GoTaq Flexi DNA polymer-ase (Promega). PCR was carried out on a MWG Primusthermal cycler using the conditions described in [39]and genotyping was carried out on an AB3730xl capil-lary genotyping system. Allele sizes were scored inGENEMAPPER V4.1 (Applied Biosystems) using ROX-500 size standards and were checked by comparisonwith previously sized control samples.
Data analysisAlignments were constructed using BIOEDIT (V7.0.9.0)[40] for the O. secunda chloroplast trnS-trnG intergenicspacer and nuclear ITS, and for the M. hypopitys chloro-plast rps2 and nuclear ITS. Length variation at anymononucleotide repeat regions was removed, since thebidirectional mutation model operating at such regionscan give rise to homoplasy [41]. The alignments wereused to construct statistical parsimony networks usingthe TCS software package (V1.2.1) [42]. Where reticula-tions were present in the networks, these were brokenfollowing the rules described in [43].
Table 2 Monotropa hypopitys populations analysed in this study
Country Location Code Lat Long Ncp NITS Nmicro Collector
Austria Karnten ATKA 46.5228 13.9539 2 2 2 Peter Schönswetter
Czech Republic Polom CZPO 49.7892 15.7595 1 1 1 Jakub Tiesetel
England Peasmarsh ENPE 50.9667 -0.6667 6 6 8 Jonathan Simmons
Estonia Jõgevamaa EEJO 58.6338 26.9453 6 6 8 Teene Talve
Põlvamaa EEPO 58.0956 27.0302 7 8 8 T. Ota
Ireland Ely Lodge IEEL 54.4567 -7.9002 8 7 8 Gemma Beatty
Straidkilly IEST 54.9914 -6.0409 8 7 8 Gemma Beatty
Poland Czarne Lake PLCL 53.4667 20.6000 8 7 8 Ada Wroblewska
Lake Golun PLLG 54.0047 17.9983 8 8 8 Ada Wroblewska
Knyszyn PLKN 53.3333 22.9167 8 8 8 Joanna Julia & Lech Galosz
Romania Retezat Mountains RORM 45.3097 22.9678 8 8 8 Anna & Michal Ronikier
ROVG 46.2070 25.5400 4 4 6 Anna Maria Csergo
Slovakia Muranska Planina SKMP 48.7825 19.9600 2 2 2 Anna & Michal Ronikier
Nizke Tatry SKNT 48.9983 19.5875 4 4 6 Anna & Michal Ronikier
Slovenia Dolenjska SIDO 45.9236 15.0958 2 3 3 Peter Schönswetter
Soca Valley SISV 46.3450 13.6800 8 8 8 Peter Schönswetter
Sweden Ranas SERA 59.8128 18.2883 3 4 4 Arne Anderberg
Switzerland Chasseron CHCH 46.8287 6.5508 5 5 5 Philippe Druart
100 100 111
Beatty and Provan BMC Evolutionary Biology 2011, 11:29http://www.biomedcentral.com/1471-2148/11/29
Page 5 of 11
Tests for linkage disequilibrium between pairs ofmicrosatellite loci in each population were carried outin the program FSTAT [44]. Levels of genetic diversitywere calculated for populations with a sample size ofN ≥ 4. Gene diversity (H) based on haplotype frequen-cies for the O. secunda chloroplast trnS-trnG region andnuclear ITS, and the M. hypopitys chloroplast rps2 andnuclear ITS, and observed and expected heterozygosity(HO and HE) based on nuclear microsatellite allele fre-quencies were calculated using the ARLEQUIN softwarepackage (V3.01) [45]. Population structuring based onthe microsatellite data was determined using theSTRUCTURE software package (V 2.2) [46]. Five inde-pendent runs were carried out for all values of K, thenumber of clusters, between 2 and 20. The program wasrun each time using 50,000 burn-in iterations followedby 500,000 Markov Chain Monte Carlo iterations, andthe most likely value of K was determined using the ΔKstatistic [47].
ResultsSpecies distribution modellingFor all models, the area under the receiver operatingcurve (AUC) statistic was consistently higher than 0.95,indicating good performance.Distribution modelling for O. secunda and M. hypop-
itys at the LGM indicated extensive areas of suitablehabitat for both species in southern Europe (Figures 1Cand 1D). For O. secunda, two of the French populations(FRSA and FRCE), one of the Swiss populations(CHVA) and the two populations from Montenegro laywithin the suitable climate envelope indicated by theENM. None of the M. hypopitys populations studied laywithin the suitable climate envelope indicated bythe ENM.The future distribution model indicated an extensive
loss of suitable habitat for O. secunda relative to themodelled current climate envelope (Figure 1E), particu-larly in northern central Europe (Figure 1G). The major-ity of the suitable remaining habitat in southern Europewould be largely restricted to the mountainous regionsof the Pyrenees, the Alps, the Carpathians and the Dina-ric Alps. For M. hypopitys, the model indicated a generalnorthward shift in the species’ distribution, with a lossof suitable habitat in southeastern Europe but anincrease in northern Europe, particularly in Scandinavia(Figures 1F and 1H).
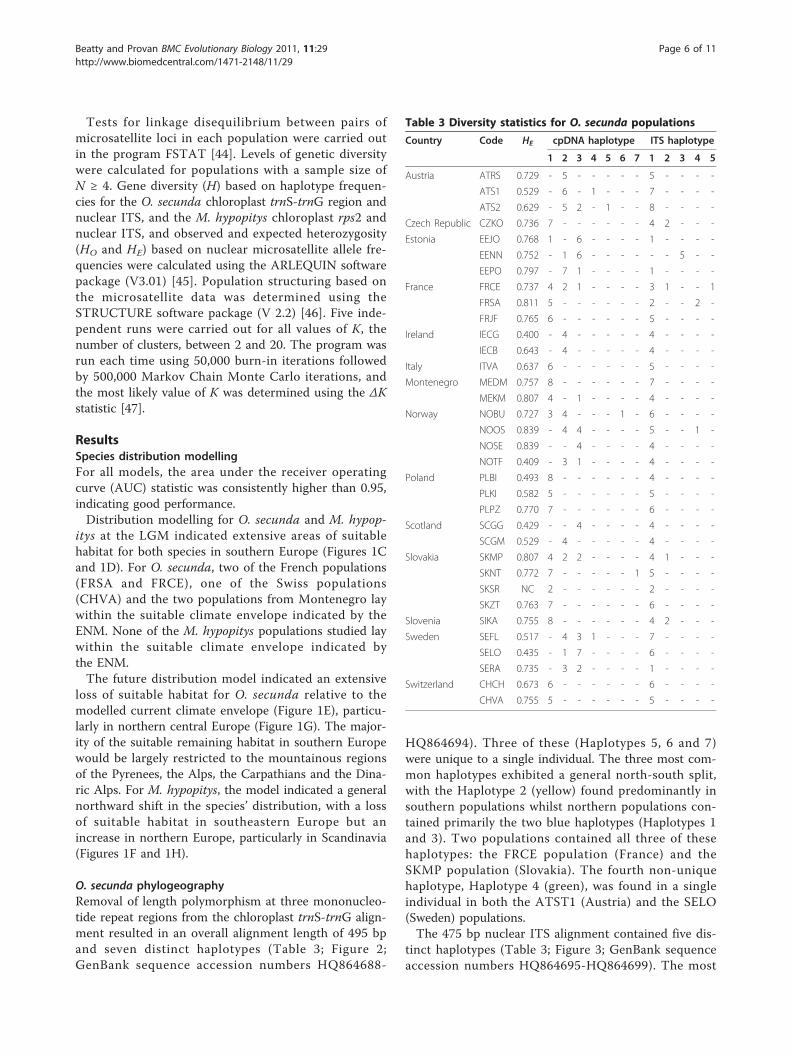
O. secunda phylogeographyRemoval of length polymorphism at three mononucleo-tide repeat regions from the chloroplast trnS-trnG align-ment resulted in an overall alignment length of 495 bpand seven distinct haplotypes (Table 3; Figure 2;GenBank sequence accession numbers HQ864688-
HQ864694). Three of these (Haplotypes 5, 6 and 7)were unique to a single individual. The three most com-mon haplotypes exhibited a general north-south split,with the Haplotype 2 (yellow) found predominantly insouthern populations whilst northern populations con-tained primarily the two blue haplotypes (Haplotypes 1and 3). Two populations contained all three of thesehaplotypes: the FRCE population (France) and theSKMP population (Slovakia). The fourth non-uniquehaplotype, Haplotype 4 (green), was found in a singleindividual in both the ATST1 (Austria) and the SELO(Sweden) populations.The 475 bp nuclear ITS alignment contained five dis-
tinct haplotypes (Table 3; Figure 3; GenBank sequenceaccession numbers HQ864695-HQ864699). The most
Table 3 Diversity statistics for O. secunda populations
Country Code HE cpDNA haplotype ITS haplotype
1 2 3 4 5 6 7 1 2 3 4 5
Austria ATRS 0.729 - 5 - - - - - 5 - - - -
ATS1 0.529 - 6 - 1 - - - 7 - - - -
ATS2 0.629 - 5 2 - 1 - - 8 - - - -
Czech Republic CZKO 0.736 7 - - - - - - 4 2 - - -
Estonia EEJO 0.768 1 - 6 - - - - 1 - - - -
EENN 0.752 - 1 6 - - - - - - 5 - -
EEPO 0.797 - 7 1 - - - - 1 - - - -
France FRCE 0.737 4 2 1 - - - - 3 1 - - 1
FRSA 0.811 5 - - - - - - 2 - - 2 -
FRJF 0.765 6 - - - - - - 5 - - - -
Ireland IECG 0.400 - 4 - - - - - 4 - - - -
IECB 0.643 - 4 - - - - - 4 - - - -
Italy ITVA 0.637 6 - - - - - - 5 - - - -
Montenegro MEDM 0.757 8 - - - - - - 7 - - - -
MEKM 0.807 4 - 1 - - - - 4 - - - -
Norway NOBU 0.727 3 4 - - - 1 - 6 - - - -
NOOS 0.839 - 4 4 - - - - 5 - - 1 -
NOSE 0.839 - - 4 - - - - 4 - - - -
NOTF 0.409 - 3 1 - - - - 4 - - - -
Poland PLBI 0.493 8 - - - - - - 4 - - - -
PLKI 0.582 5 - - - - - - 5 - - - -
PLPZ 0.770 7 - - - - - - 6 - - - -
Scotland SCGG 0.429 - - 4 - - - - 4 - - - -
SCGM 0.529 - 4 - - - - - 4 - - - -
Slovakia SKMP 0.807 4 2 2 - - - - 4 1 - - -
SKNT 0.772 7 - - - - - 1 5 - - - -
SKSR NC 2 - - - - - - 2 - - - -
SKZT 0.763 7 - - - - - - 6 - - - -
Slovenia SIKA 0.755 8 - - - - - - 4 2 - - -
Sweden SEFL 0.517 - 4 3 1 - - - 7 - - - -
SELO 0.435 - 1 7 - - - - 6 - - - -
SERA 0.735 - 3 2 - - - - 1 - - - -
Switzerland CHCH 0.673 6 - - - - - - 6 - - - -
CHVA 0.755 5 - - - - - - 5 - - - -
Beatty and Provan BMC Evolutionary Biology 2011, 11:29http://www.biomedcentral.com/1471-2148/11/29
Page 6 of 11
common haplotype, Haplotype 1 (red), was found in allpopulations with the exception of the EENN population(Estonia). Only six populations exhibited any within-population variation (FRCE, FRSA [both France], SIKA[Slovenia], SKMP [Slovakia], CZKO [Czech Republic]and NOOS [Norway]) and only the FRCE population
contained more than two haplotypes. The EENN popu-lation was fixed for Haplotype 3 (blue), which was notfound elsewhere.No significant linkage disequilibrium was detected
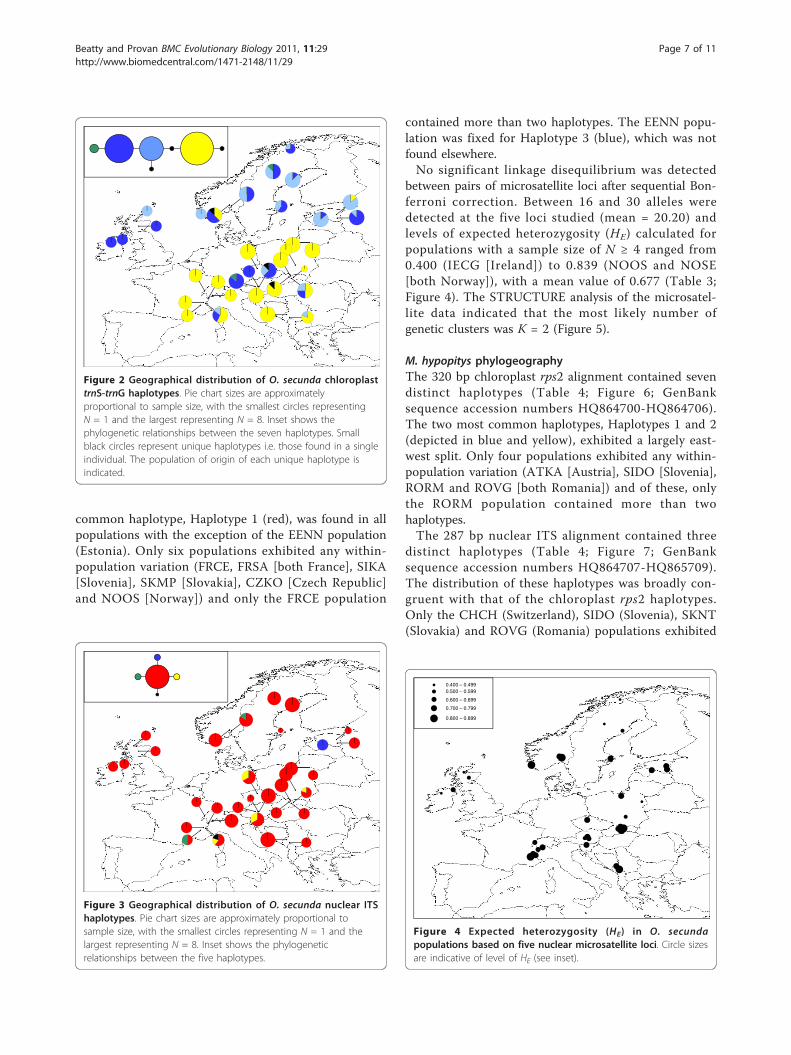
between pairs of microsatellite loci after sequential Bon-ferroni correction. Between 16 and 30 alleles weredetected at the five loci studied (mean = 20.20) andlevels of expected heterozygosity (HE) calculated forpopulations with a sample size of N ≥ 4 ranged from0.400 (IECG [Ireland]) to 0.839 (NOOS and NOSE[both Norway]), with a mean value of 0.677 (Table 3;Figure 4). The STRUCTURE analysis of the microsatel-lite data indicated that the most likely number ofgenetic clusters was K = 2 (Figure 5).
M. hypopitys phylogeographyThe 320 bp chloroplast rps2 alignment contained sevendistinct haplotypes (Table 4; Figure 6; GenBanksequence accession numbers HQ864700-HQ864706).The two most common haplotypes, Haplotypes 1 and 2(depicted in blue and yellow), exhibited a largely east-west split. Only four populations exhibited any within-population variation (ATKA [Austria], SIDO [Slovenia],RORM and ROVG [both Romania]) and of these, onlythe RORM population contained more than twohaplotypes.The 287 bp nuclear ITS alignment contained three
distinct haplotypes (Table 4; Figure 7; GenBanksequence accession numbers HQ864707-HQ865709).The distribution of these haplotypes was broadly con-gruent with that of the chloroplast rps2 haplotypes.Only the CHCH (Switzerland), SIDO (Slovenia), SKNT(Slovakia) and ROVG (Romania) populations exhibited
Figure 2 Geographical distribution of O. secunda chloroplasttrnS-trnG haplotypes. Pie chart sizes are approximatelyproportional to sample size, with the smallest circles representingN = 1 and the largest representing N = 8. Inset shows thephylogenetic relationships between the seven haplotypes. Smallblack circles represent unique haplotypes i.e. those found in a singleindividual. The population of origin of each unique haplotype isindicated.
Figure 3 Geographical distribution of O. secunda nuclear ITShaplotypes. Pie chart sizes are approximately proportional tosample size, with the smallest circles representing N = 1 and thelargest representing N = 8. Inset shows the phylogeneticrelationships between the five haplotypes.
0.400 – 0.4990.500 – 0.599
0.600 – 0.699
0.700 – 0.799
0.800 – 0.899
Figure 4 Expected heterozygosity (HE) in O. secundapopulations based on five nuclear microsatellite loci. Circle sizesare indicative of level of HE (see inset).
Beatty and Provan BMC Evolutionary Biology 2011, 11:29http://www.biomedcentral.com/1471-2148/11/29
Page 7 of 11
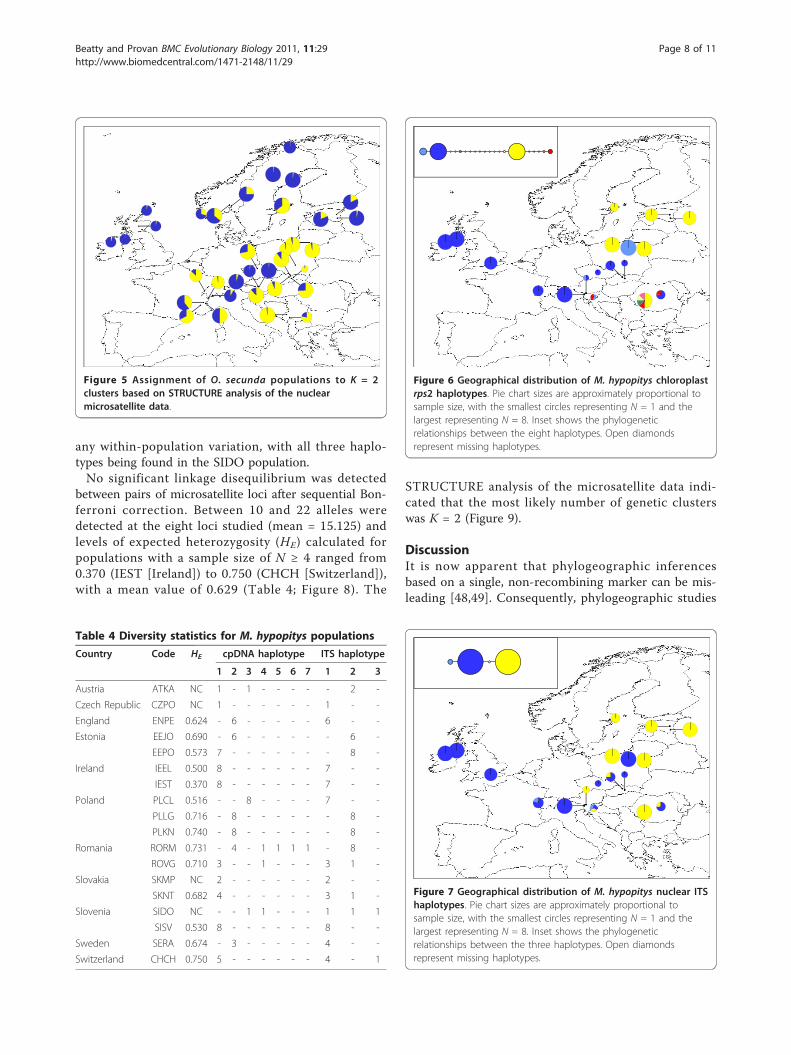
any within-population variation, with all three haplo-types being found in the SIDO population.No significant linkage disequilibrium was detected
between pairs of microsatellite loci after sequential Bon-ferroni correction. Between 10 and 22 alleles weredetected at the eight loci studied (mean = 15.125) andlevels of expected heterozygosity (HE) calculated forpopulations with a sample size of N ≥ 4 ranged from0.370 (IEST [Ireland]) to 0.750 (CHCH [Switzerland]),with a mean value of 0.629 (Table 4; Figure 8). The
STRUCTURE analysis of the microsatellite data indi-cated that the most likely number of genetic clusterswas K = 2 (Figure 9).
DiscussionIt is now apparent that phylogeographic inferencesbased on a single, non-recombining marker can be mis-leading [48,49]. Consequently, phylogeographic studies
Figure 5 Assignment of O. secunda populations to K = 2clusters based on STRUCTURE analysis of the nuclearmicrosatellite data.
Table 4 Diversity statistics for M. hypopitys populations
Country Code HE cpDNA haplotype ITS haplotype
1 2 3 4 5 6 7 1 2 3
Austria ATKA NC 1 - 1 - - - - - 2 -
Czech Republic CZPO NC 1 - - - - - - 1 - -
England ENPE 0.624 - 6 - - - - - 6 - -
Estonia EEJO 0.690 - 6 - - - - - - 6 -
EEPO 0.573 7 - - - - - - - 8 -
Ireland IEEL 0.500 8 - - - - - - 7 - -
IEST 0.370 8 - - - - - - 7 - -
Poland PLCL 0.516 - - 8 - - - - 7 - -
PLLG 0.716 - 8 - - - - - - 8 -
PLKN 0.740 - 8 - - - - - - 8 -
Romania RORM 0.731 - 4 - 1 1 1 1 - 8 -
ROVG 0.710 3 - - 1 - - - 3 1 -
Slovakia SKMP NC 2 - - - - - - 2 - -
SKNT 0.682 4 - - - - - - 3 1 -
Slovenia SIDO NC - - 1 1 - - - 1 1 1
SISV 0.530 8 - - - - - - 8 - -
Sweden SERA 0.674 - 3 - - - - - 4 - -
Switzerland CHCH 0.750 5 - - - - - - 4 - 1
Figure 6 Geographical distribution of M. hypopitys chloroplastrps2 haplotypes. Pie chart sizes are approximately proportional tosample size, with the smallest circles representing N = 1 and thelargest representing N = 8. Inset shows the phylogeneticrelationships between the eight haplotypes. Open diamondsrepresent missing haplotypes.
Figure 7 Geographical distribution of M. hypopitys nuclear ITShaplotypes. Pie chart sizes are approximately proportional tosample size, with the smallest circles representing N = 1 and thelargest representing N = 8. Inset shows the phylogeneticrelationships between the three haplotypes. Open diamondsrepresent missing haplotypes.
Beatty and Provan BMC Evolutionary Biology 2011, 11:29http://www.biomedcentral.com/1471-2148/11/29
Page 8 of 11
are increasingly using multiple genetic markers and/orpalaeodistribution modelling to draw more reliableinferences on population history. The results of thepaleodistribution modelling and the patterns of geneticvariation revealed by the phylogeographic analyses sug-gest that both Orthilia secunda and Monotropa hypop-itys persisted throughout the LGM in Europe insouthern refugia. Although both species generally exhib-ited a “southern richness vs. northern purity” distribu-tion of genetic variation [21], this was more pronouncedin the temperate M. hypopitys, where the only popula-tions that displayed any within-population genetic varia-tion for both the chloroplast rps2 and nuclear ITS
regions were located closest to the modelled refugialareas. Northern populations of O. secunda were morediverse, but the signatures of refugial areas i.e. highdiversity coupled with unique haplotypes [27] wererestricted to southern populations.Based on the weight of evidence across modelling and
the different markers used, our findings indicate a possi-ble refugial area for O. secunda in Europe located in thevicinity of the French Alps. A second area of high diver-sity and endemic haplotypes included the Austrian Alpsand Slovakia, but these populations lie outside the suita-ble climate envelope indicated by the palaeodistributionmodel. Nevertheless, although the precise locations ofputative refugia are difficult to identify accurately, it isclear that the majority of genetic diversity is containedin southern populations. The occurrence of a fixedendemic ITS haplotype in one of the Estonian popula-tions (EENN) more likely represents a relatively recentmutation that has become fixed through genetic drift,rather than indicating an extreme northern refugium.For M. hypopitys, the modelling and genetic data bothindicated a likely refugial area in southeastern Europe.The identification of two genetic clusters with a broadlynorthern/eastern vs. southern/western geographical dis-tribution for both species based on microsatellite datacould indicate isolation in separate refugia followed bydifferential recolonization after the retreat of the ice[24].Many studies have used modelling approaches to
determine the effects of present and future climatechange on the distribution ranges of plant species (e.g.[50-52]). We can extend this approach to investigate thepotential effects of such distribution changes on intras-pecific genetic diversity. The future modelled distribu-tions of both O. secunda and M. hypopitys indicatesubstantial changes in the ranges of both species. ForM. hypopitys in particular, these changes could have aprofound impact on the genetic diversity of the speciesin Europe. Previous studies have suggested that rangecontraction during previous phases of climate changewas characterized by population extinction, rather thanmigration [6,53]. Although the future model indicates arange expansion at the northern edge, it also suggestsextensive loss of suitable habitat in southeastern Europe.Given that this area represents the centre of geneticdiversity for the species, extinction of these populationswould lead to massive loss of genetic diversity sincemore northerly populations are genetically depauperaterelative to populations in the southeast. A northernexpansion of the species’ range would not counter this,because the leading edge colonization would be fromthese low-diversity northern populations. Northernpopulations of O. secunda, however, tended to be moregenetically diverse than those of M. hypopitys.
0.300 – 0.3990.400 – 0.499
0.500 – 0.599
0.600 – 0.699
0.700 – 0.799
Figure 8 Expected heterozygosity (HE) in M. hypopityspopulations based on five nuclear microsatellite loci. Circle sizesare indicative of level of HE (see inset).
Figure 9 Assignment of M. hypopitys populations to K = 2clusters based on STRUCTURE analysis of the nuclearmicrosatellite data.
Beatty and Provan BMC Evolutionary Biology 2011, 11:29http://www.biomedcentral.com/1471-2148/11/29
Page 9 of 11
Consequently, the loss of southern and central EuropeanO. secunda populations indicated by the species distri-bution model would not have the same overall effect ontotal intraspecific genetic diversity across the continent.Nevertheless, although the populations from the species’centres of diversity in the French and Austrian Alpswould still lie within the future modelled climate envel-ope, this would most likely be as a result of altitudinalmigration, since the mountain ranges of southern andeastern Europe represent the only climatically suitableareas in the region. Whilst altitudinal migration offerssome short-term potential for countering the effects ofclimate change [54-57], its scope is ultimately limited[58]. The situation in Europe is somewhat differentfrom that in North America, where the occurrence ofnorthern refugia for both species means that a lowerproportion of the total genetic diversity in the continentis concentrated in southern populations [[34], Beatty &Provan, unpublished results] and thus the impact of lossof rear-edge populations might not be as extreme. Itshould also be borne in mind that models of future(and, indeed, past) climate are not guaranteed to be100% accurate, and that many other factors such aschanges in species tolerances through adaptation andspecies-species interactions will also determine speciescurrent and future ranges. Nevertheless, at least in Eur-ope, the adverse encroachment of human activity on theboreal and temperate woodlands that form the naturalhabitat for these species, coupled with the fact that cli-mate is changing faster now than at any time in thepast, means that the impacts on the gene pools and sub-sequent adaptive potential of these, and possibly manyother species, are likely to be potentially serious.
ConclusionsBoth Orthilia secunda and Monotropa hypopitys appearto have persisted through the LGM in Europe in south-ern refugia. The boreal O. secunda, however, hasretained a larger proportion of its genetic diversity inmore northerly populations outside these refugial areasthan the temperate M. hypopitys. Given that future spe-cies distribution modelling suggests northern rangeshifts and loss of suitable habitat in the southern partsof the species’ current distributions, extinction of geneti-cally diverse rear edge populations could have a signifi-cant effect in the rangewide intraspecific diversity ofboth species, but particularly in M. hypopitys.
AcknowledgementsWe are extremely grateful to everybody who provided samples for thisproject (listed in Tables 1a and 1b). Jan Wieringa (Nationaal HerbariumNederland) provided valuable herbarium specimens. Gemma Beatty’s PhDresearch is funded by the Department of Agriculture and RuralDevelopment, Northern Ireland.
Authors’ contributionsBoth authors conceived and designed the study. GEB carried out thelaboratory work. Both authors analysed the data and wrote the manuscript.
Received: 4 September 2010 Accepted: 27 January 2011Published: 27 January 2011
References1. Emiliani C: Quaternary paleotemperatures and the duration of high
temperature intervals. Science 1972, 178:398-401.2. Winograd IJ, Szabo BJ, Coplen TB, Riggs AC: A 250 000-year climatic
record from Great Basin vein calcite: implications for Milankovitchtheory. Science 1988, 242:1275-1280.
3. Jansen E, Sjoholm J: Reconstruction of glaciations over the past 6 Myrfrom ice-borne deposits in the Norwegian Sea. Nature 1991, 349:600-603.
4. FAUNMAP Working Group: Spatial response of mammals to LateQuaternary environmental fluctuations. Science 1996, 272:1601-1606.
5. Hewitt GM: Ice ages: their impact on species distributions and evolution.In Evolution on Planet Earth. Edited by: Rothschild LJ, Lister AM. AcademicPress, London; 339-361.
6. Bennett KD, Tzedakis PC, Willis KJ: Quaternary refugia of north Europeantrees. J Biogeogr 1991, 18:103-115.
7. Bennett KD, Provan J: What do we mean by ‘refugia’? Quaternary Sci Rev2008, 27:2449-2455.
8. Comes HP, Kadereit JW: The effects of Quaternary climatic changes onplant distribution and evolution. Trends Ecol Evol 1998, 8:432-438.
9. Hu FS, Hampe A, Petit RJ: Paleoecology meets genetics: deciphering pastvegetational dynamics. Front Ecol Environ 2009, 7:371-379.
10. Harrison SP, Sanchez Goñi MF: Global patterns of vegetation response tomillennial-scale variability and rapid climate change during the lastglacial period. Quaternary Sci Rev 2010.
11. Walther GR, Post E, Convey P, Menzel A, Parmesan C, Beebee TJC,Fromentin JM, Hoegh-Gulberg O, Bairlein F: Ecological responses to recentclimate change. Nature 2002, 416:389-395.
12. Parmesan C, Yohe G: A globally coherent fingerprint of climate changeimpacts across natural systems. Nature 2003, 421:37-42.
13. Root TL, Price JT, Hall KR, Schneider SH, Rosenzweig C, Pounds JA:Fingerprints of global warming on wild animals and plants. Nature 2003,421:57-60.
14. Parmesan C: Ecological and evolutionary response to recent climatechange. Ann Rev Ecol Evol Syst 2006, 37:637-669.
15. Thomas CD, Cameron A, Green RE, Bakkenes M, Beaumont LJ,Collingham YC, Erasmus BFN, de Siqueira MF, Grainger A, Hannah L,Hughes L, Huntley B, van Jaarsveld AS, Midgley GF, Miles L, Ortega-Huerta MA, Peterson AT, Phillips OL, Williams SE: Extinction risk fromclimate change. Nature 2004, 427:145-148.
16. Foden W, Midgely GF, Hughes GO, Bond WJ, Thuiller W, Hoffman MT,Kaleme P, Underhill LG, Rebelo AG, Hannah L: A changing climate iseroding the geographical range of the Namib Desert tree Aloethrough population declines and dispersal lags. Diversity Distrib 2007,13:645-653.
17. Gaston KJ: The Structure and Dynamics of Geographic Ranges Oxford: OxfordUniversity Press; 2003.
18. Vucetich JA, Waite TA: Spatial patterns of demography and geneticprocesses across the species’ range: null hypotheses for landscapeconservation genetics. Conserv Genet 2003, 4:639-645.
19. Eckert CG, Samis KE, Lougheed SC: Genetic variation across species’geographical ranges: the central-marginal hypothesis and beyond. MolEcol 2008, 17:1170-1188.
20. Hampe A, Petit RJ: Conserving biodiversity under climate change: therear edge matters. Ecol Lett 2005, 8:461-467.
21. Hewitt GM: The genetic legacy of the Quaternary ice ages. Nature 2000,405:907-913.
22. Taberlet P, Fumagalli L, Wust-Saucy AG, Cossons JF: Comparativephylogeography and post-glacial recolonization routes in Europe. MolEcol 1998, 7:453-464.
23. Hewitt GM: Post-glacial recolonisation of European biota. Biol J LinneanSoc 1999, 68:87-112.
24. Petit RJ, Auinagalde I, de Beaulieu J-L, Bittkau C, Brewer S, Cheddadi R,Ennos R, Fineschi S, Grivet D, Lascoux M, Mohanty A, Muller-Starck GM,Demesure-Musch B, Palme A, Martin JP, Rendell S, Vendramin GG: Glacial
Beatty and Provan BMC Evolutionary Biology 2011, 11:29http://www.biomedcentral.com/1471-2148/11/29
Page 10 of 11

refugia: hotspots but not melting pots of genetic diversity. Science 2003,300:1563-1565.
25. Stewart JR, Lister AM: Cryptic northern refugia and the origins of themodern biota. Trends Ecol Evol 2001, 16:608-613.
26. Provan J, Bennett KD: Phylogeographic insights into cryptic glacialrefugia. Trends Ecol Evol 2008, 23:564-571.
27. Stewart JR, Lister AM, Barnes I, Dalén L: Refugia revisited: individualisticresponses of species in space and time. Proc Roy Soc B 2010, 277:661-671.
28. Frankham R: Genetics and extinction. Biol Conserv 2005, 126:131-140.29. Phillips SJ, Anderson RP, Schapire RE: Maximum entropy modeling of
species geographic distributions. Ecol Model 2006, 190:231-259.30. Hijmans RJ, Cameron SE, Parra JL, Jones PG, Jarvis A: Very high resolution
interpolated climate surfaces for global land areas. J Climatol 2005,25:1965-1978.
31. Booth GD, Niccolucci MJ, Schuster EG: Identifying proxy sets in multiple linearregression: an aid to better coefficient interpretation Research paper INT-470.United States Department of Agriculture Forest Service, Ogden, UT; 1994.
32. Govindasamy B, Duffy PB, Coquard J: High resolution simulations ofglobal climate, part 2: effects of increased greenhouse gases. ClimDynamics 2003, 21:391-404.
33. Cantor SB, Sun CC, Tortolero-Luna G, Richards-Kortum R, Follen M: Acomparison of C/B ratios from studies using receiver operatingcharacteristic curve analysis. J Clin Epidem 1999, 52:885-892.
34. Beatty GE, Provan J: Refugial persistence and postglacial recolonization ofNorth America by the cold-tolerant herbaceous plant Orthilia secunda.Mol Ecol 2010, 19:5009-5021.
35. Beatty GE, McEvoy PM, Sweeney O, Provan J: Range-edge effects promoteclonal growth in peripheral populations of the one-sided wintergreen(Orthilia secunda). Diversity Distrib 2008, 14:546-555.
36. Bidartondo MI, Bruns TD: Extreme specificity in epiparasiticMonotropoideae (Ericacea): widespread phylogenetic and geographicstructure. Mol Ecol 2001, 10:2285-2295.
37. Klooster MR, Hoenle AW, Culley TM: Characterization of microsatellite lociin the myco-heterotrophic plant Monotropa hypopitys (Ericaceae) andamplification in related taxa. Mol Ecol Resources 2009, 9:219-221.
38. Provan J, Wilson PJ: Development of microsatellites for the peat mossSphagnum capillifolium using ISSR cloning. Mol Ecol Notes 2007, 7:254-256.
39. Beatty GE, Provan J: High clonal diversity in threatened peripheralpopulations of the yellow bird’s nest (Hypopitys monotropa; syn.Monotropa hypopitys). Annals Bot 2011.
40. Hall TA: BIOEDIT: a user-friendly biological sequence alignment editorand analysis program for Windows 95/98/NT. Nucleic Acids Symp Ser 1999,41:95-98.
41. Provan J, Powell W, Hollingsworth PM: Chloroplast microsatellites: newtools for studies in plant ecology and systematics. Trends Ecol Evol 2001,16:142-147.
42. Clement M, Posada D, Crandall KA: TCS: a computer program to estimategene genealogies. Mol Ecol 2000, 9:1657-1659.
43. Pfenninger M, Posada D: Phylogeographic history of the land snailCandidula unifasciata (Helicellinae, Stylommatophora): fragmentation,corridor migration and secondary contact. Evolution 2002, 56:1776-1788.
44. Goudet J: FSTAT, version 2.9.3, A program to estimate and test genediversities and fixation indices. [http://www2.unil.ch/popgen/softwares/fstat.htm].
45. Excoffier L, Laval LG, Schneider S: ARLEQUIN, Version 3.0: An integratedsoftware package for population genetic data analysis. Evol Bioinf Online2005, 1:47-50.
46. Pritchard JK, Stephens M, Donnelly P: Inference of population structureusing multilocus genotype data. Genetics 2000, 155:945-959.
47. Evanno G, Regnaud S, Goudet J: Detecting the number of clusters ofindividuals using the software STRUCTURE: a simulation study. Mol Ecol2005, 14:2611-2620.
48. Bermingham E, Moritz C: Comparative phylogeography: concepts andapplications. Mol Ecol 1998, 7:367-369.
49. Schaal BA, Hayworth DA, Olsen KM, Rauscher JT, Smith WA:Phylogeographic studies in plants: problems and prospects. Mol Ecol1998, 7:465-474.
50. Thuiller W, Lavorel S, Araújo MB, Sykes MT, Prentice IC: Climate changethreats to plant diversity in Europe. Proc Natl Acad Sci USA 2005,102:8245-8250.
51. Hijmans RJ, Graham CH: The ability of climate envelope models topredict the effect of climate change on species distributions. GlobalChange Biol 2006, 12:2272-2281.
52. McKenney DW, Pedlar JH, Lawrence K, Campbell K, Hutchinson MF:Potential impacts of climate change on the distribution of NorthAmerican trees. Bioscience 2007, 57:939-948.
53. Dalen L, Nystrom V, Valdiosera C, Germonpre M, Sablin M, Turner E,Angerbjorn A, Arsuaga JL, Gotherstrom A: Ancient DNA reveals lack ofpostglacial habitat tracking in the Arctic fox. Proc Natl Acad Sci USA 2007,104:6726-6729.
54. Hill JK, Thomas CD, Fox R, Telfer MG, Willis SG, Asher J, Huntley B:Responses of butterflies to twentieth century climate warming:implications for future ranges. Proc Roy Soc B 2002, 269:2163-2171.
55. Daniels LD, Veblen TT: Spatiotemporal influences of climate on altitudinaltreeline in northern Patagonia. Ecology 2004, 85:1284-1296.
56. Parolo G, Rossi G: Upward migration of vascular plants following aclimate warming trend in the Alps. Basic Appl Ecol 2008, 9:100-107.
57. Lenoir J, Gegout JC, Marquet PA, de Ruffray P, Brisse H: A significantupward shift in plant species optimum elevation during the 20th
century. Science 2008, 320:1768-1771.58. Jump AS, Matyas C, Peñuelas J: The altitude-for-latitude disparity in the
range retractions of woody species. Treends Ecol Evol 2009, 24:694-701.
doi:10.1186/1471-2148-11-29Cite this article as: Beatty and Provan: Comparative phylogeography oftwo related plant species with overlapping ranges in Europe, and thepotential effects of climate change on their intraspecific geneticdiversity. BMC Evolutionary Biology 2011 11:29.
Submit your next manuscript to BioMed Centraland take full advantage of:
• Convenient online submission
• Thorough peer review
• No space constraints or color figure charges
• Immediate publication on acceptance
• Inclusion in PubMed, CAS, Scopus and Google Scholar
• Research which is freely available for redistribution
Submit your manuscript at www.biomedcentral.com/submit
Beatty and Provan BMC Evolutionary Biology 2011, 11:29http://www.biomedcentral.com/1471-2148/11/29
Page 11 of 11