Embed Size (px)
Citation preview

Research on E&P Efficiency Metrics to support SKK Migas Mission utilizing
CRISP-DM Methodology Bobby Suryajaya1 Frieda Putri Aryani1
Uma Bala Devarakonda1 Alva Erwin1 1 Swiss German University, EduTown BSDCity, Tangerang 15339, Banten, Indonesia
Abstract
SKK Migas has mission to supervise and control activities of upstream Oil & Gas. It is believed that by knowing efficiency lev-el of each PSC Contractor, improvement programs can be more effective and direct-ly hit the objective. This paper discusses research proposal on efficiency metrics using data mining techniques and its im-plementation feasibility as National Indi-cator.
Keywords: SKK Migas, Indicator, Effi-ciency, CRISP-DM, Clustering, Classifica-tion, Association Rule
1. Background
SKK Migas is The Special Task Force for Upstream Oil and Gas Business Activities Republic of Indonesia, previously known as BPMIGAS. Government as the founder has defined SKK Migas function as its mission, which is to supervise and control the Production Sharing Contracts’ (PSC) implementation through partnerships in order to ensure the effectiveness and effi-ciency of upstream oil and gas business activities for the greatest welfare of the nation.
In order to successfully perform its mis-sion, SKK Migas will need to have high quality and transparent data that is accu-rate, qualified, and can be retrieved timely.
On 2011, SKK Migas piloted SOT (Sistem Operasi Terpadu) to allow SKK Migas system to retrieve data from PSC Contrac-tors’ data-source and then process and store the important information to SKK Migas master database that can be summa-rized and reported automatically to the stakeholders. The SOT pilot selected 5 PSC Contractors that contributes 50% of Indonesia Oil & Gas Production.
2. Approach Framework – E&P Value Chain
This research uses Exploration & Produc-tion (E&P) Value Chain as approach framework, which is chain of E&P activi-ties performed by an Oil & Gas producer in order to deliver hydrocarbon where the value increases along the chain (Tordo, S. 2009). Value changes on hydrocarbon can be categorized as follow:
• Resource Potential (potential hy-drocarbon based on seismic sur-vey).
• Developable Capacity (developa-ble hydrocarbon based on explora-tion activity).
• Developed Capacity (maximum well deliverability).
• Available System Capacity (maximum production facility throughput).
• Production (processed hydrocar-bon, ready to sell).
International Conference on Advances in Intelligent Systems in Bioinformatics, Chem-Informatics, Business Intelligence, Social Media and Cybernetics (IntelSys)
© 2014. The authors - Published by Atlantis Press 13

• Sales (revenue generation). Figure 1 describes more detail on E&P
Value Chain.
RESOURCE'POTENTIAL'
DEVELOPABLE'CAPACITY'
DEVELOPED'CAPACITY'
AVAILABLE'CAPACITY'
PRODUCTION'
SALES'
Well'Losses'
Facility'Losses'
Export'Losses'
Fuel'&'Flare'
Planned'&'Unplanned'
Unavailable'Capacity'
New'Wells'&'
Facility'Expansion'
Asset%Efficiency%
Opera0ng%Efficiency%
Field%Efficiency%
Lower%Volume%Higher%Value%
Produc0on%Efficiency%
Fig. 1: E&P Value Chain
3. Proposed Control Indicators
3.1. Efficiency Metrics
Production data collected from SOT ena-bles SKK Migas to calculate Efficiency Ratios. It is simply a calculation based on input, output, and waste resulted from a production process.
Efficiency ratio is comparison between output of value chain and its input, for ex-ample comparing hydrocarbon produced by a facility with hydrocarbon flowed into facility. Normally, efficiency ratio will not exceed 100% since output will never be higher than input, and waste resulted by hydrocarbon processing is called Losses. Other names of losses are deferment or loss production opportunity (LPO).
At least following ratios can be calcu-lated: Asset, Operating, Production, and Field Efficiency.
In theory, the maximum sustainable amount of hydrocarbon that can flow through the well or facility depends on its capacity. Two important components on E&P Value Chain that can be considered as input are:
• Developed Capacity, also known as Maximum Well Deliverability or MWD.
• Available System Capacity or ASC.
Efficiency ratio calculation can use pro-duction and sales (lifting) data for the out-put. Therefore, efficiency ratios can be calculated as the following:
Asset _ Efficiency = SalesMWD
(1)
Operating _ Efficiency = SalesASC
(2)
Production_ Efficiency = ProductionMWD
(3)
Field _ Efficiency = ProductionASC
(4)
ASC can be calculated based on MWD, as built design of facility or field, or simp-ly agreement on throughput or capacity of facility or field. Sometime, ASC can also be used to calculate production if losses are known with following formula:
Production = ASC − Losses (5)
In real implementation, Efficiency Rati-os are derived mostly by the Losses in-stead of Production.
3.2. Efficiency Metrics as Control Indi-
cator
This research proposes the possibility of utilizing Efficiency Ratio as control indi-cator for SKK Migas to evaluate perfor-mance of PSC Contractors. Following is consideration of this research proposal:
• SKK Migas has ability to retrieve data requirement from PSC Con-tractor through SOT Production Monitoring initiative including MWD, ASC, Production, Sales, and Losses.
• SKK Migas through its PUPO-PPAM support the utilization of efficiency data.
• Efficiency Ratio has been widely benefited Oil & Gas Super Major Companies on evaluating their performance.

• Efficiency Ratio does not require complicated calculation.
• PSC Contractor may be already using Efficiency Ratio although in different form.
To be indicators, efficiency ratio must have criteria to evaluate performance (Paul Stevens, 2008). By using specific data mining technique such as clustering and classification, these criteria can be built.
3.3. Efficiency Metrics Contributor
and Co-occurrences
Once efficiency criteria are established, it can be associated with the Losses to de-termine what losses contribute to specific efficiency criteria. This can be analyzed based on losses occurrences or value using Association Rule Mining technique.
4. Methodology: CRISP-DM
CRISP-DM is a data mining standards drawn up by the three founders of data mining market namely Daimler Chrysler (Daimler-Benz), SPSS (ISL), and NCR. It consists of 6 life-cycle phases (Wirth, R., & Hipp, J.).
Business'Understanding'
Determine(Business(Objec0ves(
Assess(Situa0on(
Determine(Data(Mining(
Goals(
Produce(Project(Plan(
Data'Understanding'
Collect(Ini0al(Data(
Describe(Data(
Explore(Data(
Verify(Data(Quality(
Data'Prepara1on'
Select(Data(
Clean(Data(
Construct(Data(
Integrate(Data(
Format(Data(
Modeling'
Select(Modeling(Technique(
Generate(Test(Design(
Build(Model(
Assess(Model(
Evalua1on'
Evaluate(Results(
Review(Process(
Determine(Next(Steps(
Deployment'
Plan(Deployment(
Plan(Monitoring(
And(Maintenance(
Produce(Final(Report(
Review(Project(
Fig. 2: CRISP-DM Life-Cycle Phases
4.1. Phase 1 – Business Understanding
In this phase, it takes an understanding of the substance of the data mining activities that will be carried out, from the perspec-tive of business needs. The activities are: Business Objectives The business objective is to utilize effi-ciency ratio as control indicator by SKK
Migas to evaluate PSC Contractor perfor-mance. Data Mining Goals The goal from this research is to construct efficiency criteria and identify the losses that contribute to each of efficiency crite-ria. In addition it also looks for any co-occurrence of the losses that contribute to specific efficiency criteria. Project Plan The project plan is to propose methodolo-gy to SKK Migas on carrying out this re-search based on CRISP-DM life-cycle phases. 4.2. Phase 2 – Data Understanding
This phase tries to study the data to get to know and familiar with the data that will be used and identify data quality, detecting a subset pull off the data to make the ini-tial hypothesis. The activities are: Data Limitation Data limitation may include period of data, scope of data, magnitude of data, data complexity, data value, etc. Following might be the limitation: • Maximum one-year or equal to 365
rows of data. • The scope can be limited to one PSC
contractor. Data Format The data may be presented on Microsoft Excel format. Data Attributes This research will need at least data attrib-utes as defined on table 1. 4.3. Phase 3 – Data Preparation
This phase includes several activities such as data selection and cleansing. For exam-ple, prior to use data mining tools, data must not contain “null” label, especially for losses volume. If there are no losses, then data can be set as “0” (zero) instead of null.
If there are too many data attributes e.g. losses event categories, prioritization can
be done due to hardware or resources limi-tation. For this purpose, Pareto diagram can be used to filter TOP-20 or TOP-40 losses event categories.
4.4. Phase 4 – Modeling
This phase determines the data mining techniques that will be used, specify tools data mining, data mining algorithms, and determine the parameters to get optimal value.
This research is supported by various data mining techniques visualization such as Clustering, Classification, and Associa-tion Rule techniques and Rapid Miner will be used as data-mining tool. Clustering Clustering algorithms are applied on a giv-en data set iteratively until any meaningful derivations could be found in the result. The clusters thus formed can be non-overlapping collection of data points that are similar to each other (K-Means algo-rithm). Or they can be a set of nested clus-ters organized as a hierarchical tree (Ag-glomerative Hierarchical clustering). (Tan et al., 2006)
Validity of clusters highly depends upon two factors. One, choosing right repre-sentative and the other is to identify simi-larities between various datasets. (V.Ilango, 2011)
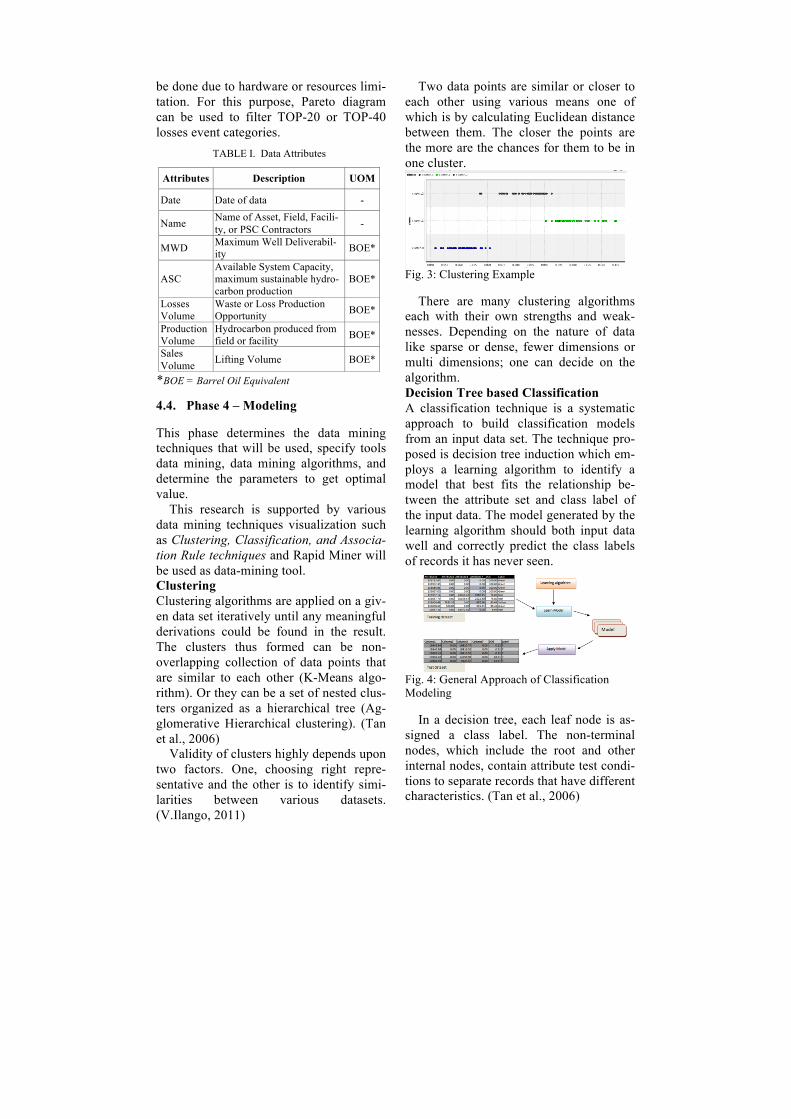
Two data points are similar or closer to each other using various means one of which is by calculating Euclidean distance between them. The closer the points are the more are the chances for them to be in one cluster.
Fig. 3: Clustering Example
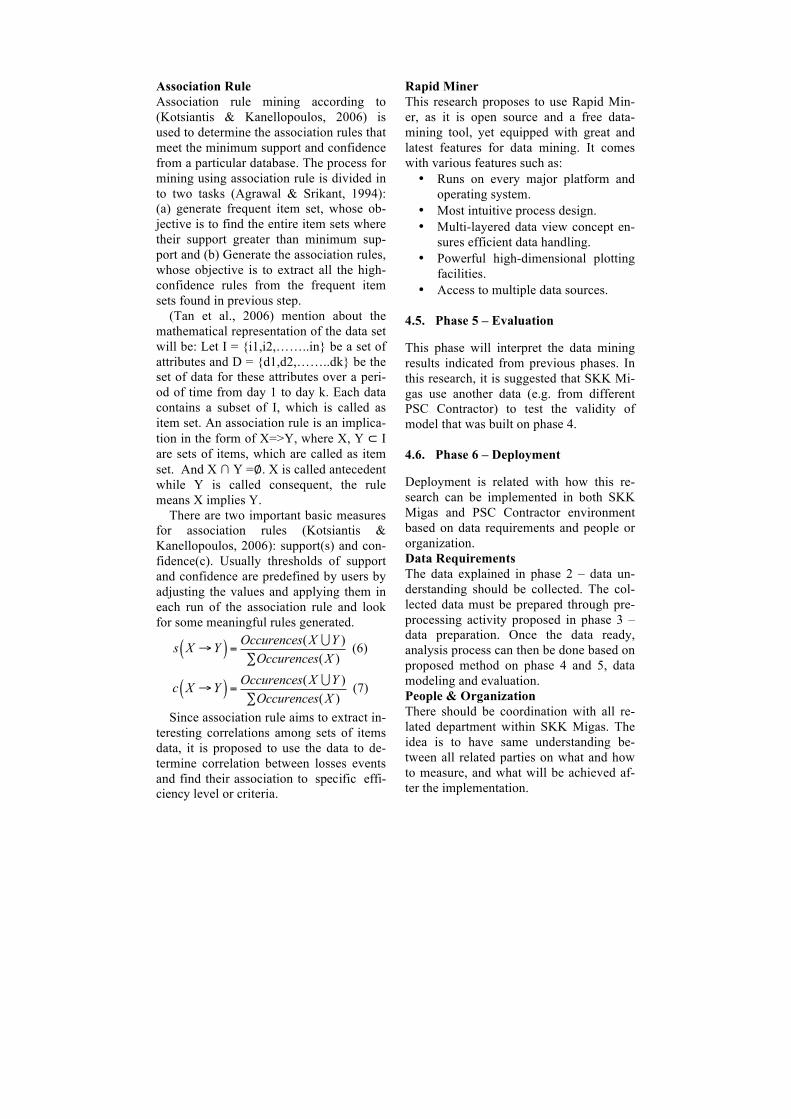
There are many clustering algorithms each with their own strengths and weak-nesses. Depending on the nature of data like sparse or dense, fewer dimensions or multi dimensions; one can decide on the algorithm. Decision Tree based Classification A classification technique is a systematic approach to build classification models from an input data set. The technique pro-posed is decision tree induction which em-ploys a learning algorithm to identify a model that best fits the relationship be-tween the attribute set and class label of the input data. The model generated by the learning algorithm should both input data well and correctly predict the class labels of records it has never seen.
Fig. 4: General Approach of Classification Modeling
In a decision tree, each leaf node is as-signed a class label. The non-terminal nodes, which include the root and other internal nodes, contain attribute test condi-tions to separate records that have different characteristics. (Tan et al., 2006)
TABLE I. Data Attributes
Attributes Description UOM
Date Date of data -
Name Name of Asset, Field, Facili-ty, or PSC Contractors -
MWD Maximum Well Deliverabil-ity BOE*
ASC Available System Capacity, maximum sustainable hydro-carbon production
BOE*
Losses Volume
Waste or Loss Production Opportunity BOE*
Production Volume
Hydrocarbon produced from field or facility BOE*
Sales Volume Lifting Volume BOE*
*BOE = Barrel Oil Equivalent
Association Rule Association rule mining according to (Kotsiantis & Kanellopoulos, 2006) is used to determine the association rules that meet the minimum support and confidence from a particular database. The process for mining using association rule is divided in to two tasks (Agrawal & Srikant, 1994): (a) generate frequent item set, whose ob-jective is to find the entire item sets where their support greater than minimum sup-port and (b) Generate the association rules, whose objective is to extract all the high-confidence rules from the frequent item sets found in previous step.
(Tan et al., 2006) mention about the mathematical representation of the data set will be: Let I = {i1,i2,……..in} be a set of attributes and D = {d1,d2,……..dk} be the set of data for these attributes over a peri-od of time from day 1 to day k. Each data contains a subset of I, which is called as item set. An association rule is an implica-tion in the form of X=>Y, where X, Y ⊂ I are sets of items, which are called as item set. And X ∩ Y =∅. X is called antecedent while Y is called consequent, the rule means X implies Y.
There are two important basic measures for association rules (Kotsiantis & Kanellopoulos, 2006): support(s) and con-fidence(c). Usually thresholds of support and confidence are predefined by users by adjusting the values and applying them in each run of the association rule and look for some meaningful rules generated.
s X →Y( ) = Occurences(X Y )∑Occurences(X )
(6)
c X →Y( ) = Occurences(X Y )∑Occurences(X )
(7)
Since association rule aims to extract in-teresting correlations among sets of items data, it is proposed to use the data to de-termine correlation between losses events and find their association to specific effi-ciency level or criteria.
Rapid Miner This research proposes to use Rapid Min-er, as it is open source and a free data-mining tool, yet equipped with great and latest features for data mining. It comes with various features such as: • Runs on every major platform and
operating system. • Most intuitive process design. • Multi-layered data view concept en-
sures efficient data handling. • Powerful high-dimensional plotting
facilities. • Access to multiple data sources.
4.5. Phase 5 – Evaluation
This phase will interpret the data mining results indicated from previous phases. In this research, it is suggested that SKK Mi-gas use another data (e.g. from different PSC Contractor) to test the validity of model that was built on phase 4. 4.6. Phase 6 – Deployment
Deployment is related with how this re-search can be implemented in both SKK Migas and PSC Contractor environment based on data requirements and people or organization. Data Requirements The data explained in phase 2 – data un-derstanding should be collected. The col-lected data must be prepared through pre-processing activity proposed in phase 3 – data preparation. Once the data ready, analysis process can then be done based on proposed method on phase 4 and 5, data modeling and evaluation. People & Organization There should be coordination with all re-lated department within SKK Migas. The idea is to have same understanding be-tween all related parties on what and how to measure, and what will be achieved af-ter the implementation.

5. Conclusion
Efficiency Metrics are common indicator used by any industry to measure perfor-mance of an entity. In Oil & Gas industry, efficiency refers to hydrocarbon process flow that can be measured quantitatively based on E&P Value Chain as explained on section 3.1.
Based on justifications explained on sec-tion 3.2 supported by CRISP-DM methodolo-gy, SKK Migas has higher successful proba-bility to implement efficiency indicators na-tionally, considering that all required data is recorded and reported regularly by all PSC Contractors to SKK Migas.
However, it was found that not all rec-orded and reported data is following SKK Migas standard such as report format and data acquisition point, which may produce different calculation result. This may hap-pen due to different standard adoption by each PSC contractors, where multinational companies normally follow their head quarter’s standard. Therefore, socialization prior to implementation for all PSC con-tractors is mandatory to ensure same un-derstanding.
In order to ensure successful implemen-tation, initial observation should be con-ducted to assess all possibilities and find out possible challenges or kickback such as unwillingness of one PSC contractor to provide more detail data following other PSC contractors.
6. Recommendation for SKK Migas
This research is essential to success of Ef-ficiency Metrics implementation. Hence, a more focus organization such as educa-tional institution or professional consultant should perform this research instead of SKK Migas internal resources that might be occupied with day-to-day work. How-ever, confidentiality of data must be con-sidered if third party involves.
This research is only one aspect that supports DOE implementation. Further- more, the research scope can be expanded to following aspects: Governance, Risk Management, System Architecture, Secu-rity, etc.
7. Acknowledgment
The authors wish to thank Head of SKK Migas Management Information System (MIS) Division and MIS Data Analysis Team for their full support on this re-search.
8. References
[1] Republik Indonesia, 2013. Upstream Oil & Gas Activity. PERPRES.
[2] Tordo, S. (2009) Oil, Gas, and Mining Policy Division The World Bank 'The Petroleum Sector Value Chain', Study on National Oil Companies and Value Creation.
[3] Stevens, P. Ph.D. (2008) 'A Methodology For Assessing The Performance Of National Oil Companies ', Study on National Oil Companies and Value Creation.
[4] Vanner, R. (2005) 'Energy Use in Offshore Oil and Gas Production: Trends and Drivers for Efficiency from 1975 to 2025 ', A Methodology for Measuring Sectoral Sustainable Development and its application to the UK oil & gas sector.
[5] Overview Of The Oil And Gas Exploration And Production Process. (2005). Environmental Management In Oil And Gas Exploration And Production, 4-10.
[6] Agrawal, R. & Srikant, R., 1994. Fast Algorithms for Mining Association Rule. Proceedings of the 20th VLDB Conference.
[7] Aven, T., n.d. Availability evaluation of oil/gas production and transportation systems.
[8] Han, J. & Pei, J., 2000. Mining Frequent Patterns by Pattern-Growth: Methodology and Implications. ACM SIGKDD Explo-rations Newsletter, 2, pp.14-20.
[9] Jairam Kamath, C.E.T.C. & Catherine Laroche, I.F.d.P., 2003. Laboratory-Based Evaluation of Gas Well Deliverability Loss Caused by Water Blocking. SPE Journal, Volume 8, Number 1.
[10] Kotsiantis, S. & Kanellopoulos, D., 2006. Association Rules Mining: A Recent Overview. GESTS International Transactions on Computer Science and Engineering, 32 (1), pp.71-82.
[11] Ramageri, B.M., n.d. Data Mining Techniques and Applica-tions. Indian Journal of Computer Science and Engineering, 1(4), pp.301-05.
[12] Tan, P.-N., Steinbach, M. & Kumar, V., 2006. Introduction to Data Mining. Pearson International.
[13] V.Ilango, D.R.S.D.V.V..p., 2011. Cluster Analysis Research Design model, problems, issues, challenges, trends and tools. International Journal on Computer Science and Engineering, III (ISSN: 0975-3397), p.6.
[14] Veil, J.A., 2003. Innovative Technologies for Managing Oil Field Waste. J. Energy Resources. Technol., 125(3, 238), p.11.
[15] Sagli, J.R., Klumpen, H.E., Nunez, G. and Nielsen, F. (n.d) 'Improved Production and Process Optimization Through People, Technology, and Process', 2007 SPE Annual Technical Conference and Exhibition.
[16] Wirth, R., & Hipp, J. (n.d.). CRISP-DM: Towards a Standard Process Model for Data Mining.
[17] Wang, T., Gao, X.-w., & Li, K. (2012, May 23-25). Application of data mining to production operation and control system in oil field. Control and Decision Conference (CCDC), 642, 647.