Embed Size (px)
Citation preview

Siddharth Rajeev, B.Tech, MBA, CFA Analyst
August 17, 2016
2016 Fundamental Research Corp. “10+ Years of Bringing Undiscovered Investment Opportunities to the Forefront “ www.researchfrc.com
PLEASE READ THE IMPORTANT DISCLOSURES AT THE BACK OF THIS REPORT
RESCO Mortgage Investment Corporation – Focus on Second Mortgages in Ontario
Sector/Industry: Real Estate Mortgages www.rescomic.com
IssuerRESCO Mortgage Investment
CorporaEon
Date of OM 01-Mar-16
Offering up to $20M
Securities Offered Class B Preferred Shares
Unit Price $10
Minimum Subscription $10,000
Management Fee 1.50% p.a. of AUM (paid monthly)
Distribution to Investors100% annual net income before
taxes (paid monthly)
AuditorRosenswig McRae Thorpe LLP
Chartered Accountant
Offering Summary
FRC Rating
Expected Yield (next
12M)8% p.a.
Rating 3-
Risk 3
*see back of report for rating definitions
Investment Highlights
� RESCO Mortgage Investment Corporation (“RESCO”,
“company”) is a Mortgage Investment Corporation (“MIC”) primarily focused on investing in second mortgages secured by residential properties in the urban areas of Ontario (“ON”).
� RESCO was formed in November 2013. Investors have so far received an average distribution of 8% p.a. since inception.
� As of May 31, 2016, the MIC had $12.88 million in mortgages secured by 176 properties (average - $73k). 100% of the portfolio was secured by residential mortgages and the loan-to-value (“LTV”) was 79%.
� Management and board have invested approximately $1.03 million in the MIC on the same terms as investors.
� We are assigning an overall rating of 3-, with a risk rating of 3 on the Class B preferred shares.
Risks
� Loans are short term and need to be sourced and replaced quickly.
� Timely deployment of capital is crucial. � A drop in housing prices in the Greater Toronto Area
(“GTA”) will result in higher LTVs, and higher default risk as the value of collateral decreases.
� Volatility in real estate prices. � Redemptions are not guaranteed as with most comparable
offerings. � Management expects the portfolio’s mix to be approximately
80% ON, which may expose the MIC to geographical risks.

Page 2
2016 Fundamental Research Corp. “10+ Years of Bringing Undiscovered Investment Opportunities to the Forefront “ www.researchfrc.com
PLEASE READ THE IMPORTANT DISCLOSURES AT THE BACK OF THIS REPORT
Overview
Mortgage Investment Corporations, like other non-bank private lenders, do not conform within the strict lending guidelines of banks and other traditional lenders. MICs are more flexible in their lending guidelines, and therefore, can offer individually structured / tailor made loans to meet the specific requirements of a borrower. Also, banks have lengthy due diligence processes (up to 2 months), and are typically not able to meet borrowers’ quick capital needs. Most MICs are typically able to structure, complete due diligence, and fund loans, within 2 - 4 weeks. All the above reasons allow non-bank lenders, including MICs, to charge a higher interest rate on their loans compared to banks / institutional lenders. The following chart shows the business model of a typical MIC.
Sources: canadianmortgagetrends.com
Management looks for a viable exit strategy when assessing a loan application. There is a wide variety of exit strategies, but the most common exits would be refinancing by a more traditional lender, sale of the property, etc. MICs are governed by Section 130.1 of the Income Tax Act. In order for an entity to maintain its status as a MIC, it has to comply with several rules; a few of the key rules are listed below. For the full list, refer to the Income Tax Act, Section 130.1.
• Invest at least 50% of its assets in residential mortgage loans
• Have a minimum of 20 shareholders, and no shareholder can own 25%+ of the total outstanding shares
• All MIC investments must be in Canada

Page 3
2016 Fundamental Research Corp. “10+ Years of Bringing Undiscovered Investment Opportunities to the Forefront “ www.researchfrc.com
PLEASE READ THE IMPORTANT DISCLOSURES AT THE BACK OF THIS REPORT
Manager
MICs pay no corporate tax and act as a flow-through entity. In order to avoid entity level taxation, a MIC has to payout 100% of all of its taxable income to shareholders. MIC distributions are treated as interest income for shareholder tax purposes. MIC shares are eligible for registered plans such as RRSPs, RESPs, and TFSAs.
RESCO Mortgage Investment Corporation was created in November 2013, with Radiance Mortgage Brokerage Inc. (a licensed mortgage broker / franchise of Mortgage Architects) as the Manager and 5C Capital Inc. as the Administrator. Their head office is in Markham, Ontario. The Manager and the Administrator were incorporated in September 2013. Both entities are owned by David Ho (50%), Will Sung (25%), Chris Cheng (15%) and Phoebe Lam (10%). As per management, the Manager currently originates approximately $10
million mortgages per year. As with most private lenders, the Manager typically receives a brokerage fee (approximately 3%) at the time of origination. These fees are not passed on to the MIC. The Manager / Administrator currently do not originate / administer loans for third parties. At the end of May 2016, the MIC held approximately $14.5 million of shareholders’ capital across 190 investors.
Brief biographies of the management team, as provided by in the OM, follow:
David Ho - President
David graduated from university in 1975 and since then has accumulated 8 years of Management Accounting experience with one of the largest companies in Hong Kong. David immigrated to Canada in 1984 with his family and started his financial career mainly in managing and agency building with insurance companies. In 2000, David started his own brokerage company, Torce Financial Group which is in the business of marketing and distributing products in the insurance and wealth management industry. Torce Financial Group currently has over 1,000 brokers associated with it in five offices located in Toronto, Vancouver and Hong Kong. David joined the Richmond Hill and Markham Chinese Business Association in 1999 as a director with the primary objective being to promote and explore business opportunities with the members in these areas. He was elected as the President of the Association in 2005 (for a period during the years 2005-2007). After fulfilling his two-year term as a president, he has remained on the board of directors to share his experience and wisdom with his fellow directors. His primary goals are expanding membership and providing further resources and business assistance to help members grow their businesses.
Chris Cheng - COO
Chris Graduated from the University of Windsor with a Bachelor of Science degree (Biology) in 1989 and with a Bachelor of Art degree (Economics) in 1991 and obtained his mutual funds license in 1993 and completed the CSI Branch Compliance Officer course in 2002. Chris joined TD Canada Trust in 1992 and held a number of senior positions within the organization such as Director of TD Mutual Funds, Personal Loan Officer, Branch Manager and District Vice-President for the Greater Toronto Area managing over 16 branches and 280+ employees. Chris then became a Director of one of the Mortgage

Page 4
2016 Fundamental Research Corp. “10+ Years of Bringing Undiscovered Investment Opportunities to the Forefront “ www.researchfrc.com
PLEASE READ THE IMPORTANT DISCLOSURES AT THE BACK OF THIS REPORT
Investment Corporations in North York from 2011 to 2013. In his capacity as a Director his primary responsibility was in the area of risk management, which included managing the portfolio risk by developing underwriting guidelines and funding procedures, underwriting deals, managing renewals, delinquency, and other similar matters. Chris is a licensed mortgage broker registered with the Financial Services Commission of Ontario. He is also a member of Private Capital Markets Association of Canada, Independent Mortgage Brokers Association of Ontario (IMBA) and Canadian Association of Accredited Mortgage Professionals (CAAMP). Chris is also a licensed Exempted Market Dealing Representative registered in Ontario and British Columbia.
Franky Tse – Director
Frank is the newest member of our Board of Directors. He graduated at Wilfred Laurier University in 1982 and further his study at York University with a Bachelor of Business Administrative Study degree in 1985. Frank worked at Air Canada and New York Life in his early career then he became the President of People Insurance Company Limited in 1994, managing a team of over 60 employees and agents. Frank is an accomplished and versatile business leader with over 20+ years of experience in comprehensive financial planning and wealth management.
Will Sung – Director
Will Sung has been active in the real estate industry in Toronto since 1984. In 1989 he established Landstars Realty Inc. Since joining the Century21 franchise system in 1991, Landstars Realty has earned and maintained the status of a ‘Centurian Office' within the organization. ‘Centurian Office' is an honourable recognition granted to those offices with remarkable sales achievement. Will is reputable and known within the industry for being creative and pioneering. During the recession in the early 1990's, Will innovatively cultivated a Canadian Asian market along Highway 7 between Leslie Street and Bayview Avenue in Richmond Hill of Ontario. His success in launching over one million square feet of commercial condominiums to Asian entrepreneurs then has been regarded as a real estate miracle. He is currently the owner of the Landstars 360 Realty Inc. Brokerage. Besides being the founding director of the Richmond Hill & Markham Chinese Business Association, Will is also the president of the Vaughan Chinese Business Association. His mission is to bring forth a closer tie between Canadian entrepreneurs and their Chinese counterparts.
Phoebe Lam – Director
Phoebe earned her degrees and certifications from the University of Waterloo and the University of Washington. She developed strong analytical and project management skills working as a Research Development Coordinator at Harborview Medical Centre in Seattle and at Rush Medical Centre in Chicago. In the summer of 2011, she moved to Canada and obtained her mortgage agent license working for the Mortgage Centre and as Sales Manager at Torce Capital Inc. She achieved the Top New Mortgage Agent Award in 2012 and has demonstrated a passion and a world of knowledge on real estate investment and mortgage financing. Phoebe is now the franchise owner and Principal Broker of Mortgage Architects – Radiance Mortgage in Markham, Ontario. She is also an Accredited Mortgage Professional and a member of CAAMP and IMBA. She successfully completed the Moody's Analytics Certification for Analyzing Commercial Real Estate course offered by the Canadian

Page 5
2016 Fundamental Research Corp. “10+ Years of Bringing Undiscovered Investment Opportunities to the Forefront “ www.researchfrc.com
PLEASE READ THE IMPORTANT DISCLOSURES AT THE BACK OF THIS REPORT
Investment
Criteria
Current
Portfolio
Securities Institute. In addition to the above, she is an experienced land investor, actively involved in a number of land development projects in Ontario, Alberta, Florida, California and Washington. Mortgages are sourced through third-party brokers. The MIC does not have any employees as all of the work is contracted out to Radiance and 5C Capital. Radiance and 5C Capital currently have four employees (in addition to Phoebe Lam and Chris Cheng), including one senior underwriter, two junior underwriters, and a bookkeeper.
We believe that the board of a company should include independent or unrelated directors who are free of any relationships or business that could materially interfere with the director’s ability to act in the best interest of the company. Resco’s board has five
members, of which, one is independent. Franky Tse is a Director and shareholder of RESCO MIC, but not a shareholder of the Manager or the Administrator. Our discussions with management indicated that they expect to add two more independent directors to the board.
Management and board have invested approximately $1.03 million in the MIC on the same terms as investors. Management’s key investment criteria are summarized below:
• The MIC’s primary focus is on single family properties, which includes single family dwellings, condominiums, townhomes, semi-detached, etc.
• No more than 5% of the portfolio will be in third mortgages.
• No greater than 20% of the portfolio will be invested with one borrower.
• No greater than 20% of the portfolio will be invested in a single mortgage.
• Although the MIC is primarily in residential properties, the MIC may invest in commercial (capped at 30% of the portfolio) or land development loans (capped at 15% of the portfolio).
• Maximum LTV of 85% on residential properties, 75% for commercial, mixed-use, or construction mortgages, and 50% for land development loans.
• The MIC will not lend capital to related parties.
• The MIC will not invest directly in real property except when acquired through foreclosures.
As of May 31, 2016, the MIC had $12.88 million in mortgages secured by 176
properties (average - $73k). The following table shows a summary of the portfolio.
29-Feb-16 31-May-16
Mortgages Outstanding $10,311,137 $12,883,687
No. of Mortgages 163 176
Average mortgage value $63,259 $73,203
Weighted average interest rate 12.15% 11.30%
Weighted average LTV 81.1% 79.2%

Page 6
2016 Fundamental Research Corp. “10+ Years of Bringing Undiscovered Investment Opportunities to the Forefront “ www.researchfrc.com
PLEASE READ THE IMPORTANT DISCLOSURES AT THE BACK OF THIS REPORT
The high number of mortgages and the relatively low average mortgage amounts offer
the MIC good diversification. Loan sizes in the portfolio ranged between $25k and $500k.
100% of the portfolio was secured by residential mortgages and the LTV was 79.2% as of May 31, 2016. None of the mortgages have a LTV higher than 85%. According to management, approximately 90% of the portfolio is secured by detached houses, and approximately 95% of the properties are owner occupied. Management’s goal is to expand
the portfolio to $20 million by the end of the year. The mortgage terms are typically 6 to 24 months, with 91% having a term of up to one year. This provides a high level of liquidity to the mortgage portfolio. As per management, typically 30% of their borrowers renew at the end of their terms.
The current first mortgage rates charged by the MIC to borrowers range between 7.99% p.a. and 9.99% p.a., and second mortgage rates range between 8.99% p.a. to 14.99% p.a.

Page 7
2016 Fundamental Research Corp. “10+ Years of Bringing Undiscovered Investment Opportunities to the Forefront “ www.researchfrc.com
PLEASE READ THE IMPORTANT DISCLOSURES AT THE BACK OF THIS REPORT
Management indicated to us that their rates are in line with the rates offered by comparables.
First mortgages accounted for 12.8% of the portfolio as of May 31, 2016. Second mortgages accounted for 86.2%, and third mortgages accounted for 1%. Management expects the percentage of first mortgages to be approximately 15% for the next 12 – 24 months.
Geographical Diversification: The chart below outlines the portfolio’s distribution of mortgages by location. Approximately 78.5% of the portfolio, as of May 31, 2016, was secured by properties in Ontario. Over 90% of these mortgages are in GTA. Manitoba accounted for 21%, and AB accounted for the remaining 0.5%.
Although MICs tend to geographically diversify their portfolios as they expand, our discussions with management indicated that they will continue to have a strong focus within the GTA. They expect the portfolio’s mix to be approximately 80% ON.

Page 8
2016 Fundamental Research Corp. “10+ Years of Bringing Undiscovered Investment Opportunities to the Forefront “ www.researchfrc.com
PLEASE READ THE IMPORTANT DISCLOSURES AT THE BACK OF THIS REPORT
Private
Lending
Market
The private mortgage lending market is a highly competitive market, and is highly affected by changes in interest rates and home prices. The currently low interest rate environment has been attracting a lot of investors to higher yield opportunities, such as MICs. The structure of MICs makes it so their income is minimally affected by home prices and interest rates in the short term. As the average term to maturity of the mortgages in the portfolio is
under 12 months, the MIC can re-price interest rates quickly. However, long term real estate prices will have an impact on the deal flow due to the following:
• If prices decrease, there will be less activity, mainly because people hold off purchasing and selling, until the market stabilizes.
• Borrowers will have less collateral to borrow with. A decrease in market activities will reduce mortgage volume, which will impact lenders’ deal flow.
A recent report published by the Canadian Association of Accredited Mortgage Professionals (“CAAMP”) indicated that there are currently approximately 9.62 million homeowners in Canada, of whom, about 5.64 million have mortgages and may also have a home equity line of credit. Over 85% of homeowners have 25% or more equity in their homes. Approximately 11% of homeowners took equity out of their home (averaging $55k) in the past year, totaling $63 billion. The most common uses of the funds are listed below:
• $20.6 billion (33%) for debt consolidation / repayment
• $17.4 billion (28%) for renovation / home repair
• $6.6 billion (11%) used for purchases (including education)
• $7.7 billion (12%) is for investments, and
• $10.3 billion (16%) is for other purposes Total residential mortgage credit in Canada has increased from $0.42 trillion in 2000, to $1.36 trillion by November 2015, reflecting a compounded annual growth rate (“CAGR”) of 7.8%.

Page 9
2016 Fundamental Research Corp. “10+ Years of Bringing Undiscovered Investment Opportunities to the Forefront “ www.researchfrc.com
PLEASE READ THE IMPORTANT DISCLOSURES AT THE BACK OF THIS REPORT
Data Source: Statistics Canada
The YOY growth in credit has declined significantly from the pre-recession years, but has been increasing in recent years due to the low interest rate environment.
Data Source: Statistics Canada
Chartered banks, credit unions, life insurance companies, pension funds and related entities accounted for 93.34% of the total mortgage credit as of August 2015. The remaining loans (approximately $89 billion) were from trusts, mortgage companies, and non-depository credit intermediaries.

Page 10
2016 Fundamental Research Corp. “10+ Years of Bringing Undiscovered Investment Opportunities to the Forefront “ www.researchfrc.com
PLEASE READ THE IMPORTANT DISCLOSURES AT THE BACK OF THIS REPORT
In a study we conducted for the CMHC in 2015, we built a database of 72 entities that operate as MICs or have similar structures, across the country through management interviews, surveys, public filings, company websites, etc. We estimate there may be 200 to 300 MICs in the country. We estimate the total outstanding mortgages of the 72 MICs to be approximately $6.74 billion, reflecting 0.5% of the total mortgages outstanding in Canada. Since our database includes almost all of the larger MICs, we estimate that our study represents at least 75% of the total mortgages held by the MIC industry. Factors contributing to increased private lending - Subsequent to the recession of 2008, there have been several changes in mortgage rules in Canada as the government began to tighten mortgages rules in an effort to further strengthen the Canadian housing finance system.
• Minimum down payment increased to at least 5% for home buyers (previously no down payment was required), and to 20% for non-owner occupied properties (investment/speculative properties).
• The maximum amortization period has been reduced to 25 years from 40 years.
• Lowered the maximum amount that can be borrowed from 95% to 80% of the value of the homes when refinancing.
• Limiting the maximum gross debt service (“GDS”) ratio to 0.39x and the maximum total debt service (“TDS”) ratio to 0.44x. GDS reflects the portion of a homeowner’s gross annual income required to meet payments related to housing, such as mortgage principal and interest, property taxes, etc. TDS reflects the portion of a homeowner’s gross annual income required to meet all debt payments.
Page 11
2016 Fundamental Research Corp. “10+ Years of Bringing Undiscovered Investment Opportunities to the Forefront “ www.researchfrc.com
PLEASE READ THE IMPORTANT DISCLOSURES AT THE BACK OF THIS REPORT
• Government-backed mortgage insurance made available to homes with a price of less than $1 million.
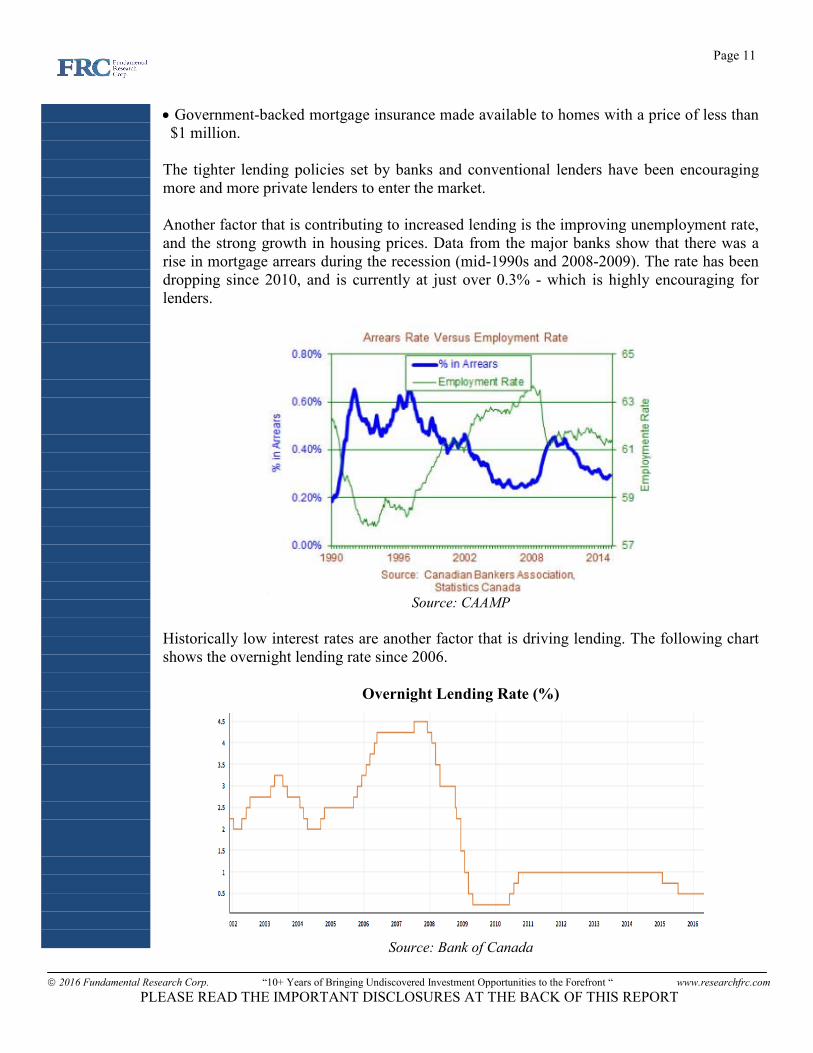
The tighter lending policies set by banks and conventional lenders have been encouraging more and more private lenders to enter the market. Another factor that is contributing to increased lending is the improving unemployment rate, and the strong growth in housing prices. Data from the major banks show that there was a rise in mortgage arrears during the recession (mid-1990s and 2008-2009). The rate has been dropping since 2010, and is currently at just over 0.3% - which is highly encouraging for lenders.
Source: CAAMP
Historically low interest rates are another factor that is driving lending. The following chart shows the overnight lending rate since 2006.
Overnight Lending Rate (%)
Source: Bank of Canada

Page 12
2016 Fundamental Research Corp. “10+ Years of Bringing Undiscovered Investment Opportunities to the Forefront “ www.researchfrc.com
PLEASE READ THE IMPORTANT DISCLOSURES AT THE BACK OF THIS REPORT
Toronto Market
The major banks currently offer one-year fixed mortgage rates at about 3% p.a. to borrowers, while rates offered by MICs range between 5% - 15% p.a. Although there have been uncertainties about the future of the Toronto real estate market especially due to the rapid rise in price / sales (see chart below), we believe the market is reasonably healthy, and do not expect any major drop in prices.
The following table, which shows the Ontario Chamber of Commerce’s forecasts, indicates that population growth and unemployment rates in the Toronto Region are expected to stay healthy through 2017.
Regional Economic Summary: Toronto Region
2013 2014 2015 2016E 2017E
Unemployment Rate 8.20% 8.00% 7.30% 6.90% 6.70%
Population (000s) 6,269 6,358 6,440 6,530 6,626
% ch. 1.4 1.4 1.3 1.4 1.5
MLS® Res. Sales 94,588 99,193 107,400 114,300 119,200
% ch. 0.9 4.9 8.3 6.4 4.3
MLS® Res. Avg. Price 529,948 573,183 625,800 680,400 730,100
% ch. 5.1 8.2 9.2 8.7 7.3
Residential Permits (Units) 40,256 35,136 42,000 46,500 48,500
% ch. 3.6 -12.7 19.5 10.7 4.3
Source: Ontario Chamber of Commerce
The soft oil price environment is expected to keep the C$ weak in the next 12 – 24 months

Page 13
2016 Fundamental Research Corp. “10+ Years of Bringing Undiscovered Investment Opportunities to the Forefront “ www.researchfrc.com
PLEASE READ THE IMPORTANT DISCLOSURES AT THE BACK OF THIS REPORT
(as shown below), which we believe will continue to encourage international buyers.
Toronto is expected to continue to be the most popular destination for immigrants. In 2015, approximately 30.2% of the immigrants to Canada chose Toronto.
Source: The Canadian Magazine of Immigration
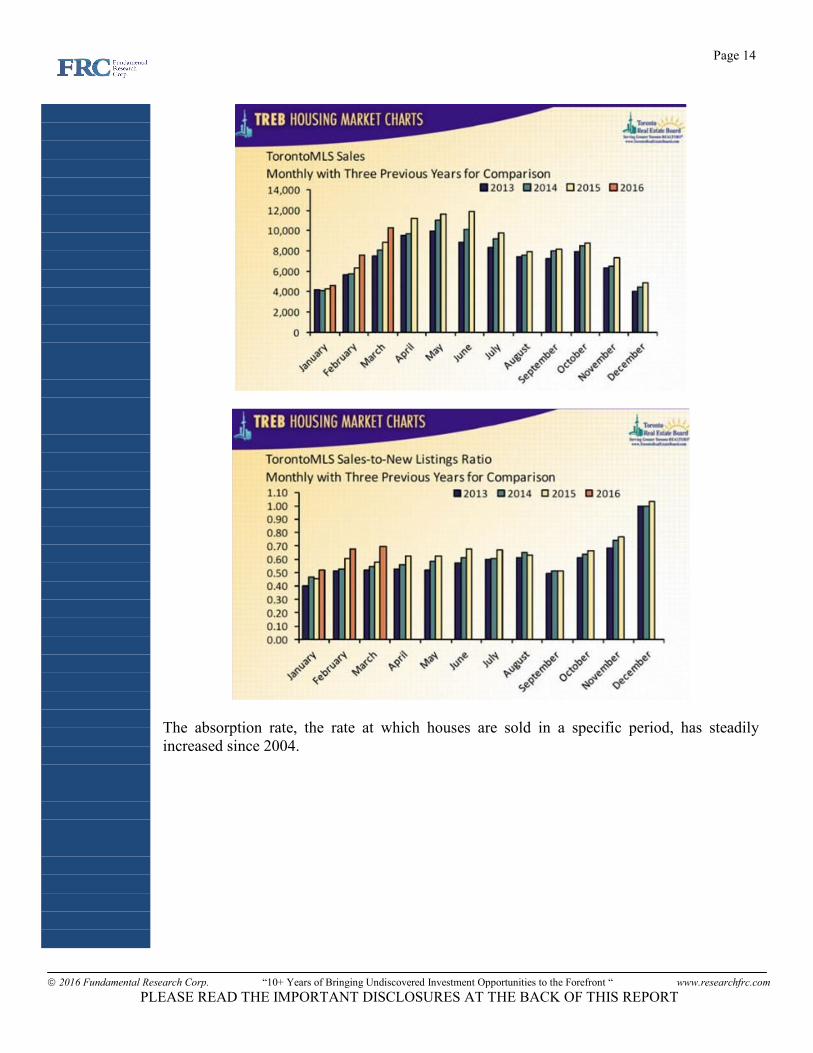
According to the Toronto Real Estate Board (“TREB”), TREB MLS® home sales in Q1-2016 were 22,575, up 16% YOY. The following charts show the strong YOY sales growth and the high sales to new listings ratio. TREB estimates 2016 will mark a second
consecutive record year for home sales.
Page 14
2016 Fundamental Research Corp. “10+ Years of Bringing Undiscovered Investment Opportunities to the Forefront “ www.researchfrc.com
PLEASE READ THE IMPORTANT DISCLOSURES AT THE BACK OF THIS REPORT
The absorption rate, the rate at which houses are sold in a specific period, has steadily increased since 2004.

Page 15
2016 Fundamental Research Corp. “10+ Years of Bringing Undiscovered Investment Opportunities to the Forefront “ www.researchfrc.com
PLEASE READ THE IMPORTANT DISCLOSURES AT THE BACK OF THIS REPORT
Source: TREB
According to TREB, there is a persistent lack of inventory for single, semi and townhouses in the GTA, primarily because most of the new supply over the past decade has come from new condominiums. The following chart shows the decline in single housing starts.
Data from: Canadian House Observer
A recent survey conducted by Ipsos indicated that 12% of GTA households are
seriously considering purchasing a home in 2016. All the above factors, along with the historically low interest rate environment, we believe, will keep the GTA real estate market healthy in the near-term. Canada’s real estate market (especially Vancouver) is highly influenced by foreign investment. The Bank of Canada estimates that Chinese investment accounts for $12.7 billion in real estate sales in Vancouver, representing 33% of the total sales. In July 2016, the B.C. government introduced legislation that added a 15% property transfer tax on foreign
Page 16
2016 Fundamental Research Corp. “10+ Years of Bringing Undiscovered Investment Opportunities to the Forefront “ www.researchfrc.com
PLEASE READ THE IMPORTANT DISCLOSURES AT THE BACK OF THIS REPORT
Structure
Financials
nationals buying real estate in Metro Vancouver – a move, we believe, that is likely to curb foreign investment and eventually lead to a price correction. We expect this may drive a
segment of foreign investors from Vancouver to the Toronto market. However, it may
be possible that the Ontario government may adopt similar measures to curb foreign
investment and/or cool down Toronto’s real estate market.
At the end of May 2016, the MIC held approximately $14.5 million of shareholders’ investment in Class B preferred shares. Management owns 100% of the common shares. The MIC primarily raises capital through exempt market dealers, and offers up to 5% as sales commissions. The MIC also pays a fee of up to 2% of the gross proceeds raised to EMDs, and 1.5% of the gross proceeds raised to the Manager. In summary, a total of up to 8.5% of the gross proceeds is allocated for fees, which we believe is much higher than comparable MICs. However, the MIC's actual fees to date have been much lower. Management states that the total sales commission and fees to EMDs have been approximately 3.25% - 4.25% versus the maximum of 7% indicated in the OM.
Management fees: 1.5% p.a. of the book value of the gross assets under management + 3% of the lenders fee collected from the borrowers upon origination. We believe the fees are in line with comparables. Most comparable MICs, we estimate, typically charge a flat management fee of 1% - 2% p.a. and a share of the lenders fee. Redemption: There is no market or exchange that the preferred shares trade on. Investors are allowed to submit redemption requests at any time. The redemption amount is subject to the following penalties in the first four years of investment:
• 4% discount in the first 12 months
• 3% discount in months 12 – 24
• 2% discount in months 24 – 36
• 1% discount in months 36 – 48
• No discount thereafter Most of the comparable MICs tend to apply a redemption penalty in the first few years of investment. However, investors have to keep in mind that redemptions are totally upon management’s discretion and the MIC’s availability of cash. According to management, the MIC has fulfilled 100% of total redemption requests since inception. Management has the right to redeem all or any portion of the shares at any time. Therefore, investors are subject to prepayment risks.
The following are the income statements since inception.

Page 17
2016 Fundamental Research Corp. “10+ Years of Bringing Undiscovered Investment Opportunities to the Forefront “ www.researchfrc.com
PLEASE READ THE IMPORTANT DISCLOSURES AT THE BACK OF THIS REPORT
Income StatementNov 21, 2013 - Oct 31,
20142015
Revenues
Mortgage interest $84,761 $553,299
Other income $2,326 $13,793
$87,087 $567,092
Operating Expenses
Management Fee $12,585 $81,037
Audit and accounting fees $23,277
Legal fees $19,287
Regulatory fees $6,834
Insurance $6,162
Advertising and promotion $1,642
Bank charges $3,277 $938
Office expenses $725 $855
$16,587 $140,032
Net Income $70,500 $427,060
YE – October 31st
In 2015, the company generated $0.57 million in revenues. The net income was $0.43 million, of which, $0.39 million was distributed to investors. Revenues include interest income and any pre-payment interest penalty. Revenues such as late payment fees, discharge fees, etc. belong to the Administrator. Interest + Other Income as a percentage of mortgage receivables were 12.4% p.a. in 2015. The dividend yield (dividends as a percentage of invested capital) was 6.99% p.a. Note that our calculations are slightly different from the figures reported by the MIC due to the difference in the method of calculation. We used the average of the opening balance, and year-end balance of the mortgages outstanding, and invested capital, to arrive at the above figures.
Page 18
2016 Fundamental Research Corp. “10+ Years of Bringing Undiscovered Investment Opportunities to the Forefront “ www.researchfrc.com
PLEASE READ THE IMPORTANT DISCLOSURES AT THE BACK OF THIS REPORT
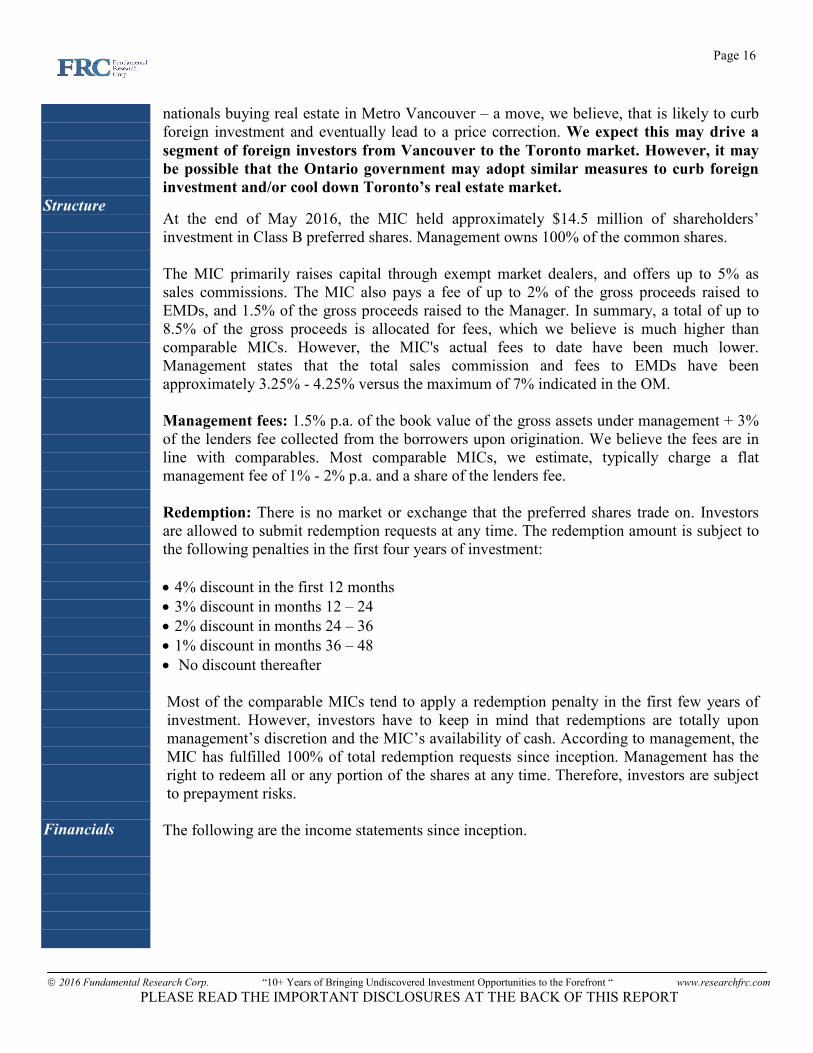
% of Mortgage Receivable 2015
Mortgage interest 12.1%
Other income 0.30%
12.37%
Less:
Management fee 1.77%
Audit and accounting fees 0.51%
Legal fees 0.42%
Regulatory fees 0.15%
Insurance 0.13%
Advertising and promotion 0.04%
Bank charges 0.02%
Office expenses 0.02%
Net 9.31%
Investors' Distributions as a % of Invested
Capital6.99%
2-year GOC 0.54%
Spread 6.45%
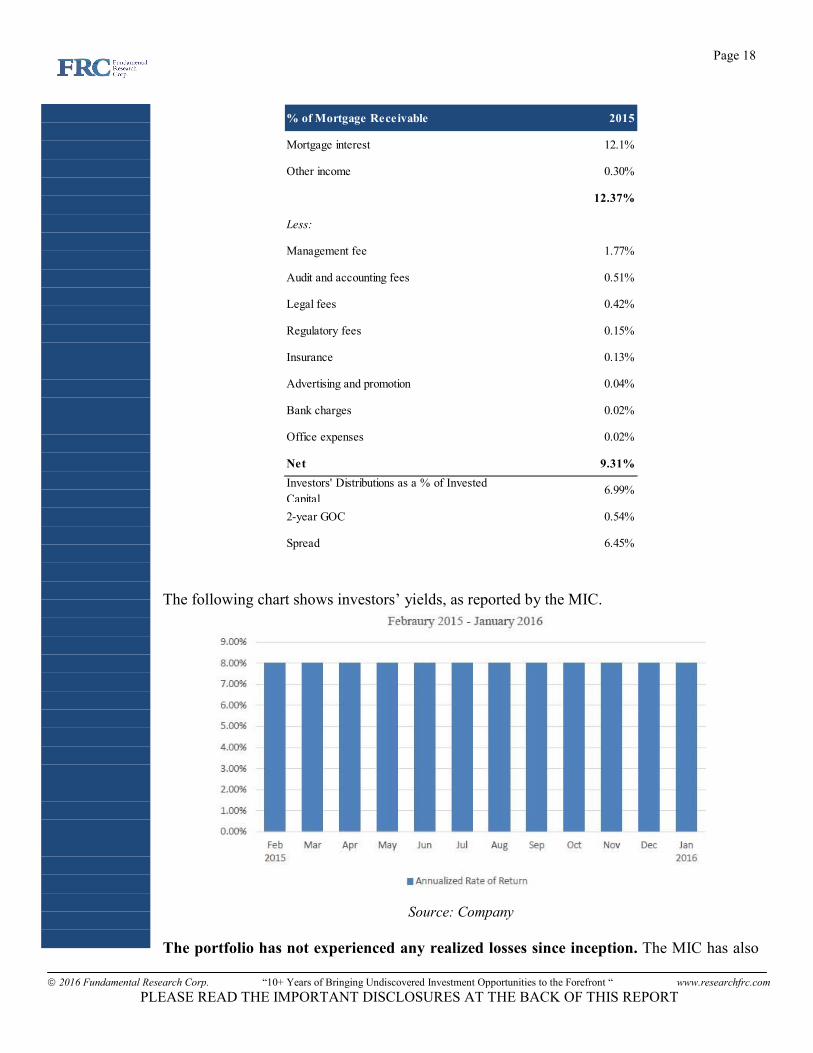
The following chart shows investors’ yields, as reported by the MIC.
Source: Company
The portfolio has not experienced any realized losses since inception. The MIC has also

Page 19
2016 Fundamental Research Corp. “10+ Years of Bringing Undiscovered Investment Opportunities to the Forefront “ www.researchfrc.com
PLEASE READ THE IMPORTANT DISCLOSURES AT THE BACK OF THIS REPORT
not assigned any provision for losses in 2015. The following table shows few key parameters of the portfolio since inception.
2015
No. of Delinquencies
Foreclosured Properties
Value
Provision for losses
Total allowance at the end of the year
Realized losses
Actual Losses (% of mortgage receivable)
Reinvested $113,772
Dividends $385,734
Reinvested (as a % of Distributions) 29%
Redemptions: $285,000
Invested Capital $8,295,000
Redemption (% of invested capital) 5%
According to management, the portfolio currently has two mortgages (approximately $38,000) in foreclosure, and 7 delinquent. Investors have reinvested about 29% of the annual distributions in 2015, which is a positive sign as it indicates existing investors’ confidence in management. The following table shows a summary of the company’s balance sheet. The total loans outstanding increased by 227% from $2.15 million at the end of FY2014, to $7.02 million by the end of FY2015.

Page 20
2016 Fundamental Research Corp. “10+ Years of Bringing Undiscovered Investment Opportunities to the Forefront “ www.researchfrc.com
PLEASE READ THE IMPORTANT DISCLOSURES AT THE BACK OF THIS REPORT
Risk
Balance Sheet (YE - Oct 31st) 2014 2015
Assets
Cash $589,397 $741,930
Prepaid expenses $8,608
Accounts receivable $462,980
Mortgages receivable $2,147,594 $7,023,178
Total Assets $2,736,991 $8,236,696
Liabilities
Accounts payable & accrued liabilities $52,202 $106,015
Shareholders' Equity
Share capital $2,676,364 $8,080,930
Retained earnings $8,425 $49,751
$2,684,789 $8,130,681
$2,736,991 $8,236,696
Debt to Capital - -
Redeemable common shares 274,267 829,500
NAV per share $9.79 $9.80
Invested capital $2,742,668 $8,295,000
The Net Asset Value (“NAV”) per share was $9.80 per share compared to the issuance price of $10.00 per share because of the share issuance costs. It is not uncommon for MICs to have a slightly lower NAV compared to the issuance price, especially if they have expenses associated with raising capital / issuing new shares. RESCO’S previous redemptions have been at $10.00 per share.
Line of credit – The MIC currently does not have a line of credit. Our discussions with management indicated that they currently have no intent to secure a line.
We believe the following are the key risks of this offering (most of the risks mentioned below are industry specific and impact comparable MICs as well) :
• Loans are short term and need to be sourced and replaced quickly.
• Timely deployment of capital is crucial.
• A drop in GTA housing prices will result in higher LTVs, and higher default risk, as the value of collateral decreases.
• Volatility in real estate prices.
• Shareholders’ principal is not guaranteed, as the NAV per share could decrease from current levels (as a result of loan losses).
• Loans are primarily interest only loans.
• The MIC may leverage going forward, which will increase its exposure to negative events.
• The MIC primarily invests in second mortgages, which carry higher risk than first

Page 21
2016 Fundamental Research Corp. “10+ Years of Bringing Undiscovered Investment Opportunities to the Forefront “ www.researchfrc.com
PLEASE READ THE IMPORTANT DISCLOSURES AT THE BACK OF THIS REPORT
Rating
mortgages.
• Redemptions are not guaranteed.
• Management expects the portfolio’s mix to be approximately 80% ON, which may expose the MIC to geographical risks.
Based on our review of the returns/risk features of the offering, we are assigning an overall rating of 3-, and a risk rating of 3 on the preferred shares.
FRC Rating
Expected Yield (next
12M)8% p.a.
Rating 3-
Risk 3

Page 22
2016 Fundamental Research Corp. “10+ Years of Bringing Undiscovered Investment Opportunities to the Forefront “ www.researchfrc.com
PLEASE READ THE IMPORTANT DISCLOSURES AT THE BACK OF THIS REPORT
Fundamental Research Corp. Rating Scale:
Rating – 1: Excellent Return to Risk Ratio Rating – 2: Very Good Return to Risk Ratio Rating – 3: Good Return to Risk Ratio Rating – 4: Average Return to Risk Ratio Rating – 5: Weak Return to Risk Ratio Rating – 6: Very Weak Return to Risk Ratio
Rating – 7: Poor Return to Risk Ratio A “+” indicates the rating is in the top third of the category, A “-“ indicates the lower third and no “+” or “-“ indicates the middle third of the category.
Fundamental Research Corp. Risk Rating Scale:
1 (Low Risk) 2 (Below Average Risk) 3 (Average Risk) 4 (Speculative) 5 (Highly Speculative)
Rating - 1 0% Risk - 1 0%
Rating - 2 26% Risk - 2 4%
Rating - 3 48% Risk - 3 35%
Rating - 4 9% Risk - 4 39%
Rating - 5 5% Risk - 5 10%
Rating - 6 1% Suspended 13%
Rating - 7 0%
Suspended 11%
FRC Distribution of Ratings
Disclaimers and Disclosure
The opinions expressed in this report are the true opinions of the analyst about this company and industry. Any “forward looking statements” are our best estimates and opinions based upon information that was provided and that we believe to be correct, but we have not independently verified with respect to truth or correctness. There is no guarantee that our forecasts will materialize. Actual results will likely vary. The analyst and Fundamental Research Corp. “FRC” does not own any shares of the subject company, does not make a market or offer shares for sale of the subject company, and does not have any investment banking business with the subject company. Fees have been paid by the issuer to FRC to issue this report. The purpose of the fee is to subsidize the high costs of research and monitoring. FRC takes steps to ensure independence including setting fees in advance and utilizing analysts who must abide by CFA Institute Code of Ethics and Standards of Professional Conduct. Additionally, analysts may not trade in any security under coverage. Our full editorial control of all research, timing of release of the reports, and release of liability for negative reports are protected contractually. Distribution procedure: our reports are distributed first to our web-based subscribers on the date shown on this report then made available to delayed access users through various other channels for a limited time. To subscribe for real-time access to research, visit http://www.researchfrc.com/subscription.htm for subscription options. This report contains "forward looking" statements. Forward-looking statements regarding the Company and/or stock’s performance inherently involve risks and uncertainties that could cause actual results to differ from such forward-looking statements. Factors that would cause or contribute to such differences include, but are not limited to, continued acceptance of the Company's products/services in the marketplace; acceptance in the marketplace of the Company's new product lines/services; competitive factors; new product/service introductions by others; technological changes; dependence on suppliers; systematic market risks and other
risks discussed in the Company's periodic report filings, including interim reports, annual reports, and annual information forms filed with the various securities regulators. By making these forward looking statements, Fundamental Research Corp. and the analyst/author of this report undertakes no obligation to update these statements for revisions or changes after the date of this report. A report initiating coverage will most often be updated quarterly while a report issuing a rating may have no further or less frequent updates because the subject company is likely to be in earlier stages where nothing material may occur quarter to quarter. Fundamental Research Corp DOES NOT MAKE ANY WARRANTIES, EXPRESSED OR IMPLIED, AS TO RESULTS TO BE OBTAINED FROM USING THIS INFORMATION AND MAKES NO EXPRESS OR IMPLIED WARRANTIES OR FITNESS FOR A PARTICULAR USE. ANYONE USING THIS REPORT ASSUMES FULL RESPONSIBILITY FOR WHATEVER RESULTS THEY OBTAIN FROM WHATEVER USE THE INFORMATION WAS PUT TO. ALWAYS TALK TO YOUR FINANCIAL ADVISOR BEFORE YOU INVEST. WHETHER A STOCK SHOULD BE INCLUDED IN A PORTFOLIO DEPENDS ON ONE’S RISK TOLERANCE, OBJECTIVES, SITUATION, RETURN ON OTHER ASSETS, ETC. ONLY YOUR INVESTMENT ADVISOR WHO KNOWS YOUR UNIQUE CIRCUMSTANCES CAN MAKE A PROPER RECOMMENDATION AS TO THE MERIT OF ANY PARTICULAR SECURITY FOR INCLUSION IN YOUR PORTFOLIO. This REPORT is solely for informative purposes and is not a solicitation or an offer to buy or sell any security. It is not intended as being a complete description of the company, industry, securities or developments referred to in the material. Any forecasts contained in this report were independently prepared unless otherwise stated, and HAVE NOT BEEN endorsed by the Management of the company which is the subject of this report. Additional information is available upon request. THIS
REPORT IS COPYRIGHT. YOU MAY NOT REDISTRIBUTE THIS REPORT WITHOUT OUR PERMISSION. Please give proper credit, including citing Fundamental Research Corp and/or the analyst, when quoting information from this report. The information contained in this report is intended to be viewed only in jurisdictions where it may be legally viewed and is not intended for use by any person or entity in any jurisdiction where such use would be contrary to local regulations or which would require any registration requirement within such jurisdiction


![[P][W] T. L. Eco. Resco, Laura.pdf](https://img.dokumen.tips/doc/110x75/586f65931a28ab66058be1ed/pw-t-l-eco-resco-laurapdf.jpg)


