Embed Size (px)
Citation preview

3R- ^LM^
REPORTS
DATE:
FINAL REPORT ON FLORA VISTA CONTAMINATION STUDY
OCTOBER, 1986
A Report to the Flora Vista Water Users Association Flora Vista, New Mexico
Prepared by David G. Boyer Hydrogeologist
Environmental Bureau .New Mexico Oil Conservation Division
Paul L. Biderman Secretary Energy and Minerals Department
R. L. Stamets, Director Oil Conservation Division

FINAL REPORT ON FLORA VISTA CONTAMINATION STUDY - OCTOBER, 1986
Introduction
This report was prepared by the New Mexico Oil Conservation Division to summarize the work performed at the Flora Vista well f i e l d ; to review the results of water quality sampling, aquifer testing, and other hydrologic measurements; to present conclusions based on this work, and to make recommendations for future monitoring of ground water to protect the currently used well f i e l d . The assistance of the staff of the Flora Vista Water Users Association, Lawrence A. Brewer & Associates, and the Environmental Improvement Division in providing data, reports, support equipment, and services is gratefully acknowledged. The assistance of other Oil Conservation Division staff i n Santa Fe and Aztec in preparing this report is appreciated.
Background
The Flora Vista Water Users Association operates a State approved community water system for the Flora Vista area located approximately half way between Farmington and Aztec on U.S. Highway 550. In 1983. the system served approximately 1500 residents and small businesses through 431 connections. Maximum system delivery, as reported in New Mexico Environmental Improvement Division (EID) community water supply system inspection reports, was reported at 170,000 gallons per day (gpd) with average delivery i n 1983 of about 100,000 gpd. The system was placed in service i n 1981 with two wells each having pump capacities of 60-70 gallons per minute (gpm).
In January, 1980, a gas well owned by Manana Gas, Inc. of Albuquerque was d r i l l e d i n unit M (SW/4 SW/4) of Section 23, Township 30 North, Range 12 West. The well, Mary Wheeler No. 1-E, was placed i n service i n July, 1980, with the natural gas being received by El Paso Natural Gas via a pipeline at the site.
Manana f a c i l i t i e s at the site include the well, an oil-water separator, a fiberglass tank (capacity approximately 120 barrels) holding produced water and some o i l from the separator, an o i l tank for storing o i l produced with the gas, and a tank drain p i t for discharging water separated from the o i l (now replaced with a small fiberglass tank). A reserve (mud pit) and a blowdown p i t were both l i k e l y present at one time but have been covered over. The original fiberglass tank has been replaced with a second identical tank due to discovery of a leak. El Paso Natural Gas f a c i l i t i e s include a gas dehydrator, a dehydrator p i t with a 55-gallon drum serving as a collector, and a gas meter house.
The entire site occupies an area of approximately 220 x 75 feet and is located northeast of water supply well Sl. Distances from the water

well to the fiberglass produced water tank, gas well, and dehydrator p i t are 235 feet, 255 feet, and 285 feet, respectively. Figure 1 shows the relationship of the various o i l and gas f a c i l i t i e s to the water wells. The location of the reserve (mud pit) is not directly evident from recent aerial photographs, but is thought to be south of the fiberglass tank for the oil-water separator.
In 1982, Oil Conservation Division records show gas well production of 39,584 million cubic feet of natural gas and 1022 barrels of o i l . Water production is estimated by the company (1985) at approximately 210 gallons per day or about 76.6 thousand gallons per year. A l l produced water collected is removed from the site.
In February, 1983, at least one water supply well, Sl, became contaminated with o i l and grease and was taken out of service. The level of contamination was reported i n Association records as 16 mg/l. To avoid further contamination, the system was shut down and water was purchased from, the City of Aztec and delivered via an existing pipeline. At that time, the Association dug a p i t between Sl and the gas well and detected a noticeable odor and an o i l y film. Between February and August, 1983, additional backhoe pits were dug and sampled for o i l and grease. In August, the CCD sampled the water well Sl', the Manana separator, the El Paso dehydrator, and a previously dug p i t . Oil and grease levels reported ranged from 32 to 38 mg/l except for the dehydrator which was not reported. However, the dehydrator sample was reported to have 13 mg/l of both benzene and toluene.
In the summer of 1984, the EID attempted to d r i l l monitoring wells i n the area for the purposes of determining the contamination sources and the risk to the other supply wells. However, the hollow-stem auger d r i l l r i g was not able to penetrate the large boulders i n the shallow subsurface and the attempt was discontinued.
Site Investigation
The following is a summary of work performed in 1985:
1) Five monitoring wells were placed around the original contaminated well i n late March by OCD and EID staff. Due to large boulders in the shallow subsurface, the wells were installed with a backhoe provided by the water users association. The wells are 2-inch diameter steel casing, with a 48-inch long Johnson wire-wound stainless steel screen having a slot size of 0.07 inches. This slot size is too large for effective sand control, but i t was the only screen available for immediate use. The wells and casing were provided by EID. Gravel packing was t r i e d for the f i r s t well, but the large p i t size and rapid slumping of the hole precluded further gravel use. The lack of a gravel envelope made the wells subject to rapid s i l t i n g . Total depths of the wells range from 7 to 10.8 feet from the casing top. The wells extend about 20 inches above the land surface and are cemented at the surface. The monitor wells are capped and locked to prevent unauthorized entry.
-2-
2) Samples were taken from the water supply and monitor wells for organic analyses i n March, June, August, September, and October, 1985. The results are shown in Tables 1 and 2. Results of samples from the fiberglass separator tank at the Mary Wheeler No. LE gas well are shown i n Table 3. Inorganic analyses were run on the water supply wells (including the previously contaminated well) and the Animas River i n March, and the produced water from the gas well in October.
3) As expected, several monitor wells f i l l e d with sand and were cleaned twice using compressed a i r from two different compressors. The use of these compressors apparently affected the water quality as discussed below.
4) In September a l l monitor and supply wells were surveyed by Brewer and Associates for both location and elevation. Several well elevations were resurveyed i n October. Blueprints from recent aerial photos were received i n late December. Water levels were measured in September and October, 1985.
A summary of work performed i n 1986 follows:
1) Water levels were measured in January, February, April and May. These are shown in Figures 3 to 6.
2) Samples from the monitoring wells for water quality analysis were taken i n January, and Apr i l . The contaminated well was sampled i n April and May. The water system was sampled for organics in January, April and May. The new fiberglass tank at the Mary Wheeler IE o i l storage tank (used to collect water drained from that tank) was sampled i n April and May. The 55-gallon drum at the El Paso Natural Gas dehydrator unit was sampled i n January and February. The results of organic analyses of these samples are shown i n Tables 1 to 4. Inorganic analyses were run on samples from the contaminated water well i n A p r i l , and from the dehydrator barrel i n February. Discussion on the results is presented i n the section on water quality.
3) A 72-hour aquifer test was performed on the contaminated well between April 21 and 25. The test consisted of water level measurements from the pumped well and monitor wells on Ap r i l 21, 48 hours of pumping April 22-24, and 24 hours of recovery April 24-25. Approximately 5 hours into the test, o i l was drawn into the well. The results of this test are discussed i n detail i n the hydrogeology and water quality sections.
4) A second, short duration test was performed i n May to better characterize the volume and nature of the o i l . These results are also presented below.
5) A study progress report was prepared i n January.
-3-

Hydrogeology
The valley of the Animas Paver contains alluvium consisting mainly of sand and gravel which is outwash material from Pleistocene glaciers i n the San Juan Mountains i n Colorado. In the v i c i n i t y of the Flora Vista wells this alluvium i s about 22 to 25 feet thick. Examination of the aerial photograph blueprints provided by Brewer & Associates shows old river channels and meanders i n the flood plain. Finer grained s i l t s and clays can be expected to have been deposited i n low velocity areas such as point bars and areas of overbank flooding. However, the area where the monitor wells were d r i l l e d was found to be a zone of very coarse sand and gravel with some rocks exceeding a foot in diameter.
The presence of a coarse sand and gravel zone usually indicates high ground water permeability. Examination of the pumping level estimates provided i n the 1982 EID community water system environmental survey, together with a 1982 Brewer and Associates i n f i l t r a t i o n gallery f e a s i b i l i t y study shows an aquifer permeability of about 750 gallons per day per square foot, or 100 feet per day. This was confirmed by the aquifer test conducted i n April. The value i s at the lower end of the range for clean sand and gravel mixtures, but s t i l l allows for rapid ground water movement.
In September and October, 1985, ground water levels were measured i n those monitoring wells where f l u i d levels were present. The results were used to calculate the direction of ground water flow and the hydraulic gradient. The gradient values were 0.0080 and 0.0081, respectively, or about 43 feet per mile. These values are intermediate between the average river gradient at Flora Vista of 0.004 and the topographic gradient of 0.014 perpendicular to the river at the well f i e l d location. The 1986 water levels, measured i n January, February, Apr i l , and May, showed gradients of 0.0080, 0.0086 and 0.0079, and 0.0071 respectively. The average of the six measured values i s 0.0080 or about 42 feet per mile.
The 1985 ground water flow directions are shown on Figures 1 through 2. The direction i n September i s slightly east of south. By late October, the direction had changed to nearly 20° east of south and continued that direction through January and February (Figures 3 and 4). The April and May measurements (Figure 5 and 6) again show the direction of flow as slightly east of south.
Some reasons for these observed changes i n the ground water flow direction may be postulated based on surface and ground water interaction i n the area. When river flows are generally low, as i n the f a l l and winter, water stored i n the permeable al l u v i a l material i n the immediate v i c i n i t y of the river during times of spring and summer high flows i s discharged back into the river. Additional ground water discharge to the river comes from sources to the northwest of the well f i e l d including ground water recharged to the alluvium from the Flora Vista Arroyo, the Halford Independent Ditch, the Farmers Ditch,
-4-

i r r i g a t i o n seepage, recharge due to septic tank discharges, and any runoff from precipitation events. In the spring and summer months river flow is high, and water enters the alluvium with the resultant flow direction shifted southward as shown in Figures 5 and 6. Cne lik e l y entry area is the alluvium north of the Manana production area at the river bend.
As shown on the figures, the direction of ground water flow on a l l the dates measured was towards the river. Therefore, natural ground water flow i n the v i c i n i t y of the Manana Mary Wheeler IE Well moves i n the direction of the river and not towards any of the water supply wells or monitor wells. Pumping of the water well changes the natural flow direction.
During the week of April 21-25, 1986, extensive f i e l d work was performed at the site to determine aquifer characteristics. On the morning of April 21, water level measurements were taken at a l l observation wells at the site. The centrifugal pump planned for use would not perform satisfactorily and the test was postponed one day u n t i l another pump was obtained. The following morning, a gasoline powered Honda 350 gpm centrifugal pump with approximately 25 feet of intake hose was installed adjacent to the well. The discharge hose outlet was placed 225 feet downgradient in a low spot between the well and the river. The discharge was not allowed to enter the river. The volume discharged was measured using a totalizer meter, and flow rates were obtained using a stop watch. Water levels were measured 60 to 90 minutes before beginning the test to obtain a static level for drawdown calculations.
_ / Six observation wells located between 30 and 200 feet from the pumped well were used to measure drawdown.
Beginning at 1 p.m. on April 22, 1986, a 72-hour aquifer test was performed on the previously contaminated supply well. The test consisted of pumping for 48 hours, followed by measuring water level recovery for 21 hours. The i n i t i a l discharge rate was set at 100 gallons per minute (gpm). However, because of totalizer errors and because the pumping rate was very sensitive to the thrott l e adjustment, the actual rate for the f i r s t 8.5 hours was later calculated to be 108.4 gpm. At that point the drawdown was below the top of the screen, and water was cascading into the borehole. This caused the discharge to decrease slightly. The average rate for the next 5.25 hours was 102.8 gpm. At 2:37 a.m. on April 23, the pumping rate was lowered to 85 gpm to avoid uncovering the pump intake. The actual pumping rate for the next 21 hours was later calculated at 88.6 gpm. At 11:49 p.m. the pump shut of f automatically for reasons unknown. I t was started again after six minutes. The pump stopped five other times during the following ten hours, but was restarted within 4-7 minutes each time. The test ended at 1:34 p.m. on April 24. The average pumping rate for the f i n a l 13.75 hours was calculated at 85.9 gpm.
The unanticipated and unintentional changes i n the pumping rate made analysis of the results d i f f i c u l t and a number of methods were used to calculate the aquifer coefficients for transmissivity (T) and
-5-

storage(S). The methods and their application are b r i e f l y outlined below. A form devised to tabulate the data is shown i n Figure 7. The results are shown i n Table 5.
Before drawdown values could be used i n the calculations, they were corrected for dewatering of the water table aquifer us^ng the Jacob correction (2) . This method uses the formula s = s - (s /2m) where s is the corrected drawdown, s the observed drawdown, and m the saturateS aquifer thickness (calculated at 19.6 feet from the d r i l l e r s log and the static water level).
The following methods of analysis of pumping data were used:
1. Theis Method (modified for water table use) - This non-steady state procedure (4) assumes that gravity drainage of sediments near the pumping well slows the rate of drawdown u n t i l the sediments are dewatered. Graphs of time versus drawdown were plotted on log-log paper for each well and superposed on Boulton delayed-yield type curves (Figure 8). When matched for best f i t , these curves produced the Theis values for T and S shown in Table 5. Because the Theis method and i t s modifications are based on constant discharge, this method could not be used after the rate was dropped to 88.6 gpm about 14 hours after the test began.
2. Jacob Method - This is a graphical method plotting time versus drawdown with time plotted on the log scale (3, 4). This method is accurate after pumping has continued long enough such that drawdown varies directly with log time, and the plotted data is a straight line. This method cannot be used with variable pumping rates, and delayed gravity drainage may cause variations i n drawdowns such that transmissivity appears higher than actual values. Because of the short constant-rate pumping time, this method could only be used with wells Sl, xSl, and M3.
3. Time-Recovery Method - This is a combination mathematical-graphical procedure (1) directly applicable when variable pumping rates occur during a test. I t adjusts the drawdown and time coordinates for the variable rates, and gives transmissivity values for both pumping and recovery periods. Since pumping drawdown values are affected by well entrance losses, calculations using recovery values give the most accurate estimates of aquifer transmissivity. Recovery data was collected only at wells Sl and xSl.
Review of Table 5 shows only slight variations for T for the observation wells using the modified Theis method. Lower T values for the pumped well are due to well entrance losses. Variations using the other methods can be considered acceptable given the graphical nature of the
-6-

procedure, and the fact that the straight line methods do not consider the effect of delayed water table drainage in the calculations. Based on the results, an average value of aquifer transmissivity of 14545 gallons per day per foot can be used for further computations. An average specific yield of 0.08 to 0.09 (ratio of volume of water released to volume of unconfined aquifer) was found for this portion of the aquifer. These parameters can now be used for a multitude of purposes including estimation of ground water seepage velocity, aquifer drawdown, interference of nearby pumping wells, design of pumping schedules, etc.
In this report, transmissivity was only used to calculate hydraulic conductivity to provide an estimate of travel times and capture r a d i i . Transmissivity i s divided by the saturated aquifer thickness, b, to obtain hydraulic conductivity (K) . For b = 19.6 feet, K = 742 gallons per day per square foot. This value is in excellent agreement with the earlier estimate of 750 given i n the January progress report. Therefore, the calculations presented i n the January report do not need to be revised.
Because just under 14 hours of data were collected before the pumping rate was reduced, the presence and magnitude of river recharge on the aquifer system could not be determined. Recharge could be expected to occur, but a previous 12-hour test by Ranney (5) did not detect such river replenishment.
Several observation wells were used during the test, and the plotted water levels show the expansion of the pumping cone of depression after several hours. Figure 9 depicts the cone at 32 hours after the start of the test. The figures show that the pumping cone is elongated northeast-southwest. This can have several interpretations. In areas of homogenous material with only one source of recharge, a pumping well w i l l cause steeper drawdown contours i n the direction of recharge, and f l a t t e r contours on the opposite side of the cone. Figure 9 shows the expected steep, closely spaced contours near M3, but the f l a t t e r contours are rotated about 45° clockwise from the expected direction. This could be due to either induced recharge from the river, a natural increase i n aquifer transmissivity towards the southwest, or a combination of both. Since the steepest gradient i s in the direction from which ground water is flowing, i t would appear that more water is being captured by the well from that source than from the river to the east. I f a constant pumping rate could have been maintained for the entire 48-hour test, the effect of the river on recharge would be known.
Because of cone of depression elongation, a change in transmissivity can be postulated. Since T i s equal to the product of hydraulic conductivity and saturated aquifer thickness, either one or both can increase T. The aerial photo shows that i n the past the river has meandered, and old channel remnants can be seen that appear to coincide with the northeast-southwest elongation. Since the coarsest materials were deposited i n these channels, they have preferential permeability i n the direction of stream flow. Therefore, i t i s l i k e l y that sediments
-7-

near the contaminated well have a higher permeability in the northeast-southwest direction. An old channel would l i k e l y have a greater depth to bedrock because of scouring by moving sediment. Association records show that well S4, located away from this feature, has a lower production rate.
Because of the change i n aquifer test pumping rates, and the effect of delayed water table drainage, no clear pattern was present i n the values of T shown i n Table 5. However, a l l hydraulic effects are "integrated" by the aquifer to produce the shape of the drawdown seen i n Figures 9.
Predictive Calculations
Since higher permeabilities are l i k e l y i n the northeast-southwest direction, there are ground water quality implications. Because the Manana and El Paso production units are directly northeast of well Sl, when the water well i s pumping some of the water drawn into the well w i l l be from the area of the production f a c i l i t y . The following paragraphs summarize predictive calculations made from the hydrologic information obtained at the site.
In February, 1983, with river water levels quite low (Table 6), water well Sl was contaminated by hydrocarbons. One suspected source was a leaky fiberglass tank (since replaced) containing produced water from the Mary Wheeler No. IE gas well. As discussed elsewhere, the contamination could be from several sources. This source is only used to i l l u s t r a t e the predictive calculations.
The tank location i s approximately 230 feet to the northeast of well Sl. I f the direction of ground water flow at this time was slightly east of south towards the river, other factors must have been operating for this to be the contaminant source. Using the available hydrologic data and the EID's January, 1983 report of estimated water use, drawdown calculations were made using the Theis non-equilibrium well formula (Table 7) . The calculations were made assuming 100,000 gallons per day pumped from two wells with a daily average of Q = 35 gpm/well. The results show a drawdown of 0.1 foot at the tank after only two days of pumping at the above rate. Though small, this value i s enough to cause movement of water towards the well. After 100 days of pumping, the calculated drawdown i s 1.1 feet at the tank location.
Since this well (Sl) i s only 250 feet from the river, i t was reasonable to expect that river water i s recharging a portion of the water removed from the aquifer by the well. However, calculations assuming steady-state flow and isotropic aquifer permeabilities show that the zone of capture only extends 69 feet down gradient for an average daily pumping rate of 35 gpm. This is because more water upgradient is captured, and the resultant asymmetrical cone of depression (zone of influence) does not extend as far downgradient i n the direction of the flow (Figure 10). Since the well was reported to have pumped at a maximum of 60 to 70 gpm, a downgradient capture distance of 127 feet was calculated for Q = 65 gpm. Because the pump was cycled on and of f , the stress on the aquifer
-8-

would fluctuate. I f the pump was on more than 50% of the time, the parabolic envelope shown in Figure 10 would approach that of the Q = 65 gpm curve.
These pumping capture curves were drawn assuming the flow direction in early 1983 was the same as January, 1986. Some variables that could change curve shape include non-homogenuous sediments, variations in permeability, non-equilibrium (vs. steady-state) flow, and the pumping cycles. Since the Ap r i l , 1986, aquifer test showed a li k e l y increase i n permeability i n the northeast-southwest direction, the right limb of the capture curve probably extends further eastward than shown.
I f there i s a drawdown of water under the produced water tank due to well Sl, this would allow capture by the well of water under the tank. A simple calculation using only the volume of water i n the aquifer, a porosity of 0.25, a radius of 230 feet, a saturated thickness of 17 feet, and pumping rate of 35 gpm finds that movement of contaminants from the tank to the well would occur in 105 days. Calculations for a drawdown of 1.1 feet after 100 days of pumping (average Q = 35 gpm) and taking into account changes i n flow velocity near the well show that travel times for water movement from the tank location to the well would range between 96 and 103 days. These times do not take into account constant pumping at a higher rate or any mechanisms of attenuation such as contaminant retardation due to sorption, or biochemical transformation. More sophisticated techniques can produce more exact estimates of both flow and solute transport rates i f actual pumping rates, and pumping cycles were known.
Under non-pumping conditions, ground water movement w i l l be determined by the local hydraulic gradients, and the rates of movement can be calculated using the formula shown in Table 7. Using an average gradient of 0.0080 for f a l l , 1985 - spring, 1986, a porosity of 0.25 and hydraulic conductivity of 750 gpd/ft, an approximate horizontal seepage velocity of about 3.2 feet per day, or 1170 feet per year, was calculated. This shows rapid particle movement under natural conditions for those seasons. I f these rates prevail a l l year, and the contaminant source was a one-time release of produced water with some o i l , movement of the more mobile contaminants (e.g., chloride) would be out of the zone of influence of the well after only one year. In addition dilution with other water and other mechanisms would be expected to attenuate a single incident plume. Most effective attenuation would occur i f a large o i l phase was not present. Again, more sophisticated techniques using computers can produce a ground water model of plume movement and dispersion i f more source information was available.
I f a large o i l phase was discharged, the presence of residual o i l i n the so i l and water together with seasonal water level changes would cause continued leaching of soluble o i l constituents into ground water. I f present, these dissolved contaminants w i l l again reach the well i f i t i s put back into service. The remaining o i l i t s e l f can also be mobilized under certain conditions and enter the well. These conditions are discussed later i n the report.
-9-

Water Quality
The inorganic chemistry analyses of the a l l water supply wells sampled since March, 1985, show generally very good water quality. For four samples from two wells and a composite of two other wells, t o t a l dissolved solids (TDS) average 422 mg/l, chlorides average 17 mg/l and sulfates average 188 mg/l. A sample of Animas River water had concentrations of 368 mg/l, 12.5 mg/l and 116.3 mg/l for the same constituents. For the wells, only manganese with an average of 0.37 mg/l i s elevated above acceptable levels. Manganese is naturally occurring i n salt and minerals and the New Mexico Ground Water Standard is 0.2 mg/l. The effects of slightly elevated levels are generally limited to unpleasant taste and plumbing fixture staining.
The contaminated well, Sl, was sampled for inorganics on April 23, 1986, 24-hours into the aquifer test. Values for TDS, chlorides and sulfates were 498 mg/l, 16.0 mg/l and 185 mg/l, respectively. Produced water from the Mary Wheeler IE fiberglass separator tank was collected i n September and October, 1985. The two analyses showed average TDS of 35,640 mg/l, chloride 20,380 mg/l and sulfate 3,000 mg/l. The El Paso Natural Gas dehydrator barrel was checked for conductivity i n February, 1986. The value of 81 umho/cm at 17° C i s equivalent to about 70 mg/l TDS. The barrel had elevated levels of iron, t i n , and manganese thought to be from the barrel i t s e l f .
A sampling program for organic chemicals i n the affected water supply wells, monitor wells, and operating supply wells was begun by the CCD i n March, 1985. Subsequent testing was performed i n June, August, September, and October, 1985; and January, April and May, 1986. The results are shown in Tables 1 and 2. Tables 3 and 4 show sampling results for Manana and El Paso units at the site.
The wells were sampled for aromatic hydrocarbons which have been found to be present i n water and fluids produced concurrently with o i l and gas. Once dissolved i n water, these contaminants migrate with the ground water i n the subsurface. At a point of use, such as a well, the hydrocarbons can be present i n the water even though a separate o i l phase may not be detected. Samples for aromatic hydrocarbon testing require only a small 40 ml volume of water, and no special treatment or preservation except c h i l l i n g needs to be performed prior to analysis. In addition to aromatic hydrocarbons, tests for methane gas and halogenated hydrocarbons can be performed on the same sample. Prior to sampling, the monitor wells were "purged" by use of a clean bailer to obtain fresh samples.
In March, 1985, water samples were taken from the backhoe-dug pits prior to monitor well installation. An o i l y sheen appeared on the water i n the p i t s . Examination of the backhoe bucket determined that hydraulic f l u i d was leaking from either a f i t t i n g or a cylinder and dripping into the p i t . Samples of the p i t water taken that day showed no contamination.
-10-

Sampling of the monitor wells was complicated by fine sand that entered the well as a result of the large screen size and lack of a gravel pack. Also, water levels i n the monitor wells dropped between 4.6 and 7.6 inches from September to October, 1985. Wells Ml, M2, and M4 were dry for one or more of the 1985 samplings.
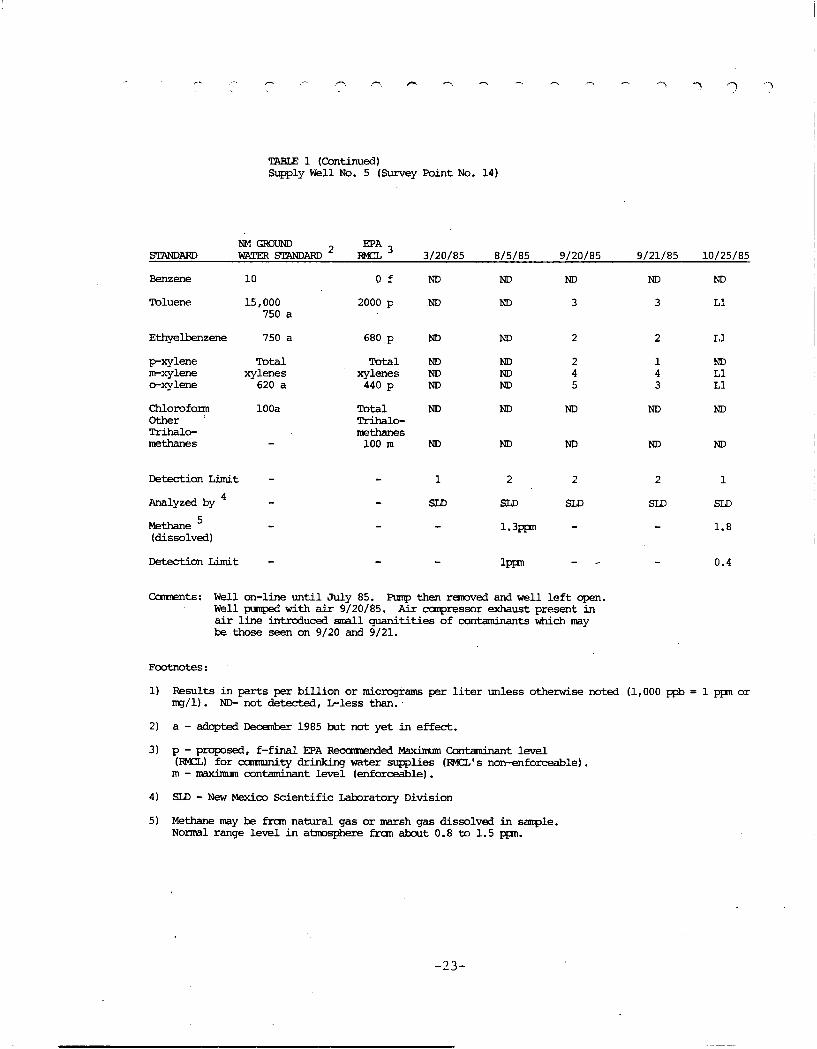
On June 27, 1985, cleaning of a l l monitor wells was attempted using a small air compressor lik e that used for spray painting. Sampling done the following day detected low or trace levels of hydrocarbons in three of the five wells. At that time the use of a i r from a compressor to clean out shallow monitoring wells was thought by both OCD and EID to be a practical solution. Although EID had used this small compressor previously and not detected contamination, i t s air line was never tested for hydrocarbons, and the compressor is no longer available for testing. Therefore, the small compressor as a source for those contaminants detected i n monitoring wells for the June sampling cannot be ruled out. The use of a larger air compressor to displace water and sand i n the wells i s known to have introduced small amounts of contaminants. In September, 1985, well S5 was pumped by introduction of air to displace several well water volumes to acquire a "fresh" sample. Samples taken that day and the following day from S5 had low levels of toluene and several other aromatic hydrocarbons. These levels were many times lower than either New Mexico or newly proposed EPA recommended levels.
After examination of these and other September results showing low levels of contamination, the air compressor was tested and found to have lubrication or combustion pollutants in the air line. The air line is thought to be the major source for the pollutants detected i n wells S5, Ml, M2, M3, and M5 for the September, 1985, sampling. However, well M4, which could not be reached by the air line i n September, also showed a slight, but detectable level of toluene. Well S5 was resampled in October and trace levels less than 1 ppb were found for several aromatic hydrocarbons, not including benzene. Well M4 was dry at the time of the October sampling and no hydrocarbons were detected i n the other wells.
After this experience, the use of air compressors to remove sediment from the wells was discontinued. Prior to the January, 1986, sampling; a l l monitor wells were cleaned by use of a homemade PVC hand auger that effectively removed a l l but a small volume of sand.
Results of the 1985 samplings of the previously contaminated well Sl, well S5, and the monitor wells were inconclusive except where known contamination occurred after attempting to clean sediment out of the wells with an air compressor. Toluene at 6 ppb was detected i n a bailed sample from Sl i n June, along with another unidentified hydrocarbon (Table 1). The well was capped shortly thereafter, and remained sealed u n t i l the aquifer test. The air compressor was not used on well Sl. Well S5 was i n service u n t i l July, 1985, when the pump was removed. The samplings i n March and August showed no contamination, but September and October results showed low levels. Only the September sampling would l i k e l y have been affected by the use of the air compressor. Well S5 remained uncapped through May, 1986.
-11-

For the monitor wells, the September cleaning is known to have introduced contaminants, and the June cleaning is also suspected to have done so. For the March, August, and October, 1985 samplings, no contamination was detected i n any of the monitor wells having water. Since the range of seepage velocities was from 3 to 4 feet per day, low level contamination introduced from the compressors would have been diluted and quickly moved beyond the capture radius of the monitor wells. Well M4, cleaned with a compressor in June, but not i n September, contained a very low level of toluene close to the detection l i m i t at the time of the September sampling. This well was dry for the August and October samplings.
Results for 1986, prior to the aquifer test, showed continued low levels of organic contaminants i n well S5 i n January. Likewise, wells M3 and M5 showed some slight contamination i n January. A l l values reported were close to the detection l i m i t of 1 ppb. The April 21 sampling, one day prior to the start of the aquifer test, showed no contamination in wells Sl and S5, nor i n any of the monitor wells. The impact of the aquifer test on water quality of the monitor wells is discussed later in the report.
Tests for dissolved methane gas were made on samples collected on several dates. Monitor wells 3 and 5 had greatly elevated levels of the gas i n August but only slightly elevated levels i n October. January, 1986, levels were not elevated above background. M5 is the monitor well nearest the gas well, and i t may be located at or i n the buried pi t s . I t had the largest volume of gas and also was located i n an area where dark black sediment was present. Soil sampling did not show o i l present at detectable levels. The source of the gas may be natural material since the area i s swampy, or i t may be from shallow buried organic material deposited i n the reserve p i t during d r i l l i n g and/or testing. Produced water containing small amounts of o i l previously discharged from the leaky tank may also be the source. The gas well i t s e l f i s not suspected because the surface casing extends to a depth of 227 feet and is cemented back to the surface. Because gas levels were not elevated above background i n January, the effect may be seasonal and related to water table elevations.
Produced water from the Manana Oil Mary Wheeler IE gas well was collected from the fiberglass tank at the separator i n September and October, 1985 (Table 3). Benzene values were 8,700 and 16,000 ppb and other aromatic hydrocarbons exceeded 1,000 ppb except for ethylbenzene. April and May, 1986, samples were taken from the fiberglass tank at the o i l storage tank. Benzene values were 550 and 150 ppb, and other aromatics were of similar magnitude except ethylbenzene which was lower.
The 55-gallon drum at the El Paso Natural Gas dehydrator was sampled i n January and February, 1986. Levels of aromatics were from 2 to 600 times greater i n January than i n February (Table 4). Benzene levels were 14,000 ppb and 550 ppb for those two months, respectively.
-12-

A t o t a l of six samples representing a composite of the pumping wells were taken from the pump house tap in March, August, and October, 1985; and i n January, A p r i l , and May, 1986. No contaminants were detected in 1985 except for a very small volume of chloroform. Chloroform might have been present as a result of chlorination which occurs immediately adjacent to, but downpipe from the pump house tap. In 1986, a laboratory solvent, dichloromethane was detected in April. Subsequent investigation determined that the sample vials were contaminated when received. No aromatic hydrocarbons were detected in the system's composites analyzed as part of this study.
Aquifer Test Water Quality
Approximately 5.25 hours after the aquifer test began, o i l was detected in the pumped well during a water level measurement. The Water Users Association was notified and sampling of the well began. A bailer was used to obtain samples from the open bore-hole. This provided the most accurate sample for dissolved aromatic hydrocarbons since the pump outlet was 225 feet away, and contaminant volatization occurs during turbulent flow i n the pipeline. An o i l sheen was seen on the water surface i n the well, the bailer was greasy and o i l y , and. the wellbore had a very noticeable hydrocarbon odor. A similar odor was observed at the fiberglass water drain tank at Manana's o i l storage area, but not at the produced water tank, or at the El Paso dehydrator barrel.
Analyses of samples taken the following three days were highly variable. Dissolved aromatic hydrocarbons (benzenes, toluene, xylenes) were detected four times at low parts per b i l l i o n levels (Table 1). A l l levels were below health standards. One sample had a possible trace of toluene and xylenes. Other o i l hydrocarbons were also detected i n some samples. Four samples taken after the o i l entered the well showed no aromatic hydrocarbons. Samples taken for phenols, o i l and grease, and polynuclear aromatic hydrocarbons did not show those constituents at the detection level of the equipment used. Inorganic constituents did not appear elevated i n a sample taken during pumping.
The v a r i a b i l i t y of the samples is thought to be due to the arrival of o i l as "blobs" instead of continuously. Turbulent conditions and cascading water i n the well bore also caused sample variation.
Monitor wells 1, 2, 3 and 4 did not detect aromatic hydrocarbons before or after the test. A trace (<lppb) of one unidentified o i l hydrocarbon was found i n M3 the day before the test. No hydrocarbons were detected in M5 the day prior to the test, but sampling the day after test completion showed elevated levels of toluene and xylene (Table 2). Although these levels did not exceed state or proposed federal standard levels, they were higher than any levels previously seen i n any of the monitor or supply well samples. Well M5 is located approximately one-half the distance between the pumped well and the produced water tank at the Manana lease. The monitor well may be located i n or near the area formerly used as the reserve p i t .
-13-

On May 21, 1986, the well again was pumped, but only for 5.6 hours. The purpose of the test was to see what effect cyclic pumping had on o i l nearby the well. After only 11 minutes, a sheen was noticed i n the wellbore. At the end of one hour, an odor and heavy sheen were noticed. When the pump was restarted after f i l l i n g i t s fuel tank, the rise i n water level brought o i l up in the well. Close to the end of the test, a thin o i l layer was floating i n the bore that produced a rainbow sheen i n the reflected l i g h t . Aromatic hydrocarbons, phenols, and polynuclear aromatic hydrocarbons could not be detected i n water samples taken during the May test.
Source of the Hydrocarbon
Based on the hydrologic data, the water guality data, and sampling of the effluents from the Manana Mary Wheeler No. IE Gas Well, the source of contamination is from o i l and gas activities at the Manana site. The exact mechanism of discharge could not be determined with the current information. Possible sources of contaminants included:
1. Produced Water - Discharges of about five (5) barrels (210 gallons) per day of water with some o i l . Records of use and dates of use of fiberglass tanks or pits to contain the water are not available to CCD. The produced water has high concentrations of chlorides (20,000 mg/l) and t o t a l dissolved solids (36,000 mg/l). No elevated levels of inorganics were detected i n the contaminated well during the CCD investigation. Chlorides were less than 20 mg/l and TDS ranged from 365 to 498 mg/l. TDS was reported highest at 570 mg/l in 1981 before the contamination. Since chlorides, sulfates, and seme other constituents of TDS are highly mobile and move close to the seepage velocity of water, any single incident of brine contamination would have moved past or into the well before arrival of the less mobile o i l phase. Therefore, the absence of brine contaminants i n the water sampled does not eliminate o i l y produced water discharges as the contaminant source.
2. Water Drained from the Oil Storage Tank - Intermittent discharges of water and some o i l of unknown volume. Records and dates of use of pits or fiberglass tanks are unknown to OCD. Since the water contained high salt concentrations (conductivity approximately 50,000 umho/cm), the same comments made for produced water apply here.
3. Oil i n the Reserve, Blowdown and/or Mud Pit - Discharges during well d r i l l i n g ; volumes and quality unknown by CCD. Blowdown p i t may receive o i l after d r i l l i n g and intermittently during well operation. None of these pits are currently visible at the site. Association records of
-14-

analyses from samples taken i n 1983 show o i l and grease and other hydrocarbons in the "slush p i t " and i n a p i t dug east of the dehydrator p i t . Again, the exact source (e.g., separator tank, reserve p i t , etc.) of the hydrocarbons is unknown by OCD.
4. Steam Vapor Condensation, Water and Upset Fluids at El Paso Natural Gas Company dehydrator - Intermittent, very low volume fluids. Condensation water discharge similar to leaky faucet drip. Volume dependent on unit operation and efficiency; estimated at one, 55-gallon barrel per 30 to 60 days. Upsets occur when Manana separator does not operate properly and El Paso dehydrator must remove fluids prior to gas line transmission. Information on condensation wastes volumes, and dates or volumes of any upsets are not available to the OCD.
Information supporting one or more unspecified discharges at the Manana production unit as being the cause of the well contamination is based on:
1. Ground water flow past the production unit i s captured by the well (Sl) when the well i s pumped. The zone of f l u i d capture includes the production area, dehydrator area, o i l storage area, and the area thought to include the buried reserve, and blowdown pi t s .
2. The aerial photograph shows that the Animas River channel has meandered at Flora Vista. A feature that appears to to be an old straighter, river channel trending northeast-southwest can be discerned on the photograph. Subsurface evidence for this change comes from the coarse sand, gravel and boulders found when d r i l l i n g the supply well, and from the elongated shape of the cone of depression formed when pumping the well. Supply well S4 (690 feet north of Sl) is located outside this feature and has poor production. The gas well and associated production units are located at the northeast end of this channel feature at the river's edge. The contaminated well i s southwest on a direct line with the axis of this postulated channel.
3. The monitor well, (M5), located between the Manana f a c i l i t y and the contaminated well, was the only monitor well to detect contamination at the time of the aquifer test.
4. Whereas Sl and M5 show contamination, S4, located 400 feet north of, and on the other side of the production unit, has not become contaminated.
5. The Manana f a c i l i t y i s the only o i l and gas production unit i n the area of the waterwell. No industrial f a c i l i t i e s are nearby, and no evidence of dumping of o i l or other fluids at
-15-
the site was found.
Implications for Future Well Use
The pumping test showed that after three years, o i l s t i l l remains close to the supply well. A simple calculation using pumping rate, time of o i l a r r i v a l , aquifer thickness, and porosity, shows that o i l was at a radius of about 20 feet when the test started. This calculation assumes that the o i l w i l l move to the well at the same velocity as the water, an assumption not always satisfied.
Once a source of hydrocarbon pollution is disrupted, and the main body of contaminants displaced, some of the o i l remains trapped i n the porous media above and below the water table because of capillary forces. Hydrocarbon migration halts as this lower, "residual saturation" i s reached. The trapped hydrocarbon remains as pendular rings attached to the subsurface particles or as isolated "blobs" (7).
Below the water table, most residual o i l exists as discontinuous blobs. I t can be mobilized by increasing the hydraulic gradient or by reducing surface tension (as by surfactants). One method to .increase the hydraulic gradient is by pumping. Therefore, when the Flora Vista well was i n operation, the pumping cycles themselves acted to mobilize the blobs and move them towards the well. In the absence of a sufficient hydraulic gradient to move the o i l i t s e l f , some constituents w i l l leach into the water and move as dissolved species. Therefore, benzene, toluene, etc., can be detected i n a well without the actual physical presence of an o i l phase.
Because the amount, duration, and exact nature of the discharge is unknown, i t cannot be predicted how long i t w i l l endure. However, i t can be assumed that as long as o i l remains nearby the well, i t w i l l be mobilized and captured by the cyclic pumping. Even i f o i l pumped with the water cannot be quantified i n definite health terms, the presence of o i l cannot be tolerated i n drinking water systems for esthetic reasons.
Well S5 was taken out of service i n summer, 1985. Since that time, the well has been l e f t uncapped. Some low levels of hydrocarbons were found in that well, as i n the other monitor wells, after using the air compressor in September, 1985. Unlike the others, continued traces of hydrocarbons have been found i n the 1986 samplings. A zone of capture diagram (Figure 11) shows that during the 2 1/3 years the well was pumping after well Sl was contaminated, well S5 would have captured water from the area of Sl. Therefore, the existence of hydrocarbons between Sl and S5 cannot be ruled out. Well S5 should be pumped and sampled to determine whether there i s a hydrocarbon problem. The well should then be capped, but with access for sampling.
Not enough information i s known by the OCD to provide information on the likelihood of the other wells being contaminated. Pumping and sampling
-16-

S5 w i l l provide some information on hydrocarbon presence. Well S2 is along the assumed buried channel as described above, but the others are offset by some distance. I f d r i l l i n g logs, pumping rates, and cycles for the other wells are known, drawdowns, cones of depression, and capture zones can be calculated using data from the CCD aquifer test.
Conclusions
1) No verifiable contamination was detected i n 1985 in either the unused water supply wells or the monitor wells except for low level contamination detected i n samples taken within 24 hours of cleaning with an air compressor. The contaminated well was not pumped with a high capacity pump in 1985.
2) Methane at concentrations 1200 times ambient levels was detected i n the monitor well closest to the gas well i n August, 1985. The source i s l i k e l y the decay of shallow buried organic material. I t may be from natural material, from gas well d r i l l i n g and testing fluids, or from the leaked produced water. The gas well i t s e l f i s not l i k e l y the source of methane since i t has 227 feet of surface casing cemented back to the surface. A January, 1986, sample showed no methane in any wells.
3) Natural ground water flow i s from north to south. Under non-pumping conditions, ground water from the v i c i n i t y of the Manana production unit w i l l not encounter supply well Sl or other supply wells.
4) An aquifer test performed by the OCD i n A p r i l , 1986, found that average hydraulic conductivity of the sediments i s approximately 750 gallons per day per square foot. Seepage velocity is in excess of 3 feet per day and about 1170 feet per year.
5) The aquifer test produced an elongated cone of depression which indicates a buried channel along a northeast-southwest axis. Supporting evidence includes aerial photographs, extensive subsurface sand, gravel and boulder deposits, and lower production at well S4 which i s located away from this feature.
6) Zone of capture calculations for well Sl show that when the conl^minated well i s pumped at production rates, the well w i l l draw water (and any contaminants) from the v i c i n i t y of the Manana f a c i l i t y . The presence of a buried channel l i k e l y having preferential permeability w i l l enhance such capture.
7) Capture calculations for well S5 show that water (and contaminants) near Sl w i l l be drawn to S5 when well S5 is i n use.
8) Oil and dissolved hydrocarbon contamination remains i n sediments immediately adjacent to well Sl. Any production pumping w i l l cause continued movement of contaminants into the well.
9) Concentrations of organic contaminants have not exceeded health
-17-

standards i n OCD samples. However, i f only for esthetic reasons, o i l i s not acceptable i n drinking water systems.
10) At conclusion of the aquifer test, monitor well sampling detected elevated levels of organic aromatic hydrocarbons i n well M5 approximately halfway between the contaminated supply well and the Manana produced water tank. These values were higher than i n any previous sampling. A l l other monitor wells were free of detectable contamination.
11) Inorganic contaminant levels were not elevated at well Sl i n any OCD sampling i n 1985-86. Minor variations were noted that are attributable to natural fluctuations.
12) The source of contamination is past activities at the Mary Wheeler Gas well f a c i l i t y . The hydrologic and geologic evidence, especially from the aquifer test, supports this conclusion. Additional support for this conclusion comes from the fact that no other sources of hydrocarbons are i n the area, and an upgradient well (S4) did not become contaminated when i t was i n service.
13) The exact discharge mechanism(s) at the gas well f a c i l i t y i s unknown. Possible sources include Manana's fiberglass produced water storage tank (which was known to have leaked); the p i t used to drain produced water from the o i l storage tank; the mud, reserve or blowdown pit s containing o i l from d r i l l i n g and completion operations; or o i l from upsets of the El Paso Natural Gas Company's dehydrator. Oil from the latte r f a c i l i t y would be discharged i n the event of malfunction of Manana equipment. OCD does not have records of EPNG upsets nor does i t have records of Manana tank replacement or other equipment malfunctions. The contamination may be a combination of one or more of these mechanisms.
14) The absence of brine contaminaton i n the contaminated well does not eliminate produced water discharges as the cause of contamination. Since many inorganic constituents are very mobile and ground water flow is rapid, such contaminants, especially chloride, are l i k e l y gone from the area.
15) Residual o i l , as hydrocarbon "blobs", w i l l remain present i n the sediments near the well. Oil w i l l continue to move into the well i n response to cyclic pumping i f the well i s put back i n service.
16) Capture curves were not calculated for the pumping wells since conditions were not known at those sites. Knowledge of the natural flow at the new wells, pumping rates, and pumping cycles would allow such curves and cones of depression to be drawn. Such information would allow evaluation of the threat of those wells from the o i l contamination.
Recommendations
1) Well S5 should be immediately capped and locked, but such capping
should allow for access for pumping and water level measurements.
2) Since well S5 is upgradient of the currently used well f i e l d , i t should be used as a monitor well. The well should be pumped for a sufficient length of time to purge water in the immediate v i c i n i t y of the well bore. I t then should be sampled for aromatic hydrocarbons, chlorides and to t a l dissolved solids. Sampling should be on a regular schedule (perhaps quarterly or semiannually) depending on the most recent sampling results.
3) I f the pumping of well S5 detects o i l or high concentrations of dissolved hydrocarbons, other wells (especially S2) may be threatened. In that instance, additional extensive site work, including s o i l excavation, w i l l be necessary to determine the threat to other wells. Removal of o i l and contaminated s o i l may well be necessary to prevent continued movement to other supply wells.
4) Sampling of individual pumping water supply wells for purgeable aromatic hydrocarbons should be performed on a regular basis. For convenience, a sampling schedule identical to that required for t o t a l trihalomethanes is i n i t i a l l y suggested.
References
1) Birsoy, Y. K., and W. K. Summers. 1980. Determination of Aquifer parameters from step tests and intermittent pumping data. Ground Water, V. 18, No. 2, pp. 137-146.
2) Jacob, C. E. 1963. Determining the permeability of water-table aquifers, i n "Methods of Determinig Permeability, Transmissibility and Drawdown". U.S.G.S., Water Supply Paper 1536-1. pp 245-271.
3) Johnson Division, UOP Inc. 1972, Ground Water and Wells, 2nd ed. Edward E. Johnson Co., St. Paul Minn. 440p.
4) Lohman, S. W. 1972. Ground-Water Hydraulics. U.S.G.S. Professional Paper 708. 70p.
5) Ranney Method Western Corporation. 1981. "Ranney Collector Water Supply, Flora Vista Water Users Association, Flora Vista, New Mexico". 7p., appendices.
6) Todd, D. K. 1980. Groundwater Hydrology, 2nd ed. John Wiley & Sons, N.Y. 535p.
7) Wilson, J. L. and S. H. Conrad. 1984, Is physical displacement of residual hydrocarbons a rea l i s t i c possibility i n aquifer restoration? i n "Proceedings of the NWWA/API Conference on Petroleum Hydrocarbons and Organic Chemicals in Ground Water - Prevention, Detection and Restoration, Nov. 5-7, 1984, Houston," National Water Well Association, Dublin, Ohio, 533p.
-19-

!
REPORT TABLES

TABLE 1. - Results of Organic Chemical Analyses for Flora Vista Supply Wells Supply Well No. 1 (Survey Point No. 6)
STANDARD NM GROUND WATER STANDARD
EPA RMCL 8/83
1538 3/20/85
1610 3/20/85 6/28/85
Benzene
Toluene
10
15,000 750 a
0 f
2000 p
ND
ND
ND
ND
ND
ND
ND
6
Ethyelbenzene
p-xylene m-xylene o-xylene
Chloroform Other Trihalo-methanes
750 a
Total xylenes
620 a
100 a
680 p
Total xylenes 440 p
Total Trihalo-methanes 100 m
ND
ND ND ND
ND
ND
ND
ND ND ND
ND
ND
ND
ND ND ND
ND
Detection Limit 4
Analyzed by
Methane (dissolved)
10
Ana Cor
1
SLD
1
SLD
1
SLD
1.3ppm
Detection Limit Ippm
Conments: Well shut down i n 1983 due to hydrocarbon contamination. Well capped and welded, shut July 1985. One unsaturated hydrocarbon detected 6/28/85 at 5ppb but unidentified.
Footnotes:
1) Results i n parts per b i l l i o n or micrograms per l i t e r unless otherwise noted 1,000 ppb = 1 ppm or mg/l). ND- not detected, L-less than.
2) a - adopted December 1985 but not yet i n effect.
3) p - proposed, f - f i n a l EPA Recommended Maximum Contaminant level (RMCL) for community drinking water supplies (RMCL's non-enforceable), m - maximum contaminant level (enforceable).
4) SLD- New Mexico Scientific Laboratory Division
5) Methane may be frcm natural gas or marsh gas dissolved i n sample. Normal range level i n atmosphere from about 0.8 to 1.5 ppm.
-21-

TABLE 1. - (Continued) Supply Well No. 1 (Survey Point No. 6) - 1986
NM GROUND EPA 1950 2010 2015 1310 STANDARD WATER STANDARD RMCL 4/22/86 4/22/86 4/22/86 4/24/86
Benzene 10 0 f ND ND ND 1
Toluene 750 a 2000 p ND ND 1 ND
Ethyelbenzene 750 a 680 p 6 1 ND ND
p-xylene Total Total 7 1 ND ND m-xylene xylenes xylenes 14 2 ND ND o-xylene 620 a 440 p 1 ND ND ND
Detection Limit - - 1 1 1 1
4 Analyzed by
- - SLD SLD SLD SLD
Comments: Well shut down i n 1983 due to hydrocarbon contamination. Aquifer test on well 4/22-24/86. Hydrocarbons entered well at 1817 4/22. Analyses that date at 1950, 2010, and 2015 showed unsaturated C aliphatics, and possible C- substituted benzene. Possible trace of toluene and xylenes 4/23 at 0832. No high levels of heavy metals or napthalenes detected. Chloride 16 mg/l and TDS 498 mg/l on 4/23/86.
Footnotes:
1) Results i n parts per b i l l i o n or micrograms per l i t e r unless otherwise noted 1,000 ppb = 1 ppm or mg/l). ND- not detected.
2) a - adopted December, 1985.
3) p - proposed, f - f i n a l EPA Recommended Maximum Contaminant level (RMCL) for community drinking water supplies (RMCL's non-enforceable), m - maximum contaminant level (enforceable).
4) SLD- New Mexico Scientific Laboratory Division
5) The following 1986 samples had no aromatic hydrocarbons detected: 4/21-0945; 4/22-1525; 4/23-1310; 4/24-1320, 1400; 4/25-1050; 5/21-0935, 1140, 1340.
-22-
-1 •-) •>
TABLE 1 (Continued) Supply Well NO. 5 (Survey Point No. 14)
STANDARD NM GROUND WATER STANDARD
EPA RMCL 3/20/85 8/5/85 9/20/85 9/21/85 10/25/85
Benzene
Toluene
Ethyelbenzene
p-xylene m-xylene o-xylene
Chloroform Other Trihalo-methanes
10
15,000 750 a
750 a
Total xylenes
620 a
100a
0 f
2000 p
680. p
Total xylenes 440 p
Total Trihalo-methanes 100 m
ND
ND
ND
ND ND ND
ND
ND
ND
ND
ND
ND ND ND
ND
ND
ND
3
2 4 5
ND
ND
ND
3
1 4 3
ND
ND
ND
Ll
L l
ND Ll Ll
ND
ND
Detection Limit 4
Analyzed by
Methane 5
(dissolved)
1
SLD
2
SLD
1.3ppm
2
SLD
2
SLD
1
SLD
1.8
Detection Limit Ippm 0.4
Comments: Well on-line u n t i l July 85. Pump then removed and well l e f t open. Well pumped with a i r 9/20/85. Air compressor exhaust present i n ai r line introduced small quanitities of contaminants which may be those seen on 9/20 and 9/21.
Footnotes:
1) Results i n parts per b i l l i o n or micrograms per l i t e r unless otherwise noted (1,000 ppb = 1 ppm or mg/l). ND- not detected, L-less than.•
2) a - adopted December 1985 but not yet i n effect.
3) p - proposed, f - f i n a l EPA Recommended Maximum Contaminant level (RMCL) for community drinking water supplies (RMCL's non-enforceable). m - maximum cxmtaminant level (enforceable).
4) SLD - New Mexico Scientific Laboratory Division
5) Methane may be from natural gas or marsh gas dissolved i n sample. Normal range level i n atmosphere from about 0.8 to 1.5 ppm.
-23-

TABLE 1 - (Continued) Supply Well No. 5 (Survey Point No. 14) - 1986
NM GROUND _ EPA ., STANDARD WATER STANDARD RMCL 1/17/86 4/21/86 4/25/86
Benzene 10 0 f <1 ND ND
Toluene 750 a 2000 p 2 ND <1
Ethyelbenzene 750 a 680 p ND ND ND
p-xylene Total Total ND ND ND m-xylene xylenes xylenes <1 ND ND o-xylene 620 a 440 p ND ND ND
Detection Limit - - 1 1 1 4
Analyzed by - - SLD SLD SLD
Comments: Well on-line u n t i l July, 1985. Pump then removed.and well l e f t open. Uncapped through May, 1986. On 1/17/86 trace quantities of two other unidentified compounds were detected.
Footnotes:
1) Results in parts per b i l l i o n or micrograms per l i t e r unless otherwise noted (1,000 ppb = 1 ppm or mg/l). ND- not detected, <-less than.
2) a - adopted December, 1985.
3) p - proposed, f - f i n a l EPA Recommended Maximum Contaminant level (RMCL) for community drinking water supplies (RMCL's non-enforceable), m - maximum contaminant level (enforceable).
4) SLD - New Mexico Scientific Laboratory Division.
-24-

Table 1. (Cont'd) System Composites
STANDARD NM GROUND WATER STANDARD
EPA RMCL 3/20/85 8/5/85 10/25/85
Benzene
Toluene
Ethyelbenzene
p-xylene m-xylene o-xylene
Chloroform Other Trihalo-methanes
Detection Limit
4 Analyzed by
Methane ~* (dissolved)
Detection Limit
10
15,000 750 a
750 a
Total xylenes
620 a
100 a
0 f
2000 p
680 p
Total xylenes 440 p
Total Trihalo-Methanes
100 m
ND
ND
ND
ND ND ND
ND
1
SLD
ND
ND
ND
ND ND ND
ND
ND
2
SLD
13.6ppm
Ippm
ND
ND
ND
ND ND ND
ND
ND
1
SLD
l.lppm
0.4ppm
Comments: 3/20/85-Wells S2 & S3 on line; 10/25/85 (and l i k e l y 8/5)-wells S2, S3 and S6 on line. A l l samples prior to chlorinator entry point several feet down pipe. By comparison City of Farmington sample on 10/23 had 50 ppb chloroform and to t a l of 76 ppb THM.
Footnotes:
1) Results i n parts per b i l l i o n or micrograms per l i t e r unless otherwise noted (1,000 ppb = 1 ppm or mg/l). ND- not detected, L-less than.
2) a - adopted December 1985 but not yet i n effect.
3) p - proposed, f - f i n a l EPA Recommended Maximum Contaminant level (RMCL) for community drinking water supplies (RMCL's non-enforceable), m - maximum contaminant level (enforceable).
4) SLD - New Mexico Scientific Laboratory Division
5) Methane may be from natural gas or marsh gas dissolved i n sample. Normal range level i n atmosphere from about 0.8 to 1.5 ppm.
-25-

Table 1. (Cont'd) System Composites - 1986
STANDARD NM GROUND WATER STANDARD
EPA RMCL 1/17/86 4/25/86 5/21/86
Benzene
Toluene
10
750 a
0 f
2000 p
ND
ND
ND
ND
ND
ND
Ethyelbenzene 750 a
p-xylene m-xylene o-xylene
Chloroform Other Trihalo-methanes
Detection Limit 4
Analyzed by
Methane (dissolved)
Detection Limit
Total xylenes
620 a
100 a
680 p
Total xylenes 440 p
Total Trihalo--Methanes
100 m
ND
ND ND ND
ND
ND
1
SLD
ND
ND
ND ND ND
ND
ND
1
SLD
2 ppm
ND
ND ND ND
ND
ND
1
SLD
Conments: A l l samples prior to chlorinator entry point several feet down pipe. Dichloramethane at 14 ppb detected 4/25; further investigation determined sample vials contaminated.
Footnotes:
1) Results in parts per b i l l i o n or micrograms per l i t e r unless otherwise noted (1,000 ppb = 1 ppm or mg/l). ND- not detected.
2) a - adopted December, 1985.
3) p - proposed, f - f i n a l EPA Recommended Maximum Contaminant level (RMCL) for community drinking water supplies (RMCL's non-enforceable). m - maximum contaminant level (enforceable).
4) SLD - New Mexico Scientific Laboratory Division.
5) Methane may be from natural gas or marsh gas dissolved in sample. Normal range level i n atmosphere from about 0.8 to 1.5 ppm.
-26-
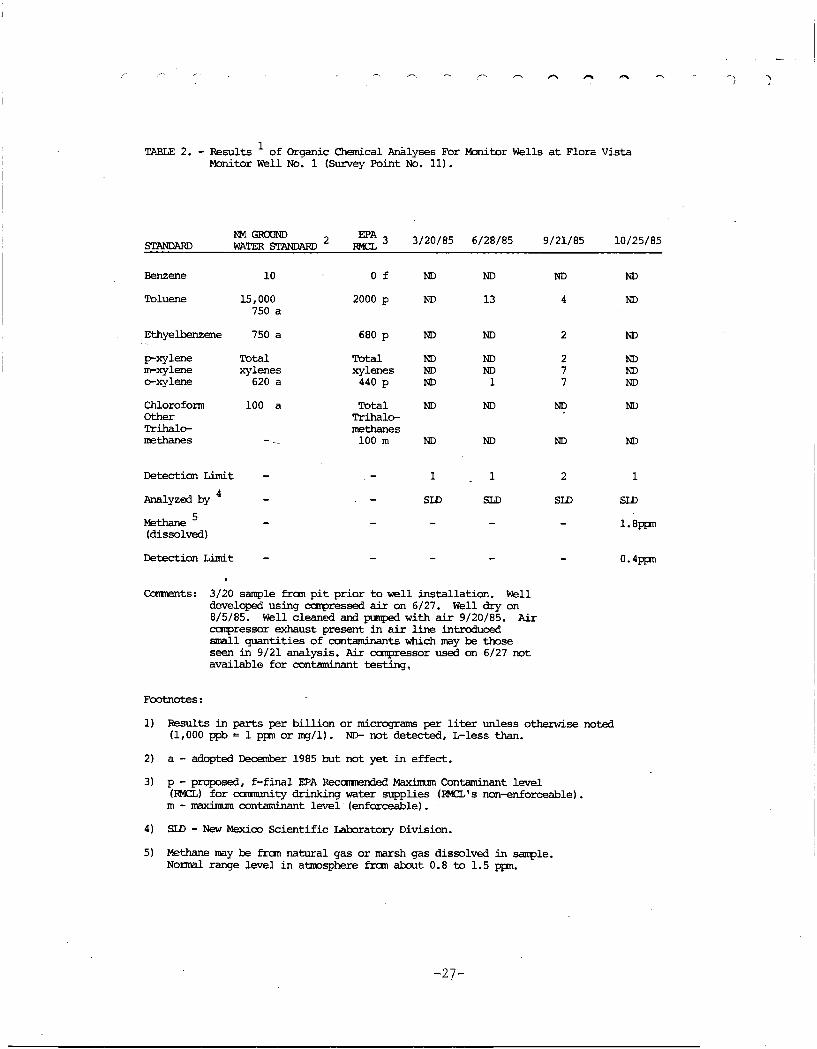
TABLE 2. - Results of Organic Chemical Analyses For Monitor Wells at Flora Vista Monitor Well No. 1 (Survey Point No. 11).
STANDARD NM GROUND WATER STANDARD
EPA RMCL
3/20/85 6/28/85 9/21/85 10/25/85
Benzene
Toluene
Ethyelbenzene
p-xylene m-xylene o-xylene
Chloroform Other Trihalo-methanes
10
15,000 750 a
750 a
Total xylenes
620 a
100 a
0 f
2000 p
680 p
Total xylenes 440 p
Total Trihalo-methanes 100 m
ND
ND
ND
ND ND ND
ND
ND
ND
13
ND
ND ND 1
ND
ND
ND
4
2 7 7
ND
ND
ND
ND
ND
ND ND ND
ND
ND
Detection Limit 4
Analyzed by
Methane (dissolved)
Detection Limit
1
SLD
1
SLD
2
SLD
1
SLD
1.8ppm
0.4ppm
Comments: 3/20 sample from p i t prior to well installation. Well developed using compressed a i r on 6/27. Well dry on 8/5/85. Well cleaned and pumped with a i r 9/20/85. Air compressor exhaust present i n a i r line introduced small quantities of cxmtaminants which may be those seen i n 9/21 analysis. Air compressor used on 6/27 not available for contaminant testing.
Footnotes:
1) Results i n parts per b i l l i o n or micrograms per l i t e r unless otherwise noted (1,000 ppb = 1 ppm or mg/l). ND- not detected, L-less than.
2) a - adopted December 1985 but not yet i n effect.
3) p - proposed, f - f i n a l EPA Recommended Maximum Ctotaminant level (RMCL) for community drinking water supplies (RMCL's non-enforceable). m - maximum contaminant level (enforceable).
4) SLD - New Mexico Scientific laboratory Division.
5) Methane may be from natural gas or marsh gas dissolved i n sample. Normal range level i n atmosphere from about 0.8 to 1.5 ppm.
-21-
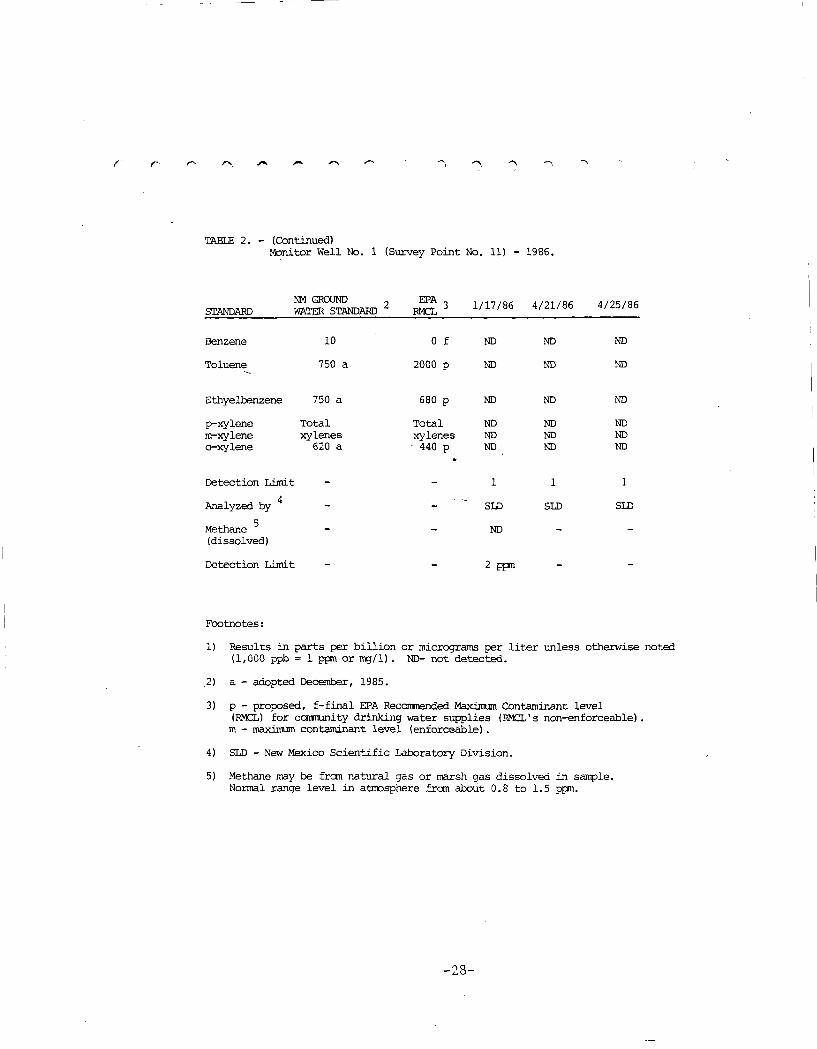
TABLE 2. - (Continued) Monitor Well No. 1 (Survey Point No. 11) - 1986.
NM GROUND - EPA , ^ l a c A m i l a c / l / l c / o c STANDARD WATER STANDARD 2 RMCL 3 1 / 1 7 / 8 6 4 / 2 1 / 8 6 4 / 2 5 / 8 6
Benzene 10 0 f ND ND ND
Toluene 750 a 2000 p ND ND ND
Ethyelbenzene 750 a 680 p ND ND ND
p-xylene m-xylene o-xylene
Total xylenes
620 a
Total xylenes 440 p
ND ND ND
ND ND ND
ND ND ND
Detection Limit
Analyzed by 4
Methane 5
(dissolved)
1
SLD
ND
1
SLD
1
SLD
Detection Limit 2 ppm
Footnotes:
1) Results in parts per b i l l i o n or micrograms per l i t e r unless otherwise noted (1,000 ppb = 1 ppm or mg/l). ND— not detected.
.2) a - adopted December, 1985.
3) p - proposed, f - f i n a l EPA Recommended Maximum Contaminant level (RMCL) for community drinking water supplies (RMCL's non-enforceable). m - maximum contaminant level (enforceable).
4) SLD - New Mexico Scientific Laboratory Division.
5) Methane may be from natural gas or marsh gas dissolved in sample. Normal range level i n atmosphere from about 0.8 to 1.5 ppm.
-28-

TABLE 2. (Continued) Monitor Well No. 2 (Survey Point No. 12)
STANDARD NM GROUND WATER STANDARD
EPA RMCL 3/20/85 6/28/85 9/21/85 10/25/85
Benzene
Toluene
Ethyelbenzene
p-xylene m-xylene o-xylene
Chloroform Other Trihalo-methanes
10
15,000 750 a
750 a
Total xylenes
620 a
100 a
0 f
2000 p
680 p
Total xylenes 440 p
Total Trihalo-methanes 100 m
ND
ND
ND
ND ND ND
ND
ND
ND
5
ND
ND ND Ll
ND
ND
ND
3
ND
L2 2
L2
ND
ND
ND
ND
ND
ND ND ND
ND
ND
Detection Limit 4
Analyzed by
Methane 5
(dissolved)
Detection Limit
1
SLD
1
SLD
2
SLD
1
SLD
0.7ppm
0.4ppm
Comments: 3/20 sample from p i t prior to well installation. Well developed using compressed a i r 6/27. Well dry 8/5/85. Well cleaned and pumped with a i r 9/20/85. Air compressor exhaust present i n a i r line introduced small quantities of contaminants which may be those seen i n 9/21 analysis. Air compressor used on 6/27 not available for contaminant testing.
Footnotes:
1) Results i n parts per b i l l i o n or micrograms per l i t e r unless otherwise noted (1,000 ppb = 1 ppm or mg/l). ND- not detected, L-less than.
2) a - adopted December 1985 but not yet i n effect.
3) p - proposed, f - f i n a l EPA Recommended Maximum Contaminant level (RMCL) for community drinking water supplies (RMCL's non-enforceable). m - maximum contaminant level (enforceable).
4) SLD - New Mexico Scientific Laboratory Division.
5) Methane may be from natural gas or marsh gas dissolved i n sample. Normal range level i n atmosphere frcm about 0.8 to 1.5 ppm.
-29-

TABLE 2. (Continued) Monitor Well No. 2 (Survey Point No. 12) - 1986
NM GROUND - EPA , STANDARD WATER STANDARD RMCL 1/17/86 4/21/86 4/25/86
Benzene
Toluene
10
750 a
0 f
2000 p
ND
ND
ND
ND
ND
ND
Ethyelbenzene
p-xylene m-xylene o-xylene
750 a
Total xylenes
620 a
680 p
Total xylenes 440 p
ND
ND ND ND
ND
ND ND ND
ND
ND ND ND
Detection Limit 4
Analyzed by 5
Methane (dissolved) Detection Limit
1
SLD
ND
2 ppm
1
SLD
1
SLD
Footnotes:
1) Results in parts per b i l l i o n or micrograms per l i t e r unless otherwise noted (1,000 ppb = 1 ppm or mg/l). ND- not detected.
2) a - adopted December, 1985.
3) p - proposed, f - f i n a l EPA Recommended Maximum Contaminant level (RMCL) for community drinking water supplies (RMCL's non-enforceable)', m - maximum contaminant level (enforceable).
4) SLD - New Mexico Scientific Laboratory Division.
5) Methane may be frcm natural gas or marsh gas dissolved i n sample. Normal range level i n atmosphere from about 0.8 to 1.5 ppm.
-30-
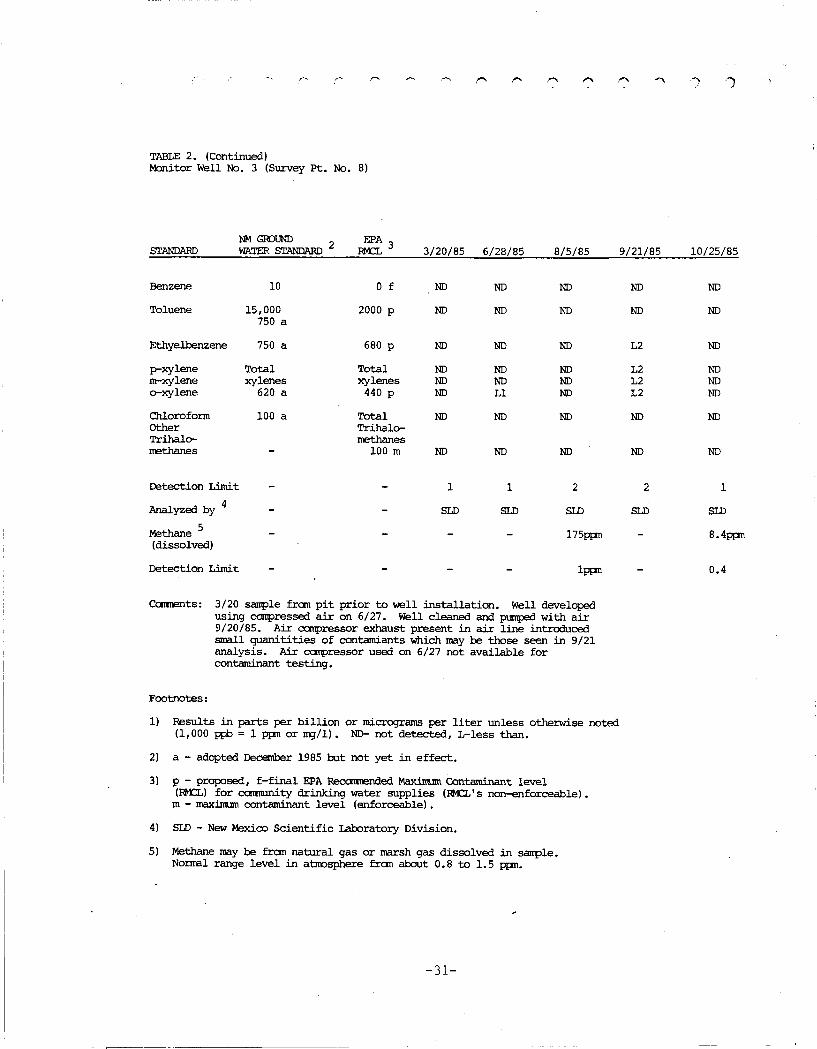
TABLE 2. (Continued) Monitor Well No. 3 (Survey Pt. No. 8)
NM GROUND EPA , STANDARD WATER STANDARD RMCL 3/20/85 6/28/85 8/5/85 9/21/85 10/25/85
Benzene
Toluene
Ethyelbenzene
p-xylene m-xylene o-xylene
Chloroform Other Trihalo-methanes
10
15,000 750 a
750 a
Total xylenes
620 a
100 a
0 f
2000 p
680 p
Total xylenes 440 p
Total Trihalo-methanes
100 m
ND
ND
ND
ND ND ND
ND
ND
ND
ND
ND
ND ND Ll
ND
ND
ND
ND
ND
ND ND ND
ND
ND
ND
ND
L2
L2 L2 L2
ND
ND
ND
ND
ND
ND ND ND
ND
ND
Detection Limit 4
Analyzed by
Methane 5
(dissolved)
Detection Limit
1
SLD
1
SLD
2
SLD
175ppm
Ippm
2
SLD
1
SLD
8.4ppm
0.4
Comments: 3/20 sample from p i t prior to well installation. Well developed using compressed a i r on 6/27. Well cleaned and pumped with air 9/20/85. Air compressor exhaust present i n air line introduced small quanitities of contamiants which may be those seen i n 9/21 analysis. Air compressor used on 6/27 not available for contaminant testing.
Footnotes:
1) Results i n parts per b i l l i o n or micrograms per l i t e r unless otherwise noted (1,000 ppb = 1 ppm or mg/l). ND- not detected, L-less than.
2) a - adopted December 1985 but not yet i n effect.
3) p - proposed, f - f i n a l EPA Recommended Maximum Contaminant level (RMCL) for community drinking water supplies (RMCL's non-enforceable), m - maximum contaminant level (enforceable).
4) SLD - New Mexico Scientific Laboratory Division.
5) Methane may be from natural gas or marsh gas dissolved i n sample. Normal range level i n atmosphere from about 0.8 to 1.5 ppm.
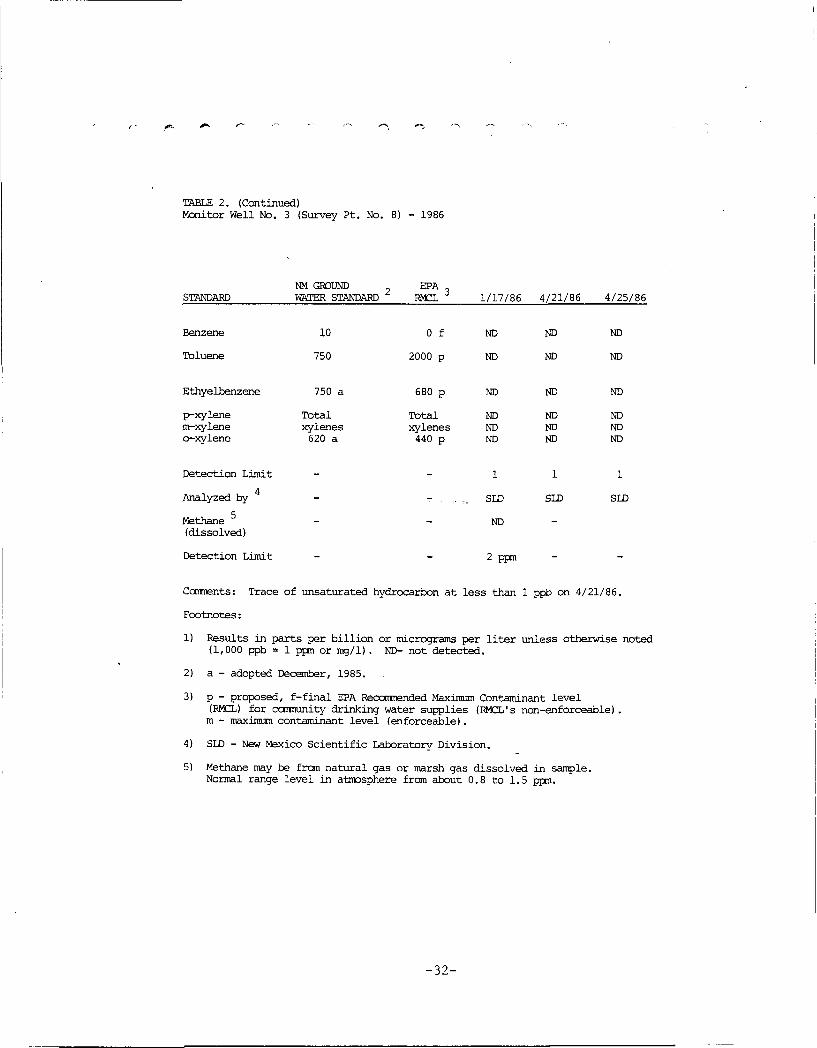
TABLE 2. (Continued) Monitor Well No. 3 (Survey Pt. No. 8) - 1986
STANDARD NM GROUND WATER STANDARD
EPA RMCL 1/17/86 4/21/86 4/25/86
Benzene
Toluene
10
750
0 f
2000 p
ND
ND
ND
ND
ND
ND
Ethyelbenzene
p-xylene m-xylene o-xylene
750 a
Total xylenes 620 a
680 p
Total xylenes 440 p
ND
ND ND ND
ND
ND ND ND
ND
ND ND ND
Detection Limit 4
Analyzed by
Methane 5
(dissolved)
Detection Limit
1
SLD
ND
2 ppm
1
SLD
1
SLD
Comments: Trace of unsaturated hydrocarbon at less than 1 ppb on 4/21/86.
Footnotes:
1) Results in parts per b i l l i o n or micrograms per l i t e r unless otherwise noted (1,000 ppb = 1 ppm or mg/l). ND- not detected.
2) a - adopted December, 1985.
3) p - proposed, f - f i n a l EPA Recommended Maximum Contaminant level (RMCL) for community drinking water supplies (RMCL's non-enforceable), m - maximum contaminant level (enforceable).
4) SLD - New Mexico Scientific Laboratory Division.
5) Methane may be from natural gas or marsh gas dissolved in sample. Normal range level in atmosphere from about 0.8 to 1.5 ppm.
-32-
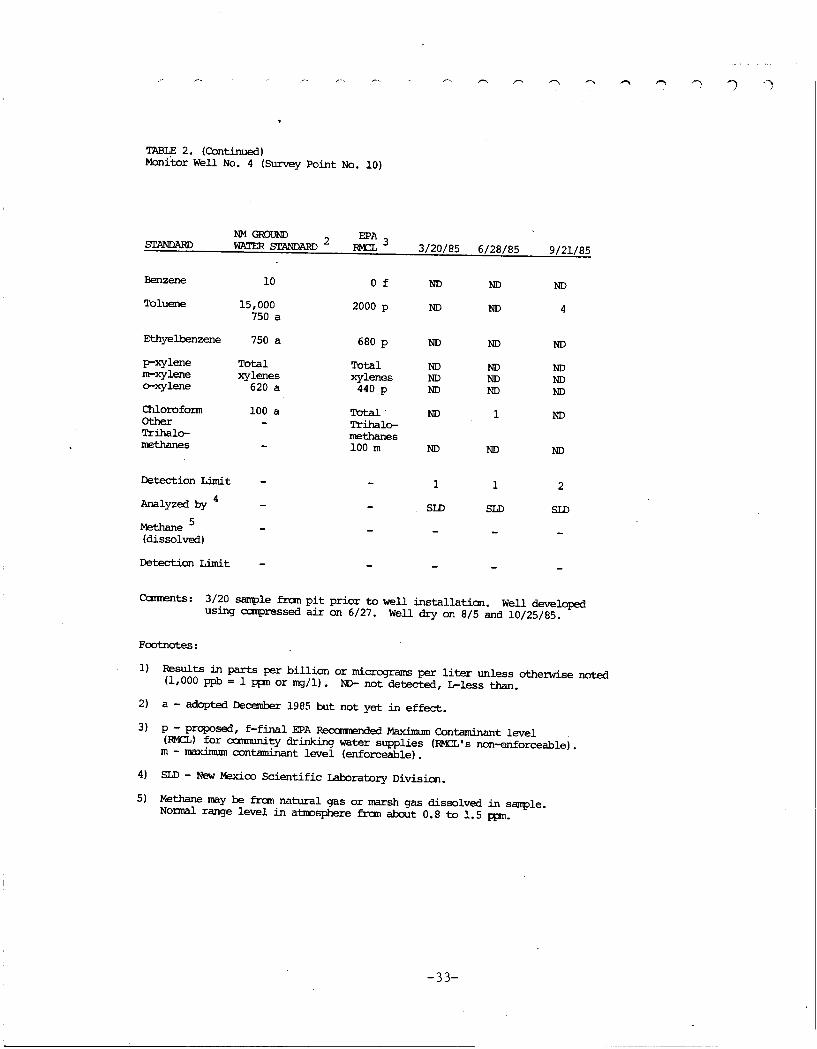
TABLE 2. (Continued) Monitor Well No. 4 (Survey Point No. 10)
STANDARD NM GROUND WATER STANDARD
EPA RMCL 3/20/85 6/28/85 9/21/85
Benzene
Toluene
Ethyelbenzene
p-xylene m-xylene o-xylene
Chloroform Other Trihalo-methanes
Detection Limit 4
Analyzed by
Methane 5
(dissolved)
Detection Limit
10 0 f ND ND ND
15,000 2000 p ND ND 4 750 a
750 a 680 p ND ND ND
Total Total ND ND ND xylenes xylenes ND ND ND
620 a 440 p ND ND ND
100 a Total ND 1 ND - Trihalo-
methanes 100 m ND ND ND
- - 1 1 2
SLD SLD SLD
Comments: 3/20 sample from p i t prior to well installation. Well developed using compressed a i r on 6/27. Well dry on 8/5 and 10/25/85.
Footnotes:
1 } V t S ^ * t p a ^ T t S b i l l i o n o r micrograms per l i t e r unless otherwise noted (1,000 ppb = 1 ppm or mg/l). ND- not detected, L-less than.
2) a - adopted December 1985 but not yet i n effect.
3) p - proposed, f - f i n a l EPA Recanmended Maximum Contaminant level (RMCL) for community drinking water supplies (RMCL's non-enforceable) m - maximum contaminant level (enforceable).
4) SLD - New Mexico Scientific Laboratory Division.
5) Methane may be from natural gas or marsh gas dissolved i n sample Normal range level i n atmosphere from about 0.8 to 1.5 ppm.
-33-

TABLE 2. (Continued) Monitor Well No. 4 (Survey Point No. 10) - 1986
NM GROUND _ STANDARD WATER STANDARD
EPA , RMCL 1/17/86 4/21/86 4/25/86
Benzene 10 0 f ND ND ND
Toluene 750 a 2000 p ND ND ND
Ethyelbenzene 750 a 680 p ND ND ND
p-xylene Total Total ND ND ND m-xylene xylenes xylenes ND ND ND o-xylene 620 a 440 p ND ND ND
Detection Limit - - 1 1 1
4 Analyzed by
- - SLD SLD SLD
Methane 5 _ __ " ""ND _ _ (dissolved)
Detection Limit - - 2 ppm - -
Footnotes:
1) Results i n parts per b i l l i o n or micrograms per l i t e r unless otherwise noted (1,000 ppb = 1 ppm or mg/l). ND- not detected.
2) a - adopted December, 1985.
3) p - proposed, f - f i n a l EPA Recommended Maximum Contaminant level (RMCL) for community drinking water supplies (RMCL's non-enforceable), m - maximum contaminant level (enforceable).
4) SLD - New Mexico Scientific Laboratory Division.
5) Methane may be from natural gas or marsh gas dissolved in sample. Normal range level i n atmosphere from about 0.8 to 1.5 ppm.
-34-

TABLE 2. (Continued) Monitor Well No. 5 (Survey Point No. 4)
NM GROUND _ EPA , STANDARD WATER STANDARD RMCL 3/20/85 6/28/85 8/5/85 9/21/85 10/25/85
Benzene
Toluene
Ethyelbenzene
p-xylene m-xylene o-xylene
Chloroform Other Trihalo-methanes
10
15,000 750 a
750 a
Total xylenes
620 a
100 a
0 f
2000 p
680 p
Total xylenes 440 p
Total Tribalo-methanes 100 m
ND
ND
ND
ND ND ND
ND
ND
ND
ND
ND
ND ND ND
ND
ND
ND
ND
ND ND ND
ND
ND
ND
2
2 1 ND
ND
ND
ND
ND
ND
ND ND ND
ND
ND
Detection Limit
Analyzed by 4
5
Methane
(dissolved) Detection Limit
1
SLD
1
SLD
5
SLD
1256ppm
Ippm
2
SLD
1
SLD
l.lppm
0.4ppm
Comments: 3/20 sample from p i t prior to well installation. Dark black s o i l layer sampled 3/20 but o i l not present at detectable levels. Well developed using compressed a i r on 6/27. 8/5 sample has strong swampy sulfur smell. Well cleaned and pumped with air 9/20/85. Air compressor exhaust present i n a i r line introduced small quanitities of contamiants which may be those seen i n 9/21 analysis.
Footnotes:
1) Results i n parts per b i l l i o n or micrograms per l i t e r unless otherwise noted (1,000 ppb = 1 ppm or mg/l). ND- not detected, L-less than.
2) a - adopted December 1985 but not yet i n effect.
3) p - proposed, f - f i n a l EPA Recommended Maximum Contaminant level (RMCL) for community drinking water supplies (RMCL' s non-enforceable). m - maximum contaminant level (enforceable).
4) SLD - New Mexico Scientific Laboratory Division.
5) Methane may be from natural gas or marsh gas dissolved i n sample. Normal range level i n atmosphere from about 0.8 to 1.5 ppm.
-35-
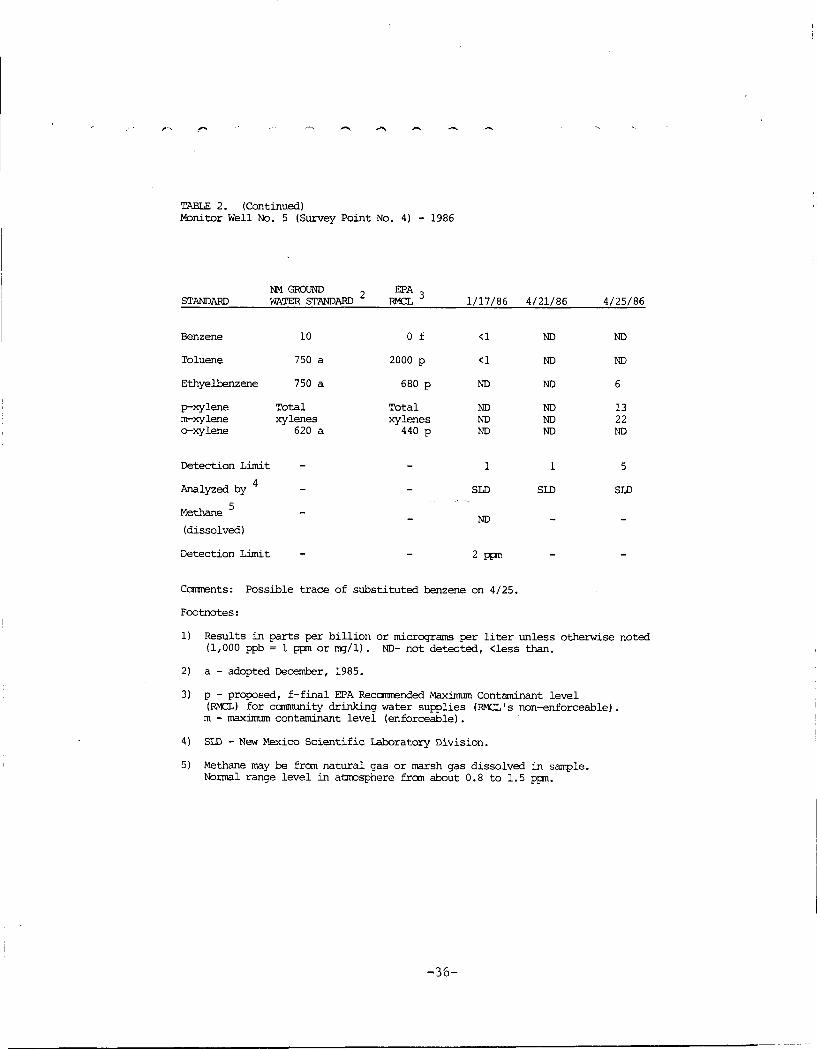
TABLE 2. (Continued) Monitor Well No. 5 (Survey Point No. 4) - 1986
STANDARD NM GROUND WATER STANDARD
EPA RMCL 1/17/86 4/21/86 4/25/86
Benzene
Toluene
Ethyelbenzene
p-xylene m-xylene o-xylene
10
750 a
750 a
Total xylenes
620 a
0 f
2000 p
680 p
Total xylenes
440 p
<1
<1
ND
ND ND ND
ND
ND
ND
ND ND ND
ND
ND
6
13 22 ND
Detection Limit 4
Analyzed by
Methane 5
(dissolved)
1
SLD
ND
1
SLD
5
SLD
Detection Limit 2 ppm
Comments: Possible trace of substituted benzene on 4/25.
Footnotes:
1) Results i n parts per b i l l i o n or micrograms per l i t e r unless otherwise noted (1,000 ppb = 1 ppm or mg/l). ND- not detected, <less than.
2) a - adopted December, 1985.
3) p - proposed, f - f i n a l EPA Recommended Maximum Contaminant level (RMCL) for ccmmunity drinking water supplies (RMCL's non-enforceable), m - maximum contaminant level (enforceable).
4) SLD - New Mexico Scientific Laboratory Division.
5) Methane may be from natural gas or marsh gas dissolved in sample. Normal range level i n atmosphere from about 0.8 to 1.5 ppm.
-36-
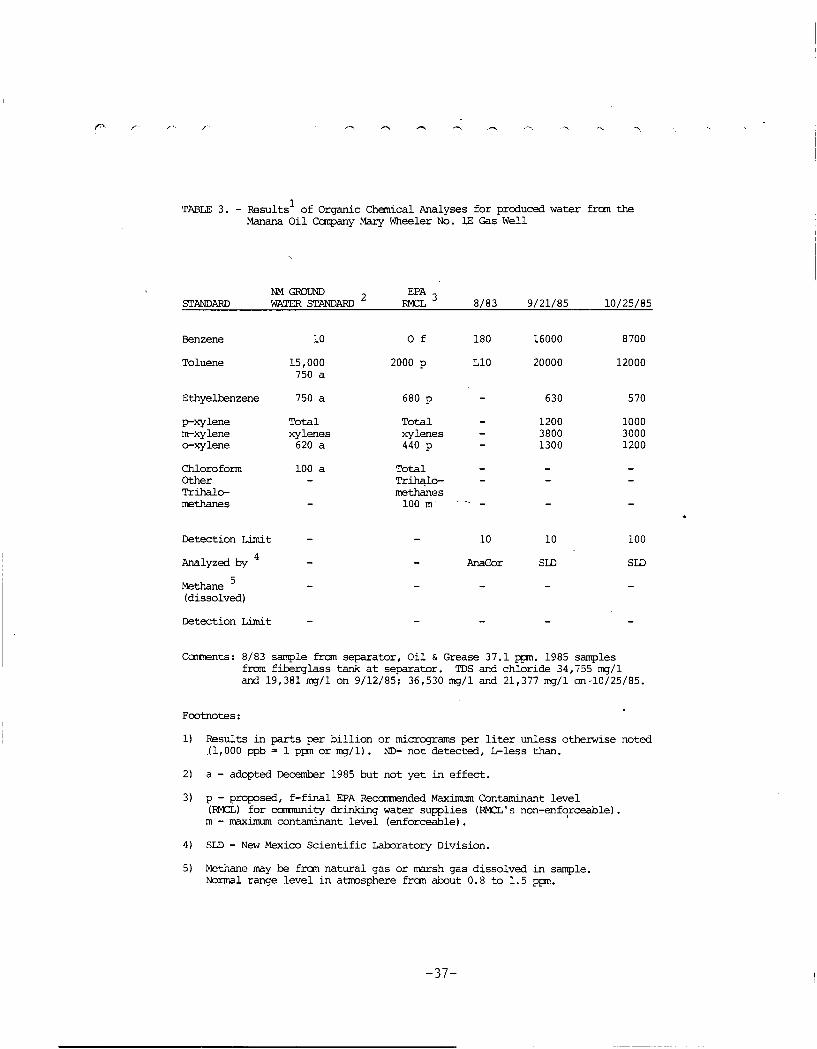
TABLE 3. - Results of Organic Chemical Analyses for produced water from the Manana Oil Company Mary Wheeler No. IE Gas Well
STANDARD NM GROUND WATER STANDARD
EPA RMCL 8/83 9/21/85 10/25/8S
Benzene 10 0 f 180 16000 8700
Toluene 15,000 750 a
2000 p L10 20000 12000
Ethyelbenzene 750 a 680 p - 630 570
p-xylene m-xylene o-xylene
Total xylenes 620 a
Total xylenes 440 p
— 1200 3800 1300
1000 3000 1200
Chloroform Other Trihalo-methanes
100 a Total Trihalo-methanes 100 m
- -
_
Detection Limit - 10 10 100
4 Analyzed by
- - AnaGor SLD SLD
Methane (dissolved)
Detection Limit
Comments: 8/83 sample from separator, Oil & Grease 37.1 ppm. 1985 samples from fiberglass tank at separator. TDS and chloride 34,755 mg/l and 19,381 mg/l on 9/12/85; 36,530 mg/l and 21,377 mg/l on-10/25/85.
Footnotes:
1) Results i n parts per b i l l i o n or micrograms per l i t e r unless otherwise noted .(1,000 ppb = 1 ppm or mg/l) . ND- not detected, L-less than.
2) a - adopted December 1985 but not yet in effect.
3) p - proposed, f - f i n a l EPA Recommended Maximum Contaminant level (RMCL) for ccrmmunity drinking water supplies (RMCL's non-enforceable), m - maximum contaminant level (enforceable).
4) SLD - New Mexico Scientific Laboratory Division.
5) Methane may be from natural gas or marsh gas dissolved i n sample. Normal range level i n atmosphere from about 0.8 to 1.5 ppm.
-37-

TABLE 3. - (Continued) Manana Oil Company Mary Wheeler No. IE Gas Well - 1986
NM GROUND ? EPA , STANDARD WATER STANDARD RMCL 4/23/86 5/21/86
Benzene 10 0 f 550 150
Toluene 750 a 2000 p 120 500
Ethyelbenzene 750 a 680 p 45 11
p-xylene Total Total 120 120 m-xylene xylenes xylenes 540 640 o-xylene 620 a 440 p 145 180
Detection Limit - - 1 5
4 Analyzed by
- - SLD SLD
Comments: 1986 Samples from fiberglass tank at o i l storage tank. Napthalenes present at 350 ppb (to t a l ) . Benzo(a) pyrene may be present but can't be quantified.
Footnotes:
1) Results in parts per b i l l i o n or micrograms per l i t e r unless otherwise noted (1,000 ppb = 1 ppm or mg/l). ND- not detected.
2) a - adopted December, 1985.
3) p - proposed, f - f i n a l EPA Reconmended Maximum Contaminant Level (RMCL) for ccraminity drinking water supplies (RMCL's non-enforceable). m - inaximum contaminant level (enforceable).
4) SLD - New Mexico Scientific Laboratory Division.
-33-

TABLE 4. - Results of Organic Chemical Analyses for produced water frcm the El Paso Natural Gas dehydrator at the Manana Oil Company Mary Wheeler No. IE Gas Well - 1986
STANDARD NM GROUND WATER STANDARD
EPA RMCL 1/17/86 2/28/86
Benzene
Toluene
10
750 a
0 f
2000 p
14,000
37,000
550
350
Ethyelbenzene
p-xylene m-xylene o-xylene
750 a
Total xylenes 620 a
680 p
Total xylenes 440 p
1,200
3,000 11,000 4,100
1800 NR 499
Detection Limit
Analyzed by 4
5 Methane (dissolved)
Detection Limit
200
SLD
0.5%
SLD
207 ppm
2 ppm 0.3 ppm
Comments: Samples frcm 55-gallon drum at dehydrator. Conductivity 81 umho/cm at 17°c on 2/28/86. No heavy metals except iron, t i n and manganese (likely from drum) .
Footnotes:
1) Results in parts per b i l l i o n or micrograms per l i t e r unless otherwise noted (1,000 ppb = 1 ppm or mg/l). ND - Not Detected; NR - Not Reported.
2) a - adopted December, 1985. ,
3) p - proposed, f - f i n a l EPA Recommended Maximum Contaminant level (RMCL) for carnmunity drinking water supplies (RMCL's non-enforceable) . m - maximum contaminant level (enforceable).
4) SLD - New Mexico Scientific Laboratory Division.
5) Methane may be from natural gas or marsh gas dissolved i n sample. Normal range level i n atmosphere from about 0.8 to 1.5 ppm.
-39-

TABLE 5 - Sunmary of Aquifer Test Results for Several Analytical Methods
Aquifer Theis - Adjusted Dimensionless Well Parameter (Modified) Jacob Time Drawdown Time Recovery
Sl T(gpd/ft): 8,014 7,196 9429 (Step 1)
S: NA NA
5500 (Step 2) 9962 (Step 3)
NA
15,529
NA
xSl T(gpd/ft): S:
14,614 0.027
16,704 0.019
13,200 0.041
12,279 NA
Ml T(gpd/ft): S:
15,617 0.100
NA NC ND
M3 T (gpd/ft) : S:
14,855 0.078
12,752 0.070
NC ND
M4 T (gpd/ft) : S:
15,227 0.092
NA NC ND
M5 T(gpd/ft) : S:
14,677 0.097
NA NC ND
Notes: 1) T - Transmissivity, S - Storage Coefficient (dimensionless), NA - Not Applicable, NC - Not Calculated, ND — No Data.
2) Storage coefficient cannot be calculated for pumped well. Low T values for Sl during pumping are due to well entrance losses. Well M2 drawdown too small to analyze.
-40-

TABLE 6. Animas River Flow at Farmington, 1983 Water Year (Source: U.S. Geolog ica l Survey)
SAN JUAN RIVER BASIN 3 7 9
09364500 ANIMAS RIVER AI FARMINGTON, NM ( N a t i o n a l s c r e a m - q u a l i t y a c c o u n t i n g network s t a t i o n )
LOCATION Lat 36"4 3'17", long 108*12'05", I n SWkSWt sec.15, T.29 N•, R.13 U., San Juan County, H y d r o l o g i c Onit 14080104, l n Boyd C i t y Park, on r i g h t bank 900 f t upstream from b r i d g e oo Ml 11*t Ave., 0.4 ml downstrssa from b r i d g e on U.S. Highway 64 I n F a r m i n g t o n , and 1.5 ml upstream from mouth.
DRAINAGE AREA 1,360 m l 2 , a p p r o x i m a t e l y .
WATER-DISCHARGE RECORDS
PERIOD OF RECORD June 1904 t o October 1905 ( p u b l i s h e d aa "near F a r m i n g t o n " ) , September 1912 t o c u r r e n t year. Monthly d i a c h a r g e o n l y f o r some p e r i o d s , p u b l l a h e d l n USP 1313.
REVISED RECORDS.—WSP 1243: 19 31. KSP 1313: 1913.
GAGE.—Water-stage r e c o r d e r . A l t i t u d e of gage l s 5,280 f c , from t o p o g r a p h i c map. P r i o r Co Nov. 1, 1905, n o n - r e c o r d i n g gage at o l d b r i d g e 0.1 ml upstream at d i f f e r e n t datum. Sept. 17, 1912, t o Oct. 4, 1938, w a t e r - s t s g e r e c o r d e r at s i t e 0.8 mi downstream at l o w e r dacuma (datum lowered 2*0 f t Aug. 15, 1927, and r a i s e d 0.2 f t Dec. 16, 1929). Oct. 5, 1938 co Nov. 1, 1973 ac s i c e 900 f c downacream ac datum 1.74 f c l o w e r .
REMARKS.—Water-discharge r e c o r d s good excepc chose f o r w i n t e r p e r i o d , which are f a i r . D i v e r s i o n s f o r i r r i g a t i o n of abouc 30,000 acres above s t a t i o n .
AVERAGE DISCHARGE 72 y e a r s , 916 f c 3 / e , 663,600 a c r e - f t / y r .
EXTREMES FOR PERIOD OF RECORD Maximum d i a c h a r g e , about 25,000 ( t 3 / s June 29 , 19 27 , gage h e i g h t , 8.5 f t , s i t e and datum then l n use, from r a t i n g curve excendad above 10,000 f c /s; minimum, 1.0 f t /a Aug. 11, 1972*
EXTREMES OUTSIDE PERIOD OF RECORD.—Maximum f l o o d o c c u r r e d Oct. 6, 1911, whan a stage of about 16.5 f t waa reached (datum l n uae Oct. 1938 Co Nov. 1973). Flood of Sepc. 6, 1909, reached a stage of 11.1 f t , 1904-5 s i t e end dstum ( d l s c h e r g e , about 19,000 f t / a ) .
EXTREMES FOR CURRENT YEAR.—Peek d l e c h a r g e s above baea of 4,000 f t 3 / s and maximum ( * ) :
Discharge Gage heighc D i s c h a r g e Cage Height Dace Time ( < t J / s ) ( f t ) Date Time ( f t / s ) ( f c )
May 31 2330 *6320 8.59 Aug. 6 0100 9320 8.31 June 25 0330 5920 8.61
DISCHARGE, IN CUBIC FEET FER SECOND, WATER TEAR OCTOBER 1982 TO SEPTEMBER 1983 MEAN VALUES
DAT OCT NOV DEC JAN FEB MAR APR MAT JUN J U L AUG SEP
1 8 5 8 4 1 1 4 3 2 345 35 3 5 6 4 6 9 2 1 7 8 0 5 8 1 0 3 6 1 0 126C 4 2 1
2 8 9 0 4 0 9 4 1 5 3 4 1 3 3 6 5 1 0 6 5 2 1 5 4 0 5 2 5 0 34 70 1 2 7 0 4 0 6
3 7 9 0 4 1 1 395 34 6 3 3 2 5 0 8 6 3 6 1 4 0 0 4 3 7 0 34 30 1 3 9 0 4 4 2 4 746 389 385 385 35 3 5 9 3 6 5 2 1 3 3 0 3 6 3 0 35 60 1 3 2 0 4 00
5 7 1 0 396 4 0 5 3 9 1 365 6 3 3 6 6 0 1 3 0 0 3 6 4 0 3 4 8 0 1 2 3 0 379
6 6 5 6 3 9 0 380 390 330 4 9 8 5 7 2 1 4 8 0 3 6 5 0 3 3 1 0 1 8 1 0 349 7 5 9 2 3 9 0 38 8 355 29 8 4 6 8 58 8 1 7 6 0 3 5 7 0 3 1 5 0 1 3 3 0 34 3 8 554 3 8 0 384 369 296 4 6 5 5 6 1 1 8 7 0 3 7 4 0 3 1 8 0 1 4 3 0 345 9 535 395 4 1 1 3 7 6 308 4 8 1 5 2 7 17 30 3 8 1 0 2 9 3 0 1 2 8 0 38 7
10 5 1 1 4 6 2 5 5 3 358 3 1 1 5 0 3 5 5 9 20 30 3 3 1 0 2 8 4 0 U 5 0 385
11 4 9 9 4 5 0 3 4 4 36 5 30 2 5 4 8 555 2 6 1 0 3 3 4 0 2 6 7 0 1 0 9 0 35 3 1 2 4 9 1 4 4 4 4 8 1 37 6 317 6 1 1 5 7 3 2 9 8 0 39 20 2 2 9 0 1 0 8 0 335 13 4 4 8 3 9 5 4 3 2 365 328 6 4 7 6 30 2 7 7 0 39 30 2 0 7 0 9 7 2 30 8 14 4 30 390 4 0 4 367 335 6 7 8 6 7 2 2 3 4 0 3 1 2 0 1 8 6 0 8 5 9 297
15 4 2 9 390 396 370 336 8 3 0 6 4 5 2 1 6 0 2 7 3 0 1 7 4 0 8 0 1 30 3
16 4 36 3 7 0 374 37 3 319 7 0 3 5 9 1 1 9 0 0 2 9 2 0 1 3 9 0 757 29 3 17 455 3 7 0 3 8 2 376 34 1 6 0 6 6 0 2 17 20 3 1 9 0 1 5 0 0 6 4 8 304
18 4 7 1 405 4 0 0 380 336 6 0 4 64 6 16 20 37 30 1 4 7 0 547 27 8 19 464 4 0 5 3 9 1 366 3 4 1 597 7 8 3 1 4 9 0 4 6 1 0 1480 5 3 6 270 20 4 4 2 4 34 366 3 5 2 34 1 5 5 3 9 2 3 1 4 5 0 5 4 1 0 1 5 7 0 607 268
21 4 30 4 2 8 36 3 350 34 5 4 9 0 1 0 3 0 1 4 7 0 5 3 1 0 1530 5 0 4 275 22 398 4 0 5 373 3 5 1 345 5 0 0 1 0 2 0 1 3 6 0 5 3 3 0 1 5 2 0 47 1 293 23 38 7 387 4 2 3 335 390 5 8 0 1 0 6 0 14 30 5 1 6 0 1 6 1 0 4 3 5 312 24 389 3 9 0 4 1 6 328 4 4 4 5 4 0 1 2 2 0 1 9 5 0 5 1 4 0 1 6 9 0 4 14 326
:s 387 374 36 7 332 4 6 8 5 4 0 1600 2 6 6 0 5 5 4 0 1 6 6 0 4 1 5 302
:6 384 377 339 330 504 5 4 8 1 9 7 0 3 9 0 0 49 30 1 8 1 0 4 6 6 30 4 :7 4 25 3 7 1 348 318 4 8 0 5 5 6 1 9 5 0 4 2 1 0 4 5 2 0 2 1 1 0 47 3 298
:a 4 37 37 1 3 25 3 2 1 4 9 2 5 2 8 18 10 4 9 4 0 4 2 7 0 1 6 9 0 5 7 9 309 29 407 385 306 34 1 5 2 2 1 7 2 0 5 5 1 0 3 7 6 0 1 4 3 0 4 8 0 322 10 40 3 38 5 288 334 5 5 6 1770 5 4 6 0 3 6 8 0 1 3 6 0 4 6 6 392 11 404 336 3 2 1 6 6 0 5 8 0 0 1 34 0 4 3 3
TOTAL 1 5 8 5 8 1 1 9 5 9 12 202 1 1 0 0 7 1 0 0 4 6 1 76 20 2 7 8 6 9 7 5 9 5 0 1 2 5 5 2 0 6 8 9 5 0 2 6 5 0 3 1 0 0 0 1 MEAN 5 1 2 399 394 35 5 359 568 9 2 9 2 4 5 0 4 1 8 4 2 2 2 4 8 5 5 333 HA X 8 9 0 4 6 2 5 5 3 39 1 504 8 3 0 1 9 7 0 5 8 0 0 58 10 3 6 1 0 1 8 1 0 4 4 2
M:S 384 370 288 318 296 465 527 1 3 0 0 27 30 1 3 4 0 4 1 4 268 AC-FT 3 1 4 5 0 2 37 20 24 20 0 2 1 8 3 0 199 30 3 4 9 5 0 5 < ? 8 0 1 5 0 * 0 0 2 4 9 0 0 0 1 3 6 B 0 0 5 2 5 7 0 1 9 8 4 0
CAL VR 1982 TOTAL 364553 MEAN 999 MAX 3660 MIN 209 AC-FT 723100 "TR YR 1983 TOTAL 413485 MEAN 1133 MAX 5810 MIN 268 AC-FT 820100
- 4 1 -

TABLE 7. Summary of Formulas used i n Predictive Calculations
1) Seepage velocity using Darcy's Law:
- JL i 2
Where: K = Permeability (K = 750 gallons/day/ft from
Ranney report to Brewer & Assoc.)
n = Porosity ( N = 0.25 assumed value for sand/gravel)
i = measured gradient ( i = change i n water level elevation per unit distance)
Reference: Todd, Eq. 3.21.
2) Drawdown using Theis non-equilibrium formula: •
A = £rr
Where: Q = pumping rate (Q = 35 gallons per minute, or Q =
65 gpm) T = Transmissivity (T = Kb where K i s permeability,
b = saturated aquifer thickness = 17 feet from Ranney report; T = 12750 gpd/ft)
r = distance (from well to produced water tank, r = 230 feet)
S = storage coefficient ( S = 0.2 for water table conditions)
t = time of pumping ( t = 100 days for example used here)
Reference: Todd, Eq. 4.38, 4.36.
3) Zone of capture i n a uniform flow f i e l d under steady state conditions:
a) Boundary equation: — jfc. = ToJ\ ^ t) k
b) y - Limit: U. - •4' Q
c) x - Limit: *Y _ O
-42-

TABLE 7. (Continued)
Reference: Todd, Eq. 4.31 to 4.33.
4) Time of transport to pumping well:
a) t - £ f * A lr]" -I
Where: As = change in drawdown over distance, Ar, moving towards pumping well.
b) A-Sj c / t ^ J^'
Where: As^ = change in drawdown over one log cycle of distance for given Q. A s 3 5 = 1.45, As = 2.70
Reference: Todd, Eq. 3.23; Johnson Eq. 8, p. 123.
-43-

REPORT FIGURES

Figure 1. Ground Water Flow Direction, V i c i n i t y of Flora Vista Well Sl, 9/20/85.
-45-
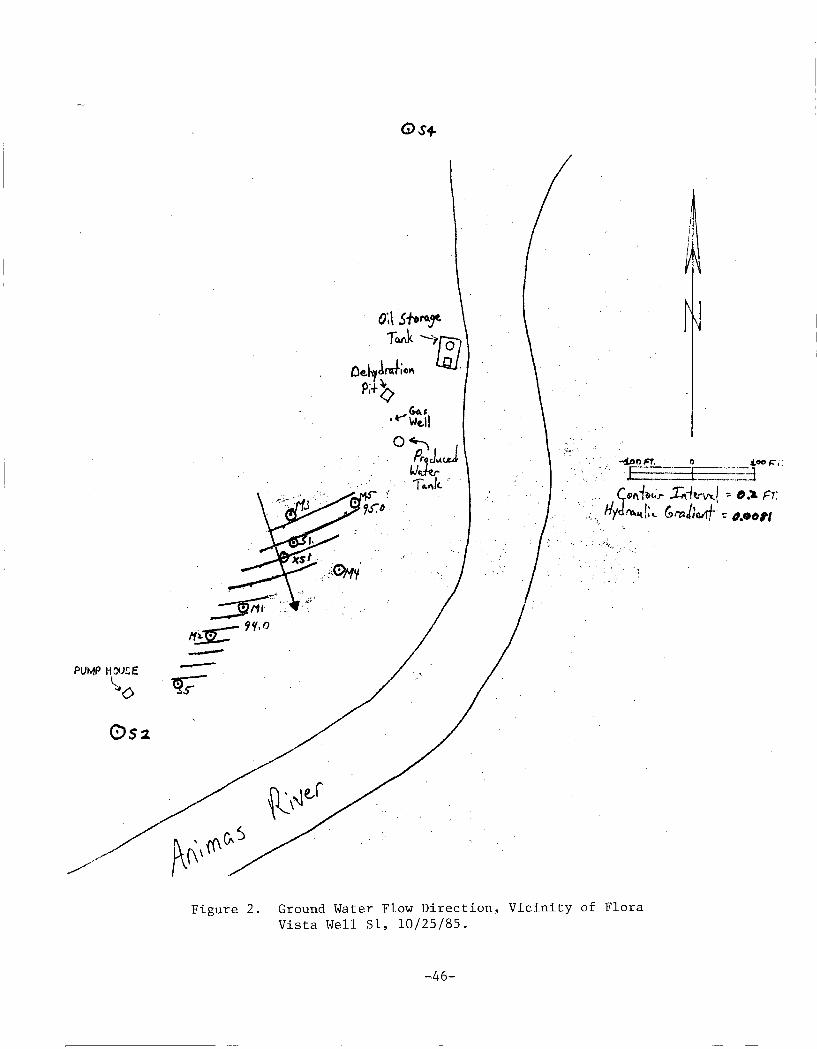
G>S+
Figure 2. Ground Water Flow Direction, V i c i n i t y of Flora Vista Well Sl, 10/25/85.
-46-
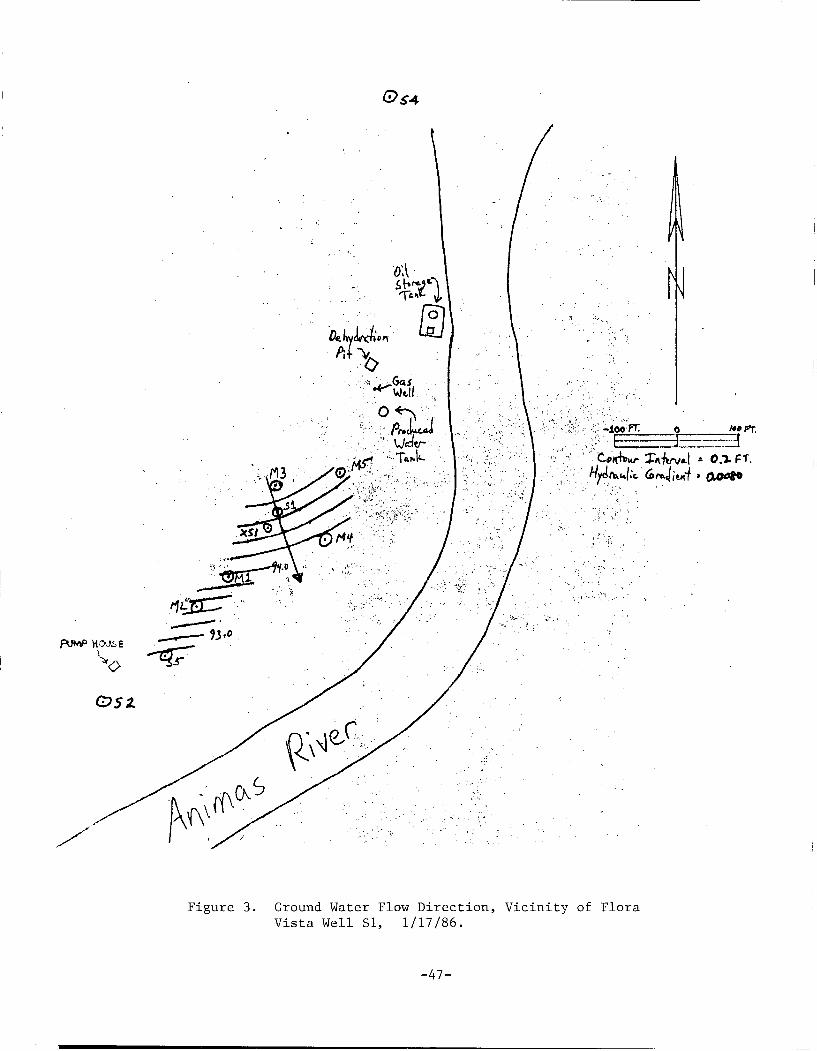
Figure 3. Ground Water Flow Direction, V i c i n i t y of Flora Vista Well Sl, 1/17/86.
-47-
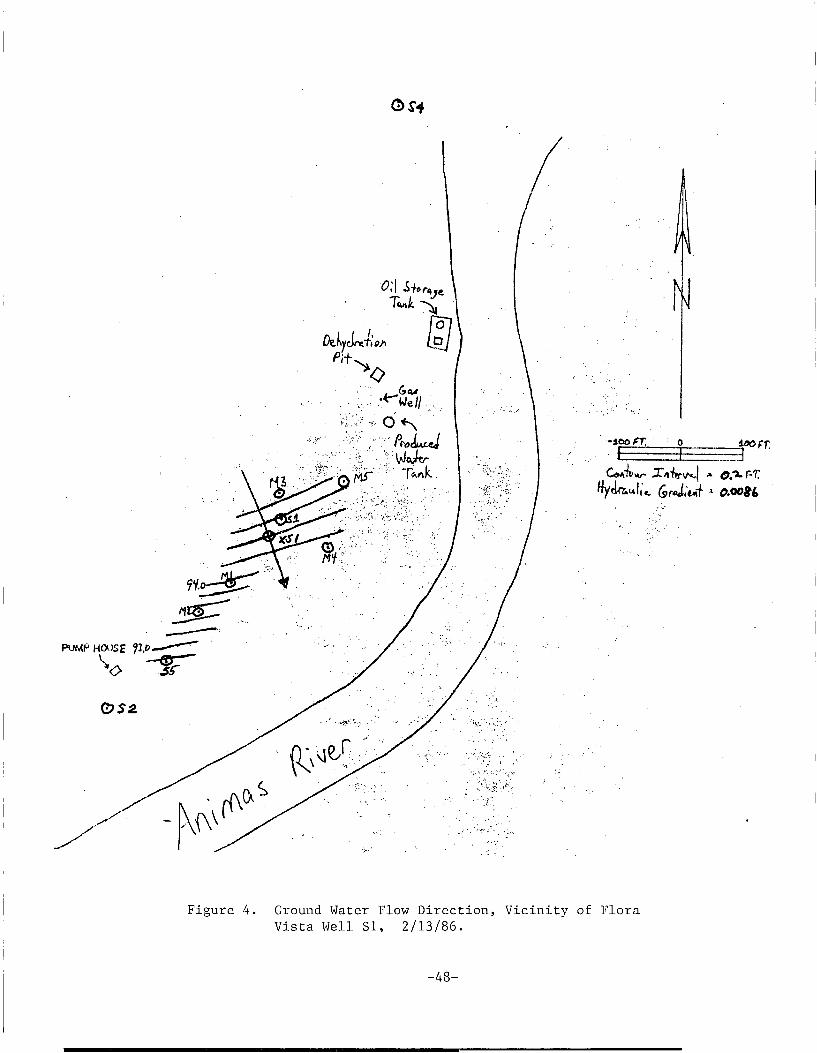
Figure 4. Ground Water Flow Direction, V i c i n i t y of Flora Vista Well Sl, 2/13/86.
-48-

Figure 5. Ground Water Flow Direction, V i c i n i t y of Flora Vista Well Sl, 4/21/86.
-49-

©54
gure 6. Ground Water Flow Direction, V i c i n i t y of Flora Vista Well Sl, 5/21/86.
-50-

AQUIFER TEST
Owner
WELL_
Well No.
IA IA l A Section
SWL feet Date
N S, R. E W. BSM
Measuring point which is
Discharge Diameter inches O r i f i c e
feet above ground surface
inches
Other Measuring Device
Perforated Interval Data col lected by
Date Time Depth Observed Corrected Adjusted Time & since to Drawdown Drawdown s time since
Remarks
Time s t a r t water pump
Minutes Feet Feet
s Q since pump c n s t a r t stopped
Feet Ft/gpm t (Min) t ' (Min)
t/t' t It' a
Figure 7. Form to Tabulate Aquifer Test Results
-51-
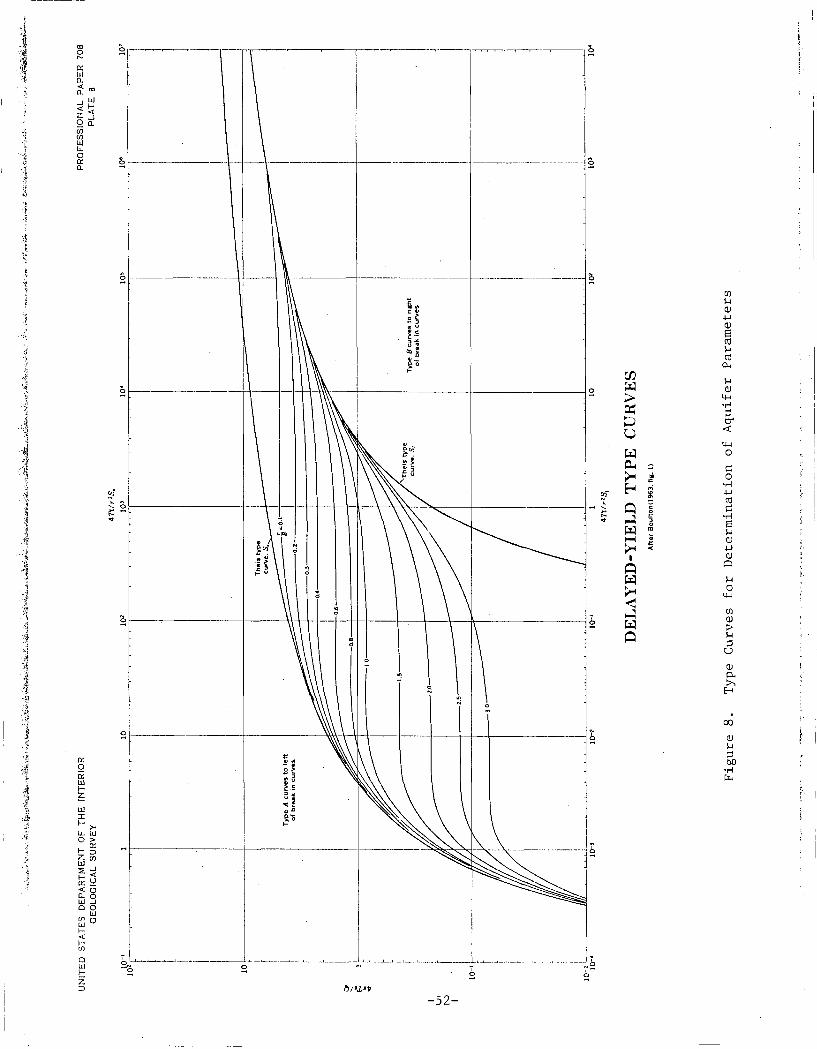
•:lf CK LU a
LU t -
z 2 i CO CO LU Lu O CK
O CC 111 H Z
a H Z
W >
P U
w <H 3
Q I J 1 W -
i
Q W
<
CH
Q
cn u a) 4- 1 QJ 6 CTj H aj
CM
5- i 0)
LH •H
cr <
o
a o •H •P CO a
•H
B a) 4-1 QJ P
O
w 0) > u 3
CJ
QJ Pu
00
0) M
00 •H
t>/>A*t>
- 52 -
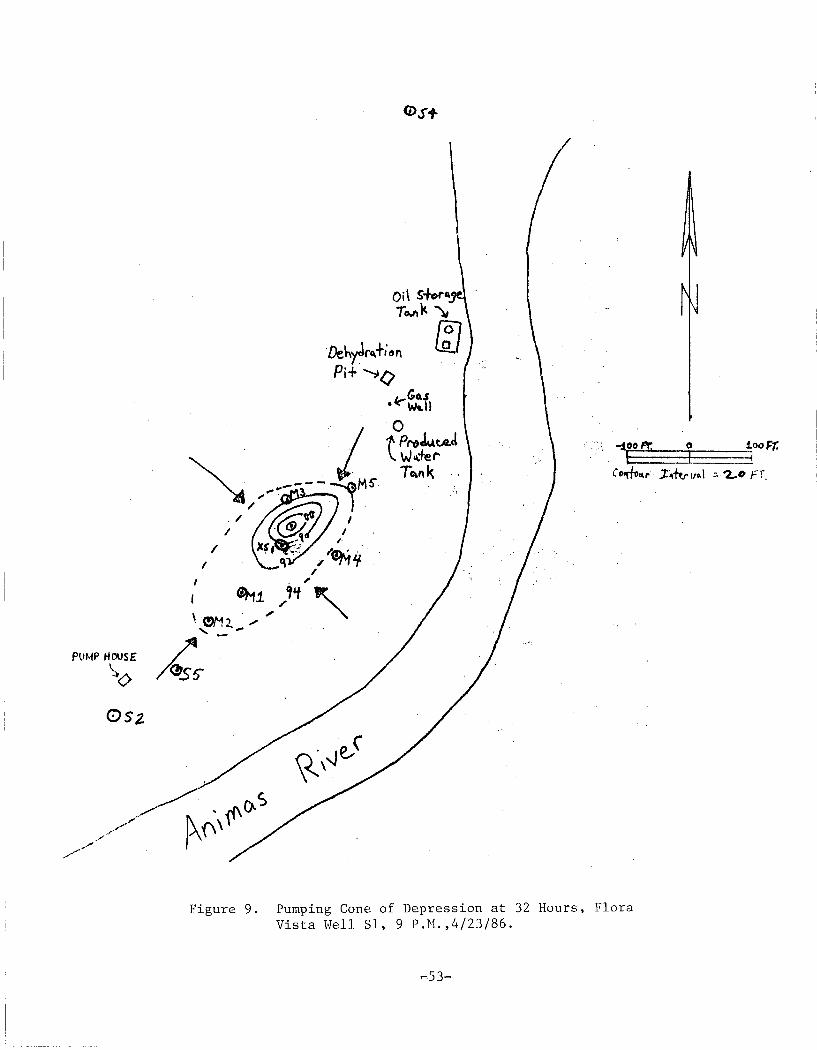
Figure 9. Pumping Cone of Depression at 32 Hours, Flora Vista Well Sl, 9 P.M.,4/23/86.
"53-


Figure 11. Pumping Zone of Capture, Flora Vista Well S5.
-55-

APPENDIX G A n a l y t i c a l Data
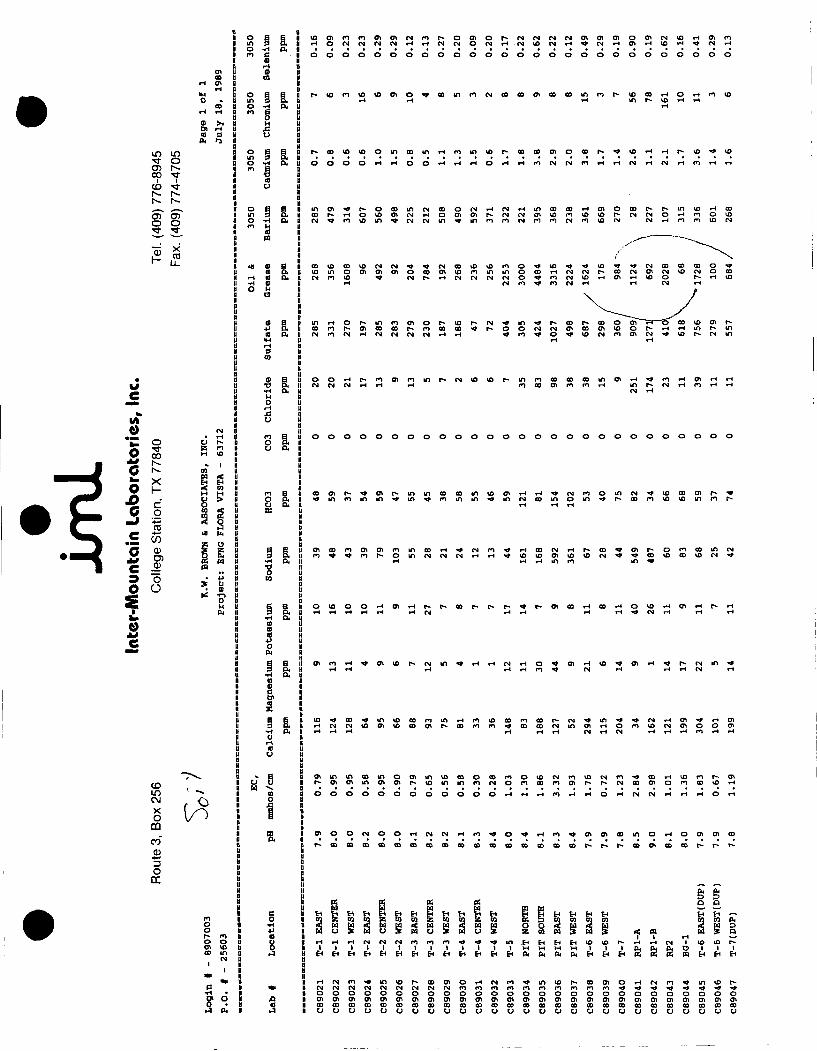
in
00 I
co
ST o
LO
o i
•<r C>-1 -
CT? O 3_ xi CTJ
II a o g
B » a 10 ro O l t N ro r- O O l o r- CN CN CN CM O l O l O l o O l CN VO r H 01 CO
i n a a t H o rN CN CN t H t H CN CN o I N t H • CN CO CN t H "» CN t H O l t H CO i H
•» CN t H
o a a
• c O o o O O O O O O O o o O O o O o o O O o o O O o O O
a> s t H a a i II 0 a CO 0 ta a
t H cn 0 *H II a
•M n O § a r- VO co CO 10 0 1 O *» CO i n ro CN 03 CO 01 CO ro i n ro r~ CD 03 t H O t H ro CO
o i u l 3 a a t H t H t H m r- VO t H t H oo B O •rt a. u t H
t - l t H a ro fi a 0 a
o a H a D l H a £ a a 9 u a a< • 3 a a
a O g a j} r~ 00 CO CO o i n 03 i n t H ro i n IO r- CO 00 O l o 03 r- CO t H t H VO CO
• m 3 a S
r H 0
° y
3 a
a II
(X u a H u
O O »-» t - l rt N N
CN CN m
r- r*. i n co oo OJ o »H cn o vo tN »H cn cn co I N
00 CO 00 U> I N PJ • * co m o o i crt ot o CN f l CO * f
CO CO f*.
r - i- t CN CN in in O IN tN O
CN cn
CD H N
CN rn CN
r- i n cn ot oo oo t H CN CN
CN CN Ot
o •W
c I P .
o £> G e G e o S
• o e
o oo
c o re cn QJ D)
o O
CO
8 o z 04
u
u o
T O o H cu
a
if a 1 to
§ 8.
« o
9 & - H 0 *
ot m i n r- CN co co
o o o o o o o o o o o o o o o o o o o o o o o o o o o
to rn m m o i t> m m
i n cn m m
i N N N H H i f v O i D
cn co co tn cn
IO H C l ri
1 fi •rt a, CJ
ro i n tH ro vo
CO in CM X o CQ co" 05 3 o tx
» B CJ 0 M ^
f 0
a t m m m m o o t t n u > c o o f l O f n o \ o ( N ( n c o t N f n r ^ a o i i n o i a t i ^ v o i n i n c n c N o m c o c n o t r ^ r ^ c N
oo TH vo «n
O t-H fH tH t H t H O f H t H O f H
Ot O O CN O O f H CN CN
CO 00 00 CO
at co
CO CO O- t H »H CN I
EH H S S S ffl
5? °. J Pu
• 3
H f H I N cn ** i n VD CO Ot o t H CN cn <•» m co r- CO Ot o t H CN n m CD r-tt CN CN CN fM CN CN CN CN CN cn cn cn cn cn cn cn cn cn cn ** H O O o O o o o o o o o o o o o o o o o o o o o o o o o a Ot Ot ot Ot ot Ot Ot Ot Ot Ot Ot Ot cn ot ot Ot ot Ot ot Ot Ot Ot Ot Ot Ot Ot a t D 00 CO ao CO 00 ao 00 CO CO CO 00 CO CO CO CO CO CO CO 00 00 00 CO CO ao CO CO CO 1 CJ o u u u CJ u u u u CJ CJ CJ CJ CJ CJ CJ CJ CJ CJ CJ CJ CJ CJ CJ u CJ
PNAs ( S o i l )
I
APPENDIX D Martin Investigation Report

W. tf. MARTIN & ASSOCIATES, INC 709 North Butler, Farmington, New MeSt7rjTJ7401 ~ ~ - — ^
Phone: (505) 326-4507
< MAY -7 mi
April 27, 1987
Flora Vista Water Users Association P. 0. Box 171
Flora Vista, Naw Mexico 87415
Attention: Bert Darn9
The following are summarized lab results and recemmendations from drilling 25+ pilot holes around Mary Wheeler *lE's gao well.
1) S91, #2, #3 were samples taken at different depths 15* SW of Supply Well f i . These sarapla3 showed no solubility and feel that the hydrocarbon level is 7.r.detsctabl«. S H staple waa used as a base for this particular area. Samples v 5-3, C-i, K, and M showed moderate to vigorous gas evolution for 20-30 seconds. All of thesa sasple* are in the reserve pit area and the gaa released was not broken down except in saaple M. Sample M gave off H2S (Hydrogen Sulfide gas) rotten egg scent. The reasoning for the H2S evolution for this sampl.! over the ocher aanplaa ia due to the high concentration of hydrocarbons. No solubility test* hare 'been perforned on the second set of samples, but feel that che only p^slble saeplta that night have H-.S evolution is sample 0, 3ee Fig. 7 in raloticn to sasple H.
2) During tha sulfate analysis of the f i r s t set of samples A-M, the sulfite count waa extremely high aa comparei to samples N-V of the second set. The explanation for thia, even though samples M and N are only 7 linear feet apart, th« saaplet were taken 3 weeka apart. March, 1987, wa3 an extremely ccld aonth and tha water table waa lower than during the middle of April, 1987. Due to the parraeabillty of the river rock and its high porosity of 25Z, the system was probably flushed with the increase of runoff. Due Co the high concentrations of sulfates racorded that a source for bacteria to thrive on ln and around this area vas present during the lessor flow periods fall-winter and then during the vast acounC of runoff in the firat part of April i t had flushed the system. According to Boyaf'a report, that ground movement in this area is up to 100'/day, so to flush thia area fron the gaa well to the supply well would take less than 3 days. Theae results can enow the process of contamination from the reserve pit area to supply well t l into the water system. A corrective method in treating high sulfates ts by using chlorine i.\ the water Bystem. Since the sulfate content has been reduced from 14,000 ppn ,-iovn to less L':-.an 1000 ppa tn throe weeks during the fi r s t part of run-off theae flushings might have brought an excessive acount of sulfates into the system which it was unable to handle.

Flora V i s t a Water Users Association A p r i l 27, 1987 Page 2
3) Hydrocarbon te s t r e s u l t s were very noticeable l n sample M from 5-7' depth ranging from 200-1000 ppm and also in sample 0 9 7' ranging from 100-800 ppm. The high l e v e l of hydrocarbon detected from Richard Cheney'3 report did not exceed 23 ppm. Normal detection level i u .01. Sample detection f o r representative sample No. A-M was less than 5 ppra and most of those second set of .samples were less than .1 ppm. The l e v e l of hydrocarbons detected i n samples M &0 100-1000+ ppm of ^ ^ ^ 2 2 3 r l^ e ;^ very strongly away from the p o s s i b i l i t y of being dead animal decomposition. Most recent animal decomposition usually produces CO2 and Methane, something s i m i l a r at a f e r t i l i z i n g p l a n t . From the gas, peaks on the chromatograph chart and comparing to other o i l f i e l d hydrocarbon source areas showed s i m i l a r r e s u l t s , especially i n the heavy carbon chain levels Cy - C^Q. During high runoff times and the permeability l e v e l of the ground water beds that a good implementation of a charcoal f i l t e r w i l l aid i n absorbing the hydrocarbons out.
A) Bentonite tests were high for sample K which from v i s u a l sample d e s c r i p t i o n can be assumed to be d r i l l i n g mud r e s i d u a l .
In summary, there i s a d r a s t i c change in s u l f a t e content between samples A-M and samples N-V r e s u l t i n g from the increased water r u n o f f . Sulfates can be treated out of the water with c h l o r i n e , but i f hydrocarbons are present then the p o s s i b i l i t y of c h l o r i n a t e d hydrocarbons can be formed. Chlorinated hydrocarbons i f ingested are usually d e t o x i f i e d in the l i v e r and can be c l a s s i f i e d as a carclnagen. A s o l u t i o n to both of these problems would be by implementing both a charcoal f i l t e r and u t i l i z i n g ozone to p u r i f y the system. There are probably soae State guidelines on t h i s type of system. The samples that were taken are s t i l l l n cold storage and a d d i t i o n a l tests can be taken.
Sincerely,
Drew Bates Engineering and Operations Manager

Data: 3-27-87 Mary Wheeler 1-E
Tiae Location
7:00 AM S4 @ SW of S, i l 9 2' if 2 <? 4' #3 9 6' #4 9 8'
8 : 0 0 U J l ^ " ' 1 0 " S O U t h e a 3 C C o r n e r C o w a r d edge reserve p i t
n 9 5' *3 (? 7' water table
8 : 3 ° , ^ ! L ° c a t l 0 Q 2 0 ' of o i l line in reserve p i t l l i #19 3'
C2 Q 4' CMT #3 0 5' #4 9 7' frac sand
9:10 AM C Locacion SE 24' NE of o i l line l l l l n 9 3*
# 2 0 4 '
10:00 AM Location 9 85' East of wellhead edge of Reserve p i t
10:45 AM D Location 9 SW l i m i t <? 2.5'
11:00 AM Location 9 11.5' East of B" East edge l l l l E I? 01 0 3'
E «2 9 5'-7' 5' mud 7' water table
11:10 AM F Location Q 12.5' SE of separator p i t 2' s o i l very unconsolidated river rock very permeable #1 9 3' 91 9 5*-7' frac sand 0 6' water table 9 7'
12:00 PM G Location 8 1 South of separator p i t south post corner #1 sample 9 2' Unable to go below 3' check for hydrocarbon
12:30 PM H Location 4* due South of Separator p i t #1 9 4' $2 Q 5' too rocky too many bits Shaley and very wet - l i t t l e Intermediate sand

Dace: 3
Time
12:44 PM
1:15 PM
1:45 PM
2:00 PM
2:30 PM
2 7 - 8 7 Mary Wheeler 1-E
Location
I Location 12' SW corner separator p i t I 91 9 3' I #2 9 4' very unconsolidated and permeable unable to go below 4-1/2'
J Location 9 38* SE of separator p i t J i l 9 4' J 92 9 9' frac sand water table 9 7.5'
K 45' SE of p i t on surface Mud with hydrocarbons bogged down
L 55' SE of separator p i t #1 9 3-5' 92 9 7' water table
M 75' South of separator pit 9 5-7' Threw drive line

/
•SAMPLING #
N
U
V
4-16-87 (? 7:30 AM
West eSd.efo? ' V " ^ 5' 5 ™ p l e t a k e n 2' and 5' west e^ge of reserv o i r p i t l a s t of v i s i b l e signs.
o l " t i l l 1 " " 8 ^ P ° S 3 i b l e ^ d r o c a L n s d e f i n i t e l y
d e s c ^ ; ^ E 3 9 t ° f m ° n l t 0 r W e l 1 7' 0e«nlte hydrocarbons sample
Water table @ 7.5'
Pound combination lock (? 6'
^ °f m ° n i t 0 r 3 6 ' 5 ' S c e n C o f ^drocarbons Black samples
I v ' l ' o hvd8r ° f K 2 V , N E ° f m ° n i t 0 r W e U " P r e - e n t a t l v e sample « 6 7 no hydrocarbon clear sand check hydrocarbons.no contamination.
t o 7 3 ' S i n t L p t h n , ° n l t 0 r C ° n t a m l n a C e d B»»Ple water table up
V ; 5 ' , w a t e r t a b l e 3' 6" 8* w " t of drainage creek check s u l f a t e and hydrocarbons.
<? 20' NE of S, <? 7' 3' water table Sulfates - Hydrocarbons
<? 20' East of S, t o t a l 10' depth samples out
@ 25' SW of S, t o t a l 6' deep very permeable sulfates and hydrocarbons.

Tech. Inc. 333 E. Main St. Jar-Tingt.on, NM 87401 T50.-5) 327-33H
Laboratory Anniy ' A p r i l 1987
r>t-. >' *
a 1 y 3 i o '"-'--Uiested by: Mr. D. Bate:
^ Drew Bates
•'':ii"r.infftou NM 87401
I a b i l i t y t e s t i n 15% HCI
Cample «
Ai* 2
Aub
B«3
:<
M
M
•«> 1
Analysis
- S o l u b i l i t y
S o l u b i l i t y
S o l u b i l i t y
Solubi1i ty
S o l u b i l i t y
S o l u b i 1 i t y
S o l u b i l i t y
S o l u b i l i t y '"i •:0
J " S o l u b i l i t y
Analysis date: 5 A p r i l 1987
"ample Received:28 March 1987
AnaiystrH. P. Hamlow
K-r.ult
-Mode-race gus evolution, f o r 20-sec
Moderate gas e v o l u t i o n f o r 20 sec
Vigorous gas e v o l u t i o n f o r 30 sec
Vi^-rcus ga-. c-volution 30 sec.
Vigorous gas evol u t i o n 30 sec.
Vigorous gas e v o l u t i o n f o r 30 sec.
Hydrogen s u l f i d e gas evolved.
Very s l i g h t gas evo l u t i o n .
Very s l i g h t gas evo l u t i o n .
Very s l i g h t gaz e v o l u t i o n .

/ i n c . ••'/ Main S t . mngton , NM 87401 5)327-3311
7 A p r i l 1967
Laboratory Analysis R-^porv
r.is requested by: Mr. D. Bates
Mr. Drew Bates
Farmington NM 87401
Analysis on Core Samples
Sample tt Analysi s Result.
E«3 Su l f a t e 2 4 4 p p m -
B»4 . Su l f a t e 3620 ppra
Cfll S u l f a t e 52600 ppm
Foi S u l f a t e 1810 ppm
F 82 Su l f a t e 4 50 ppm
GUI " " Hydrocarbons none or < 5 ppm
J Hydrocarbons none or < 5 ppm
Jtf2 Hydrocarbons none or < 5 ppm
- -Sulfate 3160
K Hydrocarbons none or < 5 ppm
Sul f a t e 24700 ppm
L«2 Hydrocarbons none or < 5 pptr.
S u l f a t e 7 280 ppm
K Hydrocarbons none or < 5 ppm
Sul f a t e 2'1700 ppm
Hydrocarbonr. n&ue ov < f> \<
:-.ul f .v
/ •: r ' •••rb..;.-:
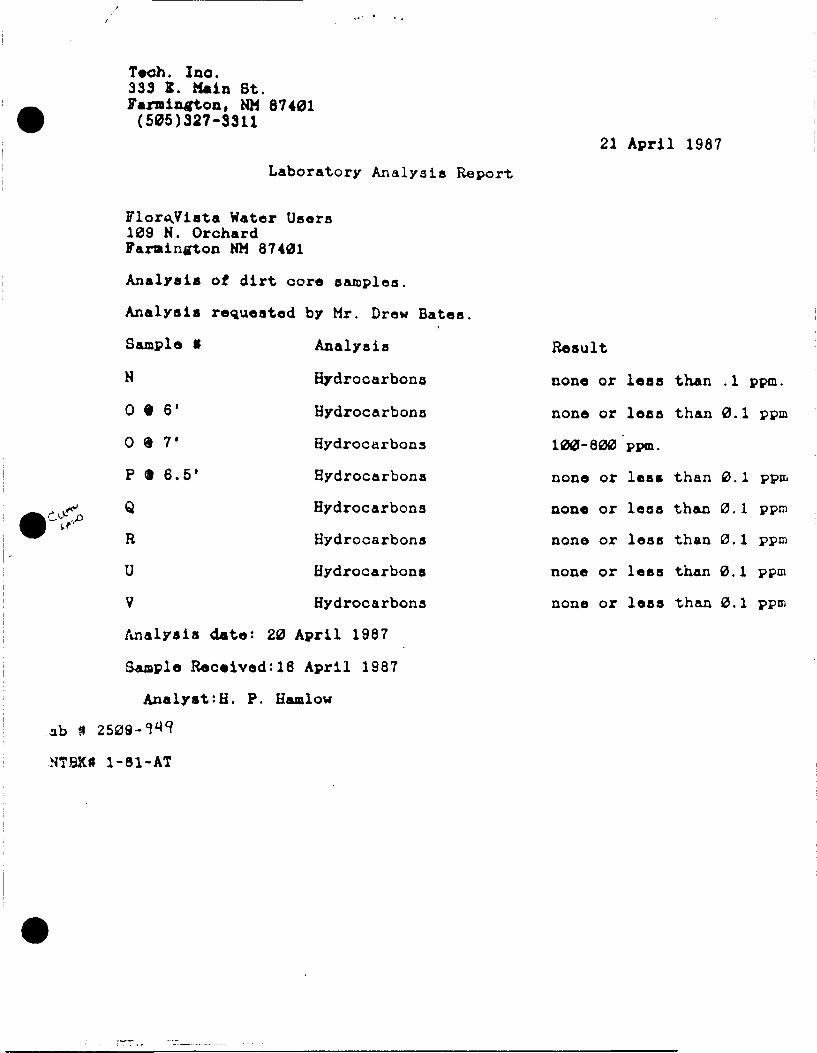
Teoh. Ioo. 333 I . Main St. Farmintfton, NM 87401 (505)327-3311
Laboratory Analysis Report
21 April 1987
Flor^Vista Hater Usora 109 N. Orchard Farmington NM 87401
Analysis of dirt core samples.
Analysis requested by Mr. Drew Bates
Sample ff Analysis Result
N Hydrocarbons none or leas than . 1 ppm.
0 • 6' Hydrocarbons none or less than 0.1 ppm
0 9 1* Hydrocarbons 100-600 ppm.
P <t 6.5' Hydrocarbons none or less than 0.1 ppm
Q Hydrocarbons none or less than 0.1 ppm
R Hydrocarbons none or less than 0.1 ppm
U Hydrocarbons none or less than 0.1 ppm
V Hydrocarbons none or loss than 0.1 ppm
Analysis date: 20 April 1987
Sample Received:16 April 1987
Analyst:H. P. Hamlow
ab ft 2509-W
HTBX* 1-81-AT
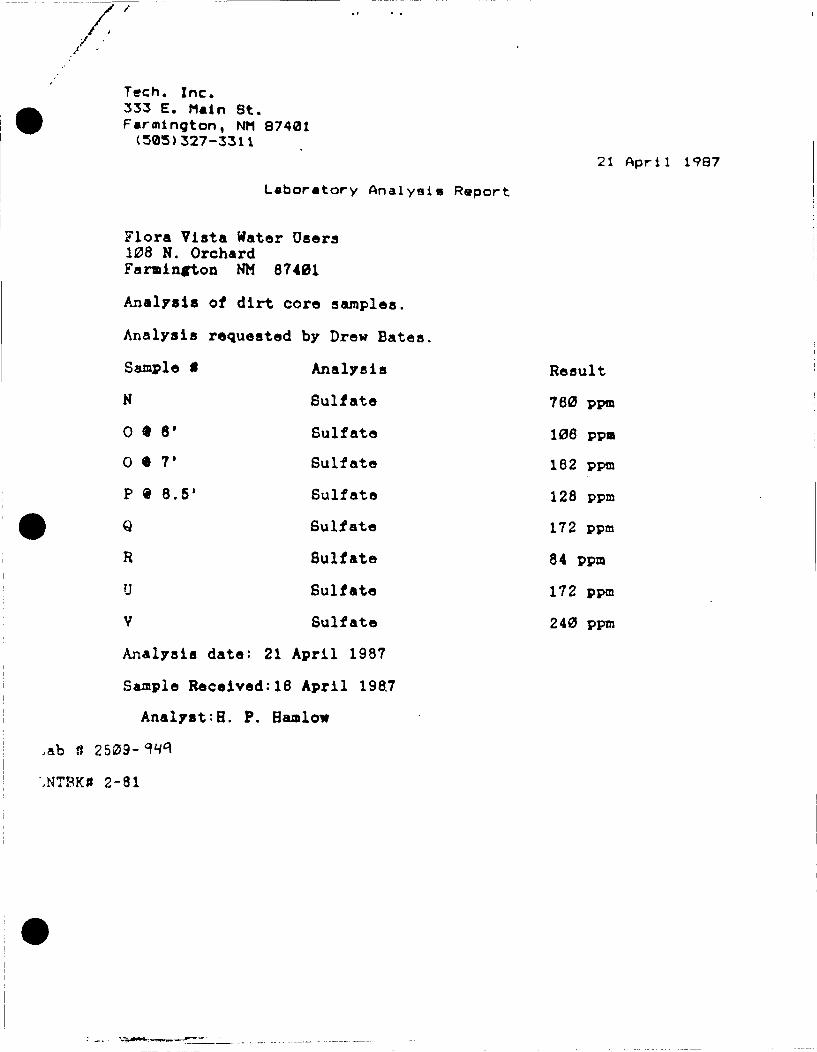
/
Tech. Inc. 333 E. Main St. Farmington, NM 87401 (303)327-3311
21 April 1987
Laboratory Analysis Roport
ora Vista Water Users 108 N. Orchard Farainrton NM 87401
Analysis of dirt core samples.
Analysis requested by Drew Bates.
Sample # Analysis Result
N Sulfate 760 ppm
0 t 6' Sulfate 106 ppm
0 • T Sulfate 182 ppm
P 9 8.5' Sulfate 128 ppm
Q Sulfate 172 ppm
R Sulfate 84 ppm
U Sulfate 172 ppm
V Sulfate 240 ppm
Analysis date: 21 April 1987
Sample Received:16 April 1987
Analyst:H. P. Hamlow
,ab tt 2509-W
,NT8K# 2-81

/-A DIVISION OF CASA DEL SOL, INC. 1474 MAIN AVENUE §131 POST OFFICE BOX 2605 DURANGO, COLORADO 81301
LABORATORIES (303) 247-4220
Date:
To: 8-1-83
Flora Vista Water User Attn. Richard Cheyney 909 V. Apacha Faraington, N.M. 87401
CDS Lab ID #
Sample Description: U.B.WG 73 -53
Sample ID
2456 <3*<-<-~o J7Iv V
2359 v ^' T
24 54 ^ °* ' ' r
2455 S**<T« -5 /= /='• -r
Normal detection Limit 0.01
Analyte
VC22 C6"C22
VC22 C6-C22
24: <t
Analytical results
0.70 mg Total Hydrocarbons
7.50 mg Total Hydrocarbons
8.10 mg Total Hydrocarbons
4.00 mg Total Hydrocarbons
Dr. Joe Bowden T H * LAf tOnATOf lY R * K ) H T MAT NOT M P t « * . l S K . CO CM U S i O f OM A O V t A T & N G OA « C O N K f C ' O ' l WITH * O V ( R I l S * * a 0 » ANV K MC «UMTXJT P f l l C * WMT7CM PtMWSSJON » « O M CDS T O f b t S MVArs AAC W U ON «ACX «r Tut I t M . i M M I A M M C U V E O AT U U K M A T O n r
Director Members of: AM*«JCAM ASSOCIATION ' O t * T V * A O V A M C t U f HT S O £ H C « A U E R I C A N S O O t T Y OF SO.OGJCA4. 0 * i * S T 8 AU l . r t lCAX ^ . I t M ^ C A / f » , l A T O N S O U x j

Slip; : ;•.
" n < / / / . '.y-w

APPENDIX E B l a i r I n v e s t i g a t i o n Report

Jverolo, Hansen & Wolf, PA. COUNSELORS t ATTORNEYS AT LAW
January 20, 1988
Mr. Thomas L. Wright E l Paso N a t u r a l Gas Company P. O. Box 1492 E l Paso, Texas 79978
Mr. David S i d d a l l E l Paso N a t u r a l Gas Company P. 0. Box 1492 E l Paso, Texas 79978
Re: Flora V i s t a v. Manana and EPNG
Dear Tom and David:
I enclose a map and a r e p o r t which r e p o r t e d l y show some trench d i g g i .g which Dr. B l a i r d i d for Brewer & Associates a t the Flora V i s t a s i t e . Brewer & Associates i s Richard Cheney's' company, and he, of course, i s not only a consultant f o r F l o r a V i s t a but also i s a r e s i d e n t i n the area. As you w i l l note, somehow they have been able to draw perimeters and somehow have been able t o separate water s p e c i f i c a l l y enough i n t h e i r studies to come t o a magic boundary for contamination.
I would appreciate your sending these on to Henry Van, Ken Beasley, Greg Kardos and whoever else you f e e l should have them t o get t h e i r thoughts about the study. I think we w i l l send i t on to John Shomaker, i f you approve, t o get h i s thoughts, too. There i s considerable a d d i t i o n a l m a t e r i a l which I presume you w i l l want. We are i n the process of copying i t and w i l l forward i t to you, als o .
Very t r u l y yours.
CIVEROLO, HANSEN & WOLF, P. A.
Wayne C. Wolf
WCW:jj Enclosures
cc: Mr. Adolfo Campos I I P o l i c y No. 46-LLR-G18538E D/Loss: 2/24/83
SOO Murquct lc \ \ V . Suite U O O P.O. Drawer HH7 Albuquerque. NM H710.\ (SOS) H-\ 2 -H2SS T e l e c o p i e r SOS-
K! ( I I A K I ) ( t I V I Kt Ml
(. M.W »V I I A W t \
W A Y . M t . I
U 11 .MAM I' < .H K H IU
K A I I I M K N I ) L t H K k
I H N \ l > I J O N T Z
« . A K l I W l k l S
\ i K M M . W
T U I V ft (.I 'fcMhKT
O ' N T I M A A FKY
IB HM- N K i * AMVIIHI
nu i i < jv iwni t
« C A L E K K M M KH
JI I.l A It V A I I
< U M U N » T I H 11
(AN I M M S
M i • \ \ i 4. t i i %
Ml< If At.I. 11 >M1 I M
A M I " INN { l l ( l l \ t K l
It 1 I It >MA> IIAVX I
MKI < I 1 111* I M I * N » i \
I t U ) V ) A V H 4 .1 t I t V
M V K A t M i II O l M I A I t K
l't.1 I K \ I H IMI \ M I
Hi t i l l Ml | ( I K I h
I I \ \ \ MMI N< l \
I t U W * V < I l - \ 1 \ ^ t \

Date: e/25/67
fcichard Cheney, President Brewer Associates F.O. Box 2079
Farmington, New Mexico 87499
Dear Mr. Cheney, Attached i s my sumr.ary of the Flora Vista contamination
f.tucy conducted on August 16 and 19, 1967. The study, I believe, shows that 1) hydrocarbon contamination of water well Sl came from a hydrocarbon plune located east and north of the water well and 2) the source of contamination stems from an area immediately south of the dehydrator owned by El Paso Natural Gas Coicpany.
I f you have any questions concerning the report please contact roe either at work (303) 247-7263 or at home 247-2703. I found the project to be very i n t e r e s t i n g and f r a n k l y , fun. I f I can be of further service to you please don't hes i t a t e to c a l l .
Sincerely,
Dr. F<. W. B l a i r , Jr. Department" of Geoiogy Fort Lewis College Durango, CO 8130]

FLORA VISTA CONTAMINATION STUDY SUMMARY OF TRENCHING ACTIVITIES
8/IB TO 8/19 1987
by U. W. B l a i r , Jr. consulting geologist
SITUATION
Systematic trenching with a backhoe was commenced on August l e t h and l ^ t h . 1967 between the Flora Vista Water Users Association's water well Sl and Manana O i l and Gas w e l l , Mary Wheeler no. 1-E. Tne objective was to trace and i s o l a t e the source of hydrocarbon contamination to the Sl water w e l l . Present during trenching on the 18th were Ed Hartman, President of Manana Gas, Inc.; David Beyer, hyarologist with New Mexico O i l Conservation "Division; R. W. B l a i r , J r ., consulting geologist representing Brewer Associates; Ray Penroc, representing the Flora Vista Water Users Association and the backhoe operator. Present during trenching on the 19th were Ed Hartman, R. W. B l a i r , J r . , Ray Penrod, Frank Chavez, d i s t r i c t supervisor, N.M. O i l Conservation D i v i s i o n , Ken Beasley and six other El Paso Natural Gas Company employees,and the backhoe operator.
TECHNIQUES AND METHODS
1. Thirteen trenches, seven to eight feet deep were dug i n a l l , s i x (A thru F) on the 18th and seven (G thru M) on the 19th i see attached map). Trench location on the f i r s t cay was determined by David boyer. On the second day Mr. Ed Hartman, anc myself ( B l a i r ) determined trench lo c a t i o n .
2. A l l trenches were documentec as to l o c a t i o n , o r i e n t a t i o n and hydrocarbon contamination.
j. The trenches wtre due i n 5ueh a manner th a t : a) they intersected the exis t i n g water table, b) berms were placec every 6 tc 10 feet at bottom of trench to minimi i t groundwater mixing, - they were generally oriented perpendicular to tne d i r e c t i o n of
giouncwater flow d i r e c t i o n , and d; they were positioned to naximize information concerning loc a t i o n and source o i contaminat i o n .
4. Mr. Ed Hartman with Ry assistance obtained water sample? fron. a l l contaminatec trenches and a few of the uncontan.inatec veneres which are to be analyzed for hydrocarbon.1.. David bryer rook W3ter sampler only from the six trenches excavated on August I T : ' : , . Tries* ai e to br analyzed i or i f 1 c or cani c vol lutar.ts v-urn af t-enzene anc. toluene.
. A map uif. constructed u rir,p 5-t.ar.carc pace am ron.wire tfchr.: cues of the t renrhes , wel 1 £ i t e r , and a s r- o c : a t e z gai

production structures (see attached map).
DISCUSSION
The water and gas well are located upon a point bar deposit (sand and gravel deposited from a meandering r i v e r ) . Two f l a t depositional surfaces are evident (see attached map). Tne lower surface represents the modern f l o o d p l a i n and is found adjacent to the Animas River and the upper surface or terrace (18 to 24 incites higher) i s an older floo d p l a i n . The point bar deposit consists of sand and gravel with cobbles commonly 12 inches i n diameter. The upper 12 to 18 inches of both surfaces consists of a sandy loam s o i l .
Tne water table i s measured i n the trenches at 5 to 6 feet below the upper terrace surface. Uncontaminated water i s s l i g h t l y muady with some natural organic foam or scum present on the surface. Contaminated water displays an iridescent o i l f i l m along with a strong hydrocarbon smeTl. The contaminated zones are recognized i n the gravel deposits from a black stain which coats the sand and robble surfaces and from strong noxious organic odors emanating from the stained horizon. The contaminated zone i s found to coinside with the water table f l u x zone, because the hydrocarbons tend to f l o a t and be carr i e d along at the top of the water table surface. Tnus, only, r a r e l y i s the contamiinated zone found w i t h i n the upper f i v e f e e t . The smelly black organic stain i s noted i n the contaminated trenches and i s marked on the attached aap with cross hatching. Tne contaminated zones vary i n thickness from a few inches to several feet (the thickest zone i s found jus t south of the dehydrator).
In trenches A and C a t h i n discontinuous black stained zone i s noted, but i t i s not associated with any hydrocarbon odor. T.nis zone may have been contaminated curing the producing periods of the water well SI, because the cone of cepression would have captured the contaminated flow documented to the west of the w e l l . Upon cessation of pumrping, Iresh, clean ground water c.-rohably flushed and leached out the v o l a t i l e s , but s t i l l l e f t an JI.soluble organic Mack stain.
As noted irom the map, the contaminated zone appears to be confined to a narrow r>and and i s shaped l i k e a giant comma, trending south. Ground water flow i s to the south, as recorded by David Boyer (I?*':;; tnus, tbe source of hydrocarbon contamina t i o n i s found i n the v i c i n i t y of the dehydrator and s p e c i : i c a l l y iron ar. area iir.mrclat r '.y south of the oer.yciator old cehydrat or :::>. I f l i q u i c r.ya:ocarbon waste war dumped i n t o the gravels r.out:: of the ce.-ivcrator near tne surface anc above t h t wate: :aMe, they wou;c spread l a t e r a l l y a l l d i r e c t i o n s ; cue there; ore, could conceivably contaminate an area . mrvediat*. ly north of the denydrat or as indicated i.n trench 1. One-? th'- waste : ec i n t o the water table i t uc-u: c be carried in the direct ;c<n o: crounu water flow. Tne slig h t westward trend of the centa.*:.in-
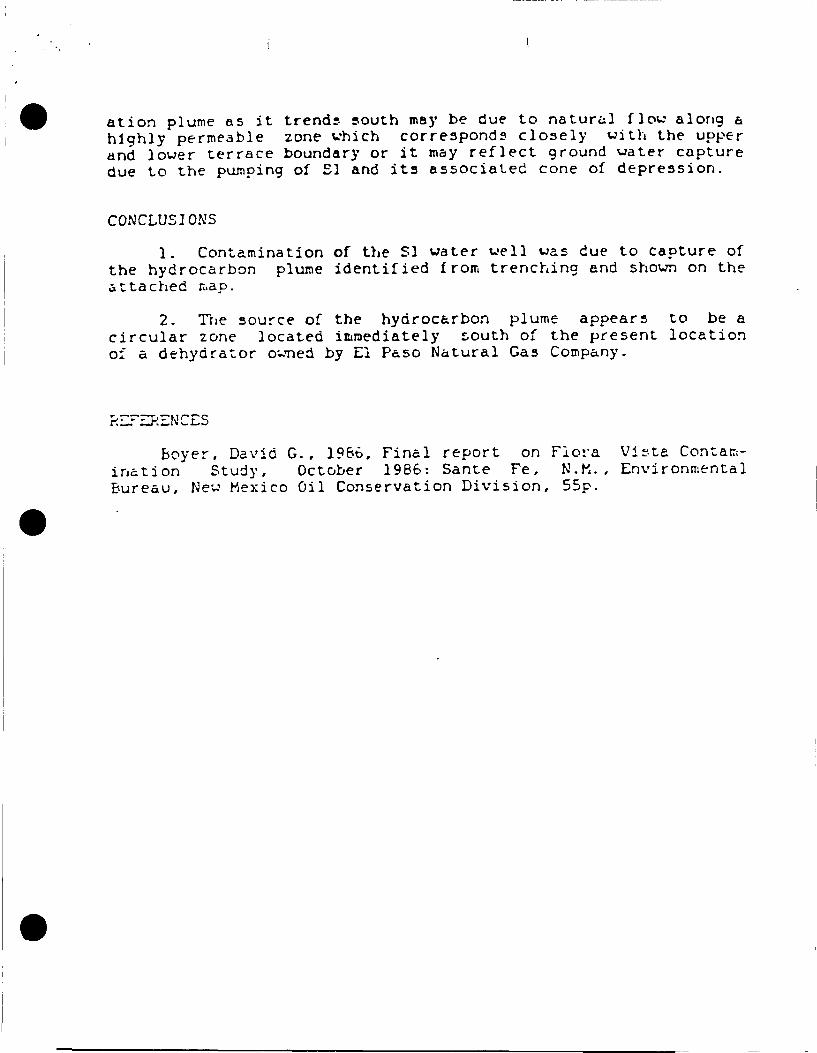
a t i o n plume as i t trends south may be due to natural f l o u along a highly permeable zone which corresponds closely with the upper and lower terrace boundary or i t may r e f l e c t ground water capture due to the pumping of £1 and i t s associated cone of depression.
CONCLUSIONS
1. Contamination of the Sl water well was due to capture of the hydrocarbon plume i d e n t i f i e d from trenching and shown on the attached map.
2. The source of the hydrocarbon plume appears to be a c i r c u l a r zone located immediately south of the present location of a dehydrator owned by El Paso Natural Gas Company.
REFERENCES
Boyer. David G., 1966, Final report on Flora Vista Contami n a t i o n Study, October 1986: Sante Fe, N.M., Environmental bureau, New Mexico Oil Conservation D i v i s i o n , 55p.

•CH M A P O F FLORA. V ISTA
H Y D R O C A R B O N C O M T A M I N A T I O N
map t y : T?. B U I V 8 /22/87
N
3pm C o n t o u r
SO l _
3 0 n '
EXPLANATION
"trewc^ p i t
(flJJ- C onta mi natecL Zone
• Contaw i nation boundary
^ / terrace boundary
Capture Contour <,
Hotet i -
w a V ' l ^ l / * / ? ^ i / modern
"terrace.
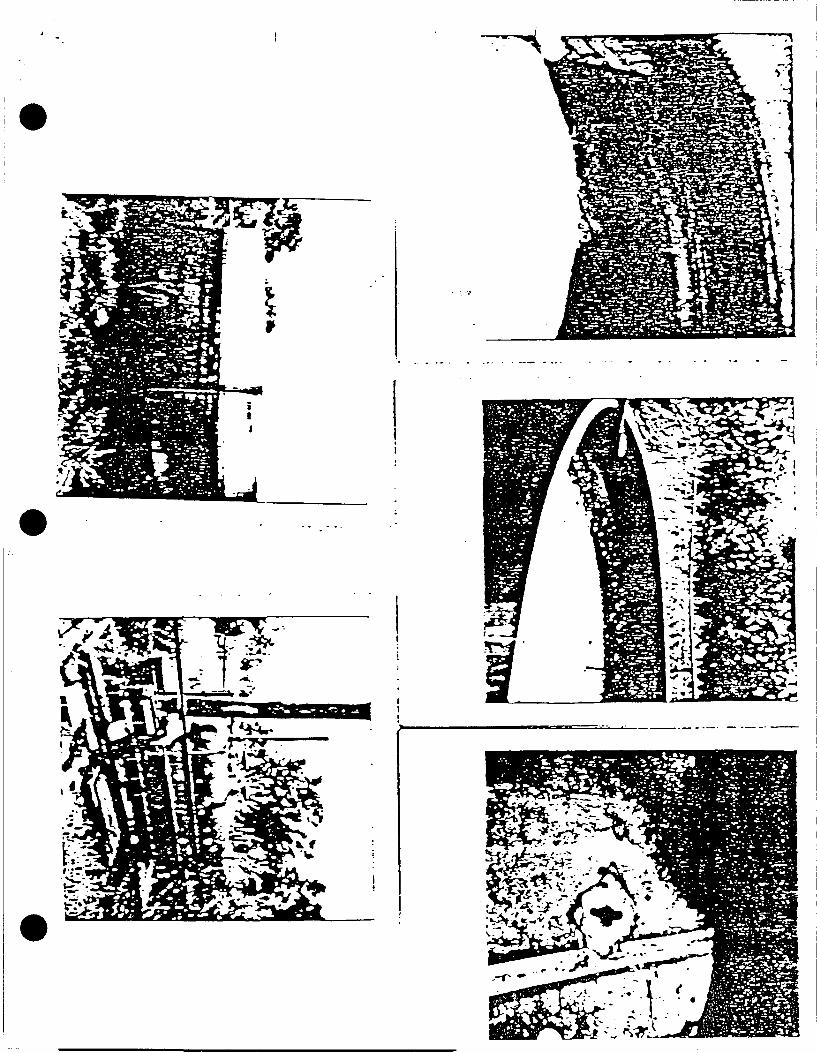

APPENDIX F Photograph Log
PHOTOGRAPH LOG
Photo #1-2 Excavation of trench T - l .
Photo #1-3 Close-up of st a i n e d s o i l noted i n trench T - l .
Photo #1-4 I n s t a l l a t i o n of monitoring w e l l EPNG-1 i n a background l o c a t i o n .
Photo #1-5 S e t t i n g the sand pack (Colorado S i l i c a Sand) i n monitoring w e l l EPNG-1.
Photo #1-6 Checking the placement of the w e l l casing f o r monitoring w e l l EPNG-1.
Photo #1-7 Placing the bentonite p e l l e t s (1/4") i n monitoring w e l l EPNG-1.
Photo #1-8 Completed monitoring w e l l (EPNG-3). P r o t e c t i v e s t e e l casing and 2' x 2' c o n c r e t e pad r e p r e s e n t e d t h e method of competition f o r each EPNG monitoring w e l l .
Photo #1-9 Mixing the bentonite mud used t o d r i l l each of the EPNG monito r i n g w e l l s . Bentonite mud was need t o keep the coarse-grained sediment i n place.
Photo #1-10 S e t t i n g the p r o t e c t i v e c o l l a r at monitoring w e l l EPNG-3. Note the Portland Type I & I I grout which was used as an upper se a l . The form f o r the concrete pad i s i n place.
Photo #1-11 I n s t a l l i n g m onitoring w e l l EPNG-2A near the Mary Wheeler w e l l .
Photo #1-12 Preparing t o j e t out monitoring w e l l EPNG-1 using the a i r compressor on the d r i l l r i g . The compressor was o u t f i t t e d w i t h a dry element t o prevent o i l from blowing past the compressor.
Photo #1-13 J e t t i n g groundwater from EPNG-1. This p o r t i o n of development was f o l l o w e d by pumping numerous gallons of water from the w e l l using a noncontact sample pump.
Photo #1-14 Preparing t o j e t out 0CD-4. This w e l l had s i l t e d i n t o the po i n t where a water l e v e l reading could not be obtained. Following j e t t i n g , water l e v e l s could be taken; however, groundwater samples could not be c o l l e c t e d due t o a bent w e l l casing.
Photo #1-15 B e l l - h o l e excavation i n the area of the reserve p i t . Note the dense dark gray clay i n the bottom of the hole. These sediments appear t o be associated w i t h the c u t t i n g s from the reserve p i t .

Photo #1-16 Be l l - h o l e excavation i n the area of the reserve p i t . The gray m a t e r i a l appeared t o be a combination of c u t t i n g s and bento n i t e from the reserve p i t .
Photo #1-17
Photo #1-18
Photo #1-19
Photo #1-22
Photo #1-23
Photo #1-24
Photo #1-25
Photo #1-26
Photo #1-27
Photo #2-14
Photo #2-15
Photo #2-16
Photo #2-17
Close-up of the gray m a t e r i a l noted i n photo #1-16.
Emmett Hudson, KWB&A, purging water from monitoring w e l l EPNG-1 using a b a i l e r .
F i e l d l ab used t o t e s t groundwater samples f o r pH, EC, and temperature. The black meter i s the pH and compensates f o r temperature. The blue meter was used t o measure EC. The pump, funnel, and side arm f l a s k were used t o f i l t e r samples f o r metal a n a l y s i s .
Groundwater purged from monitoring w e l l EPNG-2A p r i o r t o c o l l e c t i n g a sample. A noncontact Isco sample pump was used along w i t h dedicated sample t u b i n g . A l l of the groundwater samples f o r the EPNG monitoring wells were c o l l e c t e d using the Isco pump. Note the cl e a r appearance of the produced groundwater.
Groundwater purged from monitoring w e l l EPNG-2A p r i o r t o c o l l e c t i n g a sample. A noncontact Isco sample pump was used along w i t h dedicated sample t u b i n g . A l l of the groundwater samples f o r the EPNG monitoring wells were c o l l e c t e d using the Isco pump. Note the cl e a r appearance of the produced groundwater.
An example of a completed EPNG monitoring w e l l (EPNG-4) . Note l o c k i n g cap.
Sid Johnson, KWB&A, purging water from OCD-2 p r i o r t o c o l l e c t i n g a groundwater sample. B a i l e r s were used t o purge and c o l l e c t samples f o r the OCD wells due t o the large amount of coarse-grained sediment present i n the w e l l s .
Sid Johnson, KWB&A, purging water from 0CD-2 p r i o r t o c o l l e c t i n g a groundwater sample. B a i l e r s were used t o purge and c o l l e c t samples f o r the OCD wells due t o the large amount of coarse-grained sediment present i n the w e l l s .
An example of the type of groundwater and the t e x t u r e of the sediments produced from the OCD monitoring w e l l s .
Excavation of trench T - l .
Excavation of trench T - l .
Excavation of trench T - l .
Sidewall p r o f i l e of trench T - l . Depth t o water i n the trench i s on the order of 6 f e e t . Due t o the depth of the trenches and the i n s t a b i l i t y of the s i d e w a l l , s o i l samples were c o l l e c t e d from the backhoe bucket.
Photo #2-18
Photo #2-19
Photo #2-20
Photo #2-21
Photo #2-22
Photo #2-23
Photo #2-24
Photo #2-25
Stained s o i l and rocks removed from trench T-2.
B a c k f i l l i n g the east end of trench T-2.
Stained s o i l and rocks removed from the center p o r t i o n of t r e n c h T-2.
Close-up of m a t e r i a l seen i n Photo #2-20.
Close-up of m a t e r i a l seen i n Photo #2-20.
Excavation of the west end of trench T-2
M a t e r i a l removed from the excavation of trench T-2.
Excavation p i t used t o c o l l e c t a s o i l sample from the west end of trench T-2.
/
S T A T E O F N E W M E X I C O
E N E R G Y AND M I N E R A L S D E P A R T M E N T O I L C O N S E R V A T I O N D I V I S I O N
POST OFFICE BOX 2088
TONEY ANAYA N o v e m b e r 1 7 1 9 R f i STATE LAND OFFICE BUILDING GOVERNOR N o v e m b e r l / , x y b b SANTA FE. NEW MEXICO 875oi-ao88
(505) 827-5800
MEMORANDUM
TO: ADDRESSEES
FROM: DAVID BOYER, HYDROGEOLOGIST, OIL CONSERVATION DIVISION
SUBJECT: CORRECTED PAGE 3, FINAL REPORT ON FLORA VISTA CONTAMINATION STUDY
The enclosed sheet replaces pages 3 and 4 of the above r e p o r t . Page 3 i s corrected to show t h a t a study progress re p o r t was prepared i n January, 1986. Please i n s e r t the corrected page i n your copy of the r e p o r t .
DB: dp
Enc.

PROGRESS REPORT ON FLORA VISTA CONTAMINATION
STUDY JANUARY 1986
A Report to the Flora Vista Water Users Association Flora Vista, New Mexico
Prepared by David G. Boyer Hydrogeologist
Environmental Bureau New Mexico Oil Conservation Division
Paul L. Biderman Secretary, Energy and Minerals Department
R. L. Stamets, Director Oil Conservation Division
50 YEARS
S T A T E O F N E W M E X I C O
E N E R G Y ANO M I N E R A L S D E P A R T M E N T O I L C O N S E R V A T I O N D I V I S I O N
1935 - 1985
TONEY ANAYA G O V E R N O R
P O S T O F F I C E B O X 2088
S T A T E L A N O O F F I C E B U I L D I N G
S A N T A F E . N E W M E X I C O 87501
,505) 827-5800
January 31, 1986
Mr. Bert Barnes, President Flora Vista Water Users
Association P.O. Box 171 Flora Vista, NM 87415
Mr. Richard P. Cheney, Vice President Lawrence A. Brewer &
Associates, Inc. P.O. Box 2079 Farmington, NM 87401
Gentlemen:
The New Mexico Oil Conservation Division (CCD) has completed a report on the a c t i v i t i e s through January, 1986, of this Division and the Environmental Improvement Division (EID) regarding the contamination investigation of Flora Vista Water Well No. 1 (Sl). This well, which was contaminated by o i l and grease i n early 1983, has been out of service since that date. CCD act i v i t i e s in 1985 included installation of five monitoring wells, sampling of water quality from these wells and other ground water at this location, and measurement of water levels to determine ground water direction and rate of flow. EID supplied material and staff to assist i n well installation.
The CCD report i s enclosed with this l e t t e r but i t s major conclusions and recaimendations for further study are summarized below:
1) No verifiable contamination was detected i n 1985 i n either the unused water supply wells or the monitor wells except for low level contamination detected i n samples taken within 24 hours of cleaning the well with an a i r compressor. The latest sampling for which results are available (October 1985) did not detect hydrocarbons either i n the monitor wells or in a composite of the water wells currently supplying the system.
2) Methane at concentrations 1200 times ambient levels was detected i n the monitor well closest to the gas well i n August. The source is l i k e l y the decay of

-2-Letter to Bert Barnes and Richard P. Cheney January 31, 1986
shallow buried organic material. The gas well i t s e l f i s not a l i k e l y source of methane since i t has 227 feet of surface casing cemented back to the surface.
3) Ground water movement i n the v i c i n i t y of the monitor wells i n f a l l 1985 - winter 1986 was towards the river and away from the currently used water supply wells. The flow has a seepage velocity range of 3 to 4 feet per day.
4) Based on the available information, the produced water tank at the Manana Mary Wheeler IE gas well, the gas well i t s e l f , and the dehydrator p i t are a l l l i k e l y to have been within the zone of influence ("cone of depression") of the pumping Sl well at the time the water well was contaminated i n February 1983. Actual pumping rates and pumping cycle information at the time of contamination would better define the extent of pumping well influence.
5) The estimate of travel time for unretarded soluble contaminants to have moved from the v i c i n i t y of the gas well to the pumping water well i s approximately 100 days.
6) The rate of ground water movement i s such that a single plume of c^taininated produced water originating i n the v i c i n i t y of the gas well i n 1983 has now moved beyond the water well.
7) Because of the passage of time, water pumped from well Sl would not show conl^omination unless a zone of residual o i l saturation i s present at or near the produced water tank or other f a c i l i t i e s .
8) To determine the presence and concentrations of any residual o i l between the site of the leaky p i t and well Sl, exploration digging with the backhoe i s recommended, followed by sampling. I f o i l i s found, capture of soluble constituents i s again a possibility and well No. 1 (Sl) may again evidence conl^mination i f pumped continually.
9) The CCD intends to measure water levels and sample water quality of the monitor wells and other available wells through at least the f a l l of 1986.
10) Well S5 should be capped to prevent introduction of contaminants. However, both wells Sl and S5 should have caps that allow for access for periodic water level measurements, water quality sampling, and pumping i f necessary.

-3-Letter to Bert Barnes and Richard P. Cheney January 31, 1986
11) An aquifer test using well Sl as the pumped well should be performed for at least 72 hours at a rate of 60 gpm or at the rate the well would be pumped i f put back i n service. This test would determine accurate aquifer parameters and detect any contaiTLination i n the immediate v i c i n i t y of the well.
12) Since well S5 i s at a distance greater than 500 feet from the gas well and out of the direct path of ground water flow, i t is unlikely that pumping S5 w i l l cause capture of any remaining contaminants from the gas well. To test this assumption, additional flow calculations should be made before placing back i n service.
13) Sampling of individual pumping water supply wells for purgeable aromatic hydrocarbons should be performed on a regular basis. For convenience, a sampling schedule identical to that required for t o t a l trihalomethanes i s i n i t i a l l y suggested.
The CCD would l i k e to schedule a 72-hour aquifer test i n March using well Sl. Since we do not have a pump or a water flow measuring device, any assistance the Association could provide would be appreciated. A flow device could either be a calibrated in-line meter, o r i f i c e weir, or other accurate device. The pump should have a valve to control discharge so that a constant rate is maintained. Also, a pipe or hose w i l l be needed to divert the water away from the monitor wells to prevent recharge. I f these items can be obtained, the test can be performed.
The attached report and the proposed work represent a substantial ccrrmitment of time and e f f o r t by the three-person staff of the CCD Environmental Bureau. I hope that the information we have provided, and that which we w i l l provide over the next eleven months, w i l l be useful in any action you take to resolve the matter.

-4-Letter to Bert Barnes and Pd.ch.ard P. Cheney January 31, 1986
I f you have any questions regarding this l e t t e r or the report, please contact me at 827-5812.
DGB/dp
Enc.
cc: Paul Biderman, Secretary EMD R. L. Stamets, Director CCD NM CCD, Aztec D i s t r i c t Office NM EID Water Supply Section NM EID Ground Water/Hazardous Waste Bureau NM EID, Farmington Field Office
DAVID G. BOYER, ' ' Hydrogeologist Environmental Bureau Chief

PROGRESS REPORT ON
FLORA VISTA CONTAMINATION
STUDY - JANUARY, 1986
Introduction
This report was prepared by the New Mexico Oil Conservation
Division to summarize the work performed to date at the Flora Vista well
f i e l d , to review the results of water quality sampling and.hydrologic
mesurements, to present preliminary conclusions based on this work, and
to make recommendations for future testing. The assistance of the staff
of the Flora Vista Water Users Association, Lawrence A. Brewer &
Associates, and the Environmental Improvement Division i n providing
data, reports, support equipment, and services i s gratefully
aknowledged.
Background
The Flora Vista Water Users Association operates an approved
cannunity water system for the Flora Vista area located approximately
halfway between Farmington and Aztec on U S highway 550. In 1983 the
system served approximately 1500 residents and small businesses through
431 connections. Maximum system delivery, as reported i n New Mexico
Environmental Improvement Division (EID) community water supply system
inspection reports, was reported at 170,000 gallons per day (gpd) with

average delivery i n 1983 of about 100,000 gpd. The system was placed in
service i n 1981 with two wells each with pump capacities of 60-70
gallons per minute (gpm).
In January, 1980, a gas well owned by Manana Gas, Inc. of
Albuquerque was d r i l l e d i n unit M (SW/4 SW/4) of Section 23, Township 30
North, Range 12 West. The well, Mary Wheeler No. 1-E, was placed i n
service i n July, 1980, with the natural gas being received by El Paso
Natural Gas via a pipeline at the site.
Manana f a c i l i t i e s at the site include the well, an oil-water separator,
a fiberglass tank (capacity approximately 120 barrels) holding produced
water and some o i l from the separator, an o i l tank for storing o i l
produced with the gas and a tank drain p i t for discharging water
separated from the o i l (now replaced with a small fiberglass tank). A
reserve (mud pi t ) and a blowdown p i t were both li k e l y present at one
time but have been covered over. The original fiberglass tank was
replaced with a second identical tank in early 1983 due to discovery of
a leak. El Paso Natural Gas f a c i l i t i e s include a gas dehydrator, a
dehydrator p i t with a 55 gallon drum serving as a collector, and a gas
meter house.
The entire site occupies an area of approximately 220 x 75 feet and
is located northeast of water supply well Sl. Distances from the water
well to the fiberglass produced water tank, gas well, and dehydrator p i t
are 235 feet, 255 feet, and 285 feet, respectively. Figure 1 shows the
relationship of the various o i l and gas f a c i l i t i e s to the water wells.

In 1982, OCD records show production of 39,584 million cubic feet
of natural gas and 1022 barrels of o i l . Water production is estimated
by the company (1985) at approximately 210 gallons per day or about 76.6
thousand gallons per year. A l l produced water collected is removed from
the site.
In February, 1983, at least one well, Sl, became contaminated with
o i l and grease and was taken out of service. The level of contamination
was reported i n Association records as 16 mg/l. To avoid further
contairdnation, the system was shut down and water was purchased from the
City of Aztec and delivered via an existing pipeline. At that time, the
Association dug a p i t between Sl and the gas well and detected a
noticeable odor and an o i l y film. Between February and August, 1983,
additional backhoe pits were dug and sampled for o i l and grease. In
August, the OCD sampled the water well Sl, the Manana separator, the El
Paso dehydrator, and a previously dug p i t . Oil and grease levels
reported ranged from 32 to 38 mg/l except for the dehydrator which was
not reported. However, the dehydrator was reported to have 13 mg/l of
both benzene and toluene.
In the summer of 1984, the EID attempted to d r i l l monitoring wells
i n the area for the purposes of determining the contamination sources
and the risk to the other supply wells. However, the hollow-stem auger
d r i l l r i g was not able to penetrate the large boulders i n the shallow
subsurface and the attempt was discontinued.
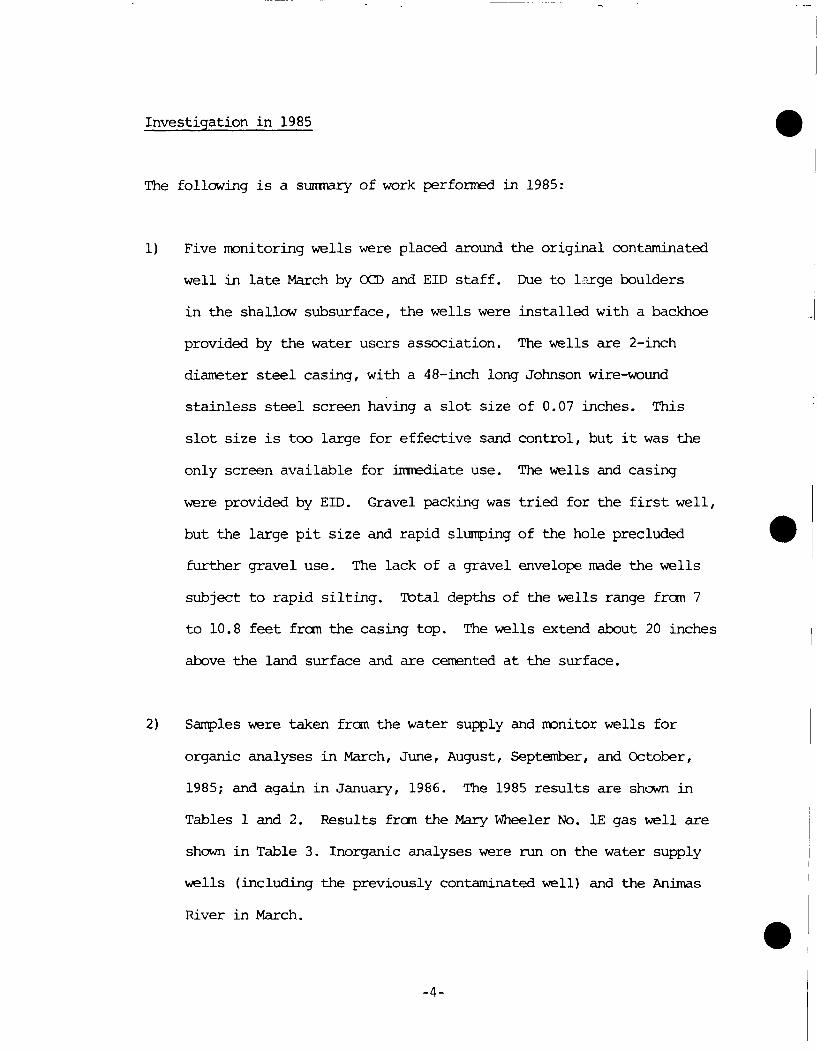
Investigation i n 1985
The following is a summary of work performed in 1985:
1) Five monitoring wells were placed around the original contaminated
well in late March by OCD and EID staff. Due to large boulders
in the shallow subsurface, the wells were installed with a backhoe
provided by the water users association. The wells are 2-inch
diameter steel casing, with a 48-inch long Johnson wire-wound
stainless steel screen having a slot size of 0.07 inches. This
slot size i s too large for effective sand control, but i t was the
only screen available for immediate use. The wells and casing
were provided by EID. Gravel packing was tr i e d for the f i r s t well,
but the large p i t size and rapid slumping of the hole precluded
further gravel use. The lack of a gravel envelope made the wells
subject to rapid s i l t i n g . Total depths of the wells range from 7
to 10.8 feet from the casing top. The wells extend about 20 inches
above the land surface and are cemented at the surface.
2) Samples were taken from the water supply and monitor wells for
organic analyses i n March, June, August, September, and October,
1985; and again i n January, 1986. The 1985 results are shown in
Tables 1 and 2. Results from the Mary Wheeler No. IE gas well are
shown i n Table 3. Inorganic analyses were run on the water supply
wells (including the previously contaminated well) and the Animas
River i n March.
-4-

3) As expected, several monitor wells f i l l e d with sand and were
cleaned twice using compressed air from two different compressors.
The use of these compressors apparently affected the water quality
as discussed below.
4) In September a l l monitor and supply wells were surveyed by Brewer
and Associates for both location and elevation. Several well
elevations were resurveyed in October. Blueprints from recent
aerial photos were received i n late December. Water levels were
measured i n September and October 1985, and January, 1986. This
information allows ground water elevations to be directly compared,
and estabishes the hydraulic gradient, direction of ground water
flow, and flow velocity. These calculations and the resultant
conclusions and interpretations are presented below.
Hydrogeology
The valley of the Animas River contains alluvium consisting mainly of
sand and gravel which is outwash material from Pleistocene glaciers in
the San Juan Mountains i n Colorado. In the v i c i n i t y of the Flora Vista
wells this alluvium i s about 25 feet thick. Examination of the aerial
photograph blueprints provided by Brewer & Associates shows old river
channels and meanders i n the flood plain. Finer grained s i l t s and clays
can be expected to have been deposited i n low velocity areas such as
point bars and areas of overbank flooding. However, the area where the

monitor wells were d r i l l e d was found to be a zone of very coarse sand
and gravel with some rocks exceeding a foot in diameter.
The presence of a coarse sand and gravel zone usually indicates high
ground water permeability. Examination of the pumping level estimates
provided in the 1982 EID community water system environmental survey,
together with a 1982 Brewer and Associates i n f i l t r a t i o n gallery
f e a s i b i l i t y study shows an aquifer permeability of about 750 gallons per
day per square foot, or 100 feet per day. This value is at the lower
end of the range for clean sand and gravel mixtures, but s t i l l allows
for rapid ground water movement.
In September and October, 1985, ground water levels were measured i n
those monitoring wells where f l u i d levels were present. The results
were used to calculate the direction of ground water flow and the
hydraulic gradient. The gradient values were 0.0080 and 0.0105,
respectively, or about 42 and 55 feet per mile. These values are
intermediate between the average river gradient at Flora Vista of 0.004
and the topographic gradient of 0.014 perpendicular to the river at the
well f i e l d location. The January, 1986, water levels, measured after
hand-augering sand out of holes, showed a gradient of 0.0097, or about
51 feet per mile.
The ground water flow directions in September and October are shown on
Figures 1 and 2. The direction on September 20 is slightly east of
-6-

south. On October 25 the direction had changed to nearly 25 east of
south. The January 17 direction (Figure 3) is intermediate between
the autumn directions. As shown in the figures, the direction of ground
water flow on a l l sampling dates was towards the river. In the f a l l and
early winter of 1985, ground water flow in the v i c i n i t y of the Manana
Mary Wheeler IE Well moves in the direction of the river and not towards
any of the water supply wells or monitor wells.
Based on these water level measurements and some assumptions about
surface and ground water interaction i n the area, Figure 4 showing
estimated fall-winter ground water flow directions was prepared. The
assumptions used are:
1) Paver flows are generally low in f a l l and winter
months;
2) Water stored i n the permeable all u v i a l material i n the
immediate v i c i n i t y of the river during times of spring
and summer high flows is discharged back into the river
at low flow;
-7-
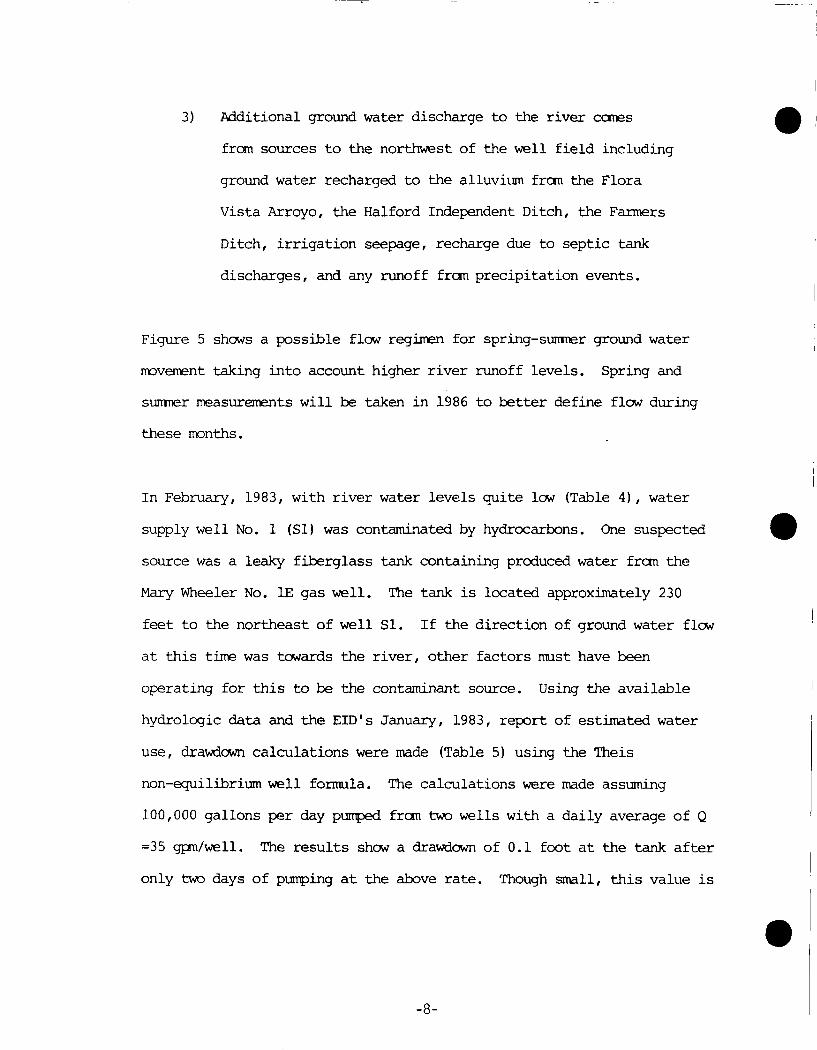
3) Additional ground water discharge to the river comes
from sources to the northwest of the well f i e l d including
ground water recharged to the alluvium from the Flora
Vista Arroyo, the Halford Independent Ditch, the Farmers
Ditch, i r r i g a t i o n seepage, recharge due to septic tank
discharges, and any runoff from precipitation events.
Figure 5 shows a possible flow regimen for spring-summer ground water
movement taking into account higher river runoff levels. Spring and
summer measurements w i l l be taken i n 1986 to better define flow during
these months.
In February, 1983, with river water levels quite low (Table 4), water
supply well No. 1 (Sl) was contaminated by hydrocarbons. One suspected
source was a leaky fiberglass tank containing produced water from the
Mary Wheeler No. IE gas well. The tank is located approximately 230
feet to the northeast of well Sl. I f the direction of ground water flow
at this time was towards the river, other factors must have been
operating for this to be the contaminant source. Using the available
hydrologic data and the EID's January, 1983, report of estimated water
use, drawdown calculations were made (Table 5) using the Theis
non-equilibrium well formula. The calculations were made assuming
100,000 gallons per day pumped from two wells with a daily average of Q
=35 gpm/well. The results show a drawdown of 0.1 foot at the tank after
only two days of pumping at the above rate. Though small, this value is

enough to cause movement of water towards the well. After 100 days of
pumping, the calculated drawdown is 1.1 feet at the tank location.
Since this well (Sl) is only 250 feet from the river, i t is reasonable
to expect that river water i s recharging a portion of the water removed
from the aquifer by the well. However, calculations assuming steady
state flow show that the zone of capture only extends 63 feet down
gradient for an average daily pumping rate of 35 gpm. This is because
more water up gradient is captured, and the resultant asymmetrical cone
of depression (zone of influence) does not extend as far down gradient
i n the direction of the flow (Figure 6). Since the well was reported to
have pumped at a maximum of 60 to 70 gpm, a down gradient capture
distance of 117 feet was calculated for Q = 65 gpm.
Because the pump was cycled on and o f f , the stress on the aquifer would
fluctuate. I f the pump was on more than 50% of the time, the parab ..:
envelope shown i n Figure 6 would approach that of the Q = 65 gpm curve.
These capture curves were drawn assuming the flow direction i n early
1983 was the same as January 1986; other variables that could change
curve shape include non-homogenuous sediments, variations i n
permeability, non-equilibrium (vs. steady-state) flow, and the pumping
cycles.
I f there is a drawdown of water under the produced water tank due to
well Sl, this would allow capture by the well of water under the tank.
Calculations for a drawdown of 1.1 feet after 100 days of pumping
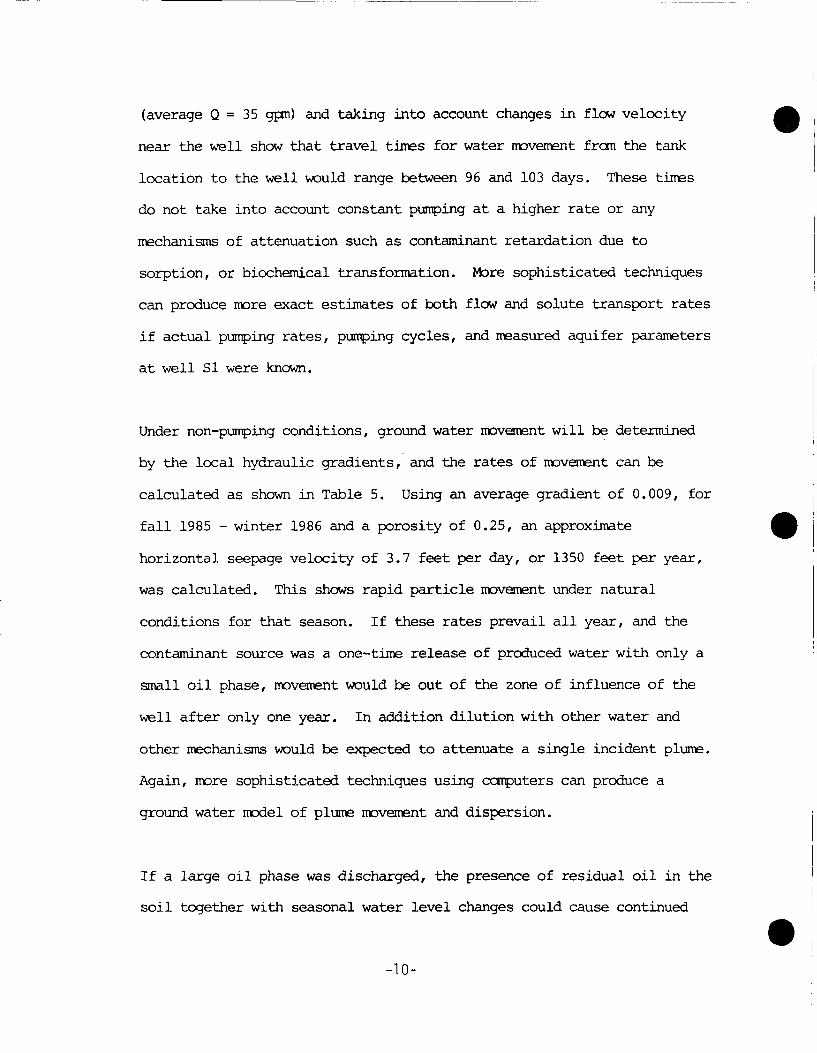
(average Q = 35 gpm) and taking into account changes in flow velocity
near the well show that travel times for water movement from the tank
location to the well would range between 96 and 103 days. These times
do not take into account constant pumping at a higher rate or any
mechanisms of attenuation such as contaminant retardation due to
sorption, or biochemical transformation. More sophisticated techniques
can produce more exact estimates of both flow and solute transport rates
i f actual pumping rates, pumping cycles, and measured aquifer parameters
at well Sl were known.
Under non-pumping conditions, ground water movement w i l l be deterndned
by the local hydraulic gradients, and the rates of movement can be
calculated as shown in Table 5. Using an average gradient of 0.009, for
f a l l 1985 - winter 1986 and a porosity of 0.25, an approximate
horizontal seepage velocity of 3.7 feet per day, or 1350 feet per year,
was calculated. This shows rapid particle movement under natural
conditions for that season. I f these rates prevail a l l year, and the
contaminant source was a one-time release of produced water with only a
small o i l phase, movement would be out of the zone of influence of the
well after only one year. In addition dilution with other water and
other mechanisms would be expected to attenuate a single incident plume.
Again, more sophisticated techniques using computers can produce a
ground water model of plume movement and dispersion.
I f a large o i l phase was discharged, the presence of residual o i l i n the
s o i l together with seasonal water level changes could cause continued

leaching of soluble o i l constituents into ground water. I f present,
these contaminants could again reach the well i f i t was put back into
service.
Water Quality
The inorganic chemistry analyses of the water supply wells sampled show
generally very good water quality. For three samples from two wells and
a composite of two others, t o t a l dissolved solids average 403 mg/l,
chlorides average 17 mg/l and sulfates average 189 mg/l. A sample of
Animas River water had concentrations of 368 mg/l, 12.5 mg/l and 116.3
mg/l for the same constituents. Only manganese with an average of 0.37
mg/l i s elevated above acceptable levels. Manganese is naturally
occurring i n salt and minerals and the New Mexico Ground Water Standard
is 0.2 mg/l. The effects of slightly elevated levels are generally
limited to unpleasant taste and plumbing fixture staining.
A sampling program for organic chemicals in the affected water supply
wells, monitor wells, and operating supply wells was begun by the OCD i n
March, 1985. Subsequent testing was performed i n June, August,
September, and October; and January, 1986. The results (except for the
most recent sampling) are shown in Tables 1 to 3.
The wells were sampled for aromatic hydrocarbons which have been found
to be present i n water and fluids produced concurrently with o i l and
gas. Once dissolved i n water, these contaminants migrate with the
-11-

ground water i n the subsurface. At a point of use, such as a well, the
hydrocarbons can be present i n the water even though a separate o i l
phase may not be detected. Samples for aromatic hydrocarbon testing
require only a small 40 ml volume of water, and no special treatment or
preservation except c h i l l i n g needs to be performed prior to analysis.
In addition to aromatic hydrocarbons, tests for methane gas and
halogenated hydrocarbons can be performed on the same sample. Prior to
sampling, the monitor wells were "purged" by use of a clean bailer to
obtain fresh samples.
Results for three samplings of the water supply well originally shut
down (Sl) show a small amount (6 ppb) of toluene detected i n the June
sampling. The newly adopted New Mexico Ground Water Standard i s 750
ppb, down from 15,000 ppb. The compound was detected only once and a
sampling error cannot be ruled out. The well, which had remained open
since the pump was removed, now has a plate welded over the top and is
inaccessible for sampling.
Benzene, a known human carcinogen, was not detected i n well Sl or in any
other well i n any sampling. Also, no separate o i l phase was found i n
any of the wells during any of the samplings.
Sampling of the other unused well (S5) detected no contamination u n t i l
September when i t was pumped by introduction of air to displace several
well volumes to acquire a "fresh" sample. Samples taken that day and
the following day from S5 had low levels of toluene and several other

aromatic hydrocarbons. These levels were many times lower than either
New Mexico or newly proposed EPA recommended levels.
After examination of these and other September results showing low
levels of contamination, the a i r compressor was tested and found to have
lubrication or combustion pollutants i n the air line. The ai r line i s
thought to be the major source for the pollutants detected i n wells S5,
Ml, M2, M3, and M5 for the September sampling . However, well M4, which
could not be reached by the air line i n September, also showed a slight,
but detectable level of toluene. Well S5 was resampled i n October and
trace levels less than 1 ppb were found for several aromatic
hydrocarbons, not including benzene. Well M4 was dry at the time of the
October sampling and no hydrocarbons were detected i n the other wells.
Three samples representing a composite of the pumping wells were taken
from the pump house tap i n March, August, and October, 1985, and
January, 1986. No contaminants were detected except for a very small
volume of chloroform. Chloroform might have been present as a result of
chlorination which occurs immediately adjacent to, but downpipe from the
pump house tap.
In March, 1985, water samples were taken from the backhoe-dug pits prior
to monitor well installation. An o i l y sheen appeared on the water i n
the p i t s . Examination of the backhoe bucket determined that hydraulic
f l u i d was leaking from either a f i t t i n g or a cylinder and dripping into
the p i t . Samples of the p i t water taken that day showed no

contamination. Later, a sample of water mixed with hydraulic f l u i d
showed a dissolved toluene concentration of 1700 ppb i n the water.
Sampling of the monitor wells was complicated by fine sand that entered
the well as a result of the large screen size and lack of a gravel pack.
Also, water levels i n the monitor wells dropped between 4.6 and 7.6
inches from September to October. Wells Ml, M2, and M4 were dry for one
or more of the samplings.
On June 27, cleaning of a l l monitor wells was attempted using a small
air compressor lik e that used for spray painting. Sampling done the
following day detected low or trace levels of hydrocarbons i n three of
the five wells. At that time the use of a i r from a compressor to clean
out shallow monitoring wells was thought by both CCD and EID to be a
practical solution. Although EID had used this small compressor
previously and not detected contamination, i t s air line was never tested
for hydrocarbons, and the compressor i s no longer available for testing.
Therefore, the small compressor as a source for those contaminants
detected i n the June sampling cannot be ruled out.
As previously mentioned, the compressor used in September to pump well
S5 and to clean the monitor wells was known to have introduced low
levels of TOntaminants. Therefore, i t cannot be determined whether
hydrocarbons were in the wells i n September prior to the introduction of
air . For the August and October samplings, no contamination was
detected in any of the monitor wells having water. Since the range of

seepage velocities was from 3 to 4 feet per day, low level contamination
from the compressors would have been diluted and quickly moved beyond
the capture radius of the monitor wells.
Prior to the January, 1986 sampling, a l l monitor wells were cleaned by
use of a homemade PVC hand auger that effectively removed a l l but a
small volume of sand. January test results are not yet available.
Tests for dissolved methane gas were made on samples collected on
several dates. Monitor wells 3 and 5 had elevated levels of the gas in
August but not i n October. M5, the monitor well nearest the gas well,
had the largest volume of gas and also was located i n an area where dark
black s o i l was present. Soil sampling did not show o i l present at
detectable levels. The source of the gas may be natural material since
the area is swampy, or i t may be from shallow buried organic material
deposited i n the reserve p i t during d r i l l i n g and/or testing. Produced
water containing small amounts of o i l previously discharged from the
leaky tank may also be the source. The gas well i t s e l f is not suspected
because the surface casing extends to a depth of 227 feet and is
cemented back to the surface.
Produced water from the Manana Oil Mary Wheeler IE gas well was
collected from the fiberglass tank at the separator i n September and
October. Benzene values were 8,700 and 16,000 ppb and other aromatic
hydrocarbons exceeded 1,000 ppb except for ethylbenzene. Total

dissolved solids exceeded 34,000 mg/l (ppm) with chlorides about 20,000
mg/l.
In summary, the March, August, and October 1985 samplings detected no
dissolved aromatic hydrocarbons i n the monitor wells. With one
exception, when such hydrocarbons were detected in the June and
September samplings, a i r compressors had been used to clean the wells
the previous day. Well M4, cleaned with a compressor i n June but not in
September, contained a very low level of toluene close to the detection
l i m i t at the time of the September sampling. This well was dry for the
August and October samplings.
Conclusions
1) No verifiable contamination was detected i n 1985 i n either
the unused water supply wells or the monitor wells except for
low level contamination detected in samples taken within
24 hours of cleaning with an air compressor.
2) In wells Sl and M4 low levels of toluene near detection limits
were found i n one sampling, but the possibility of a sampling
error cannot be ruled out.
3) The latest sampling for which results are available (October 1985),
detected no hydrocarbons either i n the monitor wells or in a
composite of the water wells currently supplying the system.
4) Methane at concentrations 1200 times ambient levels was detected
in the monitor well closest to the gas well in August. The
source is l i k e l y the decay of shallow buried organic material. I t
may be from natural material, from gas well d r i l l i n g and testing
fluids, or from the leaked produced water. The gas well i t s e l f
is not lik e l y the source of methane since i t has 227 feet of
surface casing cemented back to the surface.
5) Ground water movement i n the v i c i n i t y of the monitor wells i n
f a l l 1985 - winter 1986 was towards the river with a seepage
velocity range of 3 to 4 feet per day. Ground water flow at this
location is away from the currently used water supply wells.
6) Based on the available information, the produced water tank at the
Manana Mary Wheeler IE gas well, the gas well i t s e l f , and the
dehydrator p i t are a l l l i k e l y to have been within the zone of
influence ("cone of depression") of the pumping Sl well at the time
the water well was contaminated i n February 1983. Actual pumping
rates and pumping cycle information at the time of contamination
would better define the extent of pumping well influence.
7) The distance between the water well Sl and the closest p i t or
tank at the gas well i s 230 feet. The estimate of travel time for
unretarded soluble contaminants to have moved that distance and
reach the pumping water well i s from 96 to 103 days.
-17-

8) The rate of ground water movement is such that a single plume
of contaminated produced water originating in the v i c i n i t y of
the gas well i n 1983 has moved past the water well (Sl). The
current location and disposition of a plume is unknown because
of the uncertainty of seasonal hydrologic conditions between the
well f i e l d and river.
9) Because of the passage of time, water pumped from well Sl would
not show contamination unless a zone of residual o i l saturation
is present at or near the produced water tank or other f a c i l i t i e s .
Extended pumping at 60 to 70 gpm i n excess of 55 days would be
required to detect by pumping any remaining o i l present, since i t
would take at least that long for soluble constituents to travel
230 feet. Exploratory digging would also detect the zone, and i t
would define the extent of such a zone.
10) I f residual o i l i s present, some soluble constituents w i l l dissolve
into ground water due to water level fluctuations and migrate
towards the pumping well. These constituents are most l i k e l y to be
purgeable aromatic hydrocarbons (i.e. benzenes, toluene, and
xylenes). Whether these contaminants would actually reach the
well, and what their concentrations would be, cannot be determined
with the present information.
-18-
^commendations and Proposed Future Work
1) To better define the hydrologic regimen at the site, the OCD
intends to measure water levels and sample water quality of the
monitor wells and other available wells through at least the f a l l
of 1986. Spring-summer measurements, especially, w i l l provide
ground water movement data not yet available.
2) Well S5 should be capped to prevent introduction of contaminants.
However both wells Sl and S5 should have caps that allow for access
for periodic water level measurements, and pumping i f necessary.
3) An aquifer test using well Sl as the pumped well should be
performed for at least 72 hours at a rate of 60 gpm or at the
rate the well would be pumped i f put back i n service. This
test would deteriruLne accurate aquifer parameters and detect any
contamination i n the immediate v i c i n i t y of the well.
4) Since well S5 is at a distance of greater than 500 feet from the gas
well and out of the direct path of ground water flow, i t i s unlikely
that pumping S5 w i l l cause capture of any remaining contaminants
from the gas well location. To test this assumption, some
additional ground water flow calculations should be performed using
actual aquifer parameter data before placing S5 back in service.
5) To determine the presence and concentrations of any residual
-19-
o i l (or any remaining free o i l ) between the gas well site and well
Sl, exploration digging with the backhoe is recommended, followed by
immediate, witnessed sampling for purgeable and extractable
hydrocarbons. The backhoe bucket should be cleaned prior to each use
and a l l hydraulic lines should be checked for integrity. I f
residual o i l is found, capture of soluble constituents is again a
possibility and well No. 1 (Sl) may again evidence contamination
i f pumped continually.
Sampling of individual pumping water supply wells for purgeable
aromatic hydrocarbons should be performed on a regular.basis. For
convenience, a sampling schedule identical to that required for
to t a l trihalomethanes is i n i t i a l l y suggested.
-20-

REPORT FIGURES

-A' OA
SZ 03 a> o.
-r- V "O TJ S-
—- LO cr? ~o W O O D S
- "O -M - — O 03
C \ j >
LU CTl OJ CJ O h - oo r -H < 2 X i <T3 "-^ 2 O O O
• if*-*?
• rv^..p^-;- • ' f f . -i. ^*%^^-^V^ '*^Q#:.:V' '0: i %


— 3>; WW
3£
4 : ^
:% : r---; - * •
Vtf& I— O CO CD "O 1 / 1 Z O D D i—i TD \ "O •*-> > O I— O) <o
a : r— > i — <C CD \ S_ =! a : i— ai o O Q i — _ J z : -z. -Q K> LL. c£ o o o
1SS1 3B
CD
si" ?• v.: :-**: • v ••->»
- v.. 'r*.' •.. •• , • '. ., -A r»- - ' • v- ••.•!»• v
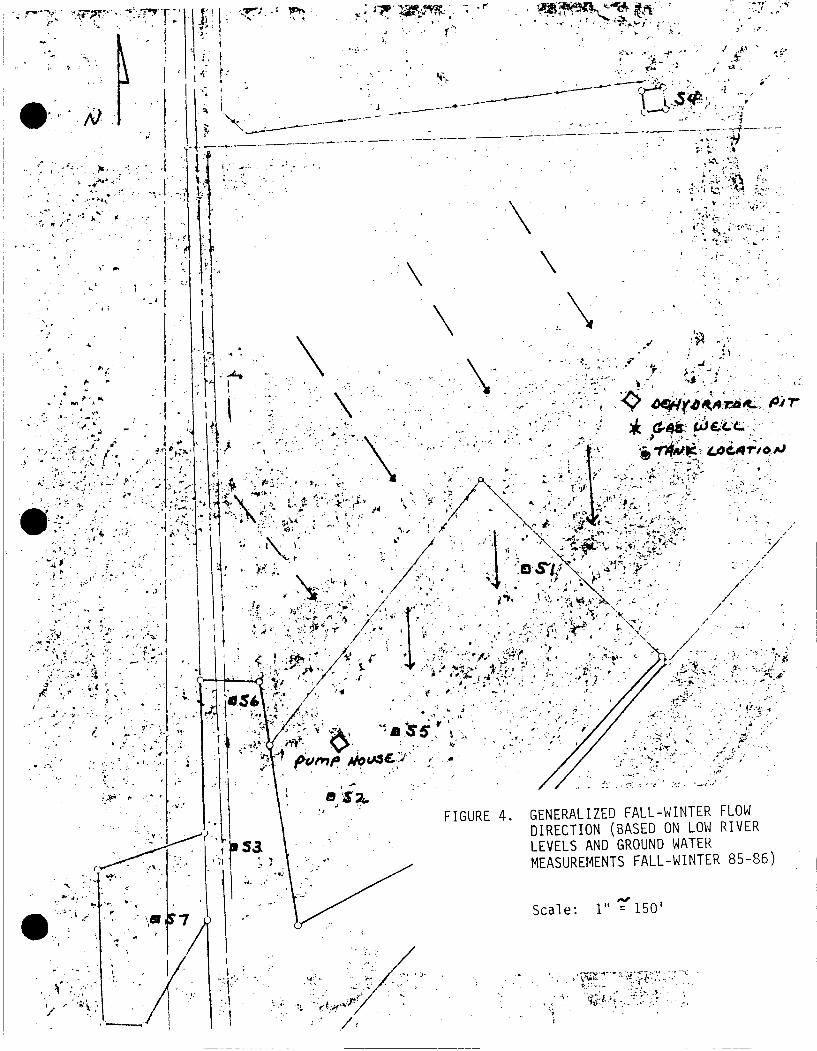
•a' • •'
7 pump /fava&O
.' ft-:
FIGURE 4. GENERALIZED FALL-WINTER FLOW DIRECTION (BASED ON LOW RIVER LEVELS AND GROUND WATER MEASUREMENTS FALL-WINTER 85-86)
Scale: 1" = 150'
/ /<

O
.(HI. '. ,•
* • - -FIGURE 5. ESTIMATED SPRING-SUMMER
GROUND WATER FLOW DIRECTION (BASED ON ASSUMED RIVER RECHARGE DURING HIGH WATER LEVELS. MEASUREMENTS TO BE MADE SPRING-SUMMER 1986).
SCALE: 1" ?150


REPORT TABLES
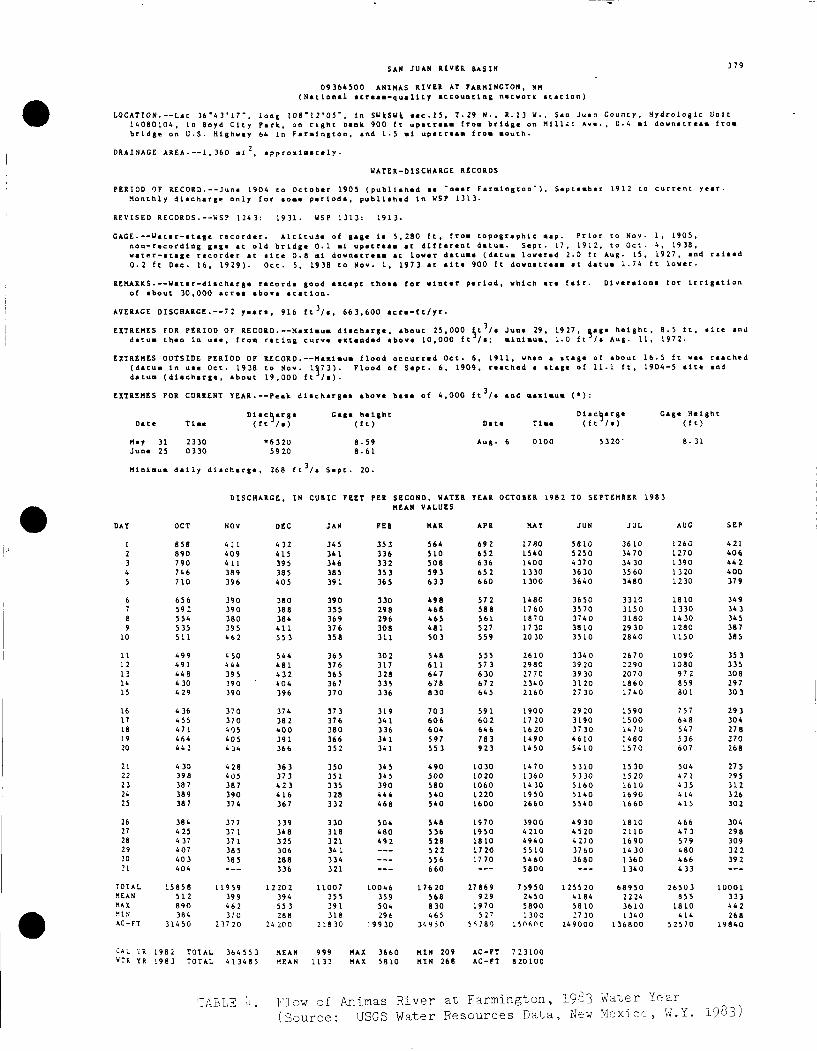
SAN JUAN RIVER BASIN 3 7 9
09364500 ANIMAS RIVER AT FARMINGTON, NM ( N a t i o n a l • t r e e a - q u a 1 1 t y a c c o u n t i n g n e t w o r k s t a c l o n )
LOCATION.—Lac 36"4 3'17". l o n g 108"12'05'. l n SWkSWt aae.15. T.29 N., R.13 W., San Juan Councy, H y d r o l o g i c Unic 14080 L04, l n Boyd C i t y P a r k , on r i g h t bank 900 f t u p e t r e a a I r o n b r l d g a on M11W: Av«.. 0.4 a l do w n e t r e e a f r o m b r i d g e on U.S. Highway 64 i n F a r a l n g t o n , and 1-5 a i u p a t r a a a f r o a a o u t h .
DRAINAGE AREA.—1 , 360 a l 2 , a p p r o i l a a c a 1y.
WATER-DISCHARGE RECORDS
PERIOD OF RECORD.—Juna 1904 co Oc t o b e r 1905 ( p u b l l a h e d aa "near F a r a l n g t o n " ) , Sapteaber 1912 Co c u r r e n t y e a r . M o n t h l y d l a c h a r g e o n l y f o r aoae p e r l o d a , p u b l l a h e d l n WSP 1313.
REVISED RECORDS.—WSP 1243: 1931. WSP 1313: 1913.
GAGE.—Wecer-atage r e c o r d e r . A l t i t u d e of gage l a 5,280 f c , f r o a t o p o g r a p h i c aap. P r i o r t o Nov. 1, 1905, n o n - r e c o r d i n g gage a t o l d b r i d g e 0.1 a l u p a t r a a a a t d i f f e r e n t d a t u a . Sept. 17, 1912, t o O c t . 4, 1938, w a t e r - a c e g e r e c o r d e r a t a l t e 0.8 a l do w n a t r e e a a t l o w e r d a t u a a ( d a t u a l o w e r e d 2.0 fc Aug. 15, 1927, end r a i a a d 0.2 f t Dec. 16, 1 9 2 9 ) . O c t. 5, 1938 t o Nov. 1 , 1973 a t a l t e 900 f t downatraaa a t d a t u a 1.74 f t l o w e r .
REMARKS W a t e r - d l a c h a r g e r a c o r d a good e x c e p t thoae f o r w i n t e r p e r i o d , which ara f a i r . D l v e r e l o n a f o r I r r i g a t i o n
of about 30,000 a c r e a above a t a t l o n .
ERAGE 0ISCHARGE.--7 2 y e a r a , 916 f t 3 / a ,
EXTREMES FOR PERIOD OF RECORD Maxlaua d l a c h a r g e , about 25 , 000 U 3 / a June 29 , 19 27, gage h e i g h t , 8.5 f t , a l e e and
d a t u a t h e n l n uee, f r o a r a t i n g c u r v e e x t e n d e d above 10,000 f t /a; a l n l a u a , 1.0 fc /a Aug. 11, 1972. EXTREMES OUTSIDE PERIOD OF RECORD•—Maxlaua f l o o d o c c u r r e d O c t . 6, 1911, when a atage of about 16.5 f c waa reached
( d a t u a l n uae Oct. 1938 t o Nov. 1 9 7 3 ) . F l o o d of S e p t . 6, 1909, reeched a t t a g e of 11.1 f t , 1904-5 a l t e end d a t u a ( d l a c h a r g e , a b o u t 19,000 f t / a ) .
EXTREMES FOR CURRENT YEAR.—Peak d l a c h a r g e a above baae o f 4,000 f t 3 / , and a a x l a u a ( • ) :
D l a c h a r g e Gage h e i g h t D l a c h a r g e Cage H e i g h t Date T i a e ( f t /a) ( f t ) Data T i a e ( f t /a) ( f t )
May 31 2330 «6320 8.59 Aug. 6 0100 5320' 8-31 June 25 0330 5920 8.61
DISCHARGE, IN CUBIC FEET PER SECOND, WATER TEAR OCTOBER 1982 TO SEPTEMBER 1983 MEAN VALUES
AT OCT NOV DEC JAN FEB MAR APR MAT JUN JUL AUG SEP
1 858 411 4 32 345 353 564 692 1780 5810 36 10 1260 421 2 890 409 415 34 1 336 510 652 1540 5250 3470 1270 406 3 790 411 395 346 332 508 636 1400 4 370 34 30 1390 442 4 746 389 385 385 353 593 652 1330 3630 3560 1320 4 00 5 710 396 405 391 365 633 660 1300 3640 3480 1230 379
6 656 390 380 390 330 498 572 1480 3650 3310 18 10 349 7 59 2 390 388 355 29 8 468 588 1760 3570 3150 1330 34 3 8 554 380 384 369 296 465 561 1870 3740 3180 1430 345 9 535 395 411 376 308 481 527 17 30 3810 29 30 1280 387
10 511 462 55 3 358 311 503 559 20 30 3510 2840 1150 385
11 499 450 544 365 30 2 548 555 2610 3340 2670 1090 35 3 12 49 1 444 481 376 317 611 57 3 2980 39 20 2290 1080 335 13 448 395 432 365 328 647 6 30 27 70 39 30 2070 97 2 308 14 4 30 390 404 367 335 678 672 2340 3120 1860 859 297 15 4 29 390 396 370 336 830 645 2160 27 30 1740 SO 1 30 3
16 4 36 370 374 37 3 319 703 591 1900 29 20 1590 757 293 17 455 370 38 2 376 341 606 602 17 20 3190 1500 648 304 18 47 1 105 400 380 336 604 646 1620 37 30 1470 547 278 19 464 405 391 366 34 1 597 763 1490 46 10 1460 536 270 20 44 2 4 34 366 352 34 1 55 3 923 1450 5410 1570 607 268
21 4 30 428 36 3 350 34 5 490 1030 1470 5 310 1530 504 27 5 22 398 405 373 351 34 5 500 1020 1360 5330 1520 47 1 295 23 38 7 387 423 335 390 580 1060 1430 5160 16 10 435 312 24 389 390 416 3 28 444 5*0 1220 1950 5140 1690 4 14 326 25 38 7 374 367 332 468 540 1600 2660 5540 16 60 415 302
26 384 377 339 330 504 548 1970 3900 49 30 1810 466 304 27 425 37 1 348 318 480 556 1950 4 210 4520 2110 47 3 298 28 4 37 37 1 325 321 492 528 1810 4940 4 270 1690 579 309 29 407 38 5 306 34 1 522 17 20 5510 3760 1430 480 322 30 40 3 38 5 288 334 556 1770 5460 3680 1360 466 39 2 31 404 336 321 660 5800 134 0 433
OTAL 15856 11959 12 202 11007 10046 176 20 27869 7 5950 125520 68950 2650 3 10001 EAN 512 399 394 355 359 568 929 2450 4184 2 2 24 855 333
(AX 890 462 55 3 391 504 8 30 1970 5800 5810 3610 1810 442 IN 384 370 288 318 296 465 527 130 0 27 30 1 340 4 14 268
iC-FT 314 50 237 20 24 200 218 30 ^99 30 3'. 9 50 5 < 780 15O6O0 249000 136800 5 2570 19840
CAL VR 1982 TOTAL 364553 MEAN 999 MAX 3660 MIN 209 AC-FT 723100 WTR YR 1983 TOTAL 413485 MEAN 1133 MAX 5810 MIN 266 AC-FT 820100
TABLE l i . Flow of Animas River at Farmington, 1983 Water Year ^ ^ (Source: USGS Water Resources Data, New Mexico, W.Y. 19'->3)

TABLE 5. SUMMARY OF FORMULAS USED IN CALCULATIONS
1) Seepage velex:ity using Darcy's Law:
2 Where: K = Permeability (K = 750 gallons/day/ft from
Ranney report to Brewer & Assoc.)
n = Porosity ( N = 0.25 assumed value for sand/gravel)
i = measured gradient ( i = change i n water level elevation per unit distance)
Reference: Todd, Eq. 3.21.
2) Drawdown using Theis non-equilibrium formula:
A-- £rT ) a = M Where: Q = pumping rate (Q = 35 gallons per minute, or Q =
65 gpm)
T = Transmissivity (T = Kb where K i s permeability, b = saturated aquifer thickness = 17 feet from Ranney report; T = 12750 gpd/ft)
r = distance (from well to produced water tank, r = 230 feet)
S = storage coefficient ( S = 0.2 for water table conditions)
t = time of pumping ( t = 100 days for example used here)
Reference: Todd, Eq. 4.38, 4.36.
3) Zone of capture in a uniform flow f i e l d under steady state conditions:
a) Boundary equation: — = ToJy^ "J^ L-
: Uu- ± JL-b) y - Limit
^M c) x - Limit
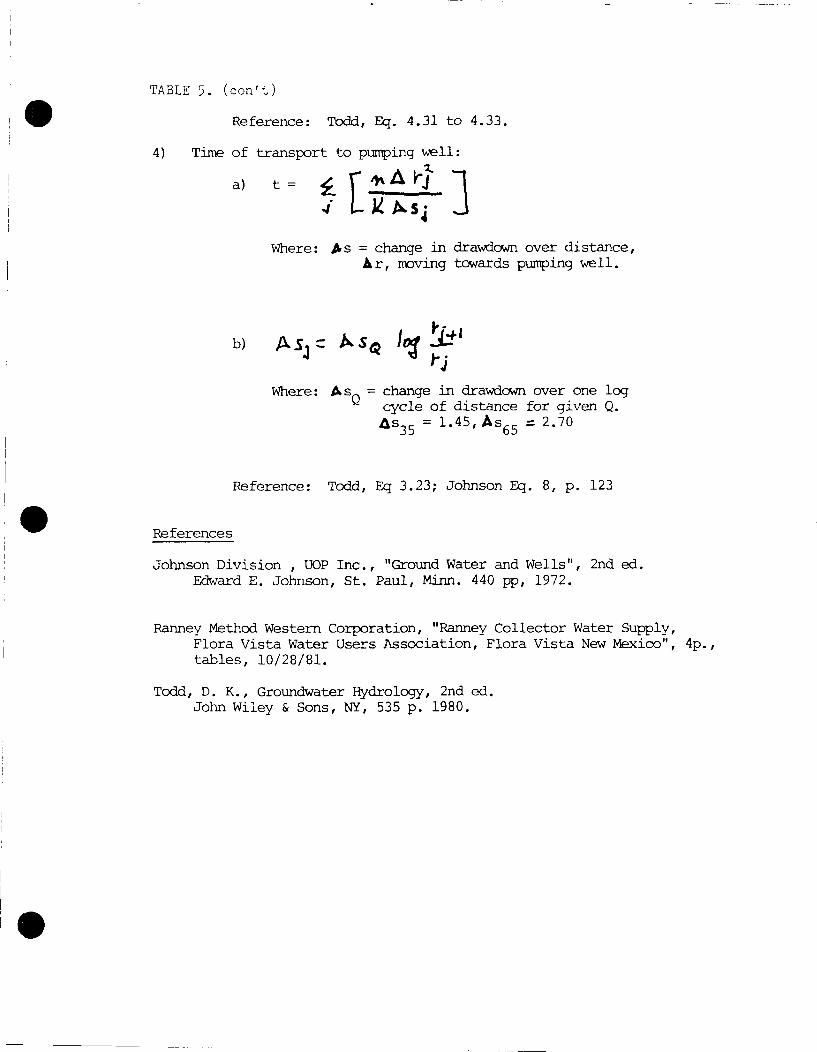
TABLE 5. (con't)
Reference: Todd, Eq. 4.31 to 4.33.
4) Time of transport to pumping well:
a) t = £ T *Alrj- n
Where: As = change i n drawdown over distance, Ar, moving towards pumping well.
b) Ait c k s r lot
Where: As. = change i n drawdown over one log cycle of distance for given Q. As, c = 1.45, As, c = 2.70
Reference: Todd, Eq 3.23; Johnson Eq. 8, p. 123
References
Johnson Division , UOP Inc., "Ground Water and Wells", 2nd ed. Edward E. Johnson, St. Paul, Minn. 440 pp, 1972.
Ranney Method Western Corporation, "Ranney Collector Water Supply, Flora Vista Water Users Association, Flora Vista New Mexico", tables, 10/28/81.
Todd, D. K., Groundwater Hydrology, 2nd ed. John Wiley & Sons, NY, 535 p. 1980.
APPENDIX C OCD F i n a l Report

2) Samples were taken from the water supply and monitor wells for organic analyses i n March, June, August, September, and October, 1985. The results are shown i n Tables 1 and 2. Results of samples from the fiberglass separator tank at the Mary Wheeler No. IE gas well are shown i n Table 3. Inorganic analyses were run on the water supply wells (including the previously contaminated well) and the Animas River i n March, and the produced water from the gas well i n October.
3) As expected, several monitor wells f i l l e d with sand and were cleaned twice using compressed a i r from two different compressors. The use of these compressors apparently affected the water quality as discussed below.
4) In September a l l monitor and supply wells were surveyed by Brewer and Associates for both location and elevation. Several well elevations were resurveyed i n October. Blueprints from recent aerial photos were received i n late December. Water levels were measured in September and October, 1985.
A summary of work performed i n 1986 follows:
1) Water levels were measured i n January, February, Ap r i l and May. These are shown i n Figures 3 to 6.
2) Samples from the monitoring wells for water quality analysis were taken i n January, and A p r i l . The contaminated well was sampled i n April and May. The water system was sampled for organics in January, Ap r i l and May. The new fiberglass tank at the Mary Wheeler IE o i l storage tank (used to collect water drained from that tank) was sampled i n A p r i l and May. The 55-gallon drum at the El Paso Natural Gas dehydrator unit was sampled i n January and February. The results of organic analyses of these samples are shown i n Tables 1 to 4. Inorganic analyses were run on samples from the contaminated water well i n A p r i l , and from the dehydrator barrel i n February. Discussion on the results is presented i n the section on water quality.
3) A 72-hour aquifer test was performed on the contaminated well between Apr i l 21 and 25. The test consisted of water level measurements from the pumped well and monitor wells on Ap r i l 21, 48 hours of pumping Apr i l 22-24, and 24 hours of recovery April 24-25. Approximately 5 hours into the test, o i l was drawn into the well. The results of this test are discussed i n detail i n the hydrogeology and water quality sections.
4) A second, short duration test was performed i n May to better characterize the volume and nature of the o i l . These results are also presented below.
5) A study progress report was prepared i n January.
-3-

Hydrogeology
The valley of the Animas River contains alluvium consisting mainly of sand and gravel which is outwash material from Pleistocene glaciers i n the San Juan Mountains i n Colorado. In the v i c i n i t y of the Flora Vista wells this alluvium is about 22 to 25 feet thick. Examination of the aerial photograph blueprints provided by Brewer & Associates shows old river channels and meanders i n the flood plain. Finer grained s i l t s and clays can be expected to have been deposited i n low velocity areas such as point bars and areas of overbank flooding. However, the area where the monitor wells were d r i l l e d was found to be a zone of very coarse sand and gravel with some rocks exceeding a foot i n diameter.
The presence of a coarse sand and gravel zone usually indicates high ground water permeability. Examination of the pumping level estimates provided i n the 1982 EID ccnrounity water system environmental survey, together with a 1982 Brewer and Associates i n f i l t r a t i o n gallery f e a s i b i l i t y study shows an aquifer permeability of about 750 gallons per day per square foot, or 100 feet per day. This was confirmed by the aquifer test conducted i n A p r i l . The value i s at the lower end of the range for clean sand and gravel mixtures, but s t i l l allows for rapid ground water movement.
In September and October, 1985, ground water levels were measured in those monitoring wells where f l u i d levels were present. The results were used to calculate the direction of ground water flow and the hydraulic gradient. The gradient values were 0.0080 and 0.0081, respectively, or about 43 feet per mile. These values are intermediate between the average river gradient at Flora Vista of 0.004 and the topographic gradient of 0.014 perpendicular to the river at the well f i e l d location. The 1986 water levels, measured i n January, February, A p r i l , and May, showed gradients of 0.0080, 0.0086 and 0.0079, and 0.0071 respectively. The average of the six measured values is 0.0080 or about 42 feet per mile.
The 1985 ground water flow directions are shown on Figures 1 through 2. The direction i n September i s slightly east of south. By late October, the direction had changed to nearly 20° east of south and continued that direction through January and February (Figures 3 and 4) . The A p r i l and May measurements (Figure 5 and 6) again show the direction of flow as sli g h t l y east of south.
Some reasons for these observed changes i n the ground water flow direction may be postulated based on surface and ground water interaction i n the area. When river flows are generally low, as i n the f a l l and winter, water stored i n the permeable a l l u v i a l material i n the immediate v i c i n i t y of the river during times of spring and summer high flows i s discharged back into the river. Additional ground water discharge to the river comes from sources to the northwest of the well f i e l d including ground water recharged to the alluvium from the Flora Vista Arroyo, the Halford Independent Ditch, the Farmers Ditch,
-4-

S-4 O
GAS PIPELINE
FORMER DEHYDRATOR LOCATION
MARY WHEELER #1-E GAS WELL —
S-6 O
DIRT ROAD
STORAGE TANK
S-2
S-3 ®
S-7 50 25 50 100 150
SCALE IN FEET
El Paso AJ .OilipainlLU]
MAP OF THE MANANA - MARY WHEELER #1-E WELL SITE.
PROJECT: EPNG-63712 (FLOADDS) LOCATION: FLORA VISTA, NEW MEXICO
K.W. BROWN &
ASSOCIATES, INC.
DATE: 9-13-89 PLATE: 1 SCALE: AS SHOWN
OCT-2 1989
OIL CONSERVATION DIV. SANTA FE

S-4
1 !
v .
NuTF
>-3
THIS HAP ASSUMES T H A T THERE ARE NG SIGNIFICANT VERTICAL COMPONENTS
CCNTOJR INTERVAL 0,5 FEET. DATUM IS MEAN SEA LE / F L ,
S-7 50 50 100
SCALE IN FEET
150
a
El Paso WATER TABLE ALTITUDE, MANANA - MARY WHEELER #1-E WELL SITE, JUNE 19, 1989.
PROJECT: EPNG-63712 (FLOADDS) LOCATON: FuORA ViSTA, NEW MEXICO
K.W. BROWN &
ASSOCIATES, INC.
DATE: 9 - 1 3 - 8 9 PLATE: 2 SCALE: 1"=50'
OCT-2 1989
OIL CONSERVATION DIV. SANTA FE

S-4
El
EPNG-1 2,1 p g A METHYLENE CHLORIDE .34 f j , gA XYLENE
MARY WHEELER §1-E WELL EPNG-2A ^
EPNG-2B— '
1.6 / xg / l BENZENE 1,2 H Q A ETHYLBENZENE 12,1 f i g A XYLENE
8,1 f i g / i BENZENE 37.4 /xg/L ETHYLBENZENE 192.4 / i g / l XYLENE
LEGEND
• EPNG-SERIES MONITDRING WELL
L?3 EXPLORATORY WELL
O OCD-SERIES MONITORING WELL
0 WATER-PRODUCTION WELL
.4 fig/V BENZENE
.33 H Q A TOLUENE 4.3 f i g A ETHYLBENZENE 13,54 H Q A X Y L E N E
ND - NOT DETECTED NS - NOT SAMPLED
OCD-3 O NS
[1.6 f i g A METHYLENE CHLORIDE]
S r i
APPROXIMATE LIM'T OF VISIBLE HYDROCARBON STAINING
•SX-1
l i NS •CD-4
O
NS
•CD-I
1,3 / i g / l METHYLENE CHLORIDE
•CD-2 o •
ND
S-6
NOTES:
1. ALL GROUNDWATER SAMPLES WERE COLLECTED ON JUNE 16 AND 17, 1989.
SX-2
NS
S-5
V.
PUMP HOUSE I ,26 / i g / i BENZENE | .32 fJ.g/\ TOLUENE
S-2
S-3
S-7 50 25 0 50
SCALE IN FEET
100 150
El Paso ^afiwdu I d s . = i i p a n ^
pjSJ^IRilT1QJN_OF AROMATIC VOLATILE ORGANIC COMPOUNDS IN ^ R O U N D W A J E R 3 A M P L E S TAKEN AT THE MANANA - MARY WHEELER #1-E
WELL "SITE
PROJECT: 63712 EPNG—FLORA VISTA (FLOADDS) LOCATION: FLORA VISTA, NEW MEXICO
K.W. BROWN &
ASSOCIATES, INC.
DATE: 9 - 1 4 - 8 9 K.W. BROWN &
ASSOCIATES, INC. PLATE: 3
K.W. BROWN &
ASSOCIATES, INC. SCALE: AS SHOWN
OCT - 2 1989 OIL CONSERVATION DIV.
SANTA FE

S-4 LQ]
7 EPNG-1
. • ND
LEGEND
• EPNG-SERIES MONITORING WELL
B EXPLORATORY WELL
O OCD-SERIES MONITORING WELL
O WATER-PRODUCTION WELL
ND - NOT DETECTED NS - NOT SAMPLED
MARY WHEELER #1-E WELL
EPNG-2A
EPNG-2B
OCD-3 O NS
ST1
® ND
SX-1
m NS
/ x .002/zg/i BEN ZO(b)FLU OR ANTHENE ' ' . 006 / jg / l INDENO(l,2,3-cd)PYRENE
OCD-4
o NS
APPROXIMATE LIMITS OF VISIBLE HYDROCARBON STAINING
•CD- I
o-ND
S-6
•CD-2
ND
SX-2 ffl'
NS
S-5
ND
NOTES:
1. ALL GROUNDWATER SAMPLES WERE COLLECTED ON JUNE 16 AND 17, 1989.
PUMP HOUSE
S-2
S-3
50 25 0 50 100
SCALE IN FEET
150
El Paso SB pa raw
DISTRIBUTION OF POLYNUCLEAR AROMATIC HYDROCARBONS IfKGROUND-/'WAJES^SAMPLES TAKEN AT THE MANANA - MARY WHEELER # 1 ^
WELL SITE
PROJECT: 63712 EPNG—FLORA VISTA (FLOADDS2) LOCATION: FLORA VISTA, NEW MEXICO
K.W. BROWN &
ASSOCIATES. INC.
DATE: 9-14-89 PLATE: 4 SCALE: AS SHOWN
OCT - 2 1989 OIL CONSERVATION DIV.
SANTA FE

S-4 fo1
. 6 l U g / { 1,2 DICHLDRDPRDPANE
BG-1
EPNG-1
LEGEK ! T M U
• EPNG-SERIES MONITORING WELL
ffl EXPLORATORY V E L L
O OCD-SERIES MONITORING WELL
g ] WATER-PRODUCTION WELL
ND - NOT DETECTED
; ~ 6 '9 BENZENE ; o4.3 M 9 7 9 T7JI UENE 177,2 u g / g >YLENE
1,2 u g / g TQLUFNE r . S /xg /g XYLENE
P-N // P-V \ 1/
\
~ \ i M Q / g v r ' _L 'NL- ; :
AM/?r WHEELER %1-E WELL
EPNG-£A_^
EPNG-2B
I ' 7>
1 T-1W
V P-S- ,37 ^ g / g CHLL1RDBENZENE ,76 /zg /g XYLENE
16 /ug/g TOLUENE
1 M g / g XYLENE p f - l C
• c r - i O'
VND
r ; 6 ^ g / g TLJLUENE | / R P - 1 A ,94 ^ g / g XYLENE ' N D
T-2W ' NB ;
/
" I E yug/g XYLENE
,4 .3 ^ g / g VINYL C H L D R I B E
RP-1B
,22 /J.Q/Q BENZENE R p - 2 j . 3 3 / i g / g TOLUENE
ND 0CB/-5 ~ ! .19 / xg /g CHLDRDBENZENE
° EPNG-4I ^ •CD-3
O
S-l
Bi T-4W
SX-1
1! T - 4 C ND
•CD-4
O
•4E ND
T - 6 V . ND
DCD-2 O '
T . 6E IN J j
TES:
S-6
SX-2
ffl'
S-5
0
T -7 ND
ALL SOIL SAMPLES WERE COLLECTED ON JUNE 12, 13, AND 15, 1989.
PUMP HOUSE
S-2
S-3
S-7 50 25 50 100 150
;CALE IN FEET
El Paso DISTRIBUTION OF VOLATILE AROMATIC ORGANIC COMPOUNDS INC^ lJ ) SAMPLES TAKEN AT THE MANANA - MARY WHEELER #1-E WELL SITE
PROJECT: 63712 EPNG-FLORA VISTA LOCATION: FLORA VISTA, NEW MEXICO
K.W. BROWN &
ASSOCIATES. INC.
DATE: 9 - 1 4 - 8 9 PLATE: 5
SCALE: AS SHOWN
lr.:h
OIL CONSERVATION DIV . . SANTA Ft '
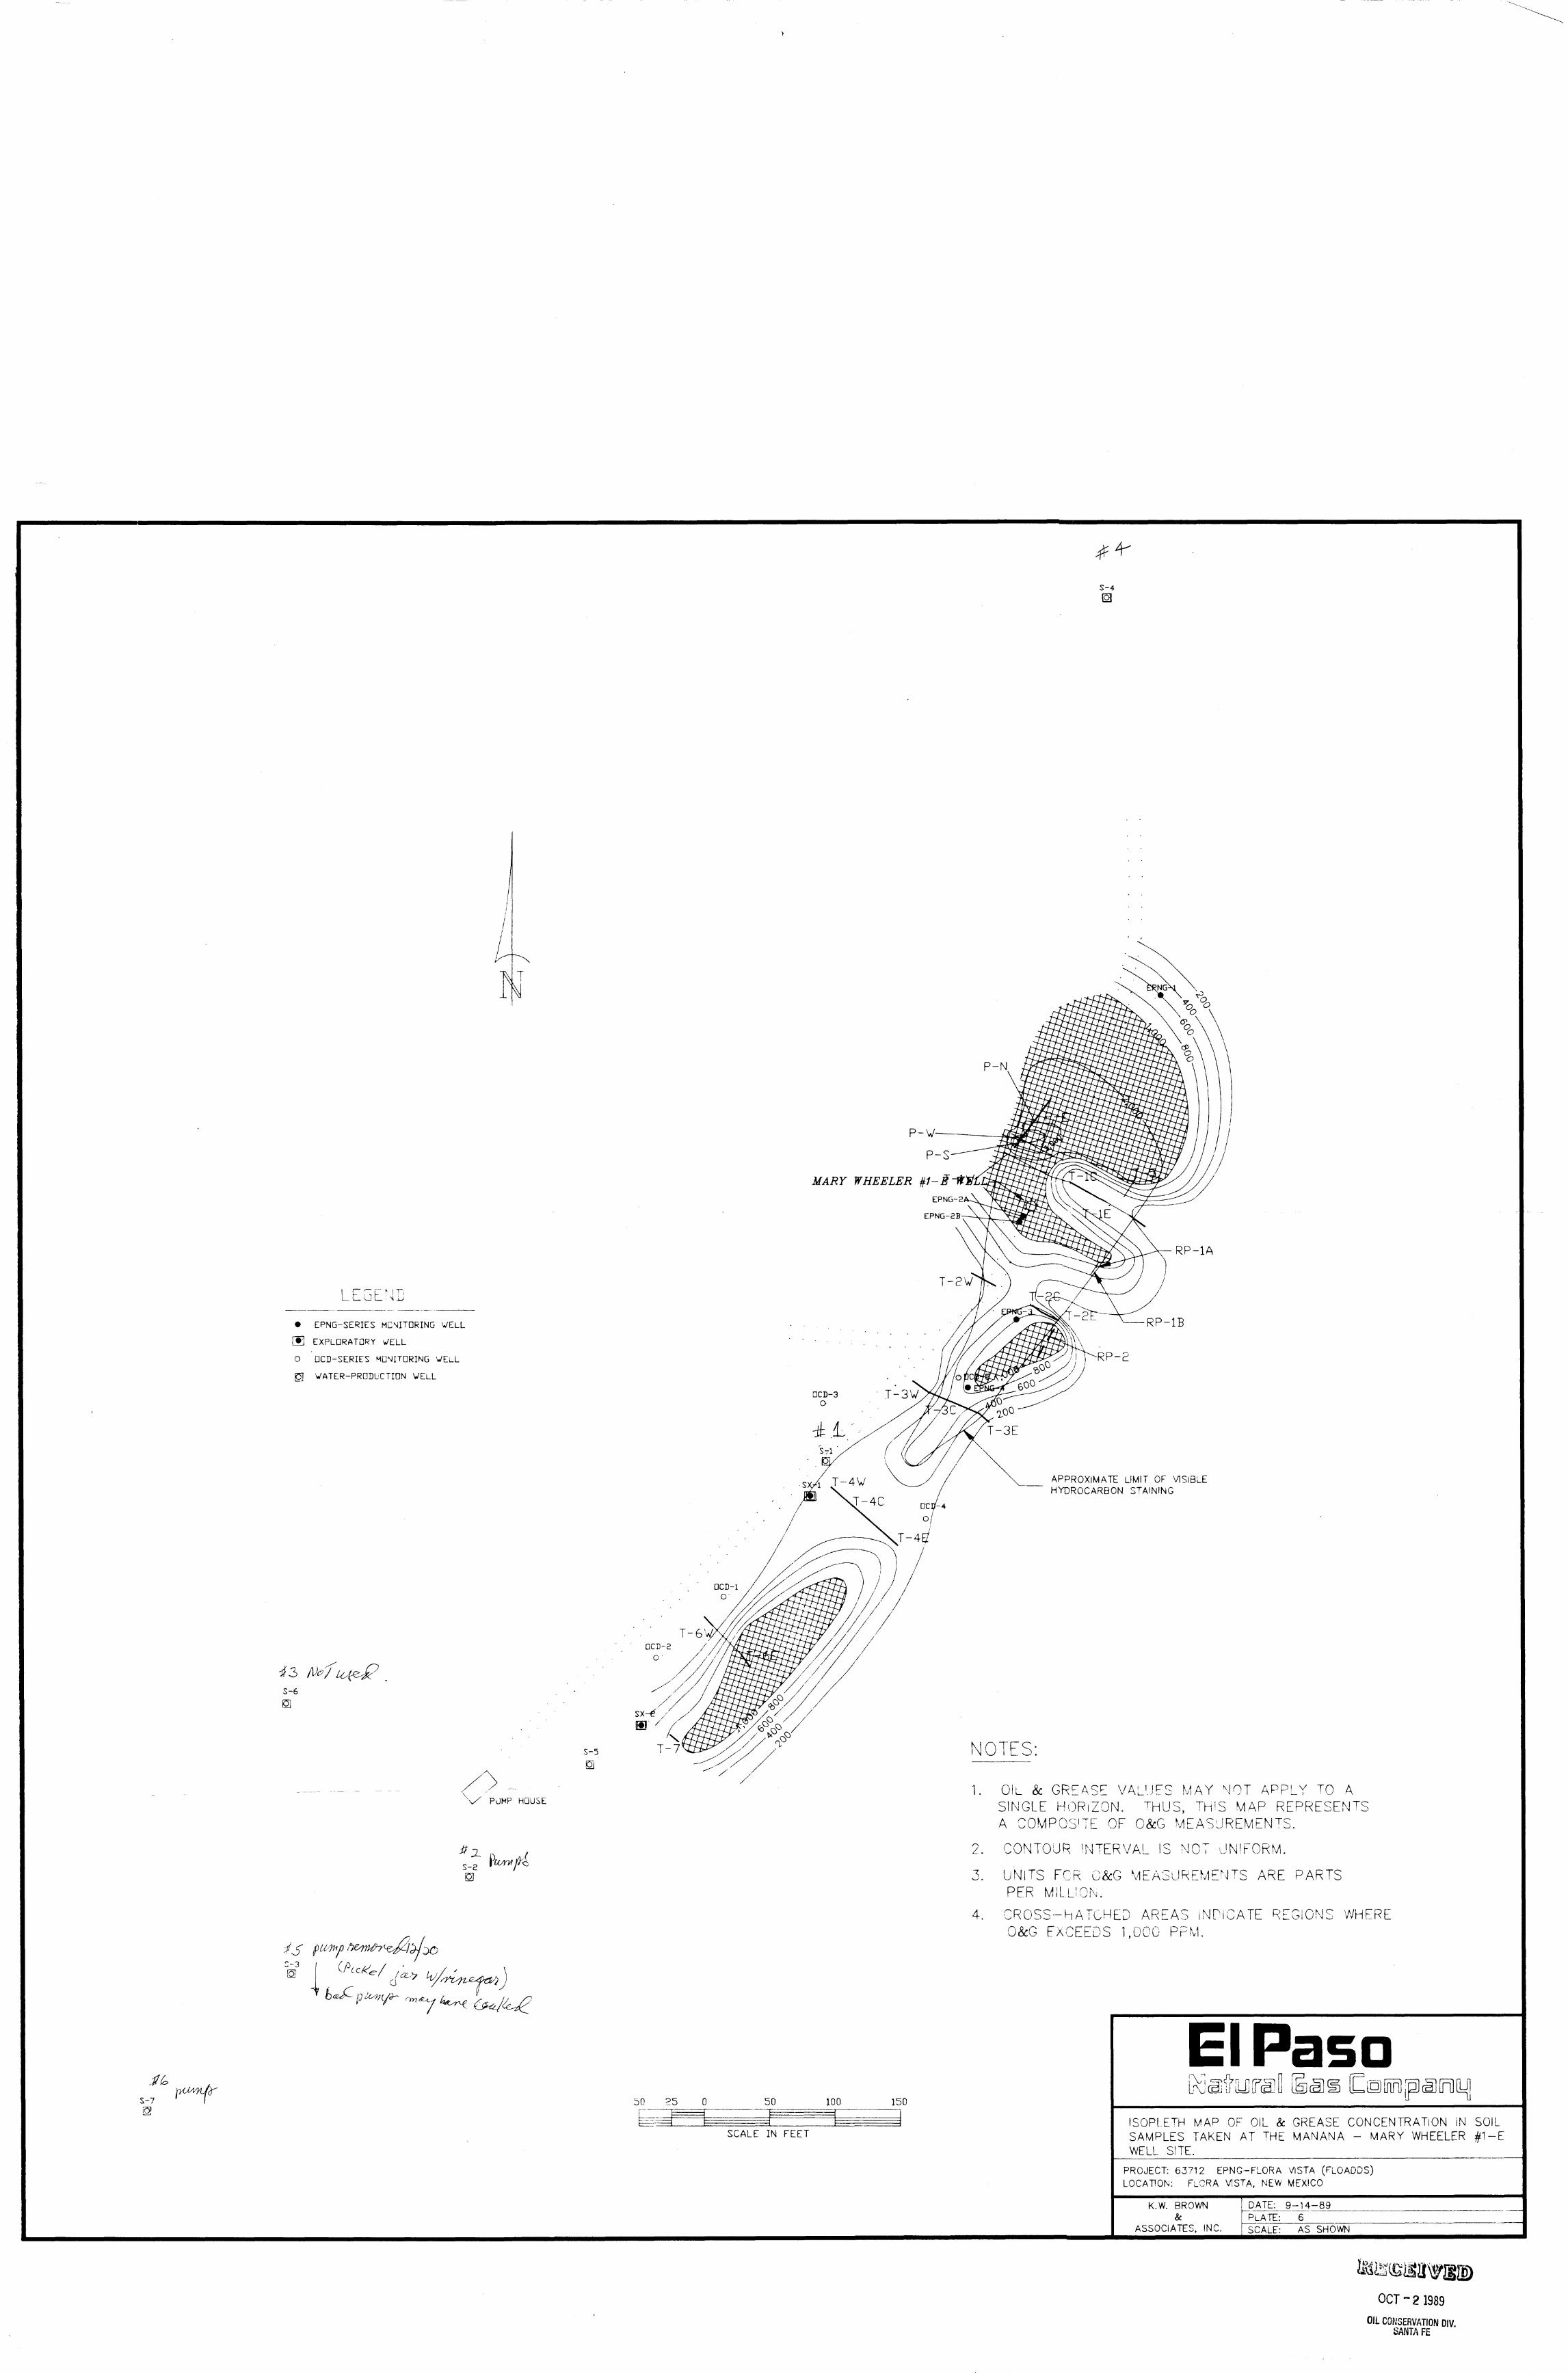
>
S-4
S-7 13!
T
MARY WHEELER #/-. EPNG-2*
EPNG-2B-
LEGEN
• EPNG-SERIES MCNITDRING WELL
[• ] EXPLORATORY WELL
O OCD-SERIES MONITORING WEuL
0 WATER-PRODUCTION WELL
^3 i V e f u j ^ p . S-6
S-5
•CD-3
APPROXIMATE LIMIT OF VISIBLE HYDROCARBON STAINING
NOTES:
PUMP HOUSE OIL & GREASE VALUES MAY UOT APPLY TO A SINGLE HORIZON. T HUS, THIS MAP REPRESENTS A COMPOSITE OE O&G MEASUREMENTS.
s_2 ymmfr z.
7
4.
:ONTOUR INTERVAL NOT UNIFORM.
S-3
lo!
UNITS FCR O&G MEASUREMENTS ARE PARTS PER MILLION.
ROSS-hATCHED AREAS INDICATE REGIONS WHERE O&G EXCEEDS 1,000 PPM.
50 ?5 o 50 ioo 150
SCALE IN FEET
El Paso L^afe^l] \&s\m Compaq
ISOPLETH MAP OF OIL & GREASE CONCENTRATION IN SOIL SAMPLES TAKEN AT THE MANANA - MARY WHEELER f l - E WELL SITE.
PROJECT: 63712 EPNG-FLORA VISTA (FLOADDS) LOCATION: F L O R A VISTA, NEW MEXICO
K.W. BROWN &
ASSOCIATES, INC.
DATE: 9 - 1 4 - 8 9 PLATE: SCALE: AS SHOWN
OCT-2 1989 OIL CONSERVATION DIV.
SANTA FE

S-4
BG-1
X ' ND
EPNG-1
LEGEND
• EPNG-SERIES MONITORING WELL
B EXPLORATORY WELL
O OCD-SERIES MONITORING WELL
0 WATER-PRODUCT IDN WELL
ND - NOT DETECTED
.165 m g / k g FLUORANTHENE
.178 m g / k g FLUORANTHENE
.118 m g / k g CHRYSENE
MARY WHEELER #1-E WELL
EPNG-2A
EPNG-2B
OCD-3 O
SX-1
m
T-4W ' ND
T-4C ND
•CD-4
O
3.901 m g / k g NAPTHALENE 3.584 m g / k g ACENAPTHENE
APPROXIMATE LIMIT OF VISIBLE HYDROCARBON STAINING
•CD-I cr
T-6W ND •
•CD-2
O"
T-6E ND
T-4E ND
S-6
SX-2 B'
T -7 ND
S-5
NOTES:
1. ALL SOIL SAMPLES WERE COLLECTED ON JUNE 12, 13, AND 15, 1989.
PUMP HOUSE
S-2
S-3
S-7 50 25 0 50 100 150
SCALE IN FEET
El Paso Lrvl ikons op paining
DISTRIBUTION OF POLYNUCLEAR AROMATIC HYDROCARBONS I N C I O I £ >
SAMPLES TAKEN AT THE MANANA - MARY WHEELER # 1 - E WELL SITE
PROJECT: 63712 EPNG—FLORA VISTA (FLOADDS2) LOCATION: FLORA VISTA, NEW MEXICO
K.W. BROWN &
ASSOCIATES. INC.
DATE: 9-14-89 PLATE: 7 SCALE: AS SHOWN
OCT-2 1989 OIL CONSERVATION DIV.
SANTA FE

S-4 O
GAC
BG-1 X
EPNG-1
STORAGE TAM<
• A i ' !
V AP Y WHEF.XR #1-E GAS *Eo.
OEHYJRA^OR
v • J
EPNG-2A
EPN0-2B -D
- J
TANK
4'
n n D - 3 O
G S - l
N.
EPN^- iX
p •CB<r5
TERRACE
/ - .RP-2
/ R P - : /
.CTiMATEr LOCATION ^ T'-iE K E S E K V E P'T
Sx-1 3
•CD-4
S-6
SX-2 C
PUMP STAT.
,Ai F IN FEET
150
—1-~ t
El Paso S=3
MA> CMC WING THt E3T,MMTEr ^CCATiONC CF THE CEHYDRATOR P I T A N J T h E W J M Ml " - REJER/E PIT
PROJECT: E P r , 3 - b 3 / i L ( F . U A ^ S )
L O C A T I C N : F_ORA /,C T A, NEW MEX" JO
K.vV. ^KO//N &
AS-CCJATFJ, 'NC.
DATE: 9 - 1 3 - 8 9 *~ - - - - — - - —
Dl / . T P ; P
OCT - 2 1989
Oil CONSERVATION DIV. SANTA FE