Embed Size (px)
Citation preview


Site: ^£(4^ID#: Break: . Other: .
/ /._4a.
REPORT OF INVESTIGATION
SALSBURY LABORATORIES
CHARLES CITY, IOWA
by
U.S. Environmental Protection Agency Region VII
Surveillance and Analysis Division
February 1979

ABSTRACT
The waste disposal operations of Salsbury Laboratories
in Charles City, Iowa, a maker of feed additives and veterinary
pharamaceutical preparations were examined and sampled. Analytical
data was obtained on conventional wastewater chemistry parameters
as well as heavy metals and trace organics.
Ortho-nitroaniline and a number of EPA priority
pollutants including arsenic were identified in the industrial
process wastewater, in the municipal wastewater treatment plant
influent and effluent, and in the receiving stream. In addition
to the municipal treatment plant, sources of receiving stream
pollutants included the industrial cooling water discharge,
contaminated groundwater, and leachate from the industrial sludge
disposal site. A downstream municipal drinking water supply was
found to contain ortho-nitroaniline.

n
ACKNOWLEDGEMENT
The Surveillance and Analysis Division of the Environmental
Protection Agency, Region VII, wishes to acknowledge the cooperation
of the City of Charles City, Iowa, Salsbury Laboratories, and the
City of Waterloo, Iowa.

disclaimer
Mention of brand names of equipment in this report does not
constitute endorsement or recommendation of a product by the
Environmental Protection Agency.

TABLE OF CONTENTS
Page
ABSTRACT............................................................................................................... i
ACKNOWLEDGEMENT .................................................... .... . ...11
DISCLAIMER...................................................................................................... iii
TABLE OF CONTENTS........................................................................................... iv
LIST OF FIGURES.................................................................................. . -vi11
lLIST OF TABLES ............................................... .................................. . . . x
REPORT ABBREVIATIONS ............................................................ xiv
I. INTRODUCTION ......................................... ......................... 1
II. BACKGROUND AND HISTORICAL INFORMATION ....... 3
A. CHARLES CITY....................................................... 3
B. SALSBURY LABORATORIES ............. 3
1. GENERAL INFORMATION ..................... 3
a. COOLING WATER DISCHARGE ........ 3
b. PROCESS WASTEWATER PRETREATMENT .... 5
C. CHARLES CITY MUNICIPAL WASTEWATER TREATMENTPLANT ........................................................................................... 6
III. LITERATURE AND DATA REVIEW . . .......................... 7
A. INTRODUCTION................................................................ 7
B. SALSBURY LABORATORIES PROCESS WASTEWATER .... 8
C. CHARLES CITY MUNICIPAL WASTEWATERTREATMENT PLANT ....... .......................... ; * 14
1. PLANT LAYOUT AND PERMIT CONDITIONS . . . ... 14
2. WASTEWATER CHARACTERIZATION . . . .'. . . . . 19
3. MUNICIPAL WASTEWATER SLUDGE DISPOSAL .... 25
4. MUNICIPAL SLUDGE DISPOSAL SITE .......................... 25

V
Page
t
D. CEDAR RIVER................................................... 26
1. HYDROLOGY ........................................... .........................26
. 2. WATER QUALITY STANDARDS .......................... .... 28
E. LABOUNTY DISPOSAL SITE .......................................... 29
IV. SAMPLING METHODOLOGY ANALYTICAL PROCEDURE, ANDDATA PRESENTATION............................................... .... 38
A. INTRODUCTION . ............................................... 38
B. AUGUST 1974 SURVEY.......................... .... • ......................39
C. AUGUST 1975 SURVEY...........................................................42
1. SAMPLING STATIONS............................................... 42
2. SAMPLING MEJHODOLOGY ................................................ 43
a. CEDAR RIVER AT CHARLES CITY .......................... 43
b. SALSBURY LABORATORIES PROCESSWASTEWATER...........................................................47
c. CEDAR RIVER AT USGS GAUGING STATION ... 48
d. WHITE MOTORS PROCESS WASTEWATER ..... 48
e. CHARLES CITY MUNICIPAL WASTEWATERTREATMENT PLANT ..... .......................... 49
i. MUNICIPAL TREATMENT PLANT INFLUENT. . 49
ii. MUNICIPAL TREATMENT PLANT EFFLUENT. . 50
lii. MUNICIPAL TREATMENT PLANT RAW SLUDGE. 54
iv. MUNICIPAL TREATMENT PLANT DIGESTEDSLUDGE . ...........................................................54
v. MUNICIPAL TREATMENT PLANT SLUDGE. . . SUPERNATANT.............................. : . . .*.55
f. CEDAR RIVER AT NASHUA................. .... d'i . 55
g. CEDAR RIVER AT JANESVILLE ........ 55
TABLE OF CONTENTS, CONTINUED

VI
TABLE OF CONTENTS, CONTINUED
Page
3. ANALYTICAL METHODOLOGY .... ..................... 56
4. DATA........................................................... 58
D. FEBRUARY 1976 INVESTIGATION ............................................ 58
E. FEBRUARY 10-11, 1977 RECONNAISSANCE ...... 62
F. FEBRUARY 22-23, 1977 FIELD EFFORT . ...........................70
G. APRIL 1977 FISH FLESH ANALYSIS ....................................80
H. JUNE 29-30, 1977 SEDIMENT AND FISH COLLECTIONEFFORT.......................................... 82
I. . AUGUST-SEPTEMBER 1977 SURVEY . . ....................................86
* 1. SURVEY STRUCTURE . . . ...............................................86
2. SAMPLING LOCATIONS .................................................... 86
3. SALSBURY LABORATORIES SAMPLING SITES .... 89
a. PROCESS WASTEWATER AND WATERSUPPLY SAMPLING ................................................ 89
b. WASTE SLUDGE ....... ...................... 99
c. SALSBURY SOIL SAMPLE................. ......... 100
4. WILDWOOD PARK SEDIMENT SAMPLES ........................ 100
5. MUNICIPAL WASTEWATER TEATEMENT PLANT .... 102
a. WASTEWATER . ................................. 102
b. DIGESTED SLUDGE . .............................................. 108
6. CEDAR RIVER . . . ......................................................... 108
7. SAND PIT......................... .111
8. MUNICIPAL AND PRIVATE WELLS ........ Ill
9. AIR SAMPLES.............................. .... . . .... 117
10. PRECIPITATION........................................ ...... 118

vi
TABLE OF CONTENTS, CONTINUED
Page
V. DISCUSSION........................................................ ■........................ • 122
VI. SUMMARY ........ ....................................................... 136
VII. CONCLUSIONS....................................... 138
VIII. RECOMMENDATIONS................................................................... .... . 140
BIBLIOGRAPHY.................................. 141
APPENDICES
A. AUGUST 1974 SURVEY DATA......................... 145
B. AUGUST 1975 SURVEY DATA......................... 150
C. PRIORITY POLLUTANTS AND AUGUST-SEPTEMBER 1977SURVEY. DATA.............................................................................. 171
D. SALSBURY LABORATORIES DATA AND IOWASTATE HYGIENIC LABORATORY DATA.......................................... 204

vi i
LIST OF FIGURES
Figure ' Page
1. Study Area.................................................................... 4
2. Location Map - Salsbury Laboratories, LaBounty Site,and Municipal Wastewater Treatment Plant .......................... . 9
3. Schematic Flow-through Diagram of MunicipalWastewater Treatment Plant ............................. 15
4. Location Map - Salsbury Laboratories, USGS Gauging Station, Municipal Wastewater TreatmentPlant, Etc...........................................................................................44
5. Location Map - Nashua Sampling Site . ..............................45
6. Location Map - Janesville Sampling Site.............................. 46
7. LaBounty Disposal Site - Looking West from East Bankof Cedar River ...... ............................................................ 65
8. LaBounty Disposal Site - From Base of Site LookingNorthwesterly ....................................... . . .................................. 65
9. LaBounty Disposal Site - From Top LookingEasterly Toward Cedar River (Behind Treeline) ..... 66
10. LaBounty Disposal Site - South End....................... 66
11. Yellow Color in Ice of Cedar RiverEast of Disposal Site........................................................... 67
12. Yellow Color in Ice of Abandoned Sand andGravel Pit . • • . . . . ............................................................ .67
13. Charles City Municipal Wastewater Treatment Plant - Raw Combined Domestic and IndustrialWastewater ................................................................................................. 68
14. Charles City Municipal Wastewater Treatment Plant -Primary Clarifier......................................................................... . 68
15. Charles City Municipal Wastewater Treatment Plant -Secondary Clarifier ....................................................... 69
16. Location Map - February 1977 Sampling Sites inCharles City Area............................................................ .... ... 72

ix
Figure Pfl9e17. Location Map - February 1977
Cedar River Sampling Site .............................. ....... 73
18. Location Map - February 1977 Cedar RiverSampling Site at Nashua ............... 74
19. Location Map - August 1977 Sample CollectionSites in Charles City Area .............................. ...... 90
20. Location Map - August 1977 SurveyCountry Club and McDonnell Wells...................................... 91
21. Location Map - August 1977 SurveyKrueger Well ...................................................................................... 92
22. Location Map - August 1977 SurveyWaterloo Municipal Well Number 9 . . . ...............................93
23. Location Map - Salsbury Soil BoringsSeptember 1977 . ......................................................... 101
24. Arsenic Concentration in Cedar River Sediments . . . .125
25. August-September Cedar River Discharge atCharles City.......................................................................................129
LIST OF FIGURES, CONTINUED

X
LIST OF TABLES
TABLE PAGE
I. Characterization of Salsbury LaboratoriesProcess Wastewater . .............................................. 10
II. Salsbury Compounds ....................................... ....... 12
III. Comparison of Known Salsbury Compounds with Lists of Priority Pollutants, Toxic Substances,and Hazardous Substances ........................................................ 13
IV. " Toxicity Information........................... .... . . ................. 16
V. Wastewater Characterization SalsburyLaboratories Industrial Wastewater .................................. 20
VI. Wastewater Characterization - Charles City Combined Domestic and Industrial WastewaterInfluent....................................................... 21
VII. Charles City Municipal Wastewater TreatmentPlant Influent Plant Loadings ..........................................*22
VIII. Charles City Municipal Wastewater TreatmentPlant Influent and Effluent BOD5 and NFS ...... 23
IX. Expected 1977 Waste Production -Salsbury Laboratories . ...................................... 31
X. Pounds of Organic Compounds at LaBounty Site .... 33
XI. Charles City Sewage Treatment PlantLoadings and Removal Efficiencies - August 1974 . . 41
XII. Compounds Identified by GC/MS From Sourcesin Charles City, Iowa................... 57
XIII. Summary Table - Mean Water and WastewaterChemistry Concentrations - August 1975 .......................... 59
\XIV. Summary Table - Mean Water and Wastewater
Chemistry Loadings, Pounds per day -August 1975 60
XV. - Summary Table - Municipal Wastewater TreatmentPlant Sludge Mean Concentration - August 1975 . ; ..61

xi
LIST OF TABLES, CONTI HOED
C
XVI. Charles City Municipal WastewaterTreatment Plant Concentrations and Loadings February 1976 ................................................... 63
XVII. Cedar River and Salsbury LaboratoriesSamples - February 23, 1977 .................................................. 75
XVIII. Sediment Sample and LaBounty Disposal SiteSample - February 23, 1977 . ........................................... 76
XIX. Cedar River Sediment Samples - MeanConcentrations - June 29-30, 1977 ..................................... 84
XX. Cedar River Fish Flesh Analysis ....................................... 85
XXI. Summary of Salsbury Wastewater and WaterChemistry Mean Concentrations and Loadings - September 1977 96
XXII. Wildwood Park Stream Sediment Sample DataSeptember 1977 103
TABLE 1 PAGE
XXIII. Summary of Charles City Municipal WastewaterTreatment Plant Chemistry Data - September 1977 . .105
XXIV. Charles City Municipal Wastewater TreatmentPlant Digested Sludge - September 1977 ...................109
XXV. Cedar River Chemistry Data and Loading RatesAugust-September 1977 ............................................... .... . .112
XXVI. Municipal and Private Well Water ChemistryData Concentrations - August-September 1977 ... .115
XXVII. Air Sample Particulates . .................. ............................. 119
XXVIII. Air Sample Gaseous Pollutants ..................... 120
XXIX. Summary of Arsenic and Ortho-nitroanilineResults.......................... ................................................................123
A-l Charles City Municipal Sewage TreatmentPlant Influent - August 1974 ...................... .... ,146
A-2 Charles City Municipal Sewage TreatmentPlant Effluent - August 1974 .......... .148

LIST OF TABLES, CONTINUED
xi i
B-l Cedar River at Charles City ConcentrationsAugust 1975 ............................................................................. . 151
B-2 Cedar River at Charles City Loadings -August 1975 .................................................................................. 152
B-3 Salsbury Laboratories Wastewater DischargeHeavy Metals Concentrations - August 1975 .................. 153
B-4 Salsbury Laboratories Wastewater Discharge
TABLE PAGE
Trace Organics Concentrations - August 1975 .... 154
B-5 Salsbury Laboratories Process WastewaterLoadings - August 1975 ........................................................ 155
B-6 Storm Sewer Discharge at Cedar River -August 1975 . . ......................................................................... 155
B-7 Charles City Municipal Treatment PlantInfluent Concentrations - August 1975 .......................... 157
B-8 Charles City Municipal Wastewater TreatmentPlant Influent Trace Organics Concentrations August 1975 .......................... ............................. ......................... 158
B-9 Charles City Municipal Sewage Treatment PlantInfluent Loadings -August 1975 ....................................... 159
B-l0 Charles City Municipal Wastewater Treatment Plant Influent Trace Organics Loadings August 1975 ........................................................................ 160
B-l1 Charles City Municipal Sewage Treatment PlantEffluent Concentrations - August 1975 . . .................. 161
B-l2 Charles City Municipal Wastewater Treatment Plant Effluent Trace Organics Concentrations August 1975 .................................................................................. 162
B-l3 Charles City Municipal Sewage Treatment PlantEffluent Loadings - August 1975 . . .............................. 163
B-l4 Charles City Municipal Wastewater Treatment Plant Effluent Trace Organics Loadings August 1975 .............................................. 164
B-l5 Charles City Sewage Treatment Plant Raw SludgeConcentrations - August 1975 165

LIST OF TABLES, CONTINUED
B-16 Charles City Municipal Sewage Treatment PlantDigested Sludge Concentrations - August 1975 . . . .166
B-17 Charles City Municipal Sewage Treatment Plant Digester Supernatant Concentrations
TABLE PAGE
August 1975 ......................... 167
B-18 Cedar River at Nashua ConcentrationsAugust 1975 .................................................................................. 168
B-19 Cedar River at Janesville ConcentrationsAugust 1975 ................................... ........... 169
B-20 Cedar River at Janesville LoadingsAugust 1975 ......................... 170
\
C-l Recommended List of Priority Pollutants ...... 172
C-2 Salsbury Laboratories Wastewater andWater Chemistry Data - September 1977 .......................... 179
C-3 Charles City Municipal Wastewater TreatmentPlant Chemistry Data . .................................... 192
m

XIV
REPORT ABBREVIATIONS
Abbreviations not defined in the text of this report are defined as
follows.
As ArsenicAug AugustBa BariumBOD c Five-day biochemical oxygen demand°C Degrees CelsiusCa CalciumCd Cadmiumcfs Cubic feet per secondcm Centimetercone ConcentrationCPU ChloropTatinate unitsCr , ChromiumCr 3 tri-valent chromiumCr+6 Hexavalent chromiumcu cm Cubic centimetercu ft Cubic foot (feet)cu ft/sec Cubic feet per secondcu m Cubic meter(s)cu m/day Cubic meter(s) per daycu m/sec Cubic meter(s) per secondDDE DichiorodiphenyIdichioroethyleneDO Dissolved oxygenEC 50 Median effective concentration°F Degrees Fahrenheitft Foot (feet)g Gram(s)gal Gallon(s)GC/MS Gas chromatography-mass spectrographyHg Mercuryha Hectare(s)'hr, Hour(s)ID Inside diameterkg Kilogram(s)kg/day Kilograms per daykm Kilometers1 Liter(s)lb Pound(s)LC50 Median lethal concentrationig Lengthm Meter(s)Mg Magnesiummgd Million gallons per daymg/kg Milligram(s) per kilogrammg/1 Milligram(s) per litermil gal Million gallonsml Milliliter(s)rr.l/min Milliliter(s) per minute

XV
REPORT ABBREVIATIONS (continued)
Mn ManganeseN NorthNa SodiumNFS Nonfilterable solids*NHo-N Ammonia nitrogen as nitrogenNi3 NickelNo. Number(s)N0p-N0o-N Nitrite-nitrate nitrogen as nitrogenno2-n Nitrite nitrogen as nitrogenNO^-N Nitrate nitrogen as nitrogenNW NorthwestONA Ortho-nitroanilinePb Leadppb Parts per billionP, P' DDD Para, Para '-2,2-Bis (para-chlorophenyl)-l,P, P' DDE Para, Para1-DichiorodiphenyldichioroethyleneP, P* DDT Para, Para'-DichlorodiphenyltrichioroethaneQC Quality controlR, RiverR RangeSe SeleniumSE SoutheastSec SectionSn TinS04 Sulfate(s)STP Sewage treatment plantsq km Square kilometer(s)sq miles Square mile(s)T TownshipTC Total carbonTDS Total dissolved solidsTKN Total Kjeldahl nitrogenTOC Total organic carbonTotal P Total phosphorousTVS Total volatile solidsUSGS United States Geological Surveyl! Westwt Weightyd YardZn Zinc
Miscellaneous
ymhos/cm yg/cu m yg/1 ><
micromhos per centimeter micrograin(s) per cubic meter microgram(s) per liter Less than Greater than
* Also termed total suspended solids (TSS)
-dichloroethane

I. INTRODUCTION
As a result of routine municipal wastewater compliance
monitoring activities, the Surveillance and Analysis Division (SVAN)
of the Environmental Protection Agency (EPA), Region VII*, has
frequently encountered situations in which industrial process wastes
either interfere with the biological processes of municipal wastewater
treatment plants or pass through these plants without appreciable
attenuation.
In 1974, the Water Section of SVAN became aware of a similar
situation in Charles City, Iowa. Process waste resulting from an
industrial biologic-pharmaceutical-feed additive operation were
being discharged to the municipal treatment plant. These process
waste were yellow in color and contained significant concentrations
of arsenic and unidentified trace organics. Visual observations and
preliminary data indicated some concern as to whether or not this
waste was compatible with plant biological processes. Since 1974,
numerous reconnaissances and sample collection efforts by Water
Section personnel indicated that this municipal-industrial situation
was of wider scope then initially realized and that there was cause
for concern because of a number of interconnected environmental
and human health factors. These factors included leachate and
runoff from municipal and industrial solid waste disposal sites,
groundwater contamination, receiving stream water quality, private
and municipal drinking water supplies, and occupational exposure to
volatile organics.
*25 Funston Road, Kansas City, Kansas 66115

It is the purpose of this report to provide background and
historical information on the Charles City situation, to summarize
the rather extensive number of reports covering various aspects of
the problem, and to present the data resulting from various SVAN
activities in the area.
3
e
*v
II. BACKGROUND AND HISTORICAL INFORMATION
A. CHARLES CITY .
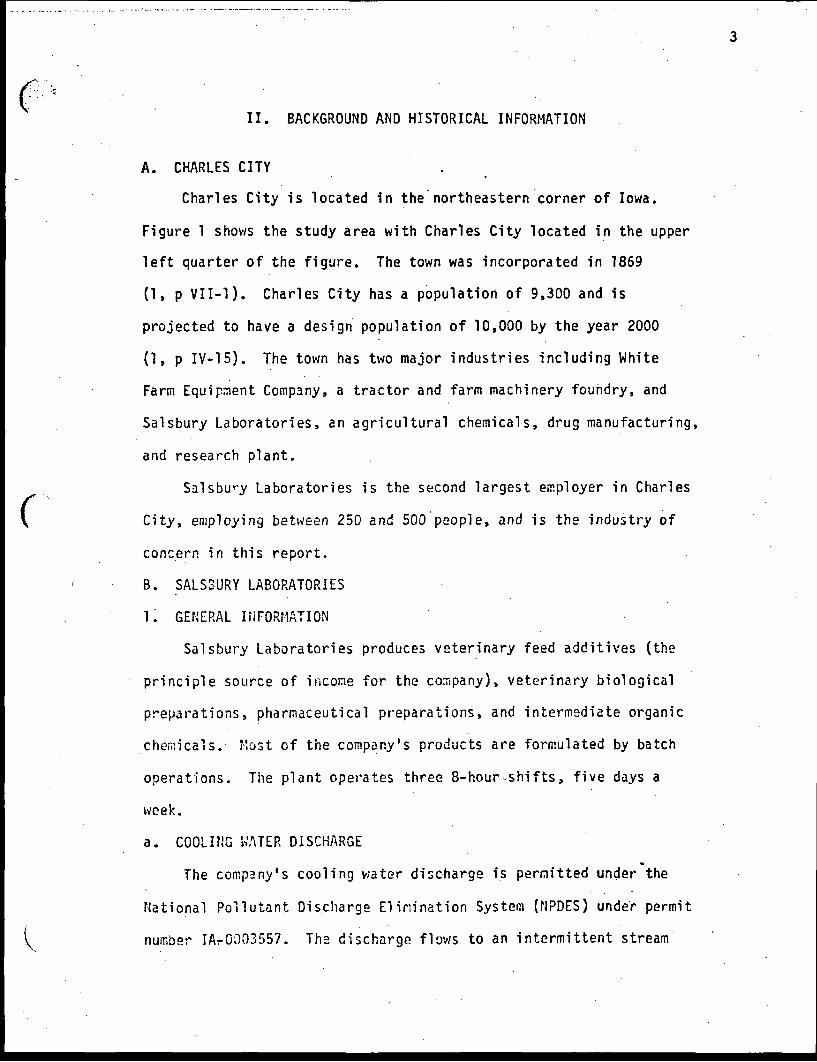
Charles City is located in the northeastern corner of Iowa.
Figure 1 shows the study area with Charles City located in the upper
left quarter of the figure. The town was incorporated in 1869
(1, p V11—1). Charles City has a population of 9,300 and is
projected to have a design population of 10,000 by the year 2000
(1, p IV-15). The town has two major industries including White
Farm Equipment Company, a tractor and farm machinery foundry, and
Salsbury Laboratories, an agricultural chemicals, drug manufacturing,
and research plant.
Salsbury Laboratories is the second largest employer in Charles
City, employing between 250 and 500 people, and is the industry of
concern in this report.
B. SALS3URY LABORATORIES
1. GENERAL INFORMATION
Salsbury Laboratories produces veterinary feed additives (the
principle source of income for the company), veterinary biological
preparations, pharmaceutical preparations, and intermediate organic
chemicals. Most of the company's products are formulated by batch
operations. The plant operates three 8-hour shifts, five days a
week.
a. COOLING WATER DISCHARGE
The company's cooling water discharge is permitted under the
National Pollutant Discharge Elimination System (NPDES) under permit
number IAr0003557. The discharge flows to an intermittent stream

4
I
MINNESOTA
FIR'JRE 1. STUDY AREA

5
which is a tributary to an unnamed creek which flows through Wildwood
Park located on the west side of Charles City. Pertinent permit
conditions on this discharge are as follows:
Parameter Dai.ly Average Daily Maximum
Temperature — 95°F
NFS 30 mg/1 45 mg/1
PH
Permit Expiration Date:
6.5 to 9.0
Nay 27, 1979
b. PROCESS WASTEWATER PRETREATMENT
Salsbury's chemical plant has over 100 separate process streams
which discharge to sewers within the complex. The waste streams
containing arsenic are treated separately for arsenic removal.
Following arsenic removal, this process wastewater is combined with
the other process waste for pH neutralization and calcium sulfate
precipitation. The wastewater'is then pumped to a clarifier
followed by a 0.5 mil gal (1900 cu m) flow equalization basin which
provides approximately one day detention. From the equalization
basin the wastewater flows to a wet well where it is pumped to
the city sewer. The plant sanitary waste is also discharged to
the wet wsl1.
Average daily process wastewater flow rate has been estimated
at between 0.45 (1, p IV-9) and 0.52 (2) mgd (1700 and 2000 cu m/day).
The company's gypsum and arsenic bearing sludges are disposed of
by landfill at the LaBounty disposal site. Total current annual
solid waste disposal volume at the site is estimated (14, p 13) to
be about 910,000 cu ft (26,000 cu m).

6
C. CHARLES CITY MUNICIPAL WASTEWATER TREATMENT PLANT
The municipal wastewater treatment plant was constructed in
1967 (1). The treatment system includes the following elements and
processes: bar screen, Parshall flume, grit removal, wastewater
pumping, two primary clarifiers, a single stage trickling filter,
a secondary clarifier, and an outfall to the Cedar River. Primary
and secondary sludge are treated in two aerobic digesters and
disposed of by application on farmland.
The NPDES permit (3) for the municipal treatment plant expired
June 30, 1977. The permit has not been reissued because of the.
uncertainties of the situation in Charles City vis-a-vis industrial
pretreatment, municipal waste treatment needs, effluent parameters,
etc.
)

7
III. LITERATURE AMD DATA REVIEW
A. INTRODUCTION
In addition to the information which this report presents, there
is considerable information available on various elements of the
Charles City problem. With regard to Salsbury's process wastewater,
these sources include the company's state operating permit application
(2), the Charles City 201 Facilities Plan (1), and a report by
Stracke and Baumann (4) on the biological treatment of Salsbury's
wastewater.
Information on the Charles City municipal wastewater treatment
plant is also contained in the Facilities Plan (1) and in Discharge
Monitoring Reports as well as Stracke and Bauman's Report (4).
Information on the LaBounty sludge disposal site is perhaps
most extensive and includes a joint report (5) by the Iowa Department
of Environmental Quality (IDEQ) and the Iowa Geological Survey (IGS).
Data presented in this report indicated that arsenic bearing
leachate was moving from the LaBounty site. The report was
instrumental in structuring SVAN field activities in August and
September of 1977. In addition to this report and partially as a*
result of it, IDEQ entered into a contract (G) with Eugene A. Hickok
and Associates* for a detailed study of the LaBounty disposal site
as well as secondary sites which were known to contain industrial
sludges or liquid wastewater. The contract amount of $95,101 was
funded by a grant to IDEQ from the U.S. EPA. The stated purpose
*545 Indian Mound, Wayzata, Minnesota 55391.

8
of the contract was "...to aid the Executive Director of DEQ in
preventing further contamination of the groundwater, to determine thJ extent of present and predicted contamination, and to develop
criteria for evaluating storage and/or disposal methods for disposal
sites near Charles City, Iowa." The reports resulting from this
contract were submitted to IDEQ in fourteen separate volumes
(references 7 thru 20) during the period beginning July 1 and
iending December 14, 1977.
Figure 2 shows the locations of Salsbury Laboratories, the
LaBounty disposal site, and the municipal wastewater treatment plant.) /
In this figure, the direction of flow of the river is from the
upper left hand corner to the lower right hand corner.
B. SALSBURY LABORATORIES PROCESS WASTEWATER
On December 12, 1974, Salsbury applied to the IDEQ for an
operating permit (2) for their process wastewater pretreatnent
system. In the permit application, Salsbury characterized their
wastewater as shown in Table I. The application did not contain anyi
data on trace organics concentrations in the process wastewater.
It should be pointed out that because of the batch operations
the plant, which are typical for the pharmaceutical industry,
there is no average waste stream. Some compounds may only be
produced at infrequent intervals with several months between
batches (4, p 13).
Accompanying Salsbury's state application (2) was a list-of
ra\-/ materials and compounds associated witii the company's operations.
This list was based upon the company's anticipated 1975 production

9
V.
\
i,• !•
31 —
Rn;s/i fI.
v-v
Ss^dai:
—-i = T„ '— f' ...................
Wtt’wootfl rI- .. *............. . • 1
: :! :: t
v..v-A
-J---------------->CV/__
, I
* I. ‘;.*Wx-Si-ij:.,* 7------ : \ ct-
"i.
">■ -6.
^ A \ ,• ;* /*•. j *• - ~
, v v^QX-^v -x\I V, v X- —* .*•*... '•>•■ "c . . f----------- :;---------;; .------- .---------.----------- .'I * V‘ • 1 * ' l' NVv-.v, • V .•'*vV •' X . 'l ,: Tf*, i____ ;____ ;‘ 4 v *■____ ;* __ I
* L □7CD^u=z^i!•.::•: .0\.-• /- • '■.. ^s«vV r^o. : -r:; *rn«* •- S,-' '■» x ____^ •_________________ « SLh _ ^ ••"
■ A sf t-’ SeS
i'.>> CHARLES JCIIY..'. I 1
I !
SALSBURY‘a^>x
r ; X /> Tx^V^^labounty *rrmunicipal J•.w» d* LABORATORIES >• nT cpnsfll • v- WASTEWATER' ,.■■■
* --- ‘ 1 1 :iX_:L Gai,^3Xw./t',IJif_UirtL"V- TDFaTMrfJT Xl.
’ -I ' - *■XS • '____;:_ ?p_____•?____: aj/c 1 • \
s v
__ ______ : L .—OLD MUNICIPAL’.^' , r .. .. •* *+* LANDFILL SUES. '*•
>< I Cl-jr.1/1 ■% u -------------,/•: I- n
/■
*GURE 2. LOCATION MAP - SALSBUP.Y LABORATORIES, LABOUNTY DISPOSAL SITE, LD MUNICIPAL LANDFILL SITE, AND MUNICIPAL WASTEWATER TREATMENT PLANT

10
TABLE I
CHARACTERIZATION OF SALSBURY LABORATORIES
PROCESS WASTEWATER
Concentration, mg/1 Loading, lb/day*
Mean Daily Maximum Mean Daily Maximum
Flow Rate, mgdi- ■
0.518 0.87 NA NA
Ajsenic (Total) 5.4 17.5 23.2 67.2
Phenolics 3.05 44 14.0 192
Zinc (Total) 0.31 3.82 1.33 21.5
Manganese (Total) 39.4 57.6 39.4 164
Chloride 529 820 2,195 3,405
Calcium 450 567 1,870 2,350
Sodium 1,338 1,602 5,555 6,650
Sul fatei
2,130 3,780 10,960 14,570
Total Organic Carbon 497 935 2,205 4,085
N o2-n 4.3 6.0 17.9 25.0
B od5 533 990 2,525 5,663
C OD 952 1,168 4,199 6,433
Tjotal Solids 5,475 10,350 25,500 50,420
Total Dissolved Solids 5,445 10,290 25,380 51,180
Total Suspended Solids 29 62 115 240
Total Volatile Solids 960 1,660 4,240 8,130 f
!i3rN 85 212 370 1,120
TKN 148 217 640 1,000
!jl03-N 3.1 4.5 12.9 18.7
'^Multiply by 0.454 to obtain kg/day.

schedule. This list is presented in Table II. Although the relative
production quantities may have changed, this list is believed to
Ireflect those materials which could be found 1n the company's
projcess wastewater. Table III presents the results obtained after
cross-checking those compounds listed in Table II (plus arsenic)
against various lists of substances prepared by EPA pursuant to
Congressional mandate and court decree. The priority pollutants heJding in Table III refers to those 129 potentially toxic compounds
identified in the June 1976 consent decree (21) with the Natural
Resources Defense Council, Inc. et al. The EPA is currently
reevaluating the 1933 limitations representing the Best Available
Technology Economically Achievable for these materials. The Toxic
Substances Control Act (TSCA) lists refers to the. preliminary
tabulation (22) of approximately 300 substances which were identified
by the JSCA Interagency Testing Committee (July 1977), The initial
TSCA report of October 1977 (23) identified ten compounds from the
preliminary list which were of the most immediate concern. The
second TSCA report of April 1978 (24) recommended eight additional compounds for further study. Hazardous substances refers to those
materials identified by EPA in the Federal Register of March 13,
1973 (25).
A detailed literature search for human and aquatic toxicity
information is beyond the scope of this report, and as the TSCA
lists .indicate, many of the substances are recommended for further
evaluation because of inadequate toxicity information. As background
information, the toxicity information from the Merck Index (26)

12
I
TABLE II
SALSBURY COMPOUNDS
Compounds present at least 80* of t!
3-f)h’tro-4-Hydroxypheny 1 arsonic Acid Sulfanilic Acid Acetic Acid PhenolBenzoic AcidNitrobenzoic Acid (3 isomers)AcetanilideAnilineOrtho-nitroaniline Diphenyl amine Butyl Acetate Phenol sulfonic Acid N-Nitrosodiphenyl amine
Compounds present at least 50« of t
Zinc salt of phenol sulfonic acid Sociium salt of phenol sulfonic acid
time:
1,1,2-trichloroethane Sulfanilamide Ortho-nitrophenol Sulfuric Acid /Nitric Acid Hydrochloric Acid Sodium Hydroxide Calcium Oxide (Hydroxide) Sodium Nitrite Manganese Sulfate Arsenic Acid Arsenic Trioxide
time (in addition to the above):
paro-nitroaniline
Compounds present at least 30* of the time (in addition to the above):
4-Nitrophenylarsonic AcidfiijtrobenzeneSajiicylic AcidsSujl fapyridineSalicylazosulfapyridineDijnitrobenzoic AcidsMethanolDi|chloroni troanil ine
N-Acetyl -N1 -(4-ni trophenyl) sulfanilamide
EthvlenediamineN,N'-Bis (3-Nitrobenzenesulfonyl)
Ethylene-diamine2-Amino-5-Nitrophenyl Thiocyanate Ammonium thiocyanate 2-Amino-6-Nitrcbenzothiazole Chioro-nitroaniline
the time (in addition to the above):Compounds present at least 10^ oi
Lithium salt of phenolsulfonic Acid 2^chloro-4-nitrotoluene 2-Khloro-4-ni trobenzoic acid 2-jchloro-4-nitrobenzamide 2-|ami no-5,6-di chi orobenzothi azole 10,10'-Oxybisphenoxarsine
Compounds present less than 10% of the
Ethylene glycol Methyl Ethyl Ketone Diphenyloxide 2-Ethyl-Hexanol Aluminum chloride
time (in addition to the above):
3,5-Dinitrosalicylic acid Ammonium salt Phenolsulfonic Aci 3]5-Dinitrobenzamide
d

TABLE III
COMPARISON OF KNOWN SALSBURY COMPOUNDS
WITH LISTS OF PRIORITY POLLUTANTS, TOXIC SUBSTANCES,
AND HAZARDOUS SUBSTANCES
1
SalsburyCompounds
PriorityPollutants
June1976
TSCA Lists HazardousSubstances
March1978
July1977
Oct.1977
April1978
1i/^cetic Acid X X
Ammonium Thiocyanate1
X
Aniline X X
Arsenicx(a) x(b)
Benzoic Acid*(c)
Diphenyl amine X
Hydrochloric Acid X
Nitric Acid X
Nitrobenzene1
X X X X
Ortho-nitrophenol X X X
Para-nitroaniline XI-Phenoli
X X
Sodium Hydroxide X
Sulfuric Acid X
1,1,2-Trichloroethane X X X■
(a) Total Arsenic(b) Arsenic disulfide, pentoxide, trichloride, trioxide, trisulfide Cc) 2-[(4-Dimethylamino) phenylazo]-

14
and the findings and recommendations of the TSCA committee for someI ‘
ofjthe compounds 1n Table III are summarized in Table IV.
C. CHARli.ES CITY MUNICIPAL WASTEWATER TREATMENT PLANT
1. PLANT LAYOUT AND PERMIT CONDITIONS
Figure 3 shows the flow through layout of the municipal waste-
water treatment plant. The NPDES permit (3) which expired June 30,
1977, stipulated the following effluent limitations:
Concentration, mg/1 Loading, lb/day*
Parameter Daily Average Maximum Daily Average Maximum
bod5 70 120 1,750 3,000
NFS 30 90 750 2,200
HH3-Nj
90 120 2*200 3,000
Arsenic (Total) 1.6 2.5 —
Total Heavy Metals* ** 1.5 2.5 — —
PH 6.5 - 9.0 — —
FI dw Rate, mgd 3.0 . 5.0 — —
Under the permit schedule of compliance, Charles City was directed
to meet the following monitoring requirements and effluent limitations.
The contract award for construction of facilities to meet thesej
limitations was to be awarded by January 1, 1977.
^Multiply by 0.454 to obtain kg/day.
**Sum of individual analyses for Ba, Cd, Cr (+3 and +6), Cu, ( Pb, Zn, Se, Hg.

15

16
TABLE IV
TOXICITY INFORMATION
Compound Merck Index'Toxicity Information and TSCA| Committee Findings
Acetic Acid "Ingestion may cause severe corrosion ofmouth and G.I. tract with vomiting, hematemesis, diarrhea, circulatory collapse, uremia, death. Chromic exposure may cause erosion of dental enamel, bronchitis, eye irritation." (26, p 6)
Ammonium Thiocyanate
Aniline
Under potassium thiocyanate, "May cause skin eruptions, psychosis" (26, p 859)
"Intoxication may occur from inhalation, ingestion, or cutaneous absorption.Serious poisoning may result from ingestion of 0.25 ml. Acute: cyanosis methemoglobinema, vertigo, headache, mental confusion.Chronic: anemia anorexia, weight loss, cutaneous lesions. So called aniline tumors of the urinary bladder are caused by intermediates in the manufacture of coal tar (aniline) dyes rather than by aniline itself." (26, p 85)
Arsenici
IIBjenzoic Acid
"Most forms of arsenic are highly toxic. Acute symptoms following ingestion relate to irritation of the G.I. tract: nausea, vomiting, diarrhea which can progress to shock and death. Chronic poisoning can result in exfoliation and pigmentation of skin, herpes, polyneuritis, altered hematopoiesis, degeneration of liver and kidneys." (26, p 101)
"A mild irritant to skin, eyes, mucous membranes." (26, p 133)
Diphenyl amine "May be irritating to mucous membranes. Methomeglobinemia has been produced' experimentally, symptoms similar to aniline, but diphenylamine is less toxic." (26, p 387)

TABLE IV
(Continued)
CompoundMerck Index Toxicity Information and TSCA
Committee Findings
Nitrobenzene "May cause headaches, drowsiness, nausea, vomiting, methemoglobinemia with cyanosis, (p 737)
It
TSCA Committee Testing Recommendations:
Carcioogenicity Mutagenicity Environmental Effects
"Nitrobenzene is a relatively persistent substance in the environment. Its low volatility, stability to light, and low water solubility indicate that bioaccumulation is possible. Acute effects have been demonstrated in fish. Nitrobenzene inhibits growth in yeast, and is toxic to various soil bacteria and microorganisms." (23, p 26)
Ortho-nitrophenol Toxicity data given for paranitrophenol which indicates the paranitrophenol to be most toxic of the three isomers. "Animal experts have shown CNS depression, methemoglobinemia, hyperthemia." (26, p 74) Refers to toxicity data under Dinitrophenol (26, p 38) "Highly toxic material. Readily absorbed through intact skin. Vapors absorbed through respiratory tract. Produces marked increase in metabolism and temperature, produce sweating, collapse, death. May cause dermatitis, cataracts, weight loss, granulacytopenia, polyneuropathy, exfoliative dermatitis."
3ara-nitroaniline "Acute exposure can cause methemoglobinemia, cyanoisis. Chronic exposure may cause liver damage." (26, p 736) *

TABLE IV
(Continued)
CompoundMerck Index Toxicity Information and TSCA
Committee Findings
"Ingestion of even small amounts may cause nausea, vomiting, circulatory collapse tachypnea, paralysis, convulsions, coma, greenish or smoky colored urine, necrosis of mouth and G.I. tract, icterus, death from respiratory failure, sometimes from cardiac arrest. Average fatal dose is 15 g but death from 1.5 g has been reported. Fatal poisoning may also occur by skin absorption following application to large areas. Chronic poisoning with renal and hepatic damage may occur from industrial contact." (26, p 810)
1,1,2-Trichlorethane "Irritating to eyes, mucous membranes, and, in high concentrations, narcotic." (26 p 1058)
TSCA Committee Testing Recommendations:
CarcinogenicityMutagenicityTeratogenicity
Reasons given for additional evaluation, include quantities produced population
* exposure and the lack of any health effects data on the compound (24, p 16688)

19
Wastewater Parameter
B0D5I
NFS1
Fecal Coliform
NH3-N
Phenolics
Hg
Col or (chloroplatinate units)
Daily Average
30 mg/1
30 mg/1
200/100 ml
10 mg/1
0.01 mg/1
0.001 mg/1
75 CPU
2. WASTEWATER CHARACTERIZATION
Maximum
45 mg/1
45 mg/1
400/100 ml
15 mg/1
0.015 mg/1
0.0015 mg/1
120 CPU
In their report (1), Engineering Sciences* summarized available
data on Salsbury process wastewater and the raw combined industrial-
domestic wastewater at the treatment plant. These summary data
are reproduced in Tables V, VI, and VII.
The 1972 through 1974 BOD5 and NFS data for the municipal
treatment plant in Table VIII is taken from Stracke and Baumann
(4‘, p 5). The quarterly effluent concentrations for 1976 and 1977
are taken from the Charles City Discharge Monitoring Reports (27).
An examination of this Table would indicate that the 1972 through
1974 removal efficiencies ranged from 42 to 84 percent for BOD5 anjd from 68 to 93 percent for NFS.
Salsbury discontinues operation for a two-Week period in
August of each year in order for employees to take annual leave.
Stracke and Baumann (4, p 6) presented data covering municipal
*57 Executive Park South, N.E., Suite 590, Atlanta, Georgia. 30329
I
I

20
TABLE V
WASTEWATER CHARACTERIZATION
SALSBURY' LABORATORIES INDUSTRIAL WASTEWATER*
Parameteri
Mean Std. Dev. High/Low Period
i* jFlow (mgd) 0.449 0.183 1.102/0
TOC (mg/1) 410 182 1500/45
B0D5 (mg/1) /486 259 1330/60 1/71-2/76
COD (mg/1)** 1190
NFS (mg/1) 7.02 5.37 27.3/0.33 4/75-2/76
NH3-N (mg/1)1
73.6 55.3 253/1.6 2/74-2/76
Phenolst
25.7 58.2 187/0 2/74-2/76
Co lor (cpu) 8234 5152 17500/25 5/75-2/76
PH -- — 9.1/2.4 5/75-2/76
As (mg/i) 6.08 T-- 145/0
Hg (mg/1) — —
Heavy Metals (mg/1) — —
TD S (mg/1) 5445 — 10290-
NO 3-N (mg/1) 3.1 4.5-
NO2-N (mg/1) 4.3 — 60-
Ch loride (mg/1) 529 —
Mn (mg/1) 39.4
Calcium (mg/1) 450 —
Sodium (mg/1) 1338 —
Sulfate (mg/1)i
2130
Zrj (mg/1) 0.31 —
*/\fter Engineering Sciences (1 p IV-9). ** Calculated from TOC

21
TABLE VI
WASTEWATER CHARACTERIZATION
CHARLES CITY COMBINED DOMESTIC AND INDUSTRIAL WASTEWATER INFLUENT*
' 1
ParameterI
Mean Std. Dev. High/Low Period
FI ow (mgd) 1.722 0.55 5.90/0.61 1972-1975
1.513 •1967-1971
BC D5 (mg/1) 204 37 520/60 1972-1975
239 1957-1971
MI 'S (mg/1) 188 148 540/56 1972-1975
HH3-N (mg/1) 29 — 64/17 1976
ipH 7.3 0.45 9.0/5.6 1972-1975
Temperature (°F) 54 12 72/37 1972-1967
Color (cpu) n 1916 1082 4600/45 9/75-12/75
Phenols (mg/1) 5.8 5.7 15.3/0 7/75-12/75
Hg (mg/1) 0.0014 0.0015 0.0028/0 7/75-12/75
As (mg/1) 1.83 1.33 5.62/0 7/75-12/75
Total Heavy Metals (mn/1)U---------------------------------------
0.48 0.32 03/C.045 7/75-12/75
*After Engineering Sciences (1, p IV-8).
#

(
I .
22
. TABLE VII
CHARLES CITY MUNICIPAL WASTEWATER TREATMENT
INFLUENT PLANT LOADINGS*
Total Load
Salsbury * Contribution** Domestic
ContributionParameter Load C//oj
Flow (regd) 1.722*** 0.449 26 0.721
BOD (Ib/day) 2930 1704 58 1226
NFS (lb/day) 2700 26 0.1 2674n|3-N (lb/day)
395 276 70 120
Color (cpu-l/day)**** 12,500 x 106 14,000 x TO5— 0
Phenol (lb/day) 83.3 (114) — 0
As (lb/day)i
26 23 86 0
♦After Engineering Sciences (1, P IV-10)
♦♦Percentage Calculations by SVAN
♦♦♦Includes infiltration and inflow
* ***cpu-l cpu-1iter

23
TABLE VIII
. CHARLES CITY MUNICIPAL WASTEWATER TREATMENT PLANT
INFLUENT AND EFFLUENT B0D5 AND NFS
Yr MoFlow3 mgda
PrecipB0D5 NFS
Total Salsbury in.b Inf Eff %Rem.
Inf Eff ©/
to
Rem.
01 — _02 0.888 0.423 0.7 200 62 69 160 38 7603 0.941 0.428 2.1 210 132 37 164 38 7704 0.991 0.421 3.0 240 74 69 291 28 9005 1.120 0.504 2.8 200 44 78 214 24 89
72 06 0.914 0.420 2.9 290 46 ’ 84 203 18 91| 07 1.046 0.347 6.9 150 39 74 172 21 83
08 1.083 0.256 1.8 150 28 81 195 22 8909 1.387 0.397 12.3 200 60 70 160 20 8S10 1.872 0.362 5.8 140 48 66 182 24 87
1 11 2.051 0.418 2.2 168 48 71 160 33 79| 12 1.720 0.282 1.5 260 151 42 155 33 79
Me an 1.274 0.387 42.0C 201 67 67 187 27 85
01 1.489 0.642 — 230 108 53 150 38 7502 1.233 0.651 1.5 220 45 80 200 .50 7503 1.934 0.429 3.1 170 44 74 134 35 7404 3.172d 5.7 175 44 75 187 32 8305 2.404 0.416 5.5 200 79 61 157 29 82
73 06 1.425 0.473 2.4 220 42 81 195 17 9107 1.080 0.452 2.9 180 40 78 180 13 93
1 08 1.001 0.209 2.5 ■ 240 39 84 117 20 8309 1.101 0.500 9.5 250 80 68 198 42 7910 1.373 0.500 1.6 200 80 60 242 44 S211 1.004 0.565 1.8 260 114 56 198 34 8312 0.891 0.500 2.2 280 no 61 160 35 78
Mean1
1.358 0.485 38.7C 219 87 69 177 32 82
01 0.932 0.639 0.7 210 103 51 179 45 7502 0.988 0.524 1.1 190 79 58 152 32 7903 1.309 0.497 1.7 200 no 45 142 38 7304 1.642 0.435 2.9 190 75 61 111 36 6305 1.828 0.475 6.6 ' 220 55 75 172 37 78
74 06 2.340 0.415 6.9 130 , 35 73 89 23 7407 1.684 0.487 2.8 220 86 61 132 •16 8308 1.265 0.200 1.1 160 54 66 163 13 9209 1.021 0.449 0.8 240 92 62 177 .' 40 77IQ 1.252 0.435 3.0 270 105 61 181 41 7711 0.955 0.382 1.0 270 70 74 248 40. 3412 0.919 0.386 0.5 220 93 5S 243 51 79
Mean1
1.345 0.444 22.2C 210 80 62 166 34 79

24
TABLE VIII
(Continued)
YrFlow mgda
PrecipBOD5 NFS
MoTotal Salsbury Inf Eff % Inf Eff %
in.b Rem. Rem.
1/01to 1.125 __ . -- — 100 — — 51 —
3/31
4/01to 1.501 -- -- -- 55 — — 32 —
6/3076
7/01 -
to 1.102 — — — 49 — — 24 —
9/30
10/01to 1.045 — -- — 70 — -- 37 —
12/31
Meani
1.193 -- — — 68 — 36 —
1/01to 1.247 — — -- 64 -- — 35 --
3/31
4/01to 1.173 — — . — 53 ("
6/3077
7/01l to 1.384 — — 45 — — 22 —
19/30
!
10/01to 1.414 — -- — 68 -- 34 —
12/31
iKeani
1.31 — — 59 — — 30 —
• (a) Multiply by 3785 to obtain cu m/day.
(b) Multiply by 2.54 to obtain cm.I
(c) Total.
(d) Total domestic and industrial.

treatment plant performance during five shut-down periods which included 1970 through 1974. The data for these five periods
indicated a mean influent BOD5 and NFS of 134 and 182 mg/1,
respectively. For the effluent, the respective concentrations were
18 and 15 mg/1. These values correspond to a mean BOD5 removal
efficiency of 87 percent and a NFS removal of 92 percent. In their
report which resulted from pilot plant treatability studies of
the Salsbury process, they presented data to show the toxic effect
of Salsbury's wastewater. Based upon the pilot plant studies and
the municipal treatment plant data they concluded, "The present
municipal treatment facility could meet state effluent standards
when treating domestic wastewater from the city, but could not
satisfy the state requirements when treating the combined
wastewater." (4, p 69).
3. MUNICIPAL WASTEWATER SLUDGE DISPOSAL
The municipal treatment plant generates an estimated 1.0
mi gal (3800 cu m) per year of sludge with an estimated solids
content of five percent (29). These values correspond to a dry
solids production of about 430,000 lb (196,000 kg) per year.
Prior to 1964, the old city dump site was used for disposal of
this sludge (20, p 1). Since 1974, the sludge has been disposed
of on private farmland (Winterink Farm). A small amount, less than
10 percent, has also been disposed of on cropland and garden plots1.
in' the immediate vicinity of the municipal treatment plant.
4. MUNICIPAL SLUDGE DISPOSAL SITE —
Up to 1976, the Winterink Farm sludge disposal area consisted

of about 200 acres (81 ha). In 1976, 80 acres of this farm were
so d for private development. The sludge was applied to the initial
200 acre plot (81 ha) by surface spreading. The city now uses
subsurface injection on the remaining 120 acres (49 ha) of the
Winterink Farm. According to the Floyd County Soil Conservation
Agency, this plot contains 6 to 10 in. (15 to 25 cm) of loam with
a clay subsurface.
Hickok and Associates made 15 soil borings of various depths
upjto 25 ft (7.6 m). Arsenic concentrations for the borings ranged
from 6 to 52 mg/kg (20, p 39). One of the borings was analyzed
for! four organic compounds with the following results (20, p 44):
Compound Concentration mg/kg, dry weight
1,1* 2-tric'nioroethane
Nitrobenzenei
Ortho-nitroaniline PhJnol
<0.1
0.2
2
<0.1
Hickok and Associates concluded that the Winterink Farm
represented a small potential for groundwater pollution but did
recommend a continuing monitoring program for sludge application
rates. No data was presented on the water quality of surface
I „runoff.
D.
1.The
e nd
CEDAR RIVER
HYDROLOGY
The Cedar River has five USGS stream gauging stations on it.
two stations of primary interest are the station at Charles City
the station at Janesville, which is 45.2 miles (72.7 km)

downstream from Charles City. Pertinent information on these two
stations is as follows:
Charles City Gauging Station (28, p 91)
Stream Mile: 252.9 miles (406.9 km)
Drainage Area: 1.054 sq miles (2.730 sq km)
Period of Record: October 1964 to Present (1976)
Average Discharge: 687 cu ft/sec (19.5 cu m/sec)
Extreme for Period of Record:
Maximum Discharge: 21,000 cu ft/sec (595 cu m/sec)
Minimum Discharge: 86 cu ft/sec (2.44 cu m/sec)
Extreme Outside Period of Record:
Flood of March 27, 1961: 29,200 cu ft/sec (827 cu m/s
Ten Year 7-Day Low Flow (1367-1976): 88.3 cu ft/sec
(2.50 cu m/sec)
Janesville Gauging Station (28, p 93)
Stream Mile: 207.7 miles (334.2 km)
Drainage Area: 1,661 sq miles (4,301 sq km)
Period of Record: Start 1904, not continuous,
October 1945 to Present (1976)
Average Discharge: 780 cu ft/sec (22.09 cu m/sec)
Extreme for Period of Record:I
Maximum Discharge: 37,00G cu ft/sec (1,050 cu m/sec)
Minimum Discharge: 28 cu ft/sec (0.79 cu m/sec)
Extreme Outside Period of Record:
Flood of March 17, 1945: 34,300 cu ft/sec (971 cu m/s

28
2. WATER QUALITY STANDARDS
Depending upon the stream segment, the Iowa Water Quality
Standards (30) specify primary body contact (Class A) and wildlife,
aquatic life, and secondary body contact (Class B) water uses.
Within the stream reach of interest, these uses are specified as
fol1ows:
Stream SegmentWavierly Impoundment to Dam at Nashua
Nashua Impoundment Dam to Chickasaw-Floyd Co. Line
Nashua Impoundment to Charles City Dam Mo. 2
Charles City Impoundment Dam No. 2 to
Water Use
A B
X
X X
X
X X
tha
r.ot
ten
'1 line of Sec. 2, T95N, R16W, Floyd County
The standards which become effective August 31, 1977, specify
t the following concentrations of chemical constituents "...shall
be exceeded at any time the flow equals or exceeds the seven-day,
yr low flow unless the material is from uncontrollable non-point
sources." (30, Ch 16, p 4).
Arsenic 0.1 tr.g/1
Barium (total) 1.0 mg/1
Cadmium (total). 0.01 mg/1
Chromium (total hexavalent) 0.05 mg/1
Copper (total) 0.02 mg/1

(
29
Cyanide 0.02 mg/1*
Lead (total) 0.1 mg/1
Mercury (total) 0.2 yg/1
Phenol 0.1 mg/1
Selenium 0.1 mg/1
Zinc (total) 1.0 mg/1
Water Uses**
Ammonia Nitrogen (N) B(W) B(C)
2.5 mg/1
1.0 mg/!
November 1 to March 31 5 mg/1
April 1 to October 31 2 mg/1
E. LABOUNTY DISPOSAL SITE
The location of the LaBounty site is shown in Figure 2.
Salsbury has used this site since 1953 (14, p 12) for disposal of
wastes resulting from their manufacturing operations. According
to Salsbury officials (31), the wastes in the site include the
ollowing:
1. Gypsum Waste generated by lime neutralization of:
a. Waste sulfuric acid from nitration processes
b. Waste sulfuric acid from chlorosulfonation processes
2. Arsenic wastes from:
a. Compound 1 (3-Nitro-4-hydroxypher.ylarsonic acid)
b. Compound 3 (4-Nitrophenylarsonic acid)
3. Carbon cakes
*Lpwest detectable concentration.
**MU" means warm water and "C" means cold water.

30
4. Reaction heels from:
a. Sodium phenolsulfonate
b. Lithium phenolsulfonate
c. Zinc phenolsulfonate
d. Aluminum phenolsulfonate
e. Sodium neta-nitrobenzoate
f. Sodium glycolate
5. Distillation residues from:
a. Methanol still bottoms
b. Extraction plant residues
c. Glycol still bottom
d. TCE low boilers
e. Chloro-nitrotoluene bottoms
6. Incinerator ashes (not from chemical incineration)
7. Miscellaneous
a. Waste chemical drums
b. Floorsweepir.gs
c. Dust collector clean out
d. Miscellaneous maintenance debris
Salsbury officials also indicated (31) that an undetermined
amount of municipal refuse was deposited in the site in 1933. The
vast majority of the waste consist of chemical sludges resulting
from the company's liquid process wastewater treatment operations.
These sludges include gypsum waste resulting from acid neutralization
ani precipitated arsenical waste. Ilickok and Associates estimated
sbury's expected 1977 waste production as shown in Table IX and

TABLE IX
EXPECTED 1977 WASTE PRODUCTION* SALSBURY LABORATORIES
iI „ , Volume
Source Probable Components (cu ft)**
Adid Waste Treatment Plant:
Ac id Neutralization Gypsum (CaS04) 99% pure 800,000
ArsenatePrecipitation
Production Plant Processes:
O.N A Tar Cake
Calcium arsenate^(Ca3(As04)2) and some arsenite (Ca3(As03)2)
100,000
Ortho-nitroaniline, 4-Amino-3- nitrobenzenearsonic acid, Bis-4- amino-3-nitrobenzenearsonic acid
21,000
Hydrolysis Tar Cake
Reaction Tars
Distillation Heel (1iquid)
Tar Cake
Reaction Heel (liquid)
Arsenates of calcium and heavy metals
Insoluble arsenical tars, para- nitroanil ine; some 4-nitro- phenylarsonic acid
Para-nitroaniline
Para-nitroaniljne
Phenol
1,875
900
2C0
280
2,800
Gyp-Carbon Cake
Carbon Cake
TCE Low-Boilers
Phenol
Phenol
1,1,2-Trichloroethane
1,155
• 65
NA(liquid)
Extraction Heel(solid and liquid)
iLiquid Waste
1,1,2-Trichloroethane
Nitrobenzene
100
Othert
Total
Wastes None of the above 1,280
929,656
*^fter Hickck and Associates (14, p 15).
**Multiply by 0.0283 to obtain cu m.

32
characterized and quantified (14) the contents of the LaBounty
site and the surrounding soil on the basis of information obtained
from 26 soil borings. They estimated the area of chemical fill
to be 8.5 acres (3.4 ha) and the depth of the fill to vary from
0 to 30 ft (0 to 9m). The volumes and average dry densities of
the chemical sludge were reported (14, p 30-33) as follows:
Material Volume, cu ft* Dry Density, lb/cu ft
Chemical Sludge 6,416,000 55.2
Underlying Soil 5,862,000 109.0
Surrounding Soil 15,540,000 109.0
Concentrations of arsenic from selected depths of the 26 soil
borings ranged from 2 to 72,600 mg/kg on a dry weight basis (14, p 35),
The total estimated weights of arsenic and. mean concentrations were
fol1ows:
Material Weight, lb** Mean Concentration, nq/kg
15,000
70C
Chemical Sludge 5,223,000
Underlying Soil 541,000
Surrounding Soil 360,000 2,200
In addition to arsenic, Hickok and Associates analyzed composite
samples from six soil borings for four organic compounds. These data
are reproduced in Table X.
In their report (19, p 32), Hickok and Associates concluded that
the chemical fill and contaminated soil in the LaBounty site was
“■Multiply by 0.0283 to obtain cu m.

TABLE X
POUNDS* OF ORGANIC COMPOUNDS AT LABOUNTY SITE**
Bor“ing 1,1,2-TCE Nitro-Benzene ONA Phenol
L- 1 <18 270 12,000 1,400
L- 2 51,000 • 135,000 713,000 12,000
L- 4 100 6,900 238,000 3,700
L- 6 14,800 39,200 155,000 1,900
L- 8 250 1,500 7,600 1,300
L- 17 3,500 97,400 406,000 6,700
TC TAL 69,700 280,000 1 ,530,000 27,000
♦Multiply by 0.454 to obtain kg.
**^fter Hickok and Associates (14, p 64). Multiply by 0.454 to

34
hazardous and recommended development of plans for removal of the
material to an approved landfill site. Interim measures recommended
included control of aquifer pumpage and a groundwater monitoring
program.
In an executive order issued by IDEQ in December of 1977,
Salsbury was directed to stop using the LaDounty site and was also
required to remove all material at the site. In response to this
order and a number of news releases by IDEQ and EPA, Salsbury
reported their position in a full page statement in the Das Moines
Register (32). In this newspaper, they released a list of the
chronological events relating to Salsbury solid waste disposal
operations. For background information, this list of c-vonts has been
reproduced in its entirety as follows:'
”1953, July 10 - Salsbury notifies Iowa State Department of Health (ISDH) results of test drilling in LaDounty site. Type of wastes tc be deposited described."
"1953, August 7 - ISDH informs Salsbury it can start disposing of the wastes with city garbage at the LaDounty site. Salsbury's first disposal of material at site."
"1953, August 10 - Letter from Iowa Geological Survey (IGS) indicating use .of the LaDounty site would be okay.'!
"1953, August 25 - Letter from ISDH approving use of the LaDounty site."
"1953, August 31 - Salsbury letter informs ISDH that recommended four sand point wells are installed."
"1953, November 13 - Salsbury notifies ISDH of results of well samples taken on 9/04/53, 10/02/53, and 10/22/53."
"1953 to 1972 - Salsbury reports results of well testing to ISDH."
"1953, May 15 - Salsbury notifies ISDH that amount of material being deposited is four times greater than in 1952."
"1S5C, October 5 - The LaDounty si Pollution Control Commission
te on the agenda for the Iowa Water meeting. Salsbury present."

/
35
"1966, December 2 - Three additional test wells at the LaBounty site."
"1967-, April 12 - Dr. E. R. Baumann, Iowa State University (ISU), was engaged by Salsbury Laboratories as its pollution control consultant."
"1963, January 16 - Salsbury and consultant report "Disposal of Solid Wastes from Salsbury Laboratories Production Operations" to ISDH and IGS."
"1970, July 20 - IGS recommends observation wells into the'Cedar Valley limestone with a water analysis program be carried out over several seasons."
"1970, September 3 - Meeting of IGS and Salsbury recommends monitoring wells be put into limestone at LaBounty site."
"1972, January 13 - IGS communicates to Salsbury initial thoughts on criteria and sites for hazardous waste disposal."
"1972, May 9 - Letter from IGS to Salsbury on sites that have deep beds of Juniper Hill shale (blue clay)."
"1972, September 13 - IGS, Salsbury meeting. State proposed four wells into the Cedar Valley Aquifer at LaBounty site."
"1973, May 12 - IGS reports Electrical Resistivity results on proposed Rockford site."
"1573, May 29 - IGS reports drilling logs from test drilling on Rockford site looks good."
"1973, December 4 - First soil and bedrock investigation report at Rockford site by Soil Exploration Company."
"1974, February 24 - Salsbury purchases a 140.68 acre farm southwest of Rockford, Iowa, with intentions of this farm being developed as a hazardous waste disposal site for Salsbury's chemical wastes. This farm has the thick deposit of Juniper Hill clay thought to be desirable for this purpose."
"1974, June 18 - Salsbury notifies DEQ of waste materials destined for future hazardous landfill site."
"1974, September 11 - IGS visits Salsbury and LaBounty site. Indicated that IGS would drill 7 or 8 sets of wells 'into the Cedar*Valley limestone."
"1974, September 25 - IGS proposal for groundwater monitoring program at LaBounty site. Recommended 7 drive point wells and 12 drilling wells.

"1974, December 20 - Meeting of DEQ, IGS, Salsbury on LaBounty site. Salsbury consultant cautions against drilling in the actual dump site."
"1975, July 9 - Signed agreement with DEQ granting them $4,000 toward their expenses for drilling 3 wells at LaBounty."
"1976, December 15 - Meeting with DEQ, IGS, INRC, ISHL, Salsbury to discuss findings of November 1976 report on LaBounty site by IGS and DEQ."
"1977, January 18 - Meeting with DEQ and Salsbury on subject of solid waste disposal and wastewater treatment."
"1977, February - EPA carries out investigation of Salsbury disposal site and river sampling."
"1977, February 21 - Salsbury responds to DEQ request for information from January 18, 1977, meeting."
"1977, February 25 - Salsbury meets with DEQ, EPA, IGS, INRC, and Engineering-Science (ES) on solid waste disposal."
"1977, March 17 - Salsbury receives first DEQ Executive Order."
"1977, April 13 - Salsbury responds positively to all provisions of March 17 Executive Order."
"1977, April 29 - Date of Amended Executive Order. Expanded on the same points as in the original Order."
"1977, May 20 - Salsbury responds positively to all provisions of amended Executive Order of April 29."
"1977, June 9 - Date of Amendment to DEQ Executive Order."
"1977, June 10 - INRC approves construction of dike at LaBounty site.
"1977, June 13 - Salsbury sends DEQ soil testing program for Rockford site."
"1977, June 24 - Salsbury responds positively to Executive Order as amended June 9, 1977."
"1977, June 28 - DEQ indicates that proposed Soil Testing Program at the Rockford site is adequate."
"1977, July 1 - DEQ approves construction of dike at LaBounty site.
"1977, July 29 - Copy of bid package for interim storage basin sent to DEQ."

"1977, October 20 - Letter from Salsbury transmits to DEQ report entitled, "Preliminary Engineering Report for Wastewater Treatment" authored by Engineering-Science (Salsbury consultant). Request prompt review."
"1977, November 8 - Meeting at DEQ. First agreement to a reasonable approach to solid waste characterization.".
"1977, November 16 - Meeting at Salsbury with DEQ. Agreement on solid waste stream characterization. Draft of executive order presented for review."
"1977, November 28 - Salsbury attorney and DEQ agree to minor changes in draft of executive order."
"1977, December 9 - Salsbury receives phone call from DEQ advising Salsbury the contents of a new Executive Order to be issued December 14, 1977. This Order drastically different than drafts previously agreed upon."
"1977, December 12 - Phone conversation between Salsbury and DEQ. Salsbury not given chance to meet with DEQ before the issuance of Executive Order."
"1977, December 15 - Salsbury receives Executive Order, ceases all disposal operations at LaBounty site and stops all chemical production."
"1977, December 16 - DEQ approves use of the interim storage basin which is lined with two clay and one polyethylene liners."
"1978, January 3 - Salsbury resumes limited chemical production."
"1973, January 4 - DEQ withdraws approval to use the interim storage basin because of failure in the top clay liner."

38
IV. SAMPLING METHODOLOGY, ANALYTICAL PROCEDURE, AND DATA PRESENTATION
A. INTRODUCTION
It is the purpose of this chapter to present all the data
resulting from SVAN activities in the Charles City area. These
activities have been of a generally unfolding nature and, with time,
have expanded in scope as SVAN became aware of more aspects of the
problem. Although there have been a number of field trips to Charles
City and the surrounding area for various reasons, including recon
naissance and collection of sediment and fish flesh samples, three
major field efforts have been mounted by SVAN for documenting various
problems in the Charles City area.
The first effort took place in August of 1974 and was conducted
for routine municipal wastewater compliance monitoring purposes. This
five-day effort was limited to collection of samples from the Charles
City municipal treatment plant influent and effluent. Samples were
collected for analysis of conventional parameters, heavy metals, and
some trace organics.
The second effort took place in August of 1375 and, as a result
of information gained during the August 1974 investigation, was of an
enlarged scope. In addition to sampling of the municipal treatment
plant, samples of Salsbury's process wastewater were collected and
water samples of the Cedar River were also collected. This 1975
survey was generated within the Division primarily for the purpose of
evaluating the impact of Salsbury's wastewater upon the municipal
treatment plant. At this time, SVAN was not aware of Salsbury's
solid waste disposal activities. 1

39
The third major effort took place in August and September of 1977.
This investigation was much broader in scope and was conducted at the
request of IDEQ. By this time SVAN personnel had become aware of
Salsbury's LaBounty disposal site operations. In addition, certain/
compounds which the Division had identified in samples collected from
previous surveys were known to be on the list of 129 priority pollutant
compounds compiled by the EPA Effluent Guidelines Division in Washington.
With these observations and background information, the 1977 survey was
structured, primarily, to determine the relative magnitude of the
various sources of contaminants into the Cedar River and to determine
whether or not a "pathway-to-man" existed for any of the potentially
toxic compounds. Consequently, in addition to the municipal treatment
plant and Salsbury's process wastewater, crop and soil samples, air
samples, receiving stream samples, and private and municipal well water
samples were also collected and analyzed. '
The following chronological presentation and discussion presents
all the data resulting from SVAN activities from 1974 up through 1977.
Unless otherwise specifically stated, the data and observations are
EPA, Region VII, data.
B. AUGUST 1974 SURVEY
During the period beginning August 27 and ending September 9,
1974, five sets of time-composite (approximately 24-hr) samples were
collected from the Charles City treatment plant. Three separate
samplers were used at each sampling point. One sampler was used to
collect samples for conventional analyses including the oxygen
demand tests, the nutrient series, and heavy metals. Another sampler

with prepreserved (sodium hydroxide) collection container was used to
collect samples for cyanide analysis. The third sampler was used to
collect samples for trace organics analyses. The set-up for trace
organics sampling included a Teflon intake line, sampler, and a
solvent rinsed (hexane) glass collection container. A sampler blank
was not collected.
The samplers used at each station were as follows:
Influent: Sampler Parameters
Brailsford EPI* Cyanide
QCEC-CVE** Conventional
Sigmamotor WA-2*** Trace Organics
Effluent: Sampler Parameters
Sigmamotor WA-2 Cyanide
ISC0 1392**** Conventional
Sigmamotor WA-2 Trace Organics
Table XI summarizes the data resulting from the August 1974
sampling effort. The raw data may be found in Appendix A, Tables A-l
and A-2. Table XI shows the average removal efficiencies of the
plant for the various parameters using the arithmetic mean loadings.
*Brailsford and Company, Milton Road, Rye, New York. 10580.
**Quality Control Equipment Company, 2505 McKinley Avenue,Des Moines, Iowa 50315
***Sigmamotor, Inc., 14 Elizabeth Street, Middleport,New York 10405
**x*Instrument£tion Specialties Company, P. 0. Box 5347, Lincoln Nebraska 53505

TABLE XI 41
CHARLES CITY MUNICIPAL SEWAGE TREATMENT PLANT
LOADING AND REMOVAL EFFICIENCIES
August 1974
Parameter
Loadings ,* lb/day
%
RemovalInfluent Effluent
Min. Max. Mean Min. Max. Mean
B0D5 1700 3000 2200 500 930 700 68COD 4500 9000 6500 - 1800 3200 2600 60
NFS 250 1100 750 170 450 320 57
nh3-n 190 300 240 230 310 270 —
NO2-NO3-N <0.39 20 <5.2 0.39 3.3 1.2 —
TKN 270 415 400 350 490 410 —
Total P 71 99 85 61 88 7S 7
Hg (Total) 0.021 0.075 0.046' 0.013 0.031 0.019 59Cr (Total) <0.06 <0.083 <0.054 0.048 0.10 <0.069 —
Cu (Total) 0.42 0.74 0.63 0.22 0.39 0.29 95
Sn (Total) 87 200 150 33 220 150 0Ni (Total) 0.39 1.1 0.67 0.22 0.54 0.43 36
Cd (Total) <0.06 <0.07 <0.06 <0.05 <0.07 <0.05 —
Zn (Total) 1.4 2.9 2.3 1.1 4.0 2.0 13
Cyanide <0.097 0.27 <0.15 <0.097 0.13 <0.12 —
1,1,2-Trichi orethane 14 300 97 19 140. 53 45
2-Etr.yl H'exanol <0.97 150 61 <0.1 22 <3.7 >85
Ortho-nitrcani 1 i ne 9.7 150 69 5.8 92 45 35
Para-nitroaniline 21 260 140 7.7 140 73 48
Diphenyl amine 1.9 13 7.1 0.97 9.5 5.S IS
Phenol <0.2 38 <13 <1.9 <2.6 <2.4 — -*
* Multiply by 0.45 to obtain kg/day

42
The following quality control data shows the recovery values for
spiked water samples for the various trace organics.
Parameter Concentration, mq/1 Percent Recovery
1,1,2-Trichlorethane—
2-Ethyl Hexanol 0.6 90
Ortho-nitroaniline 0.6 98
Para-nitroaniline 0.6 87
Diphenyl amine 0.2 103
Phenol 1.0 80
The tabulated organics data were not corrected for these
recovery values.
C. AUGUST 1975 SURVEY
1. SAMPLING STATIONS
The field investigation which took place between August 19
and 26, 1975, was significantly expanded in scope over the 1974
survey. Sampling points included the municipal treatment plant
influent and effluent, the municipal wastewater sludge, Salsbury's
process wastewater discharge to the city sewers, and the Cedar River
upstream and downstream from Charles City. In addition to wastewater
chemistry, a toxicity test was conducted on the municipal treatment
plant effluent.
The sample collection points are identified as follows:
Station No. River Mile* STORET No. Description
1 253.4 001905 Cedar River about 50 yd .(46 m) upstream from Main Street Bridge
2 HA 001906 Salsbury Laboratories process wastewater discharge (equalization basin effluent)
^Multiply by 1.61 to obtain km.

43
Station Mo. River Mile* STORET No. Description
3 252.9 001907 - Cedar River - USGS gauging station
4 252.6 001908 White Motors process wastewater - storm sewer at river
5 NA 000033 Municipal wastewater treatment plant influent
6 . NA 001909 Municipal wastewater treatment plant raw sludge
7 MA 001910 Municipal wastewater treatment plant digested sludge out of second digester
8 MA 001911 Municipal wastewater treatment plant sludge supernatant
9 251.8 000034 Municipal wastewater treatment plant effluent
10 242.1 001912 Cedar River at Nashua dam
11 207.6 001913 Cedar River at Janesville
Figures 4, 5, and 6 show the locations of these sampling stations.
2. SAMPLING METHODOLOGY
a. CEDAR RIVER AT CHARLES CITY (STORET No. 001905)
The sample collection point was located on the left bank (facing
downstream) of the Cedar River approximately 50 yd (46 m) upstream
from the Main Street Bridge. During the August 19-26 period, five
sets of grab samples were taken for heavy metal analyses and four
sets of grab samples were collected for the purpose of determining
background concentrations of trace organics. In addition to these
grab samples, three field composites for trace organics analysis of the
^Multiply by 1.61 to obtain km.

44
e
(
i.
FIGURE 4 LOCATION MAP - SALSBURY LABORATORIES, MUNICIPAL- UASTEUATER TREATMENT PLANT,
USGS GAUGING STATION, ETC.

45
(FIGURE 5. LOCATIO:; MAP - NASHUA SAMPLING SITE5


47
river water were obtained by using a battery operated Sigmamotor WD-2I
sampler with a Teflon intake line and a column accumulator installed
in the sampling train. The accumulator consisted of a glass
chromatography column filled with approximately 30 cu cm of Rohm and
Haas XAD-2 resin. In order, proceeding from source to waste, the
sampling train consisted of a 0.125 in. (0.318 cm) ID Teflon intake
line, a column accumulator, the sampler peristaltic pump and a
container for measuring the volume of water passed through the
column. The pump rate of the sampler was approximately 50 mi /ini n
and each accumulated column resulted from between 2.0 and 3.7 gal
(7.7 and 14 1) of river water. Column accumulation time ranged
between 18 and 32 hr.
The raw data resulting from samples collected at this station
may be found in Appendix B, Tables B-l and 8-2.
b. SALS3URY LABORATORIES PROCESS WASTEWATER (STC-RET No. 001906)
This process wastewater was sampled at the effluent of the
• company's equalization basin immediately upstream from the point
where lift station pumps discharge the waste to the City sewers.
This sampling point is upstream from the point of entry of the
company's sanitary wastewater discharge.
All samples collected at this point were tine-composited over
approximately 24-hr periods. An ISC0 Model 1392 sampler with
discrete bottle base was used to collect, samples to be analyzed for
.heavy metals and other routine parameters. Two Sigmamotor Model HA-2
samplers were used tc collect samples for trace organics analysis.
C.ne of the Sigmamotor samplers was used to pump the wastewater through

48
a column in a manner similar to that described for the installation at
the upstream Cedar River station (STORET Mo. 001905). The other
Sigmamotor unit was used to collect water samples. This unit was
also fitted with a Teflon intake line and a 1-gal (3.8-1) glass solvent-
rinsed sample collection container. The Teflon and sample collection
container were solvent rinsed. No laboratory blanks were ran on the
silicone tubing.
In total, six sets of samples were collected for metals analysis,
six sets of water samples for trace organics analysis, and fou*- rosin
columns for extraction and analysis. The raw data resulting from this
sampling may be found in Appendix B, Tables B-3 through B-5.
c. CEDAR RIVER AT USGS GAUGING STATION (STORET Mo. 001907)
No samples were collected at this location. The USGS discharge
measurements were used to calculate stream loadings at the upstream
Cedar River station (STORET No. 001905).
d. WHITE MOTORS PROCESS WASTEWATER - STORM SEWER AT RIVER (STORET
No. 001 90S)
According to the superintendent of the Charles City municipal
sewage treatment plant, some process wastewater discharge from Wnite
Motors is discharged to the river via a city storm sewer. Consequently,
the storm sewer discharge was sampled at its outfall to determine
whether or not this was an additional source of contaminants in the
river. Because of the nature of the site, no flow measurements were
made on this discharge. It should be pointed out that this discharge
may have included wastev.ater from other sources. Daily ,24-hr-time-
composites were collected using a Brails ford EP-1 battery operated
sampler. Between August 19 and 26, six sample sets were collected.

4 9
Primary analytical emphasis was placed on heavy metals analysis.
The resulting raw data can be found in Appendix B, Table B-6.
e. CHARLES CITY MUNICIPAL WASTEWATER TREATMENT PLANT
Sampling at the municipal treatment plant included five
collection points which were the treatment plant influent, effluent,
raw sludge, digested settled sludge, and the digester supernatant,
i. MUNICIPAL TREATMENT PLANT INFLUENT (STORET No. 000033)
The raw combined domestic and industrial wastewater influent
was sampled in the lift station wet well immediately upstream from
the 12-in. (30-cm) Parshall flume. Again, the sampling methodology
resulted in the use of three separate samplers because of various
analytical requirements.
Because of a power outage which resulted in flooding of the wet
well and subsequent damage to the sampling equipment, two different
samplers were used to collect samples to be analyzed for conventional
parameters and heavy metals. On August 19-20 and 20-21, a Manning*
S-4QQ0 was used. Because of the flooding problem, no samples were
collected during the daily August 21-22 and 22-23 periods.
Sampling for trace organics was similar to the procedure used
on the Sals bury process wastewater. One sampler was used for
collection of water samples and the other sampler used for drawing
wastewater through a column accumulator-.
During the sampling period, five sets of time-composite samples
were collected. The resulting analytical data can be found in
♦Manning Environmental Corporation, 112 Dakota Street, California 95060
uanta Cruz

50
Appendix B, Tables B-7 through B-10. Flow rate readings were
determined from the plant totalizer.
11. MUNICIPAL TREATMENT PLANT EFFLUENT (STORET No. 000034)
Sampling procedures on the municipal treatment plant effluent
were much the same as those on the influent. Again, three samplers
were used; an ISC0 1392 for conventional parameters and heavy metals
and two samplers for trace organics. The sampling point was in the
launder of the final clarifier.
During the period of investigation, six sets of samples were
collected for conventional parameters plus heavy metals. Six sets
of wastewater samples were also collected for trace organics analysis
and five resin columns were accumulated. All samples were time-
composites collected over an approximate 24-hr period. The data
resulting from the sample analysis may be found in Appendix B,
Tables B-ll through B-14. Calculated effluent loading rates were
determined by using the influent flow rates.
In addition to the wastewater chemistry characterization of the
plant effluent, two acute static mortality tests were conducted. The
test organisms used were bluegill sunfish (Lepomis macrochirus Raf.)
and water fleas (Daphnia magna Straus.). Daphnia magna was selected
to represent organisms which fish depend on for food. This decision
was based upon the report by Anderson, et al. (33) which concluded that
the susceptibility of Daphnia magna to toxic substances was representa
tive of the susceptibility of predominant zoo plankters to toxic
substances. The test methodology was based upon the recommended
procedures outlined in “Methods for Acute Toxicity Tests with Fish,
Macroinvertebrates, and Amphibians" (34).

51
The bluegil1 sunfish were obtained from Mr. Livingston, fish
culturist of the Fish Pesticide Laboratory. Mr. Livingston obtained his
supply from Corning, Arkansas, on March 27, 1974. The bluegil1 were
presumed to be born about January 1, 1974. While at the pesticide
laboratory these fish were subjected to one Furacin prophylactic treat
ment. Following deliver to the EPA regional laboratory they were treated
once with a mixture of formalin and malachite green oxalate. Further
treatment during their 16-month tenure at'the regional laboratory was
considered unnecessary.
The regional laboratory v/as the source of the water fleas. These
were cultured and maintained daily in order to insure sufficient numbers
of neonates of the proper age (24-hour or less) for test purposes.
Cedar River water was used for acclimating the bluegil Is and the
water fleas, and as the diluent for the definitive tests. The water was
collected about 19QC hr, August 24, near the right bank (facing down
stream) at the upstream station (STORET No. 001905). The river water
temperature at this time was 24!5C. Two-hundred gal (760 1 ) of Cedar River
water were trucked to the EPA laboratory in four 55-gal (210-1), sealed,
epoxy-lined steel drums. The water was received by the regional laboratory
at 1545 hr, August 25, 1975. Chemical analysis of the water indicated
the following:
pH: 8.06
Alkalinity: 138 mg/1 (CaD^)
Total Hardness: 163 mg/1 (CaCO^)
Specific Conductance: 377 pmhos/cm at 25°C ;
The 150 randomly selected bluegill, in their holding water, were
placed within the acclimating aquarium, located in the enviro.nmental chamber,
at 1330 hr, August 25. During the following 24-hr period, the fish

52
were exposed to increasing concentrations of Cedar River water. This
was accomplished by exchanging 8 gal (30 1) of the original 16 gal
(60 1) of holding v/ater in the shielded acclimating aquarium with
Cedar River water. This procedure, which was carried out four times,
resulted in progressive river water concentrations of 50, 75, 87.5,
and 93.75 (94) percent. During the acclimination period the water
was vigorously aerated by means of an air pump and an air stone. The
fish were denied food 96 hr prior to the test.
The acclimating aquarium was located in an environmental chamber
designed to maintain a selected temperature with ±0.5°C. The lights
in the chamber generated a 16-hr light, 8-hr dark photoperiod with
gradual intensification (sunrise) and dimming (sunset) at the beginning
and end of each light cycle.
Acclimation of the water fleas consisted of two 5-ninute "washings"
in Cedar River water prior to the test.
, The definitive tests were conducted with a municipal effluent
sample which was collected in four 5-gal (19-1) flint glass buckets,
with Teflon-lined lids. The sample was collected between 0539 and
0730 hr, August 27, and delivered to the laboratory at 1620 hr the
same day. The temperature of the sample when it arrived at the
laboratory was 16°C.
Based upon the results of an initial range-finding test, which
was conducted with a sample collected at an earlier date, effluent
concentrations of 100, 56, 32, 10, and 0 (control) percent were
prepared for the definitive test. Each 5-gal (19-1) flint-glass
bucket contained a total volume of 4 gal (15 1) of effluent and

53
Cedar River water. The series was replicated and the buckets randomly
distributed on a shelf in the environmental chamber.
The recommended loading (34) for bluegills in a static toxicity
test is 0.053 oz/gal (0.4 g/1) at temperatures above 22°C. This
limitation is primarily because of the DO demand of the fish. The
weights of 20 randomly selected fish out of the 150 test candidates
ranged from 0.067 to 0.20 oz (1.9 to 5.6 g) and averaged 0.13 oz
(3.7 g). Because of this average weight and a recommended minimum
of ten fish per concentration it was necessary to load the buckets
at a higher mass concentration and oxygenate the water. Consequently,
each bucket contained ten fish at an average loading of 0.33 oz/gal
(2.5 g/1). During the test, each bucket was oxygenated to maintain
a minimum DO of 4 mg/1.
At 2020 hr, the bluegills were randomly loaded into the buckets.
The water fleas were loaded into the 250 ml test beakers immediately
prior to this. The mortality of the fish (sum of two buckets) and
the water fleas as a function of elapsed exposure time and solution
concentration was as follows: (The DO concentration is shown in
brackets.)
Elapsed Time, hr Test Concentration, percent
Bluegills:0
1216
•3596
100 56 32 18 10 5
0 0 9 (5.0)
16 (5.9) 0 201(9.9) 0 20 0
0 0 0 0
0 0 0 00 0 0 00 0 0.0
Water Fleas: 0
480
200 05 0
020
05
00

54
The 24-, 48-, and the 96-hr LC-50 values for the bluegills were
estimated to be 86%, 74%, and 74%, respectively. The last two values,
being identical, suggested that the asymptotic LC-50 has been reached.
Brown (35, p 78-84) defined the asympotic LC-50 as the concentration
below which the selected response will cease to be demonstrated and
at which the observed response remains relatively unchanged for
"prolonged" periods of exposure.
For the water fleas, the 24- and 4S-hr EC-50 were estimated to be
100% and 34% (30.1% to 38.4%), respectively.* Dissolved oxygen was
not considered a problem with the water fleas since the 250-ml beakers
remained open to the air, and since the "critical oxygen level for
Daphnia magna is no higher than 15% of saturation of 20°C."
iii. MUNICIPAL PLANT RAW SLUDGE (STORE! No. 001909)
Five samples of the raw municipal sludge were collected during
the survey. These samples were manually grabbed, once each morning
(August 22 excepted) between 0920 and 1045 hr. Analytical emphasis
was on heavy metals. No samples were collected for trace organics
analysis. The raw data resulting from these samples can be found
in Appendix B, Table B-15.
iv. MUNICIPAL PLANT DIGESTED SLUDGE (STORET No. 001910)
Digested sludge grab samples were withdrawn from the bottom
zone of the secondary digester. Altogether, six samples were
manually collected. Analytical emphasis was on heavy metals and no
samples were collected for trace organics analysis. The resulting
data can be found in Appendix B, Table B-16.
*95% confidence limits calculated by the Litchfield-Wilcoxon Method (36).
55
v. MUNICIPAL DIGESTED SLUDGE SUPERNATANT (STORET No. 001911)
Daily manual grab samples of the secondary digester supernatant
were collected between 0915 and 1045 hr during the survey. These
samples were withdrawn from the top zone of the digester. In total,
six samples were collected, analyses included heavy metals and some
conventional parameters. The analytical data can be found in
Appendix B, Table B-17.
f. CEDAR RIVER AT NASHUA (STORET No. 001912)
The sample collection point was on the left side (facing
downstream) of the impoundment structure at Nashua. During the survey
period, five sets of grab samples were collected for metals analysis
and two sets of grab samples were collected for trace organics analysis.
In addition, three resin columns were accumulated, one over a two-day
period and the other two over a one-day period. The resulting data
can be found in Appendix B, Table B-18. No flow measurements were
made at this point.
g. CEDAR RIVER AT JANESVILLE (STORET No. 001913)
Janesville, Iowa, which is on the Cedar River about 40 miles
(50 km) downstream from Charles City, was the furthest downstream
sampling station. The sampling point was on the left bank (facing
downstream) approximately 50 ft (15 m) downstream from the USGS stream
gauging station. Five grab samples were collected for metals analysis
and three water samples were grabbed for trace organics analysis. In
addition, two resin columns were composited using the same tecfmi.que
as previously described. Subsequent stream loadings were calculated
using USGS discharge records. The data can be found in Appendix B,
Tables B-19 and B-20.

56
3. ANALYTICAL METHODOLOGY
Routine wastewater chemistry parameters including heavy metals
were determined according to the EPA Methods Manual (38). Trace
organics samples were analyzed for specific organic constituents
using gas chromatography.
The water samples were prepared for instrumental analysis by
extraction with methylene chloride followed by Kuderna-Danishj
concentration of the extract. The water samples were extracted in
two ways. One involved acidification with 1 ml of concentrated
sulfuric acid prior to extraction (pH=l). The other involved direct
extraction of the sample as received without pH adjustment (pH~7).
The resin absorption samples were prepared by ethyl ether extraction
followed by Kuderna-Danish concentration. Quality assurance steps
included the analysis of blank samples (subjecting distilled deionized
water or resin treated water to the same analytical methodology) and
the analysis of spiked samples (distilled-deionized water or resin
treated water to which known organics were added) for determination
of recovery efficiency.
Initial qualitative characterization of selected extracts was
done using computerized gas chromatogpaphy/mass spectrometry.
Compounds which were identified are listed in Table XII.
Five constituents appeared to be present most frequently in
highest concentrations. These were phenol, ortho-nitrophenol,
chlororitrobenzene, ortho-nitroaniline, and aniline. Quantitative
analyses were performed for these parameters in all of the Charles
City and Salsbury samples using gas chromatography with flame
ionization detection.

TABLE XII
COMPOUNDS IDENTIFIED BY GC/MS FROM SOURCES IN CHARLES CITY, IOWA
August 1975
(Salsbury Laboratories - Process Wastewater Sample No. 913035)
Ortho-nitroanil ine Butyl Acetate PhenolNitrobenzeneOrtho-nitrophenolChioronitrobenzeneTwo Unidentified Constituents
(Salsbury Laboratories - Process Wastewater Sample No. 913038)
Ortho-nitroaniline1,1,2-TricnloroethanePhenolAnilineNitrobenzeneOrtho-nitrophenolChloronitrobenzeneOne Unidentified Component
(Charles City STP - Influent Water Sample Mo. 913034)
PhenolDecaneOrtho-nitrophenolCnloroanilineChloronitrobenzeneOrtho-nitroani1ineThree Unidentified Constituents
(Charles City STP - Effluent Water Sample No. 913155)
Ortho-nitroaniline Chloroani1ine Chloronitrobenzene One Unidentified Constituent

58
For the samples which were collected from the Cedar River,
it was necessary to utilize a more sensitive (and more selective)
detection system for analysis. Consequently, gas chromatography
with electron capture detection was used on the Cedar River extracts.
Ortho-nitroaniline and chloroni. trobenzene (probably the ortho isomer)
were detected in the downstream samples. The data for chloronitrobenzene
are estimates (response time similar to response time for ortho-
nitroaniline) because of authentic standard was not available.
Spike recovery (percent) for the five organic constituents
were quantified as follows:
Parameter .Resin Water Water (Acidified)
Phenol — 16 21
Ortho-nitropher.ol 100 60 77
Chioronitrobenzene 100 76 91
Ortho-nitroaniline 91 0v
4. DATA'
Tables XIII and XIV summarize, respectively, the wastewater
chemistry concentrations and loadings of selected stations sampled
during the August 1975 'survey. The data resulting from the municipal
sludge sampling is summarized in Table XV.
D. FEBRUARY 1976 INVESTIGATION
In the winter of 1976, SVAN carried out a survey of a number oF
different types of municipal treatment plants in Region VII. The
purpose of the survey was to determine the cold weather performance
of these plants. Because of the covered trickling filter, the Charles
City municipal wastewater treatment plant was one of the facilities
selected for investigation. Sampling was limited to

TABLE XIII
SUMMARY TABLE
MEAN WATER AND WASTEWATER CHEMISTRY CONCENTRATIONS
August 1975
Parameter
Ced
ar R
iver
Ups
trea
m(0
0190
5)
Sals
bury
Was
te
wat
er
(001
906)
Stor
m So
wer
Dis
char
ge(0
0190
8)
Tre
atm
ent
Plan
t Infl
uent
(0
0003
3)
Tre
atm
ent
Plan
t Eff
luen
t (0
0003
4)
Ced
ar R
iver
at
Nash
ua
(001
912)
Ced
ar R
iver
at
Jane
svill
e (0
0191
3)
Color 4100 1200 710Conductivity, ymho/cm — — 335 1706 1666 — —BOD5, mg/1 . '
— — 2.8 140 25. — -- .COD, mg/1 -- — <34 360 127 -- —pH — — 7.5-S.C 6.3-7.Cj6.3-7.9l
-- —TVS, mg/1 — — 548 223 — —NFS, mg/1 — 4 12 76 12 . — —
■ NH3-N, mg/1 — — <0.1 13 23 — —TKN, mg/1 — — — 25 25 — —N02-N0t-N, nq/1 — 0.4 <0.08 0.10 — —Total P, mg/i — — 0.6 6.2 6.3 —TOC, mg/1 — 207 — 80 -- --As, i.g/1 (Total) 3 5900 2 1400 1100 21 14Ba, ug/1 (Total) <100 <100 <100 <100 <100 <100 <100Cd, ug/1 (Total <5 14 <52 <5 <5 <5 <5Cr*, i.g/1 <11 <10 <64 <25 <12 <n <16Cr, uq/T (Total) 5 <5 43 <5 <5 <5Cu, ug/1 (Total) . 9 34 14 74 34 15 i-’-PL), uo/1 (Total) <20 3 20 33 64 50 <30 <33Sn, uq/1 (Total) <5 <5 <5 <5 <5 . <5 <5Se, ug/1 (Total) <10 31 <10 13 16 <10 <10Hg, ug/1 (Total) <0.30 6.2 <0.3 4.1 1.1 <0.2 <0.2Phenolics, pq/l (Total) -- 40,500 10 8100 1C1 —Flow rate, mod 0.53 — 1.32 1.32 — 1Trace Organics (Resin Column)
Phenol, •jc/1 2300 2000 <100Ortho-nitrophenol, v9/l -- 9000 — 2000 500 -- —Chioronitrcheniere, uq/1 <0.1 2G00 — 600 <200 0.3 0.2Ortho-nitroaniline, vg/ <0.3 17000 — 4000 2200 7.7 8Aniline, ug/1 700 <300 <100

60
TABLE XIV
SUMMARY TABLE
MEAN WATER AND WASTEWATER CHEMISTRY LOADINGS, POUNDS PER DAY
August 1975
Parameter
Ced
ar R
iver
Ups
trea
m(0
0190
5)
Sals
bury
Was
tew
ater
(001
906)
Tre
atm
ent
Plan
t Infl
uent
(0
0003
3)
Tre
atm
ent
Plan
t Eff
luen
t (0
0003
4)
-
Ced
ar R
iver
at
Jane
svill
e (0
0191
3)
BOD __ 1520 2S0COD 3930 1390TVS — — 6030 2440 —
NFS 17 820 132 —
nh3-n — — 190 250K3?-N0v-N — — <0.85 <1.1 —
Total P -- — 68 70 —
TOC — 1020 SSO — —
As (Total) 14 28 15.5 12.1 57Ba (Total) 370 <0.43 <1.1 <1.1 <390Cd (Total) <19 0.059 <0.1 <0.1 <20Cr45 <50 <0.050 <0.23 <0.2 <58Cr (Total) <31 <0.02 <0.1 <0.1 <20Pb (Total) <73 0.55 0.71 0.51 <112Cu (Total) 36 0.16 0.82 C.37 53Sn (Total) <19 <0.02 <0.1 <0.1 <20Se (Total) <37 0.15 0.14 0.17 <39Hg (Total) <0.82 0.03 0.04 0.01 <0.9Pnenolics, (Total) — 200 8S.9 1.1 —
TKM — — -- — —
Trace Organics (Resin Column)
Phenol 12 28 <1Crthor.itrophenol -- 43 17 6 —
Chloronitrobenzene <0.4 13 6 <2 1.4Orthonitroaniline <1.3 75 50 25 50Aniline 3.4 <3 <1

TABLE XV
SUMMARY TABLE
MUNICIPAL WASTEWATER TREATMENT PLANT SLUD3E
MEAN CONCENTRATIONS
August 1975
ParameterRaw
SludgeDigested
Sludge
DigestedSludge
Supernatant
Temp, °C 21 22 22
pH 6.3 to 6.5 6.0 to 6.5 6.2 to 6.7
bod5 — — 1300 mg/1
COD — — 2380 mg/1 ■
nh3-n — — 131 mg/1
NO2-NO3-N — — 0.17 mg/1
TVS 32,030 mg/1 36,900 mg/1 1130 mg/1
As (Total) 2000 mg/kg 1550 mg/kg 36 vg/1
Ba (Total) 9590 mg/kg 12,600 mg/kg 450 vg/1
Cd (Total) 111 mg/kg 150 mg/kg <50 vg/1
Cr46 <12 vg/1 <12 ug/1 <25 vg/1
Cr (Total) 278 mg/kg 589 mg/kg 13 vg/1
Cu (Total) 4810 mg/kg 6680 mg/kg 310 vg/1
Pb (Total) 2680 mg/kg 4120 mg/kg <300 vg/1
Sn (Total) <11,000 mg/kg <8600 mg/kg <50 vg/1
Se (Total) <22 mg/kg <17 mg/kg <100 vg/1
Hg (Total) 25.9 mg/kg <5.6 mg/kg 1.5 vg/1
___J

62
plant influent and effluent. Analyses were confined to conventional
parameters.
On the influent, a QCEC Model CVE sampler was used for the first
sampling period. A Sirco Model MKVS7* was used for the last two saJpling periods. On the effluent, an ISCO Model 1392 was used to
Acollect the three time-composite samples.
The resulting data is presented in Table XVI.
E. FEBRUARY 10-11, 1977, RECONNAISSANCE
During January of 1977, the IDEQ requested SVAN to collect a
number of water and sediment samples from the Cedar River for the pujpose of obtaining some preliminary water quality data on the stream.
A joint report prepared by IDEQ and the Iowa Geological Survey (5)
indicated the LaBounty site to be a potential source of water quality
degradation. Since SVAN personnel were not previously aware of this
site, a reconnaissance was conducted on February 10 and 11 for the
purpose of locating sampling stations for field work which was scheduled
for February 22 and 23, 1978.
No samples were taken during the reconnaissance, but the field
observations which resulted were responsible for the structuring of
the later investigative efforts. These observations were as follows:
I| 1. The distinctive yellow color of the Salsbury Laboratories
process waste was observed on the ice in the impoundment of Nashua,Iota, 10 miles (16 km) downstream from Charles City.
*siirco Controls Company, 401 2nd Avenue West, Seattle, Washington 98119

63
TABLE XVI
CHARLES CITY MUNICIPAL WASTEWATER TREATMENT PLANT
CONCENTRATIONS AND LOADINGS
February 1976
StationParameter Influent Effluent
Lab No. (933 series) 440 442 444 450 452 454Typs» of Sample Comp. Comp. Comp. Comp. Comp. Comp.Comp. Sample Info. Mean Mean RemovalStart Date, day-mo.- 11/2 12/2 13/2 11/2 12/2 13/2 Cf fStart Time, 1215 1000 1005 1235 1040 1015 E.T T •
Stop Date, day-mo. 12/2 13/2 14/2 12/2 13/2 14/2 %
Stop Time 1000 1005 0715 1040 1015 1725Water Temp.,* °C 10 . 9 8 c 11 11 10 11
Conductivityumbo/cm 4940 4030 3760 4240 4110 4030 3950 4030 —bod]
cone., mg/1 304 310 362 325 113 155 150 139 57lc>ad., Ib/day 2860 2950 3020 2940 1064 1470 1250 1260 57
COD "
cc)nc., mg/1 585 1067 1046 899 595 624 — 609 32lc>ad., Ib/day 5510 10,140 8700 3120 5610 5930 — 5770 29
NFS
cc)nc., mq/1 121 120 148 129 76 36 72 61 53load., Ib/day 1140 1140 1230 1170 720 342 600 550 53
nh3--Ncone., mq/1 .170 140 130 150 170 140 130 150 0lcjad., Ib/day 1600 1330 1080 1340 1600 1330 1080 1340 0
TKNC(jnc., mq/1 170 140 130 150 170 140 130 150 0load., Ib/day 1600 1330 1030 1340 1600 1330 1030 1340 0
NO? ■NOa-Nccnc., mg/1 45 46 34 42 14 5.8 4.5 8.1 SIload., Ib/day 420 440 280 3S0 131 55 36 74 81
Total Pcone., mq/1 7.5 8.0 8.0 f. 8 6.0 5.5 5.5 5.7 27l’(jad., Ib/day 71 76 67 71 57 52 46 52 27
pH 7.5 7.9 7.6 — 7.8 8.0 7.8 7.9 —Flo- i rate, mgd** 1.13 1.14 1.0 1 .09 — -- —
* Instantaneous measurement made at ending date and time of sample composite period.
** Multiply by 3800 to obtain cu m/day

64
The
yel
high.
poo
on
2. The present disposal site is an open face landfill operation,
embankment consists primarily of precipitated arsenicals, is bright
ow in color, about 600 ft (180 m) long and 25 to 30 ft (7.6 to 9.1 m)
3. The yellow color was observed in the ice covering the standing
s in sand excavated pits at the base of the landfill.
4. The yellow color was observed at several points in the ice
-he Cedar River immediately east of the disposal site.
5. The yellow color was observed in the ice covering an abandoned
sand pit located on the east side of the river. It appeared that this
color may have leached from a former municipal disposal site which was
closed to Salsbury in 1953.
6. The City engineer, Mr. Dan Barrett, pointed out a seep on the
west bank of the river upstream from the disposal sites. Mr. Barrett
indicated that he had received unofficial reports that this seep
occasionally turns yellow.
7. Mr. Sisk (SVAN geologist), upon an examination of rock out
crops near the seep, indicated that there was the possibility that a
fracture extended from the seep back toward the Salsbury Laboratories
complex. It is possible that the companys' equalization basin is
introducing process waste into the groundwater via this fracture and
that the reported yellow color in the seepage is from the basin.
8. Mr. Virgil Rice, the municipal wastewater treatment plant
superintendent, indicated that there have been complaints of "off-
taste" in fish taken from the Cedar River downstream from Charles City.
Figures 7 through 15 are photographs of the LaBounty Disposal
site, the Cedar River, the abandoned sand pit, and the municipal

65
l-
(

FIGURE 9 LABOUNTY DISPOSAL SITE - FROM TOP LOOKING EASTERLY TOWARD CEDAR RIVER (BEHIND TREELINE)

(
K.

68V
r
(
FIGURE 13. CHARLES CITY MUNICIPAL WASTEWATER TREATMENT PLANT RAW COMBINED DOMESTIC AND INDUSTRIAL WASTEWATER
FIGURE 14. CHARLES CITY MUNICIPAL WASTEWATER TREATMENT PLANT PRIMARY CLARIFIER

69
%FIGURE 15. CHARLES CITY MUNICIPAL WASTEWATER TREATMENT PLANT
SECONDARY CLARIFIER

70
wastewater treatment plant. These photographs were taken during the
February 10-11 reconnaissance.
F. FEBRUARY 22-23, 1977, FIELD EFFORT
As a result of the February 10-11 reconnaissance, the following
sampling stations were selected: Staition No. River Mile* STORET No.
| 1 253.8 002470
2 253.1 002471
3 253.1 002480
4 253.1 002472
5 251.9 002473
6 251.7 002474
7 245.6 002475
8 242.6 002476
9 NA 002477
10 NA 002378
11 NA 002479
t <,;xnll
Description
Cedar River at foot suspension bridge in Charles City
Seep at Cedar River near end of Hildreth Street
Sediment at base of seep near end of Hildreth Street
Cedar River downstream from seep and upstream from LaBounty site.
Cedar River downstream from old municipal landfill site and LaBounty site and upstream from municipal wastewater treatment plant outfall
Cedar River downstream from municipal wastewater treatment plant outfall
Cedar River approximately 6 miles (10 km) downstream from Charles City at first county road bridge crossing
Cedar River in Nashua impoundment
Abandoned sand pit near Cedar River at about Cedar River mile 252.2
Open face of LaBounty disposal site
City well in Wildwood Park
1tiply by 1.61 to obtain km.

71
Sta4iion No. River Mile* STORET No. Description
12 251.8 000034 Municipal wastewater treatment plant -effluent
13 NA 000035 Salsbury Laboratories CoolingWater Discharge
These sampling station locations are shown in Figures 16, 17, and
18, along with the assigned STORET No. Station 13 was not included
in the original sampling scheme but was added as a result of an
observation of the receiving stream'in Wildwood Park while sampling
station 11.
Grab samples were taken at all locations. Because of concerns
with inadequate mixing, five grab samples at equally paced intervals
across the stream cross-section were collected at stations 4, 5, and
6. At the other stream stations, samples were collected in mid-channel.
At station 10, the solid waste sample was taken from a portion of the
waste which had just been dumped.
It was originally planned to take a number of sediment samples at
various stream stations. Because of the thickness of the ice, about
30 in. (0.76 m), it was necessary to cancel the sediment sampling.
The only sediment samples obtained were collected at stations 3 and 10.
Samples were analyzed for the following total metals: Arsenic,
Cofjper, Chromium, Mercury, Lead, Barium, and Tin. In addition to
heavy metals, the two sediment samples were scanned for trace organics.
Tables XVII and XVIII present, respectively, the results of the
metals analysis on the water and wastewater samples and the sediment
*Multiply by 1.61 to obtain km.


TABLE XVIIcedaiTrTver and salsbury laboratories samples
February 23, .1977
Station* TimeTotal Heavy Metals Concentration, vg/1
Lab. No.,As Ba Cr Cu Pb Sn Hg
1 Center 1100 160001 6 100 <5 <5 <5 <1000 <0.22 0935 160006 2,200 180 <5 7 <5 <1000 <0.2
4 Left Bank 1000 160007 5 80 <5 <5 7 <1000 <0.2
4 Left of Center 1002 160008 5 100 <5 <5 6 <1000 <0.2
4 Center 1006 160009 6 50 <5 9 9 <1000 <0.24 Right of Center 1010 160010 18 50 <5 <5 13 <1000 <0.24 Right Bank 1012 160011 34 50 <5 <5 15 <1000 <0.25 Left Bank 1130 160015 23 50 <5 <5 35 <1000 <0.25 Left of Center 1131 160016 43 50 <5 <5 34 <1000 <0.25 Center 1132 160017 34 50 <5 <5 30 <1000 <0.25 Right of Center 1133 160018 48 50 <5 <5 30 <1000 <0.2
5 Right Bank 1134 160019 38 50 <5 <5 28 <1000 <0.212 1245 160048 1,880 300 <5 62 80 <1000 9.5
6 Left Bank 1330 160023 86 50 <5 <5 24 <1000 0.7
6 Left of Center 1330 160024 75 50 <5 9 24 <1000 0.34
6 Center 1330 , 160025 60 50 <5 <5 25 <1000 0.26
6 Right of Center 1330 160026 68 50 <5 7 31 <1000 0.30
6 Right 1330 160027 46 50 <5 <5 30 <1000 <0.2
7 Center 1745 160032 60 50 <5 <5 5 <1000 0.2
8 Right Bank 0910 160040 5 50 <5 <5 <5 <1000 <0.2
9 1420 160044 56 50 <5 <5 <5 <1000 <0.2
11 1445 160046 5 120 5 273 27 <1000 <0.2
13 1515 160002 15,800 250 56 74 no <1000 0.44
*Left and right when facing downstream.

TABLE XVIII
SEDIMENT SAMPLE AND LABOUNTY DISPOSAL SITE SAMPLE
February 23, 1977
Station Time Lab No.Total Heavy Metals Concentration , mg/kg
As Ba Cr Cu Pb Sn Hg
3* 0940 160047 31 3.6 8.0 1.68 0.15 <0.10 0.45
10** 1435 160045 28,000 281 13.5 24.50 0.21 <0.10 1.5
*Seep sediment
**LaBounty sludge

77
samples. An examination of Table XVII would indicate that arsenic
levels generally increased as sampling proceeded downstream.
I At station 1, the arsenic concentration was near the laboratory
detection limit of 5 Mg/1. At the seep (station 2), the arsenic
concentration was 2,200 yg/1. The arsenic in this seep is believed to
originate from one or a combination of up to three sources which includes
(1) a leak in Salsbury's equalization basin, (2) exfiltration from a
sanitary sewer carrying Salsbury's process waste, or (3) possible
entry of Salsbury's "cooling water" into the groundwater.
At station 4, which was immediately downstream from the seep, five
samples were collected across the Cedar River. Arsenic levels varied
from 5 to 34 yg/1. The higher concentrations found near the right
bank (facing downstream) at station 4 reflect the arsenic in the seep
and possible additional arsenic entering the Cedar River upstream from
the seep via the intermittent stream which flows through Wildwood Park.
This stream contains Salsbury's cooling water discharge (station 13)
which was also sampled because of its distinctive yellow color which
is asjsociated with Salsbury's process waste.
jThe single grab sample of Salsbury's cooling water discharge was
found to contain 15,800 yg/1 of arsenic.
At station 5, which was downstream from the two disposal sites,
arsenic concentrations varied from 23 to 48 yg/1 across the river.
Rough y, and on the basis of simple arithmetic mean concentrations,
the two disposal sites increased the arsenic level in the Cedar River
by 21 yg/1 between stations 4 and 5.

78
mum
At station 6 which was about 200 yd (180 m) downstream from the
cipal wastewater treatment plant, arsenic levels varied from
46 to 86 jjg/1 and averaged 67 yg/1. The high left bank concentration
of 8 5 yg/1 reflects upstream municipal effluent (station 12) which is
on the left bank and which was found to contain 1,880 yg/1 of arsenic.
Again, on the basis of mean concentration, the treatment plant effluent
increased river concentration by another 32 yg/1.
I At stations 7 and 8, Cedar River arsenic concentrations were 60■i
and 5 yg/1, respectively.
The abandoned sand pit (station 9) yielded an arsenic concentration
of 56 yg/l.i! Arsenic loadings based upon USGS stream gauging records for the
Charges City station are estimated as follows. These loading rates must
be considered, rough estimates since they are based upon simple average
concentrations at the cross-sections rather than a more accurate flow
proportional sampling technique. The USGS flow rate for the Charles City
station on February 23 was 108 cfs* (3.01 cu m/sec).
Station Mean Concentration, uq/1 Stream Loading, lb/day**
1 6 3.5
4 14 8.2
5 37 22
6 67 39
Station 11 was selected because of concern with groundwater
contamination. This station is a shallow well equipped with.a hand
*U.S. Geological Survey Water Data Report 1A-77-1
^Multiply by 0.454 to obtain kg/day.

79
operated pump for conventional park recreational uses. The arsenic concentration at this station was at laboratory detection limits.
Sample No. 160045 and 160047 which were taken, respectively,
from the LaBounty site dump face (STORET No. 002478) and from the
sediment immediately downstream from the seep (STORET No. 002480)
were analyzed for trace organics. The samples were extracted with
methylene chloride and the extracts were analyzed for organic compounds
using computerized gas chromatography/mass spectrometry. The results
are summarized below: i
Analytical Results in mg/kq
Sample No. 'Type Ortho-nitroaniline Para-nitroaniline
160045 Solid Portion 39 9
160045iI160047
160047
Water Phase
Sol id Portion
Water Phase
Not Detected
Not Detected
16
Not Detected
Not Detected
Since the visible spectra of ortho-nitroaniline and the yellow
colored sample were virtually identical (absorption maxima at 414
nanometers), the color, apparently, is largely due to the nitroanilines.
The laboratory staff performed some additional analyses on the
sludge sample (No. 160045) taken from the face on the disposal site
to futher define the sludge characteristics. The sludge was dried
ana found to include the following constituents:
Ca 28% S04 51%
Mg 0.1% TC 1.4%
Na 0.2% TOC 0.9%
Cl 0.5% As 2.8%

80
In order to get some idea as to the Teachability of the sludge
and the potential for release of sludge constituents to the environment,
the dried material was mixed with Missouri River water and with
deionized water. After standing for 24 hr, the material was filtered
through 0.45 micron filters and the filtrate analyzed.
i The solubility of this dried material in the Missouri River water
was about 0.27 g/100 ml. The solubility of the dehydrated form of
Icalcium sulfate (CaS04.2H20 or gypsum) v/as 0.24 g/100 ml; however,
not only the CaS04 dissolved. The filtrate contained the yellow
color and the arsenic concentration was 25,000 pg/1. The solubility
was even greater in deionized water. The filtrate contained 40,000 pg/1
arsenic from deionized water. The pH of these solutions was above 9.
The pH of the non-preserved sample before drying gave a pH in the
supernatant of 1.2 and the arsenic content after filtering through
!
a 0.45 micron filter v/as 790,000 pg/1.
| The studies indicate that the arsenic was fairly easily solubilized
even if it was precipitated with calcium as the arsenate (CaAs04).I! The yellow color was removed when 0.2 g of dried material was
dissolved in 100 ml of dilute acid and filtered through activated
charcoal. The filtrate contained 31,000 pg/1 of arsenic. 1i
G. | APRIL 1977 FISH FLESH ANALYSIS
I '': At the request of IDEQ, the Iowa Conservation Commissionr -
collected nineteen fish flesh samples from the Cedar River for
I
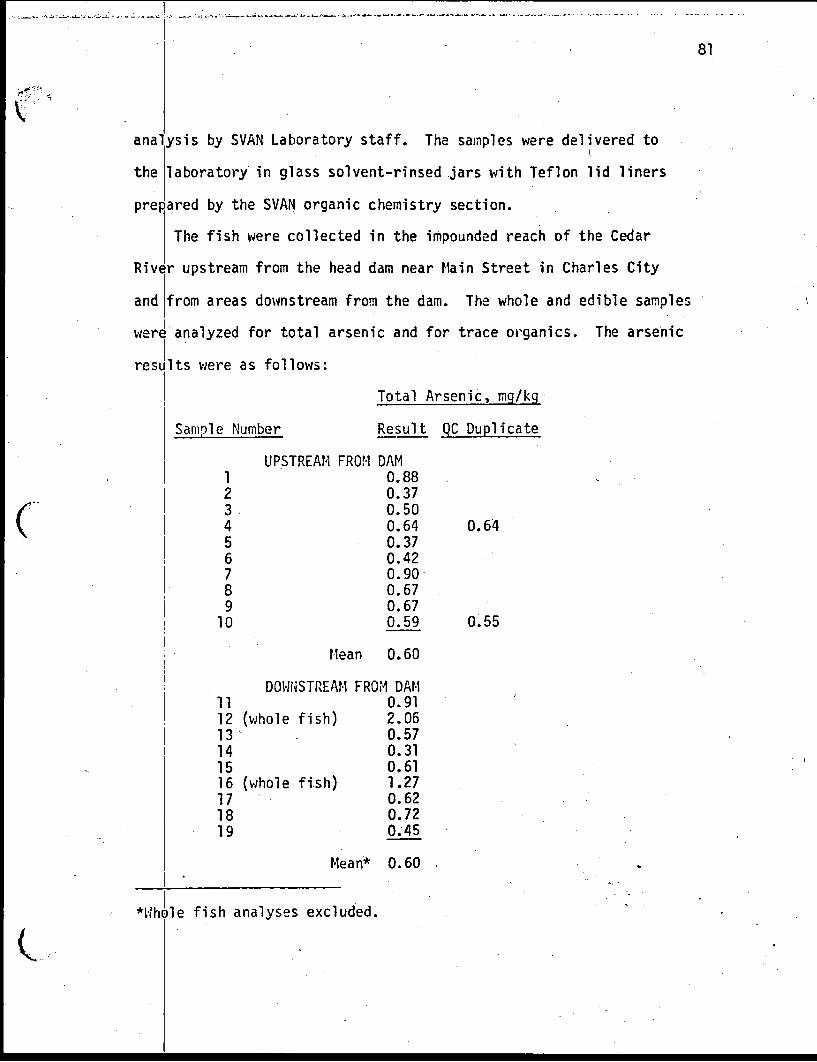
analysis by SVAN Laboratory staff. The samples were delivered toi
the laboratory in glass solvent-rinsed jars with Teflon lid liners
prepared by the SVAN organic chemistry section.
The fish were collected in the impounded reach of the Cedar
River upstream from the head dam near Main Street in Charles City
and from areas downstream from the dam. The whole and edible sample
were analyzed for total arsenic and for trace organics. The arsenic resJits were as follows:
Total Arsenic, mg/kg
Sample Number Result QC Duplicate
I
12345678 9
10
UPSTREAM FROM DAM 0.88 0.37 0.50 0.64 0.37 0.42 0.90 0.67 0.67 0.59
0.64
0.55
Mean 0.60
DOWNSTREAM FROM DAM11 0.9112 (whole fish) 2.0613 0.5714 0.3115 0.6116 (whole fish) 1.2717 0.6218 0.7219 0.45
Mean*
*Whole fish analyses excluded
0.60
82
The report of the laboratory organics section regarding their
ana ysis of the fish is quoted in its entirety as follows:
"We have completed our analyses on the 19 samples which were taken from the Cedar River near Charles City, Iowa, on April 12-13, 1977. The tissue samples were prepared for pesticide analyses as decribed previously. This preparation involves homogenization with dry ice and anhydrous sodium sulfate, solvent extraction, and cleanup by gel permeation chromatography. The extracts were analyzed by gas chromatography with electron capture detection and computerized gas chromatography/mass spectrometry. Except for trace residues of DDE, we did not identify any organics of significance in the 19 samples. Samples Mo. 16 and Mo. 17 did contain a late eluting component (by electron capture gas chromatography) which was not identified. This component
| could not be related to any of the "Charles City j pollutants" however. We specifically searched the | GC/MS data for nitroaniline, diphenylamine, i nitrobenzene, nitrophenol, and chloronitrobenzene,
but none could be found. However, because of time and manpower constraints, we did not rigorously establish the applicability of our methodology to those specific pollutants."
H. JUNE 29-30, 1977, SEDIMENT AfID FISH COLLECTION EFFORTIIi On June 29-30, 1977, SVAN personnel collected a number of sediment
samples from the Cedar River upstream and downstream from Charles City.
These samples were collected for the purpose of determining whether or not! heavy metals (arsenic in particular) were accumulating in the
Cedar River sediment as a result of the various potential problem areas
in Charles City.
In addition to the sediment samples, SVAN also collected a number
of fish flesh samples at some Cedar River stations. The fish tissue
(edible portion) was analyzed for ortho-nitroaniline by SVAN laboratory
personnel.
The Cedar River sediment sampling locations were as follows:

83
STORET No. River Mile* Cedar River Station Description
002730 262.4 Highway 218 bridge at Floyd, Iowa
001905 253.4 Charles City upper impoundment betweenWildwood Park tributary and head dam
002473 251.9 Downstream from old municipal landfill site and LaBounty site and upstream from municipal wastewater treatment plant outfall
002474 251.7 Downstream from municipal wastewater treatment plant outfall
002475 245.8 Approximately 6 miles (10 km) downstream from Charles City at first county road bridge crossing
002476 242.6 Nashua impoundment
Because of close proximity of sources and concern with unequal
distribution of sediment loads, some stream stations were sampled at
quarter-points (stream center and halfway between center and left
and right bank). The left and right are referenced with the observer
facing downstream. Table XIX presents the metals analytical data.
Table XX presents the analytical data resulting from analysis of
the edible portions of fish collected from the Cedar River. The table
shows the stream reach, fish species, number of fish per sample,
average length of fish (cm), average weight of fish (kg), and the
quantitative results in ppb.
The fish samples were prepared according to regional laboratory
methodology (39) which included clean-up by gel permeation chromatography.
However, recoveries for dose samples were poor and variable (0 to 50%)
for ortho-nitroaniline in fish. The two positive values (Cedar River
at Nashua) are, therefore, based low. The pesticide data was
^Multiply by 1.61 to obtain km.

TABLE XIX
CEDAR RIVER SEDIMENT SAMPLES - METALS CONCENTRATIONS
June 29-30, 1977
STATION DESCRIPTIONSTORET
NO.LAB.NO.
Metals Concentrations, mg/kg (Total)*
As Ba Cd Cr Cu Pb Sn Hg
Highway 218 at Floyd 002730 041060 20.8 <500 2.2 18.2 10.4 28.3 — 0.05
Upper Impoundment 001905Left Bank — 041070 34 <500 3.2 26.5 51.9 243 — 0.16Mid Stream -- 041061 33.4, <500 2.6 27.2 33.1 68.4 — 0.12Right Bank -- 041071 39 <500 3.1 23.2 ‘ 34.6 78.9 0.19
Mean 36 <500 3.0 25.7 39.9 130 -- 0.16
Downstream From Disposal Sites 002473Left Bank — 041062 107 500 27.8 36.9 52.4 389 - - 0.15
Downstream From STP 002474Left Bank — 041069 126 <500 21.1 32.8 79.5 351 -- 6.5Mid Stream -- 041068 43.9 <500 4.0 25.5 14.0 44.5 — 0.03Right Bank -- 041063 90.9 <500 10 20.3 22.1 133 — 0.07
Mean 87 <500 12 26.2 38.5 176 — 2.2
6 miles Downstream 002475Midstream — 041064 239 <500 42.8 63.2 95.5 577 «*» 0.84
Nashua Impoundment 002476Left Bank -- 041067 92 <500 7.5 35.7 49.1 98 — 0.18Mid Stream -- 041066 277 <500 20.4 106 148 296 — 0.21Right Bank — 041065 132 <500 10.1 63.4 79.2 155 — 0.20
Mean 167 <500 12.7 68.4 92.1 183 0.20
* Dry Weight

85
TABLE XX
CEDAR RIVER FISH FLESH ANALYSIS
June 29-30, 1977
CedarRiver
Locationand
(STORET No.)
Fish Data
Compound Concentration, ppb
C2Oo.
o.— mL> tVJ O i— L.< Alp
ha BH
C
Bet
a Chl
orda
ne
Die
ldri
n
P.P'
DD
E
P.P'
DD
D
P.P'
DD
T
Ort
ho-n
itroa
nilin
e
Species No.Avg.lg.cm*
Avg.wt.kg**
Carp 2 42 1.3 181 N 23 38 55 P P NFloyd Carp Sucker 4 37 0.7 100 N 8.0 17 23 P N N(002730) Large Mouth Bass 2 17.5 <0.5 120 N 8.1 11 44 P P N
Hog Sucker 3 24 <0.5 N N N N 12 N N N
Sun Fish 3 13 <0.5 N N N 8.6 16 N N ti
Carp 10 19.3 <0.5 N N N N N N N riNashua Carp Sucker 4 36.3 0.7 54 N N N 19 N 13 62(002476) Silver Sucker 2 25 <0.5 80 N N N 50 N N il
Sun Fish 8 14.4 <0.5 94 N N N 56 P 29 63
Cedar Carp 3 44 1.2 110. N 13 24 130 P 32 NFalls Quillback Sucker 5 31 ' 0.5 N N N 14 20 N N N(002755) Buffalo 4 41 1.3 N N N 16 21 N N N
Carp 4 40.5 0.9 340 N N 41 120 P 70 NCarp Sucker 1 32 0.5 220 N 19 99 4.5 P 54 N
Palo Quillback Sucker 3 31.7 0.5 300 P N N N P P N(901160) Buffalo 1 47 2 89 N N 10 31 P 74 N
Redhorse 4 40 0.7 83 N N 6.1 21 P 34 N
♦Multiply by 0.394 to obtain in.
♦♦Multiply by 0.20 to obtain lb.
N - Not detected.
P - Present but not quantified.

86
accumulated in conjunction with the regional ambient monitoring
program. There is no known relationship between these pesticides and
the various pollutant sources in Charles City.
I. AUGUS7-SEPTEMBER 1977 SURVEY
1. SURVEY STRUCTURE
The August 1977 study, which was carried out at the request of
IDEQ, was structured, primarily, to determine the relative magnitudes
of the previously identified sources of Salsbury wastes and to
determine whether or not a pathway-to-nan existed for those potentially
toxic substances. Background information considered when planning
this survey included (a) the joint IDEQ-IGS report on the LaBounty
Disposal Site, (b) data and observations resulting from previous SVAN
activities, (c) the EPA list of priority pollutants (Appendix C), and
(d) Salsbury's process wastewater pretreatment studies.
2. SAMPLING LOCATIONS
Sampling stations included the municipal treatment plant influent,
effluent, and digested sludge, various locations on the Cedar River,
municipal and private wells along the Cedar River, the municipal sludge
disposal site, various Salsbury waste streams, and ambient air
sampling in the vicinity of the municipal treatment plant and the
LaBounty site.
The tabulated list of sample collection stations are described
as follows, along with the assigned STORET No. and river mi-le,.
where applicable.

87
r \ -v
STORET No. River Mile* Station Description .
002470 253.8 Cedar River at foot suspension bridge inCharles City
003438 NA Streambed in Wildwood Park at foot bridge
003489 NA Streambed in Wildwood Park approximately50 ft (15 m) downstream from foot bridge
003490 NA Streambed in Wildwood Park approximately100 ft (30 m) downstream from foot bridge
001906 NA Salsbury Laboratories process wastewater discharge (Equalization Basin Effluent)
003479 NA Salsbury Laboratories three-week equalized raw waste feed to bench scale treatment uni t
005399 NA Salsbury Laboratories bench scale powdered activated carbon treatment (PACT) process effluent
003274 NA Salsbury Laboratories bench scale activated sludge effluent
003481 NA Salsbury Laboratories well water supply - well No. 2 (within plant)
003432 NA Salsbury Laboratories soil sample on plant grounds
003484 na ^,,:v Salsbury Laboratories Gypsum sludge off of filter
003485 NA Salsbury Laboratories Arsenic sludge off of filter
003494 NA Charles City municipal well No. 4 at 13th andF Streets
003495«
NA Charles City municipal well .No. 6 on South Johnson Drive
003496 NA Charles City municipal wells No. 5 and 7 located at 20ih and Indiana
003483 . 253.2 Boil on right bank of Cedar River approximately 300 ft (90 in) downstream from Main Street Cridg
*Mul tiply by 1.61 to obtain km.
CJ f
i

88
iTORET No'. River Mile* Station Description
003548 253.1 Cedar River approximately 50 ft (15 m) upstream from seep
002471 253.1 Seep on right bank of Cedar River
002472 253.1 Cedar River approximately 150 ft (46 m) downstream from seep
002477 NA Abandoned sand pit near Cedar River at aboutCedar River mile 252.2
003549 252.1 Cedar River downstream from LaBounty site and about 250 ft (77 m) upstream from rail road bridge
002473 251.9 Cedar River downstream from old municipal landfill ’site and upstream from municipal v;astewater treatment plant outfall
000033 NA Municipal wastewater treatment plant.influent
000034 251.8 Municipal wastewater treatment plant effluent
001910 MA Municipal wastewater treatment plant digested sludge out of secondary digester
002474 251.7 Cedar River downstream from municipal wastewater treatment plant outfall
003497 . 250.3 Charles Citv Country Club well located in the NW 1/4,'NW 1/4, SE 1/4, Sec 17, R15W,T95N, approximately 400 ft (120 m) fromCedar River on left bank
003500 NA Private well belonging to Mr. Rodger Mopes located in SW 1/4, SE 1/4, SE 1/4, SN 1/4,Sec 13, R1cW, T95N
003499 '243.5 Private well belonging to Mr. J. PatrickMcDonnell located in SE 1/4, SE 1/4, SE 1/4,Sec 20, R15W, T95M, approximately 100 ft (30 n) from Cedar River on right bank
003493 245.8 Private well belonging to Mr. Dean Krueger located in NW 1/4, NW 1/4, NE 1/4, Sec 34,R15W, T95N, approximately 30 ft (9 m) fromCedar River on left bank
NA Winterin': Farm (Municipal Sludge Disposal Site)
003503 190.2 Waterloo municipal well No. 9 located NE 1/4,SE 1/4, Sec 15, R13N, T89N
^Multiply by 1.61 to obtain km.

89
With the exception of those crop and soil sampling sites on the
Winterink farm (the municipal sludge disposal site) and the Salsbury
inplant sites, the locations of the sampling sites are shown in
Figures 19 through 22.
The data resulting from the sampling on the Winterink farm is to
be presented in a report prepared by the EPA Region VII Air and
Hazardous Materials Division. Therefore, this element of the study
will not be discussed further in this report.
3. SALSBURY LABORATORIES SAMPLING SITES
a. PROCESS WASTEWATER AND WATER SUPPLY SAMPLING
Wastewater and water sample collection sites with the Salsbury
complex included the following points:
Station No. Description
SL-1 Equalization Basin discharge to City Sewer
SL-2 Three-week equalized flow raw waste feed for bench scale treatment units
SL-3 Bench scale activated sludge unit effluent
SL-4 Bench scale powdered activated carbon treatment, uniteffluent
\
SL-5 Salsbury's raw water supply from the well within the plant which they have designated well No. 2
Sampling at station SL-1 extended over a three-day period extending
from 1045 hr September 6 to 0S45 hr September 9. During this period,
three time-composite samples were collected over an approximate
elapsed time of 24 hr using an ISCO 15S0 high speed sampler. The
sampler was prepared for priority pollutant sampling (sanpler•blank
collected) and had been fitted with a Teflon intake line and a 3-gal
(11-1) solvent rinsed glass sample collection container. Samples

90
f
r
FTGUi’r 19. LOCATION HAP - 'AUGUST 1977 SAMPLE COLLECTION SITES IN' CHARLES CITY AREA

91
(

92
FIGURE 21. LOCATION MAP - AUGUST 1977 SURVEY-KRUEGER WELLV

93

94
were analyzed for a number of conventional parameters as well as
nitroanilines and those substances identified as priority pollutants
(Appendix C, Table 1). During the same time period, three sets of
grab samples were also collected for analyses of volatile priority
pollutants as well as phenolics and cyanide. The resulting data is
presented in Appendix C, Table C-2.
Sampling of the raw feed (SL-2) to the bench scale treatment
units was performed in a similar manner. Two samples of this three-
week equalized flow process wastewater were collected.
Sampling of the bench scale activated sludge effluent (SL-3) was
done over a two-day period extending from 0330 hr September 7 to
0745 hr September 9. Because of the limited flow rate through this
unit and the UPA regional laboratory sample volume requirements, itJN.
was possible to collect only one sample of this treated effluent.
The sample was transferred from Salsbury's plastic sample collection
container to a solvent rinsed glass container prior to shipment to
the regional laboratory. Separate samples \;ere pulled out of this
two-day composite for analysis of volatile organics, phenol ics, and
cyam dido.
Sampling of the powdered activated carbon treatment unit effluent
(SL-4) also extended over a two-day period from C920 hr September 7 to
CBl'O hr September 9. Again, because of the small scale of the unit,
only one sample was collected and the samples, normally grabbed, were
pulled cut of the composite.
Salsbury's water supply (SL-5) was manually grab sampled once for
the purpose of determing whether or not there were detectable backgrcun
levels of any of the priority pollutants.

95
The data resulting from the sampling of the five Salsbury
wastewater and water streams (SL-1 through SL-5) is presented in its
entirety in Appendix C, Table C-2.
These data are summarized in Table XXI. The loadings calculated
for SL-1 were based upon the flow rates supplied by Salsbury during
the period of sampling.
An examination of Table XXI would indicate that data are reported
for both phenol and phenolics (total). Phenol refers to the specific
substance analyzed by gas chromatography. Phenolics refer to total
phenolic-like substances as determined by the EPA Methods Manual
(35, p 24).
From a quality control standpoint, there are several points which
should be considered in studying the data resulting from the Salsbury
sample data. The procedure for sampling the equalization basin effluent
(SL-1) followed routine priority pollutant sampling protocol which
specifies solvent rinsed Teflon intake lines and sample collection
containers, and the initial collection of a blank sample. This blank is
also scanned for priority pollutants to make certain that no contaminants
are introduced into the sample as a result of the collection procedure.
The blank (sample No. 902792) resulting from the sampling at SL-1 was
analyzed and was found to contain the following substances which were
at or near laboratory analytical detection limits.
Substance Detection Limit Amount
Di-n-butyl-phathalate 20 vg/1 Trace
Bis(2-ethylhexyl)phthalate 20 yg/1 Trace
20 ug/1Phenol Trace

TAD LE XXI
SUMMARY OF SALS3URY WASTEWATER AND WATER CHEMISTRY ■ MEAN CONCENTRATIONS AND LOADINGS
September 1977
Salsbury Sampling StationSL-1 SL-2 SL-3 SL-4 SL-5
B0D5cone., mq/1 499 330 8.7 4.9 NDloading, lb/d3y 2,300 — — — —
CODcone., mg/1 1,030 713 236 132 NDloading, lb/day 4,700 -- -- — —
NFScone., mg/1 ; 16 ND 124 ND NDloading, lb/day 73 -- —
NH3-Ncone., mg/1 172 ND 124 ND NDloading, lb/day 775 — -- -- --
NO2-NO3-Ncone., mg/1 43 4.4’ 104 172 NDloading, lb/day 210 -- -- —
TKNcone., mg/l 190- 170 129 . 51 NDloading, lb/day 920 -- — —
Total Pcone., mg/l 0.4 2.0 47 5.5 NDloading, lb/day 1.3 -- --
Conductivity, irho/cm 7,600 6,520 6,670 6,800. ND
Color, CPU's 3,090 2,920 2,260 1,500 ND
pH 9.1-9.1 8.0-8.0 7.3 7.0 ND
■'Arsenic (Total! cone., wg/I 6,200
! 9,100 13,800 7,500 <10
loading, lb/day 23 -- -- --♦Cadmium (Total)
cone., yg/1 <1 <1 <2 <2 <1loading, lb/day <.005 -- — -- —
♦Chromium (Total)cone., };g/l <6 8 <5 <5 <5loading, lb/day <0.2 -- -- — —
♦Copoer (Total)10cone., pg/1 28 32 30 <5
loading, lb/day 0.13 ” “ " "
-- No flov; data.ND No data.* Priority pollutant.

TABLE XXI
(Continued)
Parameter Salsburv Sampling StationSL-1 SL-2 SL-3 SL-4 SL-5
♦Lead (Total)cone., ucj/1 <5 <50 <5 <5 <5loading, Ib/day <0.2 — — — --
*Nickel (Total)cone., Pg/1 <50 <50 <50 <50 <50loading, lb/day <0.2 — -- --
♦Selenium (Total)cone., ug/1 270 190 190 190 <5loading, lb/day 1.2 -- -- — --
♦Silver (Total)cone., i;g/l <2 <2 <2 <2 <2loading, lb/day <0.01 -- — -- --
♦Barium (Total)cone., ug/1 <100 A O O <100
oo<\JV <100
loading, lb/day <0.5 -- -- -- —
♦Antimony (Total)cone., v-g/1 70 76 89 87 <10loading, lb/day 0.31 -- — — —
Tin (Total)cone., ug/1 <2,000 <2,000 <2,000 <2,000 <1,000loading, Ib/aay <9 -- -- -- --
♦Mercury (Total)cone., f.g/1 6.9 24 HD 1.5 <0.2loading, lb/day 0.3 — -- — --
♦Beryllium (Total)cone., rg/1 1.5 2.0 ND 1.6 <1loading, lb/day 0.007 — -- --
♦Thallium (Total)core. , uq/1 <8 ■5 ND <5 <0loading, lb/day <0.04 -- -- — —
♦Zinc (Total)cone., vig/1 59 76 ND 57 33loading, lb/day 0.26 -- -- — --
C'rtho-nitroanil inecone., pg/1 7,000 5,600 4,100 500 NDloading, lb/day 31 -- -- -- —
Para-nitroanil inecone., pg/1 6,600 5,000 <50 <50 NDloading, lb/day 26 — ■ --
— No flow data.ND No data.* Priority pollutant.

9S
TABLE XXI
(Continued)
Salsbury Sampling StationParameter
SL-1 SL-2 SL-3 SL-4 SL-5
*Phenolcone., ug/l 16,500 15,000 ND <20 <20loading, lb/day 80 — a -- --
*2-Nitrophenolcone., Mg/1 4,100 10,000 ND <20 <20loading, lb/day 20 -- — — —
*4-Nitrophenolcone., vq/1 1,100 3,250 ND <20 <20loading, lb/day 5.3 -- — — —
*Nitroben:enecone., i-g/1 30 50 ND <20 <20loading, lb/day 0.1 -- -- -- ■ --
*£-Bf!Ccone. , wg/1 26 12 7 ND NDloading, lb/day 0.12 — — — —
*1,1,2-Trichloroethane cone., ng/1 ■•3,400 <20'' ND ND <20loading, lb/day >16 -- --
*Tric'nlorcfl uoromethanecone. , ng/l loading, lb/day
<50<0.23
<20 <20
*Nethylene chloridecone., vg/1 <50 <20 ND ND 30
*1,1-Diehloroethylenecone., j;g/l >290 <20- ND ND 20loading, lb/day >1.3 — ““ —
Phenolics (Total) ccnc., mo/1 49,000 1 ,800 360 80 <5loading, lb/day 220 -------------- —
. -- - ~Cyanide
cone., mg/1 1.8 1.7 0.16 0.1 NDloading, lb/day 8.0 ” “
— No flov/ data.ND No data.* Priority pollutant, t Trace.

99
Based upon past experience, these substances probably resulted
from plasticizers in the pump tubing of the sampler which were leached
out when the water was flowing through it. All other substances
scanned for were not detected.
There were some inherent quality control problems introduced in
the sampling of the raw feed used in the bench scale units and in
the bench scale units as designed. Strict adherence to sampling
protocol requires that all material which the sample comes in contact
with be made of glass or Teflon. The feed solution for the bench
scale units was in a large plastic barrel and the bench units were
constructed of plastic, and included various rubber and plastic hose
connections. It is possible, because of the large wetted surface
to volume ratios of these small scale units, that some substances not
in the process wastewater may have been introduced into the sample
and have affected the analytical data for SL-2, SL-3, and SL-4.
b. WASTE SLUDGE
In addition to the process wastewater, two grab samples of sludge
from Salsbury’s wastewater pretreatment plant 'were collected off of
the company’s filters. One of these samples consisted of the gypsum
sludge 2nd the other was the arsenic sludge. The samples 'were collected
in solvent rinsed 3-gal (11-T) glass jugs. Sample identification
information and laboratory analytical results (dry ’..'eight) were
as follows:
Gypsum SludgeLaboratory Sample Do.: 902S35Date: .September 9, 1977 Tine: 0929 hrArsenic (Total): 400 mg/kgOrtho-rii troaniline: 5 mg/kg
Arsenic SludgeLaboratory Sample f!o.: 902836Date: September 9, 1977Time: 0930 hrArsenic (Total): 140,000 mg/kgOrtho-nitroanil hie: 778 mg/kg

lOu
It should be kept in mind that these analytical results are from
single grab samples and may not be typical of Salsbury's sludge on an
average basis.
C. SALSBURY SOIL SAMPLE
In February of 1977, a grab sample of Salsbury's permitted cooling
water was collected during a rainfall event. This sample was found
to have a high arsenic concentration (15,800 pg/1). Because of this
finding, it was decided to collect a soil sample on plant grounds in
order to get some idea of the amount of material in the soil which
might be leached out during runoff events. In company with Mr*. Russell
Smith, a Salsbury official, two composite soil samples were manually
collected from shallow soil borings [6 in. (15 cm) or.less] from
nine different locations on plant grounds. Figure 23 shows the
approximate locations of these borings. These two samples were
collected in solvent rinsed 1-1 glass jars. One sample was turned
over to Mr. Smith and the other shipped to the regional laboratory
for analysis. Sample identification information and EPA laboratory
analytical data were as follows:
Laboratory Sample flo.: 902833Date: September 7, 1977Time: 1400 hr , ,Arsenic (Total): 550 mg/kg*Ortho-nitroani1ine: 149 mg/kg*
4. WILDWOOD PAPJ' SEDIMENT SAMPLES
Because of previously reported Salsbury spijls (IDEQ records)
and the arsenic found in the cooling water discharge in February
*Dry weight.

j*-------H r
SALSBURY

102
of 1977, it was decided to sample the sediments in the stream which
runs through Wildwood Park. Three samples were manually collected in
center channel, one sample was collected at the foot bridge over the
stream and the other two samples were collected at locations which were,,
respectively, approximately 50 and 100 ft (15 and 30 m) downstream from the
foot bridge. These samples were collected in solvent rinsed 1-1 glass
jars with Teflon lid liners. The sample identification information
and laboratory analytical results are presented in Table XXII.
5. riUNICIPAL WASTEWATER TREATMENT PLANT
a. WASTEWATER
The Charles City municipal wastewater treatment plant raw combined
industrial and domestic v/astewater and treated final effluent were
sampled for three days. Sampling extended from approximately 0800 hr
September 6 to 0530 hr September 9. During this period, two composites
with grab samples and one set of grab samples were collected from the
influent (ST0RET No. 000033), and three sets of composites with grab
samples were collected from the final effluent (ST0RET No. 000034).
An ISC0 Model 1680 high-speed sampler was used on the influent.
The unit was fitted with a 0.375 in. (0,95 cm) ID solvent rinsed
Teflon intake line and 3-gal (11-1) glass jug sample collection
container. The unit was prepared for priority pollutant sampling
(blank collected) and was programmed to take flow proportional
composite samples using an ISC0 Model 1700 flow meter which was
calibrated to the plant primary flew measurement flume. Three*
sets of grab samples were collected for volatile, organics, cyanide,
and phenolics analysis.
i

TABLE XXII
WILDWOOD PARK STREAM SEDIMENT SAMPLE DATA
September 1977
STORETNo. Site Description
Lab.No.
Dateday-mo
Time(military)
As* mg/kg
ONA*mg/kg
003488 Stream at foot bridge 902838 5-9 1320 1,460 1
003489 ' Stream 50 feet downstream from foot bridge
902839 5-9 1330 130 2
003490 Stream 100 feet downstream from foot bridge
902840 5-9 1345 70 1
*Dry weight.

104
The procedure for sampling the effluent was similar. At this
location, an ISCO model 1392 was used and because of the absence of
a primary flow measurement device, 24-hr time-composite samples were
collected.
The analytical data resulting from this sampling can be found
in Appendix C, Table C-3. These data are summarized in Table XXIII
which presents the data for conventional parameters, heavy metals, and
trace organics which were found at concentrations which were equal to
or greater than the analytical detection limit. The table shews mean
concentrations and loadings and mean removal efficiencies for both
concentration and leadings.
The influent and effluent sampler blank identification information
and analytical results were as follows:
Influent Blank
Laboratory fie.: 902303Date: September 5, 1977Time: 1615 hr
Substance
Di-n-butyl-phthalateBis(2-ethyl hexyl)phthalatePhenol
Detection Limit Amount
20 yg/1 Trace 20 pg/1 Trace 20 ^g/l Trace
Effluent Blank
Laboratory Mo.: 902815 Date: September 5, 1977 Time: 1530 hr
Substance
Di-n-butyl-phthal 3teRis(2-ethyl hexylJphthalatePhenol
Detection Limit Amount
20 „g/l Trace 20 ug/1 Trace 20 iig/1 Trace

105
TABLE XXIII
SUMMARY OF CHARLES CITY MUNICIPAL WASTEWATER TREATMENT PLANT CHEMISTRY DATA
MEAN CONCENTRATIONS AND LOADINGS
September 1977
ParameterTREATMENT PLANT STATIONS
Influent Effluent % Removal
C0P5cone., mg/1 224 38 83loading, lb/day 3200 550 S3
CODcone., mq/1 540 201 63loading, lb/day 7500 2910 62
NFScone., mg/1 80 13 84leading, lb/day 1070 190 82
NH3-Ncone., mg/1 56 52 7loading, lb/day 800 740 8
(’O2-NO3-Ncone., mg/1 10.7 1.98 81loading, lb/day 153 27.3 82
TKNcone., ma/1 63 59 13loading, lb/day 1010 340 17
Total P cone., mg/1 5.0 2.3 54loading, lb/day 70 33 53
Color, CPU 1550 1270 18
pH 7.4 - S.l 7.1 - 7.3 —*Arsenic (Total)
cone., ug/1 2500 1400 44loading, lb/day 35 20 43
*Carimium. (Total)cone., vics/1 <1 <1 --
loading, lb/day <0.02 <0.02 —*Chromium (Total)
cone., ug/1 <0 <7loading, lb/day <.09 <.09 —
*Coppar (Total) cor.c., ug/'l • 43 24 50loading, lb/day .55 .34 A 0 'to
Prioritv pollutant

105
r
<
TABLE XXIII
(Continued)
SUMMARY OF CHARLES CITY MUNICIPAL WASTEWATER TREATMENT PLANT CHEMISTRY DATA
MEAN CONCENTRATIONS AND LOADINGS
September 1977
ParameterTREATMENT PLANT STATIONS
Influent Effluent % Removal
*Lead (Total)cone., yg/1 21 <5 >76loading, lb/day .29 <.07 >76 -
♦Nickel (Total)cone., yg/1 <50 <50 —loading, lb/day <0.7 <0.7 —
♦Selenium (Total)cone., yg/1 50 48 4loading, lb/day .75 .69 8
♦Silver (Total)cone., yg/1 <5 <2 —
loading, lb/day <0.07 <0.03 —Barium (Total)
cone., yg/1 <200 <200 --
loading, lb/day <2.8 <2.8 —♦Antimony (Total)
cone., yg/1 17 19loading, lb/day .20 . .27 —
Jin (Total) cone., yg/1 118 75 36loading, lb/day 1.6 1.1 31
♦Mercury (Total)cone., yg/1 3.8 1.9 50loading, lb/day .04 .03 25
♦Beryllium (Total)cone., yg./l <1 <1 —loading, lb/day <0.01 <0.01 —
♦Thallium (Total)cone., yg/1 <5 <51 o3dir.g, lb/day <0.07 <0.07 —
♦Zinc (Total). cone., yq/1 113 75 .35
leading, lb/day 1.6 1.1 31
Grtlionitroanil ire cone., ug/1 2300 lion 52loading, lb/day 33 16 52
■■ Priority pollutout

103
b. DIGESTED SLUDGE
Three grab samples, one per day, of the settled digested sludge
were collected while sampling at the treatment plant. These samples
were manually collected in 1-1 solvent rinsed glass jars with Teflon
lid liners. The sanples were analyzed for conventional parameters
and ortho-nitroaniline. The resulting analytical data are presented
in Table XXIV.
6. CEDAR RIVER
Sampling of the Cedar River was structured, as much as possible,
to isolate and to determine the relative magnitudes of those known
and suspected sources of Salsbury wastes. These sources included
(a) the company's cooling water discharge via the Wildwood Park
stream, (b) the seep and boil along the right bank of the Cedar River
between Main Street and Brantingham Street bridges, (c) leachate from
the LaDounty Disposal site, (d) leachate from the old municipal
disposal site, and (e) the municipal wastewater treatment plant
effluent.
The location of the sample collection points are shown
in Figure 19. The upstream station at the suspension bridge
(STORET No. 002470) was selected as a control station because there
were no known or suspected sources of Salsbury waste upstream from this
station. The intermediate stream sampling stations were selected to
bracket the previously mentioned sources. The furthest downstream
station (STORET No. 002474) was selected because of the hydraalic
characteristics which made stream gauging possible and because it
was the closest suitable sampling point which was downstream from

109
TABLE XXIV
CHARLES CITY MUNICIPAL WASTEWATER
TREATMENT PLANT DIGESTED SLUDGE
September 1977
Lab. No.Date, day-monthTime
9029257-90900
9028278-90815
9028299-90715
Mean
Lab pH 5.8 5.9 5.8 —
NH3-N, mg/1 312 422 362 365
TKN, mg/1 ,24,600 39,300 25,200 29,700
NO2-NO3-N, mg/1 — <0.04 <0.04 —
Total Phosphorous, mg/1 5,900 9,700 6,700 7,430
As, mg/kg (Total) 800 620 710 710
Cd, mg/kg (Total) 12 11 16 13
Cr, mg/kg (Total) 55 48 56 53
Cu, mg/kg (Total) 580 510 • 570 550
Zn, mg/kg (Total) 1,820 510 570 970
Ni, mg/kg (Total) 61 59 66 62
Ortho-nitroaniline, mg/1 <3 <2 <2 <2

no
all known sources. It was felt that this station would produce the
most representative water chemistry data because attenuation of pollutant
concentrations by sedimentation or other means would be minimized.
The close proximity of the sampling locations to the sources
required a rather laborious sampling procedure in order to obtain
representative stream loadings. Data collected in February of 1977
(Table XVII) indicated that arsenic concentrations within this
reach of the stream were not uniform across the various cross-
sections because of limited travel time and inadequate mixing. All
of the river stations, with the exception of the suspension bridge
station (STORET No. 002470), were flow proportionally sampled. The
cross-sections were first stream gauged and each cross-section was ,
then divided into five segments of equal flow. Using a 5-1 glass
graduated cylinder, equal volume sample aliquots were taken out of
each segment and composited in a 3-gal (11-1) solvent rinsed glass
jug to produce a single composite sample. In each segment, smaller
aliquots were taken at random depths and horizontal distances. The
stream station at the suspension bridge was randomly grab sampled at
various points across the stream. Because of the water depth at this
point, the river was not gauged.
Within this stream segment,.two point sources were sampled
which included the seep (STORET No. 002471) that was previously
sampled in February of 1977 and a boil (STORET No. 003483) which was
pointed out to SVAN personnel during the August-September- 1977 survey
by a city employee. This boil, located on the right bank at the
junction of the water-bank interface resembled a small spring with

Ill
(
enough upward flow velocity to break the water surface. This boil
was grab sampled once for arsenic.
The seep was grab sampled for arsenic and composited for trace
organics using a column accumulator similar to the accumulator
technique described for the August 1975 survey. The sampling train,
proceeding from source through the column, consisted of a Teflon intake
line, a glass chromatography column filled with approximately 30 cu cm
of Rohm and Hass XA-D resin, a Brailsford EP-1 sampler, and a 5-gal
(19-1) carboy for volumetric determination of sample quantity.
Accumulation extended from 0930 hr August 30 to 1730 hr September 9.
During this period, approximately 10.3 gal (39 1) of water was passed
through the column.
Table XXV presents the water chemistry data and river leadings
resulting from the sampling and stream gauging.
7. SAND PIT
The standing water in the sand pit (ST0RET Mo. 002477) was
previously sampled in February of 1977 for heavy metals because of the
yellow color noted in the ice during the February 1977 reconnaissance.
This pit v/as resampled in August for arsenic. The sample identification
information and analytical results were as follows:
Laboratory Sample Mo.: 902893Date: August 31, 1977Time: 1605 hrArsenic (Total): 14 vg/l
8. MUNICIPAL AMD PRIVATE HELLS
The August 1975 survey resulted in the detection of arsertic and
ortho-nitroaniline in the Cedar River at Nashua and Janesville which are,
respectively, 11 and 45 miles (13 and 72 km) downstream from Charles City.

12
TABLE XXV
CEDAR RIVER CHEMISTRY DATA AND LOADING RATES
August-Septernber 1977
SAMPLING STATION AND (STCRET NUMBER)
ParameterSu
spen
sion
Bri
dge
(002
470)
Boi
l(0
0348
3)
Ups
trea
m
from
Seep
(0
0354
8)
Seep
(002
471)
1 cx .ClU CJ CVJvn ktc Ccv3: O Oo u o
, .C. «+- ' Dov
;nst
ream
of
Lab
ount
y Site
(0
0354
9)
Ups
trea
m fro
mST
P Out
fall
(002
473)
Dow
nstr
eam
from
STP O
utfa
ll (C
0247
4)
River Mile 253.70 253.27 253.11 253.10 253.09 252.10 251.75 251.65
Grab Sample Info.Lab No. (902 series) SSI S34 883 879 805 8S7 839 "891
Date, day-mo. 30-8 D-9 30-S 6-9 30-S 31-8 1-9 1-9Time, military 1650 0300 1300 1745 1545 1530 1500 1730
Flow rate, cfs — — 16S — 156 174 140 172
♦Arsenic160 lr.O 210cone., ug/1 720 9 1030 7
loading, lh/day — -- 8 -- r, 140 lit ]ng
Orthonitroani1ine0.07cone., iic/1 <0.1 — 0.2 74 P.'1 0.03 0.03
loading, lb/day — — 0.2 -- 0.3 o,03 0.02 0.05
Chloronitrobenzene cone., i-g/1 nrj/i „ <n.r,n.t P <0.nn4
>
<0.004 <0.004 0.03loading, lb/day -- — — — - - •
♦Nitrobenzene<0.01cenc., ..q/1 .'H — <0.01 870 <0.0! <0.01 <0.01
*Phenol, ug/1 — — — N <20 — -- ■ --
*Crtho-nitrophenol, yg/1 — -- — N ;?0 — -- --
*Para-nitrophenol, pg/1 -- -- : i <20 —■
Dir.itrobenzoic Acid -- — -- n N — --
No analysis cade "or :io flow measurement.P - Present: the compound was present, but not quanti:icd.
f! - Not found: the compound was no! identified or vas not a major component of the mixture. The detection licit was not deterr.vied.
* Priority pollutant.** Grab sample information refers to arsenic only. Organics were accumulated in a
column beginning 30-8, OD30 hr. and ending n-°, 1730 hr.

113
(
TABLE XXV
(Continued)
CEDAR RIVER CHEMISTRY DATA AND LOADING RATES August-September 1977-
Parameter'
SAMPLING STATION AND (STORE! NUMBER)
Susp
ensi
onB
ridg
e(0
9247
0) COcoV
»— ro •r- Oo o
C2 -—’ Ups
trea
m
from
Seep
(0
0354
G)
*Hr-*
Q_ CMCj Oa oOO D
owns
trea
m
from
Seep
(0
0247
2)
w- aO 4-»
E= xst6 ^ i- —* c>+-> ct/> ’J 1 .1c o co5 -O oO COO __ I U
pstr
eam
from
STP O
utfa
ll
(0C
2473
)
F:OU4-
§ d
c> if- «■—«* i- +->4-* 3 IS
in o c <v^ rx O O h- O
C2 U-* '—'
River Mile 253.70 253.27 253.11 253.10 253.C9 252.10 251.75 251.65
Grab Sample Info.Lab Mo. (902 series) ESI 834 833 879 S35 837 8? 9 891
Date, day-mo. 30-8 9-9 39-8 6-9 30-8 31-8 1-9 1-9Time, military 1650 0330 1309 1745 1545 1533 1500 1730
Para’ni troani 1 ine — -- — t: -- — — —
Cnloroaniline — — --p.
-- -- — —
Aminochlorobenzene — -- — p — — — —Chloronitrotoluene — -- -- p — -- — --
Dichloroaniline — — -- p — — — —
Atraz ine — — — p , — -- — --
Mai ath ion — — — p -- -- — —
fie analysis made or no flow measurement.
P - \i -
* +
Present: the compound was present, but not quantified.
Not found: the compound was not identified or was not a major component of the mixture. The detection limit was not determined.
Grab sample information refers to arsenic only. Organics were accumulated in a column beginning 30-S, 0930 hr. and ending 0-0, 1730 hr.
r

114
In addition, the distinctive yellow color associated with Salsbury's
wastewater had been observed in the river ice at Nashua during the
February 10-11, 1977, reconnaissance. Because of these two factors
and the inclusion of some Salsbury compounds on the EPA priority
pollutant list, there was concern that the material might have been
introduced into the alluvial groundwater and, consequently, have
contaminated drinking water wells. Because of this concern, eight walls
were selected for arsenic and trace organics sampling. These wells
included (a) the two active wells in Charles City number 4 and numbers
5 and 7, which are manifolded together at the water treatment plant,
(b) the Charles City well !!o. 6 which is a standby well and the well
that is nearest to the Salsbury complex, (c) the Charles City Country
Club well, (d) three private wells serving single family dwellings,
and (e) the municipal well No. 9 in l.'aterloo which is the nearest to
the Cedar River, approximately 500 ft (150 m).
These wells were manually grab sampled for arsenic analysis.
Again, for trace organics sampling, a resin column accumulator was
used. The well water was passed through the column by periodically
refilling a laboratory cleaned, solvent rinsed 55-gal (210-1)
stainless steel drum and continuously drawing water out of the
drum through the column with Signanotor samplers, which pumped at
rates between 35 and 50 ml per minute, depending upon the particular
sampler used.
The water chemistry data resulting from the well sampling is
presented in Table XXVI.

115
TABLE XXVI
MUNICIPAL AMO PRIVATE Vi ELL HATER
CHEMISTRY DATA CONCENTRATIONS, ug/l
August - September 197?
Parameter
Well and (STORET Number)
>>•/"utno cr»
r— «£-s-f— CO Or* Or ci o CJ Zul '—*
>>4->OC/» O LOCJ ^ CT»
•— 1— COn r- o oo
>»P^4-»•r— eOo in —»■o cr> »— n vr i. •— co r; ■— O — o O O --
-OZ3
O>»V- O4-> V-‘C *— CO3 *— o o c» oc_> Zui -—
Cf c\c oc -c-Or-no*— o u oo
oov> u“>O'— COo^— oO fli o K
rueg
erW
ell
(003
498) Oo mr- O
t.o *— ro -U» r— Or» O O
Grab Sample Info.
Lab Mo. (902 series) 8 A 6 850 354 857 £53 855 850 875
Date, day-mo. 2/9 1/9 2/9 3/9 5/9 5/9 5/9 3/9Time, military 1545 1000 1340 0920 1009 1200 1030 0340
*Arsenic, vg/1 <5 <5 <5 <5 <5 <5 <5 <5
Resin Column Info.Lab ilo. (902 series) 845 843 852 855 852 855 550
(874
Sample Volume, gal.** 53 53 91 50 53 41 63 95Start Date, day-mo. 31/3 01/9 31/3 02/9 03/9 05/3 0-/9 02/9Start Time, military UCO 10C0 1235 1525 1000 1200 1030 1139Stop Date,.day-mo. 04/9 05/9 C5/9 05/9 03/9 C3/9 03/9 P3/9Stop Time, military 0330 1020 0330 1945 1345 1400 1315 1145
Orthonitroaniline <0.002 <0.002 <0.092 <0.002 <0.032 <0.002 <0.002 0.0n
Paranitroanilir.e M M r< N N H r< It
Chloroani1ine M M r; M N M M P
Chloro.n ifrobe.nzene All values <0.0001
Aminochlorober.rer.e H »iu M M M M M M
Ciiloronitro toluene N M M r: t! ‘i ii fl
Dichlorcaniline M M fl M M f:i It
•* Priority pollutant.Multiply by 3.79 to obtain liters.
No determination madeCompound was present but not quantifi
Mot found: the compound was not ido-t of the mixture. The detection iru
less than value: the compound was rot
was specified..
ified or was not a ma v.'as not determined.
:'o :uJ and the i imit
jer
or
component
detect ion

116
T.43LE XXVI
(Continued)
MUNICIPAL AND PRIVATE WELL WATER
CHEMISTRY DATA CONCENTRATIONS, yg/1
August - September 1977
Well and (ST0RET Number)
Parameter
>»•r*Ut*> sj-CJ C7»•— r?5- — CO i?t~0 ^ C> O O --
>>4->•i*c_>t*» \Si t.r>O ^ 09
-— cs- •— mO i— o SI 2> C? 0^3--
•r- eOO LD ■—' IV4MO .£> Car—i- »— r-> n r— o r a o O zs >-*■
_0zjo>> r^5- CT»j-> vrc *— roS-f—Oo o o o r-z *—
o c»C CTiCO «— r*>O r— o u a o
oov* u">Or- O)c±<— o JT* P c>
t- COO COL?i «A.“O r— C“> 3 r— O S- O O ii -—
O r—so m «— oO r— O')Oci c> C>I-I If ♦
Resin Column Info.
Lab No. (30? series) 345 OAOv,lfv TCOJ Ji. C56 S 52 oo [> 859 37 *
Samele \clume, gal.** 53 53 91 50 53 41 63 95 ■Start Date, day-m.o. 31/3 01/9 31/3 02/9 05/9 05/9 04/9 02/9Start Time, military 1100 1000 I??5 1525 1000 1200 1030 1130Stop Pate, day-mo. 04/9 05/9 05/9 05/9 03/9 03/9 03/9' 03/9Stop Time, military 0330 1020 0S30 19-0 5 1345 MOO 1315 1145
Atrarine N >» i < kiU N . N N P r»rMai athion h N r: M P N ft11
*■
♦Nitrobenzene •o.ooi •-'0.001 <0.001 <0.001 <0.001 <0.001 <0.001 <0.001
♦1,1,2-Trichioroethane
♦Phenol V. i! N N N N N
♦OrLhonitrophenol ii M n f: MI« . i > r;
'Paranitrephenol »• i. N N N N f! »>• iDinitrobenzoic Acid N ji • *’ N N !) fi
* Priority pollutant.
** Mult iply by 3.79 t.-> obtain liters.
— No cctcrr.ii.ation made.
P - Ccnr.ound was present but not quantified.
i: - Not found: the compound was r.ot identified or was not a major coraonentof the mixture. The detection 1 irrit. was not determined.
< - less than value: the compound was not found and ttnj limit, of detect ionwas specified.

117
The reported depths of the wells are as follows:
Well Depth, ft'
Charles City Municipal Well No. 4 1,250
Charles City Municipal Well No. 6 1,355
Charles City Municipal Well No. 5 186
Charles City Municipal Well No. 7 186
Charles City Country Club Well 293
McDonnell Well unknown
Mapes Well 155
Krueger Well 28
Waterloo Municipal Well No.
AIR SAMPLES
9 85
Previous field trips to Charles City had indicated the strong
odor of volatile orga~nics in the vicinity of the LaBounty disposal,
site and the municipal wastewater treatment plant. Because of this
reason, one sample was collected downwind of the disposal site and
four .samples were collected at various locations within the treatment
plant. Samples were also collected for particulates.
Sampling for particulates at the disposal area was conducted with
a high volume sampler operated for approximately 12 hr.. Sampling for
gaseous pollutants at this site was conducted by drawing ambient air
through Tenax adsorbtior, columns for a period of approximately 4 hr.
Sampling for particulates at the sewage treatment plant site was
conducted with a high volume sampler located between the trickling
filter and secondary sedimentation basin and operated for approximately
’'Multiply by 0.305 to obtain m.

118
24 hr. Sampling for gaseous pollutants at the sewage treatment
plant was conducted by drawing ambient air through tandem Tenax
adsorbtion co.lumns for a period of approximately 24 hr at each of
the following locations:
1. Inside the pump room attached to the administration building.
2. At the bottom of the intake structure near the bar screen.
3. Inside the covered trickling filter.
4. On the treatment plant grounds between the trickling filter
and the secondary sedimentation basin.
Results of the quantitative analyses of the particulate samples
are shown in Table XXVII. Total suspended particulates at each
location was less than the national secondary air quality standard for
particulate matter (60 yg/cu m, annual geometric mean). The particulate
samples were analyzed for the foil awing metals: total arsenic, total
selenium, total copper, total zinc, total lead, and total cadmium.
These analyses revealed only trace amounts of each of these six
metals.
Results of the qualitative analyses of the gaseous 'samples are
shown in Table XXVIII.
10. Precipitation
The official rainfall record (40) for th
in Charles City is reproduced as follows for
September 9, 1977, period. Field sampling ac
August 39 through September 9.
meteorological station
the August 20 through
tivities extended^ from
i . •

119
f
TABLE XXVII
AIR SAMPLE PARTICULATES
PollutantWaste Disposal
AreaSewage Treatment Plant Grounds
Total suspended particulates 58 ug/cu m 51 ug/cu m
Total arsenic <0.1 ug/cu m <0.1 ng/cu m
Total selenium^ ’
<0.1 ug/cu m <0.1 ug/cu m
Total copper <1 ug/cu m <1 ug/ci; m
Total zinc <0.1 ug/cu m <0.1 ug/cu m
Total lead <0.1 ug/cu m <0.1 ug/cu m
Total cadmium <0.1 ug/cu m <0.1 ug/cu m
V

120
TA3LE XXVIII
AIR SAMPLE GASEOUS POLLUTANTS
Location andSample Number
Compound
LaBountvHaste disposal area (No. 24, Mo. 19)
phenol
1,1,2-trichloroethane (C2H3C13)
Inside pump room of a dm.' bldg.(No. 28, No. 35)
1,1,2-trichloroethane (CoH3C13)
tetrachloroethylene (02014)
dichlorobenzene (058401?)
hexachloroethane (C2CI5)
Intake structure near bar screen (No. 2, No. 9)
1,1,2-trichloroethane (0283013)
tetrachloroethylene (C2CI4)
Under trickling filter cover(No. 31, No. 23)
1,1,2-trichloroethane (0283013)
chloronitrobenzene
STP grounds bc-tv/een trick!mg filter and secondary sedimentation basin(No. 16, No. 6)
1,1,2-trichloroethane (C283CI3)
tetrachloroethylene (03014)

121
Date Rain, ii
August 20 0.25August 21 0.60August 22 0August 23 0.04August 24 0.02August 25 0August 26 0.41August 27 0.32August 28 1.54August 29 0.10August 30 0August 31 0.33
Date Rain, in
September 1 TraceSeptember 2 TraceSeptember 3 0September 4 0.05September 5 TraceSeptember 6 0September 7 0September 8 0September 9 0.11
♦Multiply by 2.54 to obtain cm.

122
V. DISCUSSION
There are a number of parameters associated with Salsbury's
process wastewater which include color, arsenic, phenol and phenolics,
nitrophenol, trichloroethane, ortho-nitrcaniline, and para-nitroaniline.
The two substances which the greatest amount of analytical work
has been devoted to and which appear to be most widely dispersed
in the Charles City area and in the Cedar River downstream are
arsenic and ortho-nitroanilir.e. Table XXIX summarizes the data
on these two parameters for various selected sampling stations.
An examination of these data would indicate that arsenic and
ortho-nitroani 1 ine (O'iA) were found at Janesville, 44 miles (71
km) downstream from Charles City. In addition to these data,
arsenic has been found in Salsbury's cooling water discharge
(Table XVII) and in the sediments of the stream in Wildwood Park
(Table XXII), which is the receiving stream for the company's
cooling water discharge.
The single grab sample collected from Salsbury's cooling
water discharge in February of 1977 was found to contain 15,oOQ ug/"!
of arsenic. Since a light rain had begun early in the morning hours
oT February 23 and continued intermittently throughout the day, it is
possible that this high concentration resulted from plant runoff
rather than any direct discharge of process waste. Regardless of the
cause, this arsenic concentration is an apparent violation of
Salsbury's permit and it is probable that violations occur during
any significant runoff event. During an "initial flush," much
higher concentrations could be anticipated.

TABLE XXI):
r
SUMMARY OF ARSENIC AND OPrilO-NITROANILINE (ONA) RESULTS
Survey andFai a netcr
.
Sampling Location (ST0RET !!o.)
CDro T>>» h'3‘CJr~n “g U- f -
C\Jrr. 4j o •r- .y O
o __<i> o
c:0/ u nr Ci.'*” eg v t. O 3 CtJ O
<✓) -
f.•y
CJuZ
c *,) tr. a* u»o:iy -U 'J» jl • r-
+-* u <:• o to o r> -
n03M
r— roo 8ro *—'
«»-otr ^ to 00
’3't_ cun
4-» rj('lv« aOll.t/lo.')
•2a t jo» olb Cj
tr* '--'
r
i- u eg4-) i-—V* t/> *-fc: egt; 4- oo o c*
>4-JIT c:
ty 3at o1 t'j 07«-» *=r wt/l _1 U)c; •'>7*. u.. o o o o
O '*-<
'4-o17oj r». s-n. *r
4 J— CJVC/*> L_Aa tv
u•1)♦ *
>7s.n a» o
J.I *4 O'v> 1/1 V—
i— r*J Oto : : o
tr* -
4-ico3
»i- m t: ro
*— CDo
n. o *— ovO —
44c0/3
**- rt **- f> .UJ o o a. ti k— o to <
E
<vO *-«.
cl «r44HNV> L/1C (Mt; Oo o o o »—
£•C3O T5U tQ
O4-» a:<
(->Ca>E
TJC A©
<0 3 F^.3 0'#’ -rr o.og VI E oU »-* O
01
•v- n> r—v> O'UJ —_|8
River Mile 262.4 793.8 703.4 753.2 753.1+ 253.1 253.1- 252.1 251.9 HA - NA 251.8 251.7 245.6 242.6 207.6
August 1074
O’.A cone., ug/1 5,500 3.600C1LA loading, lb/day 69 45
Ajoust 1975
C'iA cone., ,g/l '0.2 16,000 4,000 2,200 7.7 8'J'iA loading, Ib/day
-- 75 50 26 50As cone., ,:n/l 3 6,000 1,400 1,100 21 14As loading, 1 b/ci.oy 14 28 15.5 12 57
Fob. 1977
As eerie., '.g/1 • 0 2,200 14 37 1,850 67 60 5As loading, Ib/day 3.5 -* 8.2 22 39
June 1977
Sedi; "nt Sarible:As cone., nj/kg "0.8 30 107 87 239 167
Ajg.-Sept. 1977
GOA cone., jg/1 <0.1 C. 2 74 0.4 0.03 0.03 7,000 2,300 1,100 0.07OOA loading, lb/doy -- 0.2 -- 0.3 0.03 0.02 31 33 16 0.05As cone., pg/1 5 770 3 1,030 7 150 leo 6,200 2,500 1,400 210As loading, lb/day ~ “ ” “ G “ “ 6 140 144 20
______
35
_____
20 195
roCO

124
The June 1977 sample data indicated a definite increase in
arsenic concentrations in the Cedar River sediments. This increase
is shown graphically in Figure 24. At Floyd, which is upstream
from any known arsenic source, the concentration was 20.3 mg/kg.
Downstream from the disposal sites, the concentration had increased
to 107 mg/kg. In the Nashua impoundment, 9 miles (15 km) downstream,
the three sediment samples collected (Table XIX) had arsenic con
centrations of 92, 277 and 132 mg/kg. It can be seen that downstream
of Charles City there was a general increase in sediment arsenic
concentrations as the arsenic level in the water phase declined.
It is apparent that significant amounts of arsenic introduced
to the river from the various sources were deposited as sediment.
This mechanism is the principal reason why the Cedar River sampling
stations were selected and why such a laborious stream sampling
procedure was used in August-September of 1977. One of the primary
objectives of that study was to isolate the various sources of
contaminants and to determine the relative magnitudes of the
contributions. Had the sampling station immediately downstream
of the treatment plant been selected at a point further downstream
in order to insure adequate contaminant mixing, additional arsenic
would have been lost to the sediments. Quantitative estin3t.es
of sediment yields would have required an inordinate amount of
field and analytical work.
Looking at the August-September 1977 data for the Cedar
River, it can be noted that the co.ncentracior. and loading downstream
from the disposal sites was 180 rg/l and 144 lb/day (65 kg/day),
respectively. These concen[.rations exceeded the Iowa viator quality
standard; (100 ug/1).

*

126
In May of 1977 at a joint meeting attended by Salsbury,
EPA, and IDEQ officials, Salsbury described circumstances and
presented data (Appendix D) which ostensibly indicated that SVAN
data resulted from a rare combination of events which were not
representative of normal conditions. These circumstances included
city construction of a storm sewer through the LaBounty site
and precipitation. It was their opinion that the site was disrupted
by construction activities and that Cedar River arsenic concentrations
were increased as a result of unusual amounts of precipitation
and runoff from the site. Salsbury presented an extensive amount
of data which showed that the ,net arsenic loading (gross riveri
loading minus treatment plant contribution) was considerably
less than the level found by SVA'l.
These Salsbury data are summarized as fellows:
Month River STP EffluentRiver
Cone. Gross Cone. Gross LoadingLoading Loading Net
ng/1 1b/day wg/i 1b/day 1b/daymean_ mean mean mean mean
January 41 33.8 1,250 12.7 21.1February 49 33.0 1,110 12.7 20.3March 4? 43.6 . 1,120 14.4 29.2ADfi 1 22 57.2 910 13.4 45.8Mean 40 41.9 1,100 13.3 29.1
According to Salsbury, the samples used to obtain the
Cedar River arsenic data were collected about 3.5 miles (5.6
Km) dawnstream from the LaBounty site ne ar the residence of Mr.
Pairic k McDonnel1. The McDonnell well was sample d during the
August -September 1977 survey (Figure 20) . Stream loadings and
plant effluent loadings were calculated, respectively, by using

USGS and treatment plant flow rates. The stream net loadings,
which are of primary interest, were calculated by subtracting
plant loadings from gross river loadings. These net values would
supposedly reflect the contribution at all sources to the Cedar
River, with the exception of the municipal treatment. These
sources would include the LaBounty disposal site, the old municipal
site, the seep, the boil, and possible intermittent discharges
of arsenic in Salsbury's cooling water.
There is no reason to believe that the Salsbnry data
are not accurate for the point of collection. However, as an
estimate of the amount of arsenic contributed by sources other
than the municipal treatment plant, the data are believed to be
biased lew because of the sedimentation which takes place as
one proceeds downstream. This loss of arsenic from the water
phase has been adequately demonstrated by the SVAN sediment d3ta
and the decreasing water phase arsenic concentration downstream
which cannot be accounted for by simple dilution.
As a resole of fluctuation in river flow rates and variatio
in rainfall and runoff stream arsenic concentrations and loadings
can be expected to vary over a considerable range. This variation
is demonstrated by the SVAN data. Downstream of the treatment
plant (STORET No. 002474) mean arsenic concentrations in the
river water were 67 pg/'l in February of 1977, in September of
1977 the mean was 210 ag/1. Table XXIX also indicates variations
at Nashua. The high'concentration and loadings resulting from

August-September 1977 survey may not be representative of long-
term conditions; however, it is doubtful that the data resulted
from a rare or unique set of circumstances.
Figure 25 v/as prepared from USGS stream gauging records
(41) and precipitation records (40) for the August-September
1977 sampling period. The figure graphically shows the river
flow rate in cfs for the period of August 20 through September 9,
1977, at the Charles City gauging station. The figure also shows
the amount of precipitation which occurred during each day, when
the stream samples were collected, and some of the flow statistics
for the gauging station. Although August was an unusually wet
month [8.03 in. (20.4 cm) total], 96 percent of the rainfall
for the month occurred prior to sampling and stream flow rates
were not greatly affected as indicated by the data. Maximum
discharge rate during the period of stream sampling was 176 cfs
(4.93 cu m/sec). This figure is considerably less than the average
daily discharge of 646 cfs fo^ the 13-yr period of record.
Although the conditions of the LaBounty site have changed
since the August-September survey, it is probable that, as a
result of runoff and percolation, increased stream arsenic con
centrations and loadings can be expected during any significant
rainfall event. Obviously, the role of the storm sewer construction
activities as a factor in the August-September data cannot be
determ'ined without additional field work.

Arseniccone! loading

130
An examination of the data in Table XIX would indicate that
concentrations of lead in the sediments of the Cedar River were
higher than the arsenic concentrations and tended to parallel the
increase in arsenic. There is no established relationship of this
lead with Salsbury. In August of 1975, the mean lead concentration
in Salsbury's wastewater was 120 ug/l. in September of 1977 the
mean was less than 5 u9/l* In addition, the one sludge sample
collected from the LaBounty site in February of 1977 had a lead
concentration of 0.21 mg/kg. Significant amounts of lead have
also been found in the municipal wastewater sludge which may
possibly originate from White Tractor. The source of the lead
in the stream is unknown.
The SVAN data on the municipal treatment plant confirms those
earlier findings (4) as to the rather refractory nature of the
municipal treatment plant combined wastewater. Data for BOD^, COD,
NFS, As, CWA, and Color are summarized as follows:

131
Survey Period Parameter Influent Effluent
PercentRemoval
August 1974,BODc, mg/1 185 57 69NFS, mg/1 63 26 59COD, mg/1 535 213 60BOD5/COD 0.35 0.27 —As, pg/1 -- -- ' — -ONA, pg/1 5,500 3,600 34Color, CPU - - “ —
August 1975BOD5, mg/1 140 25 82NFS, mg/1 76 12 84COD, mq/1 360 127 65BOD5/COD 0.39 0.20 —As, pg/1 1,400 1,100 21ONA, pg/1 4,000 2,200 45Color, CPU 1,200 710 41
February 1976B0D5, mg/1 325 139 57NFS, mg/1 129 61 53COD, mg/1 899 609 32BOD/COD 0.36 0.23 --As, pg/1 -- —ONA, pg/1 — — — “Color, CPU __
September 1977BOD5, mg/1 224 38 83NFS, mg/1 80 13 84COD, mg/1 540 201 63BOD/COD C. 42 0.19 —As, pg/1 2,500 1,400 44ONA, pg/1 2,300 1,10G 52Color, CPU 1,550 1,270 18
It can be noted, none of the SVAN data indicates*a removal efficii
of 85 percent and that only the August 1975 data indicated a BOD5 and
NFS concentration of less than 30 mg/1. The COD and BOD./COD ratio are
parameters which are generally indicative of the biological treatabili
of a wastewater. A SVA-i survey (42) of 226 municipal secondary waste-
water treatment facilities of all types in Region VII* indicated the
following average data.
* Iowa, Kansas, Missouri, and Nebraska
*•

132
Parameter Inf1uant
B0D5 186
COD 434
bod5/cod 0.43
NH3-N 16.5
Effluent Percent Removal
38 80
115 74
0.33 —
8.0 . 52
It can be noted that, in relation to these average data, the
Charles City data shows consistently lower BOD5/COD ratio and that COD
concentrations in the effluent are higher. There is no doubt that the
cold weather was a contributing factor in the poor performance of the
plant during the February 1976 sampling period. During five Salsbury
2-wk August shut-down periods, Stracke and Baumann (4, p 6) presented
data which showed that the municipal treatment plant achieved mean
BCD5 and NFS effluent concentrations of 18 and 15 mg/1, respectively.
It is probable, with longer acclimation periods for plant biological
processes, that these effluent parameters might be reduced oven more.
Without the Salsbury process wastewater, whether or not the treatment
plant could achieve secondary treatment during the winter months
cannot be determined with the SVAN data.
The quantities of ammonia in Salsbury's wastewater are an additional
contributing factor in the performance of the treatment plant. The mean
influent and effluent NhS-N concentrations and loadings for the
municipal treatment plant are summarized as follows.
Survey In fluent. EffliuentCone.mg/1
Loading* lb/day
Cone.mg/1
Loading lb/day
August, 1974 20 240 23 270August, 1975 18 190 23 250February, 1976 150 1,340 150 1,340August-September, 1977 55 800 52 740
* flultiply by 0.454 to obtain kg/day.

133
During the August-September 1977 survey, the Salsbury process
wastewater had a mean NH3-N concentration of 172 mg/1 which resulted in
a daily average loading of 775 lb/day (352 kg/day).
It is possible that the levels of NH3-N found in the municipal
effluent resulted from partial treatment of the Nitrophenol from
Salsbury's process wastewater.
The samples of Salsbury's wastewater and the municipal treatment
plant influent and effluent collected during the August-September 1977
survey period were analyzed for the 129 priority pollutants in addition
to conventional parameters and the nitroanilines. The priority pollutants,
which were found at these three locations at concentrations above
analytical detection limits, are listed as follows.
Priority Salsbury Treatment PlantPollutant Wastewater .In f 1 uent Effluent
Arsenic, pg/1 6,200 2,500 1,400Copper, pg/1 28 48 24Selenium, pg/1 270 50 48Antimony, pg/1 70 17 19Mercury, pg/1 6.9 3.8 1.9Beryllium, ug/1 1.5 <1 <1Zinc, pg/1 59 118 75Lead, p.g/1 <5 21 <5Phenol, pg/1 16,500 2,400 20Phenolics, ug/1 49,000 16,000 <1302-Nitrophenol, pg/1 4,103 820 <204-Nitrophenol, pg/1 1,100 180 <20Nitrobenzene, pg/1 30 <20 <20<r;-DHC, pg/1 26 <2 <21,1,2-Trichloroethane, pg/1 >3,400 >720 >5451,1-Dichloroethylene, pg/1 >230 25 <35

134
Of the eight wells sampled during the August-September
survey, three were found to have small concentrations of organics.
These wells included the McDonnell well, the Krueger well, and
the Waterloo municipal well No. 9. - Malathion was found in the
McDonnell well water and Atrazine was found in the Krueger well.
These substances, which were not quantified, are believed to
originate from agricultural activities. The Waterloo well water
was found to contain C.09 pg/1 of ortho-nitroaniline, and unquantifiec
amounts of cnloroaniline and atrazine.
Since these data were obtained, the State Hygienic Laboratory
has confirmed the presence of ortho-nitroaniline in well no. 9
(Appendix D). Five separate samples collected by the State
laboratory had OiiA concentrations which ranged from 0.030 to
0.260 ng/1. The state laboratory also analyzed samples from
the other Waterloo shallow wells [all 85 ft (26 m) in depth]
in the same '.yell field. Detectable quantities of ortho-nitroaniline
were found in wells 7, 10, 11, 12, and 13. The state also found
this material in the Janesville municipal well, the Plainfield
municipal well, three private wells, and in the Carnation Company
we 11 iri Waverly. The populations of Waterloo, Janesville, and
Plainfield are approximately 76,000, 740, and 450, respectively.
Table XXV indicates that a number of substances were
identified in the seep (ST0RET No. 002471) on the left bank of
the Cedar River. These materials include arsenic (1,030 wg/1.),
as well as unquantified concentrations of chloronitrobenzene,

135
chloroaniline, aminochlorobenzene, chloronitrotoluene, dichloro-
aniline, Atrazine, and Malathion. Although there is no doubt
that some, if not all, of these substances originate with Salsbury,
the pathway is uncertain. It has been surmised that these substances
may have resulted from a break in a sewer line or from a leak in
Salsbury's equalization basin. Contamination from the landfill
sites appears unlikely since the seep is located up gradient.
The boil on the left bank several hundred feet upstream
from the seep was also found to contain 720 pg/1 of arsenic which
was the only substance tested for. It is probable that the seep
and boil are merely two point source manifestations of a leachate
problem which may extend for several hundred feet along the left
bank of the Cedar River. Salsbury officials have verbally indicated
(31) that they believe the source of this material in the seep
and boil resulted from a break in a sewer line on plant property
which they discovered and repaired. Because of groundwater travel
tine, it will require occasional sampling of the seep and boil
over an extended period of time to determine whether or not this
break was the source.

VI. SUMMARY
Substances resulting from Salsbury's operations have
been shown to be distributed over an extensive area. Arsenic
has been found in the sediments of the creek in Wildwood Park
and in the sediments of the Cedar River. Data, as well as visual
observations, have indicated that material is leaching from the
LaBounty disposal site into the river. The data have indicated
that the LaBounty disposal site is a principal source of arsenic
to the Cedar River. The SVAN data indicated that the Iowa.water
quality standard for arsenic has been exceeded downstream from the
LaBounty site as well as downstream from the municipal treatment
plant outfall. Salsbury data have indicated that the water quality
standard was exceeded on 20 days downstream from Charles City
during a period extending from January 13 to March 21, 1978.
Although the Salsbury data are believed to be representative
of water-phase arsenic concentrations for the point of collection,
it has been shown that arsenic is quickly lost to the sediments.
As an estimate of arsenic loadings to the Cedar River, the Salsbury
data are considered to be biased low. As a result of changes
in river stage and precipitation and runoff, arsenic concentrations
and loadings in the Cedar River can be expected to fluctuate
over a broad range. The high river arsenic concentrations found
during the August-Septenber survey are not thought to result
from a unique combination of events.
Ortho-nitroani1ine and chloroaniline have been found
in the Waterloo municipal well Wo. 9. The Iowa State Hygenic

137
c
Laboratory has confirmed the presence of ortho-nitroaniline in
this well in Waterloo. The state laboratory has also found ONA
in the Janesville and Plainfield municipal wells, three private
wells, and the Carnation Company well in Waverly. No detectable
arsenic was found in any of the wells sampled by SVAN.
The presence of a number of priority pollutants has
been documented in Salsbury's wastewater, in the municipal treatment
plant influent and effluent, and the Cedar River.
The data have shown that components of Salsbury wastewater
are toxic or inhibitory to the municipal treatment plant biological
processes and that many substances such as arsenic, color, and
the nitroani1ines pass through without major attenuation. Without
the Salsbury process wastewater, there is reason to believe that
the municipal treatment plant could achieve secondary treatment.
The data resulting from the samples collected from the
boil arid seep indicate that groundwater contamination is rather
wide spread. Additional field work will be required to determine
whether or not Salsbury's sewer repair measures were successful
in eliminating these sources of contaminants.

133
VII. CONCLUSIONS
1. In relation to background concentrations upstream from Charles
City, arsenic is widely distributed in the Cedar River water
and in the sediments of the Cedar River.
2. The LaBounty disposal site is one of the principle sources of
arsenic in the Cedar River.
3. Daily Cedar River arsenic concentrations can be expected to
fluctuate widely as a result of sampling location, variations
in river stage, precipitation, and runoff.
4. Because of sampling location, Salsbury's estimates of arsenic
released to the Cedar River from sources other than the
municipal treatment plant are biased low.
5. Arsenic concentrations in the Cedar River frequently exceed the
Iowa water quality standard of 100 yg/1.
6. Arsenic has been released in Salsbury's permitted cooling water
discharge.
7. Salsbury’s process wastewater is toxic and/or inhibitory to the
biological processes of the municipal wastewater treatment plant.
8. Components of Salsbury's wastewater pass through the municipal
treatment plant without major reduction.
9. A number of priority pollutants have been found in Salsbury's
process wastewater and in the municipal treatment plant influent
arid effluent.
10. Significant improvement in the Charles City municipal wastewater
treatment plant performance could be anticipated if Salsbury
process wastewater were removed.

139
11. The alluvial groundwater in Waterloo contains.ortho-nitroaniline.
12. The data resulting from samples collected from the seep and
boil indicate that there is groundwater contamination upstream
from the LaBounty disposal site.
13. Cedar River sediments are contaminated with lead.
i

140
VIII. RECOMMENDATIONS
1. Because of the arsenic water quality standard violations and
the possible groundwater contamination, a comprehensive plan
for the total containment or removal of the materials in the
LaBounty disposal site should be developed and carried out
as soon as possible.
2. The need for a new municipal treatment plant at Charles City
should be.evaluated in light of whether Salsbury Laboratories
intends to develop their own treatment system or continue to
utilize the city system.
3. Additional field and analytical work is needed to determine
if Salsbury's repair of the broken sewer was effective in
controlling those substances found in the seep and boil.

141
BIBLIOGRAPHY
1. "201 Facilities Plan for Charles City," Interium Report No. 1,Infiltration/Inflow and Waste Treatment Cost Effective Analysis, City of Charles City, Iowa, Engineering Sciences, Inc., July 1976.
2. "Application for an Operating Permit for Industrial, Manufact-ing, or Commercial Disposal Systems, State of Iowa, Department of Environmental Quality, Water Quality Management Division.
3. NPDES Permit No. IA-0022039, City of Charles City, Iowa, September 12, 1975.
4. Stracke, R. J. and Baumann, E. R., "Biological Treatment of aToxic Industrial Waste-Performance of an Activated Sludge and Trickling Filter Plant." Engineering Research Institute, Iowa State University, Ames., 1975.
5. "Report on Well Water Monitoring-Salsbury Laboratory DisposalArea, Charles City, Iowa," Iowa Department of Environmental Quality and Iowa Geological Survey, November 1976.
6. Iowa Department of Environmental Quality, Contract No. 77-4000-01
7. "Storage and Disposal Methods Review-Salsbury Laboratories,Charles City, Iowa," Prepared by Eugene A. Hickok and Associates for Iowa Department of Environmental Quality, July 1, 1977.
8. "Monitoring Methods Review - Salsbury Laboratories, Charles City,Iowa," Prepared by Eugene A. Hickok and Associates for Iowa Department of Environmental Quality, August 1, 1977.
9. "Storage and Disposal Methods Analysis, - Salsbury Laboratories,Charles City, Iowa," Prepared by Eugene A. Hickok and Associates for Iowa Department of Environmental Quality, August 1, 1977.
10. "Monitoring Alternatives - Salsbury Laboratories, Charles City,Iowa," Prepared by Eugene A. Hickok and Associates for Iowa Department of Environmental Quality, August 6, 1977.
11. "Contamination Prevention and Site Review-Salsbury Laboratories,Charles City, Iowa," Prepared by Eugene A. Hickok and Associates for Iowa Department of Environmental Quality, August 15, 19] 7.
12. "Soil Characteristic LaBounty Site - Salsbury Laboratories,Charles City, Iowa," Prepared by Eugene A. Hickok and Associates for Iowa Department of Environmental Quality, August 15, 1977.

142
‘V '
BIBLIOGRAPHY(Continued)
13. "Monitoring Methods Analysis - Salsbury Laboratories, CharlesCity, Iowa," Prepared by Eugene A. Hickok and Associates for Iowa Department of Environmental Quality, August 22, 1977.
14. "Waste Characteristics LaBounty Site - Salsbury Laboratories,Charles City, Iowa," Prepared by Eugene A. Hickok and Associates for Iowa Department of Environmental Quality, August 29, 1977.
15. "Monitoring Plan Recommendations - Salsbury Laboratories, CharlesCity, Iowa," Prepared by Eugene A. Hickok and Associates for Iowa Department of Environmental Quality, August 29, 1977.
16. "Storage and Disposal Methods Criteria and Recommendations -Salsbury Laboratories, Charles City, Iowa," Prepared by Eugene A. Hickok and Associates for Iowa Department of Environmental Quality, September 1, 1977.
17. "Contamination Prevention Analysis - Salsbury Laboratories,Charles City, Iowa," Prepared by Eugene A. Hickok and Asso-
/ ciates for Iowa Department of Environmental Quality, September 15, 1977.
18. "Contamination Prevention Analysis - Salsbury Laboratories,Charles City, Iowa," Prepared by Eugene A. Hickok and Associates for Iowa Department of Environmental Quality, October 17, 1977.
19. "Recommendations LaBounty Site- Salsbury Laboratories, CharlesCity, Iowa," Prepared by Eugene A. Hickok and Associates for Iowa Department of Environmental Quality, November 15, 1977.
20. "Recommendation Secondary Sites - Salsbury Laboratories, CharlesCity, Iowa," Prepared by Eugene A. Hickok and Associates for Iowa Department of Environmental Quality, December 14, 19]7.
21. Settlement Agreement, Natural Resources Defense Council, Inc.,ejt al_ versus Train, U.S. District Court for the District of Columbia, June 7, 1976.
22. "Preliminary List of Chemical Substances for Further Evaluation,"Toxic Substances Control Act Interagency Testing Committee,
. July, 19]7.
23. "Initial Report of the Administrator, EPA," Toxic SubstancesControl Act Interagency Testing Committee, Federal Register, Part IV, October 12, 1977.
V

143
(
c.
BIBLIOGRAPHY(Continued)
24. "Second Report of the Interagency- Testing Committee," Receiptand Request for Comments, Federal Register, Part V, April 19, 1978.
25. "Hazaradous Substances," Water Programs, EPA, Federal Register,March 13, 1978.
26. "The Merck Index," 8th Edition, Merck and Company, Rahway, N. J.,1968.
27. "Charles City, Iowa municipal wastewater treatment plant Discharge Monitoring Reports, January 1, 1976 through December 31, 1977.
20. "Water Resources Data for Iowa-Water Year 1976," U.S. Geological Survey Report IA-76-1.
29. EPA, Region VII interoffice memorandum, Waste Management SectionSubject: Aerobically Digested Sludge Disposal on Farmland-Cnarles City, Iowa, June 23, 1977.
30. Water Quality Standards, State of Iowa, Chapter 16, Iowa Administrative Code, 1977. '
31. Unpublished information provided by Salsbury officials duringjoint meeting in Charles City, Iowa on May 2-3, 1978.
32. "A Report Concerning the Industrial Waste Dispute Between theIowa Department of Environmental Quality, (DEQ) and Salsbury Laboratories," Des Moines Register, January 31, 1978.
33. Anderson, B. G., Chandler, D. C., Andrews, T. F., and Jahoda, W.J., "The Evaluation of Aquatic Invertebrates as Assay Organisms for.the Determination of the Toxicity of Industrial Wastes," Final report on a project sponsored by American Petroleum Institute and carried out at the Franz Theodore Stone Laboratory, Ohio State University, put-in - Bay, Ohio, 1973.
34. "Methods for Acute Toxicity with Fish Macroinvertebrates, andAmphibians," National Environmental Research Center, Office of Research and Development, EPA-66013-75-009.
35. tBioassay Techniques and Environmental Chemistry," Edited byGlass, G. E., EPA. National Water Quality Laboratory,Duluth, 1973.
36. Litchfield Jr., J. T. and Wilcoxon, F., "A Simplified Methodof Evaluating Dose-Effect Experiments," Journal Pharmacology and Experimental Therapeutics, 96, 99. June 1919.

144
37.
38.
39.
40.
41.
42.
BIBLIOGRAPHY(Continued)
AndUsinS’Danh^ "Estirnatl’°" of Apparent Thresholds of Toxicitypresenlld^foS3^- -S-the IeSt 0r9am*s.n.- unpublished paperAm'r Chi w ° ,VT°n Water* Air and Waste Chemistry, Ame>. Chem. Soc., Wash. D. C., September, 1971.
■"■Ss"™: and uastes-'
Daily Precipitation, Charles City, Iowa, August, Septenb- 1Q77
a^na?^1 cr°Ce-niC and.■Atmospheric Administration, Environment- 1 Data Service, national Climatic Center, Asheville, N. C.
"W3DataRSeport!SW-77-Kr l0Ka ' M3ter Vear ,977-" USGS Water
"Winter Sewage Treatment Plant Performance Study Report " unnuh li!s 1?v?s?=„r: by US EPA> Res1°" VU> ^ellJanTaJd flSaT

145
/
APPENDIX A
AUGUST 1974 SURVEY DATA

T.A3LE A-1
CHAi'LCS crrv '-V. .'NIC I PAL SFHAGF. TP.CATr.EliT PLANT IMFLl'CNT
SToncT 000033 ■
August 197/l

TA'JLE A -1, Continued
a*viLrs citv municipal sewage treatment plant influent
STCPET NU! IPEP 000033
August 1974
Laboratory Number OPE 140 325142 GP5144 825146 825148
Type of Sample CC'inpf.r. ilc Composite. Ora!)* Composite Composite Arithmetic
Composite Sample Irifo. Mean
Hi'ginn In«| Nate, dav-mu. ' /•' PO/8 30/0 30/3 31/8i'enipuino Tire, military i'll;; OiV,r> 0030 0630 0630Ena inn Nate, day-mo. ;-,rt/rt — 31/3 01/9Endino Tire, military f'W. Oh 30 — 0630 0630
Parameter1,1 ,?-Trichioroethane, no/1 A. 9 PI .0 1.4 6.5 2.1 7.6P-l'tnyl U'rxanol, ry/1 10.3 11.0 "0.1 0.5 0.9 <4.6Ortlionitroaoi 1 ire;, mg/l A.3 11.0 1.0 4.7 6.3 5.5i'aran i troanil inc, my/i # 2 19.1 ?.? 10.8 13.5 10.8Nipheny famine, my/1Phenol, mo/1
0.39.6
1.3P.3
O.P<0.2
0.52.1
0.3<0.2
0.6<0.9 •
* Sampler malfunction.

r*
TABLE A-2
CHARLES CITY MUNICIPAL ST WAGE TREATMENT PLANT EFFLUENT
STORET PUMPER 000034
Auiust 1974
Laboratory Number 075160 326162 325164 825166 825168
Type of Sample Composite Composite Composite Composite Composite Arithmetic
Composite Sample Info. Meanben inu iup C.itn, day-mo. 27/P ?f.!/8 29/8 30/3 31/8
i no i riv; Ti'"!.*, military . V.L!- 0706 0645 0645 ■ 0650End inq On te,, day-mo, 2?7C 29/?) 30/3 3i/e 01/9
ParameterPOO., mo/1 72 69 49 45 52 57Cf'L1, iP'j/1 241 23A 187 162 237 213NFS, re/1 23 . vrt < • li) 22 36 26NN.-N, m-i/1 20 23 24 23 25 23:,d -CO -3, mq/I '.04 0.09 0.04 0.10 0.26 0.10
iv./i 30 36 36 34 ‘34 34i’ot.il F, no/l r '•
1‘.'* r. r ■ 6.3 7.0 6.7 6.5lib 7.2 7.1 7.4 7.3 7.4 7.1 to 7.4fnecifir Conj., umbo/cm 2000 2400 2000 1390 1800 .1900ip, -..o/l (Total) 1.6 2.3 1.7 1.2 1.3 1.6
Cr, .o/l (Iota!) r»J -6 • 5 6 <5 <6Cu, -C’/l (Total) 30 23 23 20 20 24So, uq/1 (Totol) 14,000 16,000 16,000 3,000 14,000 13,000
uq/1 (Total) a, 0 40 40 20 40 40Cd, ;..j/l (Total) •■5 *:r* ■•6 a 5 <5- <5Zn, iiq/1 (Total) 114 294 117 106 184 163Cyanide*, mi/1 0.01 ; 0.01 c -0.01 0.01 c <0.01 5 <0.01 GFecal Col ifoc'.i**, pnr 1(10 ml 2.4 v io 1.7 x 10 3.7 x 10 4.5 x 10 1.3 x 10 2.4 x 10
* Laboratory numbers differ for this parameter because different sampler used; composite periods are the same.
>* Grab sample*; col leered at end of composite period; lab numbers are not applicable.
■OiCO

TABLE A-?, Continued
CU.Y'LES CITY MUNICIPAL SEWAGE TREATMENT PLANT EFFLUENT
ST PR FT NUMBER 000034Auciust 1974
l.ahoraicry Nunher 375170
C\«
LT.
CV
t .
3751 n 82517G 825178
Type of Sample Composito Composite Composite Composite Composite Arithmetic
I'omosite Sample Info. MeanI'(v.|inning Bale, Uav-no. 77/?’. 70/0 79/3 30/8 31/8Beginning T»>:•*?, military r*16 n/o'i 0705 0545 0G50Ending Onto, day-mo. /■;/« 29/3 30/3 31/8 01/9"ndinq Tim?, military '?7(jS 0645 0645 0650 0650
i’cri:,,."trT
1,1,2-Trir hlorethan;.1, mg/1 7.1 111. 3 7.9 1.7 3.9 4.27-Et’,yl llexonol, ng/1 1 .0 l.r, ■0.1 <0.1 <0.1 <0.7ri>-Lho -n'i troiini line, mg/1 1.7 6.9 0.5 3.1 5.7 3.6Lira -ni t.roan i 1 inn, mq/1 7.7 10.3 0.8 A .8 10.6 5.8'diphenyl ami no, mc/1 9.7 P.7 0.1 0.3 0.4 0.3Phenol, mg/1 ■ 0. 7 <0.2 <0.? <0.? <0.2 <0.2

150
APPENDIX B
AUGUST 1975 SURVEY DATA
r
V

151
TABLE B-l
CEDAR RIVER AT CHARLES CITY
CONCENTRATIONS
STORET NUMBER 001905
August 1975
Lab No. (913 series)Type of SampleComposite Sample Info.
Start Date, day-mo.Start Tine, nilitaryStop Date, day-no.Stop Tine, military
N/A
19/SN/A
20/80745
N/A
20/8N/A
21/80745
000Comp.
21/8074022/31600
001Comp.
22/8150023/81015
002 Comp.
23/8101524/80315
N/A
24/8N/A
25/81200
Arith.
Mean
Resin Columns
Sample Volume, 1 9.5 7.7 14Orthonit.roaniline, ua/1 <0.3 <0.3 <0.3 -0.3Cnloronitrohenzenc, ug/1 <0.1 <0.1 -0.1 <0.1
nn:.[; SAMPLE DATA*
Lab No. (913 series) 003 00A 005 006 . 007 003Water Terrp, °C 22 23 26 23 24 23 24As, ;:o/l (Total) 2 2 ?. 2 2 S 3Ea, i.g/1 (Total.) <100 <100 <100 -ICO -100 -100 <100Cd, -g/l (Total) v'S <5 <5 <5 -5 <5 -5
■Cr*\ '. g/1 15 -- .. r <5 <5 <25 <11Zr, uq/1 (Total) 6 8 9 1C 12 -5 -8Cu, -q/1 (Total) 6 q Q 10 12 o 9Pb, >,c/l (Total) 30 -■20 *;2C <?0 <20 -20 -30So, •_q/7 (Total) i < 5 .;C • 5 ■" 5 -5 -5 •-5Se, -o/l (Total) - i o -10 -ir -10 -ID <10 -10
! He, :.q/l (Total) .0.30 .0.40 0.30 0.2 0 0.20 <0.20 <0.30| Flow rate,*'' cfs op ' 240 753 1070 617 1210 Gy 1
TRACE 0*:SA‘;!Cf> (ccncentrati in i-g/1)
Lab No. (913 series) 011 010 005 012
Wat-r Samples31 Crthonitrcarr 1 ine <0.3 <0.3 -0.3 <0.3
C Li 1 or on i t r Oorr: con e ■M .r\ i' t « X -0.1 .-0.1 <0.1
Water Samples (Acidified.)i Or thorp itroani 1 ine <n *5 <0.3 '•0.3 <0.3 -0.0j Chloroniti’oi-oncer.e -,u '-0.1 -0.1 -0.1 < u. 1
_______1
Sa-oles collected or; ‘•n-jing dote and time-! of composit» uerio:!.

CEDAR RIVER AT CHARLES CITY LOADINGS, POUNDS PER DAY*
STORET NUMBER 001905
August 1975
TABLE B-2
* Mult ip!}' Dy 0. W to obtain kg/day

TABLE B-3
SALSBURY LABORATORIES PROCESS WASTEWATER DISCHARGE
HEAVY METALS CONCENTRATIONS
STORET NUMBER 001905
August 1975
Lab No. (gi3 series) Type of SampleComposite Sample Info.
Start Date, day-mo. Start Time, military Stop Date, day-mo.Stop Time, military
014Comp.
19/S151020/81045
016Comp.
20/2104521/a1110
- 01S Ccmp.
21/8111022/81425
020Comp.
22/3142523/81105
022 Comp.
23/8110524/31025
024Comp.
24/S103525/31100
Arith.
Mean
Color* 3500 — 4000 40.00 4500 4530 4100NFS, mg/1 C.5 4.0 5.C 5.0 3.0 4.0 4As, ’-q/1 (Total) . 4400 4300 4100 4100 3600 15,000 5900Da, eg/1 (Total) <100 <100 <100 <100 <100 <100 <100Cd, jg/1 (Total) 16 15 15 13 13 14 14Cr^, ug/I <5 15 <5 6 f <25 <10Cr, vg/1 (Total) <5 <5 <5 <5 <5 <5 <5Cu, ug/l (Total) 28 3? 36 34 28 47 34
Pb, ug/1 (Total) 120 120 . 130 120 100 100 120
Sn, t-g/1 (Total) <5 <5 <5 <5 <5 <5 v5
Se, -g/1 (Total) 30 *>•? 25 33 27 40 31
Mq, ug/1 (local) 15.6 3.4 5.6 2.6 4.5 5.6 6.2
TOC, mg/1 25? on ~. w 22? ? 16 155 144 207
Phenolics, ug/I (Total) A1,00j r r *■* ✓u.-n 46,000 42,000 38,000 31,030 40,503
Flo1.: rate, mgd ** 0.52 0.62 0.64 0.57 0.49 0.53 0.5 o’-
* Platimun-Cobolt Units.** Multiply by 3800 to obtain cu n/day

TABLE B-4
SALSBURY LABORATORIES FROCESS WASTEWATER DISCHARGETRACE ORGANICS CONCENTRATIONS, mg/1
STORET NUMBER 001905August 1975
Lab No. (913 series) 028 N/A 030 N/A C32 033Type of SampleComposite Sample Info.
Comp. Comp. Comp. Comp. Comp. Comp.
Start Date, day-mo. 19/S 20/S 21/S 22/8 23/S 24/SStart Time, military 1510 1045 1100 1425 1105 1025Stoo Date, day-mo. 20/3 21/8 22/3 23/3 24/S 25/S MeanStop Time, mi 1itary 1045 1100 1410 1105 1025 1045
Resin Columns
Sample Volume, 1 6.7 4.2 6.0 3.5Phenol 2 3 0 C 2.5Ortho-n itrophenol 7 12 9 S 9Chloronitrobenzene 2.3 2.8 3.2 2.S 2.fOrtho-nitroaniline 10 16 19 19 16Aniline 0.3 i.i 0.9 0.5 0.7
Comoosite Water SamplesLab fio. (913 series)* 035 036 037 033 039 040
Phenol 11 7 14 11 S O 10Ortho-siitropheno! 12 5 13 0 6 12 10Chloronitrobonzene 2.3 1.5 2.8 2.4 2.3 2.7
£. . 3 •
Ortho - r.itro an i 11 r.e 16 0 19 17 16 ?1 16Ani1in? 1.5 1.6 A *7
. / ' 3.6 2.6 l.S 2.6
Water Samples (Acidified)13Phenol 14 16 14 . 12 11 16
Ortho-nitrophenol 16 14 13 9 8 20 13Chlo*'oni trohenzc-ne 2.^5 2.7 2.3 2.6 3.o 2.SOrtho-nitroaniline ic 16 17 16 is 31 19Aniline -- “ *"
“ — ***“ “
+ Laboratory numbers differ because, of separate compositors.
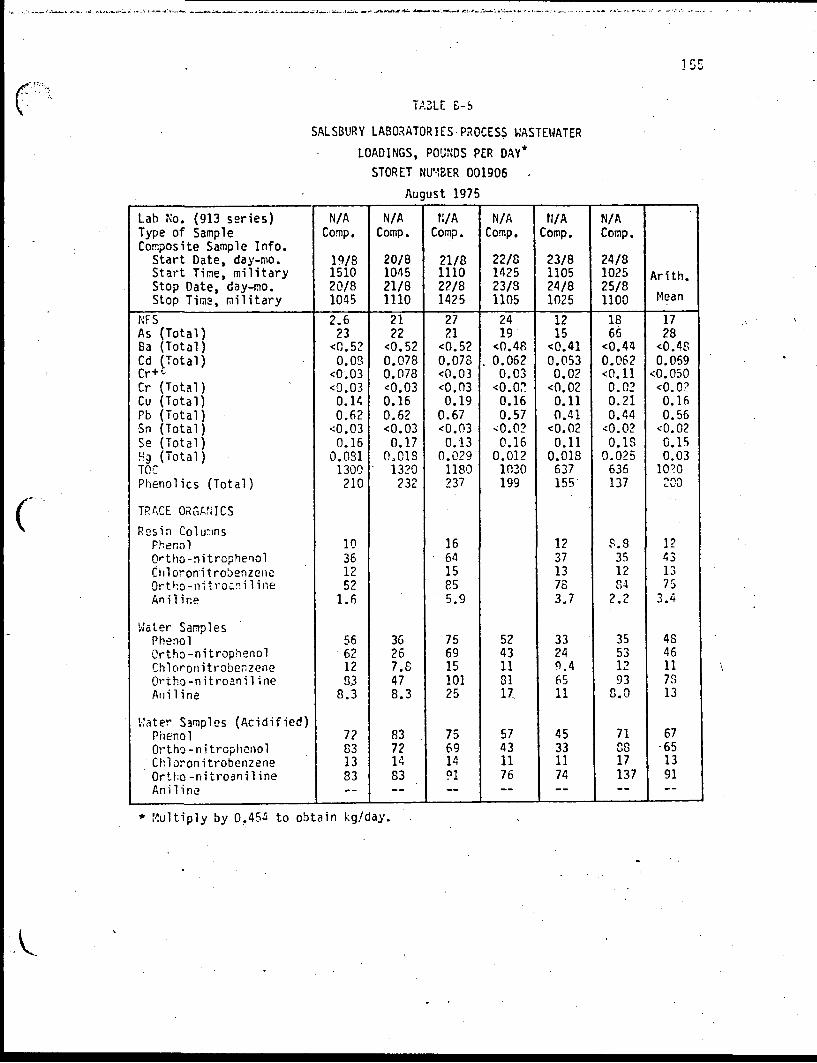
155
TA3LE B-S
SALSBURY LABORATORIES PROCESS WASTEWATER LOADINGS, POUNDS PER DAY*
STORET NUMBER 001906
August 1975
Lab No. (913 series)Type of SampleComposite Sample Info.
Start Date, day-mo.Start Time, militaryStop Date, day-mo.Stop Time, military
N/AComp.
19/8151020/81045
N/AComp.
20/8104521/81110
N/AComp.
21/8111022/81425
N/AComp.
22/8142523/81105
N/AComp.
23/8110524/81025
N/AComp.
24/8102525/81100
Arith.
Mean
NFS 2.6 21 27 24 12 18 17As (Total) 23 22 21 19 15 66 28Ba (Total) <0.52 <0.52 <0.52 <0.48 <0.41 <0.44 <0.48Cd (Total) 0.03 0.078 0.07S . 0.062 0.053 0.062 0.059Cr+< <0.03 0.073 <0.03 0.03 0.02 <0.11 <0.050Cr (Total) <0.03 <0.03 <0.03 <0.02 <0.02 0.02 <0.0?Cu (Total) 0.14 0.16 0.19 0.16 0.11 0.21 0.16Pb (Total) 0.62 0.62 0.67 0.57 0.41 0.44 0.56Sn (Total) <0.03 <0.03 <0.03 <0.02 <0.02 <0.02 <0.02Se (Total) 0.16 0.17 0.13 0.16 0.11 0.18 0.15Hg (Total) 0.0S1 0.01S 0.029 0.012 0.018 0.025 0.03TOC 1300 1320 1180 1030 637 635 1020Phenolics (Total) 210 232 237 199 155 137 lL'U
TRACE ORGANICS
Resin ColumnsPhenol 10 16 12 8.3 12O»"tho-nitrophenol 36 64 37 35 43Chloronitrobenzene 12 15 13 12 13Qrtho-nitroaniline 52 85 78 84 75Aniline 1.6 5.9 3.7 2.2 3.4
Water SamplesPhenol 56 36 75 52 33 35 4SOrtho -nitrop'nenol 62 26 69 43 24 53 46Chloronitrobenzene 12 7.8 15 11 9.4 12 110>'tho-nitroanil ine 33 47 101 31 65 93 7SAniline 8.3 8.3 25 17 11 8.0 13
Water Samples (Acidified)Phenol 72 83 75 57 45 71 67Ortho-nitrcphenol 83 72 69 43 33 83 65Chloronitrobenzene 13 14 14 11 11 17 13Ortho-nitroani1ine 83 83 91 76 74 137 91Aniline — -- — — - ~ “ ” “
* Multiply by 0.454 to obtain kg/day

155
(
TABLE B-6
STORM SEWER DISCHARGE AT CEDAR RIVER
STORET NUMBER 001908
August 1975
Lab No. (913 series)Type of SampleComposite Sample Info.
Start Date, day-mo. Start Time, military Stop Date, day-mo.Stop Time, military'
050Comp.
19/8170020/80310
052Comp.
20/8031021/30805
054Comp.
21/8080522/81525
22/8
23/8
058Comp.
23/8100024/S0340
060Comp.
24/8034025/81015
062Comp.
25/8101525/81130
Arith.
Mean
Specific Cond., umho/cm 452 431 370 — 340 333 335
BOD^, mg/1 1,2 4.2 — 2.4 2.4 3.6 2.8
COD, mg/1 8.0 16 — <4)0 20 23 <14
pH 7.5 S.2 — 8.0 7.5 7.7
NFS, mg/1 1.0 0.5 13 4.0 6.0 49 12
NHs-N, mg/1 0.01 -0.01 <0.04 <0.04 0,2 0.3 <0.1
TKfi, mg/1 1.4 0.7 0.9 0.5 2.1 1.4 1.2
NOj-NOj-::, mg/l 0.G3 0.47 0.10 OJ 0.13 0.23 1.1 0.4
Total P 0.6 0.5 0.7 >- 0.3 1.1 0.6 0.6
Phenolics, ug/l (Total) 14 10 15 E 4.0- 7.0 11.0 10
As, -g/1 (Total) 2.0 1.0 5.0 fO 2.0 2.0 2.0 2.0
Ba, ug/l (Total) -'100 <100 <100 <100 <100 <100 <100
Cd, ug/l (Total) 92 93 95 O <5 <5 24 <52Cr+-g/1 102 66 — — <25 — <64
Cr, ug/l (Total) 100 70 20 <5 <5 60 <43
Cu, ug/l (Total) 18 13 17 8 15 12 14
Pb, ug/l (Total) 60 30 40 20 30 <20 <30
Sn, ug/l (Total). <"5 <5 <5 <5 <5 <5 <5
Se, ug/l (Total) <10 <10 <10 <10 <10 <10 <10
Hg, ug/l (Total) 0.3 0.5 0.4 <0.2 <0.2 <0.2 <0.3
V_-

15
TABLE B-7
CHARLES CITY MUNICIPAL SEWAGE TREATMENT PLANT INFLUENT CONCENTRATIONS
STORET NUMBER 000033
August 1975
Lab No. (913 series) Type of SampleComposite Sample Info.
Start Date, day-mo. Start Time, military Stop Date, day-mo.Stop Time, military
064Comp.
19/8133020/80905
066Comp.
20/8090521/80940
21/8
22/8
22/8
23/8
072Comp.
23/8090024/80920
074Comp.
24/8090025/80920
076Comp.
25/8092026/80S50
Ar ith. Mean
Color 1300 1250 1000 900 1500 1200
Conductivity, vmho/cm • 195S 1925 1469 1396 1783 1706
BODs. mg/1 145 162 90 160 140 140
COD, mg/1 365 400 255 400 375 350
pH 6.3 7.3 7.4 7.6 6.7 —TVS, mg/1 1590 302 320 232 293 54 S
NrS, mg/1 '43 92 92 53 88 76
NUj-N, mg/1 18 21 13 17 19 18
TKN, mg/1 26 31 21 22 26 25
NO 2-NOj-N <0.04 0.02 CJ <u 0.10 0.18 0.05 <0.03
Total P, mg/1 5.0/ 6.5 CL CL 6.4 5.8 7.3 6.2
TOC, mg/1 90 109 £ £ 61 60 80 SO
■As, ug/1 (Total) 1050 780 LO <✓*) 530 1700 2900 1400
Da, ug/1 (Total) <100 <100 <100 <100 <100 <100
Cd, ug/1 (Total) <5 <5 zz - <5 <5 <5 <5Cr+r', ug/1 — — — <25 <25 <25
Cr, ug/1 (Total) <5 <5 <5 <5 <5 <5
Cu, ug/1 (Total) 71 72 76 53 94 74
Pb, ug/1 (Total) 70 70 50 50 80 64
Sn, ug/1 (Total) <5 <5 <5 <5 <5 <5
Se, ug/1 (Total) 16 11 10 12 14 13
Kg, ug/1 (Total) 6.5 9.6 1.4 1.4 1.7 4.1
Phenolics, ug/1 (Total) 11,000 L2.000 5500 6100 6000 8100Flow rate*, mgd 1.32 1.30 — 1.25 1.39 1.32
* Multiply by 3300 to obtain cu m/day

TABLE B-8
CHARLES CITY MUNICIPAL WASTEWATER TREATMENT PLANT INFLUENT
TRACE ORGANICS CONCENTRATIONS, mg/1
STOP.ET NUMBER 000033
August 1975 ~
Lab No. (913 series)*Type of SampleComposite Sample Info.
Start Date, day-mo.. Start Time, military Stop Date, day-mo.Stop Tine, military
078
19/8133020/S0915
079
20/8091521/80920
21/8**
22/8
22/3**
23/8
031
23/8090024/80920
24/8090025/80900
053
25/3090026/80S40
Arith.
Mean
Resin Columns
Sample Volume, 1 6 7 2.5 3.5 1.2 — ■Phenol 1 4 2 3 0Ortho-nitrophenol 2 2 1 1 L.Chloronitrobenzene 0.7 0.6 0.4 0.6 0.6Orthn-nitroani1 ine A 4 3 7 4.0Aniline 0.3 0.5 0.3 <0.1 <0.3
Composite Water SamplesLab No. (913 series)* 084 085 033 0S9 090
Water SamplesPhenol 4 4 2 2 *5 3Ortho -nitrophenol 2 2 1 1 3 <_Chi prom'trpbenzene <0.3 <0.3 <0.3 <0.3 <0.3 <0.3Ortho-nitroani1ine 5 4 3 4 7 5Aniline 0.7 0.6 0.3 0.4 0.5 0.5
Water Samples (Acidified)Phenol 5 4 2 2 2 3Ortho-nitrophenol 2 2 1 2 3 2Ch1 oronitorbenzene <0.3 <0.3 <0.3 <0.3 <0.3 <0.3Ortho-nitruani1ine 6 4 3 5 7 5Aniline - “
* Laboratory numbers differ because of separate compositors.
** No samples because of plant operational difficulties.

159
TABLE B-9
CHARLES CITY MUNICIPAL SEWAGE TREATMENT PLANT INFLUENT LOADINGS, POUNDS PER DAY*
STOP.ET NUMBER 000033
August 1975
Lab No. (913 series)Type of SampleComposite Sample Info.
Start Date, day-mo. Start Time, military Stop Date, day-mo.
mStop Time, military
054 ' Comp.
19/8133020/80905
066Comp.
20/8090521/80940
21/8
22/8
22/8
23/8
072Comp.
23/8090024/80920
074Comp.
24/8090025/S0920
076Comp.
25/8092026/80850
Arith.
Mean
BOD 5 1600 1750 990 1660 1620 1520
COD 4000 4320 2800 4160 4350 3926
TVS 17,500 3260 3520 2410 3450 6030
NFS . 530. 990 1000 600 1000 824
NHj-N 200 230 140 ISO 220 194 .
TKN 290 330 230 230 300 276
NO;- NOs-N <0.44 0.22 1.1 1.9 0.58 <0.85
Total P 55 70 70 60 85 63
TOC 990 1180 670 620 930 873
As (Total) 11.6 8.42 C CJ6.33 17.7 33.6 15.5
Da (Total) <1.10 <1.08 o. CL <1.10 <1.04 <1.16 <1.10
Cd (Total) <0.1 <0.1 Eo fO
<0.1 <0.1 <0.1 <0.1
Cr+c — — in LT> — ■ <0.26 <0.29 <0.23
Cr (Total) '<0.1 <0.1 o o<0.1 <0.1 <0.1 <0.1
Cu (Total) 0.78 0.78 ■ = = 0.84 0.60 1.10 0.32
Pb (Total) 0.77 0.76 0.55 0.52 0.93 0.71
Sn (Total) <0.1 <0.1 <0.1 <0.1 <0.1 <0.1
Se (Total) 0.18 0.12 0.11 0.12 0.16 0.14
Hg (Total) 0.07 0.10 0.02 0.01 0.02 0.04
Phenolics (Total) 121 130 60.5 63.4 69.6 83.9
* Multiply by 0.454 to obtain kg/day.

ICO
CHARLES CITY MUNICIPAL WASTEWATER TREATMENT PLANT INFLUENT
TRACE ORGANICS LOADINGS, POUNDS PER DAY*
STORET NUMBER 000033
August 1975
TABLE B-10
Lab No. (913 series)Type of SampleComposite Sample Info.
Start Date, day-mo. Start Time, military Step Date, day-mo.Stop Time, military
N/A
Comp.19/S133020/80915
N/A
Comp.20/8091521/80920
N/A N/A N/A
Comp.23/8090024/S0920
N/A
Comp.24/8090025/80900
N/A
Comp.25/8090026/80340
Arith.
Mean
Resin Columns
Phenol 11 43 22 — 35 28Qrtho-nitrophenol 22 22 11 — 12 17Cnloronitroh^nzene 8 7 4 — 7 6Ortho-nitroani1ine 4A 43 33 — 81 50Aniline 3 5 3 <1.0 <3
Water Samples
Phenol 44 43 22 21 23 31Ortho-nitrophenol 2? 22 11 10 35 20Chlororii trobenzene <3 <3 <3 f-3 <3 <3Ortho-nitroani1ine 55 43 33 42 81 51Aniline 8 7 3 4 6 6
Woter Samples (Acidified) ‘
Phenol 55 43 22 21 23 33Crtho-nitrophonol 22 22 11 21 35 22Chioronitrobenzene <3 <3 <3 <3 <3 <3Ortno-nitroaniline- 66 43 33 52 81 55Aniline ““
* Multiply by 0.45'? to obtain kg/day.

16]
(
TA3LE B—11
CHARLES CITY'MUNICIPAL SEi.'ASE TREATMENT PLANT EFFLUENT CONCENTRATIONS
STORET NUMBER 000034
August. 1975
Lab Ho. (913 series)Type of SampleComposite Sample Info.
Start Date, day-ro. Start Time, military Stop Date, day-mo.Stop Time, mi 1itary
134Comp.
19/8114020/8OS30
136 Comp.
20/8CS3021/80345
21/8
22/8
140Comp.
22/8120023/80930
142 Comp.
23/8093024/30350
144 Comp.
24/8035025/80330
146Comp.
25/8033026/3C320.
Arith.
Kean
Color 700 700 700 750 600 800 710Conductivity, rm!io/cm 18G0 1925 1613 1542 1273 1679 1655B0D5, mg/1 40 36 24 19 1.4 19 25C00, mg/1 137 1S3 141 94 90 112 127pH 6.3 7.6 7.5 7.4 7.9 7.6 --TVS, mg/I 16? 335 314 264 132 132 223NFS, mg/1 6.0 15 10 20 10 12 1?Nh'3-n, mg/1 23 24 22 22 22 23 23TKN, mg/1 26 28 22 22 25 26 25r:o2-:-:o3-r;, mg/i <0.04 0.15 0.04 0.12 0.16 0.10 <0.10Total P, rg/1 6.8 6.1 Q.
E6.4 5.8 6.2 6.7 6.3
As, ug/1 (Total) 900 820ia
VO 700 6-50 750 2700 11C0Ha, wg/1 (Total) <100 <100 o <100 <100 <100 <100 <100Cd, jjg/1 (Total) 5.0 <5 52 <5 <5 <5 <5 <5Cr+6 , vg/1 <5 <5 <5 <5 <25 <25 <12Cr, rg/1 (Total) <5 <5 <5 <5 <5 <5 <5Cu, r g/1 (Total) 41 36 32 33 29 33 34Pb, ug/l (Total) 50 50 40 50 50 40 50Sn, yg/1 (Total) <5 <5 <5 <5 <5 <5 <5Se, rg/i (Total) 14 19 18 13 13 16 16Kg, ug/1 (Total) 0.9 1.4 1.2 0.7 0.6 1.7 1.1Phenolics, rg/1 (Total) 273 105 23 61 66 73 i 101
Flo./rate, mgd 1.32 1.30 1.32** L. 32** 1.25 1.39 1.32
* Multiply by 3800 to obtain cu m/day
Hot r.easurcd due to plant operational problems; values ere* mean of measured flow rates.
v.

TABLE B-12
CHARLES CITY MUNICIPAL WASTEWATER TREATMENT PLANT EFFLUENT
TRACE ORGANICS CONCENTRATIONS, mg/1
STORET NUMBER 000034
August 1975
Lab Mo. (913 series)* 148 149 N/A 151 152 153 154Type of SampleComposite Sample Info.
Comp. Comp. Comp. Comp. Comp. Comp. Comp.
Start Date, day-mo. 19/3 20/8 21/8 22/3 23/8 24/8 25/8 Arith.Start Time, military 1220 0345 0330 1200 0915 0S50 0S50Stop Date, day-mo. 20/8 21/8 22/8 23/8 24/8 '25/8 26/8 Mean'Stop Time, military 0845 0830 1200 0915 0850 0830 0815
Resin Columns
Sample Volume, 1 2.4 2.0 3.0 3.1 2.5 2.7Phenol <0.1 <0.1 <0.1 <0.1 <0.1 <0.1 <0.1Ortho-N i tro phenol 0.8 0.8 0.4 0.3 0.3 0.5 0.5Chi cronitrobenzene 0.2 <0.2 0.2 0.2 <0.2 0.3 <0.2Ortho-Hi troaniline 2.0 2,0 1.6 1.4 1.8 4.3 2.2Aniline <0.1 <0.1 <0.1 <0.1 <0.1 <0.1 <0.1
Composite Water SamplesLab No. (913 series)*
Water Samples
155 156 157 15S 159**
160 161
Phenol <0.2 <0.2 <0.2 <0.2 <0.2 <0,2 <0.2 <0.2Ortho -Nitronhenol 0.4 0.3 0.4 0.3 0.3 <0.3 <0.3 <0.3Chloron itrobenzene <0.3 <0.3 <0.3 <0.2 <0.3 <0.3 <0.3 <0.3Ortho -Nitroaniline 1.4 1.3 1.0 1.4 1.6 1.6 3.2 1.6Aniline <0.3 <0.3 <0.3 <0.3 <0.3 <0.3 <0.3 <0.3
Water Samples (Acidified)Phenol <0.2 <0.2 <0.2 <0.2 <0.2 <0.2 <0.2 <0.2Ortho -Nitrophenol 0.3 0.3 0.3 0.3 .0.3 <0.3 <0.3 <0.3Chloronitrobenzene <0.3 <0.3 <0.3 <0.2 <0.3 <0.3 <0.3 <0.3Ortho -Nitroaniline Aniline
1.4 1.1 1.2 1.2 1.2 1.8 2.8 1.5
* Laboratory numbers differ because of separate compositors.

163
TABLE B-13
CHARLES CITY MUNICIPAL SEWAGE TREATMENT PLANT EFFLUENT
LOADINGS, POUNDS PER DAY*
STORET NUMBER 000034
August 1975
Lab No. {913 series)Type of SampleComposite Sample Info.
Start Date, day-mo. Start Time, military Stop Date, day-mo.Stop Time, military
134Comp.
19/S114020/80330
136Comp.
20/8033021/80845
21/8
22/8
140Comp.
22/8120023/30930
142Comp.
23/S093024/80850
144Comp.
24/8085025/80330
146Comp.
25/3033025/80320
Ar ith. Mean
BODv, 440 390 260 210 146 220 273
COD 1500 2030 1550 1030 940 1300 1390
TVS 1730 3630 3450 2900 1370 1530 2440
NFS 66 160 110 220 100 140 13?
Nno-N 250 260 240 240 230 270 250
tkn -r; 290 300 240 240 260 300 270
NO--NO <0.44- 1.6 \ 0.44 1.3 1.7 1.2 <1.1
Total P 75 66Qj 70 64 64 78 70
As (Total) 9.90 8.85 Cl 7.70 7.26 7.80 31.3 12.1Ba (Total) -1.10 <1.08
E
to<1.10 <1.10 <1.04 <1.16 <1.10
Cd (Total) 0.05 <0.1 LTi <0.1 <0.1 <0.1 <0.1 ^0.1
Cr+ <0.1 <0.1O
<0.1 <0.1 <0.26 <0.29 <0.2
Cr (Total) <0.1 <0.1 <0.1 <0.1 <0.1 <0.1 <0.1
Cu (Total) 0.45 0.39 0.35 0.36 0.30 0.38 0.37
Pb (Total) 0.55 0.54 0.44 0.55 0.52 0.45 0.51
Sn (Total) <0.1 ,<0.1 <0.1 <0.1 <0.1 <0.1 <0.1
Se (Total) 0.15 0.20 0.20 0.14 0.14 0.19 0.17
Hg (Total) 0.01 0.02 0.01 0.01 0.01 0.02 C.01
Phenol l'cs (Total) 3.00 1.14 0.31 0.67 0.69 0.85 1.10
* Multiply by 0.454 to obtain kg/day.

f ■1G-T
CHARLES CITY MUNICIPAL WASTEWATER TREATMENT PLANT EFFLUENT TRACE ORGANICS LOADING, POUNDS PER DAY* **
STORET NUMBER 000034
August 1975
TABLE B-14
Lab No. (913 series)Type of SampleComposite Sample Info.
Start Date, day-mo.Start Time, military Stop Date, day-mo.Stop Time, mi 1itary
N/AComp.
19/8122020/30S45
N/AComp.
20/8034521/80330
M/A N/A N/A Comp.
23/3 0915 24/S 0350
N/AComp.
24/8035025/30330
N/AComp.
25/8035026/30315
Arith.
Mean
Resin Columns *Phenol <1 <1 <1 <1 <1 vlOrtho-nitrophenol 9 9 3 3 6 6ChloronitroDhenol t- <2 2 <2 3 <2
0rtho-nitro3niline 22 22 15 19 50 26Aniline <1 <1 <1 <1 <1 <1
Water SamplesPhenol <2 <2 <2 <2 <2Ortho-ni troo'r.enol 4 3 <3 <3 • 3Chi oron it.robencene < 3 <3 "3 <3 <3 <3Crth.o-ri troani 1 ine 15 14 IS 17 37 20Ani 1 i r,e <3 <3 ■--3 <3 <3
V! at or Samples (Acidified)Phenol <2 <2 <2 <2 <2 <2Ortho-nitrcphencl 3' 3 -'3 •:3 <3Chloronitrobenzene <3 --3 3 <3 <3 <3Grtho-nitroani 1 i ne 15 12 13 19 32 13Aniline “ “ "" "
* Multiply By 0.545 to obtain kg/day.
** No loadings calculated because of plant operational difficulties winch arfected flor rate readings.

165
TABLE B-15
CHARLES CITY MUNICIPAL SEWAGE TREATMENT PLANT
RAW SLUDGE CONCENTRATIONS
■STORET NUMBER. 001909
August 1975
Lab No. (913 series)Type of SampleComposite Sample Info.
Start Date, day-no. Start Tine, military Stop Date, day-mo.Stop Time, mi 1itary
091Grab
20/30935
N/A
093Grab
21/80920
N/A
097Grab
23/S1045
N/A
099Grab
24/80955
N/A
101Grab
25/809A5
N/A
Arith.
Mean
Water Temp, uc 20 21 21 21 20 ‘21
pH 6.5 6.3 6.3 6.3 6.4 6.3-6.5
TVS, mg/1 34,530 28,130O
34,340 36,550 26,590 32,030
As, mg/kg (Total) 2670 1510 ■- 1790 1670 2360 2000
Ba, mg/kg (Total) 5340 13,900 Q. 9730 11,300 7510 9690
Co, mg/kg (Total) 123 91 E 120 10G 114 111
Cr, ng/kq (Total) 363 176 150 321 331 273
Cr% ug/1 14 <5 <5 10 <25 <12
Cu. mg/kg (Total) 5440 1470 o 5450 5530 6090 4310
Pb, mg/kg (Total) 2930 2340 3100 • 2490 2500 2630
Se, mg/kg (Total) <19 <25 <19 <20 <27 <22
Hg, r.g/kg (Total) 27.6 44.1 17.6 17.1 23 25.9
Sn, mg/kg (Total) <9500 <13,000 <9400 <10,000 44,000 <11,000
O

165
TABLE B-16
CHARLES CITY MUNICIPAL SEWAGE TREATMENT PLANT
DIGESTED SLUDGE CONCENTRATIONS
STORET NUMBER 001910
August 1975
Lab No. (913 series) Type of SampleComposite Sample Info.
Start Date, day-mo. Start Time, military Stop Date, day-mo. Stop Time, military
106Grab
20/81015
N/A
10SGrab
21/81025
N/A
22/S
112Grab
23/81045
N/A
114Grab
24/80940
ti/A
116Grab
25/8?
N/A
USGrab
26/80915
N/A
Arith. Mean
Temp, °C 21 22 21 23 23 23 22
pH 6.4 6.2 6.5 6.2 6.1 6.0 —TVS, mg/1 23,590 36,470 32,710 38,790 44,404 45,820 35,900
As, mg/kg (Total) 2140 1460 1710 1440 1330 1260 1550
3a, mg/kg (Total) 11,700 14,900 CL 13,000 11,400 11,500 13,000 12,600
Cd, mg/kg (Total) 160 147 f3 145 154 152 144 150
Cr, mg/kg (Total) 637 603 l/T 652 562 534 551 539Cr+ 6 , ug/1 '<5 <5 O 6 <5 <25 <25 <12
Cu, mg/kg (Total) 6700 . 6650 ST 6650 6500 6610 6970 6530
Pb, mg/kg (Total) 4100 4040 4100 4130 4050 4290 4120
Se, mg/kg (Total) <25 <17 <19 <16 <14 <13 <17
Hg, mg/kg (Total) 9.6 5.8 6.7 3.5 2.7 5.2 5.6
Sn, mg/kg (Total) <13,000 <8400 <9300 <7800 <6800 <6500 <S600

107
TABLE B-17
CHARLES CITY MUNICIPAL SEWAGE TREATMENT PLANT
DIGESTER SUPERNATANT CONCENTRATIONS
STORET HUMBER 001911
August 1975
Lab Mo. (913 series)Type of SampleComposite Sample Info.
Start Date, day-mo. Start Time, military Stop Date, day-mo.Stop Time, military
120Grab
20/80935
N/A
122Grab
21/S1025
N/A
22/3
126Grab
23/S1045
M/A
123Grab
24/S0340
M/A
130Grab
25/S0945
N/A
132Grab
26/SG915
N/A
Arith.
Mean
x Or
Temp, C 21 22 21 24 22 21 22
pH 6.4 6.6 6.2 6.3 6.7 6.3 6.4
ECO5, mg/1 1430 1130 1130 1100 1200 1500 1300
COD, mg/1 2800 1950 2300 21S0 2490 2540 2330
NH3-N, mg/1 146 116 112 116 142 155 131
N02-N03-N, mg/1 0.15 <0.04 Q- <0.04 0.51 0.13 0.16 <0.17
TVS, mg/1 1304 1036 . TO 932 1166 1270 1050 1133
As, vg/1 39 39 m 26 33 45 33 35
Ba, v-g/1 650 330 o 460 340 530 380 450
Cd, ug/1 <50 <50 <50 <50 <50 <50 <50
Cr+G, vg/1 — -- — — <25 <25
Cr, Vg/1 23 12 17 20 20 17 18
Cu, ^g/l 330 160 350 350 310 320 310
Pb, ’ng/1 400 200 200 300 300 <200 <300
Sn, vig/1 <50 <50 <50 <50 <50 <50 <50
So, t-g/1 <100 <100 <100 <100 <100 <100 <100
rig, vg/l 2.1 2.1 0.6 1.3 1.3 1.6 1.5
1
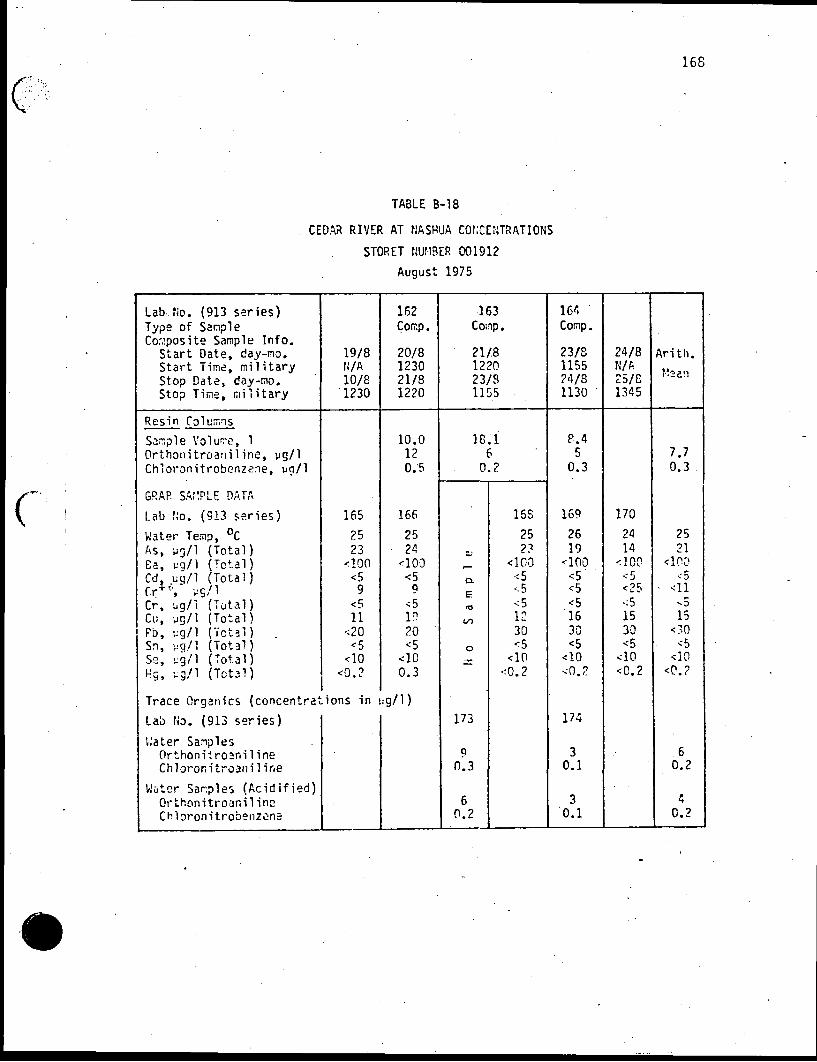
168
TABLE B-I8
CEDAR RIVER AT NASHUA CONCENTRATIONS
STORET NUMBER 001912
August 1975
Lab.No. (913 series)Type of SampleComposite Sample Info.
Start Date, day-mo.Start Time, military Stop Date, day-mo.Stop Time, military
19/8N/A10/81230
162 Comp.
20/8123021/81220
163Comp.
21/8122023/S1155
164Comp.
23/8115524/S1130
24/8N/A25/81345
Arith.
Mean
Resin ColumnsSample Volume, 1 10.0 18 .1 8.4Orthonitroaniline, yg/1 12 5 7.7Chloronitrobenzene, yg/1 0.5 0 .2 0.3 0.3
GRAB SAMPLE DATALab No. (913 series) 165 166 15S 169 170
Water Temp, °C 25 25 25 26 24 25As, ug/l (Total) 23 24 SJ 23 19 14 21Ea, ua/1 (Total) <100 <100 <100 <100 <100 <100Cd, ug/1 (Total) <5 <5 Q. <5 <5 <5 <5Cr*-, yg/1 9 9
E<5 <5 <25 • <u
Cr, yg/1 (Total) <5 <5 03 <5 <5 <5 -5Cu, yg/1 (Total) 11 19 on
12 16 15 15Pd, yg/1 (Total) <20 20 30 30 30 <30Sn, yq/1 (Total) <5 <5 o <5 <5 <5 <5Se, yg/1 (Total) <10 <10 <10 <10 <10 <10Hg, yg/1 (Total) <0.2 0.3 <0.2 <0.2 <0.2 <0.2
Trace Organics (concentrat ions in <g/DLab No. (913 series) 173 174
Water SamplesOrthonitroani1ine n 3 6Chloronitroaniline n.3 0.1 0.2
Water Samples (Acidified)Orthonitroaniline 6 3 4Chloronitrobenzene 0.2 0.1 0.2

TABLE B-19
CEDAR RIVER AT JANESVILLE''CONCENTRATIONS
STORET NUMBER 001913
August 1975
169
Lab No. {913 series)Type of SampleComposite Sample Info.
Start Date, day-mo. Start Time, military Stop Date, day-mo.Stop Time, mi 1itary
20/81355
21/S1315
22/8 23/81255
187 Comp.
23/S125524/81220
034Comp.
24/3122025/S1430
25/SN/A26/8
Arith.Mean
Resin Columns
Samp1e Vo1ume, 1 8.8 5.0Ortho -nitroanil ine eg/1 9 8 8Chloronitroher.zene, yg/l 0.2 0.3 0.2
GRA.5 SAMPLE DATA*
Lab No. (913 series) 175 176 177 179 ISOWater Temp, °C 24 26 ?n
_ 24As, eg/1 (Total) 16 14 14 ' 17 11 14Ga, ..a/1 (Total) <100 <100 <100 <100 <100 <100Cd, i.g/1 (Total) <5 <y Ct <5 <5 <5 <5Cr"-*, co/1 <5 35 c_ 10 <5 <26 Q. <16Cr, ug/1. (Total) <5 <5 o <5 <5 <5 c=.r? <5Cu, eg/1 (Total) 13 13 o 16 16 14 14Pb, ug/1 (Total) <20 20 20 30 40 <30Sn, ug/1 (Total) <5 <5 <5 <5 <5 <5Se, ug/1 (Total) <10 <10 <10 <10 <10 <10!!o, : q/1 (Total) 0.2 0.4 <0.2 <0.2 <0.2 <0.?Flow rate**, cfs 3.33 442 32 3 656 1160 993 972 ?i:
TRACE ORGANICS (conceutr ations n eg/1;
Lab No. (913 series) 132 133 124
Water SamplesOrtho-nitroaniline 3 3 5 4Chloronitroani1ine 0.1 <0.1 0.1 <0.1
Water Samples (Acidified]Ortho~nitroani1ine 4 4 6 5Chloronitroani1ine <0.1 <0.1 0.1 <0.1
* Samples collected at ending date and time of composite period.
** USGS Hater Data Report IA 75-1multiply by 0.0223 to obtain cu m/sec

170
5
TABLE B-20
CEDAR RIVER AT JANESVILLE LOADINGS, POUNDS PER DAY*
STORET NUMBER 001913
August 1975
Lab No. (913 series)Type of SampleComposite Sample Info.
Start Date, dayr-mo. Start Time, military Stop Date, day-mo.Stop Time, military
N/A
20/81355
N/A
21/81315
N/A
22/3
N/A
22/8N/A
23/81255
N/A
23/S125524/31220
M/A
24/8122025/81430
fi/A
25/8N/A
26/S
Arith.
Mean
Resin Columns
Ortho-nitroaniline 55 43 50Cliloronitrobenzer.e 1.2 1.6 1.4
GRA3 SAMPLE DATA
As (Total) 33 33 49 110 59 57Ba (Total) <210 <240 <350 <620 <530 - <390Cd (Total) <10 <12 , <18 ' <31 <27 <20Cr+■’ <10 63 35 <31 <130 <53Cr (Total) <10 <12 <18 <31 <27 <20Cu (Total) 27 31 57 100 75Pb (Total) <41 43 71 187 213 <112Sn (Tctal) <10 <12 <18 ' <31 <27 <20Se (Total) <21 <24 <35 <62 <53 <39Hg (Total) 0.4 1.0 <0.7 <1.3 <1.1 <0.9
Water SamplesOrtho-nitroaniline 6 6 25 13Chloronitrobenzene 0.2 <0.2 0.5 <0.3
Water Samples (Acidified)Ortho-nitroani1ine R 8 v 31 IBChi oronitrobenzene <0.2 <0.2 0.5 <0.3
* Multiply by 0.451 to obtain Lg/day.

APPENDIX C
LIST OF PRIORITY POLLUTANTS
AUGUST-SEPTEMBER 1977 SURVEY DATA

172
TABLE C-l
RECOMMENDED LIST OF PRIORITY POLLUTANTS
Compound Name
1. *acenaphthene
2. *acrolein
3. *acrylonitrile
4. *benzene
5. *benzidine
6. *carbon tetrachloride (tetrachloromethane)
•^Chlorinated benezenes (other than dichlorobenzenes)
7. chlorobenezene
8. 1,2,4-trichlorobenzene
9. hexachlorcbenzene
•^Chlorinated ethanes (including 1,2-dichloroethane,1,1,1-trichloroethane and hexachloroethane)
10. 1,2-dichloroethane
11. 1,1,1-trichloroethane
12. hexachloroethane
13. 1,1-dichloroethane
14 1,1,2-trichloroethane
15. 1,1,2,2-tetrachloroethane
16 . chloroethane *
*Chloroal!:yl ethers (chloromethyl, chloroethyl and mixed ethers)
17. bis(chloromethyl) ether
^Specific compounds and chemical classes as listed in the consent decire

173
r
\C-l (Continued)
18. bis(2-chloroethyl) ether
19. 2-chloroethyl vinyl ether (mixed)
*Chlorinated naphtalene
20. 2-chloronaphthalene
*Chlorinated phenols (other than those listed elsewhere; includes trichlorophenols and chlorinated cresols)
21. 2,4,6-trichlorophenol
22. parachlorometa cresol
23. ^chloroform (trichloromethane)
24. *2-chlorophenol
*Dichlorobenzenes
25 1,2-dichlorobenzene
2G. 1,3-dichlorobenzene
27. 1,4-dichlorobenzene
' . *Dichiorobenzidine
28. 3,3'-dichlorobenzidine
*Dichloroethylenes (1,1-dichloroethylene and 1,2-dichloroethylene)
29 . 1,1-dichloroethylene
30. 1,2-trans-dichloroethylene
31. *2,4-dichlorophenol
*Dichloropropane and dichloropropene
32. 1,2-dichloropropane
33. 1,2-dichloropropylene (1,3-dichloropropene)
34. *2,4-dimethyl phenol

35.
36.
37.
33.
39.
40.
41.
42.
43.
44.
'*45.
46..
47.
48.
49.
50.
51.
52.
r.7*
54.
55.
*Dinitroto1uene
2,4-dinitrotoluene
2,6-dinitrotoluene
*1,2-diphenyl hydrazine
*ethylbenzene
*fluoranthene
*Halgathers (other than those listed elsewhere)
4-chlorophenyl phenyl ether
4-bro~,ophenyl phenyl ether
bis(2-chloroisopropyl) ether
bis(2-chloroethoxy) methane
*KaloiTiathanes (other than those listed elsewhere)
methylene chloride (dichloromethane)
methyl chloride (cnloromethane)
methyl bromide (bromomethane)
bromoforn (tribromomethane)
di chi orobrcm.om.s thane
. trichlorofluoromethane
dichlorodifl uoromethar.e
chiorodibromomethane
-♦liexach-lorcbutadiene
*hexachlorocyclopentadiene
*isophorone
^naphthalene
• nitrobenzene56.

175
*Nitrophenols (including 2,4-dinitrophenol and dinitrocresol)
57. 2-nitrophenol
53. 4-nitrophenol
59. *2,4-dinitrophenol
60. 4,6-dinitro-o-cresol
*Nitrosamines
61. N-nitrosodirnethyla;nine
62. N-nitrosodiphenyl aminer
63. N-nitrosodi-n-propyiami ns
64. *pentachlorophenol
65. *phenol
*Phthajdtfi esters
66. bis(2-ethylhexyl) phthalate
67. butyl benzyl phthalate ;
Co. di-n-butyl phthalate
69. di-n-octyl phthalate
70. diethyl phthalate
71. • dimethyl phthalate
^Polynuclear aromatic hydracrarbons
72. benzo(a)anthracene (1,2-benzanthracene)
73. bonzo (a) pyrene (3,4-benzopyrene)
74. 3,4-benzofluoranthene (benzo(b)fluoranthene)
75. ber;zo(k) fluoranthene (11,12-benzofluoranthene)
76. chrysene
77. acenaphthylene
7S. anthracene.
C-l (Continued)
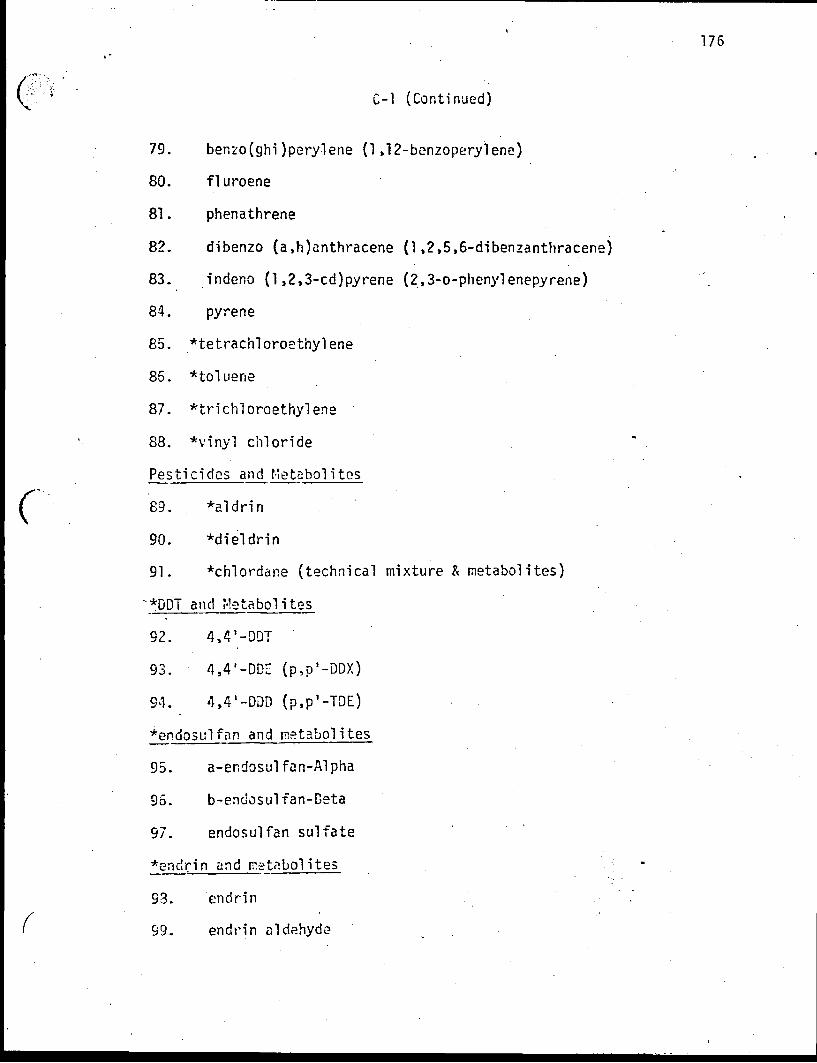
176
79. benzo(ghi)perylene (1,12-benzoperylene)
80. fluroene
81. phenathrene
82. dibenzo (a,h)anthracene (1,2,5,6-dibenzanthracene)
83. indeno (1,2,3-cd)pyrene (2,3-o-phenylenepyrene)
84. pyrene
85. *tetrachloroethylene
85. *toluene
87. ^trichloroethylene
88. *vinyl chloride
Pesticides and Metabolites
89. *aldrin
90. *dieldrin
91. *chlordane (technical mixture & metabolites)
' *DDT and Metabolites
92. 4,4’-DDT
93. 4,4'-DDE (p,d1-DDX)
94. 4,4'-DDD (p.p'-TDE)
*endosulfan and metabolites
95. a-endosulfan-Alpha
95. b-endosulfan-Deta
97. endosulfan sulfate
*endrin and metabolites
S3.
C-l (Continued)
99.
endrin
endrin aldehyde

C-l (Continued)
*hept.ac'nlor and metabolites
100. heptachlor
101. heptachlor epoxide
*hexachlorocyclohexane (all isomers)
102. a-BMC-Alpha
103. h-B'riC-Beta
104. r-BHC (1 indane)-Gaiwa
105. g-DHC-Delta
*polychlorina ted biphenyls (PCB's)
105. PCB-1242 (Arochlor 1242)
107. PCB-1254 (Arochlor 1254)
103. PCB-1221 (Arochlor 1221)
109. PCB-1232 (Arochlor 1232)
110. PCE-1243 (Arochlor 1243)
111. PCB-1250 (Arochlor 1260)
112. PCB-1016 (Arochlor TOT6)
113. *Toxaphene
114. *Antir.ony (Total)
115.. *Arsenic (Total)
116. ^Asbestos (Fibrous)
117. *i5erylliur, (Total)
118. *Cad;rnu:? (Total)
119. *ChrorrIuni (Total)
120. *Copper (Total)
121. -Cyanide (Total)
12?. *Lead (Total) :

178
C-l (Contineed)
123. *Mercury (Total)
124. *Nickel (Total)
125. *Selenium (Total)
126. *Silve'r (Total)
127. *Thallium (Total)
128. *Zinc (Total)
129. **2,3,7,8-tetrachlorodibenzo-p-dioxin (TCDD)
*Spscific compounds and chemical classes as listed in the consent decree
**This compound v/as specifically listed in the consent decree. Because of the extreme toxicity (TCDD). Vie are recommending that laboratories not acquire analytical standard for this.compound.

TABLE C-2
SALS3URY LABORATORIES WASTEWATER AND WATER
CHEMISTRY DATA
September 1977
Salsbury Laboratories StationrardrT;9ter
SL -1 SL- 2 SL-3 SL-4 SL-5
Lab. No. (S02 series) 793 795 797 761 763 771 769 731Type of SampleConip. Sample Info.
Comp. Comp. Comp.Mean
Comp. Comp. Comp • Ccmp. Grab
Start Date, day-mo 6-9 7-9 8-9 6-9 7-9 7-9 7-9 6-9Start Time, military 1045 0745 0920 1000 osoo 0330 092C 1120Step Date, day-mo 7-9 8-9 9-9 7-9 8-9 9-9 9-9 f.'AStop Time, military 0345 0920 0345 0300 0300 0745 0310 NA
Flow, ngd 0.43 0.58 0.58 0.53 ND ND ND ND ND
B0D5cone., mg/1 310 625 561 499 317 343 8.7 4.9 NDloading, Ib/day
COD
1100 3000 2700 2300
cone., mg/1 630 1030 1330 1030 617 756 236 132 NDloading, Ib/day 2400 5000 6700 4700 — “ - - -
NFScone., mg/1 3.0 15 31 16 ND ND 124 ND NDloading, lb/day 11 73 149 78 — — “ -
NH-5-Ncone., mq/1 131 194 190 172 ND ND 124 ND NDloading, lb/day 469 933 919 775 - - — ” - -- ,
NO^-NOg-N104 172 NDcor.c., mg/1 — 47 39.3 43 5.2 3.6
loading, lb/day
TKN
230 190 210
cone., mg/1 155 202 190 182 161 178 129 51 NDloading, lb/day
Total P
560 930 920 820
NDcone., mg/1 <0.2 0.5 0.5 0.4 3.0 1.0 47 5.5loading, lb/day <0.7 2.4 2.4 1.8 — — ~ —
Conductivity, umho/cn 5970 8320 8520 7600 6670 6710 6670 6300 ND
— No Flow Measurement
NO No Data Available

ISO
I
C-2 (Continued)
SALSBL'RY LABORATORIES WASTEWATER A9D WATER
CHEMISTRY DATA
September 1977
Parameter Salsburv laboratories StationSL -1 SL- 2 SL-3 SL-4 SL-5
Lab. Ko. (902 series) 793 795 797 761 753 771 769 731Type of SampleComp. Sample Info.
Comp. Comp. Comp.Mean
Comp. Comp. Comp. Ccmp. Grab
Start Date, day-mo 6-9 7-9 8-9 6-9 7-9 7-9 7-9 6-9Start Time, military 1045 0745 0920 1030 0300 0230 0920 1120Stop Date, day-mo 7-9 8-9 9-9 7-9 8-9 9-9 9-9Stop Time, military 0945 0920 03-5 03.90 0300 0/-o 0310 NA
Color, CPU 2910 3220 3130 3930 3170 2610 2260 1500 NO
PH 9.1 9.1 9.1 9.1 S.O 8.0 7.3 7.0 HDArsenic (Total)cone., ug/1 5B00 7200 5700 6200 9300 8900 ooru\ 7500 "'10loading., lb/day 21 35 23 28 — ■ --
Cadmium (Total)cone., ug/1 <1 <1 <1 -1 ■ 1 <2 •4 O <1
!loading, lb/day <.00d -.005 <.005 -.005 —Chromium (Total) cone., i-g/l 9 <5 <5 <6 10 6 -5 • 5
i
i-*
loading, lb/riay 0.03 <C. 02 <0.C2 <0.02 — : iI
Copper (Total) cone. , ■-■c/1 20 30 35 *5 r-L. 28 36 30 10 ■'5loading, lb/day 0.07 0.15 0.17 0.13 - i
Lead (Total)cone., o/l : *■5 <5 <5 '5 <50 <5 <5 <5loading, lb/day <0.02 <0.02 <0.02 <0.02
','ickel (Total)cone., og/l <50 "50 <59 <50 <50 <50 <50 <50 <50loading, lb/day | -0.2 -0.2 . -r\ O"J . L. -0.2 --
Selenium (Total) cone., ug/1 2 i 0 239 310 270 190 ! 130 190 130
i1loading, lb/day 0.75 1.4 ■; .5 1.2 - -- — 1
Silver (Total) cone., uqV1 <2 <2 * '"vL • / •2 "2 ' <2 .loadir.c. lu/bav
* l!■: 0.01 :0.01
_
-.0.91 0. Cl -- --'I- - »1___i

181
C-2 (Continued)
SALS3URY LABORATORIES WASTEWATER AND WATER
CHEMISTRY DATA
September 1977
Salsburv Laboratories StationParameter
SL- 1 sl-;l SL-3 SL-4 SL-5
Lab. No. (902 series) 793 735 797 761 763 771 769 781Type of Sample Comp. Comp. Comp.
MeanCOi''p . Comp. Comp. Ccmp. Grab
Comp. Sample Info.Start Date, day-no 6-9 7-9 8-9 6-9 7-9 7-9 7-9 6-9Start Time, military 1045 0745 0920 1000 C3D0 0830 0920 1120Stop Date, day-mo 7-9 C-9 9-9 7-9 8-9 9-9 9-9 na
Stop Time, milit3ry 0945 0920 0345 0300 0800 C7-o 0010 ::a
Barium (Total) cone., ug/1 <100 <i oo <100 <100 <100 <100 <200 <200 <100loading, lb/day <0.4 <0.5 <0.5 <0.5 -- “ - “ -
Antimony (Total) cone., pg/1 35 74
i90 j 70 76 , 76 89 87 <10loading, lb/day 0.13 0.35 0.44 |
i0.31 — — “ - • - * -
Tin (Total) cone., t;g/l <2000 <2000
1<2000 <2000 <2000 • 2000 •2000 -2000 ■10C0
loading, lb-'day <7 <10<10 1
<9 - ~ - -
Mercury (Total) cone., ::C/1 8.2 6.5 6.0 6.9 26 23 ND 1.5 -o.r iloading, lb/day 0.3 0.3 0.3 0.3 1
1 || 3eryllium (Total)
cone., u3/1 1.2 1.6 1 C s • u 1.5 1.6 0 AL. . *T
rr\ 1 c• • \y
ij -1 i
loading, lb/day |0.004 0.003 0.009 0.007 — • — — “ j
Thallium (Total) cone., -..g/l <5 <10 <10 <8.3 <5 <5 r;n <5
i1 <5
loading, lb/day <0.02 <0.05 <0.05 <C-.C4 — ** — - “1 1
Zir.e (Total) ,cone ., ug/1 70 49 57 59 71 80 0D 57
1
33loading, lb/day 0.25 0.24 0.28 0.25 — “ —
Ortho-nitroani1 ire cone., uq/1 5400 6200 9400 7C9C 6400 4700 4100 5 CO r;oloading, lb/day 19 30 45 31 “ ” — "•
Para-nitroaniline<50 <50 MOco.nc., ;.g/l 4200 6300 6800 •5330 4700 5300
o 15' 30 J j
tU V

C-2 (Continued)
lbs.
SALSBURY LABORATORIES WASTEWATER ANO WATER
CHEMISTRY DATA
September 1977
Salsburv Laboratories StationSL-■1 SL--2 SL-3 SL-4 SL-5
Lab. fio. (902 series) 793 795 797 761 763 771 769 781Type of SampleComp. Sample Info.
Comp. Comp. Comp.Mean
Comp. Comp. Comp. Comp. Grab
Start Date, day-no 6-9 7-9 8-9 6-9 7-9 7-9 7-9 6-9Start Time, military 1045 0745 0320 1030 0300 0830 0320 1120Stop Date, day-no 7-9 8-9 9-9 7-9 8-9 9-9 9-9 NAStop Tine, nilitany 0345 0920 0345 0300 csoo 0745 0810 if A
Phenolcone., ug/1 ::d 16500 ND 16500 16500 13500 ND <20 <20loading, lb/d3y 83 ■ 80 — — —
2-Nitrophenolcone., ug/1 md 4100 NO 4100 13000 7000 ND <20 <20loading, lb./dey 20 20
4-Nitrophenol<20 <20cent.. i.g/1 NO 1100 ND 1100 3500 3000 ND
loading, lb/day 5.3 5.3
Nitrobenzenecone., rg/1 30 NO ND 30 50 ND ND <20 20
j loading, lb/day 0.1 0.1 — — “ --
| P-BHC1 cone., og/1 7 25 41 26 23 <2 7 ND NO
loading, lb/day 0.03 0.14 i
0.20 0.12 ” - — ~ “
Fluoranthene, ac/l <20 • NO ND’ <20 <20 ND ND <20 • 20
Pyrene, yg/1 <20 ND ND <20 <20 ND ND <20 <20
Benzidine, rg/l <100 ND ND <100 <100 NO NP <100 <100
Butyl-benzyl-<20piiathalato, ;.n/l <20 NO NO <20 <20 ND ND
Bis(?-ethylhe:-:yl) phtrial ate, ug/l <20 NO NO ' <20 -20 ND ND <20 <20

C-2 (Continued)
SALSBURY LAG0RA7CRIES V;AS7E'..'A7ER AND V.'A7ER
CHEMISTRY DA7A
September 1977
Parameter Salsbur\ I. a b nr a ■Dries StationSL -1 SL -2 SL-3 SL-4 SL-5
Lab. No. (90? series) 793 7D5 797 761 763 771 769 7317ype of Sample Comp. Comp. Comp. COT.p . Con.p. Comp. Ccnp. GrabCorap. Sample Info. Start,Date, day-r.o 6-9 7-9 8-9
MeanC-9 7-9 7-9 7-9 6-9
Start line, military 1045 0745 0920 1 WO 0:'0J 0330 0320 1120Stop Date, day-no 7-9, 8-9 9-9 7-9 8-9 9-9 9-9 »r •i*f\
' Stop 7ine, military 0945 0920 0543 0000 P'00 0745 0310 li t\
Chrysene and/orEeneo (a)Anthracene, ug/1 <20 :.o ND <20 <20 ND NO <20 ■ no
lBenzo (b) Fluoranthene and/or Benzo (k) Fluoranthene, ng/1 i:d NO ND
■NO ND NO < 'ii
»ti<23 j
3,3-Diciilorobenaidine,<20 :;d <20 •20 ND \n <20
iI• 20 j
Di-n-octyl phtalate, ug/1 <20 t't) ND <20 <20 ND N J ,0 ■:20
: uenzc laj ryrene, ;C/i•
<20 riu iiD ■kt/-20 '
.it/ ND.
- 2D
! ind?no(l,2,3-rd)- pyrena, ug/l ■'1 ,~'0* * - ^ NO no -:}Q0
l<100 ND Vr; \ pi <1 DC
i
•••iw
Dioenao (a,!i)- Anthracene, vg/1 <50 •
•:;d ND
\<50
! <50
1no ND <50 ..'P
Senzo (g.h.i) perylcr.e, -..g/1 <20 NO ;;o <20 ■ 20
i■ND • i n <2^ -2d
h-hitrosodi :-ethvlanir:e. uS/l ,,, ,ND 'I?.
iil
i ND1
ND ND ■ • u•;• .u
4-Chk'ro-prenyl phenyl ether, '.-.g/1 <20 *;n >iU
ii -o., ' s- ND ND <20
i-o !
Acenaphhly/k-ne, ng/l <20 NO| -20 1 f-j'sj :»L NO ND *20' ^20 j
L

!£'■C-2 (Continued)
SALS3URY LABORATORIES WASTEWATER AND WATER
CHEMISTRY DATA
September 1977
Parameter Salsburv Lahore tories Station
SL -1 SL -2 SL-3 SL-4 SL-5Lab. f{o. (902 series) 793 795 797 761 753 771 769 781Type of Sample Co.iip. Comp. Comp. Comp. Comp. Comp. Comp. GrabComp. Semple Info.Start Date, day-no 6-9 7-9 8-9
Mean6-9 7-9 7-9 7-9 6-9
Start Time, military 1C45 0745 0920 . 1000 0300 0330 0920 1120Stop Date, day-no 7-9 8-9 9-9 7-9 8-9 9-9 c.o • *Stop Time, military 0945 0920 0845 0300 0300 0745 0310 »V\
Isophorene, ^g/1 -'20 ND ND <20 <20 ND ND <20 <20
Fluorene, ig./l <20 NO ND <20 ND ND ND <20 -20
2,c-Dinitrotolune, a 9/1
oC\JV NO ND <20 ND ND NO
•‘20 <20
1,2-Diphenyl - hydrazine <20 NO ND <20 ND ND ND <20
1
' 1I
2,4-Dinitrotolane <20 ND ND <20 ND ND ND <20 ■20
N-Ni troscdipner.vl amine, ug/1 :;rj ND <20 » ND NO <20 <20 -
rvjxuchl orjbenzene,.g/i <20 NO ND <2C r.D ND ND <20
-20 j
; 4-Sromophenyl phenyl ether, ug./l <20 ND ND <20 ND , ND
!j
ij ?nenanthre:;e, uQ./l -.20 ND ND <20 ND ND ND <20* <20*
Antiiracene, ;ig/l <z0 ND ND -20 ND ND ND <20* ■-2G*
D inethyl pl'.al ate, rO/’l <20 ND ND <20 ND ND ND <20 ■'20
Diethvlohtholate,rg/l <20 NO ND <20 ND ND '.ND <20 -20
^Pivener.tisren-c and/or Anthracene

C-2 (Continued)
r
SALSBURY LABORATORIES V.’ASTEWATEP. AND V.'ATER
CHEMISTRY DATA
September 1977
Salsburv Laboratories StationSL.-1 SL -2 SL-3 SL-4 SL-5
Lab. No. (902 series) 793 795 797 761 763 771 769 781Type of Sample Comp. Comp. Comp. Comp. Como. Comp. Comp. GrabComp. Sample Info.Start Date, day-mo 6-9 7-9 8-9
Mean6-9 7-9 7-9 7-9 6-9
Start Time, military 1045 0745 0920 1000 0300 C330 0920 1120Stop Date, day-no 7-9 8-9 9-9 7-9 8-9 9-9 9-9 V «•1Step Time, military 0945 0920 0345 0300 0300 0745 0310 !♦ \
Benzo (a) Anthracene, ng/1 <20 ND ' ND <20 ND ND ND . ND ND
Benzo (b) Fluoranthene, rg/1 <20 ND ND <20 f!D ND ND ND ,
Benzo (k) Fluoranthene, vg/1 <20 ND ND <20 ND ND ND ND ND
Di-n-butyl-pnthalate,■ag/1 <20 ND NO
. ) •■-20 ND ND • <20+ ,n . l
N-Nitrosodi-ii- Propyl amine, O /1 <20 ND ND , <20 <20 ND ND <20 <20
Chlordane, ug/l <20 <20 <20 <20 : <20 . ir.' *“ ^
<20 ND 1:4 * }
ij Toxaphene, ;.:g/l <300 <300 <300 <300 <3^3 <300 <300 ND ND
| PCS-12-2, ,.g/l <21 <21 <21 <21 <21 <21 <21 ND »«'J
j FC3-1254, j.3/l <35 <35 <36 <36 <36 <36 <35 ND ND
| PCB-1221, ;:q/l <23 <23 <2E <28 <28 <28 <23 ND ND
j PCB-1232, ;:g/l <7 <7 <7 <7 <7 <7 <7 ND ND
PC5-124S, uS/1 <29 <29 <29 <29 <29 <29 <29 ND ND
PCD-1260, un/1 <54 <54 <54 <54 <54 <54 <54 - ND NO
PCB-1016, np/1 <17 <17 <17 <17 <17 - <17 <17 ND ND
________
+Trace

(
C-2 (Continued)
SALS3URY LABORATORIES WASTEWATER AND WATER
CHEMISTRY DATA
K.C-
September 1977
Salsburv laboratories Station1 Ul U'mC LC 1
SL -i SL SL-3 SL-4 SL-5Lab. No. (902 series) 793 795 797 761 763 771 769 781Type of Sample Comp. Comp. Comp. Comp. Comp. Comp. Comp. GrabComp. Sample Info.Start Date, day-mo 6-9 7-9 8-9
Mean6-9 7-9 7-9 7-9 6-9
Start Tine, nilitary 1045 0745 0920 1000 0300 0830 0920 1120Stop Date, day-mo. 7-9 8-9 9-9 7-9 8-9 9-9 , 9-9 NAStop Time, military 0945 0920 0345 0300 0300 0745 0310 NA
2,3,7,6-Tetrachlcro- dibenzo-p-dioxin, i:?/l <11 <11 <11 <11 <11 <11 <11 • ».*>Mb’ ND
Endrin Aldehyde, -y/1 <20 <20 <20 <20 <20 ,*?n <20 NO NO
Aceraphthen®, .g/1 <20 ND ND <20 ND ND ND <20 <20
B-endcsulfan, yCj/1 <6 <6 <6 <6 <6 <5 <6 t* r>■ I u NO
rn |,"> „ i 1y i'Q/ i <1 <i *1 "I <1 |irj NO ’
y-BHC, ;.g/l < 1 <i <i <i <1 <i ■ <1 :;d ND
j , -hC/I <1 <i ‘ 1 <i -1 NO •:.r\
Aldrin, ;.g/l <2 <2 <2 <2 - •w.• » j
.ND
Heptachlor, ;:-g/l -2 ' <2 <2 .2 ' <2 *.nMUND !
1Heotachlor ’epoxide,
9/1 .; 4. <2 .o .O :id ND1
:.-endosu 1 fan, '.:o/l <2 <3 <3 -3 -3 ..3 -< NO 1V r*HU
Die!drin, r.g/l ! -.3 *0I
'O <3 <3 <3 r>•iu»1 NO
4,4:DD2 ^ -r <4 * <4 ■■4 <4 '■.4 >.n• t u ND
4,£‘d:dj
<6 <c <6 <5 -;5 <5 <6 *tnitl) v n: %
4,4'PDT ■ 1C <10 <10 <10 <i'j <10 <10 •inM »* f;n l
i
Endri r. -5 uc *< J <5 .5 <3 <5 NO1

) 187
C-2 (Continued)
SALSBURV LABORATORIES KASTEKATER AND MATER
CHEMISTRY DATA
September 1977
Salsburv La borat ories Station
SL--1 SL- 2 SL-3 SL-4 SL-5
Lab. No. (902 series) 793 795 797 701 763 771 759 731Type of Sanple Comp. Comp. Ccmp. Comp. Comp. Comp. Comp. GrabComp. Sample Info.Start Date, day-ro 6-9 7-9 8-9
Mean6-9 7-9 7-9 7-9 6-9
Start Time, military ic;s 0745 0920 1000 oooo 0339 0920 1120Stan Date, day-mo 7-9 8-9 9-9 7-9 8-9 9-9 9-9 NA
j Stop Time, military 094S 0920 CS^f C2.G0 080 J 0745 CD 10 NA
1---------! Endosulfar sulfate,
■-9/1 <20 <20 <20 <20 <20 <20 <20 <20
1
<20 iI
1,3-Dichlorobenzene,! -9/1 <20 liD ND ':2C <20 MO *t ->Hi* <20
1i
<20
1, 4-Dichlorobenzene, i-g/1 ■20 MD r-iD
‘<20 <20 ND ND <20 -20
1,2-Dichlorobenzene,■■3/1 . -20 ND <20 <20 MD MD <20 CO
iiexachloroethane, -a/1 -20 no MD <20 <20 ND ■ ND <20•
<20
| Bis(2-chloroet'nyl ; ether), -,.n/I •:20 ,, ND -20 X£. J MB'
'ND -20
i1<20 j
Cis(2-chloro isopropyl ) ether, -.g/1 . <20 rio
|nd <20 <20 ND MD <20 -20
j Hexachloro butadiene, :9/l <20
iND ND <20 <20 ND MD <20 <20
1,2,4 Trichlcrcbrnzene,I 1:5/1 <20 nd f!D <20 -20 ND Hu/ <20 <20
Napthalene, ;.Q/1 <20 ND MD <201
<20 MD ND <20 -20
5is(2-chloroetnoxy) Methane, ug/1 <20 ?:d ND <20 .<20 ND MD <20 <20
Hexachlorocyclo- pentadie.me, ;.g/l -20 nd nd <20 -20 NO ND <20 <0

C-2 (Continued)
SALS3URY LABORATORIES WASTEWATER AND WATER
CHEMISTRY DATA
September 1977
Parameter Salsburv Laboratories Station
SL -1 SL -2 SL-3 SL-4 SL-5Lab. No. (932 series) 793 795 797 761 763 771 769 731Type of Sample Co:;ip. Comp. Comp. Comp. Comp. Comp. Comp. GrabComp. Sample Info.Start Date, day-mo 6-9 7-9 8-9
Mean6-9 7-9 7-S 7-9 6-9
Start Time, nilitary 1C4S 0745 0920 1990 0200 0330 0320 1120Stop Date, day-ro 7-9 8-9 9-9 7-9 8-9 9-9 9-9 NAStop Tima, mil itary 0945 0920 0345 C300 0290 0745 0310 »- * ll“V
2-Chloror.eptnelene,wg/1 <20 ND ND <20 <20 ND NO <20 <20
2-ChIorcphenol, yg/1 ND <100 ND <100 <20 <20 ND <20 <20I
2,4 Dimetiiyphenol, eg.'l MO <20 ND ■ 29 <20 <20 ND <20 •:2 C
2,4-Dichlorcobenol,-■3/1 MD <20 ND <20 <20 <20 MPl
,,U <20 "I -\-• (~ \J
P-chluro H-cresol, yg/1 r;o <20 ND <20 <20 <20 ND on<LV <20
?,4,6-Trichioroabon3l , 1.3/1 ND . <29 . Of) <20 ND
■
<20 ‘ - ^
2,4-Dinitrcphenol, r3/l ND <400 ND <490 <400 <409 s’J •4 inrl 1
.-'no
4,6-Dinitro 0-cresol ND <t00 vn■ i ^ <400 <400 <400 NO <490 <400
PentacMorcahenol.:0/l
___________________________________
ND <20 ND ■20 <20 <20 ;;i; <2G •20

3E9
C-2 (Continued)
SALSBURY LABORATORIES WASTEWATER AND WATER
CHEMISTRY DATA
September 1977
Salsbury Laboratories StationParameter
SL-■1 SL- 2 SL-3 SL-4 SL-5
Lab. No. (902 series) 799 800 . 801 755 766 778 769 781Type of SampleComp. Sample Info.
Grab Grab GrabMean
Grab Grab Grab Grab Grab
Start Date, day-no 7-9 8-9 9-9 7-9 8-9 9-9 9-9 6-9Start Tine, nilitary 09 $5 0920 0045 0300 0899 0745 0210 1120Ston Date, day-no NA NA NA NA NA NA NA NAStop Tine, military NA • 1Ain NA NA NA NA NA NA
1,1 ,1-Trichloroethane,U3/1
oC 1
V <20. NO <20 <20 ND ND ND <20
Carbon Tetrachloride,ng/i <2C+ <50+ :;d ' <50* <20 NO ND ND <20
Broncdichioromethane,ng/l <20 <50 NO <50 <20 ND ND ND <20 |
Bis-chloronethyl•
•
ether, pg/1 :;d \ NO ;:d ND ND ND ND ND NOt
1,2-Dichiorooropane,1
1
-g/i -20 <50 • r. <59 < <1 J ND NO \P • 20 |
A Trans-l,3-0ichloro-.
ipropene, cg/l <20 -50 • r\
A
• 50 <20 NO ND ND - ■20 !
.
i
! i
■a 3/1 <20 <50 NO <50 <20 ND ,w NDi
S-Ci s-1,3-DiciiIoro-; t
; i
propane, ag/l <20 <50 ND <50 <20 ND ND NO 1 <20I
1,1,2-Tri chi oroeti'.ane, !
.3/1 >200 655- <5400 <20 + ND ►in1«1.' ND i v 2 0
loading, Ib/'hv '0.7 j i. >15 -- 1 —: i
Benzene, .g/1 <20 <50 j p, <50+ ■••20 ND ■ ND ND | " ’
2-Chioi'oethyl v invli
ether, ag/l NO *T* <50 NO NO ND“
i ill-
i___________________
+Trace

C-2 (Continued)
SALS3URY LASORATORIES WASTEWATER AND WATER
CHEMISTRY DATA
September 1977
ParameterSalsbury Laboratories Station
SL--1 SL- 2 SL-3 SL-4 SL-5
Lab. No. (902 series) 799 300 801 765 766 773 769 731Type of Sample Grab Grab Grab Grab Grab Grab Grab GrabComp. Sample Info. MeanStart Date, day-ir,o 7-9 8-9 9-9 7-9 8-9 9-9 9-9 6-9Start Time, military 0945 0920 0345 C300 0800 0745 0310 .1120Stop Date, day-mo NA NA NA NA NA NA NA NAStop Time, military HA NA NA NA NA NA NA <7A
Acrolein, ug/1 .ND ND ND ND ND ND ND ND <5000
Acrylonitrile, ug./l ND ND ND ND ND ND ND ND <5000
Chlorenethane, eg/1 ND ND ND ’ ND ND ND ND ND ND
Dicrlorodif1uoromethane,ug/l ND ND ND ND ND KD ND ND
J
i 3ro.*:omethane, ug/1 <20 <50 m n <50 -20 ND ND wp111/ND 1
! Vinyl chloride, ia/1 <ND <50 ND <50 ND ND ND■
ND V.IliJI ,| orjctn^nc, 1 <20 <50 ND <50 -20 ND Nl» ND fi0
I Methylene Chloride, '::5/l <20 + -5 Or i*D <50+ <20+ ND ND ND
> Trichlorofluorom?thane, t1
.j
• ;<20 1
! uT/l -20 ; oo *>n ; . -50 •20 ND i.i ND
leading, lb/day i
0.07 ;C-29i
<0.2? —!
!1j
t• 1,1-Dichloroethylene, 1 1i
1 mj n . >210 370 >290 <20+ ND ND ND <20 I
j loading, lb/day 0.75 i 1.8 “ -
i Trani-1,2-fJichloro-j ethylene. ..g/1 <20 <50 ND <50 <2C uD ND ND <20
i; Chloroform, -.e/l <20' <50- ND <50+ -20 ND ND ND <20 1
1,2-Dichloroetha':--',:.;3/l <20+ 20 ND <2C+ <2'J ND ND ND <2C

C-2 (Continued)
SALSB'JRY LABORATORIES WASTEWATER AND WATER
CHEMISTRY DATA
September 1977
Salsbury Laboratories StationParameter
SL -1 SL- 2 SL-3 SL-4 SL-5
Lab. No. (S02 series) 799 890 801 765 76C 778 769 781Type of Sample Grab Grab Grab Grab Grab Crab Grab GrabComp. Sample Info.Start Date, day-mo 7-9 8-9 9-9
Kean7-9 8-9 9-9 9-9 6-9
Start Time, mi 1itary 0945 0920 0S45 0800 csoo 0745 0810 1120Stop Date, day-mo NA NA NA NA MM NA
NANA NA
Stop Time, military NA NA NA NA NA NA NA
Bromoform, ..5/1 <20 <50 NO <30 <20 ND ND ND <20
1,1,2,2-Tetrachlore- . ethane, -..g/l <20 <50 ND <50 <20 ND ND ND <20
1,1,2,2-Tetrachloro- ethene, ng/l ••20 <50 NO <50 <20 ND :;d »ir>> tL/ <20
1,1-Dichloroethane,-s/i •-20 <50 ND ' <50 <20 r.o NO ND <20
Trichloroethylene,m /1 <20. -.50 ND <50 <20 Ml 11 J ND ■20
Toluene, og/’l <50 ND <20 ■!- ND »«n j
• Chlorobenzene, 5 / T| <20
<50 ND I <50I
<20 0 N9 ND <20
1Ethyl benzene, ug/l I <20 <50 ND
1
! <50t
<20 ft,li'.1 i Si Ji
»; r\ iU' <2C
! Phonclics, cone., mg/1. 33 60 50
1i • >! '?r 1.7 2.0 0.3o 0.03 <0.005
loading, Ib/day 140 290 240 ! 220 * — — — “ ” “ -
Cyanide cone., r.n/l ■*' -» l 0 2.0 2.0 1.0 1.5 1.8 0.16 0.1 NCloading, lh/day 4 / 9.7 9.7 •;> r» j s1
l .. _

TABLE C-3
CHARLES CITY MUNICIPAL WASTEWATER TREATMENT PLANT
CHEMISTRY DATA
September 1977
Parameter Treatment Plant Stations
Influent EffluentLab. No. (902 series) so-; 806 803 816 818 820 P.em.Type of Sample Comp. Comp. Grab CO.T:p. Comp. Comp
Comp. Sample Info. MeanStart Date, Jay-mo 6-9 7-9 9-9 6-9 7-9 S-9Start Time C340 0340 0630 C305 0740 0730Stop Date, day-mo 7-9 8-9 NA 7-9 8-9 9-9Stop Time OBC'J 0740 NA 0740 0/30 0600
Flow, ngd 1 .56 1.53 1.97 1.70BCD5cone., mg/1 ‘21 7 258 197 224 34 33 48 33 S3loading, lb/day 2820 3100 3240 3200 44Q 430 7D0 550 83
CODcone., mg/1 505 577 530 540 168 1 SI 253 201 C 1
1 loading, lb/day 6580 7600 8710 7600 2130 2330 4160 291C 62! NFS '| cond., mg/1 113 109 K GO 12 7 cO 13 13-* iloading, lb/day 1540 1440 23C 1070 150 90 330 190
-a !
KH3-IJ 1l
cone., mg/1 47.8 62.5 59 56 42.4 53 59.5 52 7loading, lb/day 621 823 970 800 551 700 977 740 s
NO2-NO3-N '‘!
ccnc. , mq/1 10 9.7 12.4 10.7 2.8 1 .76 1.38 1 .98 i6) |loading, lo/'day 130 128 203 1 53 36 23.2 22.7 • J
r 0 j5c !Ti.N i icone., t.-j/I 61 NO i 58 47 62 67 59 13loading, It/day 790 -- 1220 j 1010 610 820 1100 340 17
Total P icon;., mg/1 8.0 ND 2.5 5.0 <0.2 3.3 3.3 2.3 54loading, lb/Jay 100 -- 41 70 ..2.6 43 64 33 53
Color, CPU 1360 1560 1730 1550 1020 1370 142C 1 2/C 18pH 8.1 8.1 7.4
------- L7.1 7.3. 7.3 --
•

C-3 (Continued)
CHARLES CITY MUNICIPAL WASTEWATER TREATMENT PLANT
CHEMISTRY DATA
September 1977
ParameterTreatment Plant Stations
Cln
Influent EffluentLab. tio. (902 series) 804 806 803 816 818 820 Rem.Type of Sample Comp. Ccnp. Grab Comp. Comp. Comp.Comp. Sample Info. Mean MeanStart Date, day-r.io 6-9 7-9 9-9 6-9 7-9 8-9Start Time 0340 0340 0530 0205 0740 0730Stop Date, day-mo 7-9 8-9 KA 7-9 8-9 5-9Stop Time 0300 0740 r:A 0740 0730 0500
Arsenic (Total)cone., ug/1 2900 2400 22 CO 2500 1000 1500 1500 1400 44loading, Ib/day 33 32 36 35 13 21 26 20 43
Cadmium (Total)con;., ug/1 <2 <1 •: 1 <1 <1 <1 <1 <i --loading, lh/day <0.03 ■0.01 <0.02 -0.02 <0.01 <0.01 • 0.02 <0.01 i
Chromium (Total)ccnc., ug/1 10 12 <9 10 <5 <5 ■ 7 --loading, lb/day 0.13 O.TG <0.02 <0.12 C.l 3 <0.07 <0.03 <0.01 "
Copper (Total) ■
'i
cone., Vj/1 F5 53 22 •13 22 20 29 24 50 iloading, lb/day 0.34 0.76 0.35 0.65 0.29 0.26 0.43 0.34 .1 C iT«.i
lLead (Total) !!cone., ug/1 30 23 R 21 -5 - g <5 <5 ■■ 7 6 iloading, lh/day n> ■■■ -m
U.HU 0133 0.13 0.29 <0.0; <0.'07 ••0.08 • 7 2-7*6• »
Nickel (Total) i
cone., ug/1 <50 <50 <50 <30 -50 <50 <50loading, lb/day <0.C <0.7 ■ <0.2 . ■ 0.7 <0.5 -0.7 -0.8 <0.7 --
Selenium (Total) 1 ■conc., ug/1 I 34 40 77 50 34 41 63 49 4leading, le/day C. 50 1.3 0.75 0.44 0.54 1 .1 0.69 o
Silver (Total)cone., ug/l <5 <5 -5 . 5 -2 •>
v C. --loading, Ib/day -0.07 <0.07 <0.03 <0.07 -0.03 <0.03 <0.03 <0. C3
Barium (Total)cone., ug/1 <200 <200 •200 -200 <200 <200 <200 <203 --
loading, lb/day <2.6 <2.-5 <3.3 <2.3 -2.6 • 2.6 <3.3 ■•2.3.* -

C-3 (Continued)
19--1
CHARLES CITY MUNICIPAL WASTEWATER TREATMENT PLANT
CHEMISTRY DATA
September 1977
ParameterTreatment Plant Stations
e/*Influent Effluent
Lab. .No. (902 series) 804 805 803 816 818 820 Rem.Type of Semple Comp. Comp. Grab Comp. Comp. Comp.Comp. Sample Info. Mean MeanStart Date, day-mo 6-9 7-9 9-9 6-9 7-9 8-9Start Time 0S40 0340 0530 0305 0740 0730Stop Date, day-mo 7-9 8-9 IIA 7-9 8-9 9-9Stop Time oooo 0740 NA 0740 0730 0600
Antimony (Total)cone., vg/1 11 15 25 17 11 22 24 19 --
loading, lb/day 0.14 0.20 0.41 0.20 0.14 0.28 0.39 0.27
Tin (Total) -cone., >ig/l 151 15S 44 115 79 63 79 75 36leading, lb/day o p 2.1 0.73 1 .6 1 .0 0.89 1 .3 1 .1 31
jMercury (Total • .
:cone., vs71 \ 5- 2.5 ND 3.3 1 3.2 1 .6 1.9 53 !
iloading, ifc/aay
Beryllium (Total)
0.06 0.03 -- C. 04 0.C1 0.04 0.03 0.03 « - J 2
cone., vg/1 <1 <1 <1 <1 <1 <1 -.1 --loading, lo/rfay
Thallium (Total)
<0.01 <0.01 .0.0? -0.01
.
-0.01
■
■^0.01
■
<0.02.
•
<0.01
cone., ug/l <5 <5 <5 -.5 <5 <5 <5 ■;5.! loading, lb/day
Zinc (Total)
<0.06 <0.07 0.01 <0.07 <0.05 <9.07 <0.03 -C.C-7
can;, vg/1 151 158 44 ns 79 6S 79 75 36loadir.b, lb/d3y
•Grtno-nitroanilinc
2.0 2.1 0.72 .1 .6 l.O 0.9 1 ,3 1.1 31
con;., v3/l 1700 2500 2700 2300 730 1400 1 300 1100 52loading, lb/day
Paru-nitroani 1 i r.e
22 33 ■34 33
.
9.5 IS 21 16 53
can;., ue/l 1000 1700 3500 21 Of- 500 490 750 530 72loading, lb/day
Phenol
13'
22 59 •3 3 6.5 6.4 12 S. 3 01
cor.;., ),;/! loading, IL’/day
HD ■ 1*400 31
Vfl
■______
0022
ND 200.26
LD 200.26
'J?l!L

195
C-3 (Continued)
CHARLES CITY MUNICIPAL WASTEWATER TREATMENT PLANT
CHEMISTRY DATA
September 1977
Treatment P lant Stationsrardnie ter Influent Effluent 6/k>
Lab. No. (902 series) Type of SampleComp. Sample Info. Start Date, day-mo Start TimeStop Date, day-moStop Time
804Comp.
6- 9 03407- 9
0500
80SComp.
7-9 0840 ' 8-9 0740
803Grab
9-9C500
NANA
Mean
816Comp.
6- 9 03057- 9
0740
813Con?.
7- 9 07408- 9
0730
820Comp.
8- 9 07309- 9
GOOD
Mean
r.em.
2-Nitrophenol cone., ug/1 loading, lb/day
NO 82011
ND 82011
ND <20<0.26
ND <20<0.26
-93>95
4-Nitrop:>?nol cone., v0/1 loading, lb/day
NO 13C2.4
ND 1802.4
ND <20<0.26
ND <20+ <0.2G
>yg>59
Kitrobenzene, ng/1 20 <20 <20 <20 <20 <20.
<20 <20 <20
5-SHC, vg/l HD
MU <2 rr\MU <2 •irjtvj O v.«- O <. LFluoranthar.e, ug/1 •:20 <20 <20 <20 <20 <20 <20 <20
■Pyrene, ng/1 <20 <20 <20 <20 <20 <20 <20 <20
Denzidine, ug/l <100 <100 -100 <100 <100 -1 OCi <100 <100
Butvl-benzyl- phalthalate < >0 -J <20 -20 <20 <20 uu ■ <20 111
Gi s-(2-ethyl r,exyl) phalthalate <20* <20 <20 <20 <20 <20 <20
. ■
Chrysene, '.g/l NO <20 <20 <20t
<20 -20»
-20 <20
Chrysene and/crBenzo (a) Anthracene, wo/1 -20 NO ND <20 ND ND ND ND
i
Benzo (a) Anthracene, V3/1 ?:d <20 <20 <20 <20 <20 <20 <20 --
Genzo (b) Fluoranthene and/or Benzo (k) Fluoranthene, yg/1 -.20
LNO NO <20 j ND
LND ND ND
J--
+ Trace

C-3 (Continued)
CHARLES CITY MUNICIPAL WASTEWATER TREATMENT PLANT
CHEMISTRY DATA
September 1977
ParameterTreatment Plant Stations
Influent Ef f1uent
Lab. No. (902 series) GOT 806 803 816 813 820 Rem.Typo of SampleComp. Sample Info.
Comp. Comp. GrabMean
Comp. Comp. CO<i‘>p #
Mea nStart Date, day-mo 6-9 7-9 9-9 6-9 7-9 8-9Start Time OSAO 0540 0530 l
i0305 0740 0730
Stop Date, day-mo 7-9 8-9 NA 7-9 8-9 9-9Stop Tine 0200 0740 0740 0730 06C0
_i1
Eenzo (b) Fluoranthene, ;ig/l
3,3'-Dichlorobenzidine,
ND <20
l
<20 <20 <20 <20 <20
<20
<20
<20 ' <20ug/l <20 <20 <20 <20 <20
Di-n-octvl phtalate,<20 <20 <20 <20ug/1 <20 <20 <2C <20
Cenzo (a) Pyrena <d'' <20 <20 <20 <20 <20 <20 <20
Indeno (1,2,3-cd)- Pvrene, yg/1 <100 <100 <100 -.100 *190 <100 <100 <100
Dibenzo (a,h)-<50 <50Anthracene, ng/l <50 <50
..OLf OU ‘ -'v <DU ** ”
Benro (g,h»i)Peryler.e, pg/l <20 <20 <20 *> i. vj <20 i <20
i<20 i "
}! * ! r.l 4 « A * ^ J « ■». 4 A L ' <1 < A, 4 A A
J !i :• i
j wg/l ND ND ND ND ND ND j ND1
j NO - |
*"-Chl crc-phenvl plienyl 1 <20 <201 1
1 i jetnor, ug/1 <20 <20 1 < to w <20 < *. ‘J ••i'u i
t ;Acenaphthylene <20 <20 <20 <20 <20 <20 •20 <20 - “
Isophorere, ug/1 <20 <20 <20 <20 <20 <20 <20 <20 --
Fluarene, ug/1 <20 <20 <20 <20 <20 *20 <20 <201
2,6 Dinitrotolune, t<20
| <20
J______:20
11i u -> 'i j !L .
j <20
J__<20 <20 ■ 20
J_ _1 “ i___

1S7
(
C-3 (Continued)
CHARLES CITY MUNICIPAL WASTEWATER TREATMENT PLANT
CHEMISTRY DATA
September 1977
Treatment Plant Stations1 U t O i * i ^ L V 1 Influent Effluent %
Lab. No. (902 series) Type of SampleComp. Sample Info.Start Date, day-mo Start TimeStop Date, day-moStop Time
C04 Comp.
6- 9 03407- 9
0300
805Comp.
7- 9 03408- 9
0740
803Crab
9-90530
liAi:a
Mean
816 Comp.
6- 9 03057- 9
0740
818Comp.
7- 9 07408- 9
0730
820Comp.
8- 9 07309- 9
0500
Mean
Rem.
1,2-Dipbenzyl-hydrazine and/or Azobenzene <20 <20 <20 <20 <20 <20 <20 <20
2,4-Dinitrotolene <20 <20 <20 <20 <20f
<20 <20 <20 --
N-Nitrosodiphenyl amine,13/1 <20 <20 <20 <20
| <20<20 <20 <20 --
liexachlorobenzene, vg/1 <20 <20 <20 <20 i <20
i<20 <20 <20
!4-Eromophenyl phenyl ether, vg/1 <20 <20 <20 <20
i! <20 <20 ■ <20
1il <20i
■1-
Phenentnrene, vg/T ND <20 <20 -20 j <20 <20 <20 <20
1Pher.a nthrone and/or Anthracene, vg/1 <20 ND NO <20
i
; ND nn| »»u
i! NO
1I rni u 1i
Anthracene, vg/1 NO <20 <20 1 <20 I <201
| <20 <20 | <20 i --i
Dimethylphalate, vg/1 <20i
<20 <20 j <20
1I <201i - ^.
| <20-20
i *1 r*
j <20
-O -4
-
Dietnylphtiialate, vg/1 <20i
<20 1<20 <20 <:o+
o7 <20 <20 i
Eienzo (a) Anthracene, vg/1 ,;D ND NO ND ND hD ND
ID 1
--
Berzo (b) Fluoranthene, vg/1 ND ND ND » ND ND ND NO --
Genzo (k) Fluoranthene, vg/i ND ND ND ND ND ND ND ND --
Di-n-butyl-phthalate,<20 <20 <20vg/l <2G <20 <20 <20 -20
+ Trace

C-3 (Continued)
CHARLES CITY MUNICIPAL WASTEWATER TREATMENT PLANT
CHEMISTRY DATA
September 1977
ParameterTreatment Plant Stations
*mInfluent Effluent
Lab. No. (90? series) 804 806 808 816 CIS 820 Rem.Type of Sample Comp. Comp. Grab Comp. Comp. Comp.Comp. Sample Info. Mean MeanStart Date, day-iro 6-9 7-9 9-9 6-9 7-9 8-9Start Time 0340 0840 0530 0305 0740 0730Stop Date, day-mo 7-9 8-9 HA 7-9 8-9 9-9Stop Time 0300 0740
______HA 0740 , 0730 0500
M-Hi trosodi-n- '. i
Propylamine <-20 <20 <20 <20 <20 <20 <20 <20
Chlorodane, pg/l HD <20 ND ■:20 HD <20 <20 <20 --Toxaphcne, yg/1 HD <300 HD <300 HD <300 <300 <300 .. !
!FCR-1242, v>g/l HO <21 HD <21 HD --1 <21 <21 i
PCD-1254, ,13/1 HD < JO HD <36 HO <36 <36 • 3c-i
-- i
PC3-1221 , ug/1 HD ..?8 ND <28 HD ,.?o <23.
-.23 __ 1
PCB-1232, ’jQ/1 mL> <7 HD <1 HD -■7 ‘"7 ..■/ .. !I
PCB-1248, ug/l NO ■:?9 ND <29 ND <291
. *»a <?c\i
PCD-1260, ug/l HD <54 :54 HD <54J
.c» -54;
PC8-1015, :g/1 HD °7- :;ui
<i" HD ” ; -17 -17 1>
2.3,7,8-Tetrachloro »1» i (|i I
dibenaj-p-dioxin, pg/I NO <11 NO j <n j ND j ■' » i ",1 <n *■
End.'in Aldehyde, wg/l HD i <2C1
| HD <20j -NDi
• 20 ; <20 .? i*. L ij »A :er.a?h thane, :rj/1 <-20 | <2'j ' <70
I :2C 1I --i.0i
< _ ui <20 <20 ;
B-endoso"! far., ug/l HD ■■-6 <6 - <6 j HD HD ; <6 -:5 !1
o-BHC, ,:g/l ! HO <i <1 ! <;1 ! HO j HO. : <11
<i
Y-BHC, 'ug/li
:;d <i <1 <1 i HD 1 *!D i ? <i ..I e-DHC . t:g/l HO <i <1 <1 NO
| HD! <i <i 1
J j__ _i !

C-3 (Continued)
CHARLES CITY MUNICIPAL WASTEWATER TREATMENT PLANT
CHEMISTRY DATA
September 1977
Treatnent Plant Stations
ttAInfluent Effluent
Lab. Mo. (902 series) 804 806 803 816 818 820 P.en.Type of Sample Comp. Comp. Grab Comp. Comp. Comp.Comp. Sample Info. Mean MeanStart Date, day-no 6-9 7-9 9-9 6-9 7-9 8-9Start Tine 0340 0340 C530 0305 0740 0730Stop Date, day-no 7-9 8-9 NA 7-9 8-9 9-SStop Tine C300 0740 fJA 0740 0730 0600
Aldrin, yg/l ND <2 <c <2 MD HD <21
<2 --
Heptachlor, yg/l ND <2 <2 <2 HD ND <2 <2 --
Heptachlor exnoxide.yg/l ND <2 <- <2 ND ND <2 <2
ia-endosulfan, yg/l ND <3 <3 <3 HD HD <3 <3
Dieldrin, yg/l ND <3 <3 <3 HD HD <3 <3 "
4,4' DDE, yg/l HD <4 * <4 HD HD <4 . <4
4’4' ODD, yg/l ND <5 <6 <6 HD f.?n <6.
<5 __
! 4,41 DDT, yg/l »» ,0 <1 0 <10 HD HD <10 <10
Endrin, yg/l ND * .5 ND ND.
<5 0 1
Er,dosulfan Sulfate,yg/l HD '20 <20 .. ^ ^ ND HD <20 _ -<
'•tu
1,3-Dichlorobenzene,v 9/1 <20+ <20 •-ZO <20
t<20 <20 <20 <Z0 !
11,4-Dichlorober.zer.e,vg/1 . <20 <20+ j <2G+
i <io
\<20 <20t <2C <20
1 ,2-Dichlorobenzene, 1 1yg/l <20 <20 <20 <20 <20 <20 <20 “ -
Hexachloroethane, yg/T <20 <20 <20 <20 <20 • 20 <20 <20
Sis (2-chloroethyl)ether, yg/l <20 <20 <20 <20
><20 <20 <20 <20 ■■
(
i
+Trace

C-3 (Continued)
2C.
CHARLES CITY HU?!ICIPAL WASTEWATER TREATMENT PLANT
CHEMISTRY DATA
September 1977
Treatment Plant Stations
Influent Effluent *t
Lab. Ho. (902 series) Type of SampleComp. Sample Info.Start Date, day-mo Start TimeStop Date, day-moStop Time
804Comp.
6- 9 03407- 9
0300
805 Comp.
7-90340S-9
0740
803Grab
9-90530
r.AHA
Mean
816Comp.
6- 9 03057- 9
0740
818 Comp.
7- 9 07408- 9
0730
820Coup.
8- 9 07309- 9
0500
Mean
P.em.
Bis (2-Chloro isopropyl) ether, ug/1 <20 <20 <20 <20 <20 <20 <20 <20 . -
Hexach.lorobutadier.fr <20 <20 <20 nn<CU <20 <20 <20- <20 --1,2,4 Trichlorobenzene, ug/1 <20 <20 <20 <20 <20 <20 <20 ,0 ”
Napthalene, ug/1 <?o <20 <20 <20 <20 <20 <20 <20 _ _
Sis (2-chloroethoxy) rvetnane, ug/1 <20 <20 <20 <20 <20 <20 <20 <20 -
Hexachloror.yclo- pentadiene, ug/1 <20 <20 <20 <20 <20 <20 <20 <20 _ _
2-Chloro:-apthal ere ug/1 <20 <20 .on <20 o,n <20 - O f> s. w ‘L --
2-Chleropher.ol, ug/1 NDi
<20+ ND <20 NO <20 ND < l! J --9 ' n 4 - /
I t'-r-L.' ;n.. i » yy/ 1
! fu r\
1 1 | LJ1
-on*- il U
it n . Ml ■'tw
IrmHU
. n n . ' />I '
t . "
2-4-Dichloroohanol, ug/1
i
<20 ND <20 ND .0■ND <20
;
P-Chlorc M-cresol, ug/l
1
NO <20 NO <20 ND <20 NO <20 !2,4,6-Trichlcrouhenol , ug/l HD . <20 ND <20 HD <20 ND <20
ii
!
2,4-Pinitrophenol, ug/1 NO <400 1 mQ <400 • t n<HU <400 HD <400 1 "
4,6-Diriitro 0-crrsol Nn <400 HD <400 NO <4 GO N9 <400 \i “ ”t
Pentariilorophenol , ug/1 j r:o <20 ND <20 ND <20 NO <20 i
LI'+Trace
t

C-3 (Continued)
CHARLES CITY MUNICIPAL WASTEWATER TREATMENT PLANT
CHEMISTRY DATA
September 1977
ParameterTreatment Plant Stations
o'JiInfluent Efflue ntLab. No. (992 series) 810 812 814 822 823 824 Rem.Type of Sample Grab Grab Grab Grab Grab GrabComp. Sample Info. Mean MeanStart Date, day-mo 7-9 * 8-9 9-9 7-9 8-9 9-9Start Time! 0310 0740 0539 0740 0730 0590Stop Date, day-no NA NA NA NA NA NAStep Time NA NA NA NA r* a NA
Carbon Tetrachloride, 1vg/1 •'-20 <50 ND <20 ^50 ND
Bis-chlorcmethvl ii
ether, ;>g/l *• r\HU ND ND | ND NO ND !1,2-Dichloroprcpane,ug/1 V <23
wwmh ),;W ! -20 <50 I
A Trans-1 ,3-DichIoro- i j |
propene, :-£»/1 <2C <50ND I
<20 .. cr* ND 1>
DibrnncchloroT-cthane II .i
og/1 <50 :-;D il
<20 <50 ND
3-Cis-l,3- • r ••Diehloropropane, v.g/ ^20 -50 ND ; •20 -50 NO 1 i
i 11,1,2-TrichIoroethane, >200 -.?E0 ' »•.IU ••/29 >200 F,‘0 1 M-n».v- >545 1
« / 1 ! -2.6 16.4 - . .-2.6 11.7 ■» ‘“t
Oenzene, ;:-g/l <20* <5C- ,. |"U 1 "5r>* NO 1
2 CMorcethylvinyl, ' i
'j
ether, uD/1 ND <5C 'ND 1 ND • 00 ND ii
Brcmoforn, ug/l <20 <50 ND <20 <50 ND iM,2,2- !
Te t ra cn 1 o rethai;e, w3/1 <20 <50 •NO <20 <5C ND
1.1,2,2-Tetrachloroethethene.rg/1 -20’ <50* ND
T,
■-2C + <50 + ND

C-3 (Continued)
CHARLES CITY MUNICIPAL WASTEWATER TREATMENT PLANT
CHEMISTRY DATA
September 1977
Treatment Plant Stations
Parameter Influent Effluent *V.9
Lab. No. (992 series) Type of SampleComp. Sample Info.Start Date, day-mo Start TimeStop Date, day-moStop Time
810Grab
7-9CS10
NANA
812Grab
8-90740
NANA
SKGrab
9-90630
NANA
Mean
822Grab
7-90740
?:at«A
823Grab
8-90739
NAf.A
824Grab
9-90600
NA
Mean
Rem.
—2 Acrolein, ug/1 :id ND ND ND ND ND3 Acrylonitrile, pg/1 . ND l!D ND ND ND NO
)• Ciile*'o~etha!ie, pg/l NO ND ND ND NO . NO
Diehl orodifl uoremethane VS/.1 ND ND ND V ND ND Nn
Dromometiiane, yq/1 -29 < 50 ;id <20 -50 •iD I !1 !
Vinyl Oil or i de, jjg/1 ;o <59 :;d nD -50 ND 1 !i i
Chlcroetnane, ug/l •-20 <20 ;:d <20 -59 rtr 1 !
Methvlene Chloride,-3/'l <:n+ <50+ ND <20+ . -50 + NO
t i!i <i i
Trichlcrofluoromethane,'-29 <50 • o -20 ■ ND
! !
;1.1-Dichioroethvlene,
--■g/i -30 -20 ‘.p <29+ <59 NO! I! i
i 1Oars-1,2-Dichloro- elhylane, ng/l <20 <50 ND
.{ <20 . r **•■ . NDIi1
Chi oreform, ng/l <20 + <50 i’JD <20 + <50 ND
1,2-Dichlorcethane, vg/1 <20+
■<50 ND -20 <50 ND
1,1,1-Trichioroethane, -3/1 <20 + <50 ND <20 <59 ND
1__ - _
+Trace

C-3 (Continued)
CHARLES CITY MUNICIPAL WASTEWATER TREATMENT PLAMT
CHEMISTRY DATA
September 1977
Treatment Plant StationsParameter
Influent Ef fliis nt </Lab. No. (932 series) Type of SampleComp. Sample Info. Start Date, day-mo Start TimeStop Date, day-mo Stop Time
810Grab
7-90310
HAHA
812Grab
8-90740
HAHA
814Grab
9-90630
HAHA
Mean
822Grab
7-90740
HA . HA
823Grab
8-90730
HANA
824Grab
9-90500
HAHA
Mean
P.em. .
Tri chloroetiv/lene, tg/1 <20
'
<50 *tni'll' <20 <50 HD
Toluene, up/l <20 + <50 •:d <20 + <50 HD
j Chlorobenzene. <20 <50 HD <20•
<50 HD i
jEthyl benzene, -g/l :jd <50 HD HD .<«•Ou HD • jI
iSromodichio-cmethana <20 1 ^ UI HD <2C <50 HD j
% j1 ,1 -Dichlorceihare izg/'j <20
1 [: <50 | HD <50 HD
ji
iPhenolics (Total),
r.g /1load, lb/day
! 11j ■ 140
i 21 : 2sci
i1! lc
20016
230
.<0.18<2.3
-0.101.3
-0.12■■2.0
<0.13-1.9
l
!
. 1 j
•Cyanide, mg/1 load, lb/day
| 0.15
1
i i*. 1 nj u. 1 oz.
0.12z.o
0.152.1
0.091.2
0.111 . b
0.11.4 33
+Trace

204
APPENDIX D
SALSBURY LABORATORIES DATA
IOWA STATE HYGIENIC LABORATORY DATA

■: O _ Ft-:'; Turor-ii
m Neil A. I.cionig ■
Subjc-Ct Cedar River Sampling
IMvr*f; r?ri :nn.'';*ri?ir^IK t i v t i •„* 1 • i i # >». i 11 / w I.. C# v <. i \ c# U»< i
205
».v* | i • rtk Li’iwU/Otl
Date. .... January 16, 1978 .............
On January 6, 1978 grab water samples of the Cedar River were taken at the following locations. These water samples were submitted to Quality Assurance for arsenic assay in duplicate by Environmental Services, Assay Procedure No. 003 for Total Arsenic on January 11, 1978. The results are as follows:
Sample Identification
Right bank (20* out from bank) - under high tension wires downstream of LaBountv Site
Sample 1 Semple 2
Center stream - under high tension wires downstream of the Laoounty Site
Sample 1 Sample 2
Left bank (201 out from bank) under high tension wires downstream of the LaBounty Site
Sample 1 Sample 2
(20 * out from, bank) and 30-50' oa e•u• N. T. P . outtall
Sample 1 Sample 2
Center stream 30-50' downstream of C.C.V.’.T.?. outfall i
Sample 1 Sample 2 .
•
Left bank. (3-5' out from bank) and 30-50' downs Li earn, of C.C. V.’.T. P., outfall.
Sample 1 Sample 2Sample 3 (filtered)
Right bank, downstream
ppp As
0.0580.070
0.C390.034
0.0130.013
0.0560.050
0.0380.037
0.1250.1310.14S

•• 205
( i r-»» lie Livri? (-n/l) IN Till ■ enru?. p.T”•*; AT ?. >!CD0: • T t 1 r, '• ... l*V (1/7 - 4/24/78)
(
Date As Cone. Date As Cone. Date As Cone. Date As Cone.
1/7 0.028 2/1 0.057 3/1 0.059 4/1 0.0051/8 0.026 in — 3/2 0.055 4/2 • 0.0021/9 0.024 in 0.052 3/3 0.047 4/3 0.004
1/10 0.040 in .0.047 3/4 0.044 4/4 0.0141/11 __ in 0.041 3/4 6.044 4/5 0.0211/12 in — 3/6 0.044 4/6 0.0251/13 — in 0.051 3/7 0.040 4/7 0.0201/14 2/8 0.043 3/8 0.048 4/8 0.0101/15 — -. m 0.041 3/9 0.044 4/9 0.0031/16 0.028' 2/10 0.042 3/10 0.043 4/10 0.014
1/17 — 2/11 0.053 3/11 — 4/11 0.0211/16 0.051 2/12 0.046 3/12 0.040 4/12 0.0231/19 0 • / 2/13 0.05S .3/13 0.042 4/13 0.0281/20 0.043 2/14 0.047 3/14 0.045 4/14 0.0241/21 0.040 2/15 0.04S 3/15 0.045 4/i5 0.0301/22 0.040 2/16 0.0:>5 3/16 0.055 4/16 0.0291/23 0.037 2/17 — 3/17 0.057 4/17 0.033I/-*-' 0.037 2/18 0.047 3/18 0.035 4/18 0.033* 0.047 . 2/19 0.042 3/19 — 4/19 0.CJ8 .? 2/20 0.032 3/20 o.oso 4/20 0.025
1/ 0.055 2/21 C.042 3/21 0.069 4/21 0.018
1 1 0.046 H12 0.051 3/22 0.013 4/22 0.016
l/-:9 0.046 2/23 0.055 3/23 . 0.005 4/23 0.0191/33 0.050 2/24 0.055 3/24 — 4/24 0.0211/31 0.046 • 2/25 — 3/25 0.004
2/26 G .054 • 3/26 —2/27 0.055 3/27 0.0002/28 0.053 3/28 0.006
j3/29 0.0033/30 . 0.002
(•
i
•
\
3/31 C. 0 0 fj
|
•

?TVT"RARSENIC
JANUARY, 1978
River River River cc vrrp cc vnp cc vrrp l> > V)
, Flow As Cone As load Flow As Cone As load loadDate i'GD mg/1 lb/day MGD mg/1 lb/day lb/day
5 90 __ 1.219 1.24 12.6 —
6 90 *------ * ------ 1.216 1.45 14.7 —7 90 ■0.028 21.0 1.108 0.86 8.0 13.08 90 0.026 19.5 1.038 0.72 6.2 13.39 120 0.024 24.0 1.304 0.66 7.2 16.8
10 120 0.040 40.0 1.302 3 .07 11.6 28.411 90 — — 1.319 1.20 13.2 —12 65 — — 1.264 1.43 15.1 —13 65 — — — — — ——
14 . — . — — — — — — ”15 — — — ;— — — — —16 90 0.028 21.0 — — — . ——
17 135(98 .8) — — — — — — —
IS 120 0.051 51.1 — ■ — ■ — ——
19 SO 0.047 35.3 1.355 1.6S 19.0 16.320 65 0.043 23.3 1.224 1.28 13.1 10.221 90 0.040 30.0 1.009 0.78 .6.6 2 3.
22 90 0.040 30.0 1.000 0.62 5.2 24. S23 SO 0.037 27.8 1.034 1.77 15.3 12.524 SO 0.037 27.8 1.00S 1.39 12.4 15.425 SO 0.047 35.3 1.3S7 1.61 18.7 16.626 120 — — 1.293 2.11 22.8 —
27 120 0.055 55.1 1.253 1.74 13.2 36.923 120 0.046 46.1 1.027 1.19 10.2 35.929 . 120 O.C46 46.1 1.035 0.94 8.1 38.030 120 0.050 50.1 1.332 1.16 12.9 37.231 120 0.046 46.1 1.46S 1.30 15.9 30.2
Commutations - Janusrv— •" -
1. By averaging the calculate'! AAs loadings for 16 days results in a.monthly average AAs loading, of 22.3 Ib/day. * 1
2. Using the USGS field flow as typical of January and and daily C.C. v.’.T.P. eft
measurement of January ].7th of 153 cfs (9S.S >'3D) averaging the month's daily river concentrations uer.t loadings results in the following^
River loadingV.TP effluent loading
(98.8 MOD)(0.043 r.g/1) (S.345) = 33.& lb/dny 12.7 lb/day

208
ssFEBRUARY,
- CEDAR RIVER 1978
River River River CC WTP CC WTP CC WTP A AsFlow As Cone As load Flow’ As Cone As load load
Date MGD ttg/l lb/day MGD ir.g/1 lfc/day lb/day
1 120 0.057 57.1 1.324 1.11 12.3 44.82 120 — — 1.298 1.31 14.2 —3 120 0.052 52.1 1.209 1.06 10.7 41.44 120 0.047 47. r 1.078 0.56 5.0 42.05 120 0.041 41.0 1.069 0.54 4.8 36.26 120 — — 1.522 0.82 10.4 —
7 120 0.051 51.1 1.628 1.14 15.5 35.68 116 0.043 42.0 — 1.06 — —9 116 0.041 40.0 1.311 0.79 8.6 33 .4
10 116 0.042 41.0 1.267 1.03 11.4 29.611 116 0.053 51.7 0.937 O.SS • 7.2 44.512 116 0.046 44.9 1.022 0.61 5.2 35.713 116 0.058 56.6 1.520 1.66 21.1 35.514 116 0.047 45.9 .1.490 2.33 29.0 16.915 110 0.048 44.5 1.450 1.62 19.6 24.916 110 . . 0.055 50.9 1.352 1.80 20.3 30.617 . no — — 1.197 1.35 13.5 —IS 110 0.047 43.5 1.148 0.85 8.2 35.319 - 110 0.042 38.9 1.192 0.73 7.3 31.620 110 0.039 36.1 1.493 1.06 . 13.2 22.921 110 0.042 3S.9 1.386 1.39 16.1 22.S2? 97 0.051 ■ 41.3 1.457 1.49 18.1 23.223 81 0.055 37.2 1.499 1.55 19.4 17.824 81 0.055 37.2 1.409 1.36 16.0 21.225 81 • —' — 1.253 1.03 10.3 —
26 81 0.054 36.5 1.295 0.88 9.5 27.0'27 54 0.055 24.8 1.239 0.75 8.1 16.72S 54 0.053 23.9 1.475 1.24 15.3 S.6
Cornutabions - February • 1
1. By averaging the calculated A As loadings for 23 days results in a monthly average A As loading of 25.4 Ib/dav.
2 Using the USGS field flow ncnsut the month's daily river cencentr results in the following:
ent of February 23 of 80.S MGD and aversoin: ions and'daily C.C. U.T.P. effluent loadings
Fiver leading =V.’TP ef: .1 uc-nt leading = A Arsenis loading =■
(50.3 MOD) (0.0a9 t:g/l) (S.345) = 33.0 lb/day 12.7 lb/day33.0 lb/day - 12.7 lb/c:tv = 20.3 lb/day
f

209
AMS :c MASS BALAMCE MARCH.
■ c::dap. pitta;
1978
River River River CC KTP CC V.TP
DateFlow As Cone As load Flow As ConeMOD mg/1 lb/day MGD mg/1
1 32 0.059 15.8 1.404 1.162 53 0.055 24.3 1.420 1.243 53 0.047 20.8 1.269 0.S44 53 0.044 19.55 53 0.044 19.5 1.080 0.6?6 53 0.044 19.5 1.388 0.7978
3232
0.04C0.04S
10.712.8
1.3621.45S
1.091.199 32 0.044 11.7 1.885 1.1810
113223
0.043 11.5 1.3421.247
1.42 0.9412 23 0.040 7.7 1.300 0.7313
14119ns
0.0420.045
41.744.7
1.4391.402
1.261.7015 90 0.045 33.8 ] .641 1.6316 .119 0.055 54.6 1.393 1.5417
1890SO
0.0570.035
42. S26.3
1.2371.302
1.851.7319 90 — — 1.377 0.65
>0 so o.oso 60.1 1.782 1.1021 152 0.069 87-. 5 1.737 1.5622 523 07013 56.7,_23
24•*) -
749106 6
330
0.005
0.004—
2.1431.5291.131
0.9S0.530.5026 70/. — — 1 .03 6 0.5127 ' 659 0.000 — . 1.378 0.73*■> C1-t- ^ 614 C.006 — 1.374 1.3929 614 0.003 — 1.431 1.4030 704 0.002 — 1.467 1.2031 614 0.006 — 1.462 1.15
CC WTP A AsAs load loadlb/day lb/day
13.6 2:214.7 9.68.9 11.9
5.6 13.59.2 10.3
12.614.5 __18.615.99.87.9 —
15.1 26.619.9 24.822.3 11.517.9 36.7is :i 23.718.8 7.57.5 —
16.4 43.723.2 64.3
17.5 m |6.8 __4.7 —4.3 —8.4 —
15.9 ...16.7 —14.7 —14.0 __
Conput ations - March
River coneone ret ionr- duri balance calculations. Mi calculations.' Avcrnpa ri average’ (106.6 MAD) in th
the period from ver flow's froir. 3/1 ver flow's from 3/13 e calculations.
j/1 thru 3/21 to only be used in tnru 3/12 should not be used in
turn 3/..1 and use the resulting
River loadin'-'.TP : f 1 u: JL(
/-As loading
(106.6 MOD) (0.04 9 ir.-./l) (2
Mt.!') (1 .Mr-/!) (f.
4 ?. 6 1 u / J ay - 14.4 ] b / d:. y
• J'O) -■ 43.6 Ib/dnv0-'o> - 14.4 lb/day
" -b/nay

► ;j . \ i i. »
APRIL, 1976
River River River CC NIP CC NT? CC NIP A.AsFlow As Cone As load Flow As Cone As load load
Date MGD mg/1 lb/day KGD mg/1 lb/day lb/day
1 436 0.005 1.209 0.69 7.02 436 0.002 — 1.197 0.60 6.0 —
3 394 0.004 — 1.500 1.19 14.9 —4 352 0.014 41.1 1.465 1.28 15.6 25.55 310 0.021 54.3 1.526 1.14 14.5 39. S6 352 0.025 73.4 1.695 1.13 16.0 57.47 352 0.020 58.7 1.348 1.05 26.2 42.58 436 0.010 36.4 - 1.402 0.S3 9.7 26.79 436 0.008 29.1 1.6S2 0.64 9.0 20.1
10 373 0.014 43.6 1.822 0.88 13.4 30.211 310 0.021 54.3 1.603 0.S9 11.9 42.412 310 0.023 59.5 1.600 1.28 17.1 42.413 268 0.028 62.6 1.446 1.29 15.6 47.014 268 0.024 53.7 1.407 0.57 6.7 47.015 247 0.030 61.8 1.100 0.73 7.2 54.616 218 0.029 52.8 1.079 0.48 4.3 48.517 187 0.033 51 .'5 2.274 0.62 11.8 39.7IS — 0.033 — 2.643 0.76 16.8 —
19 352 0.01S 52.9 2.236 0.59 11.0 41.020 394 0.025 82.2 2.202 1.77 32.5 49.721 523 0.018 78.6 1.931 0.90 14.5 64.122 478 0.015 • 63.8 1.74S 1.10 16.0 47.S23 436 0.019 69.0 1.862 1.10 17.1 51.924 394 0.021 69.0 1.739 0.57 8.3 60.725 394 • 0.029 95.3 1.946 0.61 9.9 S5.426 ' 394 0.021 69.0 N.A. N.A. —27 — . A . — N.A. N.A. — —
28 352 K. A. — N.A. A*<. n • — —
29 310 K. A. — N.A. N.A. — —
30 AI'l » t\ • N.A. — N.A. N.A. — —
Coryuta t:ir»ns - A^r il
River concentration values fror. 4/4 thru 4/25. to be used in mass balance concentrations.
Ry averasinp the calculated /NAs 2oa<’. inns for 21 days results in a As loading of 4 5.9 Ib/c’.ny
1.

211
Ortho-Mitroani1ine Results
Waterloo Municipal Wells
IOWA STATE HYGIENIC ' LABORATORY
City Well No. Well Depth Cone, ppb Date Sampled
Waterloo 9 85' 0.090 E.P.A.Waterloo 9 85' 0.260 11-19-77Waterloo 9 85' 0.160 12-20-77Waterloo 9 85' 0.210 01-24-78Waterloo 9 85' . 0.220 03-01-78Waterloo 9 85' 0.030 03-28-78
Waterloo 10 85' 0.022 11-21-77Waterloo 10 85' ND (<0.010) 01-24-78Waterloo 10 85' <0.010 04-04-78
Waterloo 12 85' 0.054 11-21-77Waterloo 12 85' 0.075 01-24-78Waterloo 12 85' 0.054 04-04-78
Waterloo 11 85' 0.120 12-05-77Waterloo 11 85' 0.110 01-24-78Waterloo 11 85* 0.030 03-28-78
Waterloo 13 85' 0.012 12-05-77
Waterloo 7 85’ 0.012 12-07-77Waterloo 7 85' ND (<0.010) 01-24-73Waterloo 7 85' 0.014 C4-04-78
Wa terloo 16 190' ND (<0.001) 12-07-77
Waterloo 14 190' ND (<0.001) 11-30-77
Waterloo 18 215' ND (<0.001) 11-30-77
Waterloo Finished W3ter
l
<0.050 11-19-77
NO = None Detected
-

212)
IOWA STATE HYGIENIC LABORATORY
Ortho-Nitroaniline Results
Municipal Wells
City Well No. Well Deoth Cone, ppb Date SampledNashuaNashuaNashua
552
150*150'180'
ND (<0.001)ND (<0.010)ND (<0.010)
12-19-7703-01-7803-01-78
WaverlyWaverlyWaverlyWaverly
5521
157'157'
NO (<0.001) <0.010 <0.010 <0.010
12-19-7703-21-7803-21-7803-21-78
JanesvilleJanesvilleJanesville
222
155'155'155'
0.0310.049
<0.010
12-20-7703- 08-7804- 04-78
PlainfieldPlainfield
11
150’150'
0.2000.510
12-16-7703-0.8-78
Cedar Falls 2 105' ND (<0.001) 12-23-77GreeneGreene
12
<0.010<0.010
03-21-7803-21-78
ClarksvilleClarksville
12
<0.010<0.010
03-21-7803-21-78
She!1 rock <0.010 03-21-7S
ND - None Detected

213
Ortho-Nitroaniline Results
'Private Wells
IOWA STATE HYGIENIC LABORATORY
Sampling Site Well Depth Cone, ppb Date Sampled
Near Hwy 346T94N-R14W Sec 17 (Guthart)
=40' ND (<0.005) 01-12-78
Northwest edge ofCedar Lake impoundment (R Strawns)
? 0.040 01-12-78
Skyline Harvestore Systems Inc. (Paul Bremer)Hwy 218 North, Nashua
58' ND (<0.010) 03-01-78
Carl Simerson, NashuaRt 2
83' ND (<0.010) 03-01-78
McGregor Bros., Nashua 75' ND (<0.010) 03-01-78
Carrol Marquis, PlainfieldRt 1
65’ 0.031 03-01-78
Rudy Bohach, Nashua 140' 0.260 03-01-78
Clyde Terhume, 3137 WKt Vernon Rd, Cedar Falls
125' ND (<0.010) 03-03-78
R T Longholz, Waverly 82' ND (<0.010) 03-08-73
Camp Ingawanis, WaverlyRt 3
130' ND (<0.010) 03-03-75
Mike Harris, 5518 WaverlyRd, Cedar Falls
28' ND (<0.010) 03-03-73
Carnation Co., Waverly 145* 0.060 03-03-78
William Simmers 113' <0.010 04-04-73
Little Brown Church,Nashua
68' <0.010 04-04-78
Dennis Menan, Nashua 150' <0.010 04-04-78
John Fisher - private, (approx. 1 mile from river)
:0.010 03-28-7857'

214
IOWA STATE HYGIENIC LABORATORY
Ortho-Nitroaniline Results
Private Wells (continued)
Sampling Site Well Depth Cone, ppb Date Sampled
Dale Fritcher - private,(200 yards from Cedar Lake- approx.)
30' <0.010 03-28-78
Lena Cahil - private,Nashua
132' <0.010 03-28-78
Lee Peters - private, Plainfield ( 1 1/2 miles west of Cedar River)
72' <0.010 03-28-78
A1 Bah1man - private,Waverly (approx. 1/2 mile east of Cedar River)
95' <0.010 03-28-78
Russel Behrends - private, Waverly (1/4 mile west of
<0.010. 03-28-78
Cedar River)
IID = None Detected

215
IOIJA STATE HYGIENIC LABORATORY
Ortho-Nitroaniline Results
River Samples
Cedar River Cone, ppb Date Sampled
Blackhawk Co. Rd C57 ND (<0.015) 01-12-78T90N-R14W Sec 16-15
NE of Janesville 1.2 01-12-78T91N-R13W Sec 19
E of Plainfield 1.6 01-12-78T93N-R14W Sec 20-29
Near Carville 29 01-12-78■T95M-R15W Sec 34
Nashua (below dam) 2.2* 01-06-78Midway Bridge 1.8* 01-06-795 miles N of Midway 2.1* 01-06-78Cedar Falls, Hwy 20 6.8 01-24-78N of Janesville 25 02-01-78S of Janesville 25 02-01-78Cedar Falls, Hwy 20 8.7 02-01-78
Shell rock River
Shell rock ND (<0.010) 02-01-78Rockford ND (0.010) 02-01-78Marble'Rock ND (0.010) 02-01-78
Wepsipin icon River
Bremer Co. Rd C33 ND (<0.010) 02-07-78T92N-RI1W Sec 18-19
Fredricksburg Hwy 18 ND (0.010) 02-07-78
* Samples collected by DEQ personnel, 2 quart samples ND = None Detected

216
IOWA STATE HYGIENIC LABORATORY
Ortho-Nitroaniline Results
Sediment Samples
Preliminary AsSampling Site Cone, ppb Date Sampled (ppm by dry
Shell rock River at Rockford ID (<2) 03-06-78 9.8 .
Cedar River at Floyd ND (<1, sand sample)
03-06-78 0.8(sand sample
Cedar River at CharlesCity
<2 03-07-78 4.7
Cedar River at Carville 65 03-07-78 82
Cedar Lake-Sample £1 (Nashua impoundment)
21 03-07-78 54
Cedar Lake-Sample £2 (Nashua impoundment)
4 03-07-78 28
Cedar Lake-Sample #3 (Nashua impoundment)
25 03-07-78_ 15
Cedar Lake-Sample #4 (Nashua impoundment)
5 03-07-78 12
Cedar Lake-Sample #5 (Nashua impoundment)
19 03-07-78 52
Cedar Lake-Sample #6 (Nashua impoundment)
3 03-07-78 34
ND = None Detected

217
IOWA STATE HYGIENIC LABORATORY
Arsenic Results
Wells near the Cedar River
Location
Nashua Municipal Well #2 Nashua Municipal Well #5 Waterloo Municipal Well #9 R Bohach Well McGregor Brothers Well C Simerson WellSkyline Harvestore System Well C Marquis Well Janesville Municipal Well Plainfield Municipal Well R T Longholz Well Mike Harris Well Clyde Terhume Well Camp Ingawanis Well Carnation Co. South Plant Well
te Sampled Arsenic (mq/1)
03-01-78 <0.0103-01-78 <0.0103-01-78 <0.0103-01-78 <0.0103-01-78 <0.0103-01-73 <0.0103-01-78 <0.0103-01-78 <0.0103-08-78 <0.0103-08-78 <0.0103-08-78 <0.0103-08-78 <0.0103-08-78 <0.0103-08-78 <0.0103-08-78 0.03
I