Embed Size (px)
Citation preview
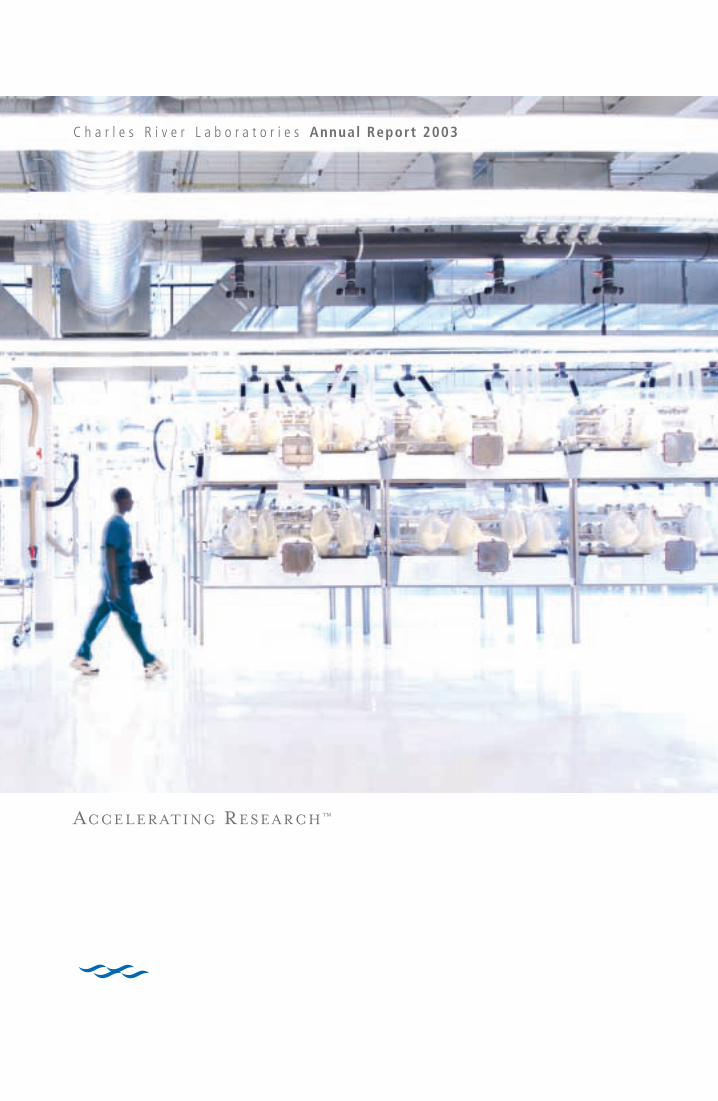
C h a r l e s R i v e r L a b o r a t o r i e s Annual Report 2003
AC C E L E R AT I NG RE S E A R C H™
CH A R L E S RI V E R LA B O R ATO R I E S
251 Bal lardvale St reet
Wi lmington, MA 01887
978.658.6000
www.cr iver.com
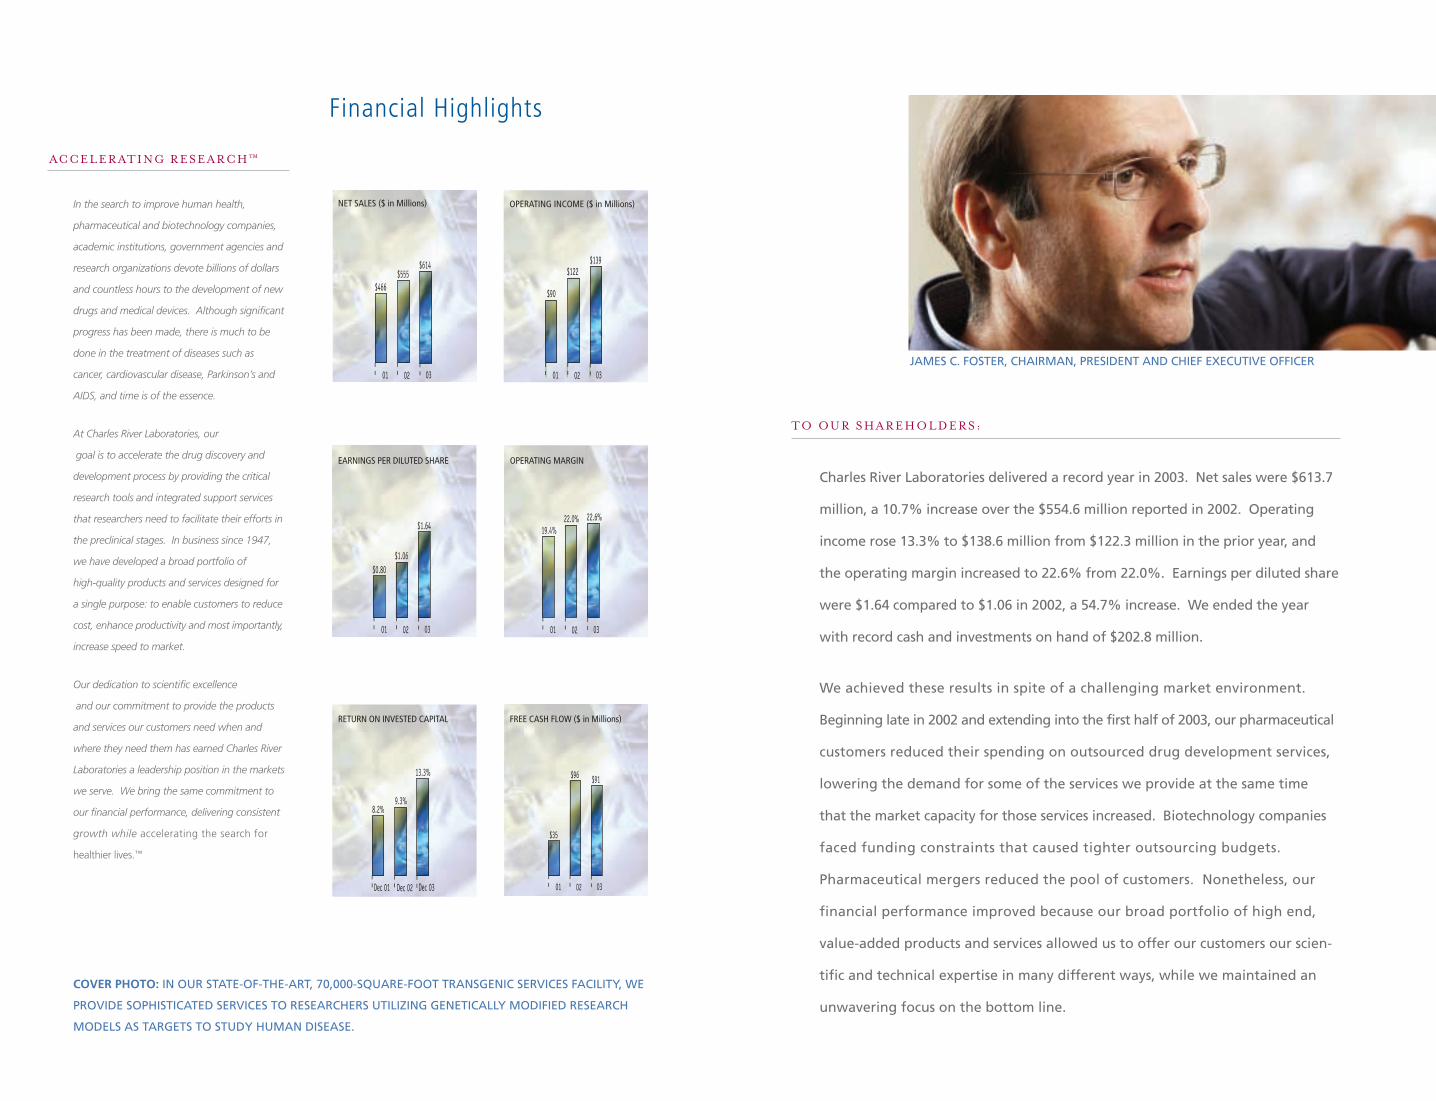
Charles River Laboratories delivered a record year in 2003. Net sales were $613.7
million, a 10.7% increase over the $554.6 million reported in 2002. Operating
income rose 13.3% to $138.6 million from $122.3 million in the prior year, and
the operating margin increased to 22.6% from 22.0%. Earnings per diluted share
were $1.64 compared to $1.06 in 2002, a 54.7% increase. We ended the year
with record cash and investments on hand of $202.8 million.
We achieved these results in spite of a challenging market environment.
Beginning late in 2002 and extending into the first half of 2003, our pharmaceutical
customers reduced their spending on outsourced drug development services,
lowering the demand for some of the services we provide at the same time
that the market capacity for those services increased. Biotechnology companies
faced funding constraints that caused tighter outsourcing budgets.
Pharmaceutical mergers reduced the pool of customers. Nonetheless, our
financial performance improved because our broad portfolio of high end,
value-added products and services allowed us to offer our customers our scien-
tific and technical expertise in many different ways, while we maintained an
unwavering focus on the bottom line.
TO OU R S H A R E H O L D E R S :
COVER PHOTO: IN OUR STATE-OF-THE-ART, 70,000-SQUARE-FOOT TRANSGENIC SERVICES FACILITY, WE
PROVIDE SOPHISTICATED SERVICES TO RESEARCHERS UTILIZING GENETICALLY MODIFIED RESEARCH
MODELS AS TARGETS TO STUDY HUMAN DISEASE.
Financial Highlights
AC C E L E R AT I NG R E S E A R C H ™
In the search to improve human health,
pharmaceutical and biotechnology companies,
academic institutions, government agencies and
research organizations devote billions of dollars
and countless hours to the development of new
drugs and medical devices. Although significant
progress has been made, there is much to be
done in the treatment of diseases such as
cancer, cardiovascular disease, Parkinson’s and
AIDS, and time is of the essence.
At Charles River Laboratories, our
goal is to accelerate the drug discovery and
development process by providing the critical
research tools and integrated support services
that researchers need to facilitate their efforts in
the preclinical stages. In business since 1947,
we have developed a broad portfolio of
high-quality products and services designed for
a single purpose: to enable customers to reduce
cost, enhance productivity and most importantly,
increase speed to market.
Our dedication to scientific excellence
and our commitment to provide the products
and services our customers need when and
where they need them has earned Charles River
Laboratories a leadership position in the markets
we serve. We bring the same commitment to
our financial performance, delivering consistent
growth while accelerating the search for
healthier lives.™
$614$555
$466
02 0301
$139$122
$90
02 0301
13.3%
9.3%8.2%
Dec 02 Dec 03Dec 01
$1.64
$1.06$0.80
02 0301
$91$96
$35
02 0301
22.6%22.0%19.4%
02 0301
NET SALES ($ in Millions)
EARNINGS PER DILUTED SHARE
RETURN ON INVESTED CAPITAL FREE CASH FLOW ($ in Millions)
OPERATING MARGIN
OPERATING INCOME ($ in Millions)
JAMES C. FOSTER, CHAIRMAN, PRESIDENT AND CHIEF EXECUTIVE OFFICER
Consistently Improving Performance
There are a number of reasons that we have been able to deliver
improving performance each year. First and foremost, our goal is to
be the leading provider of products and services that accelerate drug
discovery and development. To that end, we have built a portfolio of
scientifically validated products and services that are essential to
move a drug or medical device from discovery to clinical trials. We
have built a global network of facilities in 16 countries, which enables
us to support our customers whenever and wherever they need us.
Finally, we are committed to growing the business responsibly, with a
focus on the bottom line.
PRECLINICAL RESEARCH & DEVELOPMENT
We have chosen to focus on preclinical research and development
because the pharmaceutical and biotechnology industries continue to
invest more every year in this arena. According to the latest PhRMA
data, preclinical research and development spending worldwide
reached an estimated $33 billion in 2003.
But higher research funding is not the only reason for our growth.
Our customers have increasingly chosen to outsource certain services
in order to accelerate the drug discovery and development process. Through
outsourcing, our customers can increase throughput, reduce overhead
expenses and manage their internal resources more effectively and efficiently.
By using our services, our customers free themselves to concentrate on basic
research that only they can do.
2
Ch
arle
s R
iver
Lab
ora
tori
es
3
ESSENTIAL PRODUCTS AND SERVICES
The products and services we provide are essential to the drug and device development
process. Pharmaceutical and biotechnology companies are required by law to test
compounds thoroughly for safety before introducing them in human clinical trials.
Ch
arles River L
abo
ratories
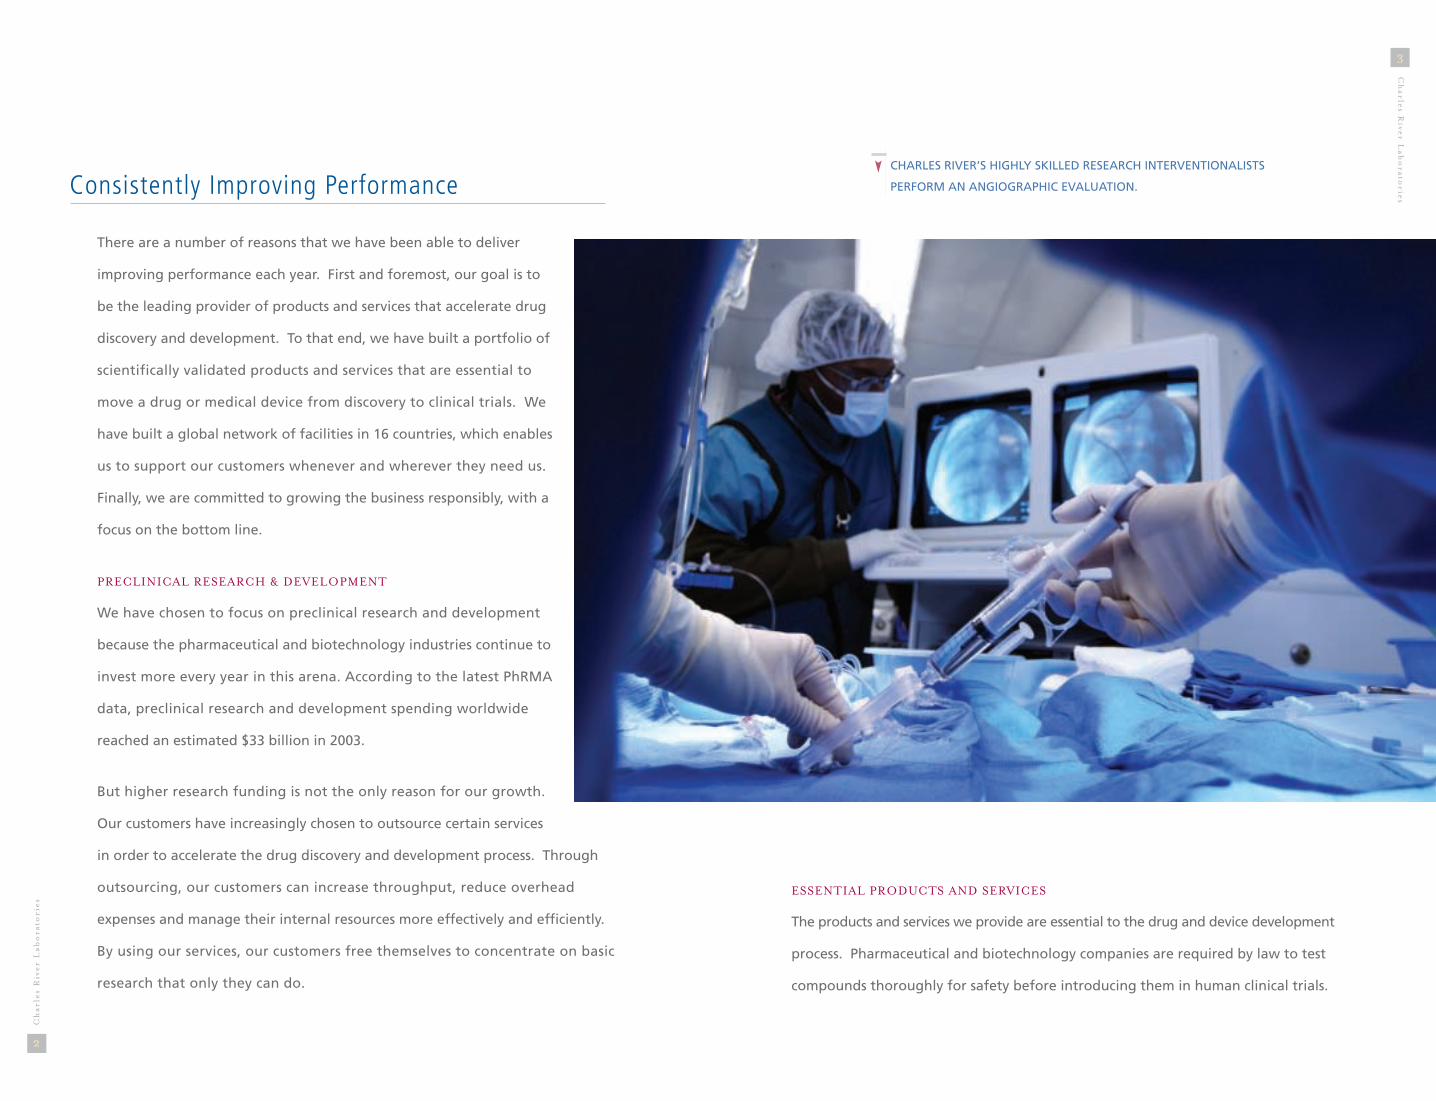
CHARLES RIVER’S HIGHLY SKILLED RESEARCH INTERVENTIONALISTS
PERFORM AN ANGIOGRAPHIC EVALUATION.
4
Ch
arle
s R
iver
Lab
ora
tori
es
5
Ch
arles River L
abo
ratories
reach. Each location has been chosen for its proximity to our
clients, allowing us to cultivate close professional relationships,
anticipate accurately the needs of our customers, and provide
products and services in a timely manner. Our global presence
also enables us to capitalize on existing opportunities and emerging
technologies around the world.
THE PRINCIPLE OF PROFITABILITY
We manage our business responsibly, focusing on revenue and
earnings growth. Our goal to provide the critical research tools and integrated
support services required to take a drug or medical device from inception to
FDA filing is built on the principle of doing business profitably. The products
and services we offer share a common characteristic; they deliver, or have the
potential to deliver, double-digit operating margins. We evaluate our opera-
tions continuously, to identify and implement improvements. And when we
make an acquisition, we fully expect that the newly acquired business will
contribute to the bottom line. Our focus is to accelerate research for our
customers, while at the same time accelerating growth and profitability for
Charles River.
While many of the world’s largest pharmaceutical companies can, and do,
provide these products and services internally, many of them outsource key
development functions to us, relying on Charles River’s extensive experience
and scientific expertise to help them bring products to market faster and
more efficiently.
THE LOCAL PROVIDER AROUND THE WORLD
We are where our customers are. Drug discovery and development is a global
business, so we have built a network of facilities in 16 countries to extend our
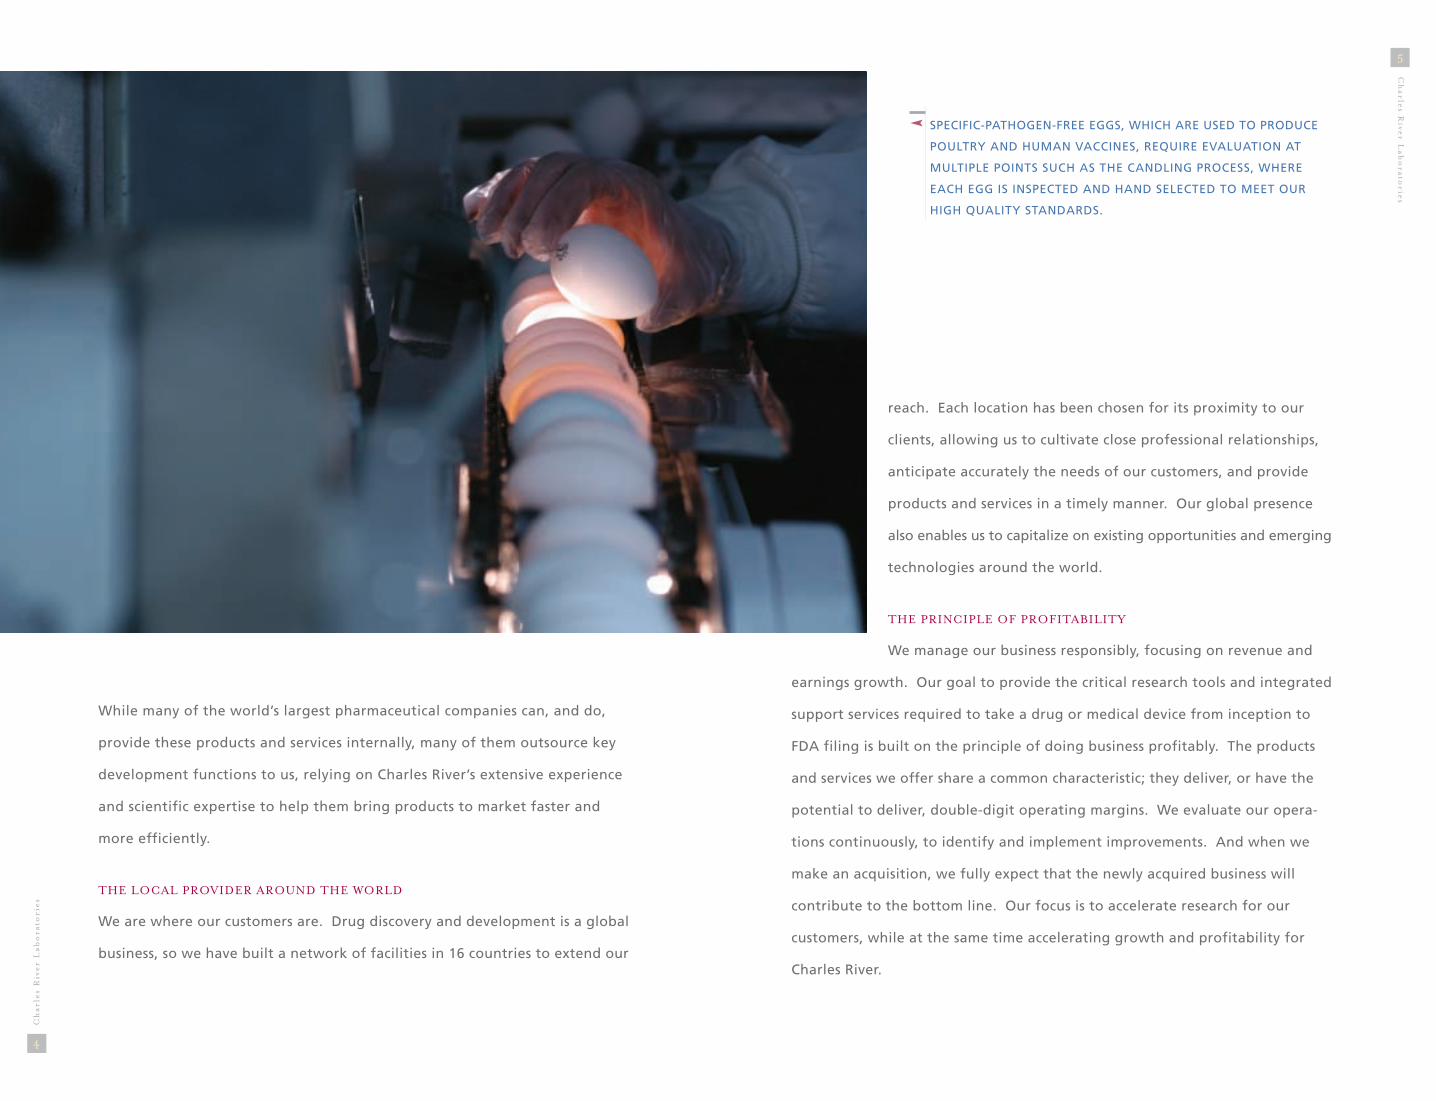
SPECIFIC-PATHOGEN-FREE EGGS, WHICH ARE USED TO PRODUCE
POULTRY AND HUMAN VACCINES, REQUIRE EVALUATION AT
MULTIPLE POINTS SUCH AS THE CANDLING PROCESS, WHERE
EACH EGG IS INSPECTED AND HAND SELECTED TO MEET OUR
HIGH QUALITY STANDARDS.

7
Ch
arles River L
abo
ratories
6
Ch
arle
s R
iver
Lab
ora
tori
es
As a result of our outstanding financial performance as a public
company, Forbes Magazine named Charles River Laboratories one
of the fastest-growing technology stars in 2003. And The Boston
Globe ranked us fourth in its 2003 annual listing of the 100 best
performing public companies in Massachusetts. We are proud of
our accomplishments and appreciate the acknowledgement, but
we maintain our commitment to improving our performance.
There are several reasons that we have been able to deliver improving
performance each year: a unique focus on the preclinical drug discovery
and development space, the essential nature of our products and
services, our global network of facilities and our attention to
profitability. We believe these are the same reasons that we will
continue to deliver growth in 2004 and beyond. We expect overall
demand for our products and services to intensify in 2004 as our
customers work diligently to bring new drugs and devices to market.
In order to take advantage of the increasing opportunities, through-
out 2003, we made a number of changes to better align related
businesses, focus sales force responsibilities and simplify our manage-
ment structure. We made these changes because we believed that
they would improve our operations, enhance our relationships with
existing and potential customers, and allow us to approach our
markets in a more coordinated and efficient manner.
In the fourth quarter of 2003, as a result of the business changes, we revised
our consolidated financial reporting segments. We are continuing to report
two business segments, called Research Models & Services (RMS) and
Looking Ahead to 2004 and Beyond
Development & Safety Testing (DST). The RMS segment includes Research Models,
Transgenic and Laboratory Services, Contract Site Management and Vaccine
Support Services. The DST segment includes Development Services and In Vitro
Technology. We believe that the newly aligned business segments appropriately
reflect results of operations and facilitate investors' and customers’ understanding
of our business.
ASSISTED REPRODUCTIVE TECHNOLOGIES SUCH AS IN VITRO FERTILIZATION
HELP RESEARCHERS OVERCOME CHALLENGES IN THE DEVELOPMENT OF
SPECIALIZED RESEARCH MODELS.

9
Ch
arles River L
abo
ratories
8
Ch
arle
s R
iver
Lab
ora
tori
es
We believe we are extremely well positioned to continue to meet the
expanding market demand. We offer an extensive array of widely-
used models. But what sets us apart from the competition is our
expertise in veterinary medicine, our global production capabilities
and our commitment to biosecurity, the term we use for minimizing
or eliminating risk of contamination to our research models. Each
employee, regardless of job level, is part of a continuous evaluation of
processes, equipment, and facilities, designed to ensure customers that
a research model from Charles River Laboratories is free of known
viruses and bacteria. Our biosecurity procedures have been key to
achieving and maintaining our worldwide market leadership position.
TRANSGENIC AND LABORATORY SERVICES
The need for sophisticated housing and related high-value services
is increasing as researchers create greater numbers of genetically
modified research models for use in drug discovery. We offer a full range of services
to assist in the development of high-quality, genetically and microbiologically
characterized transgenic and knock-out animal colonies. To meet the growing
demand for these services, we expanded our Transgenic and Laboratory Services
facilities in Europe and Japan and have plans to begin construction of a new,
70,000-square-foot facility in the United States in early 2005.
We are quite optimistic about the market outlook for 2004. The market for
Transgenic and Laboratory Services was affected by the financial pressures experienced
by many biotechnology companies in 2003, but given the improving funding
environment, we expect that biotechnology companies will intensify their efforts
in drug discovery and will continue to turn to Charles River for support services.
Research Models & Services: The Opportunities
RESEARCH MODELS
As pharmaceutical and biotechnology companies increase the number of compounds
they are developing, there is a corresponding increase in their use of research models,
particularly specialty, or disease, models. Demand for disease models such as diabetic
rats and immunodeficient mice is continuing to increase because researchers believe
they are better predictors of human disease conditions. And as more drug candidates
reach the late development stage, more research models are used for drug safety
testing. All these types of research models showed strong growth in 2003, and we
expect that growth to continue in 2004.
DEVELOPMENT AND PROPAGATION OF UNIQUE RESEARCH COLONIES
OCCUR INSIDE MICROBIOLOGICALLY SECURE, FLEXIBLE FILM ISOLATORS
WHICH ALLOW FOR EXQUISITE CONTROL OF THE ENVIRONMENT.
10
Ch
arle
s R
iver
Lab
ora
tori
es
11
Ch
arles River L
abo
ratories
and services targeted to meet our customers’ needs, supported by a rigorous,
ongoing quality program. The primary market for SPF eggs is for avian vaccines;
however, human vaccine production is a growing market for these products.
We also expect our Laboratory Services business to grow because, in addition to its
health monitoring business and reagent sales, the laboratory supports the Transgenic
Services business by screening animal health and genetic profiles.
CONTRACT SITE MANAGEMENT
Through our Contract Site Management business, Charles River
provides facility management and scientific and research support
services at customers’ facilities. We bring our combined expertise in
veterinary medicine and facility management, together with our deep
knowledge of biosecurity, to improve the efficiency of customers’
facilities and the health of their research model colonies, which
reduces the cost of interrupted research studies due to contaminations.
We have contracts to operate facilities, primarily for the Federal
government and academic institutions, and also for biotechnology
and pharmaceutical companies.
We believe that there are significant opportunities in the academic
and commercial markets as more institutions outsource facility
management. For that reason, we are focusing our sales efforts in
these sectors, capitalizing on our reputation for delivering highly
specialized services in the most efficient and cost-effective manner.
For customers building new facilities or looking to upgrade existing
ones, we are the logical and beneficial choice.
VACCINE SUPPORT PRODUCTS
Charles River is the world's leading producer of superior quality specific-pathogen-free
(SPF) chickens and embryonated eggs for vaccine production and research. We
achieved our market leadership position by pioneering novel and dependable products
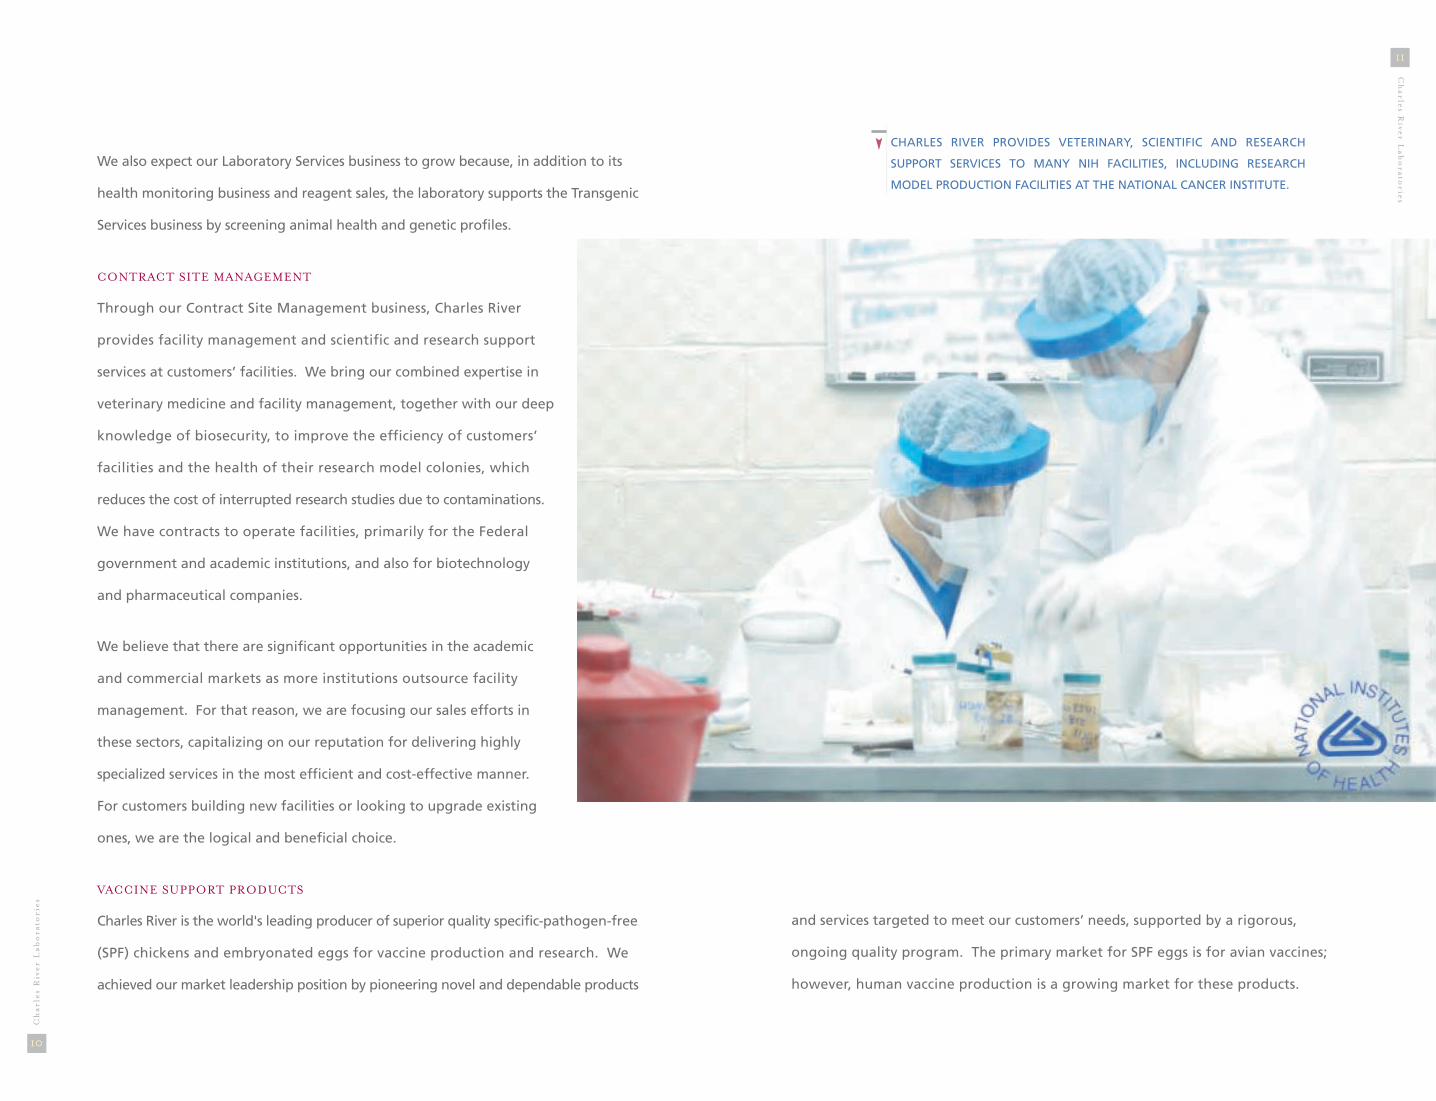
CHARLES RIVER PROVIDES VETERINARY, SCIENTIFIC AND RESEARCH
SUPPORT SERVICES TO MANY NIH FACILITIES, INCLUDING RESEARCH
MODEL PRODUCTION FACILITIES AT THE NATIONAL CANCER INSTITUTE.
Development & Safety Testing: The Opportunities
13
Ch
arles River L
abo
ratories
12
Ch
arle
s R
iver
Lab
ora
tori
es
market for outsourced development services began to recover in
mid-2003 and has continued to strengthen as more and more com-
pounds move through the development pipeline.
Over the past year, we restructured and strengthened our Development
Services business infrastructure in order to help us achieve our scientific,
business and customer-focused goals. We added capacity in two of
our facilities, and expect to add space for both general and specialty
toxicology to accommodate market growth in 2005 and beyond. We
implemented a number of changes designed to integrate our sites
and maximize our strengths, creating an efficient structure that
makes it easier for our clients to work with us. And in the first quarter
of 2004, we introduced mycrlstudy.com™, a secure, web-based portal
that will enable clients to rapidly review data online and
communicate with study directors. We believe this proprietary system represents
a tremendous advance over our competition, enabling our clients to work faster
and more efficiently to bring their drugs to market.
INTERVENTIONAL AND SURGICAL SERVICES
Development of combination products such as drug-eluting stents and the transition
towards minimally invasive surgery are driving the market for outsourced medical
device testing services. Our Development Services business has been providing
these testing services for some time and has established a reputation for scientific
and technical expertise, so the emergence of this market afforded us a significant
growth opportunity. To strengthen our service offerings, in January 2004, we
DEVELOPMENT SERVICES
Regulators in the United States and around the world have developed drug safety
regulations to ensure that drugs and medical devices are safe before beginning
human clinical trials. Recognizing the demand for outsourced development services,
we built a business through six acquisitions in five years. Capitalizing on our
expertise in veterinary medicine, the Development Services business was a logical
extension of our core research model business and afforded us significant growth
opportunities. Having experienced slower demand in late 2002 and early 2003, the
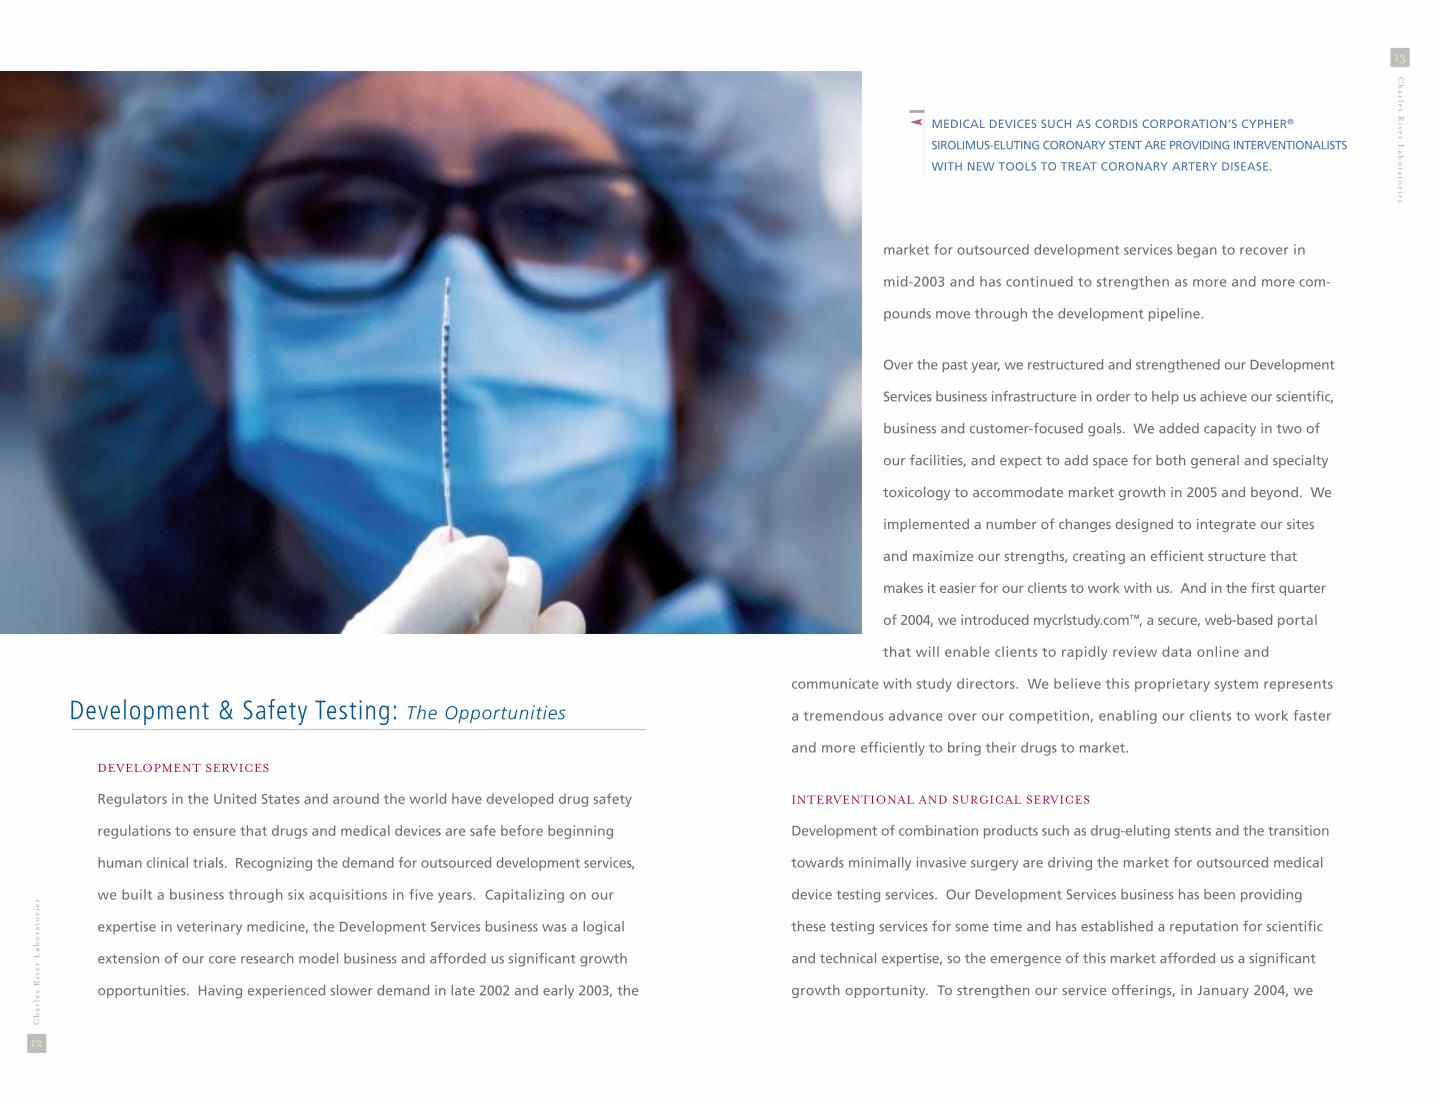
MEDICAL DEVICES SUCH AS CORDIS CORPORATION’S CYPHER®
SIROLIMUS-ELUTING CORONARY STENT ARE PROVIDING INTERVENTIONALISTS
WITH NEW TOOLS TO TREAT CORONARY ARTERY DISEASE.
15
Ch
arles River L
abo
ratories
14
Ch
arle
s R
iver
Lab
ora
tori
es dental offices. Rapid microbial detection is a growing focus in the microbiological
testing market, and while some of these opportunities are outside our traditional
markets, we are exploring potential partnerships which would give us access to
these new markets.
acquired River Valley Farms, a leading provider of preclinical services
to the medical device industry. This acquisition is an excellent
example of our ability to identify new market opportunities and
quickly establish a leadership position. The combination of our
existing business with River Valley Farms created a new business
unit which we call Interventional and Surgical Services (ISS). ISS is a
market-leading provider of outsourced services to the medical
device industry.
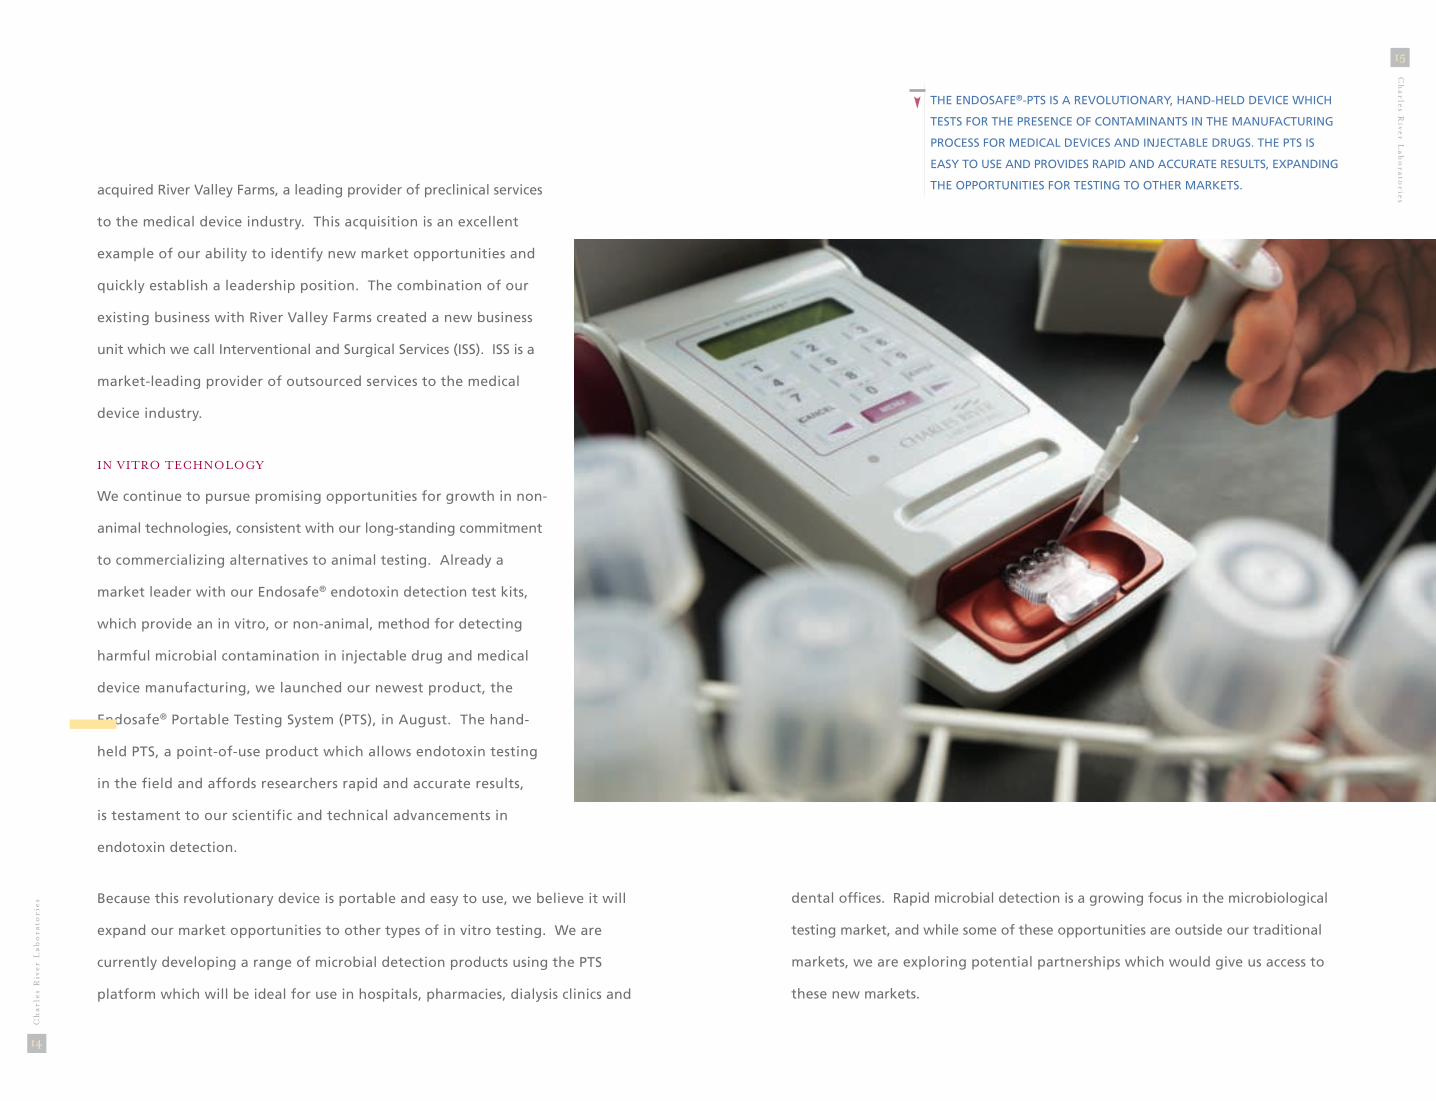
IN VITRO TECHNOLOGY
We continue to pursue promising opportunities for growth in non-
animal technologies, consistent with our long-standing commitment
to commercializing alternatives to animal testing. Already a
market leader with our Endosafe® endotoxin detection test kits,
which provide an in vitro, or non-animal, method for detecting
harmful microbial contamination in injectable drug and medical
device manufacturing, we launched our newest product, the
Endosafe® Portable Testing System (PTS), in August. The hand-
held PTS, a point-of-use product which allows endotoxin testing
in the field and affords researchers rapid and accurate results,
is testament to our scientific and technical advancements in
endotoxin detection.
Because this revolutionary device is portable and easy to use, we believe it will
expand our market opportunities to other types of in vitro testing. We are
currently developing a range of microbial detection products using the PTS
platform which will be ideal for use in hospitals, pharmacies, dialysis clinics and
THE ENDOSAFE®-PTS IS A REVOLUTIONARY, HAND-HELD DEVICE WHICH
TESTS FOR THE PRESENCE OF CONTAMINANTS IN THE MANUFACTURING
PROCESS FOR MEDICAL DEVICES AND INJECTABLE DRUGS. THE PTS IS
EASY TO USE AND PROVIDES RAPID AND ACCURATE RESULTS, EXPANDING
THE OPPORTUNITIES FOR TESTING TO OTHER MARKETS.
17
Ch
arles River L
abo
ratories
16
Ch
arle
s R
iver
Lab
ora
tori
es
Our goal to be the leading provider of products and services that accelerate drug
discovery and development presumes that we will continue to make strategic
acquisitions that add to our portfolio of value-added products and services.
We have made 22 acquisitions and alliances in the past decade, seven since our
management-led leveraged buyout in 1999. We have increased the depth and
breadth of our portfolio and acquired expertise that has enabled us to serve our
customers more fully. No matter what opportunities we pursue, we maintain our
focus on making strategic acquisitions that enhance our ability to serve our
customers while improving our bottom line.
The Charles River team has done an outstanding job of identifying
and integrating acquisitions which offer new ways to serve our
customers’ needs. Maintaining the right mix of products and
services is an integral part of the formula for achieving our growth
objectives while assisting our customers to achieve their goals.
Growth Through Acquisition THE SCIENTIFIC ADVISORY BOARD
Late in the year, we took a key step to support our goal of seeking new opportunities
to deliver high-end products and services to our expanding base of customers. We
formed a six-member Scientific Advisory Board (SAB), comprised of some of the
world’s leading researchers from industry and academia. The purpose of the SAB is
to provide advice and input as we build on our tradition of scientific excellence and
world-class customer service. The SAB will play a vital role in advising us on our
current technologies, new technologies for licensing, and potential acquisitions.
The members of the SAB offer scientific and technical expertise in areas such as
pharmacology, toxicology, genomics, bioinformatics, proteomics and medicine and
will provide valuable insights to help us serve our customers better.
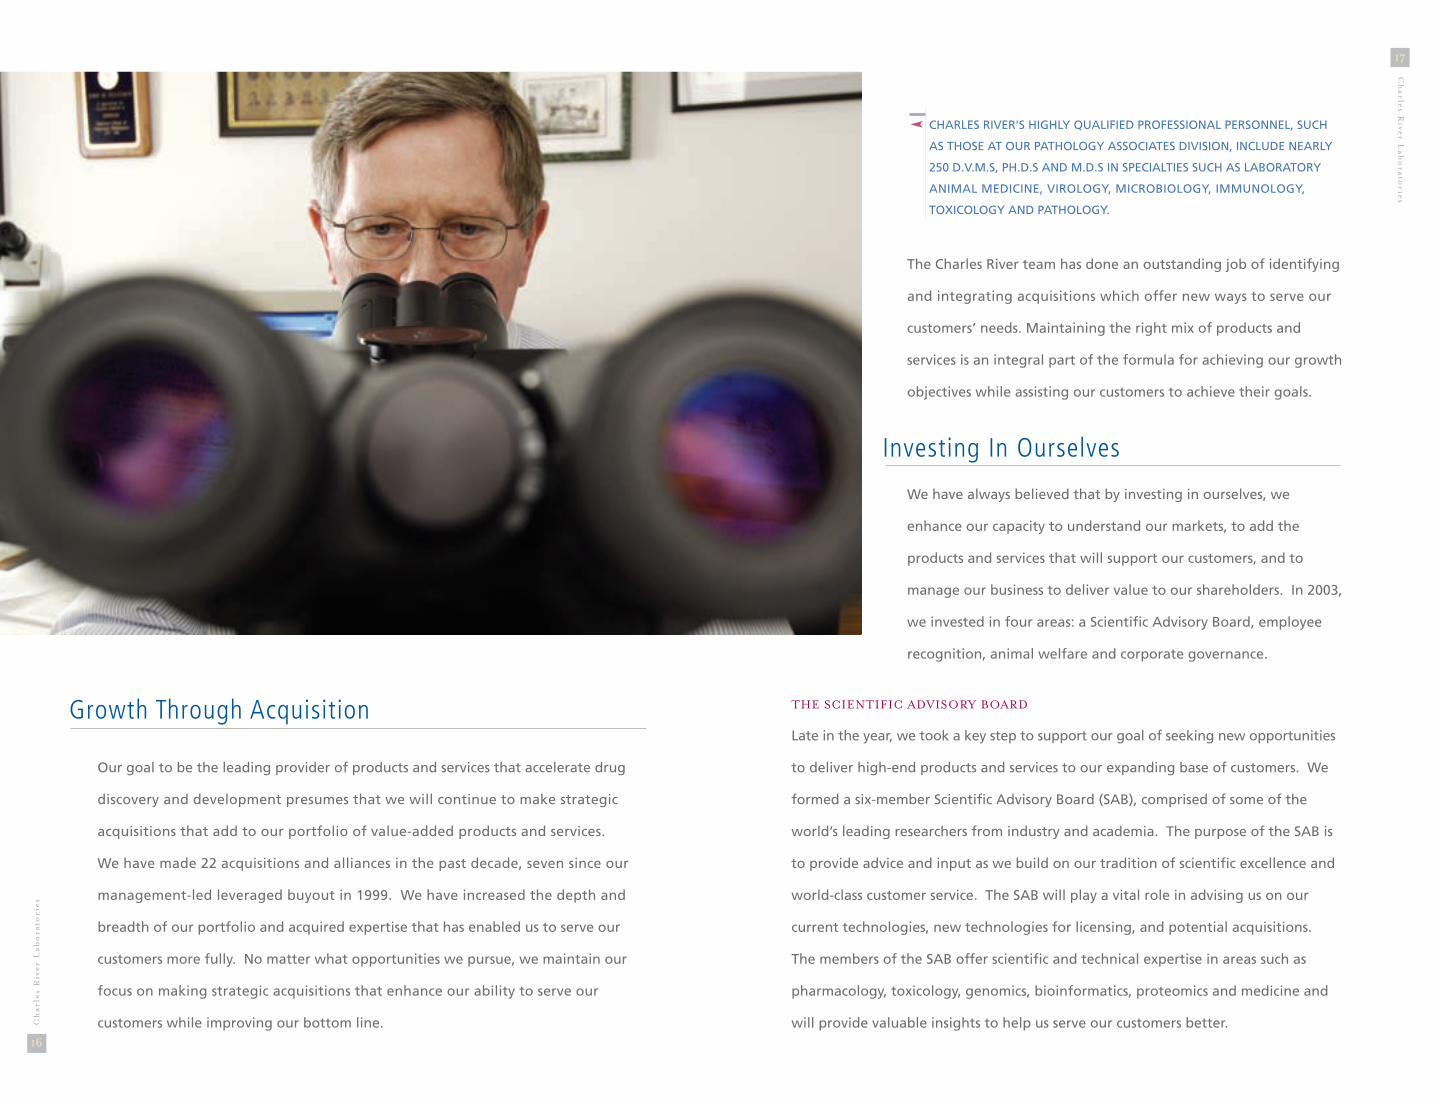
CHARLES RIVER'S HIGHLY QUALIFIED PROFESSIONAL PERSONNEL, SUCH
AS THOSE AT OUR PATHOLOGY ASSOCIATES DIVISION, INCLUDE NEARLY
250 D.V.M.S, PH.D.S AND M.D.S IN SPECIALTIES SUCH AS LABORATORY
ANIMAL MEDICINE, VIROLOGY, MICROBIOLOGY, IMMUNOLOGY,
TOXICOLOGY AND PATHOLOGY.
We have always believed that by investing in ourselves, we
enhance our capacity to understand our markets, to add the
products and services that will support our customers, and to
manage our business to deliver value to our shareholders. In 2003,
we invested in four areas: a Scientific Advisory Board, employee
recognition, animal welfare and corporate governance.
Investing In Ourselves
19
Ch
arles River L
abo
ratories
18
Ch
arle
s R
iver
Lab
ora
tori
es
EMPLOYEE RECOGNITION
Our employees’ scientific knowledge and technical expertise are the basis for our high-
quality products and services and our world-class customer service. We encourage
continuing education, and we provide training to enhance skills and enable employees
to advance their careers at Charles River. We believe that acknowledging our employees’
accomplishments is important, and to do so, our Values Award Program
recognizes and rewards employees for embodying the values that we seek
to promote: employee respect, customer service, flexibility of thought,
humane animal care, growth and profitability, and workplace safety.
ANIMAL WELFARE
One of Charles River’s core corporate values is the commitment to
animal welfare: To responsibly produce the highest-quality research models
in the most humane environment for use in drug and medical device
research. As part of our continuing investment, our enhanced Humane
Care Initiative goes well beyond the requirements set forth by the Animal
Welfare Act. This initiative is designed to raise awareness and provide
training to all Charles River employees on the importance of humane care
of our animals. Humane care is not only a moral imperative, it is a scientific
necessity. The proper care of animals has a discernible effect on the
success of a research protocol. Our goal is to ensure that every employee
has the necessary skills to handle animals with care and compassion.
CORPORATE GOVERNANCE
We are committed to operating our business with integrity and accountability.
This is why we chose to adopt new corporate governance standards proposed by
the NYSE well ahead of the mandated compliance dates. Seven of our eight Board
members are independent and have no financial, personal or significant business
ties to the Company or management, and all of our Board committees, other than
the Executive Committee, are composed of independent directors. The Board
conducts annual evaluations of its committees and members. We maintain a strong
and independent Audit Committee and require directors and officers to own stock
in the Company. We created an internal Disclosure Committee which meets regularly
and adopted disclosure procedures and guidelines to help ensure that our public
disclosures are accurate and timely.
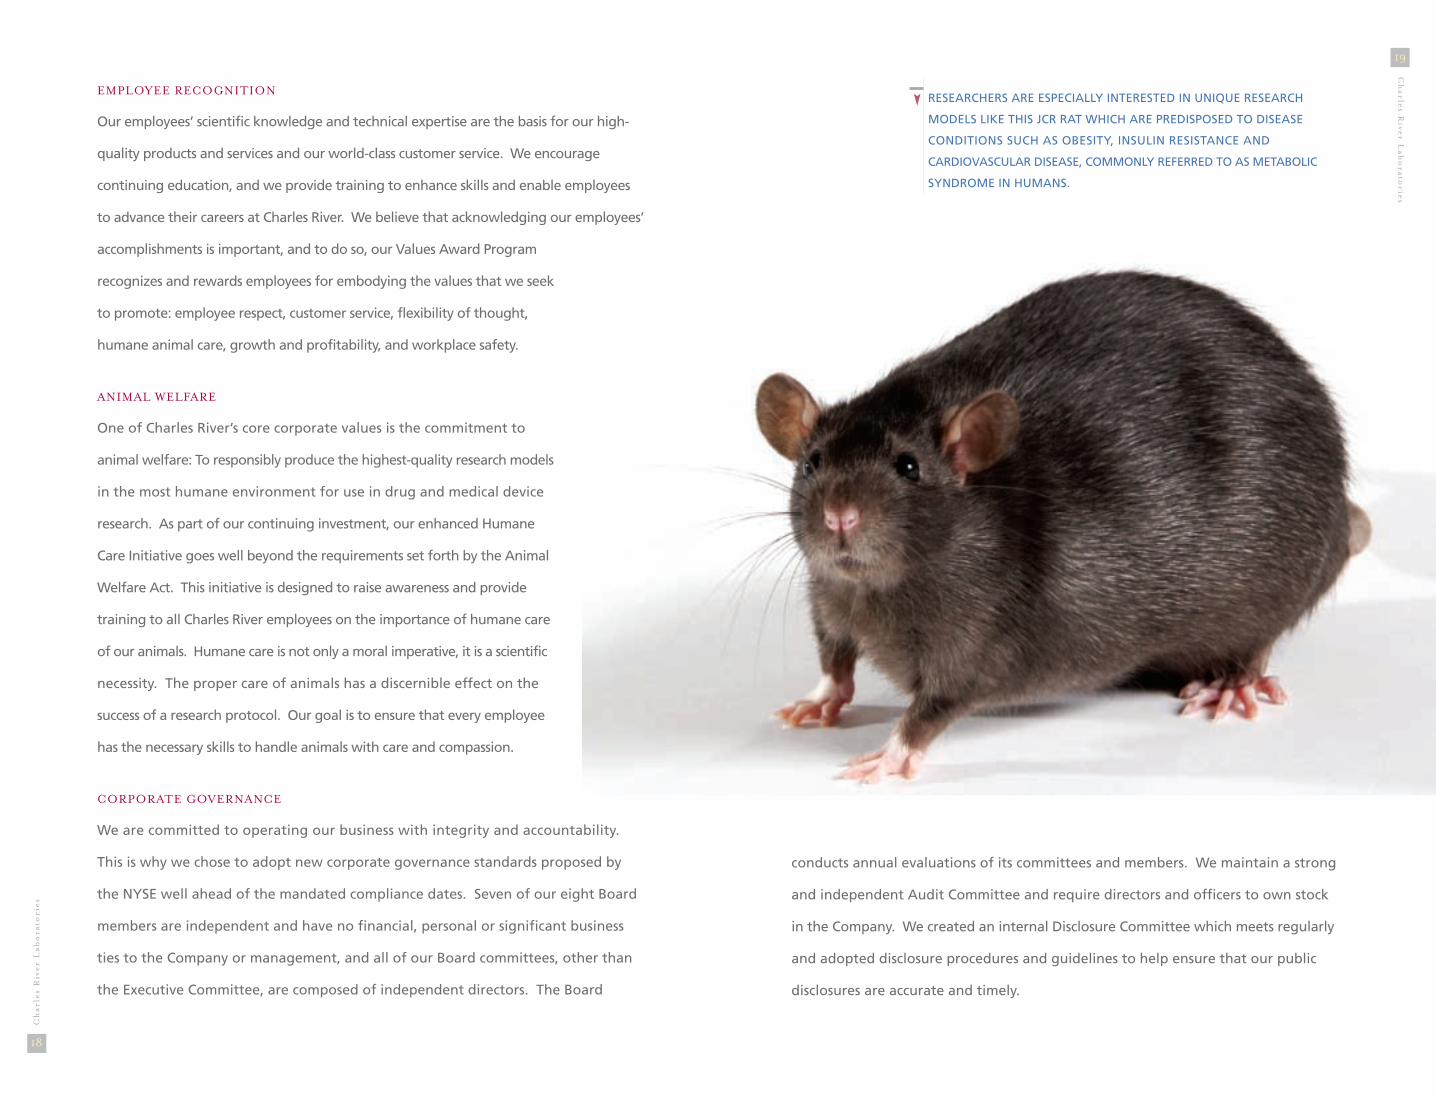
RESEARCHERS ARE ESPECIALLY INTERESTED IN UNIQUE RESEARCH
MODELS LIKE THIS JCR RAT WHICH ARE PREDISPOSED TO DISEASE
CONDITIONS SUCH AS OBESITY, INSULIN RESISTANCE AND
CARDIOVASCULAR DISEASE, COMMONLY REFERRED TO AS METABOLIC
SYNDROME IN HUMANS.
The greatest strength of our Company is the 4,500 people in 16
countries who contribute their knowledge, experience and dedication
to Charles River every day. The accomplishments of 2003 demonstrate
to our shareholders, our customers and the marketplace that
working together, our talented and committed people can meet
any challenge and continue to deliver outstanding products and
services to accelerate research.
Sincerely,
James C. Foster
Chairman, President and Chief Executive Officer
4,500 People Working As One
We adopted a Code of Business Conduct and Ethics that renews our commitment
to operating with integrity and transparency. The code, which applies to every
employee at Charles River, covers a broad range of business practices and procedures
and is designed to foster a culture of honesty and accountability.
Actions speak louder than words. Our commitment to you, our shareholders, is
evidenced by our actions: our dedication to providing quality products and services
to our customers, our focus on understanding our markets and identifying new
opportunities, our attentiveness to managing our business for profitability and our
ethical standards and practices. Our commitment to these principles has made Charles
River Laboratories the financially strong company it is today.
21
Ch
arles River L
abo
ratories
20
Ch
arle
s R
iver
Lab
ora
tori
es
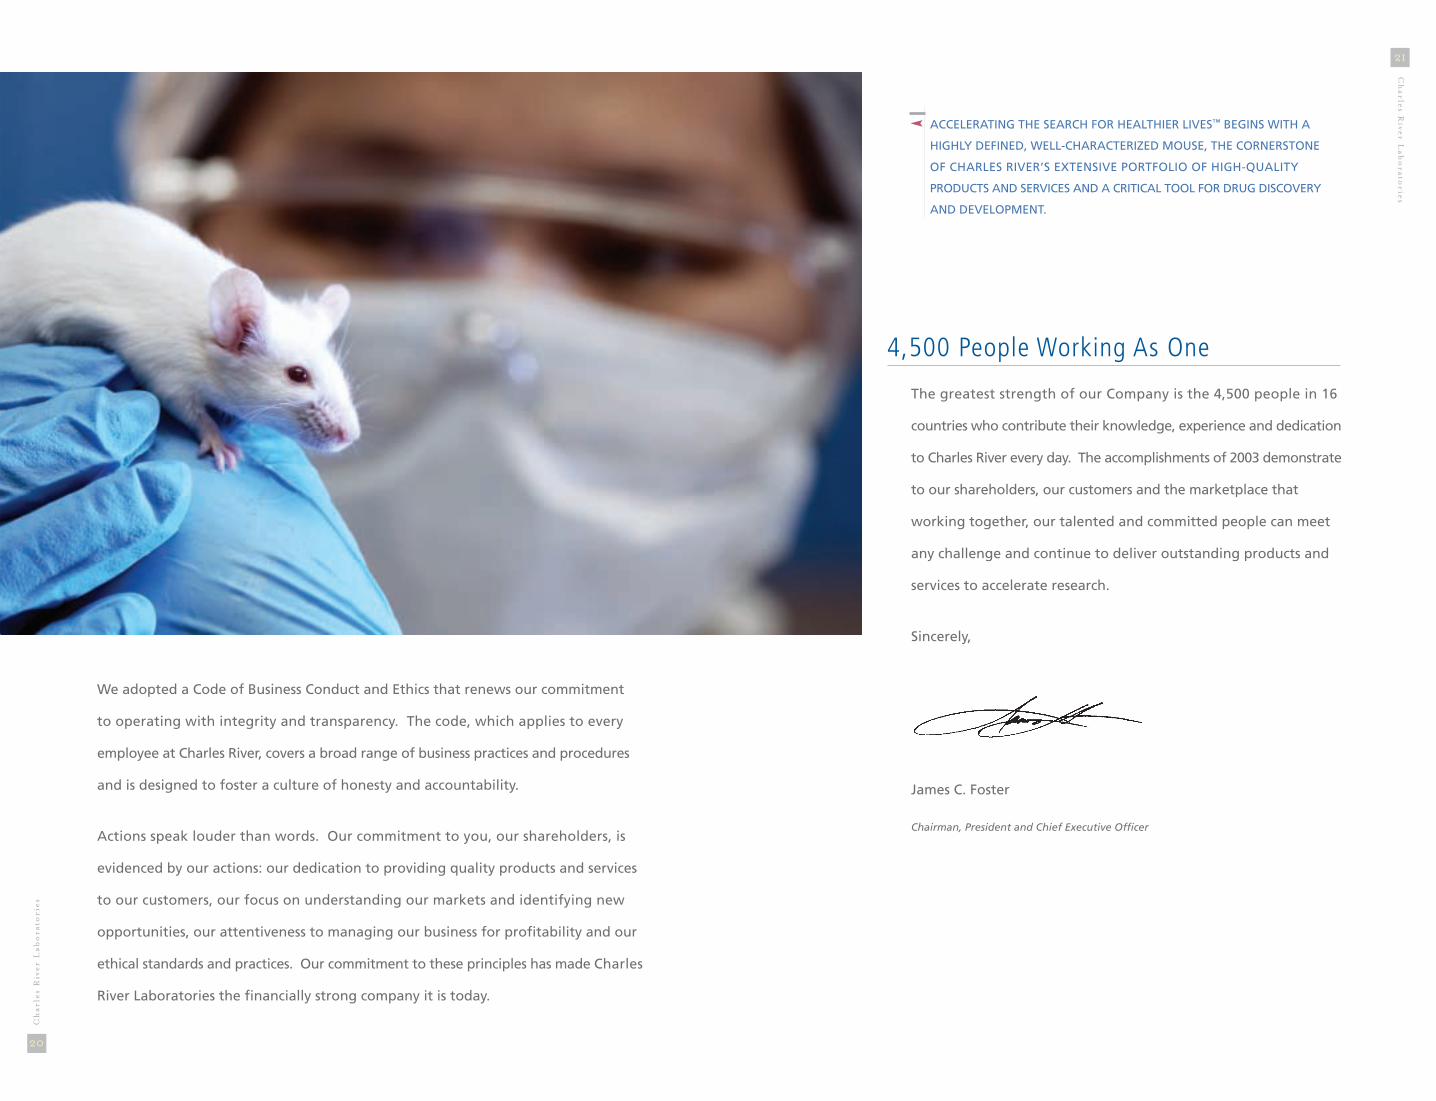
ACCELERATING THE SEARCH FOR HEALTHIER LIVES™ BEGINS WITH A
HIGHLY DEFINED, WELL-CHARACTERIZED MOUSE, THE CORNERSTONE
OF CHARLES RIVER’S EXTENSIVE PORTFOLIO OF HIGH-QUALITY
PRODUCTS AND SERVICES AND A CRITICAL TOOL FOR DRUG DISCOVERY
AND DEVELOPMENT.
2003 Form 10-K
CORPORATE INFORMATION
Directors
Henry L. FosterDirector Emeritus
Charles River Laboratories
James C. Foster (1)Chairman, Chief Executive Officer,
President
Charles River Laboratories
Robert Cawthorn (1, 3, 4)Chairman
Actelion Ltd.
Stephen D. Chubb (2, 4)Chairman, Chief Executive Officer
Matritech, Inc.
George E. Massaro (1)Managing Director
Huron Consulting Group
George M. Milne, Jr., Ph.D. (3)Retired Executive Vice President of
Global Research and Development
and President of Central Research
Pfizer Inc.
Douglas E. Rogers (3)Partner
Blackstone Healthcare Partners LLC
Samuel O. Thier, M.D.Professor of Medicine and Professor
of Health Care Policy
Harvard Medical School,
Massachusetts General Hospital
William Waltrip (1, 2, 3, 4)Chairman
Technology Solutions Company
Committee Memberships
1. Executive Committee2. Audit Committee3. Compensation Committee4. Corporate Governance and
Nominating Committee
Corporate Officers
James C. FosterChairman, Chief Executive Officer,
President
Real H. RenaudExecutive Vice President, General
Manager, Global Research Model
Products and Services
Thomas F. AckermanSenior Vice President,
Chief Financial Officer
David P. JohstSenior Vice President, Human
Resources and Administration
Dennis R. ShaughnessySenior Vice President, Corporate
Development, General Counsel
and Secretary
Christophe H. Berthoux, D.V.M.Corporate Vice President,
Charles River Europe
Jörg M. Geller, D.V.M., Ph.D.Corporate Vice President,
Charles River Europe
Nancy A. Gillett, D.V.M., Ph.D.,D.A.C.V.P.Corporate Vice President,
General Manger,
Discovery and Development Services
William J. White, V.M.D.Corporate Vice President,
Veterinary and Professional Services
Toshihide KashiwagiVice President, Japan
Charn Lee, D.V.M.Vice President, Asian Operations
Corporate Headquarters
Charles River Laboratories, Inc.251 Ballardvale StreetWilmington, MA 01887978.658.6000
Stock Listing
The common stock of theCorporation is traded under the symbol CRL on the New York Stock Exchange
Independent Accountants
PricewaterhouseCoopers, LLPOne International PlaceBoston, MA 02110617.439.4390
Shareholder Services
Equiserve Trust Company, NAP.O. Box 43010Providence, RI 02940-3010781.575.3400www.equiserve.com
Investor Relations
Charles River Laboratories, Inc.251 Ballardvale StreetWilmington, MA 01887Tel: 978.658.6000Fax: 978.658.7841
Corporate News andInformation
Stay abreast of the latestCompany news by visiting ourwebsite at www.criver.com
sku# CRL-AR-04
UNITED STATES SECURITIES AND EXCHANGE COMMISSIONWashington, D.C. 20549
FORM 10-K(Mark One)
� ANNUAL REPORT PURSUANT TO SECTION 13 OR 15(d) OF THESECURITIES EXCHANGE ACT OF 1934FOR THE FISCAL YEAR ENDED DECEMBER 27, 2003
OR� TRANSITION REPORT PURSUANT TO SECTION 13 OR 15(d) OF THE
SECURITIES EXCHANGE ACT OF 1934FOR THE TRANSITION PERIOD FROM TO
Commission File No. 333-92383
CHARLES RIVER LABORATORIES INTERNATIONAL, INC.(Exact Name of Registrant as Specified in Its Charter)
Delaware 06-1397316(State or Other Jurisdiction of (I.R.S. EmployerIncorporation or Organization) Identification No.)
251 Ballardvale Street 01887Wilmington, Massachusetts (Zip Code)
(Address of Principal Executive Offices)
(Registrant’s telephone number, including area code): (978) 658-6000
Securities registered pursuant to Section 12(b) of the Act:
Name of each exchangeTitle of each class on which registered
Common Stock, $0.01 par value New York Stock Exchange
Securities registered pursuant to Section 12(g) of the Act: None
Indicate by check mark whether the Registrant (1) has filed all reports required to be filed by Section 13 or15(d) of the Securities Exchange Act of 1934 during the preceding 12 months (or for such shorter period that theRegistrant was required to file such reports), and (2) has been subject to such filing requirements for the past90 days.
Yes � No �
Indicate by check mark if disclosure of delinquent filers pursuant to Item 405 of Regulation S-K is notcontained herein, and will not be contained, to the best of the Registrant’s knowledge, in definitive proxy orinformation statements incorporated by reference in Part III of this Form 10-K or any amendment to thisForm 10-K. �
Indicate by check mark whether the Registrant is an accelerated filer (as defined in Exchange ActRule 12b-2). Yes � No �
On June 28, 2003, the aggregate market value of the Registrant’s voting common stock held by non-affiliatesof the Registrant was approximately $1,453,176,300.
As of March 3, 2004, there were outstanding 46,074,943 shares of the Registrant’s common stock, $0.01 parvalue per share.
DOCUMENTS INCORPORATED BY REFERENCE
Portions of the Registrant’s Definitive Proxy Statement for its 2004 Annual Meeting of Stockholders scheduledto be held on May 12, 2004 (the 2004 Proxy Statement), which will be filed with the Securities and ExchangeCommission not later than 120 days after December 27, 2003, are incorporated by reference into Part III of thisAnnual Report on Form 10-K. With the exception of the portions of the 2004 Proxy Statement expresslyincorporated into this Annual Report on Form 10-K by reference, such document shall not be deemed filed as partof this Form 10-K.
CHARLES RIVER LABORATORIES INTERNATIONAL, INC.ANNUAL REPORT ON FORM 10-K
TABLE OF CONTENTS
Item Page
PART I
1 Business . . . . . . . . . . . . . . . . . . . . . . . . . . . . . . . . . . . . . . . . . . . . . . . . . . . . . . . . . . . . 12 Properties . . . . . . . . . . . . . . . . . . . . . . . . . . . . . . . . . . . . . . . . . . . . . . . . . . . . . . . . . . . 143 Legal Proceedings . . . . . . . . . . . . . . . . . . . . . . . . . . . . . . . . . . . . . . . . . . . . . . . . . . . . . 154 Submission of Matters to a Vote of Security Holders . . . . . . . . . . . . . . . . . . . . . . . . . . . . 15
Supplementary Item. Executive Officers of the Registrant pursuant to Instruction 3 toItem 401 (b) of Regulation S-K . . . . . . . . . . . . . . . . . . . . . . . . . . . . . . . . . . . . . . . . . . 15
PART II
5 Market for Registrant’s Common Equity, Related Stockholder Matters . . . . . . . . . . . . . . . 176 Selected Consolidated Financial Data . . . . . . . . . . . . . . . . . . . . . . . . . . . . . . . . . . . . . . . 197 Management’s Discussion and Analysis of Financial Condition and Results of Operations . 20
7A Quantitative and Qualitative Disclosures About Market Risk . . . . . . . . . . . . . . . . . . . . . . 338 Financial Statements and Supplementary Data . . . . . . . . . . . . . . . . . . . . . . . . . . . . . . . . . 359 Changes in and Disagreements with Accountants on Accounting and Financial Disclosure . 82
9A Controls and Procedures . . . . . . . . . . . . . . . . . . . . . . . . . . . . . . . . . . . . . . . . . . . . . . . . 82
PART III
10 Directors and Executive Officers of the Registrant . . . . . . . . . . . . . . . . . . . . . . . . . . . . . . 8311 Executive Compensation . . . . . . . . . . . . . . . . . . . . . . . . . . . . . . . . . . . . . . . . . . . . . . . . . 8312 Security Ownership of Certain Beneficial Owners and Management and Related
Stockholders Matters . . . . . . . . . . . . . . . . . . . . . . . . . . . . . . . . . . . . . . . . . . . . . . . . . 8313 Certain Relationships and Related Transactions . . . . . . . . . . . . . . . . . . . . . . . . . . . . . . . . 8314 Principal Accounting Fees and Services . . . . . . . . . . . . . . . . . . . . . . . . . . . . . . . . . . . . . . 83
PART IV
15 Exhibits, Financial Statement Schedules, and Reports on Form 8-K . . . . . . . . . . . . . . . . . 84
PART I
Item 1. Business
General
This Annual Report on Form 10-K (Form 10-K), contains forward-looking statements regardingfuture events and the future results of Charles River Laboratories International, Inc. (Charles River)that are based on current expectations, estimates, forecasts, and projections about the industries inwhich Charles River operates and the beliefs and assumptions of the management of Charles River.Words such as ‘‘expect,’’ ‘‘anticipate,’’ ‘‘target,’’ ‘‘goal,’’ ‘‘project,’’ ‘‘intend,’’ ‘‘plan,’’ ‘‘believe,’’ ‘‘seek,’’‘‘estimate,’’ and similar expressions are intended to identify such forward-looking statements. Theseforward-looking statements are predictions and are subject to risks, uncertainties, and assumptions thatare difficult to predict. Therefore, actual results may differ materially and adversely from thoseexpressed in any forward-looking statements. Factors that might cause or contribute to such differencesinclude, but are not limited to, those discussed in this Form 10-K under the section entitled ‘‘RisksRelated to Our Business and Industry.’’ Charles River undertakes no obligation to revise or updatepublicly any forward-looking statements for any reason.
Corporate History
Charles River has been in business since 1947 and has undergone several business structurechanges over the years. Charles River Laboratories International, Inc. was incorporated in 1994. In2000, we completed our initial public offering of Charles River Laboratories International, Inc. Ourstock is traded on the New York Stock Exchange under the symbol ‘‘CRL’’ and is included in theStandard & Poor’s S&P MidCap 400 Index. We are headquartered in Wilmington, Massachusetts. Ourheadquarters mailing address is 251 Ballardvale St., Wilmington, MA 01887, and the telephone numberat that location is (978) 658-6000. Our Internet site is www.criver.com. Unless otherwise specificallyincorporated by reference in this Form 10-K, material contained on our Internet site is notincorporated by reference into this Form 10-K. Unless the context otherwise requires, references in thisForm 10-K to ‘‘Charles River,’’ ‘‘we,’’ ‘‘us’’ or ‘‘our’’ refer to Charles River LaboratoriesInternational, Inc. and its subsidiaries.
This Form 10-K, as well as all other reports filed with the Securities and Exchange Commission(SEC), are available free of charge through the investor relations section of our Internet site as soon aspracticable after we electronically file such material with, or furnish it to, the SEC. The public mayread and copy any materials we file with the SEC at the SEC’s Public Reference Room at 450 FifthStreet NW, Washington, DC 20549. The public may obtain information on the operation of the PublicReference Room by calling the SEC at 1-800-SEC-0330. The SEC maintains an Internet site(http://www.sec.gov) that contains reports, proxy and information statements, and other informationregarding issuers that file electronically with the SEC.
Overview
We are a leading provider of critical research tools and integrated support services that enableinnovative and efficient drug and medical device discovery and development. We are the global leaderin providing the animal research models required in research and development for new drugs, devicesand therapies and have been in this business for more than 55 years. Since 1992, we have built uponour research model technologies to develop a diverse and growing portfolio of products and services.Our wide array of tools and services enables our customers to reduce costs, increase speed and enhancetheir productivity and effectiveness in drug and medical device discovery and development. Ourcustomer base includes major pharmaceutical companies, biotechnology companies, as well as manygovernment agencies, leading hospitals and academic institutions throughout the world. We currentlyoperate numerous facilities in 16 countries worldwide. Our products and services, supported by our
1

global infrastructure and deep scientific expertise, enable our customers to meet many of the challengesof early-stage life sciences research, a large and growing market. In 2003, our net sales were$613.7 million and our operating income was $138.6 million.
During the later part of 2003, we expanded our in vitro market opportunity with our new, portableversion of our highly successful endotoxin testing platform called Endosafe�-PTS, which allowsendotoxin testing in the field, affording researchers accurate and timely results. In January 2004, wefurther expanded our capabilities with the acquisition of River Valley Farms (RVF), a medical devicecontract research business located near Minneapolis, Minnesota. We have combined RVF with ourexisting contract surgical research services group, which has been providing pre-clinical medical devicetesting services for the past three years, to form a new unit called Interventional and Surgical Services(ISS). We expect the acquisition of RVF to significantly improve our ability to meet our customers’needs in this area
During the fourth quarter of 2003, we changed our business segments to better strategically alignrelated business units and to focus sales force and management responsibilities. As a result, some ofour operating units are now presented within a business segment that is different from that previouslyreported in our SEC reports. We are continuing to report two business segments, now called ResearchModels and Services (RMS) and Development and Safety Testing (DST). We believe that the newbusiness segments will better reflect our results of operations and facilitate understanding of theCompany’s business. The changes in segment presentation have no effect on our consolidated revenuesor net income. Prior year segment information included in this Form 10-K has been restated to reflectthis change.
Research Models and Services (RMS)
We are the global leader in the production and sale of research models, principally genetically andvirally defined purpose-bred rats and mice, and have been supplying research models since 1947. Wealso provide a variety of related services that are designed to assist our customers in screening drugcandidates. RMS accounted for 66% of total net sales in 2003.
Research Models. A significant portion of this business is comprised of the commercial productionand sale of animal research models, principally purpose-bred rats, mice and other rodents for use byresearchers. Our research models include genetically defined models and models with compromisedimmune systems, which are increasingly in demand as early-stage research tools. The Food and DrugAdministration (FDA) and foreign regulatory bodies typically require the safety and efficacy of newdrug candidates and many medical devices to be tested on research models like ours prior to testing inhumans. As a result, our research models are an essential part of the drug discovery and developmentprocess. Our research models are bred and maintained in a biosecure environment designed to ensurethat the animals are free of specific viral and bacterial agents and other contaminants that can disruptresearch operations and distort results. With our biosecure production capabilities we are able toconsistently deliver high quality research models worldwide. We also provide larger animal models,including rabbits and primates, to the research community, principally for use in their drugdevelopment and testing studies.
Our research models include:
• outbred animals, which are genetically heterogeneous;
• inbred animals, which are genetically identical;
• other genetically-modified research models;
• knock-out models with one or more disabled genes;
• hybrid animals, which are the offspring of two different inbred parents;
2
• spontaneous mutant animals, which contain a naturally-occurring genetic mutation (such asimmune deficiency); and
• transgenic animals, which contain genetic material transferred from a different species.
We offer one of the largest selections of small animal models and provide our customers withhigh-volume and high-quality production. Our rats, mice and other rodent species such as guinea pigsand hamsters have been and continue to be some of the most extensively used research models in theworld, largely as a result of our continuous commitment to innovation and quality in the breedingprocess. We provide our small animal models to numerous customers around the world, including mostpharmaceutical companies, major biotechnology companies, many government agencies, leading hospitaland academic institutions. In 2001, we acquired new and proprietary, disease-specific rat models usedto find new treatments for diseases such as diabetes, obesity, cardiovascular disease and kidney disease.
We believe that over the next several years, many new research models will be developed and usedin biomedical research, such as transgenic models with modified genetic material, knock-out modelswith one or more disabled genes, and transgenic models that incorporate or exclude a particular mouse,rat or human gene. These more highly-defined and characterized models will allow researchers tofurther focus their investigations into disease conditions and potential new therapies or interventions.We intend to build upon our position as the leader in this field to expand our presence in this marketfor higher-value research models.
We have a strategic partnership with The Jackson Laboratory, an internationally renownedresearch institution that, in addition to research functions, develops unique mouse models for use inmedical research, drug discovery and development work. Through this partnership, we produce anddistribute The Jackson Laboratory’s research models in Europe and Asia. The partnership combinesThe Jackson Laboratory’s strength in genetic science with our global production and distributioncapabilities. We view this relationship as an important step toward broadening the scope of ourresearch models business.
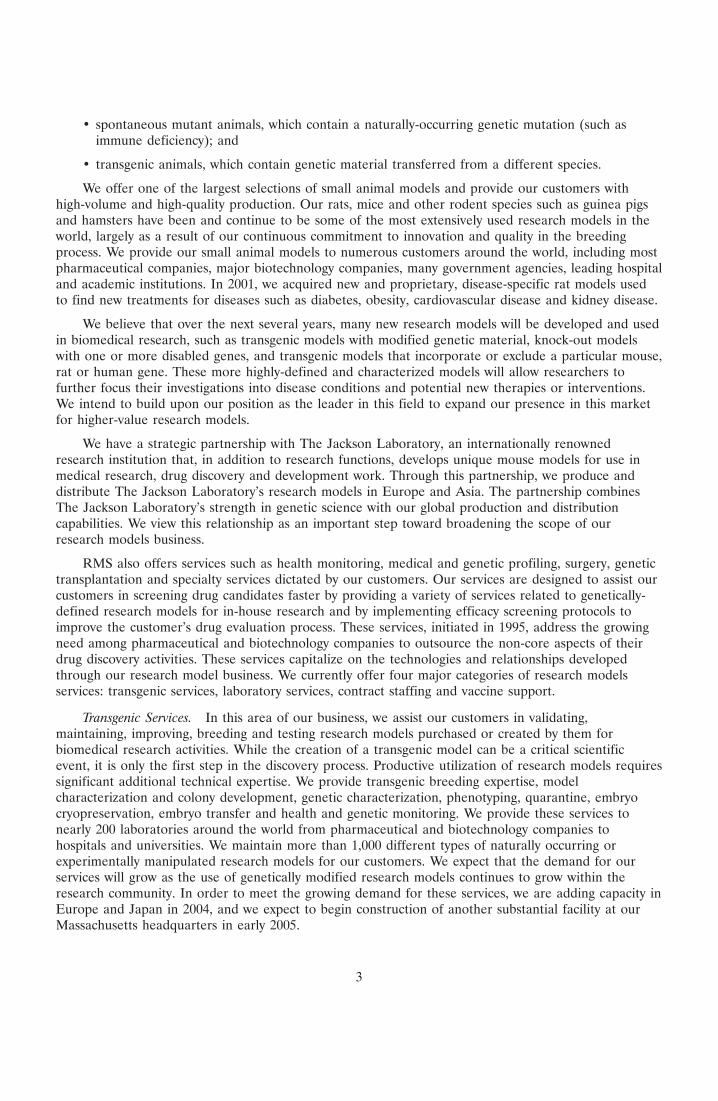
RMS also offers services such as health monitoring, medical and genetic profiling, surgery, genetictransplantation and specialty services dictated by our customers. Our services are designed to assist ourcustomers in screening drug candidates faster by providing a variety of services related to genetically-defined research models for in-house research and by implementing efficacy screening protocols toimprove the customer’s drug evaluation process. These services, initiated in 1995, address the growingneed among pharmaceutical and biotechnology companies to outsource the non-core aspects of theirdrug discovery activities. These services capitalize on the technologies and relationships developedthrough our research model business. We currently offer four major categories of research modelsservices: transgenic services, laboratory services, contract staffing and vaccine support.
Transgenic Services. In this area of our business, we assist our customers in validating,maintaining, improving, breeding and testing research models purchased or created by them forbiomedical research activities. While the creation of a transgenic model can be a critical scientificevent, it is only the first step in the discovery process. Productive utilization of research models requiressignificant additional technical expertise. We provide transgenic breeding expertise, modelcharacterization and colony development, genetic characterization, phenotyping, quarantine, embryocryopreservation, embryo transfer and health and genetic monitoring. We provide these services tonearly 200 laboratories around the world from pharmaceutical and biotechnology companies tohospitals and universities. We maintain more than 1,000 different types of naturally occurring orexperimentally manipulated research models for our customers. We expect that the demand for ourservices will grow as the use of genetically modified research models continues to grow within theresearch community. In order to meet the growing demand for these services, we are adding capacity inEurope and Japan in 2004, and we expect to begin construction of another substantial facility at ourMassachusetts headquarters in early 2005.
3
Laboratory Services. We assist our customers in monitoring and analyzing the health and geneticsof the research models used in their research protocols. We developed this capability internally bybuilding upon the scientific foundation created by the diagnostic laboratory needs of our researchmodel business. Depending upon a customer’s needs, we may serve as its sole-source testing laboratory,or as an alternative source supporting its internal laboratory capabilities. We believe that the continuedgrowth in development and utilization of specific disease models and genetically engineered models,such as transgenic models, will drive our future growth as the reference laboratory of choice for genetictesting of special models.
Contract Staffing. Building upon our core capability as a leading provider of high-quality researchmodels, we manage animal care operations on behalf of government and academic organizations, aswell as commercial customers in the biotechnology and related sectors. Demand for our servicesreflects the growing necessity of these large institutions to outsource internal functions or activities thatare not critical to the core scientific innovation process. In addition, we believe that our expertise inmanaging the laboratory animal environment enhances the productivity and quality of our customers’research facilities. This area leads to additional opportunities for us to provide other products andservices to our customers. Site management does not typically require us to make any incrementalinvestment, thereby generating a favorable return on deployed assets.
Vaccine Support. We are the global leader for the supply of specific pathogen-free, or SPF,chickens and fertile chicken eggs. SPF chicken embryos are used by animal health companies as self-contained ‘‘bioreactors’’ for the manufacturing of live and dead viruses. These viruses are used as a rawmaterial in poultry and human vaccine applications. The production of SPF eggs is done underbiosecure conditions, similar in many ways to our research model production. We have a worldwidepresence that includes several SPF egg production facilities in the United States, as well as facilities inGermany and Australia, and a joint venture in Mexico. We also operate a specialized avian laboratoryin the United States, which provides in-house testing and support services to our customers.
Development and Safety Testing (DST)
Discovery represents the earliest stages of research and development in the life sciences, directedto the identification and selection of a lead compound for future drug development. Discovery isfollowed by development activities, which are directed at demonstrating the safety and efficacy of theselected drug candidates. Discovery and development represent most of the pre-clinical activities indrug development. The development services portion of our DST business segment enables ourcustomers to outsource their non-core drug development activities to us. These activities are typicallyrequired for support of the regulatory filings necessary to obtain FDA approval. The demand for theseservices is driven by the trend to outsource certain pre-clinical drug discovery and developmentactivities.
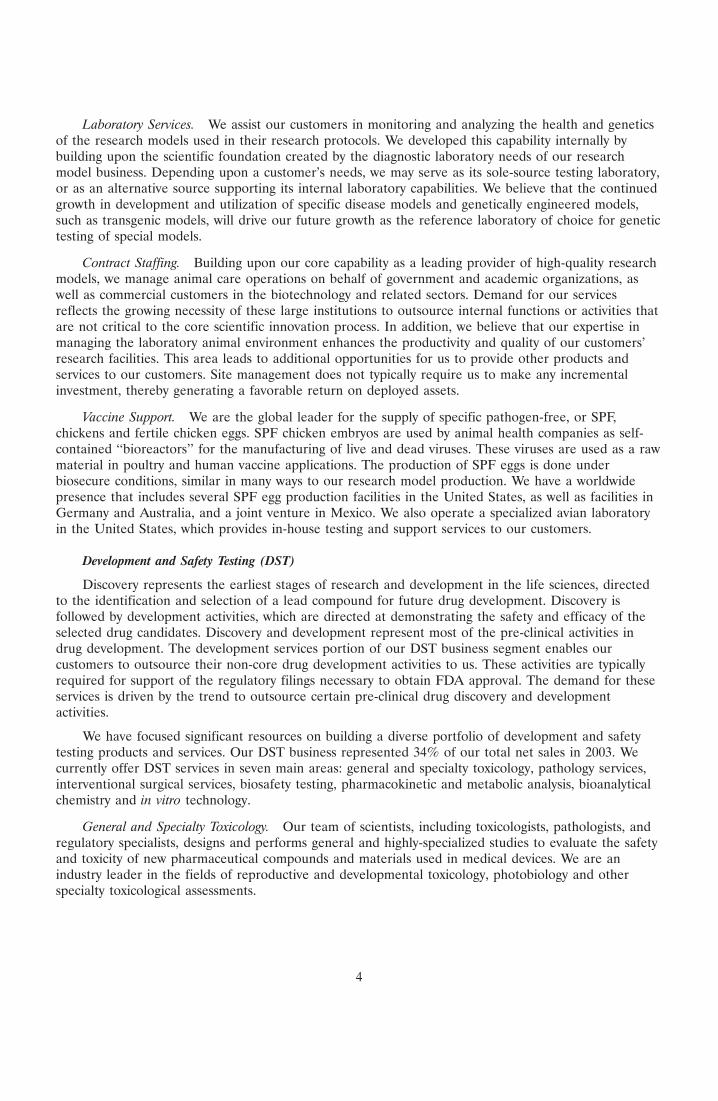
We have focused significant resources on building a diverse portfolio of development and safetytesting products and services. Our DST business represented 34% of our total net sales in 2003. Wecurrently offer DST services in seven main areas: general and specialty toxicology, pathology services,interventional surgical services, biosafety testing, pharmacokinetic and metabolic analysis, bioanalyticalchemistry and in vitro technology.
General and Specialty Toxicology. Our team of scientists, including toxicologists, pathologists, andregulatory specialists, designs and performs general and highly-specialized studies to evaluate the safetyand toxicity of new pharmaceutical compounds and materials used in medical devices. We are anindustry leader in the fields of reproductive and developmental toxicology, photobiology and otherspecialty toxicological assessments.
4
Pathology Services. In the drug development process, the ability to identify and characterizepathologic changes within tissues and cells is critical in determining the safety of a new compound. Weemploy highly-trained pathologists who use state-of-the-art techniques to identify pathology withintissues and cells, as well as at the molecular level. Frequently, decisions regarding continued productdevelopment are dependent on these pathology findings.
Interventional and Surgical Services (ISS). Many sophisticated drugs are designed to beadministered directly to a precise location within the body using surgical, or ‘‘invasive,’’ techniques. Thedevelopment of these and certain other drugs requires the use of surgical techniques to administer adrug, or to observe its effects in various tissues. Our ISS group offers extensive capabilities in this area,and has collaborated with world-renowned experts in the fields of cardiology, inflammation, andpathology at leading academic institutions. Our ISS unit also provides a wide variety of medical devicetesting services from prototype feasibility testing to long-term GLP, or good laboratory practices,studies, primarily in large research models. The FDA requires companies introducing medical devicesto test the biocompatibility of any new materials that have not previously been approved for contactwith human tissue. Our services include cardiovascular surgery, biomaterial reactivity studies,orthopedic studies and related laboratory services. We maintain state-of-the-art surgical suites whereour skilled professional staff implement custom surgery protocols provided by our customers. InJanuary 2004, we acquired RVF, a medical device contract research business located near Minneapolis,Minnesota. We expect the acquisition of RVF to significantly improve our business in this area.
Biosafety Testing. We provide specialized non-clinical quality control testing that is frequentlyoutsourced by both pharmaceutical and biotechnology companies. These services allow our customersto determine if the human protein drug candidates, or the process for manufacturing those products,are essentially free of residual biological materials. The bulk of this testing work is required by theFDA for obtaining new drug approval, maintaining an FDA-licensed manufacturing facility or releasingapproved products for use in patients. Our scientific staff consults with customers in the areas ofprocess development, validation, manufacturing scale-up and biological testing.
Pharmacokinetic and Metabolic Analysis. Our scientists conduct metabolic studies to reveal howdrugs are broken down and excreted, and the duration that drugs or their byproducts remain in variousorgans, tissues and the circulatory systems in multiple species. In addition, we have extensivecapabilities and resources which can be directed towards assessing, both in vivo and in vitro, thepharmacokinetic compounds in lead optimization studies. These studies can be performed as part ofthe drug screening process to help discover and nominate lead compounds, as well as later in thedevelopment process to provide information regarding safety and efficacy.
Bioanalytical Chemistry. Our bioanalytical chemistry services support all phases of drug discoveryand development from lead optimization through non-clinical studies and clinical trials. For leadoptimization support, our researchers apply proven high throughput methodologies to rapidly screencompounds to evaluate pharmacokinetic properties. In supporting non-clinical and clinical developmentstudies, our researchers develop and validate assays in full regulatory compliance to support theseefforts. We also provide, through a joint venture, leading-edge proteomics testing and analysis serviceson a fee-for-service contract basis to the pharmaceutical and biotechnology industries.
In Vitro Technology. Our DST business also provides non-animal, or in vitro, methods for testingthe safety of drugs and medical devices. We are strategically committed to being the leader in providingour customers with in vitro alternatives as these methods become scientifically validated andcommercially feasible. Our in vitro technology business produces and distributes test kits, reagents,software, accessories, instruments and associated services to pharmaceutical and biotechnologycompanies for medical devices and other products worldwide. We are a market leader in endotoxintesting, which is used for quality control testing of injectable drugs and medical devices, theircomponents and the processes under which they are manufactured, for the presence of endotoxins.
5
Quality control testing for endotoxin contamination by our customers is an FDA requirement forinjectable drugs and medical devices. Endotoxin testing uses a processed extract from the blood of thehorseshoe crab, known as limulus amebocyte lysate (LAL). The LAL test is the first and only majorFDA-validated in vitro alternative to an animal model test for endotoxin detection in pharmaceuticaland medical device manufacturing. The process of extracting blood is generally not harmful to thecrabs, which are subsequently returned to their natural ocean environment. In 2003, we expanded ourin vitro market opportunity with a new, portable version of our highly successful endotoxin testingplatform. The Endosafe Portable Testing System (Endosafe�-PTS) allows endotoxin testing in the field,affording researchers accurate and timely results. We continue to explore opportunities in non-traditional markets for water and surface monitoring such as food and beverage, hospitals andpharmaceuticals.
Competitive Strengths
Our products and services are critical to both traditional pharmaceutical research and the growingfields of genomics, proteomics, recombinant protein and humanized antibody research. We believe weare well positioned to compete effectively in all of these markets as a result of a diverse set ofcompetitive strengths, which include:
Critical Products and Services. We provide critical, proven and enabling products and services thatour customers rely on to advance their early-stage research efforts and accelerate product development.We offer a wide array of complementary research tools and discovery and development services thatdifferentiate us from our competition and have created a sustained competitive advantage in many ofour markets.
Long-Standing Reputation for Scientific Excellence. We have earned our long-standing reputation forscientific excellence by consistently delivering high-quality research models supported by exceptionaltechnical service and support for over 55 years. As a result, the Charles River brand name issynonymous with premium quality products and services and scientific excellence in the biomedicalresearch industry. We have nearly 250 science professionals on staff with D.V.M.s, Ph.D.s and M.D.s, inareas including laboratory animal medicine, molecular biology, pathology, immunology, toxicology andpharmacology.
Extensive Global Infrastructure and Customer Relationships. Our operations are globally integratedthroughout North America, Europe and Asia. Our extensive investment in worldwide infrastructureallows us to standardize our products and services across borders when required by our multinationalcustomers, while also offering a customized local presence when needed. We currently operatenumerous facilities in 16 countries worldwide, serving a global customer base.
Biosecurity Technology Expertise. In our research models business, our commitment to and expertknowledge of biosecurity technology distinguishes us from our competition. We maintain rigorousbiosecurity standards in all of our facilities to maintain the health profile and consistency of ourresearch models. These qualities are crucial to the integrity and timeliness of our customers’ research.
Platform Acquisition Capabilities. We have a proven track record of successfully identifying,acquiring, and developing complementary businesses. With this experience, we have developed internalexpertise in sourcing acquisitions.
Experienced and Incentivized Management Team. Most of our senior management team has anaverage of nearly 20 years of service with our company. Our Chairman and Chief Executive Officer,James C. Foster, has been with us for 27 years. As of December 27, 2003, our management teamowned, or had options to acquire, securities representing approximately 3.0% of our equity on a fully-diluted basis.
6
Our Strategy
Our business is driven by the continued growth of research and development spending bypharmaceutical, biotechnology and medical device companies, the federal government and academicinstitutions. As the pressure to develop new drugs increases for these industries, so does the pressure tocontain costs, implement research in multiple countries simultaneously and identify, hire and retain abreadth of experienced experts. These trends create opportunities for companies such as ours that canhelp speed the drug discovery and development process. Our strategy is to meet these needs bycontinuing to build upon our core research models business and to actively invest in new opportunitiesand become a full service, pre-clinical outsourcing provider to the drug discovery and developmentindustry.
We intend to continue to broaden the scope of our products and services. Primarily throughacquisitions and alliances, we have improved our ability to offer new services that complement ourexisting drug discovery and development businesses. Over the past decade, we have completed 22acquisitions and alliances that have contributed to our financial results. Several of our operations beganas platform acquisitions, which we were able to grow by developing and marketing the acquiredproducts or services to our extensive global customer base. We intend to further pursue strategicplatform acquisitions to drive our long-term growth. We believe our approach to acquisitions is adisciplined one that seeks to focus on businesses that are a sound strategic fit and that offer theprospect of enhancing stockholder value. This strategy may include geographic expansion of an existingcore service, strengthening of one of our core services or the addition of a new product or service.
We also intend to continue to expand our pre-clinical outsourcing services. Many of ourpharmaceutical and biotechnology customers outsource a wide variety of research activities that arecritical to their scientific innovation process. We believe the trend of outsourcing pre-clinical or early-stage research will continue to increase. We are well positioned to exploit both existing and newoutsourcing opportunities, principally through our discovery and development services offerings. Webelieve our early successes in the transgenic services area have increased customer demand foroutsourcing and have created significant opportunities. We intend to focus our marketing efforts onstimulating demand for further outsourcing of pre-clinical research to gain market share. We alsointend to expand our opportunities by continuing to increase our international presence.
Customers
Our customers consist primarily of large pharmaceutical companies, as well as biotechnology,animal health, medical device and diagnostic companies and hospitals, academic institutions, andgovernment agencies and other life sciences companies. We have many long-term, stable relationshipswith our customers.
During 2003, in both our RMS and DST businesses, more than three-quarters of our sales were topharmaceutical and biotechnology companies, and the balance was to hospitals, universities andgovernment agencies. No single commercial customer accounted for more than 5% of our total netsales in 2003 and our top 20 customers accounted for 32% of total net sales.
For information regarding net sales and long-lived assets attributable to each of our businesssegments for the last three fiscal years, please review Note 16 included in the Notes to ConsolidatedFinancial Statements included elsewhere in this Form 10-K.
7
For information regarding net sales and long-lived assets attributable to operations in the UnitedStates, Japan, France and other countries for each of the last three fiscal years, please review Note 16included in the Notes to Consolidated Financial Statements included elsewhere in this Form 10-K.
Sales, Marketing and Customer Support
We sell our products and services principally through our direct sales force, the majority of whomwork in the United States, with the balance working in Europe and Japan. The direct sales force issupplemented by a network of international distributors for our products businesses. In late 2003, were-aligned our U.S. sales force to provide each business segment with its own dedicated sales team.
Our internal marketing groups support the field sales staff while developing and implementingprograms to create close working relationships with customers in the biomedical research industry. Webelieve our Internet site, www.criver.com, is an effective marketing tool, and has become recognized asa valuable resource in the laboratory animal field by a broad spectrum of industry leaders.
We maintain both customer service and technical assistance departments, which service ourcustomers’ routine and more specialized needs. We frequently assist our customers in solving problemsrelated to animal husbandry, health and genetics, biosecurity, study design, regulatory consulting,protocol development and other areas in which our expertise is recognized as a valuable customerresource.
Research and Development
We do not maintain a fully-dedicated research and development staff and therefore, have not hadany significant research and development costs in any of the past three fiscal years. Our approach todeveloping new products or services is to extend our base technologies into new applications and fields,and in some instances to license or acquire technologies to serve as platforms for the development ofnew businesses that service our existing customer base. Our research and development focus isprincipally on developing projects that improve our productivity or processes.
Industry Support and Animal Welfare
Among the shared values of our employees is a concern for and commitment to animal welfare.We have been in the forefront of animal welfare improvements in our industry, and continue todemonstrate our commitment with special recognition programs for employees who demonstrate anextraordinary commitment in this critical area of our business.
We support a wide variety of organizations and individuals working to further animal welfare aswell as the interests of the biomedical research community. We fund internships in laboratory animalmedicine, provide financial support to non-profit institutions that educate the public about the benefitsof animal research and provide awards and prizes to outstanding leaders in the laboratory animalmedicine field. One of our businesses dedicates a portion of its net sales, through a royalty, to supportsimilar programs and initiatives.
Employees
As of December 27, 2003, we had approximately 4,500 employees, including nearly 250 scienceprofessionals with advanced degrees including D.V.M.s, Ph.D.s and M.D.s. Our employees are notunionized in the United States, although employees are unionized at some of our European facilities,consistent with local custom for our industry. Our annual satisfaction surveys indicate that we have agood relationship with our employees.
8
Backlog
Backlog usually includes work to be performed under signed agreements. Once work under asigned agreement begins, net sales are recognized over the life of the project. We believe that backlogis not a meaningful indicator of future business prospects for any of our business units for a variety ofreasons including: almost all of our contracts are terminable by the client on short notice; the scope ofstudies frequently changes, which may either increase or decrease their value; and studies may bereduced in scope or delayed at any time by the client or regulatory authorities. Therefore, managementdoes not believe that backlog information is material to an understanding of our business.
Competition
Our strategy is to become a leader in each of the markets in which we participate. Ourcompetitors are generally different in each of our business and geographic areas.
In our RMS segment our main competitors include three smaller competitors in North America,several smaller ones in Europe, and two smaller ones in Japan. Of our main United States competitors,two are privately-held businesses and the third is a government-funded, not-for-profit institution. Webelieve that none of our competitors in RMS has our comparable global reach, financial strength,breadth of product and services offerings and pharmaceutical and biotechnology industry relationships.
We have many competitors in our DST segment, a few of which are larger than we are and mayhave greater capital, technical or other resources than we do, however, many are smaller and moreregionalized.
We compete in the marketplace on the basis of quality, reputation and availability, supported byour international presence with strategically located facilities.
Regulatory Matters
The Animal Welfare Act (AWA) governs the treatment of particular species intended for use inresearch. The AWA imposes a wide variety of specific regulations on producers and users of thesespecies, most notably cage size, shipping conditions, sanitation and environmental enrichment methods.We comply with licensing and registration requirement standards set by the United States Departmentof Agriculture (USDA) for handling regulated species, including breeding, research use, maintenanceand transportation. However, rats, mice and chickens are not regulated under the AWA. Congressrecently adopted legislation which permanently excludes these species from regulation under the AWA.As a result, most of our United States small animal research model activities and our vaccine supportservices operations are not subject to regulation under the AWA. Our animal production facilities inthe United States are accredited by The Association for Assessment and Accreditation of LaboratoryAnimal Care International (AAALAC), a highly regarded member association which maintainsstandards that often exceed those of the USDA.
Portions of our DST are also generally regulated by the USDA, and in the case of our endotoxindetection systems, the FDA. Our manufacture of test kits and reagents for endotoxin testing is subjectto regulation by the FDA under the authority of the Federal Food, Drug, and Cosmetic Act. We arerequired to register with the FDA as a device manufacturer and are subject to inspection on a routinebasis for compliance with the FDA’s Quality System Regulations and Good Manufacturing Practices.These regulations require that we manufacture our products and maintain our documents in aprescribed manner with respect to manufacturing, testing and control activities.
Corporate Governance
We are committed to operating our business with integrity and accountability. We complied withall of the New York Stock Exchange (NYSE) corporate governance standards prior to their approval by
9
the SEC. Seven of our eight Board members are independent and have no financial, personal orsignificant business ties to the Company or management, and all of our Board committees, other thanthe Executive Committee, are composed of independent directors. The Board adopted corporategovernance guidelines and a Code of Business Conduct and Ethics which has been communicated toemployees and posted on our website. We have always been diligent in complying with generallyaccepted accounting principles and are committed to providing financial information that is transparent,timely and accurate. We have established a process through which employees, either directly oranonymously, can notify us (and the Audit Committee of the Board of Directors) of alleged accountingand auditing concerns or violations including fraud. We have created an internal disclosure committeethat meets regularly and adopted disclosure procedures and guidelines to help ensure that our publicdisclosures are accurate and timely.
Industry and Market Data
In this Form 10-K, we rely on and refer to information and statistics regarding the research modelsand development services industries, and our market share in the markets in which we compete. Weobtained this information and statistics from various third-party sources, none of which should beconsidered definitive, discussions with our customers and/or our own internal estimates. We believe thatthese sources and estimates are reliable, but we have not independently verified them.
Risks Related to Our Business and Industry
Set forth below and elsewhere in this Form 10-K and in other documents we file with the SEC arerisks and uncertainties that could cause actual results to differ materially from the results contemplatedby the forward-looking statements contained in this Form 10-K.
Our business is subject to risks relating to operating internationally.
A significant part of our net sales is derived from operations outside the United States. Ourinternational revenues, which include revenues from our non-U.S. subsidiaries, represented 30.8% ofour total net sales in 2003, 27.4% in 2002 and 27.3% in 2001. We expect that international revenueswill continue to account for a significant percentage of our revenues for the foreseeable future. Thereare a number of risks arising from our international business, including:
• foreign currencies we receive for sales outside the U.S. could be subject to unfavorable exchangerates with the U.S. dollar and reduce the amount of revenue that we recognize;
• general economic and political conditions in the markets in which we operate;
• potential increased costs associated with overlapping tax structures;
• potential trade restrictions and exchange controls;
• difficulties and costs associated with staffing and managing foreign operations;
• unexpected changes in regulatory requirements;
• the difficulties of compliance with a wide variety of foreign laws and regulations;
• longer accounts receivable cycles in certain foreign countries; and
• import and export licensing requirements.
Our operations and financial results could be significantly affected by the above mentioned risks.For example, because both sales and costs at our foreign businesses are conducted in the localcurrency, we are subject to exchange rate fluctuations between local currencies and the U.S. dollar inthe reported results of our foreign operations. These fluctuations may decrease our earnings. We
10

currently do not hedge against the risk of exchange rate fluctuations because both sales and costs atour foreign businesses are maintained in local currency. The economic situation in some of the foreigncountries in which we operate may result in slower payments of outstanding receivable balances. Ourfinancial results could be adversely affected by weakness in the economies and currencies in theseregions.
A reduction in research and development budgets may adversely affect our business.
Our customers include researchers at pharmaceutical and biotechnology companies. Our ability tocontinue to grow and win new business is dependent upon the ability and willingness of thepharmaceutical and biotechnology industries to continue to spend on research and development at ratesclose to or at historical levels and to outsource the products and services we provide. Fluctuations inthe research and development budgets of these researchers and their organizations could have asignificant effect on the demand for our products and services. Research and development budgetsfluctuate due to changes in available resources, mergers of pharmaceutical and biotechnologycompanies, spending priorities and institutional budgetary policies. Our business could be adverselyaffected by any significant decrease in life sciences research and development expenditures bypharmaceutical and biotechnology companies, as well as by academic institutions, governmentlaboratories or private foundations.
A reduction or delay in government funding of research and development may adversely affect our business.
A substantial portion of net sales in our RMS segment is derived from customers at academicinstitutions and research laboratories whose funding is partially dependent on both the level and timingof funding from government sources, such as the U.S. National Institutes of Health (NIH) and similardomestic and international agencies. Although the level of government research funding has increasedsubstantially during the past several years, we believe this increase may not continue at historic rates inthe short term. Government funding of research and development is subject to the political process,which is inherently unpredictable. Our sales may be adversely affected if our customers delay purchasesas a result of uncertainties surrounding the approval of government budget proposals. Also, governmentproposals to reduce or eliminate budgetary deficits have sometimes included reduced allocations to theNIH and other government agencies that fund research and development activities. A reduction ingovernment funding for the NIH or other government research agencies could adversely affect ourbusiness and our financial results. Our customers generally receive funds from approved grants atparticular times of the year, as determined by the U.S. federal government. In the past, grants havebeen frozen for extended periods or have otherwise become unavailable to various institutions withoutadvance notice. The timing of the receipt of grant funds affects the timing of purchase decisions by ourcustomers and, as a result, can cause fluctuations in our sales and operating results.
The outsourcing trend in the pre-clinical and non-clinical stages of drug discovery and development maydecrease, which could slow our growth.
Some areas of our discovery and development services business have grown significantly as a resultof the increase over the past several years in pharmaceutical and biotechnology companies outsourcingtheir pre-clinical and non-clinical research support activities. While industry analysts expect theoutsourcing trend to continue for the next several years, a substantial decrease in pre-clinical and non-clinical outsourcing activity could result in a diminished growth rate in the sales of one or more of ourexpected higher-growth areas.
11
Our customer contracts are generally terminable on little or no notice. Termination of a large contract forservices or multiple contracts for services could adversely affect our sales and profitability.
Generally, our agreements with our customers provide that the customer can terminate theagreements or reduce the scope of services under the agreements with little or no notice. Customersmay elect to terminate their agreements with us for various reasons, including: unexpected or undesiredstudy results; production problems resulting in shortages of the drug being tested; the customer’sdecision to forego or terminate a particular study; or the loss of funding for the particular researchstudy. If a customer terminates a contract with us, we are entitled under the terms of the contract toreceive revenue earned to date as well as certain other costs and, in some cases, penalties. Primarily inour DST segment, cancellation of a large contract or simultaneous cancellation of multiple contractscould materially adversely affect that segment’s business and, therefore, may adversely affect ouroperating results.
If we are not successful in selecting and integrating the businesses and technologies we acquire, our businessmay suffer.
During the past three years, we have expanded our business through several acquisitions. We planto continue to grow our business through acquisitions of businesses and technologies and the formationof alliances. However, businesses and technologies may not be available on terms and conditions wefind acceptable. Even if completed, acquisitions and alliances involve numerous risks which mayinclude:
• difficulties and expenses incurred in assimilating operations, services, products or technologies;
• difficulties in developing and operating new businesses, including diversion of management’sattention from other business concerns;
• the potential loss of key employees of an acquired business and difficulties in attracting newemployees to grow businesses; and
• difficulties in achieving business and financial success.
In the event that an acquired business or technology or an alliance does not meet expectations, ourresults of operations may be adversely affected. We may not be able to successfully integrateacquisitions into our existing business or successfully exploit new business or technologies.
Contaminations in our animal populations can damage our inventory, harm our reputation for contaminant-free production and result in decreased sales.
Our research models and fertile chicken eggs must be free of contaminants such as viruses andbacteria because the presence of contaminants can distort or compromise the quality of researchresults. Contaminations in our isolated breeding rooms or poultry houses could disrupt ourcontaminant-free research model and fertile egg production, harm our reputation for contaminant-freeproduction and result in decreased sales.
Contaminations typically require cleaning up the contaminated room or poultry house. This clean-up results in inventory loss, clean-up and start-up costs, and reduced sales as a result of lost customerorders and credits for prior shipments. These contaminations are unanticipated and difficult to predictand could adversely impact our financial results. We have made significant capital expendituresdesigned to strengthen our biosecurity and have significantly improved our operating procedures toprotect against such contaminations, however, contaminations may still occur.
12
New technologies may be developed, validated and increasingly used in biomedical research that could reducedemand for some of our products and services.
For many years, groups within the scientific and research communities have attempted to developmodels, methods and systems that would replace or supplement the use of living animals as testsubjects in biomedical research. Companies have developed several techniques that have scientificmerit, especially in the area of cosmetics and household product testing, markets in which we do notmarket our products or services. Only a few alternative test methods in the discovery and developmentof effective and safe treatments for human and animal disease conditions have been validated andsuccessfully deployed. The principal validated non-animal test system is the LAL, or endotoxindetection system, a technology which we acquired and have aggressively marketed as an alternative totesting in animals. It is our strategy to participate in some fashion with any non-animal test method asit becomes validated as a research model alternative or adjunct in our markets. However, thesemethods may not be available to us or we may not be successful in commercializing these methods.Even if we are successful, sales or profits from these methods may not offset reduced sales or profitsfrom research models. Alternative research methods could decrease the need for research models, andwe may not be able to develop new products effectively or in a timely manner to replace any lost sales.
We face significant competition in our business, and if we are unable to respond to competition in ourbusiness, our revenues may decrease.
We face significant competition from different competitors in each of our business units. Some ofour competitors are larger than we are and may have greater capital, technical or other resources thanwe do. We generally compete on the basis of quality, reputation and availability of service. Expansionby our competitors into other areas in which we operate, new entrants into our markets or changes inour competitors’ strategies could adversely affect our competitive position. Any erosion of ourcompetitive position may decrease our revenues or limit our growth.
Threat of future terrorist activity or related U.S. military action may have a negative impact on the economyand our business.
The current political and business turmoil in many parts of the world, including the threat offuture terrorist attacks on the U.S. and other parts of the world and related U.S. military action,continues to put severe pressure on global economic conditions and the U.S. economy. Such pressuremay have a negative effect on research and development outsourcing and spending, which wouldadversely impact our business.
Negative attention from special interest groups may impair our business.
Our core research model activities with rats, mice and other rodents have not historically been thesubject of animal rights media attention. However, we have experienced protests by animal rightactivists, which included threats against our facilities and employees, overseas. Future negative attentionor threats against our facilities or employees could adversely affect our business.
One of our large animal operations is dependent on a single source of supply, which if interrupted couldadversely affect our business.
We depend on an international source of supply for one of our large animal operations.Disruptions to their continued supply may arise from colony fertility and health problems, export orimport restrictions or embargoes, foreign government or economic instability, severe weather conditionsor contract disputes or disruptions. Any disruption of supply could harm our business if we cannotremove the disruption or are unable to secure an alternative or secondary source on comparablecommercial terms.
13

Tax benefits we expect to be available in the future may be subject to challenge.
In connection with our 1999 recapitalization, our then current shareholders, CRL Acquisition LLC(CRL Acquisition) and Bausch & Lomb Incorporated (B&L), made a joint election intended to permitus to increase the depreciable and amortizable tax basis in our assets for federal income tax purposes,thereby providing us with expected future tax benefits. In connection with our initial public offering in2000, CRL Acquisition reorganized, terminated its existence as a corporation for tax purposes anddistributed a substantial portion of its stock to its members. We believe that the reorganization andliquidating distribution should not have any impact on the election for federal income tax purposes.However, it is possible that the Internal Revenue Service (IRS) may contend that this reorganizationand liquidating distribution should be integrated with our original recapitalization. If the IRS were tobe successful with this contention, the expected future tax benefits at the time of the recapitalizationwould not be available and we would be required to write off the related deferred tax asset.
We depend on key personnel and may not be able to retain these employees or recruit additional qualifiedpersonnel, which would harm our business.
Our success depends to a significant extent on the continued services of our senior managementand other members of management. James C. Foster, our Chief Executive Officer since 1992, has heldvarious positions with us for 27 years and is our Chairman. We have no employment agreement withMr. Foster, nor with any other executive officer. If Mr. Foster or other members of management donot continue in their present positions, our business may suffer.
Because of the specialized scientific nature of our business, we are highly dependent uponqualified scientific, technical and managerial personnel. While we have an excellent record of employeeretention, there is still strong competition for qualified personnel in the pharmaceutical andbiotechnology fields. Therefore, we may not be able to attract and retain the qualified personnelnecessary for the development of our business. The loss of the services of existing personnel, as well asthe failure to recruit additional key scientific, technical and managerial personnel in a timely manner,could harm our business.
Our quarterly operating results may vary, which could negatively affect the market price of our common stock.
Our results of operations in any quarter may vary from quarter to quarter and are influenced bysuch factors as the number and scope of ongoing customer engagements, the commencement,postponement, completion or cancellation of customer contracts in the quarter, changes in the mix ofour products and services, the extent of cost overruns, holiday patterns of our customers, budget cyclesof our customers, and exchange rate fluctuations. We believe that operating results for any particularquarter are not necessarily a meaningful indication of future results. Nonetheless, fluctuations in ourquarterly operating results could negatively affect the market price of our common stock.
Item 2. Properties
The following charts provide summary information on our properties. The first chart lists the siteswe own and the second chart lists the sites we lease. Most of our leases expire between 2004 and 2006.None of these leases are material to our business operations and many have an option to renew. Webelieve that we will be able to successfully renew expiring leases on terms satisfactory to us.
14

Sites—Owned
No. of Total BusinessCountry Sites Square Feet Principal Functions Segment
Belgium . . . . . . . . . . . . . . . . . . . . . . . . 1 23,284 Office, Production RMSCanada . . . . . . . . . . . . . . . . . . . . . . . . 1 74,069 Office, Production, Laboratory RMSChina . . . . . . . . . . . . . . . . . . . . . . . . . . 1 19,372 Office, Production, Laboratory DSTFrance . . . . . . . . . . . . . . . . . . . . . . . . . 5 663,600 Office, Production, Laboratory RMS
— 2,500 Office, Production, Laboratory DSTGermany . . . . . . . . . . . . . . . . . . . . . . . 3 154,184 Office, Production, Laboratory RMS
— 300 Office, Production, Laboratory DSTMexico . . . . . . . . . . . . . . . . . . . . . . . . . 2 88,582 Office, Production, Laboratory RMSItaly . . . . . . . . . . . . . . . . . . . . . . . . . . . 1 43,390 Office, Production, Laboratory RMSJapan . . . . . . . . . . . . . . . . . . . . . . . . . . 2 116,340 Office, Production, Laboratory RMSIreland . . . . . . . . . . . . . . . . . . . . . . . . . 2 102,319 Office, Production, Laboratory DSTUnited Kingdom . . . . . . . . . . . . . . . . . . 1 56,000 Office, Production, Laboratory RMS
1 2.240 Office, Production, Laboratory DSTUnited States . . . . . . . . . . . . . . . . . . . . 22 936,369 Office, Production, Laboratory RMS
4 198,378 Office, Production, Laboratory DST
Total . . . . . . . . . . . . . . . . . . . . . . . . . . 46 2,480,927
Sites—Leased
No. of Total BusinessCountry Sites Square Feet Principal Functions Segment
Australia . . . . . . . . . . . . . . . . . . . . . . . 1 13,570 Office, Production RMSHungary . . . . . . . . . . . . . . . . . . . . . . . . 2 11,550 Office, Production, Laboratory RMSJapan . . . . . . . . . . . . . . . . . . . . . . . . . . 7 77,121 Office, Production, Laboratory RMSNetherlands . . . . . . . . . . . . . . . . . . . . . 1 3,681 Office RMSSpain . . . . . . . . . . . . . . . . . . . . . . . . . . 1 3,228 Office RMSSweden . . . . . . . . . . . . . . . . . . . . . . . . 1 8,073 Sales Office RMSUnited States . . . . . . . . . . . . . . . . . . . . 10 87,256 Office, Production, Laboratory RMS
16 510,390 Office, Production, Laboratory DST
Total . . . . . . . . . . . . . . . . . . . . . . . . . . 39 714,869
Item 3. Legal Proceedings
We are not a party to any material legal proceedings, other than ordinary routine litigationincidental to our business that is not material to our business or financial condition.
Item 4. Submission of Matters to a Vote of Security Holders
None.
Supplementary Item. Executive Officers of the Registrant pursuant to Instruction 3 to Item 401(b) ofRegulation S-K.
Below are the names, ages and principal occupations for the last five years of each our currentexecutive officers. All such persons have been elected to serve until their successors are elected andqualified or until their earlier resignation or removal.
15

Thomas F. Ackerman, age 49, joined us in 1988 with over eleven years of combined publicaccounting and international finance experience. He was named Controller, North America in 1992 andbecame our Vice President and Chief Financial Officer in 1996. In 1999, he was named a Senior VicePresident. He is currently responsible for overseeing our Accounting and Finance Department, as wellas our Information Technology Group. Prior to joining us, Mr. Ackerman was an accountant at ArthurAndersen & Co. Mr. Ackerman received a B.A. in Accounting from the University of Massachusettsand is a certified public accountant.
Christophe Berthoux, age 42, joined us in 1991 as Sales and Marketing Director in France andbecame General Manager of our French operations in 1997. Mr. Berthoux became Vice President ofour European operations in 1999, assuming our Southern Europe operations including Italy, Spain,France and Belgium. In 2002, Mr. Berthoux was promoted to Corporate Vice President and, in additionto his European duties, assumed responsibility for Transgenic Services and Laboratory and ResearchServices worldwide. Mr. Berthoux received a D.V.M. degree from Lyon Veterinary School and anExecutive M.B.A. from Purdue University’s Krannert Graduate School of Management.
James C. Foster, age 53, joined us in 1976 as General Counsel. Over the past 27 years, Mr. Fosterhas held various staff and managerial positions, and was named our President in 1991, Chief ExecutiveOfficer in 1992 and our Chairman in 2000. Mr. Foster received a B.A. from Lake Forest College, aM.S. from the Sloan School of Management at the Massachusetts Institute of Technology, and a J.D.from Boston University School of Law.
Jorg M. Geller, age 49, joined us in 1986 as a production manager in our animal productionfacility in Germany and has had various management positions since then. In 1994, Mr. Geller becameVice President, Charles River Europe, responsible for our activities in Germany and Northern andEastern Europe. In 1997, Mr. Geller assumed responsibility for our avian production unit (SPAFAS).Mr. Geller graduated from the veterinary school in Giessen and received his Ph.D. from the Universityof Hanover. He attended the Advanced Executive Program at the Kellogg School of Management,Northwestern University.
Nancy Gillett, age 48, joined us in 1999 with the acquisition of Sierra Biomedical. Dr. Gillett has19 years of experience as an ACVP board certified pathologist and scientific manager. In 1999, shebecame Senior Vice President and General Manager of our Sierra Biomedical division withresponsibilities for Sierra’s ongoing business operations. In 2002, Dr. Gillett became interim CorporateVice President of Discovery and Development Services and President and General Manager of SierraBiomedical, overseeing operations for our Argus Laboratories, PAI, Redfield Laboratories, SpringbornLaboratories and Worcester Laboratories divisions. In 2003, Dr. Gillett became Corporate VicePresident and General Manager of Drug Discovery and Development. Dr. Gillett received her D.V.Mfrom Washington State University and her Ph.D. from the University of California, Davis.
David P. Johst, age 42, joined us in 1991 as Corporate Counsel and was named Vice President,Human Resources in 1995. He became Vice President, Human Resources and Administration in 1996,and a Senior Vice President in 1999. He is responsible for overseeing our Human Resourcesdepartment, our contract staffing business unit and several other corporate staff departments. Prior tojoining the Company, Mr. Johst was a corporate associate at Boston’s Hale and Dorr. Mr. Johst is agraduate of Dartmouth College, holds an M.B.A. from Northeastern University and received his J.D.from Harvard University Law School.
Real H. Renaud, age 56, joined us in 1964 and has 40 years of research models production andrelated management experience. In 1986, Mr. Renaud became Vice President of Production, withresponsibility for overseeing the Company’s North American small animal operations, and was namedVice President, Worldwide Production in 1990. Mr. Renaud became Vice President and GeneralManager, European and North American Animal Operations in 1996, following a two-year Europeanassignment during which he provided direct oversight to our European operations. In 1999, he became
16
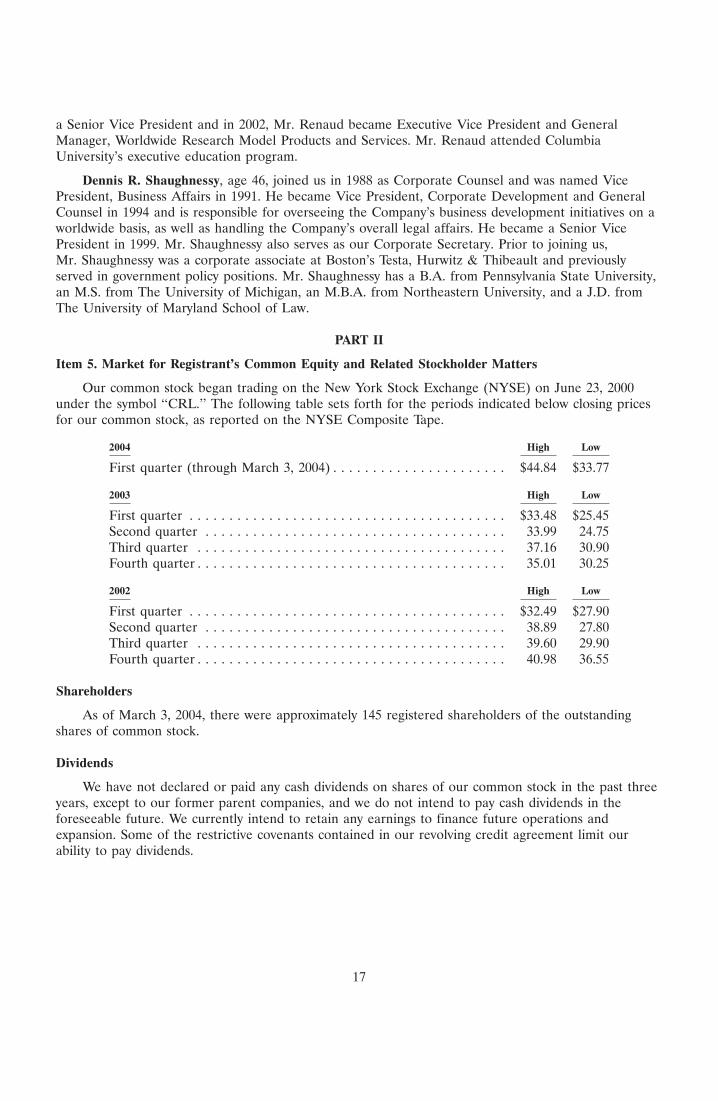
a Senior Vice President and in 2002, Mr. Renaud became Executive Vice President and GeneralManager, Worldwide Research Model Products and Services. Mr. Renaud attended ColumbiaUniversity’s executive education program.
Dennis R. Shaughnessy, age 46, joined us in 1988 as Corporate Counsel and was named VicePresident, Business Affairs in 1991. He became Vice President, Corporate Development and GeneralCounsel in 1994 and is responsible for overseeing the Company’s business development initiatives on aworldwide basis, as well as handling the Company’s overall legal affairs. He became a Senior VicePresident in 1999. Mr. Shaughnessy also serves as our Corporate Secretary. Prior to joining us,Mr. Shaughnessy was a corporate associate at Boston’s Testa, Hurwitz & Thibeault and previouslyserved in government policy positions. Mr. Shaughnessy has a B.A. from Pennsylvania State University,an M.S. from The University of Michigan, an M.B.A. from Northeastern University, and a J.D. fromThe University of Maryland School of Law.
PART II
Item 5. Market for Registrant’s Common Equity and Related Stockholder Matters
Our common stock began trading on the New York Stock Exchange (NYSE) on June 23, 2000under the symbol ‘‘CRL.’’ The following table sets forth for the periods indicated below closing pricesfor our common stock, as reported on the NYSE Composite Tape.
2004 High Low
First quarter (through March 3, 2004) . . . . . . . . . . . . . . . . . . . . . . $44.84 $33.77
2003 High Low
First quarter . . . . . . . . . . . . . . . . . . . . . . . . . . . . . . . . . . . . . . . . $33.48 $25.45Second quarter . . . . . . . . . . . . . . . . . . . . . . . . . . . . . . . . . . . . . . 33.99 24.75Third quarter . . . . . . . . . . . . . . . . . . . . . . . . . . . . . . . . . . . . . . . 37.16 30.90Fourth quarter . . . . . . . . . . . . . . . . . . . . . . . . . . . . . . . . . . . . . . . 35.01 30.25
2002 High Low
First quarter . . . . . . . . . . . . . . . . . . . . . . . . . . . . . . . . . . . . . . . . $32.49 $27.90Second quarter . . . . . . . . . . . . . . . . . . . . . . . . . . . . . . . . . . . . . . 38.89 27.80Third quarter . . . . . . . . . . . . . . . . . . . . . . . . . . . . . . . . . . . . . . . 39.60 29.90Fourth quarter . . . . . . . . . . . . . . . . . . . . . . . . . . . . . . . . . . . . . . . 40.98 36.55
Shareholders
As of March 3, 2004, there were approximately 145 registered shareholders of the outstandingshares of common stock.
Dividends
We have not declared or paid any cash dividends on shares of our common stock in the past threeyears, except to our former parent companies, and we do not intend to pay cash dividends in theforeseeable future. We currently intend to retain any earnings to finance future operations andexpansion. Some of the restrictive covenants contained in our revolving credit agreement limit ourability to pay dividends.
17
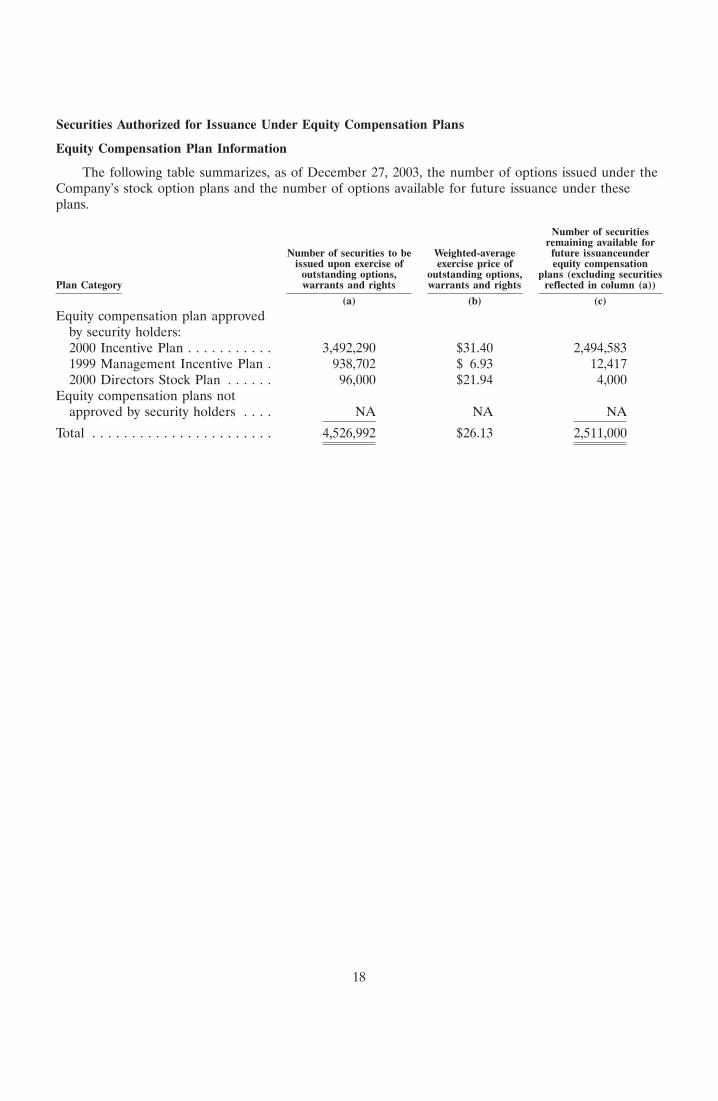
Securities Authorized for Issuance Under Equity Compensation Plans
Equity Compensation Plan Information
The following table summarizes, as of December 27, 2003, the number of options issued under theCompany’s stock option plans and the number of options available for future issuance under theseplans.
Number of securitiesremaining available for
Number of securities to be Weighted-average future issuanceunderissued upon exercise of exercise price of equity compensation
outstanding options, outstanding options, plans (excluding securitiesPlan Category warrants and rights warrants and rights reflected in column (a))
(a) (b) (c)
Equity compensation plan approvedby security holders:2000 Incentive Plan . . . . . . . . . . . 3,492,290 $31.40 2,494,5831999 Management Incentive Plan . 938,702 $ 6.93 12,4172000 Directors Stock Plan . . . . . . 96,000 $21.94 4,000
Equity compensation plans notapproved by security holders . . . . NA NA NA
Total . . . . . . . . . . . . . . . . . . . . . . . 4,526,992 $26.13 2,511,000
18
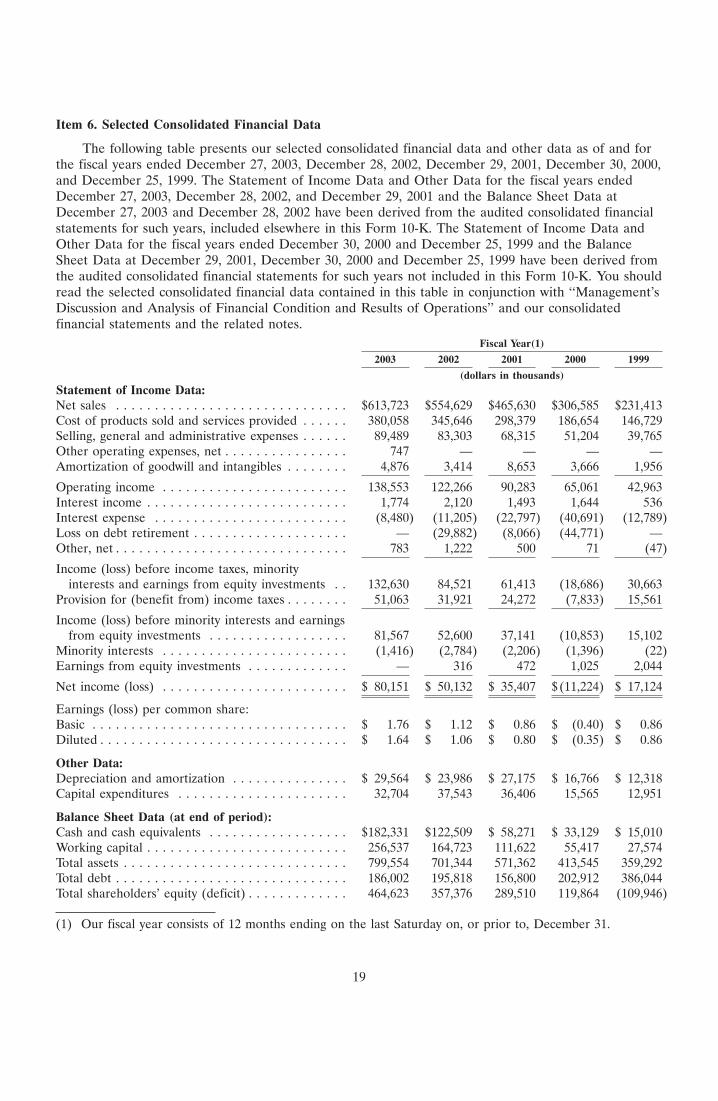
Item 6. Selected Consolidated Financial Data
The following table presents our selected consolidated financial data and other data as of and forthe fiscal years ended December 27, 2003, December 28, 2002, December 29, 2001, December 30, 2000,and December 25, 1999. The Statement of Income Data and Other Data for the fiscal years endedDecember 27, 2003, December 28, 2002, and December 29, 2001 and the Balance Sheet Data atDecember 27, 2003 and December 28, 2002 have been derived from the audited consolidated financialstatements for such years, included elsewhere in this Form 10-K. The Statement of Income Data andOther Data for the fiscal years ended December 30, 2000 and December 25, 1999 and the BalanceSheet Data at December 29, 2001, December 30, 2000 and December 25, 1999 have been derived fromthe audited consolidated financial statements for such years not included in this Form 10-K. You shouldread the selected consolidated financial data contained in this table in conjunction with ‘‘Management’sDiscussion and Analysis of Financial Condition and Results of Operations’’ and our consolidatedfinancial statements and the related notes.
Fiscal Year(1)
2003 2002 2001 2000 1999
(dollars in thousands)Statement of Income Data:Net sales . . . . . . . . . . . . . . . . . . . . . . . . . . . . . . $613,723 $554,629 $465,630 $306,585 $231,413Cost of products sold and services provided . . . . . . 380,058 345,646 298,379 186,654 146,729Selling, general and administrative expenses . . . . . . 89,489 83,303 68,315 51,204 39,765Other operating expenses, net . . . . . . . . . . . . . . . . 747 — — — —Amortization of goodwill and intangibles . . . . . . . . 4,876 3,414 8,653 3,666 1,956
Operating income . . . . . . . . . . . . . . . . . . . . . . . . 138,553 122,266 90,283 65,061 42,963Interest income . . . . . . . . . . . . . . . . . . . . . . . . . . 1,774 2,120 1,493 1,644 536Interest expense . . . . . . . . . . . . . . . . . . . . . . . . . (8,480) (11,205) (22,797) (40,691) (12,789)Loss on debt retirement . . . . . . . . . . . . . . . . . . . . — (29,882) (8,066) (44,771) —Other, net . . . . . . . . . . . . . . . . . . . . . . . . . . . . . . 783 1,222 500 71 (47)
Income (loss) before income taxes, minorityinterests and earnings from equity investments . . 132,630 84,521 61,413 (18,686) 30,663
Provision for (benefit from) income taxes . . . . . . . . 51,063 31,921 24,272 (7,833) 15,561
Income (loss) before minority interests and earningsfrom equity investments . . . . . . . . . . . . . . . . . . 81,567 52,600 37,141 (10,853) 15,102
Minority interests . . . . . . . . . . . . . . . . . . . . . . . . (1,416) (2,784) (2,206) (1,396) (22)Earnings from equity investments . . . . . . . . . . . . . — 316 472 1,025 2,044
Net income (loss) . . . . . . . . . . . . . . . . . . . . . . . . $ 80,151 $ 50,132 $ 35,407 $(11,224) $ 17,124
Earnings (loss) per common share:Basic . . . . . . . . . . . . . . . . . . . . . . . . . . . . . . . . . $ 1.76 $ 1.12 $ 0.86 $ (0.40) $ 0.86Diluted . . . . . . . . . . . . . . . . . . . . . . . . . . . . . . . . $ 1.64 $ 1.06 $ 0.80 $ (0.35) $ 0.86
Other Data:Depreciation and amortization . . . . . . . . . . . . . . . $ 29,564 $ 23,986 $ 27,175 $ 16,766 $ 12,318Capital expenditures . . . . . . . . . . . . . . . . . . . . . . 32,704 37,543 36,406 15,565 12,951
Balance Sheet Data (at end of period):Cash and cash equivalents . . . . . . . . . . . . . . . . . . $182,331 $122,509 $ 58,271 $ 33,129 $ 15,010Working capital . . . . . . . . . . . . . . . . . . . . . . . . . . 256,537 164,723 111,622 55,417 27,574Total assets . . . . . . . . . . . . . . . . . . . . . . . . . . . . . 799,554 701,344 571,362 413,545 359,292Total debt . . . . . . . . . . . . . . . . . . . . . . . . . . . . . . 186,002 195,818 156,800 202,912 386,044Total shareholders’ equity (deficit) . . . . . . . . . . . . . 464,623 357,376 289,510 119,864 (109,946)
(1) Our fiscal year consists of 12 months ending on the last Saturday on, or prior to, December 31.
19
Item 7. Management’s Discussion and Analysis of Financial Condition and Results of Operations
The following discussion should be read in conjunction with our consolidated financial statementsand the related notes.
Overview
We are a leading provider of critical research tools and integrated support services that enableinnovative and efficient drug discovery and development. We are the global leader in providing theanimal research models required in research and development for new drugs, devices and therapies andhave been in business for more than 55 years.
We believe our financial performance in 2003 demonstrated continued strength in our globalbusiness operations. Despite difficult market conditions, we delivered solid revenue growth, improvedoperating margins, strong profitability and excellent cash flow. Total net sales in 2003 were$613.7 million, an increase of 10.7% over the same period last year. Favorable foreign currencytranslation contributed approximately 3.5% to our net sales gain. Our acquisitions of Springborn andBioLabs in 2002 along with the consolidation of our Mexican joint venture contributed 4.1% to our netsales increase over last year. Our gross margin increased to 38.1% of net sales, compared to 37.7% ofnet sales for 2002. Operating income increased 13.3% to $138.6 million in 2003 from $122.3 million in2002 and the operating margin increased to 22.6% compared to 22.0% for 2002. Net income was$80.2 million in 2003 compared to $50.1 million in 2002. Diluted earnings per share for 2003 was $1.64compared to $1.06 in 2002. The 2003 results include a net charge of $0.8 million resulting from anasset impairment charge related to the closure of our biopharmaceutical production facility partiallyoffset by a litigation settlement in our favor related to our French subsidiaries. The 2002 resultsincluded a charge of $29.9 million for the early retirement of debt.
Our products and services are marketed throughout the world. Our international revenues, whichconsists of revenues from our non-U.S. subsidiaries, represented 30.8% of our total net sales in 2003,27.4% in 2002 and 27.3% in 2001. The increase in international revenues during 2003 was principallydue to the strong Euro and Yen. We expect that international revenues will continue to account for asignificant percentage of our revenues for the foreseeable future.
During the fourth quarter of 2003, we revised our consolidated financial reporting segments tobetter reflect the manner in which our operating units are managed. We believe the revision wasappropriate because in 2003 a number of changes were made to align related businesses, to focus salesforce responsibilities and to simplify management structure. We will continue to report two segments,now called Research Models & Services (RMS) and Development & Safety Testing (DST). Theresearch models business will continue to be reported in the RMS segment and transgenic services,laboratory services, contract staffing services and vaccine support products and services will now bereported in the RMS segment. The Company will report development services, including general andspecialty toxicology, pathology services, interventional and surgical services, biosafety testing and in vitrotechnology in the DST segment. The changes in segment presentation have no effect on ourconsolidated revenues or net income. Management believes that the new business segments will betterreflect results of operations and facilitate investors’ understanding of our business. Segment informationfor the prior years has been restated to reflect this change.
Our RMS business segment represented 66.0% of net sales in 2003. Net sales for this segmentincreased 14.5% over the same period in 2002. Favorable foreign currency translation, increased pricingand higher sales of inbred models, immunocompromised models and increased sales for our servicesthat support research models contributed to the net sales gain in 2003. Operating income increased to31.2% of net sales in 2003, compared to 29.0% of net sales for the same period in 2002 primarily dueto improved capacity utilization. In North America and Europe, RMS reported slower sales in the latesummer of 2003, reflecting greater seasonality than we had experienced in 2002. However, RMS sales
20
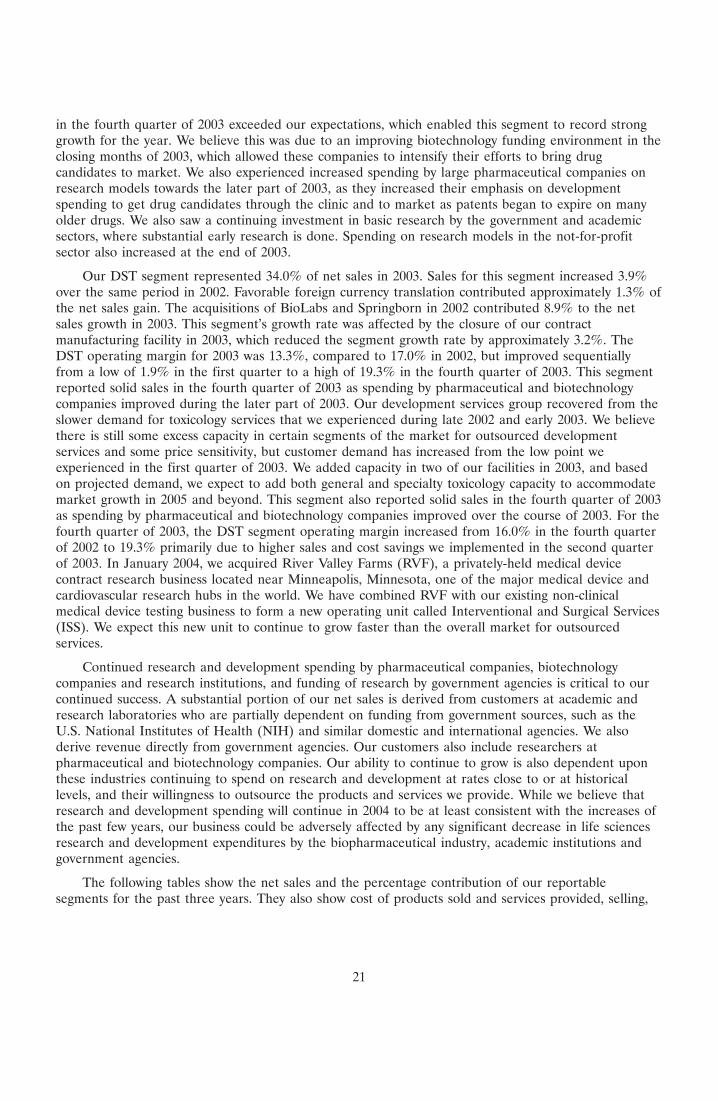
in the fourth quarter of 2003 exceeded our expectations, which enabled this segment to record stronggrowth for the year. We believe this was due to an improving biotechnology funding environment in theclosing months of 2003, which allowed these companies to intensify their efforts to bring drugcandidates to market. We also experienced increased spending by large pharmaceutical companies onresearch models towards the later part of 2003, as they increased their emphasis on developmentspending to get drug candidates through the clinic and to market as patents began to expire on manyolder drugs. We also saw a continuing investment in basic research by the government and academicsectors, where substantial early research is done. Spending on research models in the not-for-profitsector also increased at the end of 2003.
Our DST segment represented 34.0% of net sales in 2003. Sales for this segment increased 3.9%over the same period in 2002. Favorable foreign currency translation contributed approximately 1.3% ofthe net sales gain. The acquisitions of BioLabs and Springborn in 2002 contributed 8.9% to the netsales growth in 2003. This segment’s growth rate was affected by the closure of our contractmanufacturing facility in 2003, which reduced the segment growth rate by approximately 3.2%. TheDST operating margin for 2003 was 13.3%, compared to 17.0% in 2002, but improved sequentiallyfrom a low of 1.9% in the first quarter to a high of 19.3% in the fourth quarter of 2003. This segmentreported solid sales in the fourth quarter of 2003 as spending by pharmaceutical and biotechnologycompanies improved during the later part of 2003. Our development services group recovered from theslower demand for toxicology services that we experienced during late 2002 and early 2003. We believethere is still some excess capacity in certain segments of the market for outsourced developmentservices and some price sensitivity, but customer demand has increased from the low point weexperienced in the first quarter of 2003. We added capacity in two of our facilities in 2003, and basedon projected demand, we expect to add both general and specialty toxicology capacity to accommodatemarket growth in 2005 and beyond. This segment also reported solid sales in the fourth quarter of 2003as spending by pharmaceutical and biotechnology companies improved over the course of 2003. For thefourth quarter of 2003, the DST segment operating margin increased from 16.0% in the fourth quarterof 2002 to 19.3% primarily due to higher sales and cost savings we implemented in the second quarterof 2003. In January 2004, we acquired River Valley Farms (RVF), a privately-held medical devicecontract research business located near Minneapolis, Minnesota, one of the major medical device andcardiovascular research hubs in the world. We have combined RVF with our existing non-clinicalmedical device testing business to form a new operating unit called Interventional and Surgical Services(ISS). We expect this new unit to continue to grow faster than the overall market for outsourcedservices.
Continued research and development spending by pharmaceutical companies, biotechnologycompanies and research institutions, and funding of research by government agencies is critical to ourcontinued success. A substantial portion of our net sales is derived from customers at academic andresearch laboratories who are partially dependent on funding from government sources, such as theU.S. National Institutes of Health (NIH) and similar domestic and international agencies. We alsoderive revenue directly from government agencies. Our customers also include researchers atpharmaceutical and biotechnology companies. Our ability to continue to grow is also dependent uponthese industries continuing to spend on research and development at rates close to or at historicallevels, and their willingness to outsource the products and services we provide. While we believe thatresearch and development spending will continue in 2004 to be at least consistent with the increases ofthe past few years, our business could be adversely affected by any significant decrease in life sciencesresearch and development expenditures by the biopharmaceutical industry, academic institutions andgovernment agencies.
The following tables show the net sales and the percentage contribution of our reportablesegments for the past three years. They also show cost of products sold and services provided, selling,
21
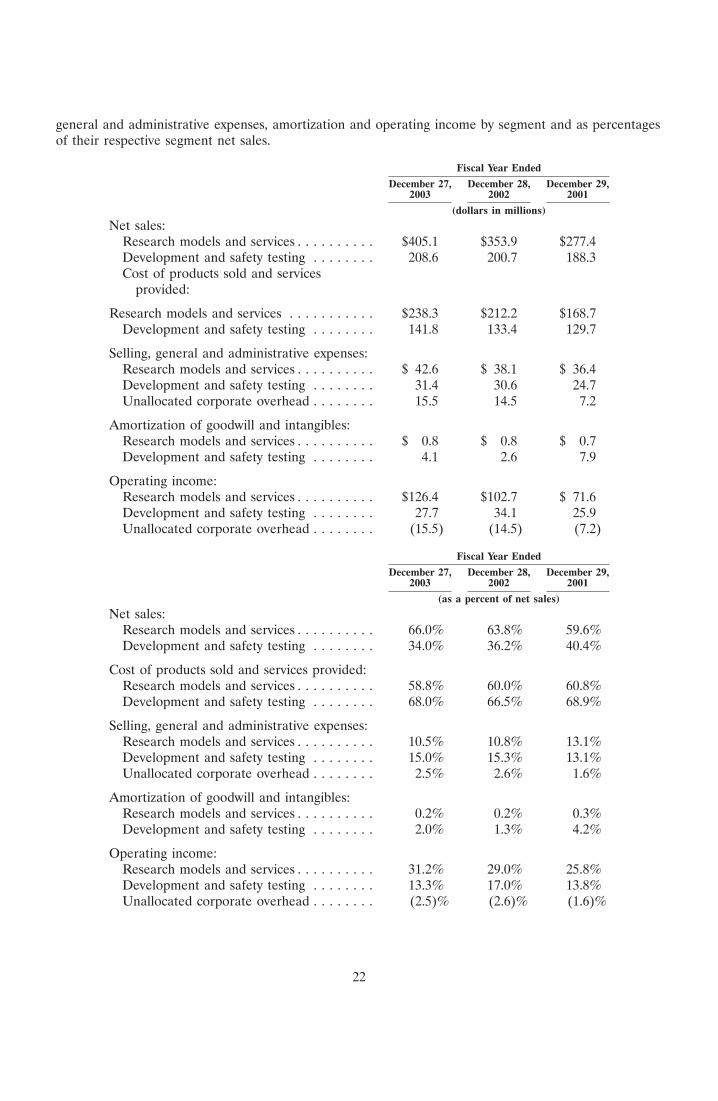
general and administrative expenses, amortization and operating income by segment and as percentagesof their respective segment net sales.
Fiscal Year Ended
December 27, December 28, December 29,2003 2002 2001
(dollars in millions)
Net sales:Research models and services . . . . . . . . . . $405.1 $353.9 $277.4Development and safety testing . . . . . . . . 208.6 200.7 188.3Cost of products sold and services
provided:
Research models and services . . . . . . . . . . . $238.3 $212.2 $168.7Development and safety testing . . . . . . . . 141.8 133.4 129.7
Selling, general and administrative expenses:Research models and services . . . . . . . . . . $ 42.6 $ 38.1 $ 36.4Development and safety testing . . . . . . . . 31.4 30.6 24.7Unallocated corporate overhead . . . . . . . . 15.5 14.5 7.2
Amortization of goodwill and intangibles:Research models and services . . . . . . . . . . $ 0.8 $ 0.8 $ 0.7Development and safety testing . . . . . . . . 4.1 2.6 7.9
Operating income:Research models and services . . . . . . . . . . $126.4 $102.7 $ 71.6Development and safety testing . . . . . . . . 27.7 34.1 25.9Unallocated corporate overhead . . . . . . . . (15.5) (14.5) (7.2)
Fiscal Year Ended
December 27, December 28, December 29,2003 2002 2001
(as a percent of net sales)
Net sales:Research models and services . . . . . . . . . . 66.0% 63.8% 59.6%Development and safety testing . . . . . . . . 34.0% 36.2% 40.4%
Cost of products sold and services provided:Research models and services . . . . . . . . . . 58.8% 60.0% 60.8%Development and safety testing . . . . . . . . 68.0% 66.5% 68.9%
Selling, general and administrative expenses:Research models and services . . . . . . . . . . 10.5% 10.8% 13.1%Development and safety testing . . . . . . . . 15.0% 15.3% 13.1%Unallocated corporate overhead . . . . . . . . 2.5% 2.6% 1.6%
Amortization of goodwill and intangibles:Research models and services . . . . . . . . . . 0.2% 0.2% 0.3%Development and safety testing . . . . . . . . 2.0% 1.3% 4.2%
Operating income:Research models and services . . . . . . . . . . 31.2% 29.0% 25.8%Development and safety testing . . . . . . . . 13.3% 17.0% 13.8%Unallocated corporate overhead . . . . . . . . (2.5)% (2.6)% (1.6)%
22
In our consolidated statements of income, we provide a breakdown of net sales and cost of salesbetween net products and services. Such information is reported irrespective of the business segmentfrom which the sales were generated.
Results of Operations
The following table summarizes historical results of operations as a percentage of net sales for theperiods shown:
Fiscal Year Ended
December 27, December 28, December 29,2003 2002 2001
Net sales . . . . . . . . . . . . . . . . . . . . . . . . . . . . . . . . . . . . . . . . 100.0% 100.0% 100.0%Cost of products sold and services provided . . . . . . . . . . . . . . 61.9% 62.3% 64.1%Selling, general and administrative expenses . . . . . . . . . . . . . . 14.6% 15.0% 14.7%Amortization of goodwill and other intangibles . . . . . . . . . . . . 0.8% 0.6% 1.9%Interest income . . . . . . . . . . . . . . . . . . . . . . . . . . . . . . . . . . . 0.3% 0.4% 0.3%Interest expense . . . . . . . . . . . . . . . . . . . . . . . . . . . . . . . . . . 1.4% 2.0% 4.9%Loss on debt retirement . . . . . . . . . . . . . . . . . . . . . . . . . . . . . — 5.4% 1.7%Provision for income taxes . . . . . . . . . . . . . . . . . . . . . . . . . . . 8.3% 5.8% 5.2%Minority interests . . . . . . . . . . . . . . . . . . . . . . . . . . . . . . . . . 0.2% 0.5% 0.5%Earnings from equity investments . . . . . . . . . . . . . . . . . . . . . . — 0.1% 0.1%
Critical Accounting Policies and Estimates
Management’s Discussion and Analysis of Financial Condition and Results of Operations discussesthe consolidated financial statements of Charles River Laboratories International, Inc. which have beenprepared in accordance with accounting principles generally accepted in the United States. Thepreparation of these financial statements requires management to make estimates and use assumptionsthat affect the reported amounts of assets, liabilities, revenues and expenses during the reportingperiod. On an ongoing basis, management evaluates its estimates and assumptions. Some of thoseestimates can be subjective and complex, consequently actual results could differ from those estimates.Management bases its estimates and assumptions on historical experience and on various other factorsthat are believed to be reasonable under the circumstances, the results of which form the basis formaking judgments about the carrying values of assets and liabilities that are not readily apparent fromother sources. For any given estimate or assumption made by management, there may also be otherestimates or assumptions that are reasonable. However, we believe that given the current facts andcircumstances, it is unlikely that applying any such alternative judgments would materially impact theaccompanying financial statements. Management believes the following critical accounting policies aremost effected by significant judgments and estimates used in the preparation of our consolidatedfinancial statements. The following summary should be read in conjunction with our consolidatedfinancial statements and the related notes included elsewhere in this Form 10-K. We believe our mostcritical accounting policies and estimates include the following:
• Goodwill and other intangible assets
• Revenue recognition
• Pension plan accounting
• Income taxes and deferred tax assets
Goodwill and Other Intangible Assets. As a result of businesses we have acquired, we have materialintangible assets, including goodwill and other identifiable finite and indefinite-lived acquired
23
intangibles. The identification and valuation of these intangible assets and the determination of theestimated useful lives at the time of acquisition, as well as the completion of annual impairment tests,require significant management judgments and estimates. These estimates are made based on, amongothers, consultations with an accredited independent valuation consultant, reviews of projected futureincome and statutory regulations. The use of alternative estimates and assumptions could increase ordecrease the estimated fair value of our goodwill and other intangible assets, and potentially result in adifferent impact to our results of operations. Furthermore, changes in business strategy and/or marketconditions may significantly impact these judgments thereby impacting the fair value of these assets,which could materially impact our results of operations. We performed annual impairment tests in 2003and concluded the goodwill and other indefinite-lived intangible asset balances were not impaired.
Revenue Recognition. We recognize revenue on product and services sales. Recognition of servicerevenue is primarily based on the completion of agreed-upon service procedures including ratespecified contracts and fixed fee contracts. Revenue of agreed-upon rate contracts is recognized asservices are performed, based on rates specified in the contract. Revenue of fixed fee contracts isrecognized as services are performed in accordance with procedures specified by the customers in theform of study protocols. The recognition of service revenue requires management judgments primarilyrelating to the determination of the level of service procedures performed during the period. As ofDecember 27, 2003, we had recorded unbilled revenue of $15.9 million and deferred revenue of$30.8 million in the consolidated balance sheet based on the difference between the estimated level ofservices performed and the billing arrangements within our service contracts.
Pension Plan Accounting. We have significant plan assets, liabilities and expenses based oninformation provided by independent actuaries. The actuaries use assumptions to estimate the totalbenefits ultimately payable to employees and allocate this cost to the service periods. The actuarialassumptions used to calculate pension costs are determined and reviewed annually by managementafter consulting with outside investment advisors and actuaries. The assumed discount rate, which isintended to be the actual rate at which benefits could effectively be settled, is adjusted based on thechange in the long-term treasury bond yield as of the measurement date. As of December 27, 2003 thediscount rate for our U.S. pension plan remained at 6.0%. The estimated effect of a 0.5% movement inthe discount rate would be to change pension expense by $0.5 million in 2004.
The assumed expected return on plan assets is the average return expected on the funds investedor to be invested to provide future benefits to pension plan participants. If the actual return is differentfrom the assumed expected return in plan assets, the difference would be amortized over a period ofapproximately 15 to 20 years. During 2003, we lowered our expected return on plan assets to 8.5%from 9.0% for our U.S. pension plan. This is expected to increase the annual pension expense byapproximately $0.2 million in 2004.
Income Taxes and Deferred Tax Assets. As part of the process of preparing our consolidatedfinancial statements, we are required to estimate our income taxes in each of the jurisdictions in whichwe operate. This process involves estimating our current tax exposure and assessing temporary andpermanent differences resulting from differing treatment of items for tax and accounting purposes.These differences result in deferred tax assets and liabilities, which are included in our consolidatedbalance sheet. As part of our 1999 recapitalization transaction, we elected under Internal RevenueCode Section 338(h)(10) to treat the transaction as a purchase resulting in a step-up in the tax basis ofthe underlying assets. The election resulted in the recognition of a deferred tax asset in 1999 in theamount of $99.5 million for the estimated future tax benefits associated with the increased tax basis ofthe assets. The balance of this deferred tax asset as of December 27, 2003 was $71.6 million.
We must assess the likelihood that our deferred tax assets will be recovered from future taxableincome and, to the extent we believe that recovery is not likely, we must establish a valuationallowance. As of December 27, 2003, a valuation allowance of $4.1 million existed on a total net
24
deferred tax asset of $64.8 million. To the extent we increase this valuation allowance in a period, wemust report the effect as additional tax provision in the consolidated statement of income. A valuationallowance is currently set against deferred tax assets because management believes it is more likely thannot that the deferred tax assets related to certain state net operating loss carryforwards and foreign taxcredit carryforwards will not be realized through the generation of future taxable income. As ofDecember 27, 2003, earnings from non-U.S. subsidiaries considered to be indefinitely reinvested totaled$69.6 million and, accordingly, no provision for U.S. income taxes has been provided thereon.Distribution of those earnings would be subject to U.S. taxes and withholding taxes payable to foreigncountries, however, it is not practicable to estimate the amount of additional tax that might be payableon these undistributed earnings.
Significant management judgment is required in determining our provision for income taxes, ourdeferred tax assets and liabilities and our future taxable income for purposes of assessing our ability torealize any future benefit from our deferred tax assets. The use of alternative estimates andassumptions could increase or decrease our deferred tax assets and materially impact our results ofoperations. Furthermore in the event that actual results differ from management’s estimates or weadjust these estimates in future periods, our operating results and financial position could be materiallyaffected.
In the first quarter of 2004, the Company began a reorganization of its European operations. Thepurpose of the reorganization is to streamline the corporate legal structure in order to improveoperating efficiency and cash management, facilitate acquisitions and provide tax benefits. Thereorganization, which will not involve reductions of personnel or facility closures, is expected to resultin a one-time, non-cash charge to earnings in the first quarter of 2004 of approximately $7,900primarily due to the write-off of a deferred tax asset.
Fiscal 2003 Compared to Fiscal 2002
Net Sales. Net sales in 2003 were $613.7 million, an increase of $59.1 million, or 10.7%, from$554.6 million in 2002. The increase in net sales was primarily due to the increase in sales in our RMSsegment during 2003.
Research Models & Services. In 2003, RMS net sales were $405.1 million, an increase of$51.2 million, or 14.5%, compared to $353.9 million in 2002. Favorable foreign currency translationcontributed approximately 5.6% to our net sales gain. RMS prices increased at certain geographicallocations in a range up to 5% with the weighted average increase of approximately 3%. Increased unitvolume sales of both models and services added approximately 5% to the net sales growth. Researchmodel unit sales increased primarily due to increased demand for our higher-priced specialty units.Sales of our research model services increased in 2003 due to increased pricing, the consolidation ofour Mexican joint venture and an increased market demand. The RMS increase was driven by basicresearch and biotechnology spending, which drove greater demand for our services that supportresearch models, primarily transgenics and laboratory services. This growth reflects the increasingnumber of new disease models being created and the corresponding need for sophisticated housing andrelated high-value services.
25
Development & Safety Testing. In 2003, DST net sales were $208.6 million, an increase of$7.9 million, or 3.9%, from $200.7 million in 2002. Favorable foreign currency translation contributedapproximately 1.3% to our net sales gain. DST sales increased in 2003 primarily due to our 2002acquisitions and an increase in in vitro safety testing sales, partially offset by the impact of reducedmarket demand for toxicology services in early 2003, lower sales in our biosafety testing servicesbusiness, and the closure of our contract manufacturing facility. The acquisitions of BioLabs andSpringborn contributed $17.8 million, or 8.9%, to the net sales growth in 2003. During 2003, DSTexperienced pricing pressures due to decreased demand earlier in the year resulting in a nominal pricedecline for the year. Our development services group recovered from the slower demand for toxicologyservices we experienced during late 2002 and early 2003. We believe there is still some excess capacityin certain segments of the market for outsourced development services, causing lingering pricesensitivity.
Cost of Products Sold and Services Provided. Cost of products sold and services provided in 2003was $380.1 million, an increase of $34.5 million, or 10.0%, from $345.6 million in 2002. Cost ofproducts sold and services provided in 2003 was 61.9% of net sales, compared to 62.3% in 2002. Theincrease in cost of products sold and services provided was due primarily to adverse foreign currencyexchange of approximately 4%, increased product volume and general inflation. The decrease in cost ofproducts sold and services provided as a percentage of net sales was primarily due to better utilizationof existing capacity and greater operating efficiencies.
Research Models & Services. Cost of products sold and services provided for RMS in 2003 was$238.3 million, an increase of $26.1 million, or 12.3%, compared to $212.2 million in 2002. Cost ofproducts sold and services provided as a percentage of net sales decreased to 58.8% in 2003 from60.0% in 2002. The decrease in cost of product sold and services provided as a percentage of net saleswas primarily due to better utilization of existing capacity and greater operating efficiencies, mainly inNorth American and European research models and research models services.
Development & Safety Testing Cost of products sold and services provided for DST in 2003 was$141.8 million, an increase of $8.4 million, or 6.3%, compared to $133.4 million in 2002. Cost ofproducts sold and services provided in 2003 increased to 68.0% of net sales compared to 66.5% of netsales in 2002. The increase in cost of products sold and services provided as a percentage of net saleswas due primarily to decreased sales of certain development services during early 2003, which createdexcess capacity, partially offset by the cost savings initiatives we implemented in 2003.
Selling, General and Administrative Expenses. Selling, general and administrative expenses in 2003were $89.5 million, an increase of $6.2 million, or 7.4%, from $83.3 million in 2002. Selling, generaland administrative expenses in 2003 were 14.6% of net sales compared to 15.0% of net sales in 2002.The increase in selling, general and administrative expenses in 2003 was due primarily to adverseforeign currency exchange, a full year of expenses related to the 2002 acquisitions and inflation,partially offset by the cost savings initiatives we implemented in 2003. The decrease in selling, generaland administrative expenses as a percentage of net sales was primarily due to our ability to manage ourcost increases at a rate slightly lower than our sales growth.
Research Models & Services. Selling, general and administrative expenses for RMS in 2003 were$42.6 million, an increase of $4.5 million, or 11.8%, compared to $38.1 million in 2002. Selling, generaland administrative expenses in 2003 decreased to 10.5% of net sales, compared to 10.8% of net sales in2002. The decrease in selling, general and administrative expenses in 2003 as a percentage of net saleswas primarily due to our efforts to limit our expense growth.
Development & Safety Testing Selling, general and administrative expenses for DST in 2003 were$31.4 million, an increase of $0.8 million compared to $30.6 million in 2002. Selling, general andadministrative expenses in 2003 were 15.0% of net sales, compared to 15.3% in 2002. Selling, general
26
and administrative expenses for 2003 were virtually flat due mainly to the cost savings initiatives weimplemented at the beginning of 2003, partially offset by the full year effect of the acquisitions ofSpringborn and BioLabs.
Unallocated Corporate Overhead. Unallocated corporate overhead, which consists of variouscorporate expenses including those associated with executive salaries and departments such ascorporate accounting, legal and investor relations, was $15.5 million in 2003, compared to $14.5 millionin 2002. The increase in unallocated corporate overhead in 2003 was due to an increased pensionexpense of $2.0 million, partially offset by lower bonuses for 2003.
Other Operating Expenses (Income). During 2003, we recorded a $3.7 million charge associatedwith the write-down of certain contract manufacturing assets. Also during 2003, our French subsidiariessettled a breach of contract claim they had asserted against a customer. After legal and relatedexpenses, the net settlement amounted to a gain of approximately $2.9 million.
Amortization of Other Intangibles. Amortization of other intangibles in 2003 was $4.9 million, anincrease of $1.5 million from $3.4 million in 2002. The increase was due to the full year of amortizationof intangible assets that arose from our 2002 acquisitions of BioLabs and Springborn.
Operating Income. Operating income in 2003 was $138.6 million, an increase of $16.3 million, or13.3%, from $122.3 million in 2002. Operating income in 2003 was 22.6% of net sales, compared to22.0% of net sales in 2002.
Research Models & Services. In 2003, operating income from our RMS segment was$126.4 million, an increase of $23.7 million, or 23.0%, from $102.7 million in 2002. Operating incomein 2003 increased to 31.2% of net sales, compared to 29.0% of net sales in 2002. The increase inoperating income in 2003 was primarily due to increased sales and higher gross margins primarily fromimproved capacity utilization, along with stable selling, general and administrative expenses and thesettlement of the French lawsuit.
Development & Safety Testing In 2003, operating income from our DST segment was $27.7 million,a decrease of $6.4 million, or 18.9%, from $34.1 million in 2002. Operating income from sales of DSTin 2003 was 13.3% of net sales, compared to 17.0% in 2002. The decrease in operating income in 2003was primarily due to the decline in demand for these services which impacted gross margins, a chargerelated to the write-down of certain contract manufacturing assets and a full year of amortization ofintangibles related to the 2002 acquisitions, partially offset by our cost containment program.
Interest Income. Interest income in 2003 was $1.8 million, compared to $2.1 million in 2002. Thelower interest income was due primarily to lower interest rates.
Interest Expense. Interest expense in 2003 was $8.5 million, compared to $11.2 million in 2002.The $2.7 million decrease was primarily due to the early retirement of debt.
Loss on Debt Retirement. In 2002, we recorded a loss of $29.9 million relating to premiums paidand the write-off of deferred financing costs and issuance discount in connection with the tender offerfor all of our remaining 13.5% senior subordinated notes, other debt repayments and the terminationof our revolving credit facility.
Other Income. Other income for 2003 was $0.8 million compared to $1.2 million for 2002. Thedecrease was primarily due to lower net foreign currency gains then in 2002.
Income Taxes. The effective tax rate for 2003 was 38.5% compared to the 2002 rate of 37.8%,which included a $0.5 million benefit associated with the release of a valuation allowance in 2002.During 2002, we reassessed the valuation allowance on the deferred tax asset associated with state net
27
operating loss carryforwards due to state tax planning initiatives and the completion of the 2001 stateincome tax returns.
Net Income. Net income in 2003 was $80.2 million, an increase of $30.1 million or 59.9%, from$50.1 million in 2002.
Fiscal 2002 Compared to Fiscal 2001
Net Sales. Net sales in 2002 were $554.6 million, an increase of $89.0 million, or 19.1%, from$465.6 million in 2001.
Research Models and Services. In 2002, net sales from our RMS segment were $353.9 million, anincrease of $76.5 million, or 27.6%, from $277.4 million in 2001. Favorable foreign currency translationcontributed approximately 0.8% to our net sales gain. RMS global prices increased in a range up to 5%with the average approximately 3%. Increased unit volume sales of both models and services addedapproximately 24% to net sales increase. Sales of our research models increased due to an increase inunit volume and a shift in demand to higher-priced research models, additional sales from our 2001acquisition of Genetic Models, Inc. (GMI) and increased sales of unique specialty models through ourcooperative agreement with The Jackson Laboratory. Sales of our research model services increased in2002 due to strong sales growth from our transgenics and contract staffing businesses, increased pricingand the consolidation of our Mexican joint venture.
Development & Safety Testing In 2002, net sales from our DST segment were $200.7 million, anincrease of $12.4 million, or 6.6%, compared to $188.3 million in 2001. The increase was due tocontinued growth in outsourcing in the pharmaceutical industry, expanded in vitro sales and theacquisitions of BioLabs and Springborn which contributed $9.7 million, or 5.1%, partially offset byreduced business at our contract manufacturing facility.
Cost of Products Sold and Services Provided. Cost of products sold and services provided in 2002was $345.6 million, an increase of $47.2 million, or 15.8%, from $298.4 million in 2001. Cost ofproducts sold and services provided in 2002 was 62.3% of net sales, compared to 64.1% in 2001 withthe improvement due to operating improvements in both RMS and DST. The decrease in cost ofproducts sold and services provided as a percentage of net sales was due primarily to better utilizationof existing capacity and greater operating efficiencies.
Research Models and Services. Cost of products sold and services provided for RMS in 2002 was$212.2 million, an increase of $43.5 million, or 25.8%, compared to $168.7 million in 2001. Cost ofproducts sold and services provided in 2002 improved to 60.0% of net sales compared to 60.8% of netsales in 2001. The decrease in cost of products sold and services provided as a percentage of net saleswas primarily due to better utilization of existing capacity and greater operating efficiencies in Europedue to the closure of one of our facilities in France in 2001.
Development & Safety Testing Cost of products sold and services provided for DST in 2002 was$133.4 million, an increase of $3.7 million, or 2.9%, compared to $129.7 million in 2001. Cost ofproducts sold and services provided as a percentage of net sales was 66.5% in 2002, compared to 68.9%in 2001. The decrease in cost of products sold and services provided as a percentage of net sales wasprimarily due to greater operating efficiencies.
Selling, General and Administrative Expenses. Selling, general and administrative expenses in 2002were $83.3 million, an increase of $15.0 million, or 21.9%, from $68.3 million in 2001. Selling, generaland administrative expenses in 2002 were 15.0% of net sales compared to 14.7% of net sales in 2001.The increase was due primarily to expenses associated with corporate overhead, the 2002 acquisitionsand foreign exchange. The increase in selling, general and administrative expenses as a percentage of
28
net sales was primarily due to the increase in unallocated corporate overhead, partially offset byimprovements in selling, general and administrative expenses in RMS.
Research Models and Services. Selling, general and administrative expenses for RMS in 2002 were$38.1 million, an increase of $1.7 million, or 4.8%, compared to $36.4 million in 2001. Selling, generaland administrative expenses in 2002 were 10.8% of net sales, compared to 13.1% in 2001. The decreasein selling, general and administrative as a percentage of sales in 2002 was principally due to costsavings from greater economies of scale and a charge of $1.5 million associated with the closure of oneof our French facilities in 2001.
Development & Safety Testing Selling, general and administrative expenses for DST in 2002 were$30.6 million, an increase of $5.9 million, or 24.0%, compared to $24.7 million in 2001. Selling, generaland administrative expenses in 2002 increased to 15.3% of net sales, compared to 13.1% of net sales in2001. The increase in selling, general and administrative expenses as a percent of sales in 2002 was dueprimarily to increased sales and marketing costs to more aggressively sell and support our products.
Unallocated Corporate Overhead. Unallocated corporate overhead, which consists of variouscorporate expenses including those associated with senior executive salaries and departments such ascorporate accounting, legal and investor relations, was $14.5 million in 2002, compared to $7.2 millionin 2001. The substantial increase in unallocated corporate overhead in 2002 was caused by decreasedpension income of $3.2 million as well as additional costs incurred in investor relations, externalreporting, internal audit and legal due to our continued growth as a public company.
Amortization of Goodwill and Other Intangibles. Amortization of goodwill and other intangibles in2002 was $3.4 million, a decrease of $5.3 million, from $8.7 million in 2001. The Company ceasedamortization of goodwill and indefinite-lived intangible assets upon the adoption of SFAS No. 142,‘‘Goodwill and Other Intangible Assets’’ as of the beginning of 2002. We completed the goodwill andindefinite-lived intangible assets impairment test for 2002, which identified no impairment.
Operating Income. Operating income in 2002 was $122.3 million, an increase of $32.0 million, or35.4%, from $90.3 million in 2001. Operating income in 2002 was 22.0% of net sales, compared to19.4% of net sales in 2001.
Research Models and Services. In 2002, operating income for our RMS segment was$102.7 million, an increase of $31.1 million, or 43.4%, from $71.6 million in 2001. Operating income asa percentage of net sales in 2002 was 29.0%, compared to 25.8% in 2001. The increase was primarilydue to increased sales and higher gross margins primarily from improved capacity utilization.
Development & Safety Testing. In 2002, operating income for our DST segment was $34.1 million,an increase of $8.2 million, or 31.6%, from $25.9 million in 2001. Operating income as a percentage ofnet sales increased to 17.0%, compared to 13.8% of net sales in 2001. The increase in operatingincome in 2002 was primarily due to the improved gross margin and the decrease in amortizationexpense as a result of our adoption of SFAS No. 142.
Interest Expense. Interest expense in 2002 was $11.2 million, compared to $22.8 million in 2001.The $11.6 million decrease was primarily due to the impact of our tender offer for the 13.5% seniorsubordinated notes completed during 2002, the repayment of all of the term loans during 2002, and thelower interest on our 3.5% senior convertible debentures.
Loss on Debt Retirement. During 2002 and 2001, we recorded a loss of $29.9 million and$8.1 million, respectively, relating to premiums paid and the write-off of deferred financing costs andissuance discount in connection with the tender offer for all of our remaining 13.5% seniorsubordinated notes, other debt repayments and the termination of the revolving credit facility. On prioryear financial statements, this loss was recorded as an extraordinary item.
29
Other Income. Other income for 2002 was $1.2 million compared to $0.5 million for 2001. Theincrease was primarily due to net foreign currency gains.
Income Taxes. The effective tax rate for 2002 was 37.8%, which included a $0.5 million benefitassociated with the release of a valuation allowance related to state income taxes and the completion ofthe 2001 tax returns, compared to the effective tax rate of 39.5% for 2001. The decrease in theeffective tax rate was due to the lower tax rate of BioLabs, an Irish company, which we acquired in2002.
Net Income. Net income in 2002 was $50.1 million, an increase of $14.7 million from $35.4 millionin 2001.
Liquidity and Capital Resources
The following discussion analyzes liquidity and capital resources by operating, investing andfinancing activities as presented in our condensed consolidated statements of cash flows.
Our principal sources of liquidity are cash flows from operations, our revolving line of creditarrangements, and proceeds from our debt and equity offerings.
On March 31, 2003, we entered into a revolving credit agreement which matures on March 31,2006. The agreement permits us to borrow up to $100.0 million at an interest rate based on, at theCompany’s option, the greatest of the Prime Rate, the Base CD Rate plus 1%, and the Federal FundsEffective Rate plus 0.5%, or LIBOR multiplied by the Statutory Reserve Rate plus a spread of 1.25%to 2.50% based on our leverage ratio and the aggregate borrowing under the revolving creditagreement. Interest is payable based on our option of interest rate selected, which ranges from monthlyto semi-annually. The credit agreement requires us to pay a quarterly commitment fee which rangesfrom 25 through 50 basis points on the undrawn balance, based on our leverage ratio. The agreementalso requires us to remain in compliance with certain financial ratios as well as other restrictivecovenants. Some of the restrictive covenants limit our ability to acquire companies, increase our debtand pay dividends. There were no amounts outstanding under the credit agreement as of December 27,2003.
Effective January 2, 2003, we acquired an additional 19% of the equity (404,321 common shares)of our then 66% equity joint venture company, Charles River Japan, from Ajinomoto Company, Inc.The purchase price for the equity was 1.3 billion yen, or $10.8 million, which was paid in cash.
In connection with the acquisition of Springborn in 2002, we entered into a $6.0 million three-yearunsecured subordinated note. The note was payable in three equal annual installments of principal,together with interest accrued in arrears commencing on October 1, 2003. The note was repaid in fullearly during 2003.
On January 24, 2002, we issued $175.0 million par value of senior convertible debentures through aprivate placement offering. On February 11, 2002, we issued an additional $10.0 million par value ofthe senior convertible debentures through the additional purchase option. The senior convertibledebentures accrue interest at an initial annual rate of 3.5% which will be reset (but not below theinitial rate of 3.5% or above 5.25%) on August 1, 2007, August 1, 2012 and August 1, 2016. Interest ispayable semi-annually in arrears, beginning August 1, 2002. The senior convertible debentures willmature in 2022 and are convertible into shares of our common stock at a fixed conversion price of$38.87, subject to adjustments under certain circumstances. On or after February 5, 2005, we mayredeem for cash all or part of the debentures that have not been previously converted at theredemption prices set forth in the purchase agreement. Holders may require us to repurchase for cashall or part of their debentures on February 1, 2008, February 1, 2013 or February 1, 2017 at a priceequal to 100% of the principal amount of the debentures plus accrued interest. In addition, upon achange in control of our Company occurring on or prior to February 1, 2022, each holder may require
30
us to repurchase all or a portion of such holder’s debentures for cash. In 2002, we used a portion ofthe net proceeds from the senior convertible debenture offering to retire all of the 13.5% seniorsubordinated notes through a tender offer.
During 2002, we repaid our outstanding senior secured term loan facilities and terminated ourrevolving credit facility. As a result of the termination of our revolving credit facility, we were requiredto transfer $5.0 million into a separate bank account to support outstanding letters of credit. Thisamount was reported as restricted cash in our consolidated financial statements as of December 28,2002. During the second quarter of 2003, the restriction was lifted due to the new revolving creditagreement entered into by the Company. As of December 27, 2003 and December 28, 2002, we hadapproximately $5.3 million and $4.7 million outstanding under letters of credit, respectively.
On July 25, 2001, we consummated a public offering of 2,000,000 shares of our common stock at aprice of $29.00 per share. We received net proceeds of approximately $54.5 million, which we used torepay a portion of our indebtedness and retire obligations incurred in connection with acquisitionsmade in 2001.
On March 21, 2001, we consummated a public offering of 3,500,000 shares of our common stock ata price of $19.00 per share. We received net proceeds of approximately $62.2 million, which we used torepay a portion of our indebtedness and retire obligations incurred in connection with acquisitionsmade in 2001.
We anticipate that our operating cash flows will be sufficient to meet our anticipated futureoperating expenses, capital expenditures and debt service obligations as they become due. We currentlyintend to retain any earnings to finance future operations, expansion and acquisitions. Charles RiverLaboratories International, Inc. is a holding company with ownership of 100% of the common stock ofits subsidiary, Charles River Laboratories, Inc. In order to repay our obligations, we are dependentupon either dividends from Charles River Laboratories, Inc., which are restricted by terms contained inthe agreement governing the revolving credit facility, or through a refinancing or equity transaction.
Fiscal 2003 Compared to Fiscal 2002
Cash and cash equivalents totaled $182.3 million at December 27, 2003, compared to$122.5 million at December 28, 2002.
Net cash provided by operating activities in 2003 and 2002 was $123.8 million and $133.7 million,respectively. The decrease in cash provided by operations was primarily a result of the increase inaccounts receivable and decrease in accrued compensation partially offset by the utilization of ourdeferred tax asset. Our days sales outstanding increased to 67 days as of December 27, 2003, comparedto 64 days as of December 28, 2002. In addition, in 2002 we had a significant improvement in DSO,which added $11.7 million to cash flow.
Net cash used in investing activities in 2003 and 2002 was $63.4 million and $78.9 million,respectively. In 2003 we used $32.7 million for capital expenditures, $21.8 million for the purchase ofmarketable securities and $10.8 million for the acquisition of an additional 19% of the equity ofCharles River Japan. This compared to 2002 during which we used net cash of $42.5 million to acquireBioLabs and Springborn and $37.5 million for capital expenditures. In 2003, we made capitalexpenditures in RMS and DST which were $23.0 million and $9.7 million, respectively. We anticipatethat the future capital expenditures will be funded by cash provided by operating activities. For 2004,we project capital expenditure to be approximately $40 million. We continue to evaluate acquisitions toserve as growth platforms as evidenced by our acquisition of RVF in January 2004. We have variousoptions for financing future acquisitions, including our existing cash and investments, cash flowprovided by operations, and our ability to raise capital through debt and equity financing.
31
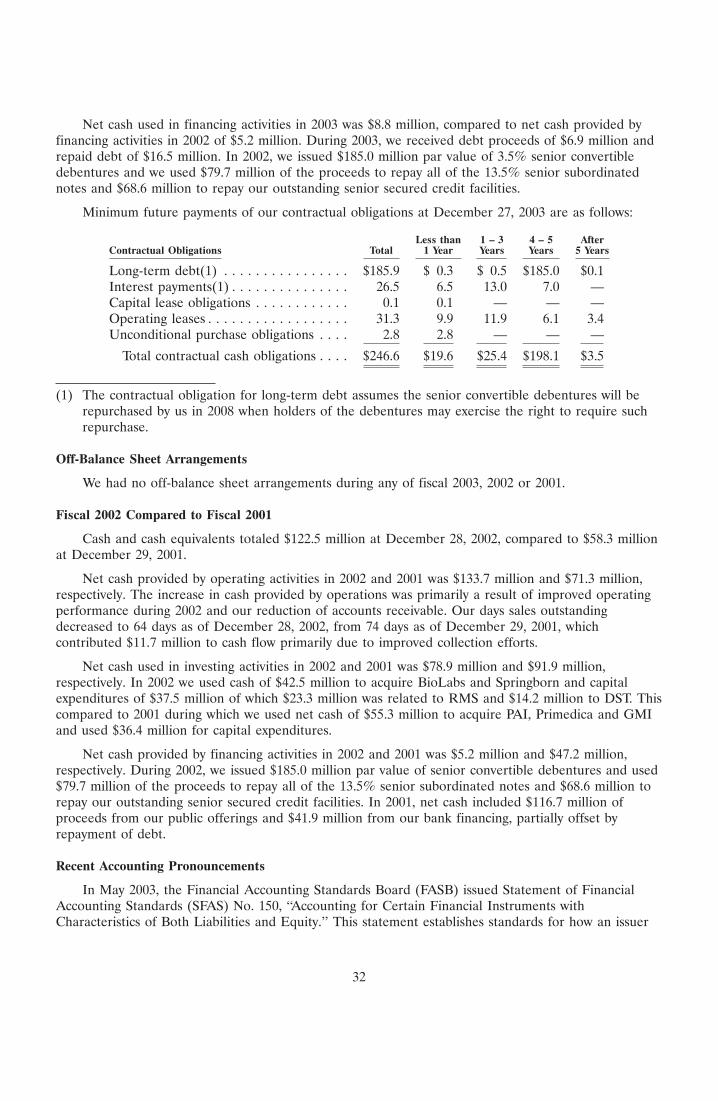
Net cash used in financing activities in 2003 was $8.8 million, compared to net cash provided byfinancing activities in 2002 of $5.2 million. During 2003, we received debt proceeds of $6.9 million andrepaid debt of $16.5 million. In 2002, we issued $185.0 million par value of 3.5% senior convertibledebentures and we used $79.7 million of the proceeds to repay all of the 13.5% senior subordinatednotes and $68.6 million to repay our outstanding senior secured credit facilities.
Minimum future payments of our contractual obligations at December 27, 2003 are as follows:
Less than 1 – 3 4 – 5 AfterContractual Obligations Total 1 Year Years Years 5 Years
Long-term debt(1) . . . . . . . . . . . . . . . . $185.9 $ 0.3 $ 0.5 $185.0 $0.1Interest payments(1) . . . . . . . . . . . . . . . 26.5 6.5 13.0 7.0 —Capital lease obligations . . . . . . . . . . . . 0.1 0.1 — — —Operating leases . . . . . . . . . . . . . . . . . . 31.3 9.9 11.9 6.1 3.4Unconditional purchase obligations . . . . 2.8 2.8 — — —
Total contractual cash obligations . . . . $246.6 $19.6 $25.4 $198.1 $3.5
(1) The contractual obligation for long-term debt assumes the senior convertible debentures will berepurchased by us in 2008 when holders of the debentures may exercise the right to require suchrepurchase.
Off-Balance Sheet Arrangements
We had no off-balance sheet arrangements during any of fiscal 2003, 2002 or 2001.
Fiscal 2002 Compared to Fiscal 2001
Cash and cash equivalents totaled $122.5 million at December 28, 2002, compared to $58.3 millionat December 29, 2001.
Net cash provided by operating activities in 2002 and 2001 was $133.7 million and $71.3 million,respectively. The increase in cash provided by operations was primarily a result of improved operatingperformance during 2002 and our reduction of accounts receivable. Our days sales outstandingdecreased to 64 days as of December 28, 2002, from 74 days as of December 29, 2001, whichcontributed $11.7 million to cash flow primarily due to improved collection efforts.
Net cash used in investing activities in 2002 and 2001 was $78.9 million and $91.9 million,respectively. In 2002 we used cash of $42.5 million to acquire BioLabs and Springborn and capitalexpenditures of $37.5 million of which $23.3 million was related to RMS and $14.2 million to DST. Thiscompared to 2001 during which we used net cash of $55.3 million to acquire PAI, Primedica and GMIand used $36.4 million for capital expenditures.
Net cash provided by financing activities in 2002 and 2001 was $5.2 million and $47.2 million,respectively. During 2002, we issued $185.0 million par value of senior convertible debentures and used$79.7 million of the proceeds to repay all of the 13.5% senior subordinated notes and $68.6 million torepay our outstanding senior secured credit facilities. In 2001, net cash included $116.7 million ofproceeds from our public offerings and $41.9 million from our bank financing, partially offset byrepayment of debt.
Recent Accounting Pronouncements
In May 2003, the Financial Accounting Standards Board (FASB) issued Statement of FinancialAccounting Standards (SFAS) No. 150, ‘‘Accounting for Certain Financial Instruments withCharacteristics of Both Liabilities and Equity.’’ This statement establishes standards for how an issuer
32

classifies and measures certain financial instruments with characteristics of both liabilities and equity.SFAS No. 150 is effective for financial instruments entered into or modified after May 31, 2003 andotherwise is effective at the beginning of the first interim period beginning after June 15, 2003. Thisstatement does not result in any material change to our existing reporting. Our joint ventureagreements are renewable by mutual agreement of the parties upon termination of the initial terms.
In November 2002, the FASB issued FASB Interpretation No. 45 (FIN 45), ‘‘Guarantor’sAccounting and Disclosure Requirements for Guarantees, Including Indirect Guarantees ofIndebtedness of Others, an interpretation of SFAS Nos. 5, 57, and 107 and Rescission of FASBInterpretation No. 34.’’ FIN 45 clarifies the requirements of SFAS No. 5, ‘‘Accounting forContingencies,’’ relating to the guarantor’s accounting for, and disclosure of, the issuance of certaintypes of guarantees. FIN 45 requires that, upon issuance of a guarantee, the guarantor must recognizea liability for the fair value of the obligation. FIN 45 is applicable to guarantees that encompassguarantees based on changes in an underlying asset, liability or equity security, guarantees that aremade on behalf of another entity’s performance, certain indemnification agreements and indirectguarantees of the indebtedness of others. The recognition and measurement provisions of FIN 45 areeffective prospectively for guarantees issued or modified after December 31, 2002. The disclosurerequirements are effective for reporting periods ending after December 15, 2002. The adoption of thestandard did not have any material effect on our consolidated financial statements.
In November 2002, the Emerging Issues Task Force (EITF) reached final consensus on EITF IssueNo. 00-21, ‘‘Accounting for Revenue Arrangements with Multiple Deliverables.’’ EITF Issue No. 00-21addresses certain aspects of a vendor’s accounting for arrangements under which it will performmultiple revenue-generating activities. It provides additional guidance as to how revenue should bemeasured and allocated to the separate units of accounting. EITF Issue No. 00-21 is effectiveprospectively for revenue arrangements entered into during fiscal periods beginning after June 15, 2003.The adoption of the standard did not have a material effect on our consolidated financial statements.
In January 2003, FASB issued Interpretation No. 46 (FIN 46), ‘‘Consolidation of Variable InterestEntities,’’ which clarifies the application of Accounting Research Bulletin (ARB) No. 51, ‘‘ConsolidatedFinancial Statements,’’ relating to consolidation of certain entities. First, FIN 46 will requireidentification of our participation in variable interest entities (VIE), which are defined as entities with alevel of invested equity that is not sufficient to fund future activities to permit them to operate on astand alone basis, or whose equity holders lack certain characteristics of a controlling financial interest.Then, for entities identified as VIE, FIN 46 sets forth a model to evaluate potential consolidationbased on an assessment of which party to the VIE, if any, bears a majority of the exposure to itsexpected losses, or stands to gain from a majority of its expected returns. In December 2003, the FASBissued a revised FIN 46 to defer the effective date and provide further clarification on theinterpretation. FIN 46R is effective for public companies in the first fiscal period after December 15,2003. We are currently evaluating the effect that the adoption of FIN 46 will have on its results ofoperations and financial condition.
Item 7A. Quantitative and Qualitative Disclosure About Market Risk
Certain of our financial instruments are subject to market risks, including interest rate risk andforeign currency exchange rates. We generally do not use financial instruments for trading or otherspeculative purposes.
Interest Rate Risk
The fair value of our marketable securities is subject to interest rate risk and will fall in value ifmarket interest rates increase. If market rates were to increase immediately and uniformly by 100 basis
33

points from levels at December 27, 2003, the fair value of the portfolio would decline by approximately$0.1 million.
The fair value of long-term fixed interest rate debt is subject to interest rate risk. In addition, thefair value of our senior convertible debentures would be impacted by our stock price. The estimatedfair value of our long-term debt at December 27, 2003 was $198.1 million. Fair values were determinedfrom available market prices, using current interest rates and terms to maturity.
Our senior convertible debentures accrue interest at an initial rate of 3.5%, which will be reset(but not below the initial rate of 3.5% or above 5.25%) on August 1, 2007, August 1, 2012 andAugust 1, 2016. Fluctuations in interest rates will not affect the interest payable on the seniorconvertible debentures, which is fixed through August 1, 2007.
Foreign Currency Exchange Rate
We also have exposure to some foreign currency exchange rate fluctuations for the cash flowsreceived from our foreign affiliates. This risk is mitigated by the fact that their operations areprincipally conducted in their respective local currencies.
34

Item 8. Financial Statements and Supplementary Data
INDEXPage
Consolidated Financial Statements:Report of Independent Auditors . . . . . . . . . . . . . . . . . . . . . . . . . . . . . . . . . . . . . . . . . . . . . . 36Consolidated Statements of Income for the years ended December 27, 2003,
December 28, 2002 and December 29, 2001 . . . . . . . . . . . . . . . . . . . . . . . . . . . . . . . . . . . . 37Consolidated Balance Sheets as of December 27, 2003 and December 28, 2002 . . . . . . . . . . . . 38Consolidated Statements of Cash Flows for the years ended December 27, 2003,
December 28, 2002 and December 29, 2001 . . . . . . . . . . . . . . . . . . . . . . . . . . . . . . . . . . . . 39Consolidated Statements of Changes in Shareholders’ Equity for the years ended
December 27, 2003, December 28, 2002 and December 29, 2001 . . . . . . . . . . . . . . . . . . . . . 40Notes to Consolidated Financial Statements . . . . . . . . . . . . . . . . . . . . . . . . . . . . . . . . . . . . . 41
Financial Statement Schedules:Schedule I. Condensed Parent Company Financial Statements . . . . . . . . . . . . . . . . . . . . . . . . 77Schedule II. Valuation and Qualifying Accounts . . . . . . . . . . . . . . . . . . . . . . . . . . . . . . . . . . . 81
Supplementary Data:Quarterly Information (Unaudited) . . . . . . . . . . . . . . . . . . . . . . . . . . . . . . . . . . . . . . . . . . . . 82
35
Report of Independent Auditors
To the Board of Directors and Shareholders ofCharles River Laboratories International, Inc.:
In our opinion, the consolidated financial statements listed in the accompanying index present fairly, inall material respects, the financial position of Charles River Laboratories International, Inc. and itssubsidiaries at December 27, 2003 and December 28, 2002, and the results of their operations and theircash flows for each of the three years in the period ended December 27, 2003 in conformity withaccounting principles generally accepted in the United States of America. In addition, in our opinion,the financial statement schedules listed in the accompanying index present fairly, in all materialrespects, the information set forth therein when read in conjunction with the related consolidatedfinancial statements. These financial statements and financial statement schedules are the responsibilityof the Company’s management; our responsibility is to express an opinion on these financial statementsand financial statement schedules based on our audits. We conducted our audits of these statements inaccordance with auditing standards generally accepted in the United States of America, which requirethat we plan and perform the audit to obtain reasonable assurance about whether the financialstatements are free of material misstatement. An audit includes examining, on a test basis, evidencesupporting the amounts and disclosures in the financial statements, assessing the accounting principlesused and significant estimates made by management, and evaluating the overall financial statementpresentation. We believe that our audits provide a reasonable basis for our opinion.
As discussed in Note 1 to the consolidated financial statements, the Company adopted FinancialAccounting Standards Board Statement of Financial Accounting Standards No. 142, ‘‘Goodwill andOther Intangible Assets,’’ and changed its method of accounting for goodwill and other intangibleassets as of December 30, 2001.
PricewaterhouseCoopers LLP
Boston, MassachusettsFebruary 6, 2004
36
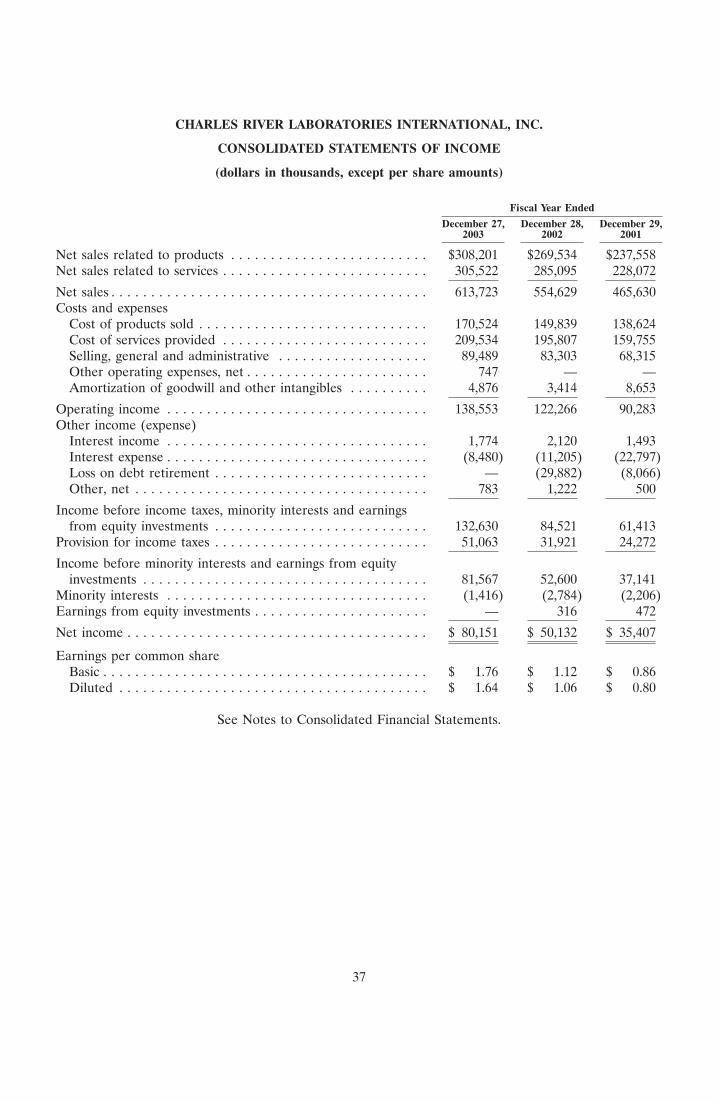
CHARLES RIVER LABORATORIES INTERNATIONAL, INC.
CONSOLIDATED STATEMENTS OF INCOME
(dollars in thousands, except per share amounts)
Fiscal Year Ended
December 27, December 28, December 29,2003 2002 2001
Net sales related to products . . . . . . . . . . . . . . . . . . . . . . . . . $308,201 $269,534 $237,558Net sales related to services . . . . . . . . . . . . . . . . . . . . . . . . . . 305,522 285,095 228,072
Net sales . . . . . . . . . . . . . . . . . . . . . . . . . . . . . . . . . . . . . . . . 613,723 554,629 465,630Costs and expenses
Cost of products sold . . . . . . . . . . . . . . . . . . . . . . . . . . . . . 170,524 149,839 138,624Cost of services provided . . . . . . . . . . . . . . . . . . . . . . . . . . 209,534 195,807 159,755Selling, general and administrative . . . . . . . . . . . . . . . . . . . 89,489 83,303 68,315Other operating expenses, net . . . . . . . . . . . . . . . . . . . . . . . 747 — —Amortization of goodwill and other intangibles . . . . . . . . . . 4,876 3,414 8,653
Operating income . . . . . . . . . . . . . . . . . . . . . . . . . . . . . . . . . 138,553 122,266 90,283Other income (expense)
Interest income . . . . . . . . . . . . . . . . . . . . . . . . . . . . . . . . . 1,774 2,120 1,493Interest expense . . . . . . . . . . . . . . . . . . . . . . . . . . . . . . . . . (8,480) (11,205) (22,797)Loss on debt retirement . . . . . . . . . . . . . . . . . . . . . . . . . . . — (29,882) (8,066)Other, net . . . . . . . . . . . . . . . . . . . . . . . . . . . . . . . . . . . . . 783 1,222 500
Income before income taxes, minority interests and earningsfrom equity investments . . . . . . . . . . . . . . . . . . . . . . . . . . . 132,630 84,521 61,413
Provision for income taxes . . . . . . . . . . . . . . . . . . . . . . . . . . . 51,063 31,921 24,272
Income before minority interests and earnings from equityinvestments . . . . . . . . . . . . . . . . . . . . . . . . . . . . . . . . . . . . 81,567 52,600 37,141
Minority interests . . . . . . . . . . . . . . . . . . . . . . . . . . . . . . . . . (1,416) (2,784) (2,206)Earnings from equity investments . . . . . . . . . . . . . . . . . . . . . . — 316 472
Net income . . . . . . . . . . . . . . . . . . . . . . . . . . . . . . . . . . . . . . $ 80,151 $ 50,132 $ 35,407
Earnings per common shareBasic . . . . . . . . . . . . . . . . . . . . . . . . . . . . . . . . . . . . . . . . . $ 1.76 $ 1.12 $ 0.86Diluted . . . . . . . . . . . . . . . . . . . . . . . . . . . . . . . . . . . . . . . $ 1.64 $ 1.06 $ 0.80
See Notes to Consolidated Financial Statements.
37
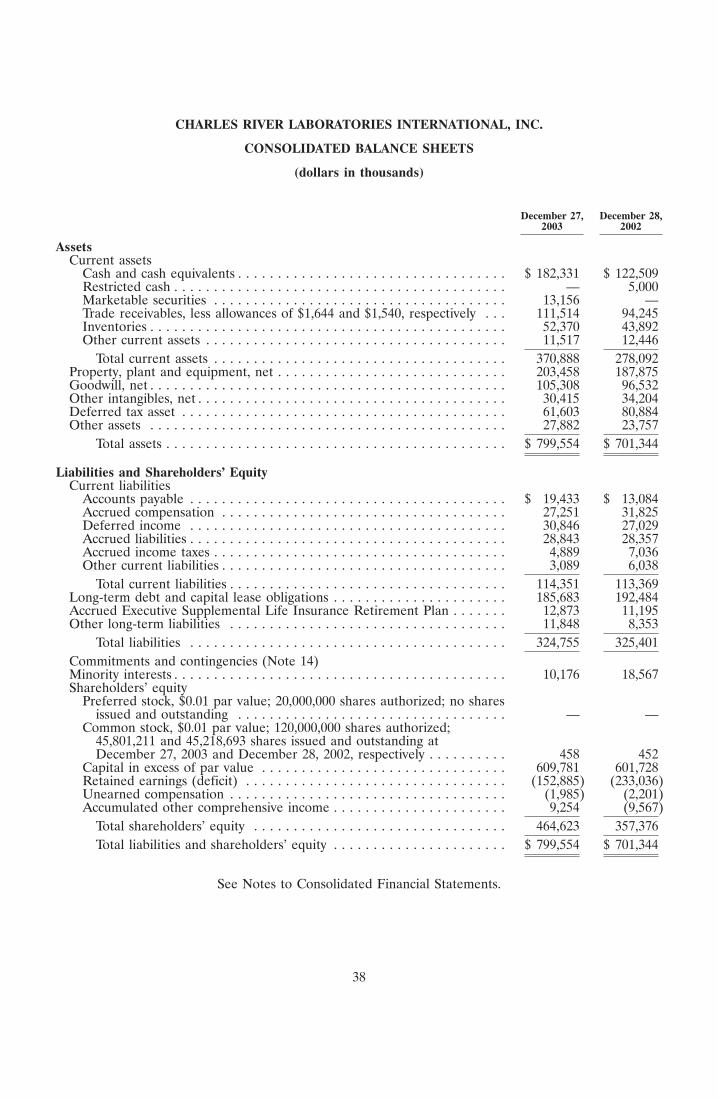
CHARLES RIVER LABORATORIES INTERNATIONAL, INC.
CONSOLIDATED BALANCE SHEETS
(dollars in thousands)
December 27, December 28,2003 2002
AssetsCurrent assets
Cash and cash equivalents . . . . . . . . . . . . . . . . . . . . . . . . . . . . . . . . . . $ 182,331 $ 122,509Restricted cash . . . . . . . . . . . . . . . . . . . . . . . . . . . . . . . . . . . . . . . . . . — 5,000Marketable securities . . . . . . . . . . . . . . . . . . . . . . . . . . . . . . . . . . . . . 13,156 —Trade receivables, less allowances of $1,644 and $1,540, respectively . . . 111,514 94,245Inventories . . . . . . . . . . . . . . . . . . . . . . . . . . . . . . . . . . . . . . . . . . . . . 52,370 43,892Other current assets . . . . . . . . . . . . . . . . . . . . . . . . . . . . . . . . . . . . . . 11,517 12,446
Total current assets . . . . . . . . . . . . . . . . . . . . . . . . . . . . . . . . . . . . . 370,888 278,092Property, plant and equipment, net . . . . . . . . . . . . . . . . . . . . . . . . . . . . . 203,458 187,875Goodwill, net . . . . . . . . . . . . . . . . . . . . . . . . . . . . . . . . . . . . . . . . . . . . . 105,308 96,532Other intangibles, net . . . . . . . . . . . . . . . . . . . . . . . . . . . . . . . . . . . . . . . 30,415 34,204Deferred tax asset . . . . . . . . . . . . . . . . . . . . . . . . . . . . . . . . . . . . . . . . . 61,603 80,884Other assets . . . . . . . . . . . . . . . . . . . . . . . . . . . . . . . . . . . . . . . . . . . . . 27,882 23,757
Total assets . . . . . . . . . . . . . . . . . . . . . . . . . . . . . . . . . . . . . . . . . . . $ 799,554 $ 701,344
Liabilities and Shareholders’ EquityCurrent liabilities
Accounts payable . . . . . . . . . . . . . . . . . . . . . . . . . . . . . . . . . . . . . . . . $ 19,433 $ 13,084Accrued compensation . . . . . . . . . . . . . . . . . . . . . . . . . . . . . . . . . . . . 27,251 31,825Deferred income . . . . . . . . . . . . . . . . . . . . . . . . . . . . . . . . . . . . . . . . 30,846 27,029Accrued liabilities . . . . . . . . . . . . . . . . . . . . . . . . . . . . . . . . . . . . . . . . 28,843 28,357Accrued income taxes . . . . . . . . . . . . . . . . . . . . . . . . . . . . . . . . . . . . . 4,889 7,036Other current liabilities . . . . . . . . . . . . . . . . . . . . . . . . . . . . . . . . . . . . 3,089 6,038
Total current liabilities . . . . . . . . . . . . . . . . . . . . . . . . . . . . . . . . . . . 114,351 113,369Long-term debt and capital lease obligations . . . . . . . . . . . . . . . . . . . . . . 185,683 192,484Accrued Executive Supplemental Life Insurance Retirement Plan . . . . . . . 12,873 11,195Other long-term liabilities . . . . . . . . . . . . . . . . . . . . . . . . . . . . . . . . . . . 11,848 8,353
Total liabilities . . . . . . . . . . . . . . . . . . . . . . . . . . . . . . . . . . . . . . . . 324,755 325,401Commitments and contingencies (Note 14)Minority interests . . . . . . . . . . . . . . . . . . . . . . . . . . . . . . . . . . . . . . . . . . 10,176 18,567Shareholders’ equity
Preferred stock, $0.01 par value; 20,000,000 shares authorized; no sharesissued and outstanding . . . . . . . . . . . . . . . . . . . . . . . . . . . . . . . . . . — —
Common stock, $0.01 par value; 120,000,000 shares authorized;45,801,211 and 45,218,693 shares issued and outstanding atDecember 27, 2003 and December 28, 2002, respectively . . . . . . . . . . 458 452
Capital in excess of par value . . . . . . . . . . . . . . . . . . . . . . . . . . . . . . . 609,781 601,728Retained earnings (deficit) . . . . . . . . . . . . . . . . . . . . . . . . . . . . . . . . . (152,885) (233,036)Unearned compensation . . . . . . . . . . . . . . . . . . . . . . . . . . . . . . . . . . . (1,985) (2,201)Accumulated other comprehensive income . . . . . . . . . . . . . . . . . . . . . . 9,254 (9,567)
Total shareholders’ equity . . . . . . . . . . . . . . . . . . . . . . . . . . . . . . . . 464,623 357,376Total liabilities and shareholders’ equity . . . . . . . . . . . . . . . . . . . . . . $ 799,554 $ 701,344
See Notes to Consolidated Financial Statements.
38
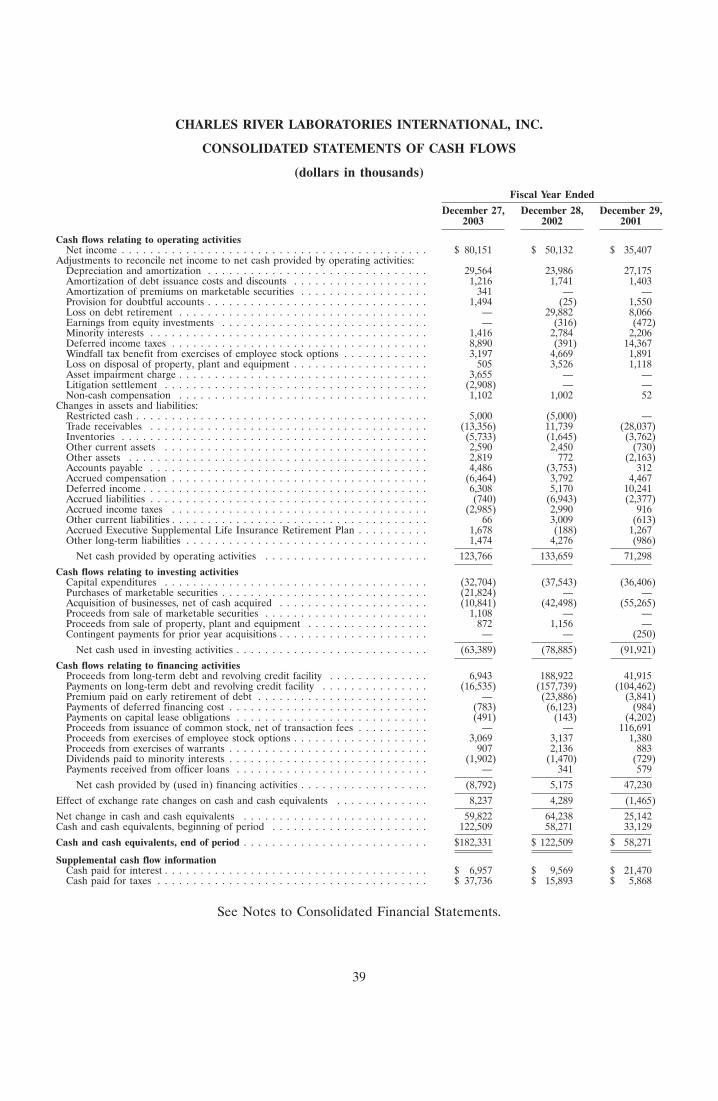
CHARLES RIVER LABORATORIES INTERNATIONAL, INC.
CONSOLIDATED STATEMENTS OF CASH FLOWS
(dollars in thousands)
Fiscal Year Ended
December 27, December 28, December 29,2003 2002 2001
Cash flows relating to operating activitiesNet income . . . . . . . . . . . . . . . . . . . . . . . . . . . . . . . . . . . . . . . . . . . $ 80,151 $ 50,132 $ 35,407
Adjustments to reconcile net income to net cash provided by operating activities:Depreciation and amortization . . . . . . . . . . . . . . . . . . . . . . . . . . . . . . . 29,564 23,986 27,175Amortization of debt issuance costs and discounts . . . . . . . . . . . . . . . . . . . 1,216 1,741 1,403Amortization of premiums on marketable securities . . . . . . . . . . . . . . . . . . 341 — —Provision for doubtful accounts . . . . . . . . . . . . . . . . . . . . . . . . . . . . . . . 1,494 (25) 1,550Loss on debt retirement . . . . . . . . . . . . . . . . . . . . . . . . . . . . . . . . . . . — 29,882 8,066Earnings from equity investments . . . . . . . . . . . . . . . . . . . . . . . . . . . . . — (316) (472)Minority interests . . . . . . . . . . . . . . . . . . . . . . . . . . . . . . . . . . . . . . . 1,416 2,784 2,206Deferred income taxes . . . . . . . . . . . . . . . . . . . . . . . . . . . . . . . . . . . . 8,890 (391) 14,367Windfall tax benefit from exercises of employee stock options . . . . . . . . . . . . 3,197 4,669 1,891Loss on disposal of property, plant and equipment . . . . . . . . . . . . . . . . . . . 505 3,526 1,118Asset impairment charge . . . . . . . . . . . . . . . . . . . . . . . . . . . . . . . . . . . 3,655 — —Litigation settlement . . . . . . . . . . . . . . . . . . . . . . . . . . . . . . . . . . . . . (2,908) — —Non-cash compensation . . . . . . . . . . . . . . . . . . . . . . . . . . . . . . . . . . . 1,102 1,002 52
Changes in assets and liabilities:Restricted cash . . . . . . . . . . . . . . . . . . . . . . . . . . . . . . . . . . . . . . . . . 5,000 (5,000) —Trade receivables . . . . . . . . . . . . . . . . . . . . . . . . . . . . . . . . . . . . . . . (13,356) 11,739 (28,037)Inventories . . . . . . . . . . . . . . . . . . . . . . . . . . . . . . . . . . . . . . . . . . . (5,733) (1,645) (3,762)Other current assets . . . . . . . . . . . . . . . . . . . . . . . . . . . . . . . . . . . . . 2,590 2,450 (730)Other assets . . . . . . . . . . . . . . . . . . . . . . . . . . . . . . . . . . . . . . . . . . 2,819 772 (2,163)Accounts payable . . . . . . . . . . . . . . . . . . . . . . . . . . . . . . . . . . . . . . . 4,486 (3,753) 312Accrued compensation . . . . . . . . . . . . . . . . . . . . . . . . . . . . . . . . . . . . (6,464) 3,792 4,467Deferred income . . . . . . . . . . . . . . . . . . . . . . . . . . . . . . . . . . . . . . . . 6,308 5,170 10,241Accrued liabilities . . . . . . . . . . . . . . . . . . . . . . . . . . . . . . . . . . . . . . . (740) (6,943) (2,377)Accrued income taxes . . . . . . . . . . . . . . . . . . . . . . . . . . . . . . . . . . . . (2,985) 2,990 916Other current liabilities . . . . . . . . . . . . . . . . . . . . . . . . . . . . . . . . . . . . 66 3,009 (613)Accrued Executive Supplemental Life Insurance Retirement Plan . . . . . . . . . . 1,678 (188) 1,267Other long-term liabilities . . . . . . . . . . . . . . . . . . . . . . . . . . . . . . . . . . 1,474 4,276 (986)
Net cash provided by operating activities . . . . . . . . . . . . . . . . . . . . . . . 123,766 133,659 71,298
Cash flows relating to investing activitiesCapital expenditures . . . . . . . . . . . . . . . . . . . . . . . . . . . . . . . . . . . . . (32,704) (37,543) (36,406)Purchases of marketable securities . . . . . . . . . . . . . . . . . . . . . . . . . . . . . (21,824) — —Acquisition of businesses, net of cash acquired . . . . . . . . . . . . . . . . . . . . . (10,841) (42,498) (55,265)Proceeds from sale of marketable securities . . . . . . . . . . . . . . . . . . . . . . . 1,108 — —Proceeds from sale of property, plant and equipment . . . . . . . . . . . . . . . . . 872 1,156 —Contingent payments for prior year acquisitions . . . . . . . . . . . . . . . . . . . . . — — (250)
Net cash used in investing activities . . . . . . . . . . . . . . . . . . . . . . . . . . . (63,389) (78,885) (91,921)
Cash flows relating to financing activitiesProceeds from long-term debt and revolving credit facility . . . . . . . . . . . . . . 6,943 188,922 41,915Payments on long-term debt and revolving credit facility . . . . . . . . . . . . . . . (16,535) (157,739) (104,462)Premium paid on early retirement of debt . . . . . . . . . . . . . . . . . . . . . . . . — (23,886) (3,841)Payments of deferred financing cost . . . . . . . . . . . . . . . . . . . . . . . . . . . . (783) (6,123) (984)Payments on capital lease obligations . . . . . . . . . . . . . . . . . . . . . . . . . . . (491) (143) (4,202)Proceeds from issuance of common stock, net of transaction fees . . . . . . . . . . — — 116,691Proceeds from exercises of employee stock options . . . . . . . . . . . . . . . . . . . 3,069 3,137 1,380Proceeds from exercises of warrants . . . . . . . . . . . . . . . . . . . . . . . . . . . . 907 2,136 883Dividends paid to minority interests . . . . . . . . . . . . . . . . . . . . . . . . . . . . (1,902) (1,470) (729)Payments received from officer loans . . . . . . . . . . . . . . . . . . . . . . . . . . . — 341 579
Net cash provided by (used in) financing activities . . . . . . . . . . . . . . . . . . (8,792) 5,175 47,230
Effect of exchange rate changes on cash and cash equivalents . . . . . . . . . . . . . 8,237 4,289 (1,465)
Net change in cash and cash equivalents . . . . . . . . . . . . . . . . . . . . . . . . . . 59,822 64,238 25,142Cash and cash equivalents, beginning of period . . . . . . . . . . . . . . . . . . . . . . 122,509 58,271 33,129
Cash and cash equivalents, end of period . . . . . . . . . . . . . . . . . . . . . . . . . . $182,331 $ 122,509 $ 58,271
Supplemental cash flow informationCash paid for interest . . . . . . . . . . . . . . . . . . . . . . . . . . . . . . . . . . . . . $ 6,957 $ 9,569 $ 21,470Cash paid for taxes . . . . . . . . . . . . . . . . . . . . . . . . . . . . . . . . . . . . . . $ 37,736 $ 15,893 $ 5,868
See Notes to Consolidated Financial Statements.
39
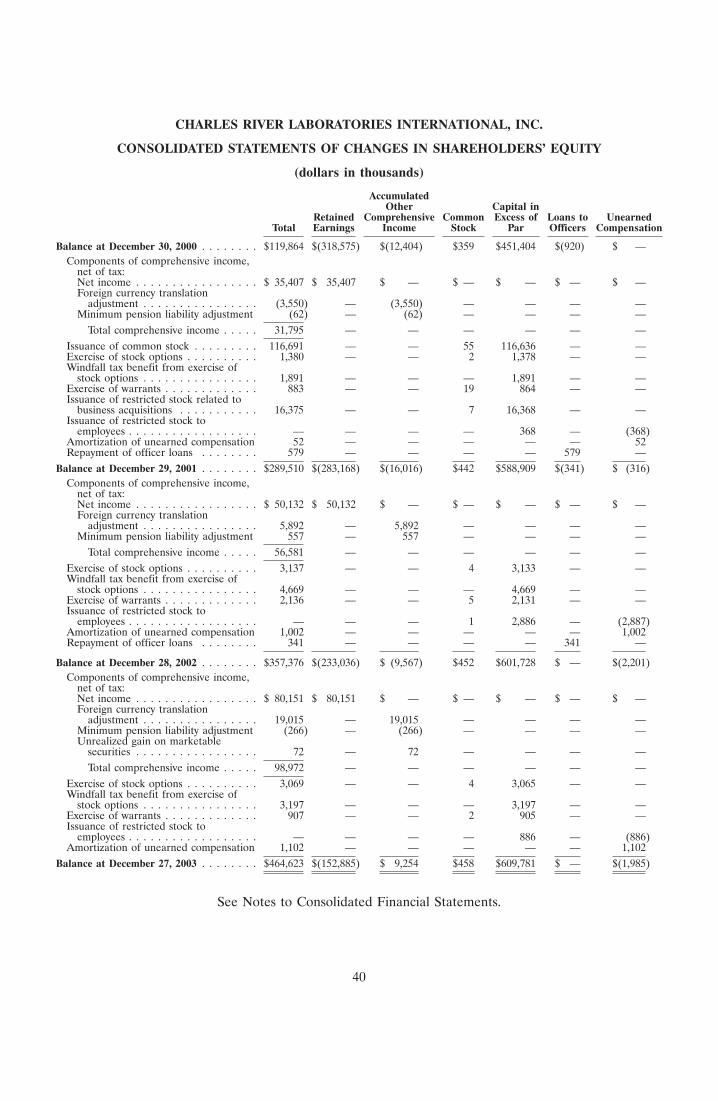
CHARLES RIVER LABORATORIES INTERNATIONAL, INC.
CONSOLIDATED STATEMENTS OF CHANGES IN SHAREHOLDERS’ EQUITY
(dollars in thousands)
AccumulatedOther Capital in
Retained Comprehensive Common Excess of Loans to UnearnedTotal Earnings Income Stock Par Officers Compensation
Balance at December 30, 2000 . . . . . . . . $119,864 $(318,575) $(12,404) $359 $451,404 $(920) $ —Components of comprehensive income,
net of tax:Net income . . . . . . . . . . . . . . . . . $ 35,407 $ 35,407 $ — $ — $ — $ — $ —Foreign currency translation
adjustment . . . . . . . . . . . . . . . . (3,550) — (3,550) — — — —Minimum pension liability adjustment (62) — (62) — — — —
Total comprehensive income . . . . . 31,795 — — — — — —Issuance of common stock . . . . . . . . . 116,691 — — 55 116,636 — —Exercise of stock options . . . . . . . . . . 1,380 — — 2 1,378 — —Windfall tax benefit from exercise of
stock options . . . . . . . . . . . . . . . . 1,891 — — — 1,891 — —Exercise of warrants . . . . . . . . . . . . . 883 — — 19 864 — —Issuance of restricted stock related to
business acquisitions . . . . . . . . . . . 16,375 — — 7 16,368 — —Issuance of restricted stock to
employees . . . . . . . . . . . . . . . . . . — — — — 368 — (368)Amortization of unearned compensation 52 — — — — — 52Repayment of officer loans . . . . . . . . 579 — — — — 579 —
Balance at December 29, 2001 . . . . . . . . $289,510 $(283,168) $(16,016) $442 $588,909 $(341) $ (316)Components of comprehensive income,
net of tax:Net income . . . . . . . . . . . . . . . . . $ 50,132 $ 50,132 $ — $ — $ — $ — $ —Foreign currency translation
adjustment . . . . . . . . . . . . . . . . 5,892 — 5,892 — — — —Minimum pension liability adjustment 557 — 557 — — — —
Total comprehensive income . . . . . 56,581 — — — — — —Exercise of stock options . . . . . . . . . . 3,137 — — 4 3,133 — —Windfall tax benefit from exercise of
stock options . . . . . . . . . . . . . . . . 4,669 — — — 4,669 — —Exercise of warrants . . . . . . . . . . . . . 2,136 — — 5 2,131 — —Issuance of restricted stock to
employees . . . . . . . . . . . . . . . . . . — — — 1 2,886 — (2,887)Amortization of unearned compensation 1,002 — — — — — 1,002Repayment of officer loans . . . . . . . . 341 — — — — 341 —
Balance at December 28, 2002 . . . . . . . . $357,376 $(233,036) $ (9,567) $452 $601,728 $ — $(2,201)Components of comprehensive income,
net of tax:Net income . . . . . . . . . . . . . . . . . $ 80,151 $ 80,151 $ — $ — $ — $ — $ —Foreign currency translation
adjustment . . . . . . . . . . . . . . . . 19,015 — 19,015 — — — —Minimum pension liability adjustment (266) — (266) — — — —Unrealized gain on marketable
securities . . . . . . . . . . . . . . . . . 72 — 72 — — — —Total comprehensive income . . . . . 98,972 — — — — — —
Exercise of stock options . . . . . . . . . . 3,069 — — 4 3,065 — —Windfall tax benefit from exercise of
stock options . . . . . . . . . . . . . . . . 3,197 — — — 3,197 — —Exercise of warrants . . . . . . . . . . . . . 907 — — 2 905 — —Issuance of restricted stock to
employees . . . . . . . . . . . . . . . . . . — — — — 886 — (886)Amortization of unearned compensation 1,102 — — — — — 1,102
Balance at December 27, 2003 . . . . . . . . $464,623 $(152,885) $ 9,254 $458 $609,781 $ — $(1,985)
See Notes to Consolidated Financial Statements.
40
CHARLES RIVER LABORATORIES INTERNATIONAL, INC.
NOTES TO CONSOLIDATED FINANCIAL STATEMENTS
(dollars in thousands, except per share amounts)
1. Description of Business and Summary of Significant Accounting Policies
Description of Business
Charles River Laboratories International, Inc. (together with its subsidiaries, the Company) is aleading provider of critical research tools and integrated support services that enable innovative andefficient drug discovery and development. The Company’s fiscal year is the twelve-month period endingthe last Saturday in December.
Principles of Consolidation
The consolidated financial statements include all majority-owned subsidiaries. Intercompanyaccounts, transactions and profits are eliminated. Results for three majority-owned subsidiaries arerecorded on a one-month lag basis. There were no material transactions or events for these subsidiariesbetween the reporting date and December 27, 2003.
Use of Estimates
The financial statements have been prepared in conformity with generally accepted accountingprinciples and, as such, include amounts based on informed estimates and judgments of managementwith consideration given to materiality. Actual results could differ from those estimates.
Cash and Cash Equivalents
Cash equivalents include time deposits and highly liquid investments with remaining maturities atthe purchase date of three months or less.
Restricted Cash
Restricted cash consists of cash reserved to support outstanding letters of credit at December 28,2002. The Company was required to restrict $5,000 of cash as a result of the termination of its thenexisting revolving credit facility in 2002, which previously supported the outstanding letters of credit.
Marketable Securities
The Company accounts for its investment in marketable securities in accordance with Statement ofFinancial Accounting Standards (SFAS) No. 115, ‘‘Accounting for Certain Investments in Debt andEquity Securities.’’ Investments in marketable securities (Note 5) consists of corporate debt securitiesand government securities and obligations which are classified as securities available-for-sale.
Realized gains and losses on securities classified as available-for-sale are included in earnings andare determined using the specific identification method. Unrealized holding gains and losses, net ofrelated tax effect, are excluded from earnings and are reported in accumulated other comprehensiveincome, a separate component of shareholders’ equity, until realized. The amortized cost of debtsecurities is adjusted for amortization of premiums and accretion of discounts to maturity. Suchamortization and accretion is included in interest income.
41
CHARLES RIVER LABORATORIES INTERNATIONAL, INC.
NOTES TO CONSOLIDATED FINANCIAL STATEMENTS (Continued)
(dollars in thousands, except per share amounts)
1. Description of Business and Summary of Significant Accounting Policies (Continued)
Allowance for Doubtful Accounts
The Company establishes an allowance for doubtful accounts which it believes is adequate to coveranticipated losses on the collection of all outstanding trade receivable balances. The adequacy of thedoubtful account allowance is based on historical information, a review of major customer accounts,receivable balances and management’s assessment of current economic conditions. The Companyreassesses the allowance for doubtful accounts each quarter.
Inventories
Inventories (Note 6) are stated at the lower of cost, determined principally on the average costmethod, or market. The determination of market value involves assessment of numerous factors,including costs to dispose of inventory and estimated selling price. Reserves are recorded to reduce thecarrying value for inventory determined damaged, obsolete or otherwise unsaleable. Costs for largeanimals are accumulated in inventory until the animals are sold.
Property, Plant and Equipment
Property, plant and equipment (Note 6), including improvements that significantly add toproductive capacity or extend useful life, are recorded at cost, while maintenance and repairs areexpensed as incurred. Depreciation is calculated for financial reporting purposes using the straight-linemethod based on the estimated useful lives of the assets as follows: buildings, 20 to 40 years; machineryand equipment, 2 to 20 years; furniture and fixtures, 5 to 7 years; vehicles, 2 to 4 years; and leaseholdimprovements, the shorter of estimated useful life or the lease periods.
Goodwill and Other Intangible Assets
Effective at the beginning of fiscal 2002, the Company adopted SFAS No. 142, ‘‘Goodwill andOther Intangible Assets,’’ which establishes financial accounting and reporting standards for acquiredgoodwill and other intangible assets (Note 7). In accordance with SFAS No. 142, goodwill andindefinite-lived intangible assets are no longer amortized but are reviewed at least annually forimpairment. Separate intangible assets that have finite useful lives continue to be amortized over theirestimated useful lives.
SFAS No. 142 requires that goodwill be tested annually for impairment using a two-step process.The first step is to identify a potential impairment. The second step of the impairment test measuresthe amount of the impairment loss. The Company completed the annual impairment tests in 2003 and2002 and concluded there was no impairment of goodwill. Intangible assets deemed to have anindefinite life are tested for impairment using a one-step process which compares the fair value to thecarrying amount of the asset. The Company completed the annual impairment tests in 2003 and 2002and concluded there was no impairment of identifiable intangible assets with indefinite useful lives.
Other Assets
Other assets consist primarily of the cash surrender value of life insurance policies, a definedbenefit plan pension asset and certain investments in available-for-sale securities that the Companydoes not intend to dispose of within the next twelve months.
42

CHARLES RIVER LABORATORIES INTERNATIONAL, INC.
NOTES TO CONSOLIDATED FINANCIAL STATEMENTS (Continued)
(dollars in thousands, except per share amounts)
1. Description of Business and Summary of Significant Accounting Policies (Continued)
Impairment of Long-Lived Assets
The Company adopted the provisions of SFAS No. 144, ‘‘Accounting for the Impairment orDisposal of Long-lived Assets,’’ in 2002. The Company evaluates long-lived assets whenever events orchanges in circumstances indicate that the carrying amount of an asset may not be recoverable. Animpairment loss would be recognized when estimated undiscounted future cash flows expected to resultfrom the use of the asset and its eventual disposal are less than its carrying amount. In such instances,the carrying value of long-lived assets is reduced to the estimated fair value, as determined using anappraisal or discounted cash flows, as appropriate.
Stock-Based Compensation Plans
As permitted under SFAS No. 123, ‘‘Accounting for Stock-Based Compensation,’’ the Companyaccounts for its stock-based compensation plans (Note 12) using the intrinsic value method prescribedby Accounting Principles Board (APB) Opinion No. 25, ‘‘Accounting for Stock Issued to Employees’’and Financial Accounting Standards Board (FASB) Interpretation No. 44 (FIN 44), ‘‘Accounting forCertain Transactions Involving Stock Compensation—an interpretation of APB Opinion No. 25.’’ Also,the Company accounts for variable restricted stock grants under the provisions of FASB InterpretationNo. 28, ‘‘Accounting for Stock Appreciation Rights and Other Variable Stock Options Award Plans.’’The Company recognizes compensation expenses for fixed and variable restricted stock grants over therestriction period.
SFAS No. 123 requires the presentation of certain pro forma information as if the Company hadaccounted for its employee stock options under the fair value method. For purposes of this disclosure,the fair value of the fixed option grants was estimated using the Black-Scholes option-pricing modelwith the following weighted average assumptions used for option grants:
2003 2002 2001
Risk-free interest rate . . . . . . . . . . . . . . . . . . . . . . . . . . . . . . 3.1% 4.1% 4.9%Volatility factor . . . . . . . . . . . . . . . . . . . . . . . . . . . . . . . . . . . 51.3% 51.2% 56.1%Weighted average expected life (years) . . . . . . . . . . . . . . . . . . 6.0 6.0 6.0
The Black-Scholes option valuation model was developed for use in estimating the fair value oftraded options which have no vesting restrictions and are fully transferable. In addition, optionvaluation models require the input of highly subjective assumptions including the expected stock pricevolatility. Because the Company’s employee stock options have characteristics significantly differentfrom those of traded options, and because changes in the subjective input assumptions can materiallyaffect the fair value estimates, in management’s opinion, the existing models do not necessarily providea reliable single measure of the fair value of its employee stock options. However, for each periodpresented, management believes the Black-Scholes model is the most appropriate option valuationmodel. The weighted average Black-Scholes fair value for the 2003, 2002 and 2001 grants was $17.04,$17.62 and $17.59, respectively.
Had compensation expense for the Company’s option grants been recognized consistent with theprovision of SFAS No. 123 as amended by SFAS No. 148, ‘‘Accounting for Stock-Based Compensation-Transition and Disclosure, an Amendment of FASB Statement No. 123,’’ the Company’s net income
43
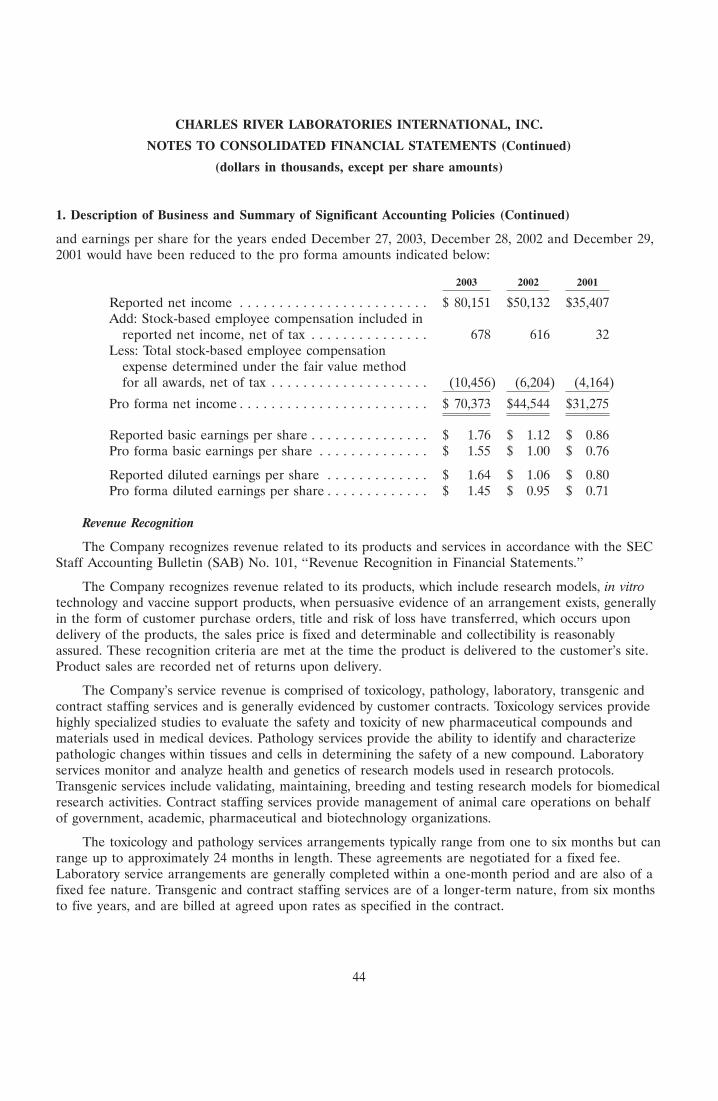
CHARLES RIVER LABORATORIES INTERNATIONAL, INC.
NOTES TO CONSOLIDATED FINANCIAL STATEMENTS (Continued)
(dollars in thousands, except per share amounts)
1. Description of Business and Summary of Significant Accounting Policies (Continued)
and earnings per share for the years ended December 27, 2003, December 28, 2002 and December 29,2001 would have been reduced to the pro forma amounts indicated below:
2003 2002 2001
Reported net income . . . . . . . . . . . . . . . . . . . . . . . . $ 80,151 $50,132 $35,407Add: Stock-based employee compensation included in
reported net income, net of tax . . . . . . . . . . . . . . . 678 616 32Less: Total stock-based employee compensation
expense determined under the fair value methodfor all awards, net of tax . . . . . . . . . . . . . . . . . . . . (10,456) (6,204) (4,164)
Pro forma net income . . . . . . . . . . . . . . . . . . . . . . . . $ 70,373 $44,544 $31,275
Reported basic earnings per share . . . . . . . . . . . . . . . $ 1.76 $ 1.12 $ 0.86Pro forma basic earnings per share . . . . . . . . . . . . . . $ 1.55 $ 1.00 $ 0.76
Reported diluted earnings per share . . . . . . . . . . . . . $ 1.64 $ 1.06 $ 0.80Pro forma diluted earnings per share . . . . . . . . . . . . . $ 1.45 $ 0.95 $ 0.71
Revenue Recognition
The Company recognizes revenue related to its products and services in accordance with the SECStaff Accounting Bulletin (SAB) No. 101, ‘‘Revenue Recognition in Financial Statements.’’
The Company recognizes revenue related to its products, which include research models, in vitrotechnology and vaccine support products, when persuasive evidence of an arrangement exists, generallyin the form of customer purchase orders, title and risk of loss have transferred, which occurs upondelivery of the products, the sales price is fixed and determinable and collectibility is reasonablyassured. These recognition criteria are met at the time the product is delivered to the customer’s site.Product sales are recorded net of returns upon delivery.
The Company’s service revenue is comprised of toxicology, pathology, laboratory, transgenic andcontract staffing services and is generally evidenced by customer contracts. Toxicology services providehighly specialized studies to evaluate the safety and toxicity of new pharmaceutical compounds andmaterials used in medical devices. Pathology services provide the ability to identify and characterizepathologic changes within tissues and cells in determining the safety of a new compound. Laboratoryservices monitor and analyze health and genetics of research models used in research protocols.Transgenic services include validating, maintaining, breeding and testing research models for biomedicalresearch activities. Contract staffing services provide management of animal care operations on behalfof government, academic, pharmaceutical and biotechnology organizations.
The toxicology and pathology services arrangements typically range from one to six months but canrange up to approximately 24 months in length. These agreements are negotiated for a fixed fee.Laboratory service arrangements are generally completed within a one-month period and are also of afixed fee nature. Transgenic and contract staffing services are of a longer-term nature, from six monthsto five years, and are billed at agreed upon rates as specified in the contract.
44
CHARLES RIVER LABORATORIES INTERNATIONAL, INC.
NOTES TO CONSOLIDATED FINANCIAL STATEMENTS (Continued)
(dollars in thousands, except per share amounts)
1. Description of Business and Summary of Significant Accounting Policies (Continued)
The Company’s service revenues are recognized upon the Company’s completion of the agreedupon performance criteria. These performance criteria are generally in the form of either studyprotocols or specified activities or procedures which the Company is engaged to perform. Theseperformance criteria are established by the Company’s customers and do not contain acceptanceprovisions which are based upon the achievement of certain study or laboratory testing results. Revenueof agreed upon rate contracts is recognized as services are performed, based upon rates specified in thecontract. Revenue of fixed fee contracts is recognized as services are performed in accordance withagreed-upon study protocols.
Unbilled and deferred revenue is recognized in the consolidated balance sheets. Unbilled servicesare recorded for revenues recognized to date and relate to amounts that are currently unbillable to thecustomer pursuant to contractual terms. In general, amounts become billable upon the achievement ofmilestones or in accordance with predetermined payment schedules. In some cases, a portion of thecontract fee is paid at the time the study is initiated. These advances are deferred and recognized asrevenue as services are performed.
Guarantees
The Company includes standard indemnification provisions in its customer contracts, which includestandard provisions limiting the Company’s liability under such contracts, including the Company’sindemnification obligations, with certain exceptions.
Fair Value of Financial Instruments
The carrying amounts of the Company’s significant financial instruments, which include cashequivalents, marketable securities, accounts receivable and accounts payable, approximate their fairvalues at December 27, 2003 and December 28, 2002. The fair value of the Company’s financinginstruments (Note 8) was $198,109 at December 27, 2003.
Income Taxes
The Company accounts for income taxes in accordance with SFAS No. 109, ‘‘Accounting forIncome Taxes.’’ The asset and liability approach underlying SFAS No. 109 requires the recognition ofdeferred tax liabilities and assets for the expected future tax consequences of temporary differencesbetween the carrying amounts and tax basis of the Company’s assets and liabilities. A valuationallowance is provided for deferred tax assets if it is more likely than not that these items will expirebefore the Company is able to realize their benefits or that their future deductibility is uncertain.
Foreign Currency Translation
The functional currencies of the Company’s foreign subsidiaries are in local currency. Inaccordance with SFAS No. 52, ‘‘Foreign Currency Translation,’’ the financial statements of thesesubsidiaries are translated into U.S. dollars as follows: assets and liabilities at year-end exchange rates;income, expenses and cash flows at average exchange rates; and shareholders’ equity at historicalexchange rates. The resulting translation adjustment is recorded as a component of accumulated othercomprehensive income in the accompanying balance sheet. Exchange gains and losses on foreign
45
CHARLES RIVER LABORATORIES INTERNATIONAL, INC.
NOTES TO CONSOLIDATED FINANCIAL STATEMENTS (Continued)
(dollars in thousands, except per share amounts)
1. Description of Business and Summary of Significant Accounting Policies (Continued)
currency transactions are recorded as other income or expense. The Company recorded exchange gainsof $702, $1,222 and $36 in 2003, 2002 and 2001, respectively.
Concentrations of Credit Risk
Financial instruments that potentially subject the Company to concentrations of credit risk consistprimarily of trade receivables from customers in the pharmaceutical and biotechnology industries. TheCompany believes its exposure to credit risk to be minimal, as these industries have experiencedsignificant growth and the customers are predominantly well established and viable.
Comprehensive Income
The Company accounts for comprehensive income in accordance with SFAS No. 130, ‘‘ReportingComprehensive Income.’’ As it relates to the Company, comprehensive income is defined as net incomeplus the sum of the changes in unrealized gains (losses) on available-for-sale marketable securities,foreign currency translation adjustments and minimum pension liabilities (collectively, othercomprehensive income) and is presented in the Consolidated Statements of Changes in Shareholders’Equity, net of tax.
Pension Obligations
The Company recognizes obligations associated with its defined benefit pension plans (Note 11) inaccordance with SFAS No. 87, ‘‘Employers Accounting for Pensions.’’ Assets, liabilities and expensesare calculated by accredited independent actuaries. As required by SFAS No. 87, the Company isrequired to make certain assumptions to value the plan assets and liabilities. These assumptions arereviewed annually, or whenever otherwise required by SFAS No. 87, based on reviews of current planinformation and consultations with independent investment advisors and actuaries. The selection ofassumptions requires a high degree of judgment and may materially change from period to period. TheCompany does not offer other defined benefits associated with post-retirement benefit plans other thanpensions. The Company adopted the disclosure requirements under SFAS No. 132R, ‘‘Employers’Disclosure about Pensions and Other Postretirement Benefits, an Amendment of FASB StatementsNo. 87, 88 and 106,’’ as of December 27, 2003 for both domestic and foreign defined benefit plans.
Restructuring Costs
The Company recognizes obligations associated with restructuring activities in accordance withSFAS No. 146, ‘‘Accounting for Costs Associated with Exit or Disposal Activities.’’ The Companyadopted the provisions of SFAS No. 146 as of the beginning of fiscal 2003, which generally requires aliability for costs associated with an exit or disposal activity be recognized and measured initially at itsfair value in the period in which the liability is incurred. The overall purpose of the Company’srestructuring actions is to lower overall operating costs and improve profitability by reducing excesscapacities. Restructuring charges (Note 3) are typically recorded in selling, general and administrativeexpenses in the period in which the plan is approved by the Company’s senior management and, wherematerial, the Company’s Board of Directors, and when the liability is incurred.
46
CHARLES RIVER LABORATORIES INTERNATIONAL, INC.
NOTES TO CONSOLIDATED FINANCIAL STATEMENTS (Continued)
(dollars in thousands, except per share amounts)
1. Description of Business and Summary of Significant Accounting Policies (Continued)
Earnings Per Share
Basic earnings per share is calculated by dividing net income by the weighted average number ofcommon shares outstanding adjusted for contingently issuable shares. Diluted earnings per commonshare is calculated by adjusting the weighted average number of common shares outstanding to includethe number of additional common shares that would have been outstanding if the dilutive potentialcommon shares had been issued (Note 9).
New Accounting Pronouncements
In May 2003, the FASB issued SFAS No.150, ‘‘Accounting for Certain Financial Instruments withCharacteristics of Both Liabilities and Equity.’’ This statement establishes standards for how an issuerclassifies and measures certain financial instruments with characteristics of both liabilities and equity.SFAS No. 150 is effective for financial instruments entered into or modified after May 31, 2003 andotherwise is effective at the beginning of the first interim period beginning after June 15, 2003. Thisstatement does not result in any material change to the Company’s existing reporting. The Company’sjoint venture agreements are renewable by mutual agreement of the parties upon termination of theinitial terms.
In November 2002, the FASB issued FIN 45, ‘‘Guarantor’s Accounting and DisclosureRequirements for Guarantees, Including Indirect Guarantees of Indebtedness of Others, aninterpretation of SFAS Nos. 5, 57, and 107 and Rescission of FASB Interpretation No. 34.’’ FIN 45clarifies the requirements of SFAS No. 5, ‘‘Accounting for Contingencies,’’ relating to the guarantor’saccounting for, and disclosure of, the issuance of certain types of guarantees. FIN 45 requires that,upon issuance of a guarantee, the guarantor must recognize a liability for the fair value of theobligation. FIN 45 is applicable to guarantees that encompass guarantees based on changes in anunderlying asset, liability or equity security, guarantees that are made on behalf of another entity’sperformance, certain indemnification agreements and indirect guarantees of the indebtedness of others.The recognition and measurement provisions of FIN 45 are effective prospectively for guaranteesissued or modified after December 31, 2002. The disclosure requirements are effective for reportingperiods ending after December 15, 2002. The adoption of the standard did not have any material effecton the Company’s consolidated financial statements.
In November 2002, the Emerging Issues Task Force (EITF) reached final consensus on EITF IssueNo. 00-21, ‘‘Accounting for Revenue Arrangements with Multiple Deliverables.’’ EITF Issue No. 00-21addresses certain aspects of a vendor’s accounting for arrangements under which it will performmultiple revenue-generating activities. It provides additional guidance as to how revenue should bemeasured and allocated to the separate units of accounting. EITF Issue No. 00-21 is effectiveprospectively for revenue arrangements entered into during fiscal periods beginning after June 15, 2003.The adoption of the standard did not have a material effect on the Company’s consolidated financialstatements.
In January 2003, FASB issued FIN 46, ‘‘Consolidation of Variable Interest Entities,’’ which clarifiesthe application of Accounting Research Bulletin (ARB) No. 51, ‘‘Consolidated Financial Statements,’’relating to consolidation of certain entities. First, FIN 46 will require identification of the Company’sparticipation in variable interest entities (VIE), which are defined as entities with a level of invested
47
CHARLES RIVER LABORATORIES INTERNATIONAL, INC.
NOTES TO CONSOLIDATED FINANCIAL STATEMENTS (Continued)
(dollars in thousands, except per share amounts)
1. Description of Business and Summary of Significant Accounting Policies (Continued)
equity that is not sufficient to fund future activities to permit them to operate on a stand alone basis,or whose equity holders lack certain characteristics of a controlling financial interest. Then, for entitiesidentified as VIE, FIN 46 sets forth a model to evaluate potential consolidation based on anassessment of which party to the VIE, if any, bears a majority of the exposure to its expected losses, orstands to gain from a majority of its expected returns. In December 2003, the FASB issued a revisedFIN 46 to defer the effective date and provide further clarification on the interpretation. FIN 46R iseffective for public companies in the first fiscal period after December 15, 2003. The Company iscurrently evaluating the effect that the adoption of FIN 46 will have on its results of operations andfinancial condition.
Reclassifications
Certain amounts in prior year financial statements and related notes have been reclassified toconform with current year presentation. These reclassifications have no impact on previously reportednet income or cash flow.
2. Business Acquisitions
The Company acquired several businesses during the three-year period ended December 27, 2003.The results of operations of the acquired businesses are included in the accompanying consolidatedfinancial statements from the date of acquisition. Significant acquisitions include the following:
Effective January 2, 2003, the Company acquired an additional 19% of the equity (404,321common shares) of Charles River Japan from Ajinomoto Company, Inc. (Ajinomoto), the minorityinterest partner, which increased the Company’s ownership to 85% of the outstanding shares. Thepurchase price for the equity was 1.3 billion yen, or $10,841, which was paid in cash. The Companyrecorded goodwill of $2,553 based on the preliminary purchase price allocation in the first quarter of2003. The Company reallocated this amount to fixed assets based on an independent valuation of thesefixed assets, which was completed during the second quarter of 2003. Charles River Japan is anextension of the Company’s research models and services segment.
During the first quarter of 2003, the Company recorded a deferred tax liability of $6,000 associatedwith prior-year acquisitions. This resulted in an increase in goodwill of $6,000.
On October 1, 2002, the Company acquired 100% of the voting equity interests of privately-heldSpringborn Laboratories, Inc. (Springborn). Consideration, including acquisition expenses, was $26,452,net of cash acquired of $634. Consideration consisted of $20,452 in cash and $6,000 in the form of athree-year unsecured subordinated note (Note 8). Springborn provides expertise in short to mid-termtoxicology studies. Springborn was acquired to strengthen service offerings of the Company’s existingdevelopment and safety testing segment. The acquisition was recorded as a purchase businesscombination in accordance with SFAS No. 141, ‘‘Business Combinations.’’
48
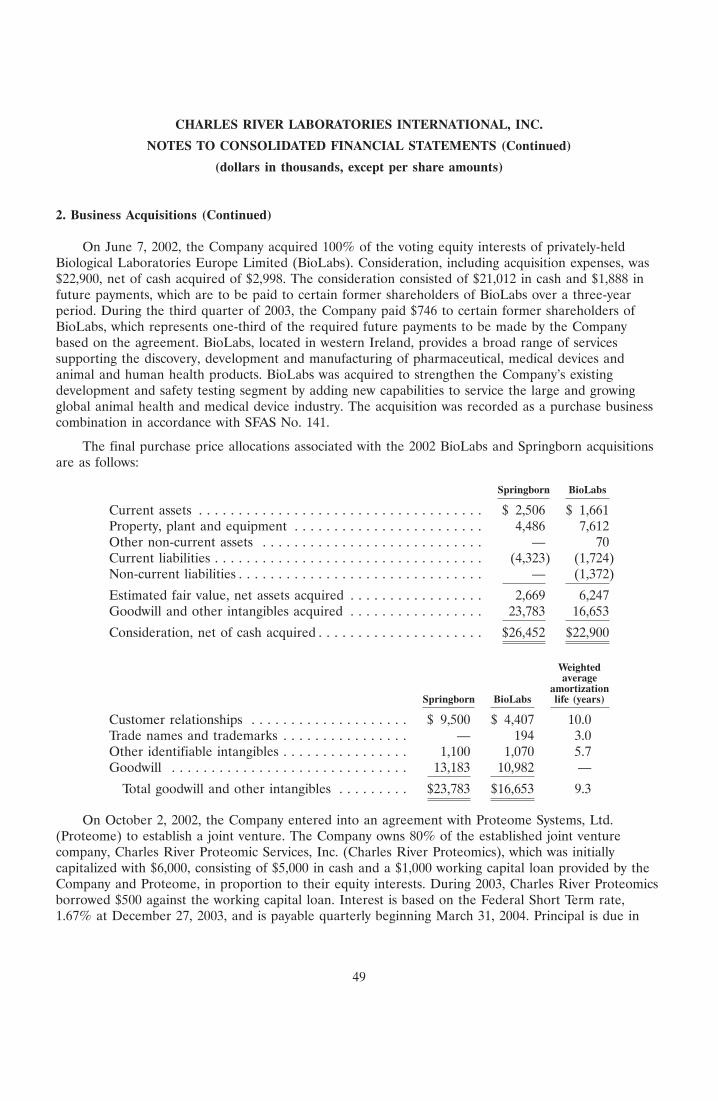
CHARLES RIVER LABORATORIES INTERNATIONAL, INC.
NOTES TO CONSOLIDATED FINANCIAL STATEMENTS (Continued)
(dollars in thousands, except per share amounts)
2. Business Acquisitions (Continued)
On June 7, 2002, the Company acquired 100% of the voting equity interests of privately-heldBiological Laboratories Europe Limited (BioLabs). Consideration, including acquisition expenses, was$22,900, net of cash acquired of $2,998. The consideration consisted of $21,012 in cash and $1,888 infuture payments, which are to be paid to certain former shareholders of BioLabs over a three-yearperiod. During the third quarter of 2003, the Company paid $746 to certain former shareholders ofBioLabs, which represents one-third of the required future payments to be made by the Companybased on the agreement. BioLabs, located in western Ireland, provides a broad range of servicessupporting the discovery, development and manufacturing of pharmaceutical, medical devices andanimal and human health products. BioLabs was acquired to strengthen the Company’s existingdevelopment and safety testing segment by adding new capabilities to service the large and growingglobal animal health and medical device industry. The acquisition was recorded as a purchase businesscombination in accordance with SFAS No. 141.
The final purchase price allocations associated with the 2002 BioLabs and Springborn acquisitionsare as follows:
Springborn BioLabs
Current assets . . . . . . . . . . . . . . . . . . . . . . . . . . . . . . . . . . . . $ 2,506 $ 1,661Property, plant and equipment . . . . . . . . . . . . . . . . . . . . . . . . 4,486 7,612Other non-current assets . . . . . . . . . . . . . . . . . . . . . . . . . . . . — 70Current liabilities . . . . . . . . . . . . . . . . . . . . . . . . . . . . . . . . . . (4,323) (1,724)Non-current liabilities . . . . . . . . . . . . . . . . . . . . . . . . . . . . . . . — (1,372)
Estimated fair value, net assets acquired . . . . . . . . . . . . . . . . . 2,669 6,247Goodwill and other intangibles acquired . . . . . . . . . . . . . . . . . 23,783 16,653
Consideration, net of cash acquired . . . . . . . . . . . . . . . . . . . . . $26,452 $22,900
Weightedaverage
amortizationSpringborn BioLabs life (years)
Customer relationships . . . . . . . . . . . . . . . . . . . . $ 9,500 $ 4,407 10.0Trade names and trademarks . . . . . . . . . . . . . . . . — 194 3.0Other identifiable intangibles . . . . . . . . . . . . . . . . 1,100 1,070 5.7Goodwill . . . . . . . . . . . . . . . . . . . . . . . . . . . . . . 13,183 10,982 —
Total goodwill and other intangibles . . . . . . . . . $23,783 $16,653 9.3
On October 2, 2002, the Company entered into an agreement with Proteome Systems, Ltd.(Proteome) to establish a joint venture. The Company owns 80% of the established joint venturecompany, Charles River Proteomic Services, Inc. (Charles River Proteomics), which was initiallycapitalized with $6,000, consisting of $5,000 in cash and a $1,000 working capital loan provided by theCompany and Proteome, in proportion to their equity interests. During 2003, Charles River Proteomicsborrowed $500 against the working capital loan. Interest is based on the Federal Short Term rate,1.67% at December 27, 2003, and is payable quarterly beginning March 31, 2004. Principal is due in
49
CHARLES RIVER LABORATORIES INTERNATIONAL, INC.
NOTES TO CONSOLIDATED FINANCIAL STATEMENTS (Continued)
(dollars in thousands, except per share amounts)
2. Business Acquisitions (Continued)
full by the end of the joint venture agreement. The Company has an option exercisable beginning onJanuary 1, 2006 to purchase up to 100% of the equity in Charles River Proteomics based on the fairmarket value at the time of exercise. Charles River Proteomics was established to strengthen theCompany’s existing development and safety testing segment by adding new capabilities in the area ofdrug discovery and development. The Company began consolidating the operations of Charles RiverProteomics from the date of the agreement.
On August 20, 2002, the Company amended the joint venture agreement for Charles RiverMexico, which was accounted for under the equity method. Upon execution of the amendment, theCompany gained control over the operations. The Company’s ownership percentage of 50.1% did notchange as a result of this amendment and no additional contributions were made. The Company beganconsolidating the operations of Charles River Mexico from the date of the amendment. Uponconsolidation, the Company reversed its equity investment of $3,203, and recognized goodwill of $581and minority interest of $2,587. Results of operations in 2002 were not materially impacted from theconsolidation. Charles River Mexico is an extension of the Company’s vaccine support business, part ofthe research models and services segment.
On July 20, 2001, the Company purchased 100% of the common stock of Genetic Models, Inc.(GMI) for cash consideration of $4,000. This acquisition was recorded as a purchase businesscombination in accordance with SFAS No. 141.
Effective February 27, 2001, the Company acquired Primedica Corporation (Primedica) forconsideration of $51,107, including acquisition expenses. Consideration was comprised of $25,708 ofcash, $16,375 of the Company’s common stock and $9,024 in assumed debt. This acquisition wasrecorded as a purchase business combination in accordance with APB No. 16, ‘‘BusinessCombinations.’’
On January 8, 2001, the Company purchased 100% of the common stock of Pathology AssociatesInternational Corporation (PAI). Consideration of $35,238, including acquisition expenses, was paidwith respect to this acquisition, consisting of $25,557 of cash and a $12,000 callable convertible note(Note 8). Consideration of $9,681 was recorded with respect to the convertible note due to an issuancediscount. The cash consideration was funded in part through a $15,000 drawdown from the Company’srevolving credit facility. This acquisition was recorded as a purchase business combination inaccordance with APB No. 16.
50
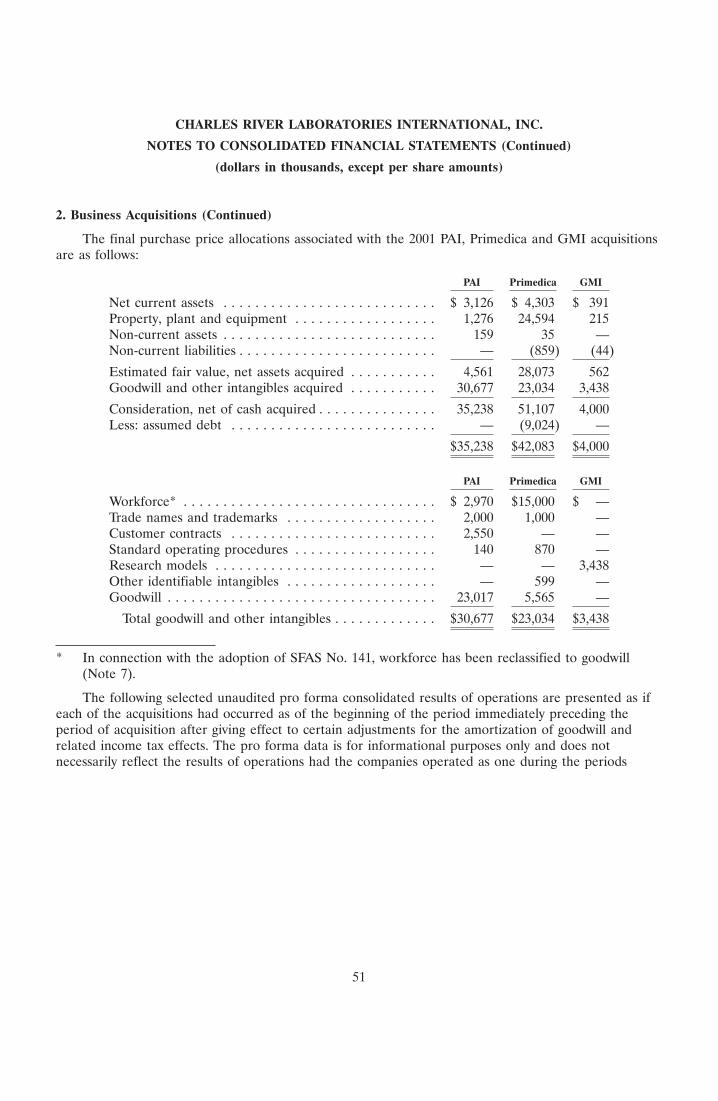
CHARLES RIVER LABORATORIES INTERNATIONAL, INC.
NOTES TO CONSOLIDATED FINANCIAL STATEMENTS (Continued)
(dollars in thousands, except per share amounts)
2. Business Acquisitions (Continued)
The final purchase price allocations associated with the 2001 PAI, Primedica and GMI acquisitionsare as follows:
PAI Primedica GMI
Net current assets . . . . . . . . . . . . . . . . . . . . . . . . . . . $ 3,126 $ 4,303 $ 391Property, plant and equipment . . . . . . . . . . . . . . . . . . 1,276 24,594 215Non-current assets . . . . . . . . . . . . . . . . . . . . . . . . . . . 159 35 —Non-current liabilities . . . . . . . . . . . . . . . . . . . . . . . . . — (859) (44)
Estimated fair value, net assets acquired . . . . . . . . . . . 4,561 28,073 562Goodwill and other intangibles acquired . . . . . . . . . . . 30,677 23,034 3,438
Consideration, net of cash acquired . . . . . . . . . . . . . . . 35,238 51,107 4,000Less: assumed debt . . . . . . . . . . . . . . . . . . . . . . . . . . — (9,024) —
$35,238 $42,083 $4,000
PAI Primedica GMI
Workforce* . . . . . . . . . . . . . . . . . . . . . . . . . . . . . . . . $ 2,970 $15,000 $ —Trade names and trademarks . . . . . . . . . . . . . . . . . . . 2,000 1,000 —Customer contracts . . . . . . . . . . . . . . . . . . . . . . . . . . 2,550 — —Standard operating procedures . . . . . . . . . . . . . . . . . . 140 870 —Research models . . . . . . . . . . . . . . . . . . . . . . . . . . . . — — 3,438Other identifiable intangibles . . . . . . . . . . . . . . . . . . . — 599 —Goodwill . . . . . . . . . . . . . . . . . . . . . . . . . . . . . . . . . . 23,017 5,565 —
Total goodwill and other intangibles . . . . . . . . . . . . . $30,677 $23,034 $3,438
* In connection with the adoption of SFAS No. 141, workforce has been reclassified to goodwill(Note 7).
The following selected unaudited pro forma consolidated results of operations are presented as ifeach of the acquisitions had occurred as of the beginning of the period immediately preceding theperiod of acquisition after giving effect to certain adjustments for the amortization of goodwill andrelated income tax effects. The pro forma data is for informational purposes only and does notnecessarily reflect the results of operations had the companies operated as one during the periods
51

CHARLES RIVER LABORATORIES INTERNATIONAL, INC.
NOTES TO CONSOLIDATED FINANCIAL STATEMENTS (Continued)
(dollars in thousands, except per share amounts)
2. Business Acquisitions (Continued)
reported. No effect has been given for synergies, if any, that may have been realized through theacquisitions.
Fiscal Year Ended
December 27, December 28, December 29,2003 2002 2001
(as reported)
Net sales . . . . . . . . . . . . . . . . . . . . . . . . . . $613,723 $576,325 $508,631Operating income . . . . . . . . . . . . . . . . . . . . 138,553 125,279 94,018Net income . . . . . . . . . . . . . . . . . . . . . . . . 80,151 52,652 37,055Earnings per common share
Basic . . . . . . . . . . . . . . . . . . . . . . . . . . . $ 1.76 $ 1.17 $ 0.90Diluted . . . . . . . . . . . . . . . . . . . . . . . . . . $ 1.64 $ 1.11 $ 0.84
Refer to Note 9 for further discussion of the method of computation of earnings per share.
3. Restructuring and Other Charges
Restructuring Charges
During the fourth quarter of 2001, the Company recorded restructuring charges of $1,788,including asset disposals of $1,041, employee separation of $477 and other charges of $270, associatedwith the closure of a San Diego, California, facility. The restructuring plan included the termination ofapproximately 40 employees and the exit of a facility utilized under an operating lease. During 2002,the Company recorded an additional $292 charge relating to the facility’s lease obligation based on theCompany’s revised estimate of expected sublease income over the remaining lease term. During thethird quarter of 2003, the Company recorded an additional $404 charge relating to the remaining leaseobligation at the facility due to adverse rental market conditions in the San Diego area.
During the fourth quarter of 2000, the Company recorded restructuring charges of $1,290,including asset disposal of $212, associated with the closure of a facility in France. During 2001, theCompany recorded additional charges of $1,915, which included a write-down of assets held for sale of$400 and additional severance payments and other related expenses of $1,515, relating to the settlementof labor disputes which originated during the first quarter of 2001. Approximately 60 employees wereterminated as a result of the restructuring.
Other Charges
During the second and third quarters of 2003, the Company recorded a total charge of $954 forseverance to employees who were terminated as part of a cost savings program. The Company recorded$690 of the charge to cost of services provided and $264 to selling, general and administrative expensesin the consolidated statements of income. Approximately 100 employees, mainly technicians, technicalsupport and administrative staff, were terminated as part of the cost savings program.
During the first quarter of 2003, the Company re-evaluated the marketability of certain long-livedassets related to a biopharmaceutical production facility in Maryland, which is included in thedevelopment and safety testing segment, due to a significant decline in market interest in purchasing
52
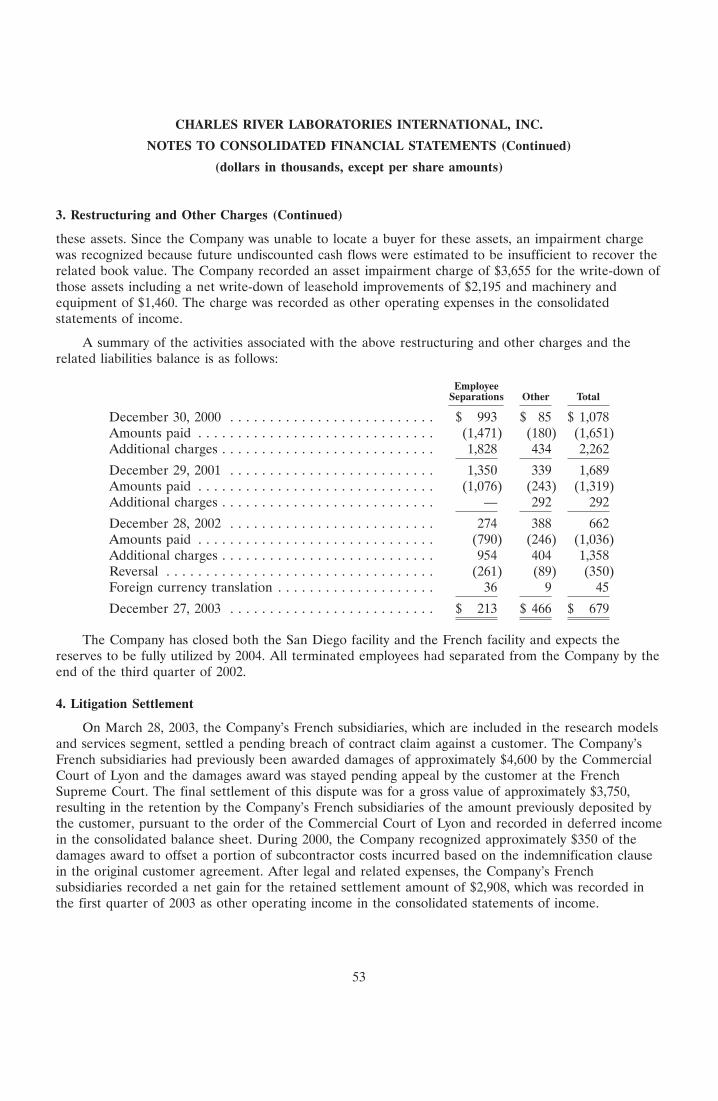
CHARLES RIVER LABORATORIES INTERNATIONAL, INC.
NOTES TO CONSOLIDATED FINANCIAL STATEMENTS (Continued)
(dollars in thousands, except per share amounts)
3. Restructuring and Other Charges (Continued)
these assets. Since the Company was unable to locate a buyer for these assets, an impairment chargewas recognized because future undiscounted cash flows were estimated to be insufficient to recover therelated book value. The Company recorded an asset impairment charge of $3,655 for the write-down ofthose assets including a net write-down of leasehold improvements of $2,195 and machinery andequipment of $1,460. The charge was recorded as other operating expenses in the consolidatedstatements of income.
A summary of the activities associated with the above restructuring and other charges and therelated liabilities balance is as follows:
EmployeeSeparations Other Total
December 30, 2000 . . . . . . . . . . . . . . . . . . . . . . . . . . $ 993 $ 85 $ 1,078Amounts paid . . . . . . . . . . . . . . . . . . . . . . . . . . . . . . (1,471) (180) (1,651)Additional charges . . . . . . . . . . . . . . . . . . . . . . . . . . . 1,828 434 2,262
December 29, 2001 . . . . . . . . . . . . . . . . . . . . . . . . . . 1,350 339 1,689Amounts paid . . . . . . . . . . . . . . . . . . . . . . . . . . . . . . (1,076) (243) (1,319)Additional charges . . . . . . . . . . . . . . . . . . . . . . . . . . . — 292 292
December 28, 2002 . . . . . . . . . . . . . . . . . . . . . . . . . . 274 388 662Amounts paid . . . . . . . . . . . . . . . . . . . . . . . . . . . . . . (790) (246) (1,036)Additional charges . . . . . . . . . . . . . . . . . . . . . . . . . . . 954 404 1,358Reversal . . . . . . . . . . . . . . . . . . . . . . . . . . . . . . . . . . (261) (89) (350)Foreign currency translation . . . . . . . . . . . . . . . . . . . . 36 9 45
December 27, 2003 . . . . . . . . . . . . . . . . . . . . . . . . . . $ 213 $ 466 $ 679
The Company has closed both the San Diego facility and the French facility and expects thereserves to be fully utilized by 2004. All terminated employees had separated from the Company by theend of the third quarter of 2002.
4. Litigation Settlement
On March 28, 2003, the Company’s French subsidiaries, which are included in the research modelsand services segment, settled a pending breach of contract claim against a customer. The Company’sFrench subsidiaries had previously been awarded damages of approximately $4,600 by the CommercialCourt of Lyon and the damages award was stayed pending appeal by the customer at the FrenchSupreme Court. The final settlement of this dispute was for a gross value of approximately $3,750,resulting in the retention by the Company’s French subsidiaries of the amount previously deposited bythe customer, pursuant to the order of the Commercial Court of Lyon and recorded in deferred incomein the consolidated balance sheet. During 2000, the Company recognized approximately $350 of thedamages award to offset a portion of subcontractor costs incurred based on the indemnification clausein the original customer agreement. After legal and related expenses, the Company’s Frenchsubsidiaries recorded a net gain for the retained settlement amount of $2,908, which was recorded inthe first quarter of 2003 as other operating income in the consolidated statements of income.
53
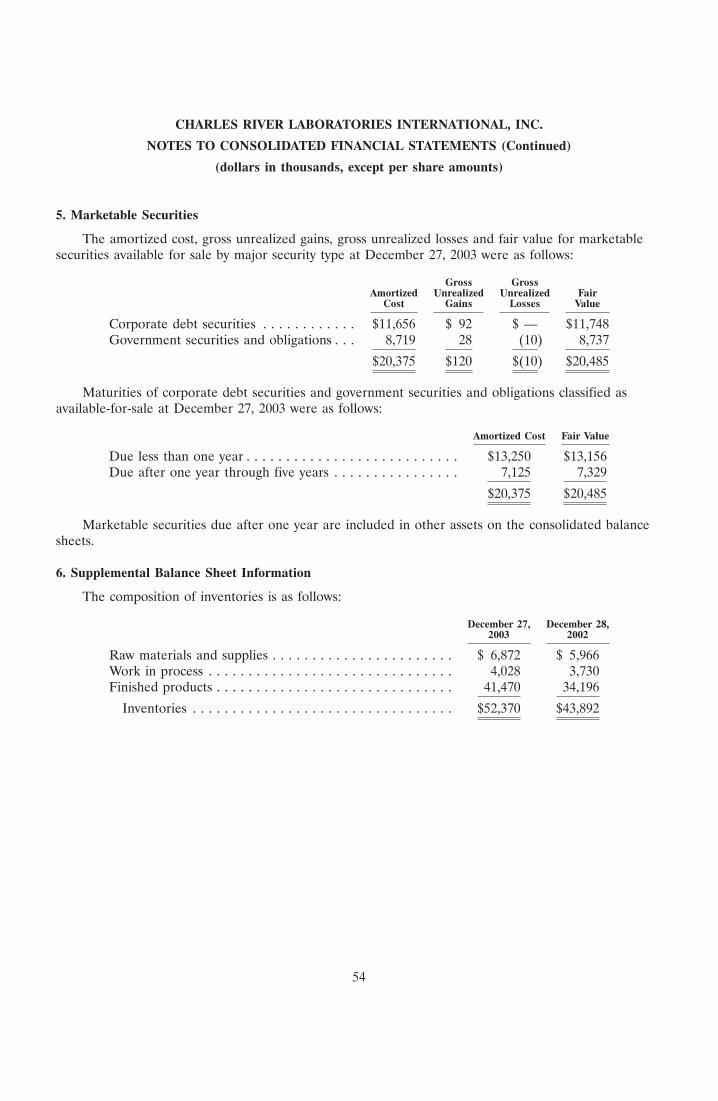
CHARLES RIVER LABORATORIES INTERNATIONAL, INC.
NOTES TO CONSOLIDATED FINANCIAL STATEMENTS (Continued)
(dollars in thousands, except per share amounts)
5. Marketable Securities
The amortized cost, gross unrealized gains, gross unrealized losses and fair value for marketablesecurities available for sale by major security type at December 27, 2003 were as follows:
Gross GrossAmortized Unrealized Unrealized Fair
Cost Gains Losses Value
Corporate debt securities . . . . . . . . . . . . $11,656 $ 92 $ — $11,748Government securities and obligations . . . 8,719 28 (10) 8,737
$20,375 $120 $(10) $20,485
Maturities of corporate debt securities and government securities and obligations classified asavailable-for-sale at December 27, 2003 were as follows:
Amortized Cost Fair Value
Due less than one year . . . . . . . . . . . . . . . . . . . . . . . . . . . $13,250 $13,156Due after one year through five years . . . . . . . . . . . . . . . . 7,125 7,329
$20,375 $20,485
Marketable securities due after one year are included in other assets on the consolidated balancesheets.
6. Supplemental Balance Sheet Information
The composition of inventories is as follows:
December 27, December 28,2003 2002
Raw materials and supplies . . . . . . . . . . . . . . . . . . . . . . . $ 6,872 $ 5,966Work in process . . . . . . . . . . . . . . . . . . . . . . . . . . . . . . . 4,028 3,730Finished products . . . . . . . . . . . . . . . . . . . . . . . . . . . . . . 41,470 34,196
Inventories . . . . . . . . . . . . . . . . . . . . . . . . . . . . . . . . . $52,370 $43,892
54
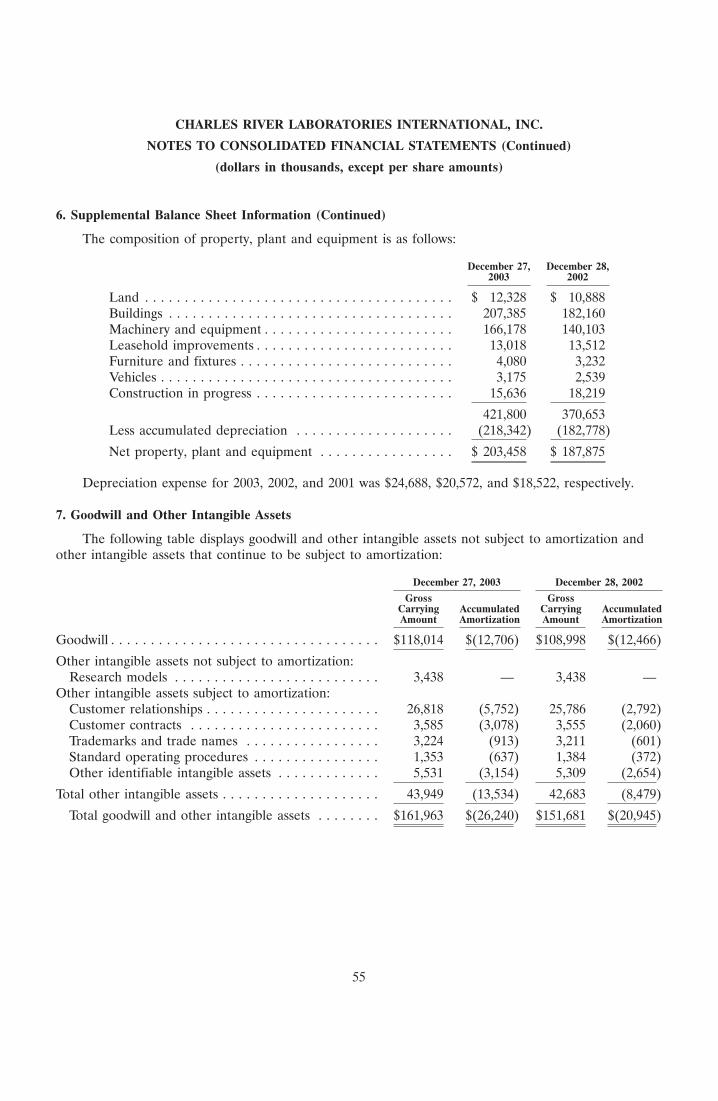
CHARLES RIVER LABORATORIES INTERNATIONAL, INC.
NOTES TO CONSOLIDATED FINANCIAL STATEMENTS (Continued)
(dollars in thousands, except per share amounts)
6. Supplemental Balance Sheet Information (Continued)
The composition of property, plant and equipment is as follows:
December 27, December 28,2003 2002
Land . . . . . . . . . . . . . . . . . . . . . . . . . . . . . . . . . . . . . . . $ 12,328 $ 10,888Buildings . . . . . . . . . . . . . . . . . . . . . . . . . . . . . . . . . . . . 207,385 182,160Machinery and equipment . . . . . . . . . . . . . . . . . . . . . . . . 166,178 140,103Leasehold improvements . . . . . . . . . . . . . . . . . . . . . . . . . 13,018 13,512Furniture and fixtures . . . . . . . . . . . . . . . . . . . . . . . . . . . 4,080 3,232Vehicles . . . . . . . . . . . . . . . . . . . . . . . . . . . . . . . . . . . . . 3,175 2,539Construction in progress . . . . . . . . . . . . . . . . . . . . . . . . . 15,636 18,219
421,800 370,653Less accumulated depreciation . . . . . . . . . . . . . . . . . . . . (218,342) (182,778)
Net property, plant and equipment . . . . . . . . . . . . . . . . . $ 203,458 $ 187,875
Depreciation expense for 2003, 2002, and 2001 was $24,688, $20,572, and $18,522, respectively.
7. Goodwill and Other Intangible Assets
The following table displays goodwill and other intangible assets not subject to amortization andother intangible assets that continue to be subject to amortization:
December 27, 2003 December 28, 2002
Gross GrossCarrying Accumulated Carrying AccumulatedAmount Amortization Amount Amortization
Goodwill . . . . . . . . . . . . . . . . . . . . . . . . . . . . . . . . . . $118,014 $(12,706) $108,998 $(12,466)
Other intangible assets not subject to amortization:Research models . . . . . . . . . . . . . . . . . . . . . . . . . . 3,438 — 3,438 —
Other intangible assets subject to amortization:Customer relationships . . . . . . . . . . . . . . . . . . . . . . 26,818 (5,752) 25,786 (2,792)Customer contracts . . . . . . . . . . . . . . . . . . . . . . . . 3,585 (3,078) 3,555 (2,060)Trademarks and trade names . . . . . . . . . . . . . . . . . 3,224 (913) 3,211 (601)Standard operating procedures . . . . . . . . . . . . . . . . 1,353 (637) 1,384 (372)Other identifiable intangible assets . . . . . . . . . . . . . 5,531 (3,154) 5,309 (2,654)
Total other intangible assets . . . . . . . . . . . . . . . . . . . . 43,949 (13,534) 42,683 (8,479)
Total goodwill and other intangible assets . . . . . . . . $161,963 $(26,240) $151,681 $(20,945)
55
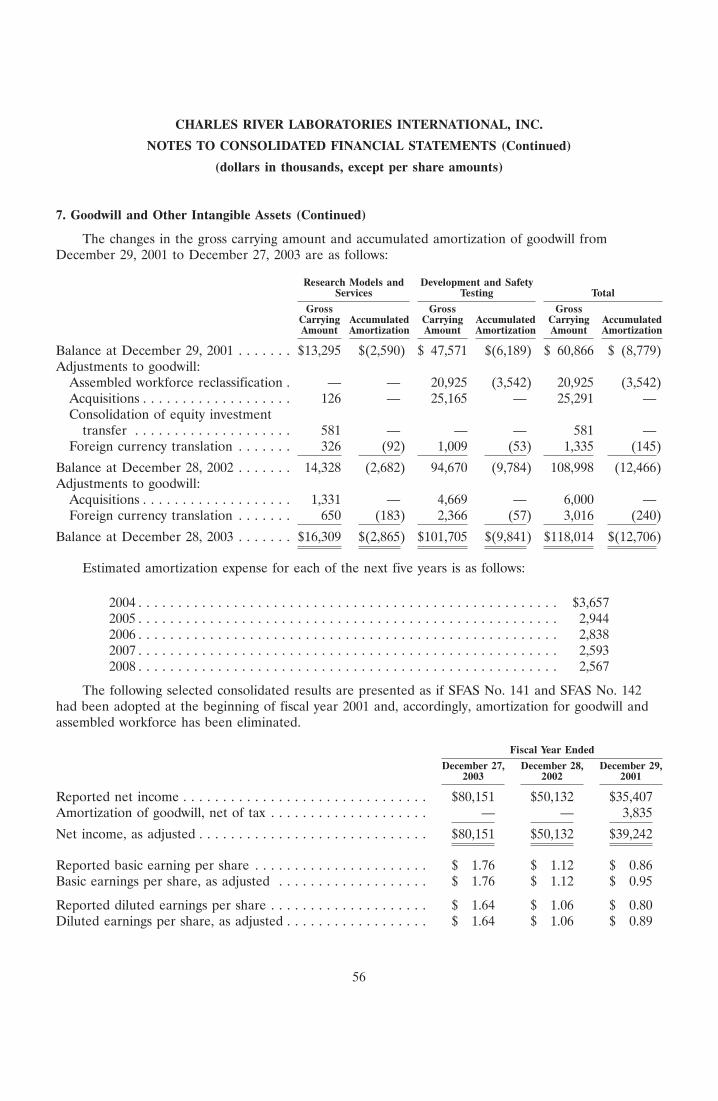
CHARLES RIVER LABORATORIES INTERNATIONAL, INC.
NOTES TO CONSOLIDATED FINANCIAL STATEMENTS (Continued)
(dollars in thousands, except per share amounts)
7. Goodwill and Other Intangible Assets (Continued)
The changes in the gross carrying amount and accumulated amortization of goodwill fromDecember 29, 2001 to December 27, 2003 are as follows:
Research Models and Development and SafetyServices Testing Total
Gross Gross GrossCarrying Accumulated Carrying Accumulated Carrying AccumulatedAmount Amortization Amount Amortization Amount Amortization
Balance at December 29, 2001 . . . . . . . $13,295 $(2,590) $ 47,571 $(6,189) $ 60,866 $ (8,779)Adjustments to goodwill:
Assembled workforce reclassification . — — 20,925 (3,542) 20,925 (3,542)Acquisitions . . . . . . . . . . . . . . . . . . . 126 — 25,165 — 25,291 —Consolidation of equity investment
transfer . . . . . . . . . . . . . . . . . . . . 581 — — — 581 —Foreign currency translation . . . . . . . 326 (92) 1,009 (53) 1,335 (145)
Balance at December 28, 2002 . . . . . . . 14,328 (2,682) 94,670 (9,784) 108,998 (12,466)Adjustments to goodwill:
Acquisitions . . . . . . . . . . . . . . . . . . . 1,331 — 4,669 — 6,000 —Foreign currency translation . . . . . . . 650 (183) 2,366 (57) 3,016 (240)
Balance at December 28, 2003 . . . . . . . $16,309 $(2,865) $101,705 $(9,841) $118,014 $(12,706)
Estimated amortization expense for each of the next five years is as follows:
2004 . . . . . . . . . . . . . . . . . . . . . . . . . . . . . . . . . . . . . . . . . . . . . . . . . . . . . $3,6572005 . . . . . . . . . . . . . . . . . . . . . . . . . . . . . . . . . . . . . . . . . . . . . . . . . . . . . 2,9442006 . . . . . . . . . . . . . . . . . . . . . . . . . . . . . . . . . . . . . . . . . . . . . . . . . . . . . 2,8382007 . . . . . . . . . . . . . . . . . . . . . . . . . . . . . . . . . . . . . . . . . . . . . . . . . . . . . 2,5932008 . . . . . . . . . . . . . . . . . . . . . . . . . . . . . . . . . . . . . . . . . . . . . . . . . . . . . 2,567
The following selected consolidated results are presented as if SFAS No. 141 and SFAS No. 142had been adopted at the beginning of fiscal year 2001 and, accordingly, amortization for goodwill andassembled workforce has been eliminated.
Fiscal Year Ended
December 27, December 28, December 29,2003 2002 2001
Reported net income . . . . . . . . . . . . . . . . . . . . . . . . . . . . . . . $80,151 $50,132 $35,407Amortization of goodwill, net of tax . . . . . . . . . . . . . . . . . . . . — — 3,835
Net income, as adjusted . . . . . . . . . . . . . . . . . . . . . . . . . . . . . $80,151 $50,132 $39,242
Reported basic earning per share . . . . . . . . . . . . . . . . . . . . . . $ 1.76 $ 1.12 $ 0.86Basic earnings per share, as adjusted . . . . . . . . . . . . . . . . . . . $ 1.76 $ 1.12 $ 0.95
Reported diluted earnings per share . . . . . . . . . . . . . . . . . . . . $ 1.64 $ 1.06 $ 0.80Diluted earnings per share, as adjusted . . . . . . . . . . . . . . . . . . $ 1.64 $ 1.06 $ 0.89
56
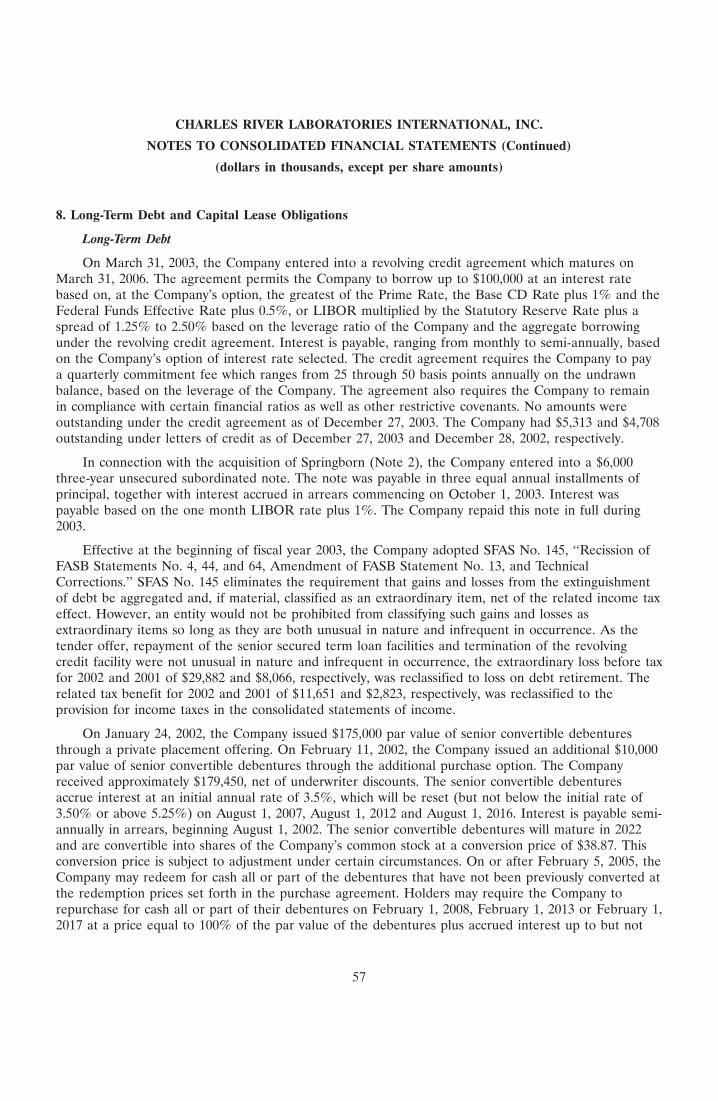
CHARLES RIVER LABORATORIES INTERNATIONAL, INC.
NOTES TO CONSOLIDATED FINANCIAL STATEMENTS (Continued)
(dollars in thousands, except per share amounts)
8. Long-Term Debt and Capital Lease Obligations
Long-Term Debt
On March 31, 2003, the Company entered into a revolving credit agreement which matures onMarch 31, 2006. The agreement permits the Company to borrow up to $100,000 at an interest ratebased on, at the Company’s option, the greatest of the Prime Rate, the Base CD Rate plus 1% and theFederal Funds Effective Rate plus 0.5%, or LIBOR multiplied by the Statutory Reserve Rate plus aspread of 1.25% to 2.50% based on the leverage ratio of the Company and the aggregate borrowingunder the revolving credit agreement. Interest is payable, ranging from monthly to semi-annually, basedon the Company’s option of interest rate selected. The credit agreement requires the Company to paya quarterly commitment fee which ranges from 25 through 50 basis points annually on the undrawnbalance, based on the leverage of the Company. The agreement also requires the Company to remainin compliance with certain financial ratios as well as other restrictive covenants. No amounts wereoutstanding under the credit agreement as of December 27, 2003. The Company had $5,313 and $4,708outstanding under letters of credit as of December 27, 2003 and December 28, 2002, respectively.
In connection with the acquisition of Springborn (Note 2), the Company entered into a $6,000three-year unsecured subordinated note. The note was payable in three equal annual installments ofprincipal, together with interest accrued in arrears commencing on October 1, 2003. Interest waspayable based on the one month LIBOR rate plus 1%. The Company repaid this note in full during2003.
Effective at the beginning of fiscal year 2003, the Company adopted SFAS No. 145, ‘‘Recission ofFASB Statements No. 4, 44, and 64, Amendment of FASB Statement No. 13, and TechnicalCorrections.’’ SFAS No. 145 eliminates the requirement that gains and losses from the extinguishmentof debt be aggregated and, if material, classified as an extraordinary item, net of the related income taxeffect. However, an entity would not be prohibited from classifying such gains and losses asextraordinary items so long as they are both unusual in nature and infrequent in occurrence. As thetender offer, repayment of the senior secured term loan facilities and termination of the revolvingcredit facility were not unusual in nature and infrequent in occurrence, the extraordinary loss before taxfor 2002 and 2001 of $29,882 and $8,066, respectively, was reclassified to loss on debt retirement. Therelated tax benefit for 2002 and 2001 of $11,651 and $2,823, respectively, was reclassified to theprovision for income taxes in the consolidated statements of income.
On January 24, 2002, the Company issued $175,000 par value of senior convertible debenturesthrough a private placement offering. On February 11, 2002, the Company issued an additional $10,000par value of senior convertible debentures through the additional purchase option. The Companyreceived approximately $179,450, net of underwriter discounts. The senior convertible debenturesaccrue interest at an initial annual rate of 3.5%, which will be reset (but not below the initial rate of3.50% or above 5.25%) on August 1, 2007, August 1, 2012 and August 1, 2016. Interest is payable semi-annually in arrears, beginning August 1, 2002. The senior convertible debentures will mature in 2022and are convertible into shares of the Company’s common stock at a conversion price of $38.87. Thisconversion price is subject to adjustment under certain circumstances. On or after February 5, 2005, theCompany may redeem for cash all or part of the debentures that have not been previously converted atthe redemption prices set forth in the purchase agreement. Holders may require the Company torepurchase for cash all or part of their debentures on February 1, 2008, February 1, 2013 or February 1,2017 at a price equal to 100% of the par value of the debentures plus accrued interest up to but not
57
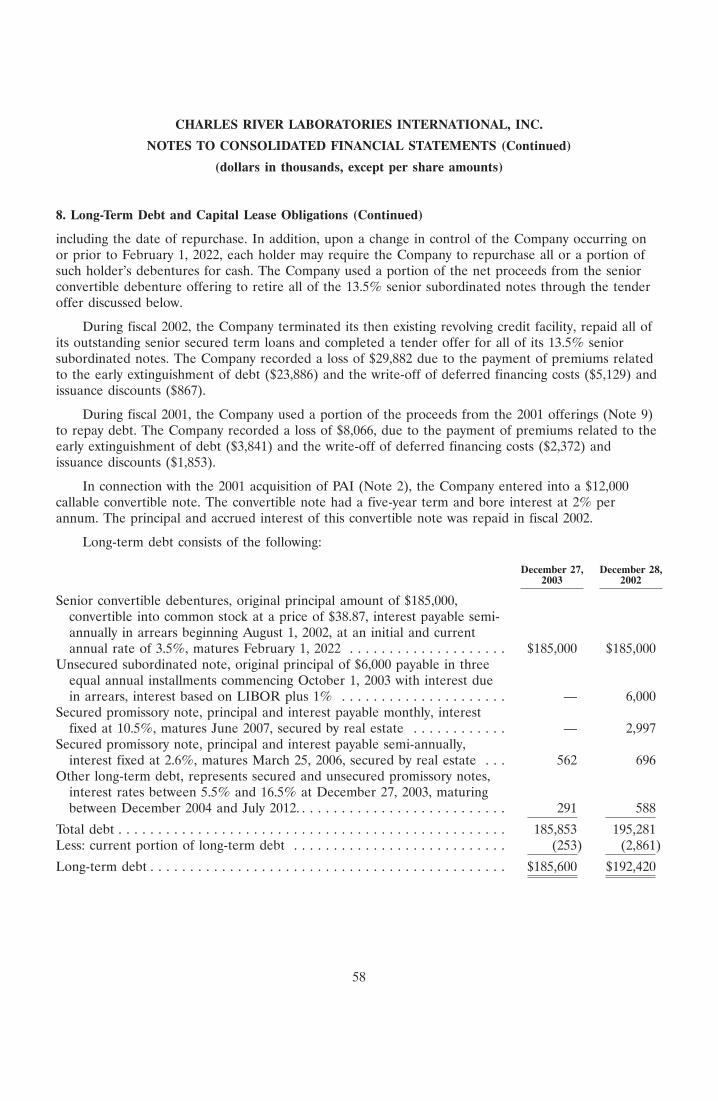
CHARLES RIVER LABORATORIES INTERNATIONAL, INC.
NOTES TO CONSOLIDATED FINANCIAL STATEMENTS (Continued)
(dollars in thousands, except per share amounts)
8. Long-Term Debt and Capital Lease Obligations (Continued)
including the date of repurchase. In addition, upon a change in control of the Company occurring onor prior to February 1, 2022, each holder may require the Company to repurchase all or a portion ofsuch holder’s debentures for cash. The Company used a portion of the net proceeds from the seniorconvertible debenture offering to retire all of the 13.5% senior subordinated notes through the tenderoffer discussed below.
During fiscal 2002, the Company terminated its then existing revolving credit facility, repaid all ofits outstanding senior secured term loans and completed a tender offer for all of its 13.5% seniorsubordinated notes. The Company recorded a loss of $29,882 due to the payment of premiums relatedto the early extinguishment of debt ($23,886) and the write-off of deferred financing costs ($5,129) andissuance discounts ($867).
During fiscal 2001, the Company used a portion of the proceeds from the 2001 offerings (Note 9)to repay debt. The Company recorded a loss of $8,066, due to the payment of premiums related to theearly extinguishment of debt ($3,841) and the write-off of deferred financing costs ($2,372) andissuance discounts ($1,853).
In connection with the 2001 acquisition of PAI (Note 2), the Company entered into a $12,000callable convertible note. The convertible note had a five-year term and bore interest at 2% perannum. The principal and accrued interest of this convertible note was repaid in fiscal 2002.
Long-term debt consists of the following:
December 27, December 28,2003 2002
Senior convertible debentures, original principal amount of $185,000,convertible into common stock at a price of $38.87, interest payable semi-annually in arrears beginning August 1, 2002, at an initial and currentannual rate of 3.5%, matures February 1, 2022 . . . . . . . . . . . . . . . . . . . . $185,000 $185,000
Unsecured subordinated note, original principal of $6,000 payable in threeequal annual installments commencing October 1, 2003 with interest duein arrears, interest based on LIBOR plus 1% . . . . . . . . . . . . . . . . . . . . . — 6,000
Secured promissory note, principal and interest payable monthly, interestfixed at 10.5%, matures June 2007, secured by real estate . . . . . . . . . . . . — 2,997
Secured promissory note, principal and interest payable semi-annually,interest fixed at 2.6%, matures March 25, 2006, secured by real estate . . . 562 696
Other long-term debt, represents secured and unsecured promissory notes,interest rates between 5.5% and 16.5% at December 27, 2003, maturingbetween December 2004 and July 2012. . . . . . . . . . . . . . . . . . . . . . . . . . . 291 588
Total debt . . . . . . . . . . . . . . . . . . . . . . . . . . . . . . . . . . . . . . . . . . . . . . . . . 185,853 195,281Less: current portion of long-term debt . . . . . . . . . . . . . . . . . . . . . . . . . . . (253) (2,861)
Long-term debt . . . . . . . . . . . . . . . . . . . . . . . . . . . . . . . . . . . . . . . . . . . . . $185,600 $192,420
58

CHARLES RIVER LABORATORIES INTERNATIONAL, INC.
NOTES TO CONSOLIDATED FINANCIAL STATEMENTS (Continued)
(dollars in thousands, except per share amounts)
8. Long-Term Debt and Capital Lease Obligations (Continued)
Minimum future principal payments of long-term debt at December 27, 2003 are as follows:
Fiscal Year
2004 . . . . . . . . . . . . . . . . . . . . . . . . . . . . . . . . . . . . . . . . . . . . . . . . . . . $ 2532005 . . . . . . . . . . . . . . . . . . . . . . . . . . . . . . . . . . . . . . . . . . . . . . . . . . . 3302006 . . . . . . . . . . . . . . . . . . . . . . . . . . . . . . . . . . . . . . . . . . . . . . . . . . . 1292007 . . . . . . . . . . . . . . . . . . . . . . . . . . . . . . . . . . . . . . . . . . . . . . . . . . . 72008 . . . . . . . . . . . . . . . . . . . . . . . . . . . . . . . . . . . . . . . . . . . . . . . . . . . 185,007Thereafter . . . . . . . . . . . . . . . . . . . . . . . . . . . . . . . . . . . . . . . . . . . . . . . 127
Total . . . . . . . . . . . . . . . . . . . . . . . . . . . . . . . . . . . . . . . . . . . . . . . . . $185,853
Capital Leases
The Company has one capital lease for a building and numerous capital leases for equipment.These leases are capitalized using interest rates considered appropriate at the inception of each lease.Assets recorded in connection with these capital leases are not material.
Capital lease obligations amounted to $149 and $537 at December 27, 2003 and December 28,2002, respectively, with maturities through July 2007 at interest rates ranging from 4.6% to 9.5%.
9. Shareholders’ Equity
Earnings Per Share
Basic earnings per share for the years ended December 27, 2003, December 28, 2002 andDecember 29, 2001 was computed by dividing earnings available to common shareholders for theseperiods by the weighted average number of common shares outstanding in the respective periodsadjusted for contingently issuable shares. The weighted average number of common shares outstandingfor the years ended December 27, 2003, December 28, 2002 and December 29, 2001 have beenadjusted to include common stock equivalents for the purpose of calculating diluted earnings per sharefor these periods.
Options to purchase 3,234,201 shares, 141,624 shares and 715,625 shares were outstanding atDecember 27, 2003, December 28, 2002 and December 29, 2001, respectively, but were not included incomputing diluted earnings per share because their inclusion would have been anti-dilutive.
Basic weighted average shares outstanding for 2003 and 2002 excluded the weighted averageimpact of 20,000 shares of contingently issuable shares. There was no exclusion of contingently issuableshares in basic weighted average shares outstanding during 2001. In addition, weighted average sharesoutstanding for 2003, 2002 and 2001 excluded the weighted average impact of 72,139, 61,669 and 11,500shares, respectively, of non-vested fixed restricted stock awards.
59
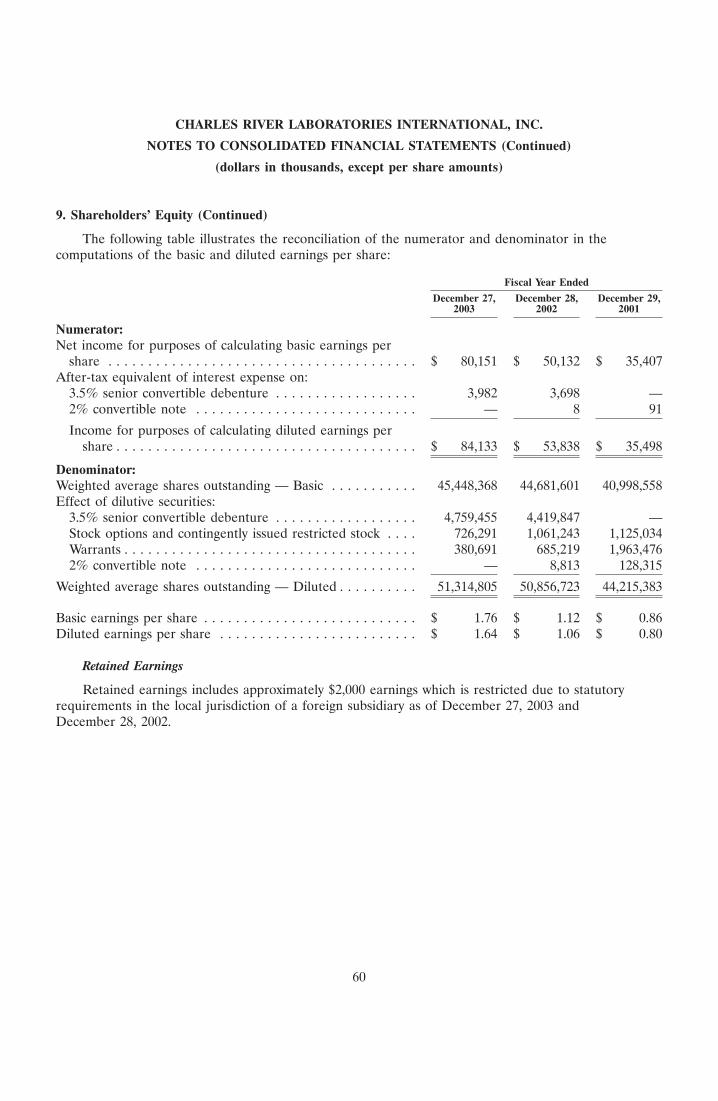
CHARLES RIVER LABORATORIES INTERNATIONAL, INC.
NOTES TO CONSOLIDATED FINANCIAL STATEMENTS (Continued)
(dollars in thousands, except per share amounts)
9. Shareholders’ Equity (Continued)
The following table illustrates the reconciliation of the numerator and denominator in thecomputations of the basic and diluted earnings per share:
Fiscal Year Ended
December 27, December 28, December 29,2003 2002 2001
Numerator:Net income for purposes of calculating basic earnings per
share . . . . . . . . . . . . . . . . . . . . . . . . . . . . . . . . . . . . . . . $ 80,151 $ 50,132 $ 35,407After-tax equivalent of interest expense on:
3.5% senior convertible debenture . . . . . . . . . . . . . . . . . . 3,982 3,698 —2% convertible note . . . . . . . . . . . . . . . . . . . . . . . . . . . . — 8 91
Income for purposes of calculating diluted earnings pershare . . . . . . . . . . . . . . . . . . . . . . . . . . . . . . . . . . . . . . $ 84,133 $ 53,838 $ 35,498
Denominator:Weighted average shares outstanding — Basic . . . . . . . . . . . 45,448,368 44,681,601 40,998,558Effect of dilutive securities:
3.5% senior convertible debenture . . . . . . . . . . . . . . . . . . 4,759,455 4,419,847 —Stock options and contingently issued restricted stock . . . . 726,291 1,061,243 1,125,034Warrants . . . . . . . . . . . . . . . . . . . . . . . . . . . . . . . . . . . . . 380,691 685,219 1,963,4762% convertible note . . . . . . . . . . . . . . . . . . . . . . . . . . . . — 8,813 128,315
Weighted average shares outstanding — Diluted . . . . . . . . . . 51,314,805 50,856,723 44,215,383
Basic earnings per share . . . . . . . . . . . . . . . . . . . . . . . . . . . $ 1.76 $ 1.12 $ 0.86Diluted earnings per share . . . . . . . . . . . . . . . . . . . . . . . . . $ 1.64 $ 1.06 $ 0.80
Retained Earnings
Retained earnings includes approximately $2,000 earnings which is restricted due to statutoryrequirements in the local jurisdiction of a foreign subsidiary as of December 27, 2003 andDecember 28, 2002.
60
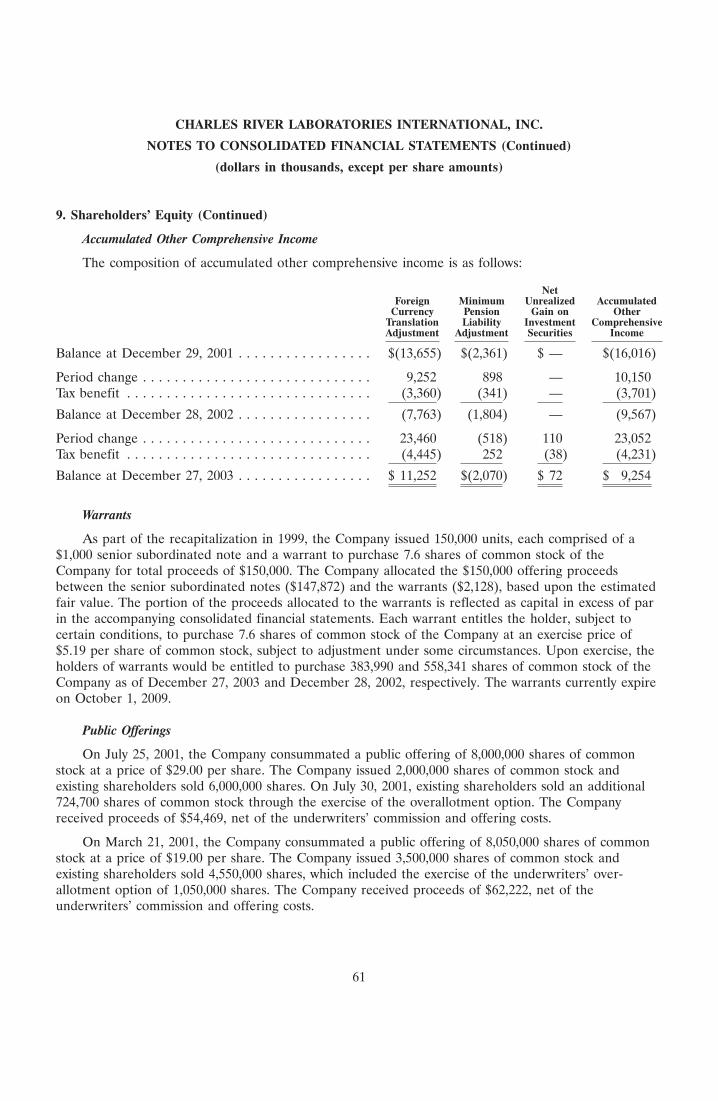
CHARLES RIVER LABORATORIES INTERNATIONAL, INC.
NOTES TO CONSOLIDATED FINANCIAL STATEMENTS (Continued)
(dollars in thousands, except per share amounts)
9. Shareholders’ Equity (Continued)
Accumulated Other Comprehensive Income
The composition of accumulated other comprehensive income is as follows:
NetForeign Minimum Unrealized Accumulated
Currency Pension Gain on OtherTranslation Liability Investment ComprehensiveAdjustment Adjustment Securities Income
Balance at December 29, 2001 . . . . . . . . . . . . . . . . . $(13,655) $(2,361) $ — $(16,016)
Period change . . . . . . . . . . . . . . . . . . . . . . . . . . . . . 9,252 898 — 10,150Tax benefit . . . . . . . . . . . . . . . . . . . . . . . . . . . . . . . (3,360) (341) — (3,701)
Balance at December 28, 2002 . . . . . . . . . . . . . . . . . (7,763) (1,804) — (9,567)
Period change . . . . . . . . . . . . . . . . . . . . . . . . . . . . . 23,460 (518) 110 23,052Tax benefit . . . . . . . . . . . . . . . . . . . . . . . . . . . . . . . (4,445) 252 (38) (4,231)
Balance at December 27, 2003 . . . . . . . . . . . . . . . . . $ 11,252 $(2,070) $ 72 $ 9,254
Warrants
As part of the recapitalization in 1999, the Company issued 150,000 units, each comprised of a$1,000 senior subordinated note and a warrant to purchase 7.6 shares of common stock of theCompany for total proceeds of $150,000. The Company allocated the $150,000 offering proceedsbetween the senior subordinated notes ($147,872) and the warrants ($2,128), based upon the estimatedfair value. The portion of the proceeds allocated to the warrants is reflected as capital in excess of parin the accompanying consolidated financial statements. Each warrant entitles the holder, subject tocertain conditions, to purchase 7.6 shares of common stock of the Company at an exercise price of$5.19 per share of common stock, subject to adjustment under some circumstances. Upon exercise, theholders of warrants would be entitled to purchase 383,990 and 558,341 shares of common stock of theCompany as of December 27, 2003 and December 28, 2002, respectively. The warrants currently expireon October 1, 2009.
Public Offerings
On July 25, 2001, the Company consummated a public offering of 8,000,000 shares of commonstock at a price of $29.00 per share. The Company issued 2,000,000 shares of common stock andexisting shareholders sold 6,000,000 shares. On July 30, 2001, existing shareholders sold an additional724,700 shares of common stock through the exercise of the overallotment option. The Companyreceived proceeds of $54,469, net of the underwriters’ commission and offering costs.
On March 21, 2001, the Company consummated a public offering of 8,050,000 shares of commonstock at a price of $19.00 per share. The Company issued 3,500,000 shares of common stock andexisting shareholders sold 4,550,000 shares, which included the exercise of the underwriters’ over-allotment option of 1,050,000 shares. The Company received proceeds of $62,222, net of theunderwriters’ commission and offering costs.
61
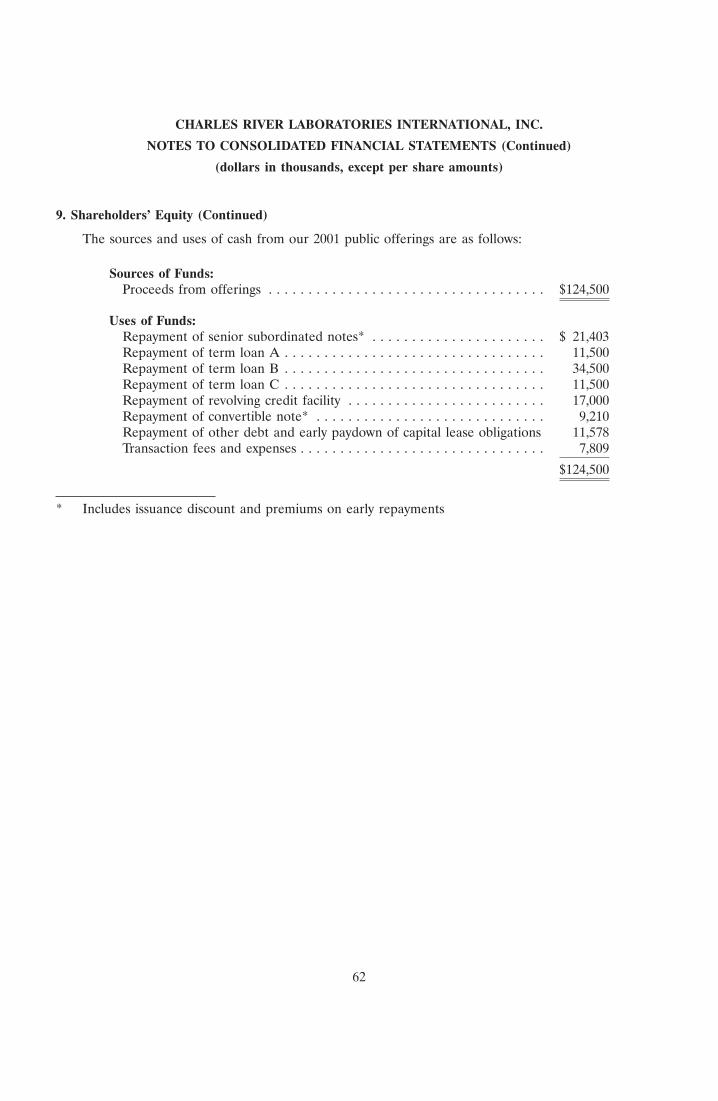
CHARLES RIVER LABORATORIES INTERNATIONAL, INC.
NOTES TO CONSOLIDATED FINANCIAL STATEMENTS (Continued)
(dollars in thousands, except per share amounts)
9. Shareholders’ Equity (Continued)
The sources and uses of cash from our 2001 public offerings are as follows:
Sources of Funds:Proceeds from offerings . . . . . . . . . . . . . . . . . . . . . . . . . . . . . . . . . . . $124,500
Uses of Funds:Repayment of senior subordinated notes* . . . . . . . . . . . . . . . . . . . . . . $ 21,403Repayment of term loan A . . . . . . . . . . . . . . . . . . . . . . . . . . . . . . . . . 11,500Repayment of term loan B . . . . . . . . . . . . . . . . . . . . . . . . . . . . . . . . . 34,500Repayment of term loan C . . . . . . . . . . . . . . . . . . . . . . . . . . . . . . . . . 11,500Repayment of revolving credit facility . . . . . . . . . . . . . . . . . . . . . . . . . 17,000Repayment of convertible note* . . . . . . . . . . . . . . . . . . . . . . . . . . . . . 9,210Repayment of other debt and early paydown of capital lease obligations 11,578Transaction fees and expenses . . . . . . . . . . . . . . . . . . . . . . . . . . . . . . . 7,809
$124,500
* Includes issuance discount and premiums on early repayments
62
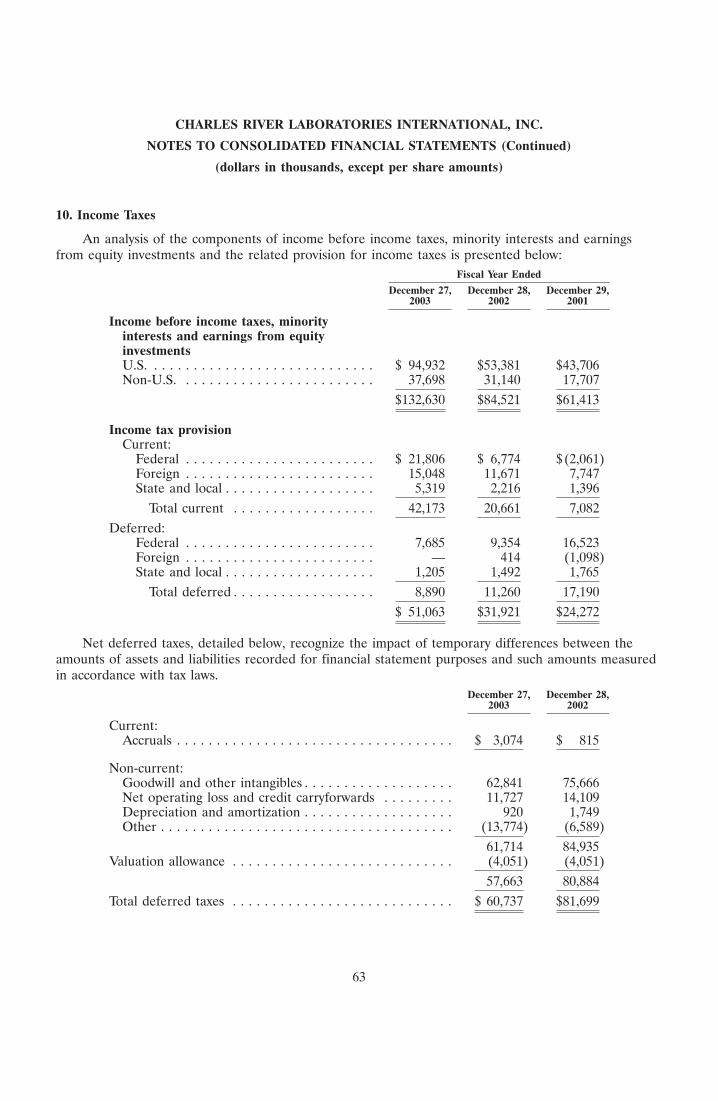
CHARLES RIVER LABORATORIES INTERNATIONAL, INC.
NOTES TO CONSOLIDATED FINANCIAL STATEMENTS (Continued)
(dollars in thousands, except per share amounts)
10. Income Taxes
An analysis of the components of income before income taxes, minority interests and earningsfrom equity investments and the related provision for income taxes is presented below:
Fiscal Year Ended
December 27, December 28, December 29,2003 2002 2001
Income before income taxes, minorityinterests and earnings from equityinvestmentsU.S. . . . . . . . . . . . . . . . . . . . . . . . . . . . . $ 94,932 $53,381 $43,706Non-U.S. . . . . . . . . . . . . . . . . . . . . . . . . 37,698 31,140 17,707
$132,630 $84,521 $61,413
Income tax provisionCurrent:
Federal . . . . . . . . . . . . . . . . . . . . . . . . $ 21,806 $ 6,774 $(2,061)Foreign . . . . . . . . . . . . . . . . . . . . . . . . 15,048 11,671 7,747State and local . . . . . . . . . . . . . . . . . . . 5,319 2,216 1,396
Total current . . . . . . . . . . . . . . . . . . 42,173 20,661 7,082Deferred:
Federal . . . . . . . . . . . . . . . . . . . . . . . . 7,685 9,354 16,523Foreign . . . . . . . . . . . . . . . . . . . . . . . . — 414 (1,098)State and local . . . . . . . . . . . . . . . . . . . 1,205 1,492 1,765
Total deferred . . . . . . . . . . . . . . . . . . 8,890 11,260 17,190$ 51,063 $31,921 $24,272
Net deferred taxes, detailed below, recognize the impact of temporary differences between theamounts of assets and liabilities recorded for financial statement purposes and such amounts measuredin accordance with tax laws.
December 27, December 28,2003 2002
Current:Accruals . . . . . . . . . . . . . . . . . . . . . . . . . . . . . . . . . . . $ 3,074 $ 815
Non-current:Goodwill and other intangibles . . . . . . . . . . . . . . . . . . . 62,841 75,666Net operating loss and credit carryforwards . . . . . . . . . 11,727 14,109Depreciation and amortization . . . . . . . . . . . . . . . . . . . 920 1,749Other . . . . . . . . . . . . . . . . . . . . . . . . . . . . . . . . . . . . . (13,774) (6,589)
61,714 84,935Valuation allowance . . . . . . . . . . . . . . . . . . . . . . . . . . . . (4,051) (4,051)
57,663 80,884Total deferred taxes . . . . . . . . . . . . . . . . . . . . . . . . . . . . $ 60,737 $81,699
63
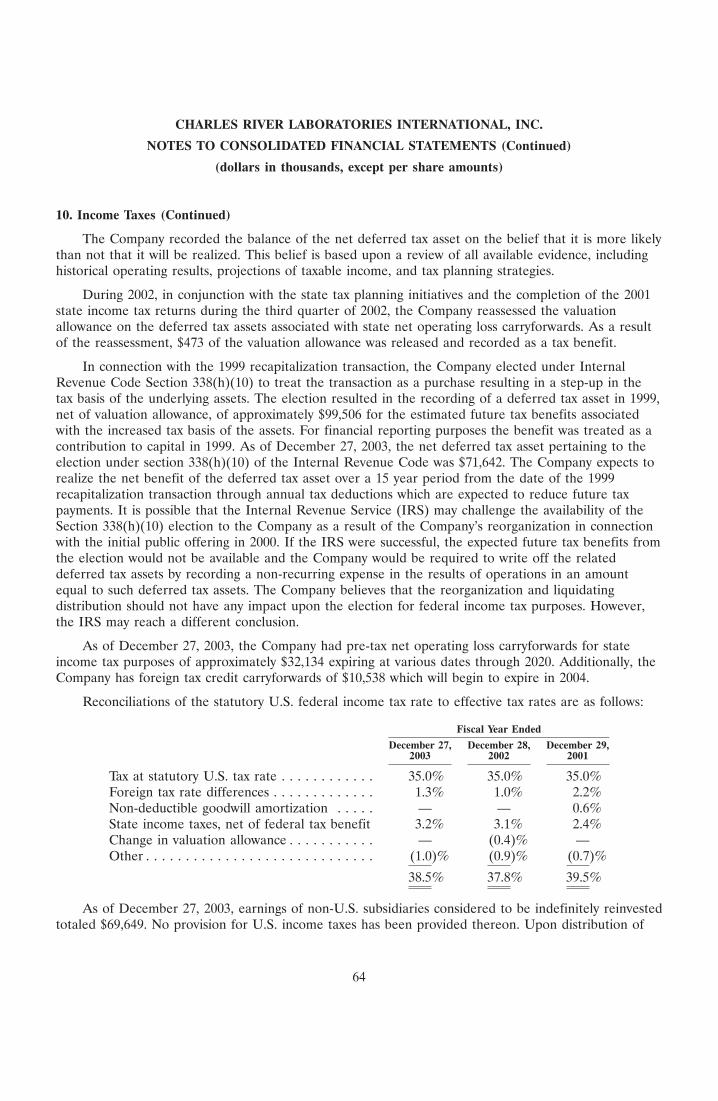
CHARLES RIVER LABORATORIES INTERNATIONAL, INC.
NOTES TO CONSOLIDATED FINANCIAL STATEMENTS (Continued)
(dollars in thousands, except per share amounts)
10. Income Taxes (Continued)
The Company recorded the balance of the net deferred tax asset on the belief that it is more likelythan not that it will be realized. This belief is based upon a review of all available evidence, includinghistorical operating results, projections of taxable income, and tax planning strategies.
During 2002, in conjunction with the state tax planning initiatives and the completion of the 2001state income tax returns during the third quarter of 2002, the Company reassessed the valuationallowance on the deferred tax assets associated with state net operating loss carryforwards. As a resultof the reassessment, $473 of the valuation allowance was released and recorded as a tax benefit.
In connection with the 1999 recapitalization transaction, the Company elected under InternalRevenue Code Section 338(h)(10) to treat the transaction as a purchase resulting in a step-up in thetax basis of the underlying assets. The election resulted in the recording of a deferred tax asset in 1999,net of valuation allowance, of approximately $99,506 for the estimated future tax benefits associatedwith the increased tax basis of the assets. For financial reporting purposes the benefit was treated as acontribution to capital in 1999. As of December 27, 2003, the net deferred tax asset pertaining to theelection under section 338(h)(10) of the Internal Revenue Code was $71,642. The Company expects torealize the net benefit of the deferred tax asset over a 15 year period from the date of the 1999recapitalization transaction through annual tax deductions which are expected to reduce future taxpayments. It is possible that the Internal Revenue Service (IRS) may challenge the availability of theSection 338(h)(10) election to the Company as a result of the Company’s reorganization in connectionwith the initial public offering in 2000. If the IRS were successful, the expected future tax benefits fromthe election would not be available and the Company would be required to write off the relateddeferred tax assets by recording a non-recurring expense in the results of operations in an amountequal to such deferred tax assets. The Company believes that the reorganization and liquidatingdistribution should not have any impact upon the election for federal income tax purposes. However,the IRS may reach a different conclusion.
As of December 27, 2003, the Company had pre-tax net operating loss carryforwards for stateincome tax purposes of approximately $32,134 expiring at various dates through 2020. Additionally, theCompany has foreign tax credit carryforwards of $10,538 which will begin to expire in 2004.
Reconciliations of the statutory U.S. federal income tax rate to effective tax rates are as follows:
Fiscal Year Ended
December 27, December 28, December 29,2003 2002 2001
Tax at statutory U.S. tax rate . . . . . . . . . . . . 35.0% 35.0% 35.0%Foreign tax rate differences . . . . . . . . . . . . . 1.3% 1.0% 2.2%Non-deductible goodwill amortization . . . . . — — 0.6%State income taxes, net of federal tax benefit 3.2% 3.1% 2.4%Change in valuation allowance . . . . . . . . . . . — (0.4)% —Other . . . . . . . . . . . . . . . . . . . . . . . . . . . . . (1.0)% (0.9)% (0.7)%
38.5% 37.8% 39.5%
As of December 27, 2003, earnings of non-U.S. subsidiaries considered to be indefinitely reinvestedtotaled $69,649. No provision for U.S. income taxes has been provided thereon. Upon distribution of
64
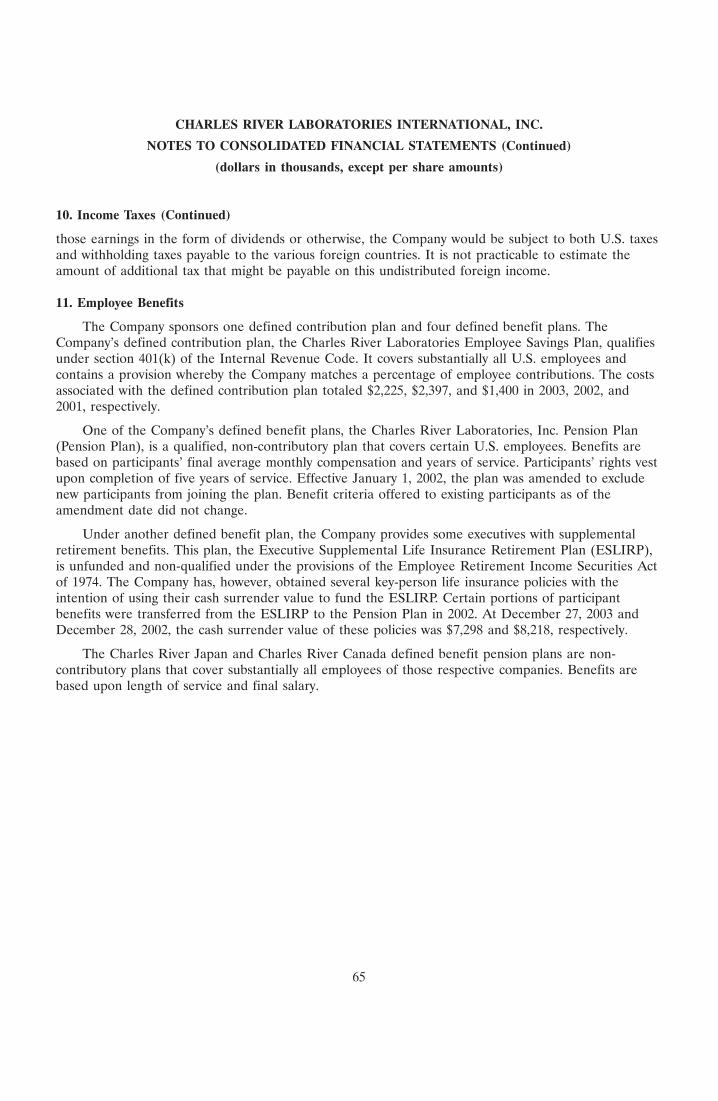
CHARLES RIVER LABORATORIES INTERNATIONAL, INC.
NOTES TO CONSOLIDATED FINANCIAL STATEMENTS (Continued)
(dollars in thousands, except per share amounts)
10. Income Taxes (Continued)
those earnings in the form of dividends or otherwise, the Company would be subject to both U.S. taxesand withholding taxes payable to the various foreign countries. It is not practicable to estimate theamount of additional tax that might be payable on this undistributed foreign income.
11. Employee Benefits
The Company sponsors one defined contribution plan and four defined benefit plans. TheCompany’s defined contribution plan, the Charles River Laboratories Employee Savings Plan, qualifiesunder section 401(k) of the Internal Revenue Code. It covers substantially all U.S. employees andcontains a provision whereby the Company matches a percentage of employee contributions. The costsassociated with the defined contribution plan totaled $2,225, $2,397, and $1,400 in 2003, 2002, and2001, respectively.
One of the Company’s defined benefit plans, the Charles River Laboratories, Inc. Pension Plan(Pension Plan), is a qualified, non-contributory plan that covers certain U.S. employees. Benefits arebased on participants’ final average monthly compensation and years of service. Participants’ rights vestupon completion of five years of service. Effective January 1, 2002, the plan was amended to excludenew participants from joining the plan. Benefit criteria offered to existing participants as of theamendment date did not change.
Under another defined benefit plan, the Company provides some executives with supplementalretirement benefits. This plan, the Executive Supplemental Life Insurance Retirement Plan (ESLIRP),is unfunded and non-qualified under the provisions of the Employee Retirement Income Securities Actof 1974. The Company has, however, obtained several key-person life insurance policies with theintention of using their cash surrender value to fund the ESLIRP. Certain portions of participantbenefits were transferred from the ESLIRP to the Pension Plan in 2002. At December 27, 2003 andDecember 28, 2002, the cash surrender value of these policies was $7,298 and $8,218, respectively.
The Charles River Japan and Charles River Canada defined benefit pension plans are non-contributory plans that cover substantially all employees of those respective companies. Benefits arebased upon length of service and final salary.
65
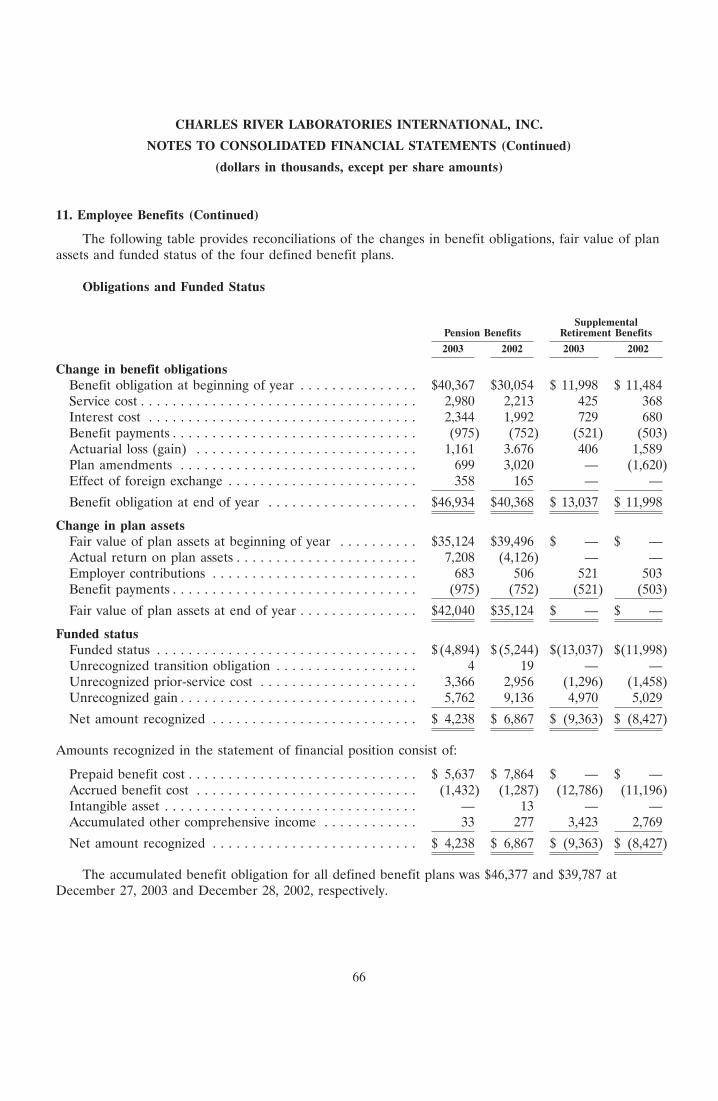
CHARLES RIVER LABORATORIES INTERNATIONAL, INC.
NOTES TO CONSOLIDATED FINANCIAL STATEMENTS (Continued)
(dollars in thousands, except per share amounts)
11. Employee Benefits (Continued)
The following table provides reconciliations of the changes in benefit obligations, fair value of planassets and funded status of the four defined benefit plans.
Obligations and Funded Status
SupplementalPension Benefits Retirement Benefits
2003 2002 2003 2002
Change in benefit obligationsBenefit obligation at beginning of year . . . . . . . . . . . . . . . $40,367 $30,054 $ 11,998 $ 11,484Service cost . . . . . . . . . . . . . . . . . . . . . . . . . . . . . . . . . . . 2,980 2,213 425 368Interest cost . . . . . . . . . . . . . . . . . . . . . . . . . . . . . . . . . . 2,344 1,992 729 680Benefit payments . . . . . . . . . . . . . . . . . . . . . . . . . . . . . . . (975) (752) (521) (503)Actuarial loss (gain) . . . . . . . . . . . . . . . . . . . . . . . . . . . . 1,161 3.676 406 1,589Plan amendments . . . . . . . . . . . . . . . . . . . . . . . . . . . . . . 699 3,020 — (1,620)Effect of foreign exchange . . . . . . . . . . . . . . . . . . . . . . . . 358 165 — —
Benefit obligation at end of year . . . . . . . . . . . . . . . . . . . $46,934 $40,368 $ 13,037 $ 11,998
Change in plan assetsFair value of plan assets at beginning of year . . . . . . . . . . $35,124 $39,496 $ — $ —Actual return on plan assets . . . . . . . . . . . . . . . . . . . . . . . 7,208 (4,126) — —Employer contributions . . . . . . . . . . . . . . . . . . . . . . . . . . 683 506 521 503Benefit payments . . . . . . . . . . . . . . . . . . . . . . . . . . . . . . . (975) (752) (521) (503)
Fair value of plan assets at end of year . . . . . . . . . . . . . . . $42,040 $35,124 $ — $ —
Funded statusFunded status . . . . . . . . . . . . . . . . . . . . . . . . . . . . . . . . . $ (4,894) $(5,244) $(13,037) $(11,998)Unrecognized transition obligation . . . . . . . . . . . . . . . . . . 4 19 — —Unrecognized prior-service cost . . . . . . . . . . . . . . . . . . . . 3,366 2,956 (1,296) (1,458)Unrecognized gain . . . . . . . . . . . . . . . . . . . . . . . . . . . . . . 5,762 9,136 4,970 5,029
Net amount recognized . . . . . . . . . . . . . . . . . . . . . . . . . . $ 4,238 $ 6,867 $ (9,363) $ (8,427)
Amounts recognized in the statement of financial position consist of:
Prepaid benefit cost . . . . . . . . . . . . . . . . . . . . . . . . . . . . . $ 5,637 $ 7,864 $ — $ —Accrued benefit cost . . . . . . . . . . . . . . . . . . . . . . . . . . . . (1,432) (1,287) (12,786) (11,196)Intangible asset . . . . . . . . . . . . . . . . . . . . . . . . . . . . . . . . — 13 — —Accumulated other comprehensive income . . . . . . . . . . . . 33 277 3,423 2,769
Net amount recognized . . . . . . . . . . . . . . . . . . . . . . . . . . $ 4,238 $ 6,867 $ (9,363) $ (8,427)
The accumulated benefit obligation for all defined benefit plans was $46,377 and $39,787 atDecember 27, 2003 and December 28, 2002, respectively.
66

CHARLES RIVER LABORATORIES INTERNATIONAL, INC.
NOTES TO CONSOLIDATED FINANCIAL STATEMENTS (Continued)
(dollars in thousands, except per share amounts)
11. Employee Benefits (Continued)
Information for defined benefit plans with an accumulated benefit obligation in excess of planassets
SupplementalPension Benefits Retirement Benefits
2003 2002 2003 2002
Projected benefit obligation . . . . . . . . . . . . . . $6,396 $5,741 $13,037 $11,998Accumulated benefit obligation . . . . . . . . . . . . 5,301 3,951 12,786 11,196Fair value of plan assets . . . . . . . . . . . . . . . . . 3,510 3,033 — —
Components of net periodic benefit cost
SupplementalPension Benefits Retirement Benefits
2003 2002 2001 2003 2002 2001
Service cost . . . . . . . . . . . . . . . . . . . $ 2,980 $ 2,213 $ 1,551 $ 425 $ 368 $ 323Interest cost . . . . . . . . . . . . . . . . . . 2,344 1,992 1,488 729 680 692Expected return on plan assets . . . . . (2,925) (3,477) (4,295) — — —Amortization of transition
obligation . . . . . . . . . . . . . . . . . . 16 84 85 — 72 —Amortization of prior service cost . . 288 235 (5) (162) (162) —Amortization of net loss (gain) . . . . 460 50 (934) 466 358 —
Net periodic benefit cost (income) . . $ 3,163 $ 1,097 $(2,110) $1,458 $1,316 $1,015
Additional information
SupplementalPension Benefits Retirement Benefits
2003 2002 2003 2002
Increase (decrease) in minimum liabilityincluded in other comprehensive income,net of tax . . . . . . . . . . . . . . . . . . . . . . . . . $(136) $(4) $402 $(553)
Assumptions
Weighted-average assumptions used to determine benefit obligations
SupplementalPension Benefits Retirement Benefits
2003 2002 2003 2002
Discount rate . . . . . . . . . . . . . . . . . . . . 5.72% 5.73% 6.00% 6.00%Rate of compensation increase . . . . . . . . 4.53% 4.58% 4.75% 4.75%
67
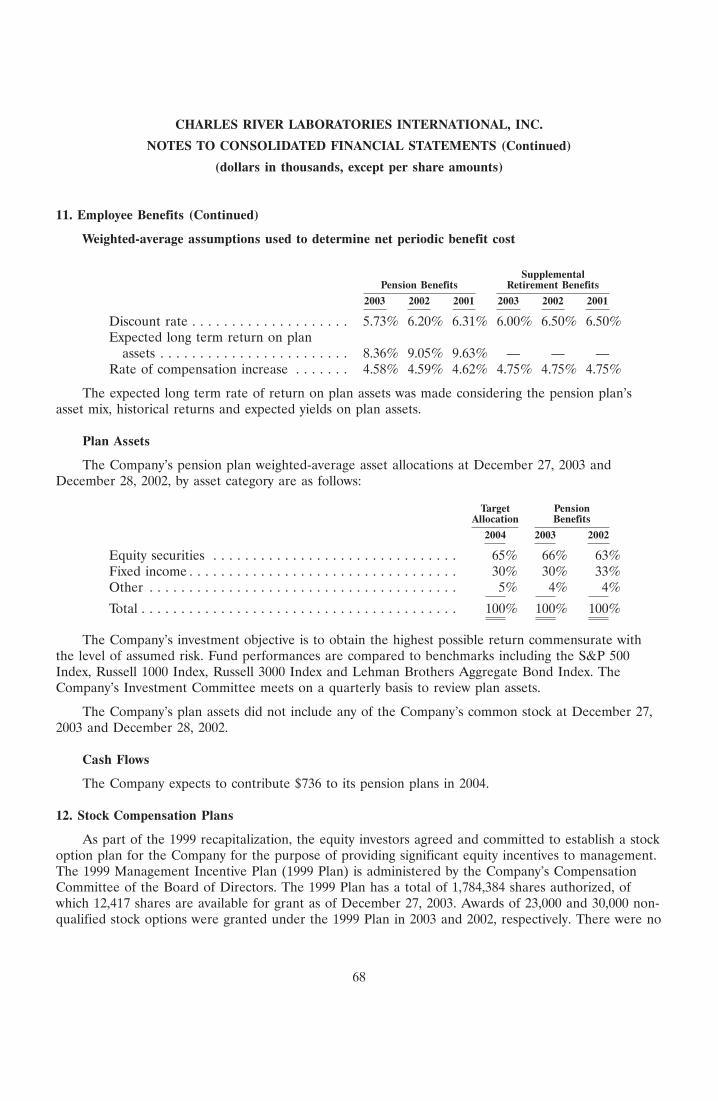
CHARLES RIVER LABORATORIES INTERNATIONAL, INC.
NOTES TO CONSOLIDATED FINANCIAL STATEMENTS (Continued)
(dollars in thousands, except per share amounts)
11. Employee Benefits (Continued)
Weighted-average assumptions used to determine net periodic benefit cost
SupplementalPension Benefits Retirement Benefits
2003 2002 2001 2003 2002 2001
Discount rate . . . . . . . . . . . . . . . . . . . . 5.73% 6.20% 6.31% 6.00% 6.50% 6.50%Expected long term return on plan
assets . . . . . . . . . . . . . . . . . . . . . . . . 8.36% 9.05% 9.63% — — —Rate of compensation increase . . . . . . . 4.58% 4.59% 4.62% 4.75% 4.75% 4.75%
The expected long term rate of return on plan assets was made considering the pension plan’sasset mix, historical returns and expected yields on plan assets.
Plan Assets
The Company’s pension plan weighted-average asset allocations at December 27, 2003 andDecember 28, 2002, by asset category are as follows:
Target PensionAllocation Benefits
2004 2003 2002
Equity securities . . . . . . . . . . . . . . . . . . . . . . . . . . . . . . . 65% 66% 63%Fixed income . . . . . . . . . . . . . . . . . . . . . . . . . . . . . . . . . . 30% 30% 33%Other . . . . . . . . . . . . . . . . . . . . . . . . . . . . . . . . . . . . . . . 5% 4% 4%
Total . . . . . . . . . . . . . . . . . . . . . . . . . . . . . . . . . . . . . . . . 100% 100% 100%
The Company’s investment objective is to obtain the highest possible return commensurate withthe level of assumed risk. Fund performances are compared to benchmarks including the S&P 500Index, Russell 1000 Index, Russell 3000 Index and Lehman Brothers Aggregate Bond Index. TheCompany’s Investment Committee meets on a quarterly basis to review plan assets.
The Company’s plan assets did not include any of the Company’s common stock at December 27,2003 and December 28, 2002.
Cash Flows
The Company expects to contribute $736 to its pension plans in 2004.
12. Stock Compensation Plans
As part of the 1999 recapitalization, the equity investors agreed and committed to establish a stockoption plan for the Company for the purpose of providing significant equity incentives to management.The 1999 Management Incentive Plan (1999 Plan) is administered by the Company’s CompensationCommittee of the Board of Directors. The 1999 Plan has a total of 1,784,384 shares authorized, ofwhich 12,417 shares are available for grant as of December 27, 2003. Awards of 23,000 and 30,000 non-qualified stock options were granted under the 1999 Plan in 2003 and 2002, respectively. There were no
68
CHARLES RIVER LABORATORIES INTERNATIONAL, INC.
NOTES TO CONSOLIDATED FINANCIAL STATEMENTS (Continued)
(dollars in thousands, except per share amounts)
12. Stock Compensation Plans (Continued)
awards granted under the 1999 plan in the year ended December 29, 2001. As of December 27, 2003,options to purchase 894,368 shares were exercisable under the 1999 Plan. Options granted pursuant tothe 1999 Plan are subject to a vesting schedule based on three distinct measures. Certain options vestsolely with the passage of time (incrementally typically over five years so long as the optionee continuesto be employed by the Company). The remainder of the options vest over time but contain clausesproviding for the acceleration of vesting upon the achievement of certain performance targets or theoccurrence of certain liquidity events. All options expire on or before November 3, 2013. The exerciseprice of all options granted under the 1999 Plan is the fair market value of the underlying commonstock at the time of the grant.
Effective June 5, 2000, the Board of Directors adopted and the Company’s shareholders approvedthe 2000 Incentive Plan (2000 Plan), which provides for the grant of incentive and nonqualified stockoptions, stock appreciation rights, restricted or unrestricted common stock and other equity awards.The 2000 Plan has a total of 6,289,000 shares authorized, of which 2,494,583 are available for grant asof December 27, 2003. Options granted pursuant to the 2000 Plan vest incrementally typically overthree years so long as the employee continues to be employed by the Company. All options grantedunder the 2000 Plan expire on or before December 1, 2013. The exercise price of all options grantedunder the 2000 Plan is the fair value of the underlying common stock at the time of grant. A total of1,478,200, 1,248,125, and 741,900 stock option awards were made under the 2000 Plan in 2003, 2002and 2001, respectively, of which 1,098,105 awards were exercisable as of December 27, 2003.
Under the Company’s 2000 Plan, shares of restricted common stock of the Company may begranted at no cost to officers and key employees. Recipients are entitled to cash dividends and to votetheir respective shares. Restrictions limit the sale or transfer of these shares until they vest, which istypically over a three-year period. Upon issuance of restricted stock awards under the plan, unearnedcompensation equivalent to the market value at the measurement date is charged to shareholders’equity and subsequently amortized as compensation expense over the vesting period. The Companygranted 32,300, 54,100 and 11,500 restricted stock awards at no cost and recorded $1,062, $1,740 and$368 as unearned compensation in shareholders’ equity for the years ended December 27, 2003,December 28, 2002 and December 29, 2001, respectively. The Company recorded $851, $416 and $52 incompensation expense for these stock awards for the years ended December 27, 2003, December 28,2002 and December 29, 2001, respectively. Additionally, the Company issued 30,000 performance-basedrestricted stock awards at no cost to the Company’s Chief Executive Officer and President during theyear ended December 28, 2002. Vesting of these awards is contingent upon the achievement of certainannual earnings per share growth targets over the vesting period. These shares are accounted for asvariable awards and the related unearned compensation and compensation expense are adjusted basedon the closing market price of the Company’s common stock until the shares are vested. The Companyrecorded $1,147 as unearned compensation in 2002 and recorded $251 and $586 in compensationexpense in connection with these awards in 2003 and 2002, respectively. The weighted average fairvalue of all restricted stock awards issued during 2003, 2002 and 2001 was $32.87, $32.15 and $31.97,respectively. As of December 27, 2003, a total of 92,139 restricted stock awards were outstanding.
In conjunction with the 2000 Plan, the Board of Directors adopted, and the Company’sshareholders approved, the 2000 Directors Stock Plan (Directors Plan), which provides for the grant ofboth automatic and discretionary nonstatutory stock options to non-employee directors. On the day of
69

CHARLES RIVER LABORATORIES INTERNATIONAL, INC.
NOTES TO CONSOLIDATED FINANCIAL STATEMENTS (Continued)
(dollars in thousands, except per share amounts)
12. Stock Compensation Plans (Continued)
each annual meeting of shareholders, each independent director who served during the prior year willbe awarded an option to purchase shares of our common stock (pro-rated if the director did not servefor the entire preceding year). The Directors Plan has a total of 100,000 shares authorized, of which4,000 shares are available to be granted as of December 27, 2003. Awards of 24,000 and 12,000 stockoptions were granted under the Directors Plan in 2002 and 2001, respectively. No stock options wereawarded under this plan in 2003. There are currently 96,000 options exercisable under the DirectorsPlan. Options granted pursuant to the Directors Plan cliff vest upon the earlier of the first anniversaryof the date of grant or the business day prior to the date of the Company’s next annual meeting. Alloptions granted expire on or before May 3, 2007. The exercise price of the options granted under theDirectors Plan is the fair market value of the underlying common stock at the time of grant.
70
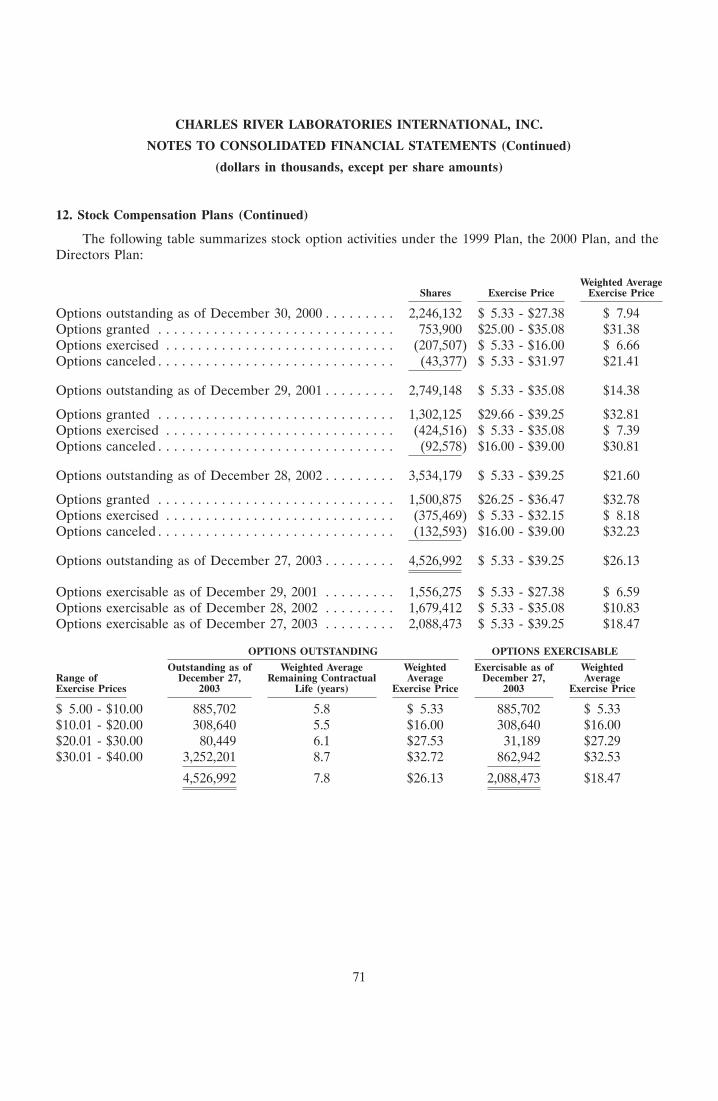
CHARLES RIVER LABORATORIES INTERNATIONAL, INC.
NOTES TO CONSOLIDATED FINANCIAL STATEMENTS (Continued)
(dollars in thousands, except per share amounts)
12. Stock Compensation Plans (Continued)
The following table summarizes stock option activities under the 1999 Plan, the 2000 Plan, and theDirectors Plan:
Weighted AverageShares Exercise Price Exercise Price
Options outstanding as of December 30, 2000 . . . . . . . . . 2,246,132 $ 5.33 - $27.38 $ 7.94Options granted . . . . . . . . . . . . . . . . . . . . . . . . . . . . . . 753,900 $25.00 - $35.08 $31.38Options exercised . . . . . . . . . . . . . . . . . . . . . . . . . . . . . (207,507) $ 5.33 - $16.00 $ 6.66Options canceled . . . . . . . . . . . . . . . . . . . . . . . . . . . . . . (43,377) $ 5.33 - $31.97 $21.41
Options outstanding as of December 29, 2001 . . . . . . . . . 2,749,148 $ 5.33 - $35.08 $14.38
Options granted . . . . . . . . . . . . . . . . . . . . . . . . . . . . . . 1,302,125 $29.66 - $39.25 $32.81Options exercised . . . . . . . . . . . . . . . . . . . . . . . . . . . . . (424,516) $ 5.33 - $35.08 $ 7.39Options canceled . . . . . . . . . . . . . . . . . . . . . . . . . . . . . . (92,578) $16.00 - $39.00 $30.81
Options outstanding as of December 28, 2002 . . . . . . . . . 3,534,179 $ 5.33 - $39.25 $21.60
Options granted . . . . . . . . . . . . . . . . . . . . . . . . . . . . . . 1,500,875 $26.25 - $36.47 $32.78Options exercised . . . . . . . . . . . . . . . . . . . . . . . . . . . . . (375,469) $ 5.33 - $32.15 $ 8.18Options canceled . . . . . . . . . . . . . . . . . . . . . . . . . . . . . . (132,593) $16.00 - $39.00 $32.23
Options outstanding as of December 27, 2003 . . . . . . . . . 4,526,992 $ 5.33 - $39.25 $26.13
Options exercisable as of December 29, 2001 . . . . . . . . . 1,556,275 $ 5.33 - $27.38 $ 6.59Options exercisable as of December 28, 2002 . . . . . . . . . 1,679,412 $ 5.33 - $35.08 $10.83Options exercisable as of December 27, 2003 . . . . . . . . . 2,088,473 $ 5.33 - $39.25 $18.47
OPTIONS OUTSTANDING OPTIONS EXERCISABLE
Outstanding as of Weighted Average Weighted Exercisable as of WeightedRange of December 27, Remaining Contractual Average December 27, AverageExercise Prices 2003 Life (years) Exercise Price 2003 Exercise Price
$ 5.00 - $10.00 885,702 5.8 $ 5.33 885,702 $ 5.33$10.01 - $20.00 308,640 5.5 $16.00 308,640 $16.00$20.01 - $30.00 80,449 6.1 $27.53 31,189 $27.29$30.01 - $40.00 3,252,201 8.7 $32.72 862,942 $32.53
4,526,992 7.8 $26.13 2,088,473 $18.47
71
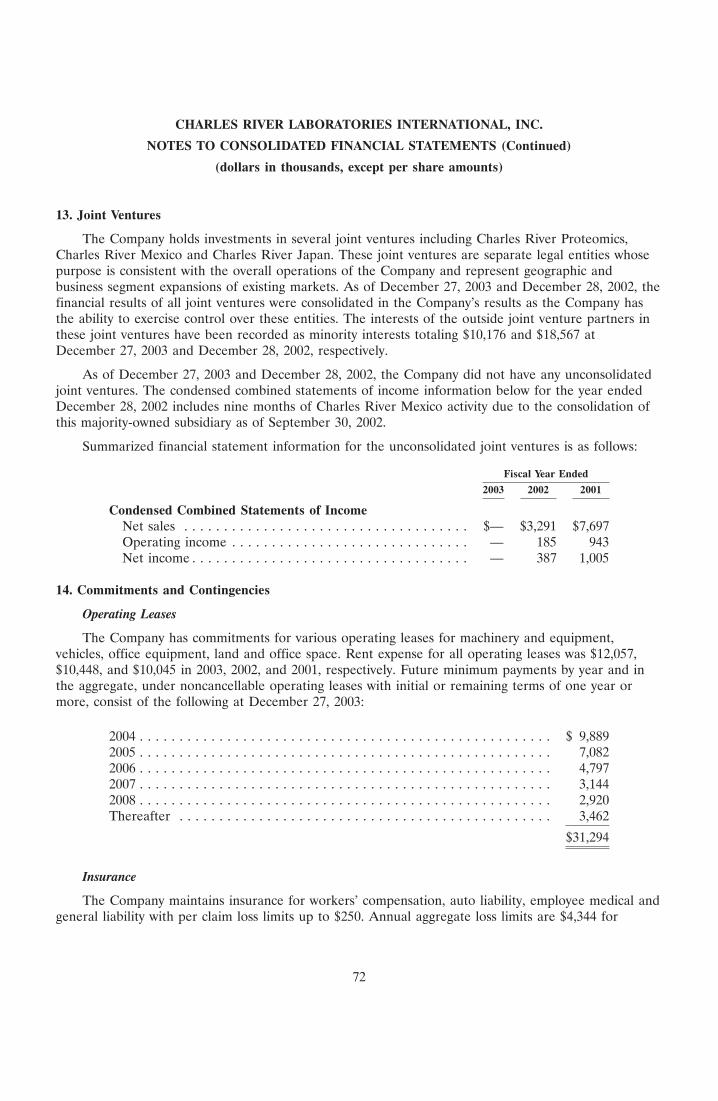
CHARLES RIVER LABORATORIES INTERNATIONAL, INC.
NOTES TO CONSOLIDATED FINANCIAL STATEMENTS (Continued)
(dollars in thousands, except per share amounts)
13. Joint Ventures
The Company holds investments in several joint ventures including Charles River Proteomics,Charles River Mexico and Charles River Japan. These joint ventures are separate legal entities whosepurpose is consistent with the overall operations of the Company and represent geographic andbusiness segment expansions of existing markets. As of December 27, 2003 and December 28, 2002, thefinancial results of all joint ventures were consolidated in the Company’s results as the Company hasthe ability to exercise control over these entities. The interests of the outside joint venture partners inthese joint ventures have been recorded as minority interests totaling $10,176 and $18,567 atDecember 27, 2003 and December 28, 2002, respectively.
As of December 27, 2003 and December 28, 2002, the Company did not have any unconsolidatedjoint ventures. The condensed combined statements of income information below for the year endedDecember 28, 2002 includes nine months of Charles River Mexico activity due to the consolidation ofthis majority-owned subsidiary as of September 30, 2002.
Summarized financial statement information for the unconsolidated joint ventures is as follows:
Fiscal Year Ended
2003 2002 2001
Condensed Combined Statements of IncomeNet sales . . . . . . . . . . . . . . . . . . . . . . . . . . . . . . . . . . . . $— $3,291 $7,697Operating income . . . . . . . . . . . . . . . . . . . . . . . . . . . . . . — 185 943Net income . . . . . . . . . . . . . . . . . . . . . . . . . . . . . . . . . . . — 387 1,005
14. Commitments and Contingencies
Operating Leases
The Company has commitments for various operating leases for machinery and equipment,vehicles, office equipment, land and office space. Rent expense for all operating leases was $12,057,$10,448, and $10,045 in 2003, 2002, and 2001, respectively. Future minimum payments by year and inthe aggregate, under noncancellable operating leases with initial or remaining terms of one year ormore, consist of the following at December 27, 2003:
2004 . . . . . . . . . . . . . . . . . . . . . . . . . . . . . . . . . . . . . . . . . . . . . . . . . . . . $ 9,8892005 . . . . . . . . . . . . . . . . . . . . . . . . . . . . . . . . . . . . . . . . . . . . . . . . . . . . 7,0822006 . . . . . . . . . . . . . . . . . . . . . . . . . . . . . . . . . . . . . . . . . . . . . . . . . . . . 4,7972007 . . . . . . . . . . . . . . . . . . . . . . . . . . . . . . . . . . . . . . . . . . . . . . . . . . . . 3,1442008 . . . . . . . . . . . . . . . . . . . . . . . . . . . . . . . . . . . . . . . . . . . . . . . . . . . . 2,920Thereafter . . . . . . . . . . . . . . . . . . . . . . . . . . . . . . . . . . . . . . . . . . . . . . . 3,462
$31,294
Insurance
The Company maintains insurance for workers’ compensation, auto liability, employee medical andgeneral liability with per claim loss limits up to $250. Annual aggregate loss limits are $4,344 for
72
CHARLES RIVER LABORATORIES INTERNATIONAL, INC.
NOTES TO CONSOLIDATED FINANCIAL STATEMENTS (Continued)
(dollars in thousands, except per share amounts)
14. Commitments and Contingencies (Continued)
workers compensation, auto liability and general liability. Related accruals were $5,522 and $5,439 onDecember 27, 2003 and December 28, 2002, respectively.
Litigation
Various lawsuits, claims and proceedings of a nature considered normal to its business are pendingagainst the Company. In the opinion of management, the outcome of such proceedings and litigationcurrently pending will not materially affect the Company’s consolidated financial statements.
15. Related Party Transactions
Ajinomoto Company, Inc. (Ajinomoto) is a minority shareholder in Charles River Japan. CharlesRiver Japan conducts certain business transactions with Ajinomoto, including the purchase ofinformation technology systems and services, engineering services, product delivery services and thereimbursement of employee compensation. Charles River Japan incurred expenses related to theseservices of $4,584, $6,631 and $5,459 during 2003, 2002 and 2001, respectively. As of December 27,2003 and December 28, 2002, Charles River Japan had amounts due to Ajinomoto totaling $1,251 and$1,381, respectively. In addition, Charles River Japan sold products to Ajinomoto totaling $1,011, $890and $876 during 2003, 2002 and 2001, respectively. As of December 27, 2003 and December 28, 2002,Charles River Japan had amounts due from Ajinomoto totaling $335 and $481, respectively.
As more fully described in Note 2, Proteome is a minority shareholder in Charles RiverProteomics. During 2002, Charles River Proteomics purchased a hardware platform from Proteome for$1,633, of which $1,520 was paid in 2002 and the remaining in 2003. During 2003, Charles RiverProteomics paid Proteome $190 for training on the hardware platform, borrowed $100 against aworking capital loan from Proteome and purchased laboratory supplies from Proteome. Charles RiverProteomics incurred expenses related to the laboratory supplies of $17 during 2003. As ofDecember 28, 2002, Charles River Proteomics had amounts due to Proteome totaling $113. As ofDecember 27, 2003, Charles River Proteomics had amounts due to Proteome totaling $100 and hadamounts due from Proteome totaling $50.
16. Business Segment and Geographic Information
In accordance with SFAS No. 131, ‘‘Disclosures About Segments of an Enterprise and RelatedInformation,’’ the Company discloses financial and descriptive information about its reportableoperating segments. Operating segments are components of an enterprise about which separatefinancial information is available and is regularly evaluated by the chief operating decision maker indeciding how to allocate resources and in assessing performance.
During the fourth quarter of 2003, the Company revised its consolidated financial reportingsegments to better reflect the manner in which the Company’s operating units are managed. TheCompany believed the revision was required because in 2003, a number of changes were made to alignrelated businesses, to focus sales force responsibilities and to simplify management structure. TheCompany will continue to report two segments, now called research models and services segment(RMS) and development and safety testing segment (DST). The research models business will continueto be reported in the RMS segment and transgenic services, laboratory services, contract staffing
73
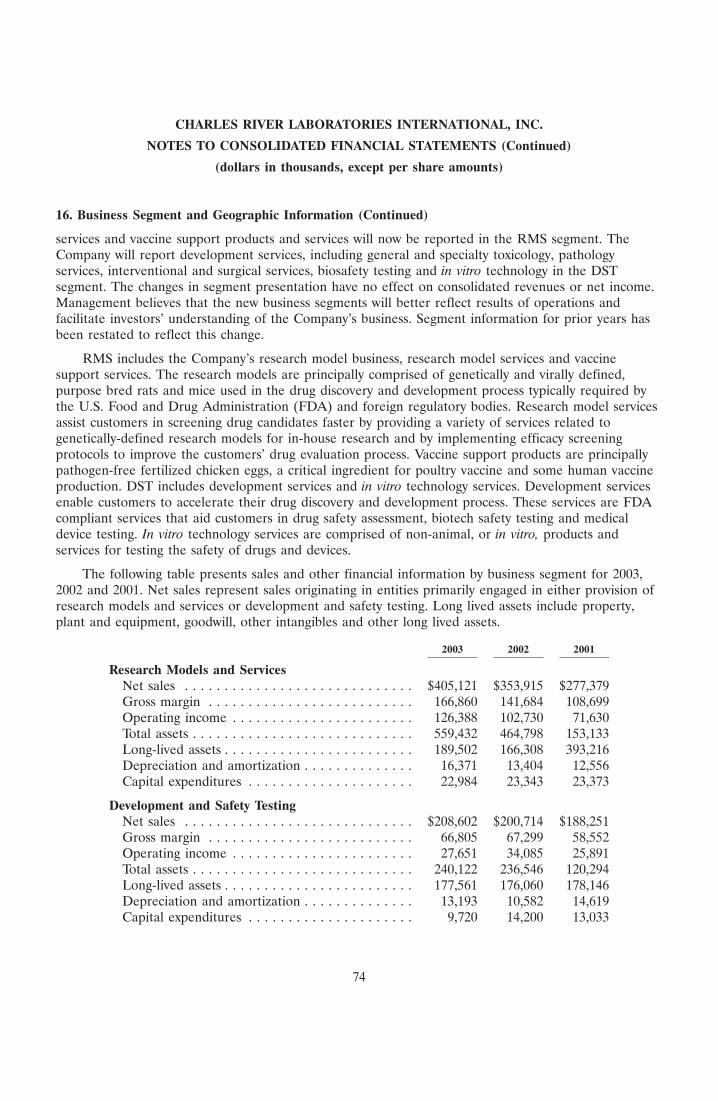
CHARLES RIVER LABORATORIES INTERNATIONAL, INC.
NOTES TO CONSOLIDATED FINANCIAL STATEMENTS (Continued)
(dollars in thousands, except per share amounts)
16. Business Segment and Geographic Information (Continued)
services and vaccine support products and services will now be reported in the RMS segment. TheCompany will report development services, including general and specialty toxicology, pathologyservices, interventional and surgical services, biosafety testing and in vitro technology in the DSTsegment. The changes in segment presentation have no effect on consolidated revenues or net income.Management believes that the new business segments will better reflect results of operations andfacilitate investors’ understanding of the Company’s business. Segment information for prior years hasbeen restated to reflect this change.
RMS includes the Company’s research model business, research model services and vaccinesupport services. The research models are principally comprised of genetically and virally defined,purpose bred rats and mice used in the drug discovery and development process typically required bythe U.S. Food and Drug Administration (FDA) and foreign regulatory bodies. Research model servicesassist customers in screening drug candidates faster by providing a variety of services related togenetically-defined research models for in-house research and by implementing efficacy screeningprotocols to improve the customers’ drug evaluation process. Vaccine support products are principallypathogen-free fertilized chicken eggs, a critical ingredient for poultry vaccine and some human vaccineproduction. DST includes development services and in vitro technology services. Development servicesenable customers to accelerate their drug discovery and development process. These services are FDAcompliant services that aid customers in drug safety assessment, biotech safety testing and medicaldevice testing. In vitro technology services are comprised of non-animal, or in vitro, products andservices for testing the safety of drugs and devices.
The following table presents sales and other financial information by business segment for 2003,2002 and 2001. Net sales represent sales originating in entities primarily engaged in either provision ofresearch models and services or development and safety testing. Long lived assets include property,plant and equipment, goodwill, other intangibles and other long lived assets.
2003 2002 2001
Research Models and ServicesNet sales . . . . . . . . . . . . . . . . . . . . . . . . . . . . . $405,121 $353,915 $277,379Gross margin . . . . . . . . . . . . . . . . . . . . . . . . . . 166,860 141,684 108,699Operating income . . . . . . . . . . . . . . . . . . . . . . . 126,388 102,730 71,630Total assets . . . . . . . . . . . . . . . . . . . . . . . . . . . . 559,432 464,798 153,133Long-lived assets . . . . . . . . . . . . . . . . . . . . . . . . 189,502 166,308 393,216Depreciation and amortization . . . . . . . . . . . . . . 16,371 13,404 12,556Capital expenditures . . . . . . . . . . . . . . . . . . . . . 22,984 23,343 23,373
Development and Safety TestingNet sales . . . . . . . . . . . . . . . . . . . . . . . . . . . . . $208,602 $200,714 $188,251Gross margin . . . . . . . . . . . . . . . . . . . . . . . . . . 66,805 67,299 58,552Operating income . . . . . . . . . . . . . . . . . . . . . . . 27,651 34,085 25,891Total assets . . . . . . . . . . . . . . . . . . . . . . . . . . . . 240,122 236,546 120,294Long-lived assets . . . . . . . . . . . . . . . . . . . . . . . . 177,561 176,060 178,146Depreciation and amortization . . . . . . . . . . . . . . 13,193 10,582 14,619Capital expenditures . . . . . . . . . . . . . . . . . . . . . 9,720 14,200 13,033
74
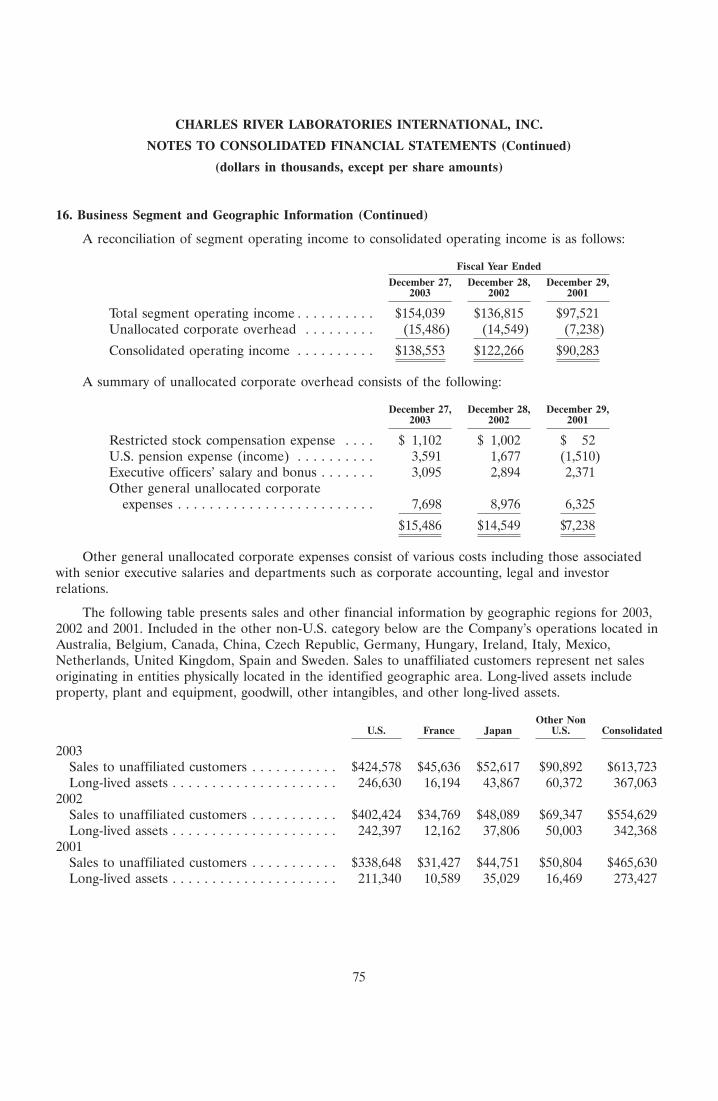
CHARLES RIVER LABORATORIES INTERNATIONAL, INC.
NOTES TO CONSOLIDATED FINANCIAL STATEMENTS (Continued)
(dollars in thousands, except per share amounts)
16. Business Segment and Geographic Information (Continued)
A reconciliation of segment operating income to consolidated operating income is as follows:
Fiscal Year Ended
December 27, December 28, December 29,2003 2002 2001
Total segment operating income . . . . . . . . . . $154,039 $136,815 $97,521Unallocated corporate overhead . . . . . . . . . (15,486) (14,549) (7,238)
Consolidated operating income . . . . . . . . . . $138,553 $122,266 $90,283
A summary of unallocated corporate overhead consists of the following:
December 27, December 28, December 29,2003 2002 2001
Restricted stock compensation expense . . . . $ 1,102 $ 1,002 $ 52U.S. pension expense (income) . . . . . . . . . . 3,591 1,677 (1,510)Executive officers’ salary and bonus . . . . . . . 3,095 2,894 2,371Other general unallocated corporate
expenses . . . . . . . . . . . . . . . . . . . . . . . . . 7,698 8,976 6,325
$15,486 $14,549 $7,238
Other general unallocated corporate expenses consist of various costs including those associatedwith senior executive salaries and departments such as corporate accounting, legal and investorrelations.
The following table presents sales and other financial information by geographic regions for 2003,2002 and 2001. Included in the other non-U.S. category below are the Company’s operations located inAustralia, Belgium, Canada, China, Czech Republic, Germany, Hungary, Ireland, Italy, Mexico,Netherlands, United Kingdom, Spain and Sweden. Sales to unaffiliated customers represent net salesoriginating in entities physically located in the identified geographic area. Long-lived assets includeproperty, plant and equipment, goodwill, other intangibles, and other long-lived assets.
Other NonU.S. France Japan U.S. Consolidated
2003Sales to unaffiliated customers . . . . . . . . . . . $424,578 $45,636 $52,617 $90,892 $613,723Long-lived assets . . . . . . . . . . . . . . . . . . . . . 246,630 16,194 43,867 60,372 367,063
2002Sales to unaffiliated customers . . . . . . . . . . . $402,424 $34,769 $48,089 $69,347 $554,629Long-lived assets . . . . . . . . . . . . . . . . . . . . . 242,397 12,162 37,806 50,003 342,368
2001Sales to unaffiliated customers . . . . . . . . . . . $338,648 $31,427 $44,751 $50,804 $465,630Long-lived assets . . . . . . . . . . . . . . . . . . . . . 211,340 10,589 35,029 16,469 273,427
75
CHARLES RIVER LABORATORIES INTERNATIONAL, INC.
NOTES TO CONSOLIDATED FINANCIAL STATEMENTS (Continued)
(dollars in thousands, except per share amounts)
17. Subsequent Events
On January 8, 2004, the Company acquired River Valley Farms, a privately-held medical devicecontract research business, which will be reported in our DST segment. Consideration of approximately$17,276 was paid with respect to this acquisition. The Company is in the process of determining thepurchase price allocation.
In the first quarter of 2004, the Company began a reorganization of its European operations. Thepurpose of the reorganization is to streamline the corporate legal structure in order to improveoperating efficiency and cash management, facilitate acquisitions and provide tax benefits. Thereorganization, which will not involve reductions of personnel or facility closures, is expected to resultin a one-time, non-cash charge to earnings in the first quarter of 2004 of approximately $7,900primarily due to the write-off of a deferred tax asset.
76
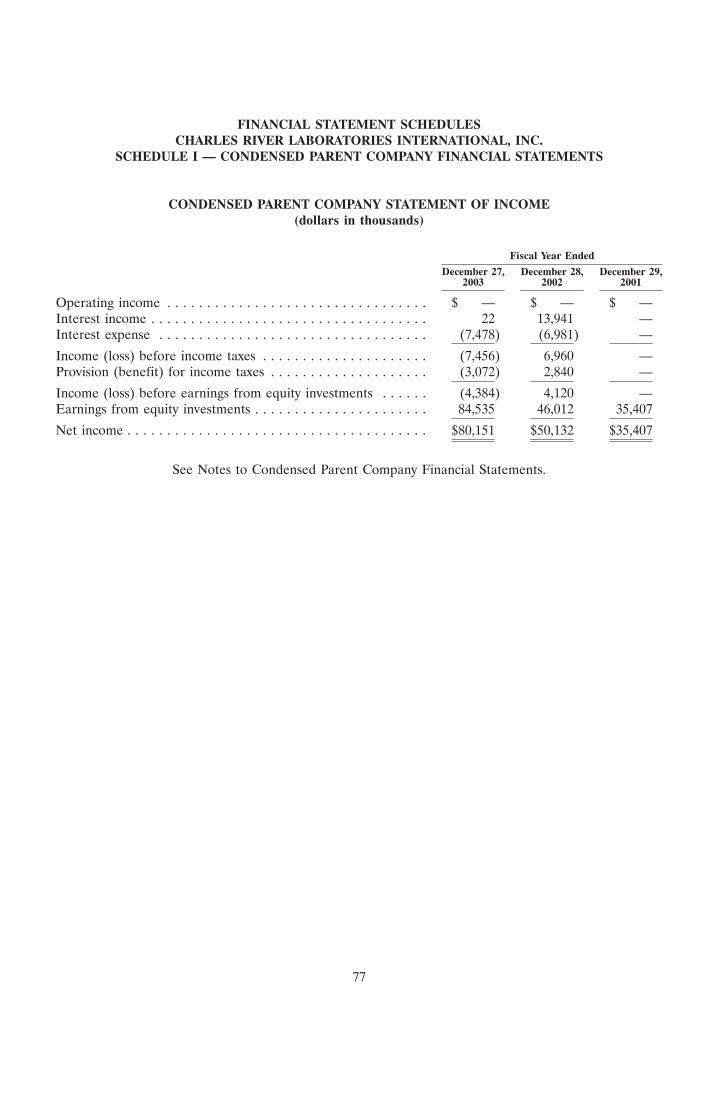
FINANCIAL STATEMENT SCHEDULESCHARLES RIVER LABORATORIES INTERNATIONAL, INC.
SCHEDULE I — CONDENSED PARENT COMPANY FINANCIAL STATEMENTS
CONDENSED PARENT COMPANY STATEMENT OF INCOME(dollars in thousands)
Fiscal Year Ended
December 27, December 28, December 29,2003 2002 2001
Operating income . . . . . . . . . . . . . . . . . . . . . . . . . . . . . . . . . $ — $ — $ —Interest income . . . . . . . . . . . . . . . . . . . . . . . . . . . . . . . . . . . 22 13,941 —Interest expense . . . . . . . . . . . . . . . . . . . . . . . . . . . . . . . . . . (7,478) (6,981) —
Income (loss) before income taxes . . . . . . . . . . . . . . . . . . . . . (7,456) 6,960 —Provision (benefit) for income taxes . . . . . . . . . . . . . . . . . . . . (3,072) 2,840 —
Income (loss) before earnings from equity investments . . . . . . (4,384) 4,120 —Earnings from equity investments . . . . . . . . . . . . . . . . . . . . . . 84,535 46,012 35,407
Net income . . . . . . . . . . . . . . . . . . . . . . . . . . . . . . . . . . . . . . $80,151 $50,132 $35,407
See Notes to Condensed Parent Company Financial Statements.
77
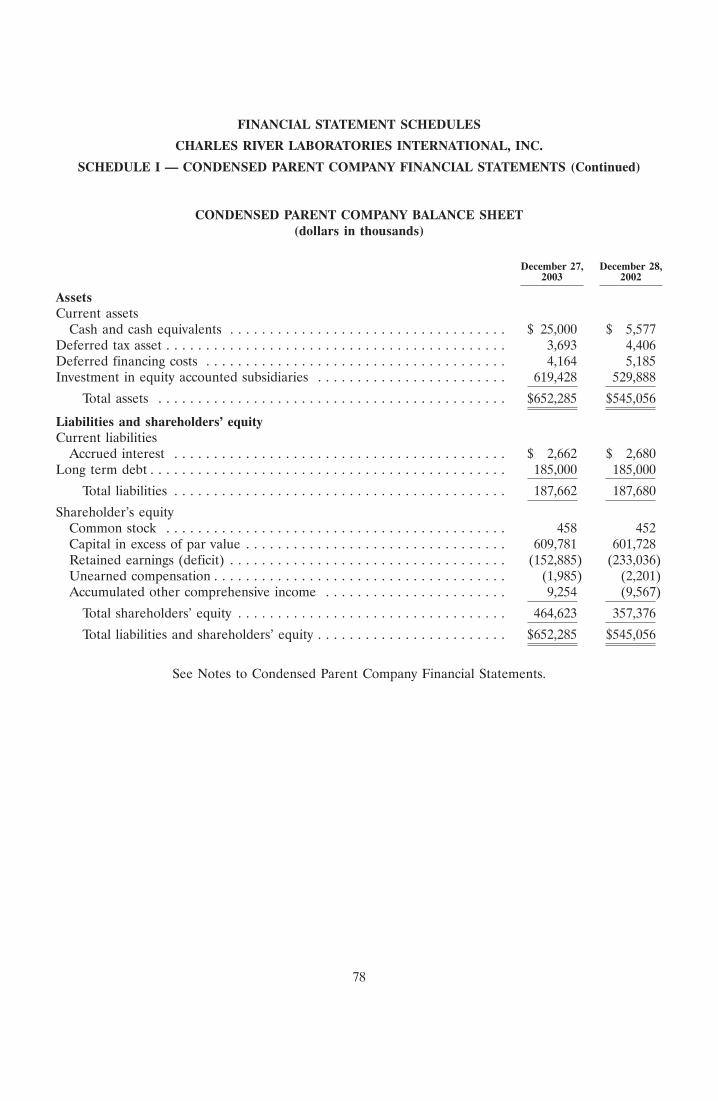
FINANCIAL STATEMENT SCHEDULES
CHARLES RIVER LABORATORIES INTERNATIONAL, INC.
SCHEDULE I — CONDENSED PARENT COMPANY FINANCIAL STATEMENTS (Continued)
CONDENSED PARENT COMPANY BALANCE SHEET(dollars in thousands)
December 27, December 28,2003 2002
AssetsCurrent assets
Cash and cash equivalents . . . . . . . . . . . . . . . . . . . . . . . . . . . . . . . . . . . $ 25,000 $ 5,577Deferred tax asset . . . . . . . . . . . . . . . . . . . . . . . . . . . . . . . . . . . . . . . . . . . 3,693 4,406Deferred financing costs . . . . . . . . . . . . . . . . . . . . . . . . . . . . . . . . . . . . . . 4,164 5,185Investment in equity accounted subsidiaries . . . . . . . . . . . . . . . . . . . . . . . . 619,428 529,888
Total assets . . . . . . . . . . . . . . . . . . . . . . . . . . . . . . . . . . . . . . . . . . . . $652,285 $545,056
Liabilities and shareholders’ equityCurrent liabilities
Accrued interest . . . . . . . . . . . . . . . . . . . . . . . . . . . . . . . . . . . . . . . . . . $ 2,662 $ 2,680Long term debt . . . . . . . . . . . . . . . . . . . . . . . . . . . . . . . . . . . . . . . . . . . . . 185,000 185,000
Total liabilities . . . . . . . . . . . . . . . . . . . . . . . . . . . . . . . . . . . . . . . . . . 187,662 187,680
Shareholder’s equityCommon stock . . . . . . . . . . . . . . . . . . . . . . . . . . . . . . . . . . . . . . . . . . . 458 452Capital in excess of par value . . . . . . . . . . . . . . . . . . . . . . . . . . . . . . . . . 609,781 601,728Retained earnings (deficit) . . . . . . . . . . . . . . . . . . . . . . . . . . . . . . . . . . . (152,885) (233,036)Unearned compensation . . . . . . . . . . . . . . . . . . . . . . . . . . . . . . . . . . . . . (1,985) (2,201)Accumulated other comprehensive income . . . . . . . . . . . . . . . . . . . . . . . 9,254 (9,567)
Total shareholders’ equity . . . . . . . . . . . . . . . . . . . . . . . . . . . . . . . . . . 464,623 357,376
Total liabilities and shareholders’ equity . . . . . . . . . . . . . . . . . . . . . . . . $652,285 $545,056
See Notes to Condensed Parent Company Financial Statements.
78
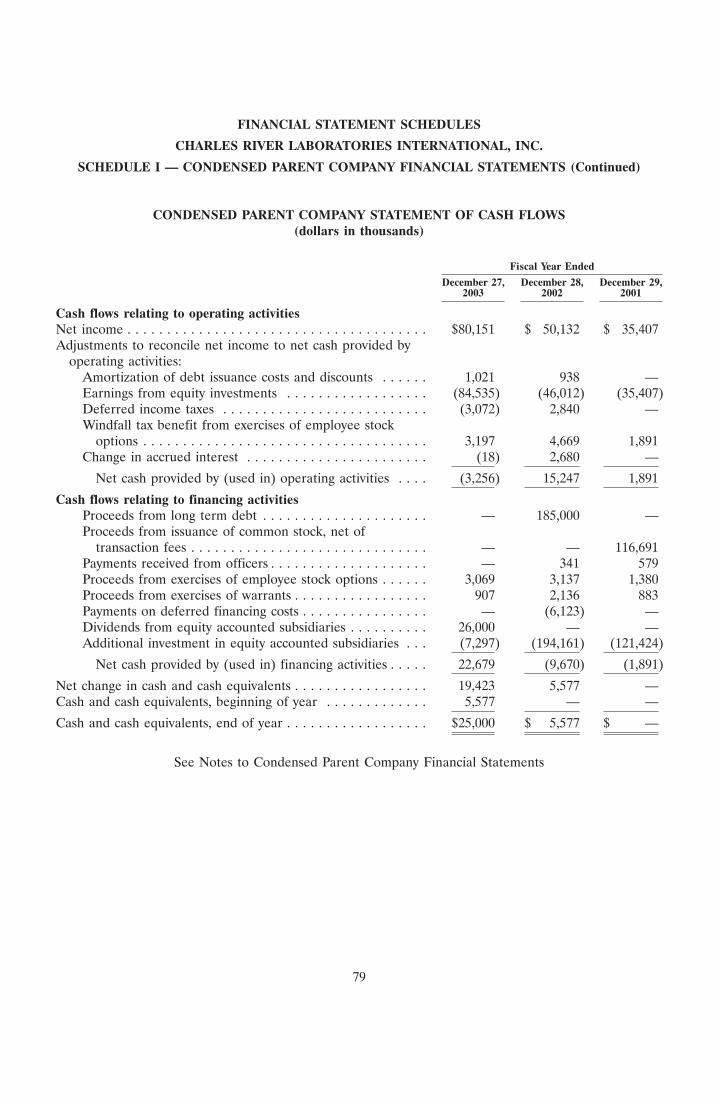
FINANCIAL STATEMENT SCHEDULES
CHARLES RIVER LABORATORIES INTERNATIONAL, INC.
SCHEDULE I — CONDENSED PARENT COMPANY FINANCIAL STATEMENTS (Continued)
CONDENSED PARENT COMPANY STATEMENT OF CASH FLOWS(dollars in thousands)
Fiscal Year Ended
December 27, December 28, December 29,2003 2002 2001
Cash flows relating to operating activitiesNet income . . . . . . . . . . . . . . . . . . . . . . . . . . . . . . . . . . . . . . $80,151 $ 50,132 $ 35,407Adjustments to reconcile net income to net cash provided by
operating activities:Amortization of debt issuance costs and discounts . . . . . . 1,021 938 —Earnings from equity investments . . . . . . . . . . . . . . . . . . (84,535) (46,012) (35,407)Deferred income taxes . . . . . . . . . . . . . . . . . . . . . . . . . . (3,072) 2,840 —Windfall tax benefit from exercises of employee stock
options . . . . . . . . . . . . . . . . . . . . . . . . . . . . . . . . . . . . 3,197 4,669 1,891Change in accrued interest . . . . . . . . . . . . . . . . . . . . . . . (18) 2,680 —
Net cash provided by (used in) operating activities . . . . (3,256) 15,247 1,891
Cash flows relating to financing activitiesProceeds from long term debt . . . . . . . . . . . . . . . . . . . . . — 185,000 —Proceeds from issuance of common stock, net of
transaction fees . . . . . . . . . . . . . . . . . . . . . . . . . . . . . . — — 116,691Payments received from officers . . . . . . . . . . . . . . . . . . . . — 341 579Proceeds from exercises of employee stock options . . . . . . 3,069 3,137 1,380Proceeds from exercises of warrants . . . . . . . . . . . . . . . . . 907 2,136 883Payments on deferred financing costs . . . . . . . . . . . . . . . . — (6,123) —Dividends from equity accounted subsidiaries . . . . . . . . . . 26,000 — —Additional investment in equity accounted subsidiaries . . . (7,297) (194,161) (121,424)
Net cash provided by (used in) financing activities . . . . . 22,679 (9,670) (1,891)
Net change in cash and cash equivalents . . . . . . . . . . . . . . . . . 19,423 5,577 —Cash and cash equivalents, beginning of year . . . . . . . . . . . . . 5,577 — —
Cash and cash equivalents, end of year . . . . . . . . . . . . . . . . . . $25,000 $ 5,577 $ —
See Notes to Condensed Parent Company Financial Statements
79
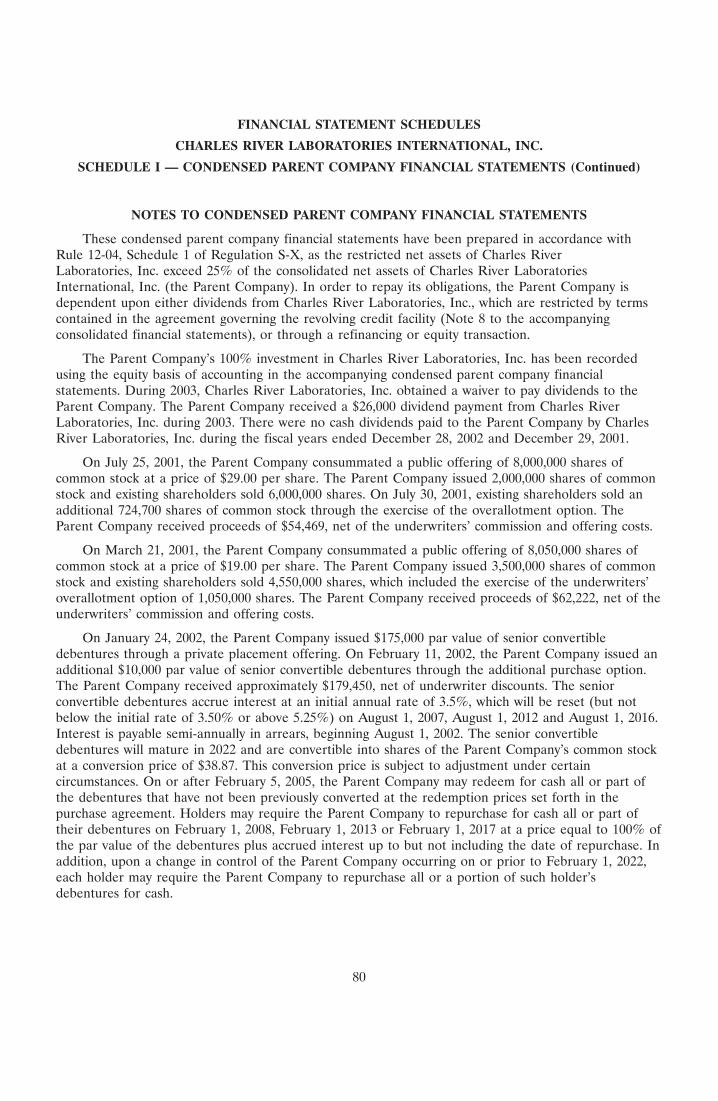
FINANCIAL STATEMENT SCHEDULES
CHARLES RIVER LABORATORIES INTERNATIONAL, INC.
SCHEDULE I — CONDENSED PARENT COMPANY FINANCIAL STATEMENTS (Continued)
NOTES TO CONDENSED PARENT COMPANY FINANCIAL STATEMENTS
These condensed parent company financial statements have been prepared in accordance withRule 12-04, Schedule 1 of Regulation S-X, as the restricted net assets of Charles RiverLaboratories, Inc. exceed 25% of the consolidated net assets of Charles River LaboratoriesInternational, Inc. (the Parent Company). In order to repay its obligations, the Parent Company isdependent upon either dividends from Charles River Laboratories, Inc., which are restricted by termscontained in the agreement governing the revolving credit facility (Note 8 to the accompanyingconsolidated financial statements), or through a refinancing or equity transaction.
The Parent Company’s 100% investment in Charles River Laboratories, Inc. has been recordedusing the equity basis of accounting in the accompanying condensed parent company financialstatements. During 2003, Charles River Laboratories, Inc. obtained a waiver to pay dividends to theParent Company. The Parent Company received a $26,000 dividend payment from Charles RiverLaboratories, Inc. during 2003. There were no cash dividends paid to the Parent Company by CharlesRiver Laboratories, Inc. during the fiscal years ended December 28, 2002 and December 29, 2001.
On July 25, 2001, the Parent Company consummated a public offering of 8,000,000 shares ofcommon stock at a price of $29.00 per share. The Parent Company issued 2,000,000 shares of commonstock and existing shareholders sold 6,000,000 shares. On July 30, 2001, existing shareholders sold anadditional 724,700 shares of common stock through the exercise of the overallotment option. TheParent Company received proceeds of $54,469, net of the underwriters’ commission and offering costs.
On March 21, 2001, the Parent Company consummated a public offering of 8,050,000 shares ofcommon stock at a price of $19.00 per share. The Parent Company issued 3,500,000 shares of commonstock and existing shareholders sold 4,550,000 shares, which included the exercise of the underwriters’overallotment option of 1,050,000 shares. The Parent Company received proceeds of $62,222, net of theunderwriters’ commission and offering costs.
On January 24, 2002, the Parent Company issued $175,000 par value of senior convertibledebentures through a private placement offering. On February 11, 2002, the Parent Company issued anadditional $10,000 par value of senior convertible debentures through the additional purchase option.The Parent Company received approximately $179,450, net of underwriter discounts. The seniorconvertible debentures accrue interest at an initial annual rate of 3.5%, which will be reset (but notbelow the initial rate of 3.50% or above 5.25%) on August 1, 2007, August 1, 2012 and August 1, 2016.Interest is payable semi-annually in arrears, beginning August 1, 2002. The senior convertibledebentures will mature in 2022 and are convertible into shares of the Parent Company’s common stockat a conversion price of $38.87. This conversion price is subject to adjustment under certaincircumstances. On or after February 5, 2005, the Parent Company may redeem for cash all or part ofthe debentures that have not been previously converted at the redemption prices set forth in thepurchase agreement. Holders may require the Parent Company to repurchase for cash all or part oftheir debentures on February 1, 2008, February 1, 2013 or February 1, 2017 at a price equal to 100% ofthe par value of the debentures plus accrued interest up to but not including the date of repurchase. Inaddition, upon a change in control of the Parent Company occurring on or prior to February 1, 2022,each holder may require the Parent Company to repurchase all or a portion of such holder’sdebentures for cash.
80

FINANCIAL STATEMENT SCHEDULESCHARLES RIVER LABORATORIES INTERNATIONAL, INC.
SCHEDULE II — VALUATION AND QUALIFYING ACCOUNTS(dollars in thousands)
Income Tax Valuation Allowance
Balance at December 30, 2000 . . . . . . . . . . . . . . . . . . . . . . . . . . . . . . . . . $ 4,524
Provisions . . . . . . . . . . . . . . . . . . . . . . . . . . . . . . . . . . . . . . . . . . . . . . . . —Releases . . . . . . . . . . . . . . . . . . . . . . . . . . . . . . . . . . . . . . . . . . . . . . . . . —
Balance at December 29, 2001 . . . . . . . . . . . . . . . . . . . . . . . . . . . . . . . . . 4,524
Provisions . . . . . . . . . . . . . . . . . . . . . . . . . . . . . . . . . . . . . . . . . . . . . . . . —Releases . . . . . . . . . . . . . . . . . . . . . . . . . . . . . . . . . . . . . . . . . . . . . . . . . (473)
Balance at December 28, 2002 . . . . . . . . . . . . . . . . . . . . . . . . . . . . . . . . . 4,051
Provisions . . . . . . . . . . . . . . . . . . . . . . . . . . . . . . . . . . . . . . . . . . . . . . . . —Releases . . . . . . . . . . . . . . . . . . . . . . . . . . . . . . . . . . . . . . . . . . . . . . . . . —
Balance at December 27, 2003 . . . . . . . . . . . . . . . . . . . . . . . . . . . . . . . . . $ 4,051
Allowance for Doubtful Accounts
Balance at December 30, 2000 . . . . . . . . . . . . . . . . . . . . . . . . . . . . . . . . . $ 1,036
Provisions . . . . . . . . . . . . . . . . . . . . . . . . . . . . . . . . . . . . . . . . . . . . . . . . 1,550Recoveries/Write-offs . . . . . . . . . . . . . . . . . . . . . . . . . . . . . . . . . . . . . . . . (467)
Balance at December 29, 2001 . . . . . . . . . . . . . . . . . . . . . . . . . . . . . . . . . 2,119
Provisions . . . . . . . . . . . . . . . . . . . . . . . . . . . . . . . . . . . . . . . . . . . . . . . . (25)Recoveries/Write-offs . . . . . . . . . . . . . . . . . . . . . . . . . . . . . . . . . . . . . . . . (554)
Balance at December 28, 2002 . . . . . . . . . . . . . . . . . . . . . . . . . . . . . . . . . 1,540
Provisions . . . . . . . . . . . . . . . . . . . . . . . . . . . . . . . . . . . . . . . . . . . . . . . . 1,494Recoveries/Write-offs . . . . . . . . . . . . . . . . . . . . . . . . . . . . . . . . . . . . . . . . (1,390)
Balance at December 27, 2003 . . . . . . . . . . . . . . . . . . . . . . . . . . . . . . . . . $ 1,644
81
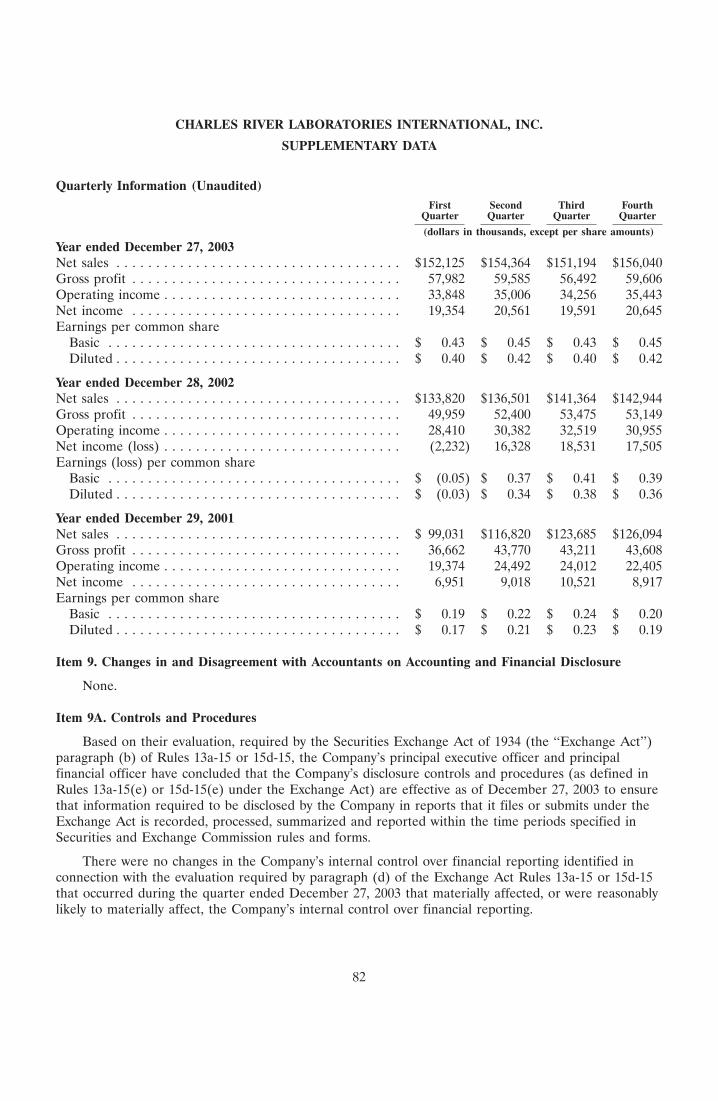
CHARLES RIVER LABORATORIES INTERNATIONAL, INC.
SUPPLEMENTARY DATA
Quarterly Information (Unaudited)First Second Third Fourth
Quarter Quarter Quarter Quarter
(dollars in thousands, except per share amounts)
Year ended December 27, 2003Net sales . . . . . . . . . . . . . . . . . . . . . . . . . . . . . . . . . . . . $152,125 $154,364 $151,194 $156,040Gross profit . . . . . . . . . . . . . . . . . . . . . . . . . . . . . . . . . . 57,982 59,585 56,492 59,606Operating income . . . . . . . . . . . . . . . . . . . . . . . . . . . . . . 33,848 35,006 34,256 35,443Net income . . . . . . . . . . . . . . . . . . . . . . . . . . . . . . . . . . 19,354 20,561 19,591 20,645Earnings per common share
Basic . . . . . . . . . . . . . . . . . . . . . . . . . . . . . . . . . . . . . $ 0.43 $ 0.45 $ 0.43 $ 0.45Diluted . . . . . . . . . . . . . . . . . . . . . . . . . . . . . . . . . . . . $ 0.40 $ 0.42 $ 0.40 $ 0.42
Year ended December 28, 2002Net sales . . . . . . . . . . . . . . . . . . . . . . . . . . . . . . . . . . . . $133,820 $136,501 $141,364 $142,944Gross profit . . . . . . . . . . . . . . . . . . . . . . . . . . . . . . . . . . 49,959 52,400 53,475 53,149Operating income . . . . . . . . . . . . . . . . . . . . . . . . . . . . . . 28,410 30,382 32,519 30,955Net income (loss) . . . . . . . . . . . . . . . . . . . . . . . . . . . . . . (2,232) 16,328 18,531 17,505Earnings (loss) per common share
Basic . . . . . . . . . . . . . . . . . . . . . . . . . . . . . . . . . . . . . $ (0.05) $ 0.37 $ 0.41 $ 0.39Diluted . . . . . . . . . . . . . . . . . . . . . . . . . . . . . . . . . . . . $ (0.03) $ 0.34 $ 0.38 $ 0.36
Year ended December 29, 2001Net sales . . . . . . . . . . . . . . . . . . . . . . . . . . . . . . . . . . . . $ 99,031 $116,820 $123,685 $126,094Gross profit . . . . . . . . . . . . . . . . . . . . . . . . . . . . . . . . . . 36,662 43,770 43,211 43,608Operating income . . . . . . . . . . . . . . . . . . . . . . . . . . . . . . 19,374 24,492 24,012 22,405Net income . . . . . . . . . . . . . . . . . . . . . . . . . . . . . . . . . . 6,951 9,018 10,521 8,917Earnings per common share
Basic . . . . . . . . . . . . . . . . . . . . . . . . . . . . . . . . . . . . . $ 0.19 $ 0.22 $ 0.24 $ 0.20Diluted . . . . . . . . . . . . . . . . . . . . . . . . . . . . . . . . . . . . $ 0.17 $ 0.21 $ 0.23 $ 0.19
Item 9. Changes in and Disagreement with Accountants on Accounting and Financial Disclosure
None.
Item 9A. Controls and Procedures
Based on their evaluation, required by the Securities Exchange Act of 1934 (the ‘‘Exchange Act’’)paragraph (b) of Rules 13a-15 or 15d-15, the Company’s principal executive officer and principalfinancial officer have concluded that the Company’s disclosure controls and procedures (as defined inRules 13a-15(e) or 15d-15(e) under the Exchange Act) are effective as of December 27, 2003 to ensurethat information required to be disclosed by the Company in reports that it files or submits under theExchange Act is recorded, processed, summarized and reported within the time periods specified inSecurities and Exchange Commission rules and forms.
There were no changes in the Company’s internal control over financial reporting identified inconnection with the evaluation required by paragraph (d) of the Exchange Act Rules 13a-15 or 15d-15that occurred during the quarter ended December 27, 2003 that materially affected, or were reasonablylikely to materially affect, the Company’s internal control over financial reporting.
82

PART III
Item 10. Directors and Executive Officers of the Registrant
A. Directors and Compliance with Section 16(a) of the Exchange Act
The information required by this Item regarding the directors of the Company and compliancewith Section 16(a) of the Exchange Act by the Company’s officers and directors will be included in the2004 Proxy Statement under the section captioned ‘‘Management’’ and is incorporated herein byreference thereto.
B. Executive Officers of the Company
The information required by this Item regarding the executive officers of the Company is reportedin Part I of this Form 10-K under the heading ‘‘Supplementary Item. Executive Officers of theRegistrant pursuant to Instruction 3 to Item 401(b) of Regulation S-K.’’
C. Audit Committee Financial Expert
The information required by this Item regarding the audit committee of the Board of Directorsand financial experts will be included in the 2004 Proxy Statement under the section captioned ‘‘AuditCommittee Financial Expert’’ and is incorporated herein by reference thereto.
D. Code of Ethics
The Company has adopted a Code of Business Conduct and Ethics that applies to all of itsemployees and directors, including the principal executive officer, principal financial officer, principalaccounting officer, controller or persons performing similar functions. The Company’s Code of BusinessConduct and Ethics is posted on its website. The Company will provide to any person, without charge,a copy of its Code of Business Conduct and Ethics by requesting a copy from the Secretary, CharlesRiver Laboratories, Inc., 251 Ballardvale St., Wilmington, MA 01887.
Item 11. Executive Compensation
The information required by this Item will be included in the 2004 Proxy Statement under thesections captioned ‘‘Compensation of Directors,’’ ‘‘Executive Compensation’’ and ‘‘Report ofCompensation Committee’’ and is incorporated herein by reference thereto.
Item 12. Security Ownership of Certain Beneficial Owners and Management and Related StockholderMatters
The information required by this Item will be included in the 2004 Proxy Statement under thesections captioned ‘‘Security Ownership of Certain Beneficial Owners and Management’’ and ‘‘EquityCompensation Plan Information’’ and is incorporated herein by reference thereto.
Item 13. Certain Relationships and Related Transactions
The information required by this Item will be included in the 2004 Proxy Statement under thesection captioned ‘‘Certain Relationships and Related Transactions’’ and is incorporated herein byreference thereto.
Item 14. Principal Accounting Fees and Services
The information required by this Item will be included in the 2004 Proxy Statement under thesection captioned ‘‘Statement of Fees Paid to Independent Accountants’’ and is incorporated herein byreference thereto.
83
PART IV
Item 15. Exhibits, Financial Statement Schedules, and Reports on Form 8-K
Item 15(a)(1) and (2) and Item 15(d) Financial Statements and Schedules.
See ‘‘Index to Consolidated Financial Statements and Financial Statements Schedules’’ at Item 8 tothis Form 10-K. Other financial statement schedules have not been included because they are notapplicable or the information is included in the financial statements or notes thereto.
Item 15(a)(3) and Item 15(c) Exhibits.
The exhibits filed as part of this Annual Report on Form 10-K are listed in the Exhibit Indeximmediately preceding the exhibits. The Company has identified in the Exhibit Index each managementcontract and compensation plan filed as an exhibit to this Annual Report on Form 10-K in response toItem 14(c) of Form 10-K.
Item 15(b) Reports on Form 8-K.
On October 30, 2003, the Company furnished a current report on Form 8-K under Item 12(Results of Operations and Financial Condition) containing a copy of an earnings press release.
84
SIGNATURES
Pursuant to the requirements of Section 13 or 15(d) of the Securities Exchange Act of 1934, theregistrant has duly caused this report to be signed on its behalf by the undersigned, thereunto dulyauthorized.
CHARLES RIVER LABORATORIES INTERNATIONAL, INC.
By: /s/ THOMAS F. ACKERMAN Date: March 10, 2004
Thomas F. AckermanSenior Vice President andChief Financial Officer
Pursuant to the requirements of the Securities Exchange Act of 1934, this report has been signedby the following persons on behalf of the registrant and in the capacities indicated below and on thedates indicated.
Signatures Title Date
By: /s/ JAMES C. FOSTER President, Chief Executive March 10, 2004Officer and ChairmanJames C. Foster
By: /s/ THOMAS F. ACKERMAN Senior Vice President and Chief March 10, 2004Financial OfficerThomas F. Ackerman
By: /s/ ROBERT CAWTHORN Director March 10, 2004
Robert Cawthorn
By: /s/ STEPHEN D. CHUBB Director March 10, 2004
Stephen D. Chubb
By: /s/ GEORGE E. MASSARO Director March 10, 2004
George E. Massaro
By: /s/ GEORGE M. MILNE Director March 10, 2004
George M. Milne
By: /s/ DOUGLAS E. ROGERS Director March 10, 2004
Douglas E. Rogers
By: /s/ SAMUEL O. THIER Director March 10, 2004
Samuel O. Thier
By: /s/ WILLIAM H. WALTRIP Director March 10, 2004
William H. Waltrip
85
EXHIBIT INDEX
ExhibitIndex Description
2.1 Recapitalization Agreement, dated as of July 25, 1999, among Charles River Laboratories,Inc., Charles River Laboratories International, Inc. (formerly known as Endosafe, Inc.),Bausch & Lomb Incorporated, and other parties listed therein (Filed as Exhibit 2.1). (3)
2.2 Amendment No. 1 to Recapitalization Agreement, dated as of September 29, 1999, by Bausch& Lomb Incorporated and CRL Acquisition LLC (Filed as Exhibit 2.2). (3)
2.3 Agreement and Plan of Reorganization, dated as of June 6, 2000, among Charles RiverLaboratories International, Inc., CRL Acquisition LLC and B&L CRL, Inc. (Filed asExhibit 2.3). (2)
2.4 Stock Purchase Agreement among Pathology Associates International Corporation, ScienceApplications International Corp., and Charles River Laboratories, Inc., dated December 21,2000 (filed as Exhibit 2.4). (1)
2.5 Stock Purchase Agreement, dated as of February 6, 2001, among Charles River Laboratories,Inc., Primedica Corporation, TSI Corporation and Genzyme Transgenics Corporation (Filed asExhibit 2.5). (1)
3.1 Amended and Restated Certificate of Incorporation of Charles River LaboratoriesInternational, Inc. (filed as Exhibit 3.1). (2)
3.2 By-laws of Charles River Laboratories International, Inc. (Filed as Exhibit 3.2). (2)4.1 Form of certificate representing shares of common stock, $0.01 per value per share (Filed as
Exhibit 4.1). (2)4.2 Indenture, dated as of January 24, 2002, between Charles River Laboratories International,
Inc. and State Street Bank and Trust Company, as Trustee (Filed as Exhibit 4.8). (9)4.3 Registration Rights Agreement, dated as of January 17, 2002, among Charles River
Laboratories International, Inc., Credit Suisse First Boston Corporation, Lehman BrothersInc., J.P. Morgan Securities Inc., SG Cowen Securities Corporation, U.S. Bancorp PiperJaffray Inc., Thomas Weisel Partners LLC, Investec PMG Capital Corp. and Jefferies &Company, Inc. (Filed as Exhibit 4.9). (9)
10.1 Joint Venture Agreement between Ajinomoto Co., Inc. and Charles River BreedingLaboratories, Inc., dated June 24, 1981, and ancillary agreements, amendments and addenda(Filed as Exhibit 10.6). (4)
10.2 Supply Agreement between Merck & Co., Inc. and Charles River Laboratories, Inc., datedSeptember 30, 1994 (Filed as Exhibit 10.7). (3)
10.3 Amended and Restated Stock Purchase Agreement among Charles River Laboratories, Inc.and SBI Holdings, Inc. and its stockholders, dated September 4, 1999 (Filed asExhibit 10.8). (3)
10.4 Ground Lease between HIC Associates (Lessor) and Charles River Laboratories, Inc.(Lessee) dated June 5, 1992; Real Estate Lease between Charles River Laboratories, Inc.(Landlord) and Charles River Partners L.P. (Tenant) dated December 22, 1993; andAssignment and Assumption Agreement between Charles River Partners, L.P. (Assignor) andWilmington Partners L.P. (Assignees) dated December 22, 1993 (Filed as Exhibit 10.9). (3)
10.5 Amended and Restated Distribution Agreement among Charles River BRF, Inc., CharlesRiver Laboratories, Inc., Bioculture Mauritius Ltd. and Marry Ann and Owen Griffiths, datedDecember 23, 1997 (Filed as Exhibit 10.10). (3)
10.6 Supply Agreement between Sierra Biomedical, Inc. and Scientific Resources International,Ltd., dated March 18, 1997 (Filed as Exhibit 10.11). (3)
10.7 Severance Agreement between Charles River Laboratories, Inc. and Real H. Renaud, datedJanuary 20, 1992 (Filed as Exhibit 10.10). (2)+
10.8 1999 Charles River Laboratories Officer Separation Plan (Filed as Exhibit 10.11). (2)+
86
ExhibitIndex Description
10.9 Form of Agreement and Release among Bausch & Lomb, Incorporated, Charles RiverLaboratories, Inc. and the named executive officers, dated as of July 25, 1999 (Filed asExhibit 10.12). (2)+
10.10 1999 Management Incentive Plan (Filed as Exhibit 10.1). (5)+10.11* 2000 Incentive Plan, as amended May 2004.10.12 Amendment No. 1 to the 2000 Incentive Plan of Charles River Laboratories International,
Inc., dated May 8, 2001 (Filed as Exhibit 99.1). (7)10.13 2000 Directors Stock Plan (Filed as Exhibit 10.15). (2)+ Charles River Laboratories
International, Inc. 2000 Incentive Plan Inland Revenue Approved Rules for UK Employees(Filed as Exhibit 99.1). (8)
10.14 Form of Indemnification Agreement (Filed as Exhibit 10.16). (2)+10.15* Form of Change in Control Agreement.+10.16* Form of Change in Control Agreement.+21.1* Subsidiaries of Charles River Laboratories International, Inc.23.1* Consent of PricewaterhouseCoopers LLP.31.1* Rule 13a-14(a)/15d-14(a) Certification of the Chief Executive Officer.31.2* Rule 13a-14(a)/15d-14(a) Certification of the Chief Financial Officer.32.1* Section 1350 Certification of the Chief Executive Officer.32.2* Section 1350 Certification of the Chief Financial Officer.
(1) Previously filed as an exhibit to the Company’s Registration Statement on Form S-3 (FileNo. 333-55670), as amended, filed February 15, 2001.
(2) Previously filed as an exhibit to Amendment No. 2 to the Company’s Registration Statement onForm S-1 (File No. 333-35524), as amended, filed June 23, 2000.
(3) Previously filed as an exhibit to the Registration Statement of Charles River LaboratoriesHoldings, Inc., predecessor in interest to the Company, on Form S-1 (File No. 333-92383), asamended, filed December 8, 1999.
(4) Previously filed as an exhibit to the Registration Statement of Charles River LaboratoriesHoldings, Inc., predecessor in interest to the Company, on Form S-1 (File No. 333-35524) filedApril 25, 2000.
(5) Previously filed as an exhibit to the Quarterly Report on Form 10-Q of Charles RiverLaboratories Holdings, Inc., predecessor in interest to the Company, filed May 9, 2000.
(6) Previously filed as an exhibit to the Company’s Quarterly Report on Form 10-Q filed August 10,2001.
(7) Previously filed as an exhibit to the Company’s Quarterly Report on Form 10-Q filed May 15,2001.
(8) Previously filed as an exhibit to the Company’s Quarterly Report on Form 10-Q filed November 5,2001.
(9) Previously filed as an exhibit to the Company’s Annual Report on Form 10-K filed March 27,2001.
(10) Previously filed as an exhibit to the Company’s Quarterly Report on Form 10-Q filed May 9, 2002.+ Management contract or compensatory plan, contract or arrangement.* Filed herewith.
Where a document is incorporated by reference from a previous filing, the Exhibit number of thedocument in that previous filing is indicated in parentheses after the description of such document.
87
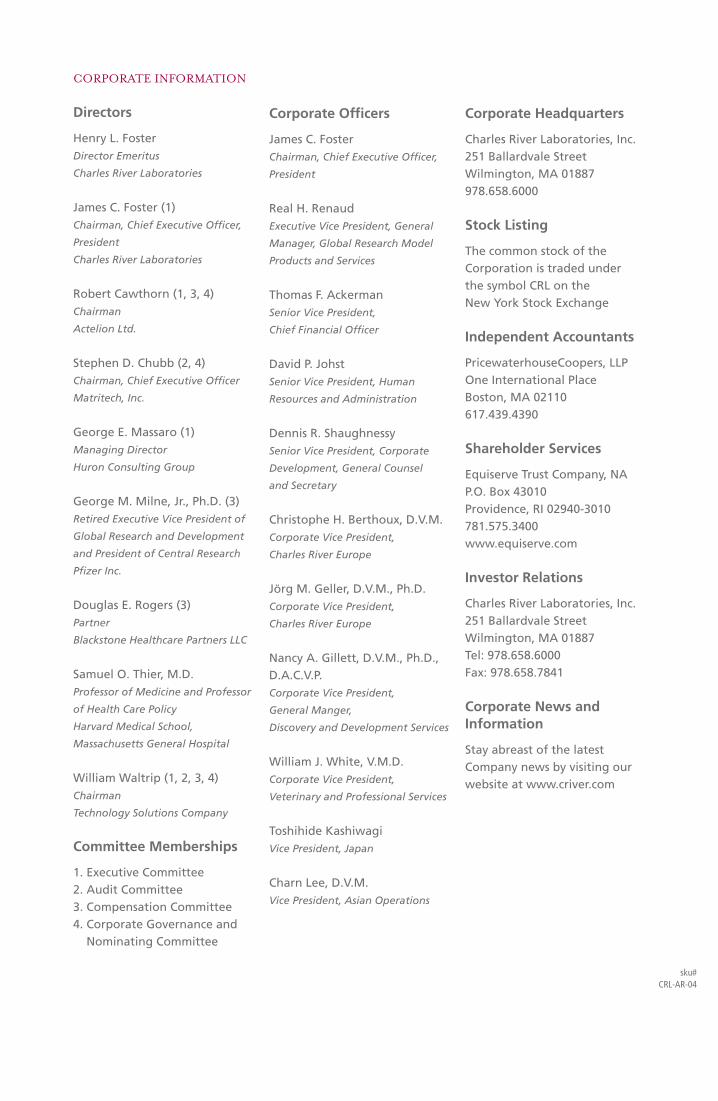
2003 Form 10-K
CORPORATE INFORMATION
Directors
Henry L. FosterDirector Emeritus
Charles River Laboratories
James C. Foster (1)Chairman, Chief Executive Officer,
President
Charles River Laboratories
Robert Cawthorn (1, 3, 4)Chairman
Actelion Ltd.
Stephen D. Chubb (2, 4)Chairman, Chief Executive Officer
Matritech, Inc.
George E. Massaro (1)Managing Director
Huron Consulting Group
George M. Milne, Jr., Ph.D. (3)Retired Executive Vice President of
Global Research and Development
and President of Central Research
Pfizer Inc.
Douglas E. Rogers (3)Partner
Blackstone Healthcare Partners LLC
Samuel O. Thier, M.D.Professor of Medicine and Professor
of Health Care Policy
Harvard Medical School,
Massachusetts General Hospital
William Waltrip (1, 2, 3, 4)Chairman
Technology Solutions Company
Committee Memberships
1. Executive Committee2. Audit Committee3. Compensation Committee4. Corporate Governance and
Nominating Committee
Corporate Officers
James C. FosterChairman, Chief Executive Officer,
President
Real H. RenaudExecutive Vice President, General
Manager, Global Research Model
Products and Services
Thomas F. AckermanSenior Vice President,
Chief Financial Officer
David P. JohstSenior Vice President, Human
Resources and Administration
Dennis R. ShaughnessySenior Vice President, Corporate
Development, General Counsel
and Secretary
Christophe H. Berthoux, D.V.M.Corporate Vice President,
Charles River Europe
Jörg M. Geller, D.V.M., Ph.D.Corporate Vice President,
Charles River Europe
Nancy A. Gillett, D.V.M., Ph.D.,D.A.C.V.P.Corporate Vice President,
General Manger,
Discovery and Development Services
William J. White, V.M.D.Corporate Vice President,
Veterinary and Professional Services
Toshihide KashiwagiVice President, Japan
Charn Lee, D.V.M.Vice President, Asian Operations
Corporate Headquarters
Charles River Laboratories, Inc.251 Ballardvale StreetWilmington, MA 01887978.658.6000
Stock Listing
The common stock of theCorporation is traded under the symbol CRL on the New York Stock Exchange
Independent Accountants
PricewaterhouseCoopers, LLPOne International PlaceBoston, MA 02110617.439.4390
Shareholder Services
Equiserve Trust Company, NAP.O. Box 43010Providence, RI 02940-3010781.575.3400www.equiserve.com
Investor Relations
Charles River Laboratories, Inc.251 Ballardvale StreetWilmington, MA 01887Tel: 978.658.6000Fax: 978.658.7841
Corporate News andInformation
Stay abreast of the latestCompany news by visiting ourwebsite at www.criver.com
sku# CRL-AR-04

C h a r l e s R i v e r L a b o r a t o r i e s Annual Report 2003
AC C E L E R AT I NG RE S E A R C H™
CH A R L E S RI V E R LA B O R ATO R I E S
251 Bal lardvale St reet
Wi lmington, MA 01887
978.658.6000
www.cr iver.com