Embed Size (px)
Citation preview

September 26 2017
Speaker: Viswanath Devanarayan, PhD, FAAPS, Charles River Laboratories
Dr. Devanarayan is currently the Executive Director and Head of Global Statistics at Charles River Laboratories. He has over 21 years of combined pharmaceutical research experience from Eli Lilly, Merck, and AbbVie. His statistical & data-analytic contributions span a wide range of applications across drug discovery and development, such as target identification, high-throughput-screening, genomics, proteomics, bioanalytical methods, precision medicine, and exploratory clinical research. He has filed 10 patent applications, given over 100 invited talks at scientific meetings, and co-authored over 55 publications that includes several white-papers with regulatory, academic and industry scientists. He is an elected Fellow of the American Association of Pharmaceutical Scientists (AAPS), and is also serving as an Adjunct Professor at the University of Illinois in Chicago. He is currently volunteering as the AAPS Task Theme Chair on Predictive Modeling.
Title: Subgroup identification algorithms for precision medicine
Abstract: Causal mechanism of relationship between the clinical outcome (efficacy or safety endpoints) and putative biomarkers, clinical baseline, and related predictors is usually unknown and must be deduced empirically from experimental data. Such relationships enable the development of tailored therapeutics and implementation of a precision medicine strategy in clinical trials to help stratify patients in terms of disease progression, clinical response, treatment differentiation, and so on. These relationships often require complex modeling to develop the prognostic and predictive signatures. For the purpose of easier interpretation and implementation in clinical practice, defining a multivariate biomarker signature in terms of thresholds (cutoffs/cut points) on individual biomarkers is preferable. In this talk, we will propose some methods for developing such signatures in the context of continuous, binary and time-to-event endpoints. Results from simulations and case study illustration are also provided.

Biomarker-basedsubgroupidentificationforprecisionmedicine
V.Devanarayan,Ph.D.,FAAPSCharlesRiverLaboratories
JointworkwithDrs.XinHuang&YanSun,AbbVieInc.
PresentedforOntarioInstituteforCancerResearch,Toronto,Canada,September26,2017

SubgroupIdentificationforPrecisionMedicine|PresentationforOICR,September26,2017|V.Devanarayan
1. ImportanceofPrecisionMedicine
2. DifferencebetweenPredictivevs.PrognosticSignatures
3. “Threshold-basedmultivariatesignatures”:whyandhow
4. Predictingtheperformanceinafutureclinicaltrial(significance:p-value,effectsize,etc.)
5. Exampleofthisapplicationduringdrugdevelopment
Outline(“learningtopics”)
2 EVERY STEP OF THE WAY

SubgroupIdentificationforPrecisionMedicine|PresentationforOICR,September26,2017|V.Devanarayan
Discovery Pre-clinical Phase 1,2 Phase 3 Phase 4
Drug Development
Discovery
Demonstration
Characterization
Qualification
SurrogacyPredictive use of efficacy &
safety biomarkers
Candidates attrition & refinement
Dose selection, PK/PD modeling
Efficacy & safety “valid” & putative markers
PoM, protocol design
Patient stratificationOther indications
Market differentiationPost approval surveillance
TranslationalMedicine
Biomarkerdevelopment&Drugdevelopmentareintertwined
3 EVERY STEP OF THE WAY

SubgroupIdentificationforPrecisionMedicine|PresentationforOICR,September26,2017|V.Devanarayan
WhyPrecisionMedicine?
EdwardAbrahamsandMikeSilver.TheCaseforPersonalizedMedicine.(2009)JournalofDiabetesScienceandTechnologyV3Issue4
4 EVERY STEP OF THE WAY

SubgroupIdentificationforPrecisionMedicine|PresentationforOICR,September26,2017|V.Devanarayan
GenomicBiomarkersforPrecisionMedicinesinOncology
SikorskiRandYaoB.2010.VisualizingtheLandscapeofSelectionBiomarkersinCurrentPhase3OncologyClinicalTrials.ScienceTranslationalMedicine,2,34,34ps27
5 EVERY STEP OF THE WAY

SubgroupIdentificationforPrecisionMedicine|PresentationforOICR,September26,2017|V.Devanarayan
Biomarkersignaturesforsubgroupidentification
PredictiveSignatures - predicttheclinicalresponsetoaspecifictreatment(drugA)comparedtoothertreatments.
ØIdentifiespatientsthatrespondonlytodrugA,andnottootherdrugs.
PrognosticSignatures - predicttheclinicalresponseirrespectiveofthetreatment.Ø IdentifiespatientsthatrespondtodrugA,butmaynotbe
specifictothisdrug(i.e.,thesepatientsmayrespondtocompetitordrugsaswell).
Weproposesomedata-drivenstatisticalmethodsbasedondecision-tree®ression-basedmodelsfordevelopingunivariate&multivariatethreshold-basedbiomarkersignatures.
6 EVERY STEP OF THE WAY

SubgroupIdentificationforPrecisionMedicine|PresentationforOICR,September26,2017|V.Devanarayan
• Foreaseofimplementationinclinicalpractice,needcut-pointsonbiomarkers forpredictingresponders/non-responders.
• i.e.,threshold-basedbiomarkersignatures
• E.g.,PatientswithGeneX1>…,GeneX2<…,arelikelyresponders.
• Thisshouldbe“Multivariate”.
• Derivedfromhigh-dimensional–omicsdata,and/orfocusedonatargetedpanel(specifictopathway,literature,etc.).
• Afterapromisingthreshold-basedsignatureisidentified,needtopredictit’sperformanceinafuturedataset,intermsofType-Ierror.
• i.e.,predicttreatmenteffectinthe“responder”subgroup,orpredictthesignatureeffectamongpatientsreceivingtreatment.
• Notmanyalgorithmsintheliterature.
Somestatisticalchallenges
7 EVERY STEP OF THE WAY

SubgroupIdentificationforPrecisionMedicine|PresentationforOICR,September26,2017|V.Devanarayan
• Weevaluatedsomeofthepublishedalgorithmsforidentifyingoptimalpatientsubgroupsinclinicaltrials(e.g.,SIDES,GUIDE,etc.).Ø Didn’tyieldpositive/goodresultsinsomeofourclinicalprograms.
• Thismotivatedastrongneedtodevelopnewalgorithms.• Wedevelopedthefollowingalgorithms:
Ø1.PRIM,2.Sequential-BATTing,3.MC-AIM,4.MC-AIM-RULE,5.optAUC,6.SQUANT,etc.
Ø1-4havebeenpublished;Chenetal(2015),Huangetal(2017).
• Ourtestinghasshownthatnosinglemethodisalwaysthebest.Ø Fore.g.,regression-basedmethodsarebettersuitedforlinear
relationships,whiletree-basedmethodsaremorepowerfulfornonlinearrelationshipswheninteractionsarepresent.
Ourresearchonsubgroupidentificationmethods
8 EVERY STEP OF THE WAY

SubgroupIdentificationforPrecisionMedicine|PresentationforOICR,September26,2017|V.Devanarayan9 EVERY STEP OF THE WAY

SubgroupIdentificationforPrecisionMedicine|PresentationforOICR,September26,2017|V.Devanarayan10 EVERY STEP OF THE WAY

SubgroupIdentificationforPrecisionMedicine|PresentationforOICR,September26,2017|V.Devanarayan
vConsiderasupervisedlearningproblemwithdata 𝒙𝒊, 𝑦% , 𝑖 =1, 2, … , 𝑛, where𝒙𝒊 isap-vectorofpredictorand𝑦% isanoutcomevariable
vConsiderthreemajorapplications:• Linearregressionforcontinuousresponse
• Logisticregressionforbinaryresponse,where𝑦% ∈ 0, 1• Coxregressionforsurvivalresponse:𝑦% = (𝑇%, 𝛿%),where𝑇% isaright
censoredsurvivaltimeand𝛿% isthecensoringindicator
vDenotethelog-likelihoodorpartiallog-likelihoodbyℓ(𝜂; 𝑿, 𝒚),where𝜂 istheusuallinearcombinationofpredictors.Forexample:• linearpredictorinsimplelinearregression
• logoddsinlogisticregression
• loghazardinproportionalhazardsregression.
Prognostic&predictivesignaturesMathematicalframework
11 EVERY STEP OF THE WAY

SubgroupIdentificationforPrecisionMedicine|PresentationforOICR,September26,2017|V.Devanarayan
v Considerthefollowingmodelforprognosticsignatures (predictthediseaseoutcome,irrespectiveofthetreatment),
𝜂 = 𝛼 + 𝛽 ; 𝜔(𝑿),(1)
where𝜔 𝑿 = {0, 1} isthesignaturerule returninggroupingindicatorsforeachsubject.
v Considerfollowingmodelforpredictivesignatures(predicttheresponsetoaspecifictreatmentcomparedtotheothertreatment),
𝜂 = 𝛼 + 𝛽 ; 𝜔 𝑿 ×𝑟 + 𝛾 ; 𝑟,(2)
wherer isthetreatmentindicator.
v Ouralgorithmsderivesignaturerules,𝜔 𝑿 ,withtheobjective ofsearchingforabestgroupingtooptimizethesignificanceof𝛽 in(1)and(2)
Prognostic&predictivesignaturesMathematicalframework(contd.)
12 EVERY STEP OF THE WAY

SubgroupIdentificationforPrecisionMedicine|PresentationforOICR,September26,2017|V.Devanarayan
Original Data
Tree 1>= C1< C1
Tree 2>= C2< C2 ……...
Tree B>= CB< CB
Aggregate Thresholds (C1, C2, …., CB)
BATTing Threshold (Median)
Bootstrapping (sampling with replacement)
Data 1 Data 2 Data B… … ...
Threshold is robust to small
perturbations in data, outliers, etc.
Bootstrapping&AggregatingofThresholdsfromTrees (BATTing)
(Devanarayan,1999)13 EVERY STEP OF THE WAY

SubgroupIdentificationforPrecisionMedicine|PresentationforOICR,September26,2017|V.Devanarayan
BATTing,contd.
14 EVERY STEP OF THE WAY

SubgroupIdentificationforPrecisionMedicine|PresentationforOICR,September26,2017|V.Devanarayan
SequentialBATTing
Model Growing within the potential Sig+ group• Get the BATTing threshold for each unusedmarker• The best marker is selected to split the current sig+ group• This procedure continues in the new Sig+ group
Stopping Rule:• The new added predictor goes through the likelihood ratio test for
significance.
WholePopulation (Sig+)
Sig-
(Sig+) (Sig+) Sig+
Sig- Sig- Sig-
Marker7 Marker3 Marker9
15 EVERY STEP OF THE WAY

SubgroupIdentificationforPrecisionMedicine|PresentationforOICR,September26,2017|V.Devanarayan
AdaptiveIndexModel
AIM(Tian&Tibshirani,2010)canbeusedforselectingmarkers&thresholds.• Output:AIMScore
• Anindexpredictor:#ofsatisfiedrules𝒔𝒄𝒐𝒓𝒆 = ∑ 𝑰(𝑋J ≤ 𝑐J)𝑲
𝒌O𝟏• ModeltogettheAIMscore
Prognostic:𝜂∗ = 𝜃S + 𝜽×𝒔𝒄𝒐𝒓𝒆,Predictive:𝜂∗ = 𝜃S + 𝛾 ; 𝑇 + 𝜽×𝑻×𝒔𝒄𝒐𝒓𝒆.
• Aninformationmatrixbasedfastalgorithmisusedtodoscoretesttoselectthresholdforeachmarker
• Markersareselectedoneatatime(forwardselection)• Optimal#ofmarkersisdeterminedviacrossvalidation
16 EVERY STEP OF THE WAY

SubgroupIdentificationforPrecisionMedicine|PresentationforOICR,September26,2017|V.Devanarayan
AIM-BATTing
1. ObtaintheAIMScore
2. UseBATTing toderiveanoptimalAIMScorethresholdbasedonModel(1)&(2).Thethresholdisthenusedtostratifythepopulation.
Patient1
Patient2
Patientn
AIMI(X1≥c1)
+I(X2≤c2)
…..+
I(Xk≥ck)
Score1
Step1
Score2
Scoren
Step2
BATTingI( Score ≥ j )
Sig+Grp.
Sig- Grp.
17 EVERY STEP OF THE WAY

SubgroupIdentificationforPrecisionMedicine|PresentationforOICR,September26,2017|V.Devanarayan
SomeRefinementstotheAIM-BATTing algorithm
• MC-AIM-BATTing:– MonteCarloproceduretogetamorestableestimateofthe“optimal#of
markers”.
– i.e.,usethemedianofestimated“optimal#ofmarkers”acrossmultiplecrossvalidationrunswithdifferentrandomseeds
• MC-AIM-RULE-BATTing:– UseBATTing directlyontherules(Xi>c),insteadofscores,andgeta
cutoffontherulelist.
– Patientsmeetingalltheruleswithinthecutoffareassignedtothesig+group
18 EVERY STEP OF THE WAY

SubgroupIdentificationforPrecisionMedicine|PresentationforOICR,September26,2017|V.Devanarayan
Commonmistake:
• Theentiredatasetisusedtodevelopthesignature.
• Importantvariablesareselectedbyassociatingmarkerswithoutcomes(e.g.,stepwiseregression)
• Testandrelyonlackoffitassessmentoftheresultingmodel
• Assumingtheresultingmodeliscorrect,inferenceontheperformanceofthebiomarkersignatureismadeusingthissameentiredataset.
Performanceevaluation
Needtoapplythesignaturederivationalgorithm&assessperformanceusingindependenthold-outdatasetsviacross-validationorsimilarframework.Thishelps“predict”thesignificanceinafuturestudy,alongwiththeeffectsizeanddifferentperformancemeasures.
19 EVERY STEP OF THE WAY

SubgroupIdentificationforPrecisionMedicine|PresentationforOICR,September26,2017|V.Devanarayan
• PredictiveSignificanceofcut-point(rules-based)signaturescanbeevaluatedvia5-foldcross-validation(CV).– Stratificationforpatientsineachfoldarepredictedbyapplyingthealgorithmdevelopedfromtheotherfolds.
– “Cross-validated”effectsize,p-value,etc.,areestimatedafteraggregatingthepredictedstratificationsofalltheleft-outfolds.
• Amorestableestimateofthecross-validatedp-valuesisobtainedbyiteratingtheaboveprocedure50-100times.
• Followingperformancemetricsaretypicallyreported:– Medianp-value,andupper95%empiricallimit– EffectSize:thisismostimportantasithelpswithdesigning&validatinginfuturestudies.
– Othersummarymetricssuchassensitivity,specificity,PPV,NPV,hazardratio,oddsratiocanbereported.
“PredictiveSignificance”viacross-validationChenetal,StatisticsinMedicine,2015
20 EVERY STEP OF THE WAY

SubgroupIdentificationforPrecisionMedicine|PresentationforOICR,September26,2017|V.Devanarayan
“PredictiveSignificance”viacross-validationChenetal,StatisticsinMedicine,2015
Aggregated cross-validated p values from M iterations (p1, p2, …., pM)
predictive significance (median of this p-value distribution)
RepeatMultipleTimes
Note:otherperformancestatistics,e.g.,sensitivity,specificity,PPV,NPV,hazardratio,oddsratiocanbecalculatedsimilarly
Train
Test
Sig.
Train
Test
Sig.
Train
Test
Sig.
GroupLabel
GroupLabel
GroupLabel
GroupLabel
GroupLabel
Evaluatep-value(pi)
Signaturepositiveornegative?
21 EVERY STEP OF THE WAY

SubgroupIdentificationforPrecisionMedicine|PresentationforOICR,September26,2017|V.Devanarayan
• SimilarsimulationmodelasinLipkovich etal.,2011,2014(SIDES)witheachpredictorascontinuousinsteadofdichotomizedvalued
• Smalltrialstolargetrials(n=100,300,500)
• Numberofcandidatepredictorsisk=10and18withdifferentcorrelationstructures
• Effectsizeis0.2(low),0.5(medium),0.8(high)
SimulationDesign
Effect size = E(Y|Trt, sig+) - E(Y|ctrl, sig+) = 0.5
0.5
22 EVERY STEP OF THE WAY

SubgroupIdentificationforPrecisionMedicine|PresentationforOICR,September26,2017|V.Devanarayan
SimulationResults
• Foreffectsize>=0.5andsamplesize>=300,ourproposedmethodshavemostofthetestingp-values<0.05andaccuracy~90%.SIDESmethodunder-performsinallscenarios.
• Foreffectsizeof0.2,ourproposedmethodsoutperformSIDESintermsoftheselectionaccuracy:theaccuracyofSIDESisaround50%whilethatofourproposedalgorithmsisfrom60%to70%forlargesamplesize.
23 EVERY STEP OF THE WAY

SubgroupIdentificationforPrecisionMedicine|PresentationforOICR,September26,2017|V.Devanarayan
Case-Study
24 EVERY STEP OF THE WAY

SubgroupIdentificationforPrecisionMedicine|PresentationforOICR,September26,2017|V.Devanarayan25 EVERY STEP OF THE WAY

SubgroupIdentificationforPrecisionMedicine|PresentationforOICR,September26,2017|V.Devanarayan
• Linifanib:Orallyactiveinhibitorofthevascularendothelialgrowthfactorreceptor(VEGFR)andplatelet-derivedgrowthfactorreceptor(PDGFR)familiesofreceptortyrosinekinases.
• AlthoughclinicalactiveinadvancedNSCLCinunselectedpatientpopulations,identificationofpredictivebiomarkerswasconsideredpotentiallyvaluableforfurtherdevelopment.
• Candidatemarkersconsidered:• CA125,CA15.3,CEA,CYFRA21-1,NSE,PlGF,ProGRP,andSCC
• Trainingdataset:• 241baselineplasmaspecimensfromfourNSCLCtrials,including
Linifanib(n=116),andthreeothertreatments(totaln=125).
• Validation/Testdataset:• 138patientswithstageIIIB/IVnon-squamousNSCLCfroma
phase-IIfirst-linestudywithLinifanib7.5mg/day,12.5mgdailyorplacebo,addedtoastandard3-weekregimenofcarboplatinandpaclitaxel.
Background/data
26 EVERY STEP OF THE WAY

SubgroupIdentificationforPrecisionMedicine|PresentationforOICR,September26,2017|V.Devanarayan
• SignaturederivedfromtheTrainingset:• CEA>3.0ng/mLandCYFRA21.1<7.0ng/mL,wasidentifiedas
providingthelowestHazardRatio(HR)estimateforsurvivalofNSCLCpatientsreceivingLinifanibversusthosereceivingothertreatments.
• Algorithmused:SequentialBATTing
• Thisbiomarkersignaturewasappliedtothepatientsfromthevalidation(test)datasettogrouptheminto“signaturepositive”and“signaturenegative”groups.ThedifferencebetweenthesegroupswithrespecttoPFSandOSwasassessedvialog-ranktest.Thetreatmentgroupswerecomparedforthesignaturepositiveandnegativegroupsseparately.
• OnlyLinifanib-treatedsignature-positivepatientshadsignificantimprovementinPFS.• MedianPFSwithplacebowas5.2monthsversus10.2months
(HR=0.49,p=0.049)forthosereceivinglinifanib 7.5mg,and8.3months(HR=0.38,p=0.029)forlinifanib 12.5mg.
Analysis&Results
27 EVERY STEP OF THE WAY

SubgroupIdentificationforPrecisionMedicine|PresentationforOICR,September26,2017|V.Devanarayan
Biomarker signature Median OS, months (95% CI); n
Linifanib Other treatments
Signature positive (49%) 13.1 (9.1-17.6), n=50 8.2 (5.8-9.6), n=67
Signature negative (51%) 7.4 (4.9-8.9), n=66 5.8 (3.3-8.8), n=58
p value (log-rank) 0.0017 0.7163
Moredetails:Trainingsetresults
Signatureassociatedwithimprovedsurvivalonlinifanib,butnotothertreatmentsinsecond- andthird-lineNSCLC
28 EVERY STEP OF THE WAY

SubgroupIdentificationforPrecisionMedicine|PresentationforOICR,September26,2017|V.Devanarayan
Moredetails:Trainingsetresults
--- Signature positive, N=50, median OS = 398 days --- Signature positive, N= 67, median OS = 248 days --- Signature negative, N=66, median OS = 225.5days --- Signature negative, N=58, median OS = 176 days
HR = 0.524 (p=0.002) HR = 0.925(p=0.716)
Kaplan-Meierestimateofoverallsurvivalforsignature-positiveandsignature-negativepatientsinsecond- andthird-linestudieswithlinifanib (left)orothertherapies(right)inadvancedNSCLC
Linifanib Other Treatments
29 EVERY STEP OF THE WAY
SubgroupIdentificationforPrecisionMedicine|PresentationforOICR,September26,2017|V.Devanarayan
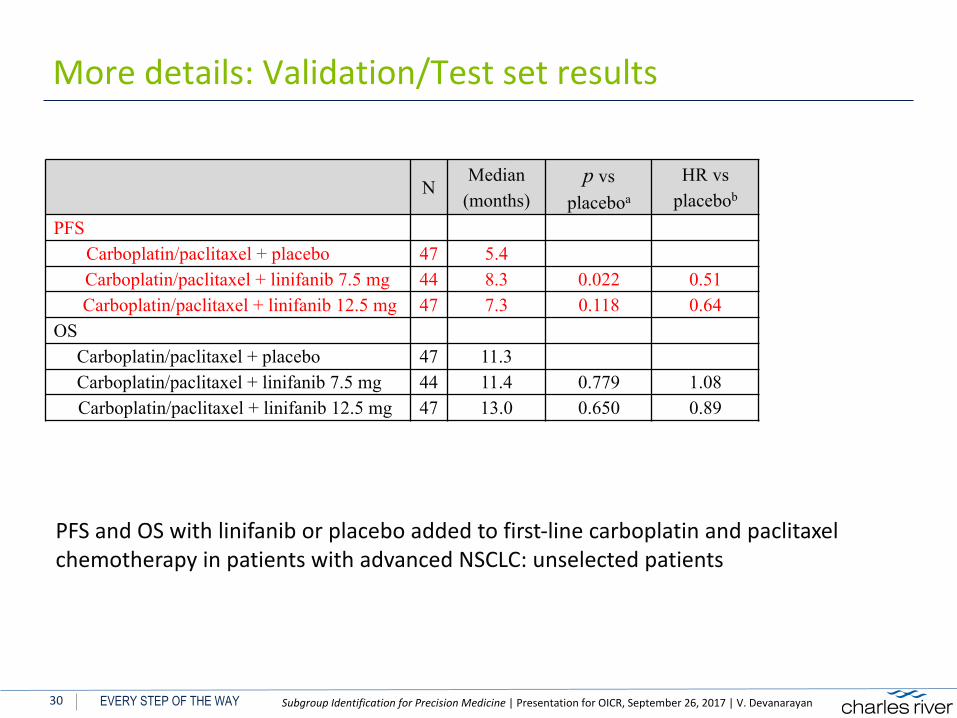
Moredetails:Validation/Testsetresults
PFSandOSwithlinifanib orplaceboaddedtofirst-linecarboplatinandpaclitaxelchemotherapyinpatientswithadvancedNSCLC:unselectedpatients
NMedian
(months)p vs
placeboa
HR vs placebob
PFSCarboplatin/paclitaxel + placebo 47 5.4Carboplatin/paclitaxel + linifanib 7.5 mg 44 8.3 0.022 0.51Carboplatin/paclitaxel + linifanib 12.5 mg 47 7.3 0.118 0.64
OSCarboplatin/paclitaxel + placebo 47 11.3Carboplatin/paclitaxel + linifanib 7.5 mg 44 11.4 0.779 1.08Carboplatin/paclitaxel + linifanib 12.5 mg 47 13.0 0.650 0.89
30 EVERY STEP OF THE WAY

SubgroupIdentificationforPrecisionMedicine|PresentationforOICR,September26,2017|V.Devanarayan
Moredetails:Validation/Testsetresults,contd.
PFSandOSwithlinifanib orplaceboaddedtofirst-linecarboplatinandpaclitaxelchemotherapyinpatientswithadvancedNSCLC:biomarkersignature-selectedpatients
NMedian
(Months)p vs
Placeboa
HR vs Placebob
PFS – Signature negativeCarboplatin/paclitaxel + placebo 26 5.4
Carboplatin/paclitaxel + linifanib 7.5 mg 18 8.3 0.480 0.48Carboplatin/paclitaxel + linifanib 12.5 mg 19 5.3 0.617 0.62
PFS – Signature positiveCarboplatin/paclitaxel + placebo 19 5.4Carboplatin/paclitaxel + linifanib 7.5 mg 24 10.2 0.049 0.49
Carboplatin/paclitaxel + linifanib 12.5 mg 26 8.3 0.029 0.38OS – Signature negative
Carboplatin/paclitaxel + placebo 26 13.3Carboplatin/paclitaxel + linifanib 7.5 mg 18 9.7 0.348 1.39Carboplatin/paclitaxel + linifanib 12.5 mg 19 8.2 0.382 1.36
OS – Signature positiveCarboplatin/paclitaxel + placebo 19 11.3Carboplatin/paclitaxel + linifanib 7.5 mg 24 12.5 0.858 1.02
Carboplatin/paclitaxel + linifanib 12.5 mg 26 17.4 0.137 0.54
31 EVERY STEP OF THE WAY

SubgroupIdentificationforPrecisionMedicine|PresentationforOICR,September26,2017|V.Devanarayan
• PrecisionMedicinehasbeenaparadigmshiftindrugdevelopment.– NotjustinOncology,butalsoAlzherimer’s,Depression,Auto-Immunedisorders(RA,OA,GI,…),CHD,etc.
• Itrequires:– Fit-for-purposeBMx plan/strategy(Wholeand/ortargetedGx/Px,etc.)– Strongcollaborationbetweendifferentfunctionalareas&SMEs.– Useofavarietyofdataanalytic&subgroupidentificationmethods– Enrichmentdesignandsimulations– CDx andclinicaldevelopmentstrategy
• Algorithmsreviewedhereprovidethreshold-basedmultivariatesignatures viavariationsoftree®ression-basedmodels.
• Notjustfor“precisionmedicine”,butalsoforotherneeds,e.g.,disease/phenotypespecificity,reducingplaceboresponse,etc.
Summary
32 EVERY STEP OF THE WAY

SubgroupIdentificationforPrecisionMedicine|PresentationforOICR,September26,2017|V.Devanarayan
1. HastieT,TibshiraniR,FriedmanJ(2011)TheElementsofStatisticalLearning:DataMining,Inference,andPrediction,SecondEdition,2nded.2009.Corr.7thprinting2013edition.Springer
2. Breiman L,FriedmanJ,StoneCJ,Olshen RA(1984)ClassificationandRegressionTrees,1edition.ChapmanandHall/CRC
3. ChenG,ZhongH,Belousov A,DevanarayanV(2015)APRIMapproachtopredictive-signaturedevelopmentforpatientstratification.StatMed34:317–342.doi:10.1002/sim.6343
4. SuX,TsaiC-L,WangH,etal.(2009)SubgroupAnalysisviaRecursivePartitioning.JMachLearnRes10:141–158.
5. Lipkovich I,Dmitrienko A(2014)StrategiesforidentifyingpredictivebiomarkersandsubgroupswithenhancedtreatmenteffectinclinicaltrialsusingSIDES.JBiopharm Stat24:130–153.doi:10.1080/10543406.2013.856024
6. BergerJO,WangX,ShenL(2014)ABayesianapproachtosubgroupidentification.JBiopharm Stat24:110–129.doi:10.1080/10543406.2013.856026
7. DevanarayanV,CumminsD,Tanzer L,MooreR.(1999)ApplicationofGAMandtreemodelsforassessingtheroleofdrugresistanceproteinsinleukemiachemotherapy,JointStatisticalMeetings,8/1/1999.
8. TianL,TibshiraniR(2011)Adaptiveindexmodelsformarker-basedriskstratification.Biostatistics12:68–86.doi:10.1093/biostatistics/kxq047
9. TianL,Alizadeh A,GentlesA,TibshiraniR(2012)ASimpleMethodforDetectingInteractionsbetweenaTreatmentandaLargeNumberofCovariates.arXiv
10. TibshiraniR,Efron B(2002)Pre-validationandinferenceinmicroarrays.StatAppl GenetMol Biol.doi:10.2202/1544-6115.1000
11. FosterJC,TaylorJM,RubergSJ(2011)Subgroupidentificationfromrandomizedclinicaltrialdata.StatMed.30(24)2867-80
12. HuangX,SunY,TrowP,Chakravartty A,TianL,DevanarayanV(2017),Biomarkersignaturesforpatientsubgroupselectioninclinicaldrugdevelopment,StatisticsinMedicine.
13. McKeeganEM,AnsellPJ,DavisG,ChanS,Chandran RK,Gawell SH,DowellBL,BhathenaA,Chakravarty A,McKeeM,RickerJ,CarlsonD,Ramalingam SS,DevanarayanV(2015)Plasmabiomarkersignatureassociatedwithimprovedsurvivalinadvancednon-smallcelllungcancerpatientsonlinifanib ,LungCancer90(2015)296-301.
References
33 EVERY STEP OF THE WAY