Embed Size (px)
Citation preview

Renegotiating NAFTA and
U.S. Textile Manufacturing
Michaela D. Platzer
Specialist in Industrial Organization and Business
October 30, 2017
Congressional Research Service
7-5700
www.crs.gov
R44998

Renegotiating NAFTA and U.S. Textile Manufacturing
Congressional Research Service
Summary When the North American Free Trade Agreement (NAFTA) was negotiated more than two
decades ago, textiles and apparel were among the industrial sectors most sensitive to the
agreement’s terms. NAFTA, which was implemented on January 1, 1994, has encouraged the
integration of textile and apparel production in the United States, Canada, and Mexico. For
example, under NAFTA’s “yarn-forward” rule of origin, textiles and apparel benefit from tariff-
free treatment in all three countries if the production of yarn, fabric, and apparel, with some
exceptions, is done within North America.
The United States maintains a bilateral trade surplus in yarns and fabrics with its NAFTA
partners. In 2016, the United States had a $4.1 billion surplus in yarns and fabrics and a positive
balance of around $720 million in made-up textile products (such as home textiles and
furnishings) with Canada and Mexico. U.S. exports of yarns and fabrics shipped to Mexico and
Canada were valued at close to $6 billion last year. In apparel, the United States had a trade
surplus with Canada of $1.4 billion and a trade deficit with Mexico of $2.7 billion in 2016.
On May 18, 2017, the Trump Administration notified Congress of its intent to renegotiate the
agreement. In July 2017, the Administration announced specific goals for textiles and apparel
among its renegotiating objectives, which include improving competitive opportunities for U.S.
textile and apparel products, but also taking into account U.S. import sensitivities. Also germane
to textiles and apparel are several other renegotiating objectives, such as enhancing customs
enforcement to prevent unlawful transshipment of these goods from outside the region and
ensuring that requirements for use of domestic textiles and apparel in U.S. government purchases
primarily benefit producers located in the United States.
NAFTA renegotiation started in August 2017. There is widespread support for continuation of the
agreement among U.S. textile and apparel producers, although there are significant differences of
opinion with respect to certain provisions. In particular, U.S. textile manufacturers generally
favor eliminating all exceptions to NAFTA’s yarn-forward rule, whereas U.S. retailers and apparel
groups oppose tightening the rule.
If the United States were to exit NAFTA, imports of textiles from Mexico and Canada would face
U.S. tariffs as high as 20%, and imports of apparel would have tariff rates of up to 32%. U.S.
exports of textiles and apparel could face higher tariff rates entering Canada and Mexico. One
possibility is that U.S. withdrawal from NAFTA could lead U.S. retailers and apparel brands to
source more of their goods from Asia, which could reduce demand for U.S.-made yarns and
fabrics within the NAFTA region.

Renegotiating NAFTA and U.S. Textile Manufacturing
Congressional Research Service
Contents
Introduction ..................................................................................................................................... 1
Textile Industry Inputs and Markets ................................................................................................ 1
Textile Manufacturing Inputs .................................................................................................... 2 End-Use Markets for U.S.-Made Textiles ................................................................................. 2
Apparel Manufacturing ....................................................................................................... 2 Home Textiles and Floor Coverings ................................................................................... 3 Technical Textiles ............................................................................................................... 3
Domestic Textile and Apparel Production and Employment........................................................... 5
Textile Production and Employment ......................................................................................... 5 Apparel Production and Employment ....................................................................................... 7
U.S. Textile and Apparel Trade ....................................................................................................... 8
U.S. Trade in Textile Products................................................................................................... 8 U.S. Trade in Apparel Products ................................................................................................. 9 Textile and Apparel Trade in the Western Hemisphere ........................................................... 10
Canada and Mexico........................................................................................................... 10 Central America and the Caribbean ................................................................................... 11
Competition from China and Vietnam ..................................................................................... 11 Possible Effects of Potential Trade Agreement Modifications ................................................ 13
NAFTA Provisions Affecting Textiles and Apparel ....................................................................... 13
Rules of Origin ........................................................................................................................ 13 Exceptions to Rules-of-Origin Requirements ......................................................................... 14
Tariff Preference Levels .................................................................................................... 14 Other NAFTA Exemptions ................................................................................................ 15 Short Supply Process ........................................................................................................ 15
Other Provisions ...................................................................................................................... 16 Customs Enforcement and Trade Facilitation ......................................................................... 16
Conclusion ..................................................................................................................................... 16
Figures
Figure 1. Major Products of the Fiber, Textile, and Apparel Industries .......................................... 5
Figure 2. Textile and Apparel Manufacturing Employment ............................................................ 7
Figure 3. U.S. Apparel Imports, Selected Countries ..................................................................... 12
Figure 4. Major Production Steps for the Textile and Apparel Sector ........................................... 13
Tables
Table 1. U.S. Exports of Textiles to the World ................................................................................ 8
Table 2. U.S. Yarn and Fabric Exports, by Countries or Region ..................................................... 9

Renegotiating NAFTA and U.S. Textile Manufacturing
Congressional Research Service
Appendixes
Appendix A. Textile Industry Overview ........................................................................................ 18
Appendix B. Top 10 States in Textile Employment ...................................................................... 19
Appendix C. Selected Apparel and Textile Duties ........................................................................ 20
Appendix D. Selected Textile and Apparel Industry Comments on NAFTA Negotiating
Objectives ................................................................................................................................... 22
Contacts
Author Contact Information .......................................................................................................... 23

Renegotiating NAFTA and U.S. Textile Manufacturing
Congressional Research Service 1
Introduction On May 18, 2017, the Office of the U.S. Trade Representative (USTR) formally notified
Congress of the Trump Administration’s intent to renegotiate the North American Free Trade
Agreement (NAFTA). As during the original NAFTA negotiations in the early 1990s among the
United States, Canada, and Mexico, textile and apparel trade is once again likely to attract
considerable congressional attention and debate.1
NAFTA, which took effect nearly a quarter-century ago, lowered or removed many barriers to
goods trade within North America.2 Prior to NAFTA, 65% of U.S. apparel imports from Mexico
entered duty-free, and the remaining 35% faced an average tariff rate of 17.9%. Mexico’s average
tariff on U.S. textile and apparel products was 16%, with duties as high as 20% on some
products.3 Over the 10-year period after NAFTA entered into force, all tariffs on textile and
apparel produced and traded within North America were fully eliminated, spurring more
integrated textile and apparel production in the region.4 Many specific provisions affecting textile
and apparel trade appear in NAFTA’s Annex 300-B.5
The Trump Administration has stated that its objectives for renegotiation of NAFTA include
maintaining duty-free access to the Mexican and Canadian markets for U.S. textile and apparel
products and improving competitive opportunities for U.S. textiles and apparel, while taking into
account U.S. import sensitivities.6 The Administration has also proposed changes in other areas of
the agreement, such as customs enforcement and rules for determining a good’s origin, which
may be significant for the textile and apparel industries. U.S. textile producers and the domestic
retail and apparel sectors have asked that the Trump Administration strive to “do no harm” in the
renegotiation and avoid any disruption to trade and investment linkages encouraged by NAFTA.
Formal talks with Canada and Mexico began in August 2017. If a new NAFTA deal is reached, it
would be subject to ratification by the legislatures of all three countries. Another possibility is
that President Trump may decide to withdraw from NAFTA, which the United States can do with
six months’ notice to the other parties.7
Textile Industry Inputs and Markets The textile industry is one of the oldest manufacturing industries in the United States. Since
NAFTA took effect more than two decades ago, there have been substantial changes in the U.S.
textile industry—perhaps most notably, it has become highly automated and capital-intensive. In
1 The NAFTA Implementation Act (P.L. 103-182) was signed into law on December 8, 1993, and entered into force on
January 1, 1994. 2 In this report, North America is defined as the United States, Canada, and Mexico (i.e., the NAFTA countries). 3 CRS Report R42965, The North American Free Trade Agreement (NAFTA), by M. Angeles Villarreal and Ian F.
Fergusson. 4 To qualify for preferential tariff rates under NAFTA, U.S. importers must claim and document that the shipments
meet the rules of origin in the agreement. 5 The complete NAFTA text, including Annex 300-B rules such as tariff elimination and rules of origin for textile and
apparel products, can be accessed at http://tcc.export.gov/Trade_Agreements/All_Trade_Agreements/
NorthAmericanFreeTA.asp. 6 USTR, Summary of Objectives for the NAFTA Renegotiation, July 17, 2017, pp. 4 and 6, https://ustr.gov/sites/default/
files/files/Press/Releases/NAFTAObjectives.pdf. 7 CRS Report R44630, U.S. Withdrawal from Free Trade Agreements: Frequently Asked Legal Questions, by Brandon
J. Murrill.

Renegotiating NAFTA and U.S. Textile Manufacturing
Congressional Research Service 2
addition, textile businesses have arranged their North American production around the
agreement’s terms.
Textile Manufacturing Inputs
U.S. textile manufacturers, generating $18.3 billion in value added in 2016, make yarns and
fabrics from raw materials such as cotton and various man-made fibers.8 The United States is a
significant producer of cotton, the most common natural fiber.9 Consumption of cotton by U.S.
textile mills peaked in 1997.10 Since then, U.S. mill use of cotton has dropped about 70% due to
the decrease in domestic textile production caused by competition from imported textile and
apparel products.11 In 2016, Mexico was the 5th-largest U.S. export market for U.S. raw cotton,
accounting for about 9% of total U.S. cotton exports, and Canada was 35th.12 Neither Canada nor
Mexico is a significant producer of other natural fibers, such as jute, flax, or sisal.
The United States accounted for about 4% of global production of man-made fibers in 2016.
Since 2000, most of the global growth in man-made textile manufacturing has taken place in
China, which by 2016 accounted for two-thirds of total worldwide production, principally
polyester, which is substitutable for cotton fiber.13 Other important producers of man-made fibers
are India, Taiwan, Indonesia, South Korea, Turkey, and Japan.14
End-Use Markets for U.S.-Made Textiles
The U.S. textile industry is a supplier industry to three main industrial end-use sectors: apparel,
home textiles and floor coverings, and technical textiles consumed in manufactured industrial
production. Each faces different market conditions.
Apparel Manufacturing
Prior to the implementation of NAFTA, the domestic apparel industry consumed about a quarter
of U.S.-manufactured fibers.15 By 2015, roughly 9% of U.S. manufactured fibers went to
domestic apparel use.16 The United States’ share of global apparel exports has fallen to 1.3% in
2015 from 4.4% in 2000, according to the World Trade Organization (WTO).17
8 U.S. Bureau of Economic Analysis (BEA), Gross Domestic Product by Industry, http://www.bea.gov/industry/
gdpbyind_data.htm. 9 Of global total fiber production in 2016, according to Fiber Year 2017, cotton represented about 23% and wool 1%. 10 Daryll E. Ray and Harwood D. Schaffer, Most U.S. Cotton Production Traditionally Went to Domestic Mills, Now It
Goes Abroad, Agricultural Policy Analysis Center, University of Tennessee, Knoxville, September 27, 2013,
http://agpolicy.org/weekcol/687.html. 11 James Johnson, Stephen MacDonald, and Leslie Meyer, et al., The World and United States Cotton Outlook, U.S.
Department of Agriculture (USDA), February 24, 2017, pp. 7-10, https://www.usda.gov/oce/forum/past_speeches/
2017/2017_Speeches/Cotton_Outlook_2017.pdf. 12 Raw cotton export figures from USDA’s Global Agricultural Trade System (GATS), August 11, 2017,
https://apps.fas.usda.gov/gats/default.aspx. 13 In 2000, China accounted for roughly a fifth of the world’s man-made fiber production. 14 Andreas Englehardt, Fiber Year 2017, World Survey on Textiles and Nonwovens, May 2017, Table 9.13, Production
of Manmade Fibers by Major Country, p. 191. 15 U.S. Census Bureau, Statistical Abstract of the United States: 1996, October 1996, Table 1229, p. 749,
https://www2.census.gov/library/publications/1996/compendia/statab/116ed/tables/manufact.pdf. 16 “End Use Survey, 2011-2015,” Fiber Organon, vol. 86, no. 10 (October 2016), Table 2, p. 188. End-use products are
those textile products ready for use or application, whether apparel, interior furnishings, or for use in industry or
(continued...)

Renegotiating NAFTA and U.S. Textile Manufacturing
Congressional Research Service 3
According to the American Apparel & Footwear Association, an industry group, 98% of all
apparel purchased by U.S. consumers is produced outside the United States.18 Mexico, the leading
source of U.S. apparel imports in the late 1990s and early 2000s, slid to sixth place in 2016,
behind China, Vietnam, Bangladesh, Indonesia, and India.19 Apparel imports from Canada
comprised less than 1% of all U.S. apparel imports in 2016.
Another way the apparel industry has changed since 1994 is that although many of the world’s
largest apparel retailing and marketing firms are headquartered in the United States, they now
frequently manufacture through a combination of facilities they own and third-party arrangements
in low-cost regions of the world. U.S.-headquartered apparel firms commonly contract directly
with apparel sourcing companies, which in turn portion out the production work to independent
manufacturers. NAFTA rules have encouraged the sourcing of apparel from Mexican plants that
use U.S.-made yarn and fabric rather than from Asian plants that use little or no U.S. content.
Home Textiles and Floor Coverings
About 40% of domestic textile output went into home textiles, furnishings, and floor coverings (a
category known as “made-up textiles”) in 2015. U.S. manufacturers of these products have fared
far better against import competition than apparel manufacturers.20 This is mainly because
manufacturing of carpets, curtains, and tablecloths is highly automated and labor costs are
relatively unimportant. For example, the development of larger, faster carpet-tufting machines
contributed to a decline in employment at U.S. carpet and rug mills from 47,800 workers in 2006
to 31,600 in 2016.21 The health of the carpet and rug mill industry is tied in large part to
conditions in domestic housing and commercial building construction, raw material prices, and
competition from foreign producers.22 Canada and Mexico are the top two export markets for the
United States’ made-up textiles.23
Technical Textiles
Technical textiles,24 which are used across various industrial sectors from agriculture,
construction and medical use to transportation, accounted for about half of U.S. textile output in
(...continued)
specialty goods. 17 World Trade Organization (WTO), International Trade Statistics, 2015, updated August 11, 2017, http://stat.wto.org/
Home/WSDBHome.aspx?Language=E. 18 Letter from Stephen Lamar, Executive Vice President, to Ed Gresser, Chair of the Trade Policy Staff Committee,
USTR, July 31, 2017, https://www.aafaglobal.org/AAFA/AAFA_News/2017_Letters_and_Comments/
AAFA_Comments_to_Administration_on_Trade_Agreements. 19 CRS analysis of trade data from U.S. Department of Commerce, Office of Textiles and Apparel (OTEXA),
http://otexa.trade.gov/msrpoint.htm. 20 “End Use Survey, 2011-2015,” Fiber Organon, vol. 86, no. 10 (October 2016), Table 2, p. 188. 21 Bureau of Labor Statistics (BLS), Quarterly Census of Employment and Wages (QCEW), Carpet and Rug Mills
(NAICS 31411), accessed August 4, 2017, http://www.bls.gov/cew/. 22 Jonathan DeCarlo, “Carpet Mills in the US—Rug Burn: U.S. Dollar Depreciation Will Make Exports More
Affordable, Benefiting the Industry,” IBISWorld Industry Report, May 2017, pp. 7-11. 23 OTEXA data show that calculated together they accounted for 63% of total U.S. exports of made-up textile articles
in 2016. 24 Technical textiles may be defined as textile materials and products manufactured primarily for their technical or
performance properties rather than their aesthetic or decorative characteristics; some also use the term industrial textiles
to mean textile products not intended for apparel and household and furnishing end-uses. See INDA’s (Association of
the Nonwoven Fabrics Industry) nonwovens glossary for a definition of technical textiles, which can be found at
(continued...)

Renegotiating NAFTA and U.S. Textile Manufacturing
Congressional Research Service 4
2015.25 Technical textiles are reportedly the fastest-growing segment of the textile industry
worldwide.26 IBISWorld, a market research firm, estimates the U.S. domestic market for
industrial textiles at $22 billion in 2017.27 Industry observers say the United States is a leader in
the production of technical textiles chiefly because these high value-added products require
advanced manufacturing processes and significant research and development, limiting import
competition from low-wage countries.28
According to the U.S. Department of Commerce, Mexico is the largest market for U.S. technical
textiles, especially for use in Mexico’s large automotive sector, followed by Canada.29 Canada
also ranks as a top market for U.S.-made industrial protective apparel, with end-user industries
such as oil and gas, construction, manufacturing, and mining.30 Canada and Mexico are the first-
and second-largest markets, respectively, for U.S. exports of medical textiles.31
Because the automotive industry is a large user of technical textiles, domestic producers could be
affected by proposed changes to NAFTA’s domestic content requirements for motor vehicle
products.32 According to one estimate, automotive manufacturers in the United States used about
330 million square yards of fabric in 2015 for headliners, fabric seats, airbags, seat belts, door
panels, engine filters, and trunk liners.33 One change in NAFTA proposed by the United States
would require motor vehicles to have 85% North American content and 50% U.S. content to
qualify for tariff-free treatment. If auto manufacturers were to import more passenger cars from
outside the NAFTA region and pay the 2.5% U.S. import duty rather than complying with stricter
domestic content requirements, automotive demand for U.S.-made technical textiles could be
adversely affected.
(...continued)
http://www.inda.org/wp-content/uploads/2015/04/glossaryfc.pdf. 25 “End Use Survey, 2011-2015,” Fiber Organon, vol. 86, no. 10 (October 2016), Table 2, p. 188. 26 Grace I. Kunz, Elena Karpova, and Myrna B. Garner, “Asia and Oceania,” in Going Global: The Textile and Apparel
Industry (Fairchild Books, 2016), pp. 368-369. 27 Jonathan DeCarlo, “Textile Mills in the US—Loose Threads: Demand for Technical and Home Furnishing Textiles
Will Aid Growth,” IBISWorld Industry Report, January 2017, pp. 16-17. 28 Ibid, p. 16. 29 U.S. Department of Commerce, International Trade Administration (ITA), 2016 Top Markets Report Technical
Textiles: Country Case Studies for Canada and Mexico, 2016, http://www.trade.gov/topmarkets/textiles.asp. 30 Technical textiles include fabrics used in personal protection equipment such as bulletproof jackets, fire retardant
clothing, and industrial gloves. 31 ITA, 2016 Top Markets Report Technical Textiles: Country Case Studies for Canada and Mexico, 2016. 32 See CRS Report R44907, NAFTA and Motor Vehicle Trade, by Bill Canis, M. Angeles Villarreal, and Vivian C.
Jones. 33 According to Textile World, 28 square yards of textiles, including woven, nonwoven, and knit fabrics, are used in an
average vehicle. In 2016, the United States produced 11.9 million light vehicles, according to data from Automotive
News. See Stephen Warner, “2016 State of the U.S. Textiles Industry,” Part 1, Textile World, April 4, 2016.

Renegotiating NAFTA and U.S. Textile Manufacturing
Congressional Research Service 5
The Textile Manufacturing Process
Textile manufacturing begins with fiber, which can be harvested from natural resources (e.g., cotton, wool, silk, or
ramie), manufactured from cellulosic materials (e.g., rayon or acetate), or made of man-made synthetic materials (e.g.,
polyester, nylon, or acrylic). After the raw fibers are shipped from the farm or the chemical plant, they pass through
four main stages of processing (see Figure 1):
yarn production, in which fiber is spun into filament or yarn;
fabric production, in which filaments and yarns are made into textile fabrics, primarily by weaving or knitting;
finishing, which prepares the textiles for further use by processes such as bleaching, printing, dyeing, and
mechanical or wet finishing; and
fabrication, where the finished cloth is converted into apparel, household textiles, or industrial products.
Figure 1. Major Products of the Fiber, Textile, and Apparel Industries
Source: U.S. International Trade Commission (USITC), Textiles and Apparel: Assessment of the Competitiveness of
Certain Foreign Suppliers to the U.S. Market, Volume 1, Investigation No. 332-448, Publication 3671, Figure 1-1,
January 2004.
Domestic Textile and Apparel Production and
Employment NAFTA has been criticized for causing a loss of production and employment in U.S.
manufacturing. The effects of NAFTA with respect to textiles and apparel, however, are not
straightforward, and the drop in domestic textile and apparel production and jobs cannot be
blamed solely on the agreement. Making it difficult to isolate the impact of NAFTA are the many
other factors that have contributed to the shrinking size of the domestic textile and apparel sectors
over the past quarter-century, among them automation, industry consolidation, currency
fluctuations, and economic growth.
Textile Production and Employment
The textile industry has been less prone to relocation to lower-wage countries than apparel
manufacturing because yarn and fabric production is capital- and scale-intensive, demanding
higher worker skills than apparel production; as discussed below, apparel production tends to be

Renegotiating NAFTA and U.S. Textile Manufacturing
Congressional Research Service 6
low-tech and labor-intensive. Nonetheless, since 1994, textile manufacturers have shed about
500,000 jobs, with direct employment dropping to around 230,000 in 2016 (as shown in Figure
2).34 The Bureau of Labor Statistics predicts the overall employee count in textile manufacturing
will shrink to about 185,000 by 2026.35
Output by U.S. textile mills, which transform fibers such as cotton, wool, and polyesters into
products such as yarn, fabric, and thread, reached an all-time peak in December 1997, nearly four
years after NAFTA took effect. It began to trend down in 2000: by the end of 2007, production
was 39% lower than at its peak a decade earlier. At the end of 2016, the output of U.S. textile
mills was 29% less than in 2007 and about 60% less than in 1997.36 The number of textile mills
has fallen by half since 1997. The number of employees has declined by three-quarters over the
same period as the surviving mills have invested heavily in technology to reduce operating
costs.37 However, significant textile production remains in the United States. Textile production
requires sizable capital investment; weaving mills can cost an estimated $12 million to $25
million and spinning mills $50 million to $70 million.38 Among all U.S. manufacturing industries,
textiles rank near the top in productivity increases, which can be attributed both to automation
and to the closure of less efficient mills.
Similar trends are seen in the textile product mills segment of the industry. These firms
manufacture home textiles and floor coverings, as well as other textiles for industrial uses from
purchased yarn, fabric, and thread. Output at textile product mills began to sink in 2001; by 2016,
production was 34% less than a decade earlier. According to the U.S. Census Bureau, the number
of textile product mills operating in the United States fell 10% over the decade 2005 to 2015.39
The number of jobs in the textile product mill segment dropped from a high of 242,900 in 1994 to
about 115,000 in 2016.40 Only 4% of U.S. textile product mills employ 100 or more workers.41
The U.S. International Trade Commission (USITC) concluded that imports of textiles had a tiny
effect on U.S. textile industry employment (a 0.4% decline) from 1998 to 2014, which covers
most of the period since NAFTA’s enactment.42 However, the collapse of the domestic apparel
industry and changing clothing tastes may have had a more significant impact on domestic textile
production.43
34 National and state employment statistics are from BLS’s Quarterly Census of Employment and Wages (QCEW). 35 Employment projections are from BLS’s Employment Projections Program (EPP), Employment and Output by
Industry, 2006, 2016, and projected 2026, Table 2.7, October 24, 2017. 36 Federal Reserve Board, Release G. 17, Industrial Production and Capacity Utilization, for NAICS 313 (textiles),
accessed August 15, 2017. 37 Only 13% of U.S. textile mills employed 100 workers or more in 2015. U.S. Census Bureau, County Business
Patterns by Employment Size Class, 2015. 38 Jonathan DeCarlo, Textile Mills in the U.S., IBISWorld, January 2017, p. 5. 39 U.S. Census Bureau, County Business Patterns for NAICS 314 (textile product mills), accessed October 2, 2017. 40 U.S. Bureau of Labor Statistics, Current Employment Survey Statistics (NACIS 314), accessed October 2, 2017. 41 U.S. Census Bureau, County Business Patterns by Employment Size Class, 2015. 42 United States International Trade Commission (USITC), Economic Impact of Trade Agreements Implemented Under
Trade Authorities Procedures, 2016 Report, 332-555, June 2016, pp. 149-151, https://www.usitc.gov/publications/332/
pub4614.pdf. 43 James Bessen, Automation and Jobs: When Technology Boosts Employment, Boston University School of Law, Law
& Economics Paper No. 17-09, April 12, 2017, pp. 28-29, http://www.bu.edu/law/faculty-scholarship/working-paper-
series/.

Renegotiating NAFTA and U.S. Textile Manufacturing
Congressional Research Service 7
Domestic production of textiles and textile products is primarily located in the southeastern states
and in California, although every state has some textile manufacturing. In 2016, more than one-
third of all textile jobs were located in Georgia and North Carolina. Appendix B compares textile
employment in the top 10 states, which accounted for more than two-thirds of all textile jobs, in
1994 and 2016.
Figure 2. Textile and Apparel Manufacturing Employment
Source: Bureau of Labor Statistics, Quarterly Census of Employment and Wages for North American Industry
Classification System (NAICS) 313 and 314 (textiles) and NAICS 315 (apparel).
Apparel Production and Employment
Apparel production and the number of companies in the sector have fallen off in recent decades.
In 2016, apparel manufacturers directly employed about 128,800 workers—roughly 830,000
fewer than in 1990 (see Figure 2).44 In 2015, there were around 7,000 domestic apparel
manufacturers, compared to more than 11,100 in 2005.45 Industry output declined by about 85%
between 1997 and 2016. In September 2017, the sector’s output reached an all-time low, with
apparel production down 11% since the start of 2017.46
Apparel brands, retailers, importers, and wholesalers based in the United States are highly
dependent on global supply chains, with suppliers making sourcing choices based on factors such
as price, speed, and flexibility. In the United States, apparel production has dwindled because
many manufacturers no longer physically sew U.S.-produced apparel and other fashion products
that directly compete with low-value imports, especially low-cost “fast-fashion” garments.
Apparel production in the United States is largely focused on high-quality niche products and the
military market, which is statutorily required to purchase U.S.-produced garments and textiles.47
As a result of more and more apparel production moving to lower-wage countries, including
44 BLS QCEW program, accessed August 15, 2016, http://www.bls.gov/cew/. 45 U.S. Census Bureau, County Business Patterns for NAICS 315 (apparel), accessed October 2, 2017. 46 Federal Reserve Board, Release G. 17, Industrial Production and Capacity Utilization, for NAICS 315 (apparel),
accessed October 25, 2017. 47 The Berry Amendment, codified at 10 U.S.C. §2533a, is the main statute for U.S. military purchases of certain items,
which currently cover textiles, apparel, food and hand or measuring tools.

Renegotiating NAFTA and U.S. Textile Manufacturing
Congressional Research Service 8
Mexico, apparel manufacturing employment in the United States has shrunk every year since
1990. NAFTA likely accounts for the loss of some of these jobs, but there is little evidence that
NAFTA was the decisive factor, given that the major growth in apparel manufacturing for the
U.S. market has occurred in Asian countries that receive no preferences under NAFTA.
According to a study by researchers at Duke University, the U.S. apparel industry has retained the
more skilled, higher-paying jobs such as those involving the design, branding, and marketing of
products, with lower-skilled apparel production having moved offshore.48 Because of the
difficulty in automating most sewing functions, assembly of garments remains largely labor
intensive, but that could change if robotic sewing machines eventually automate some apparel
assembly.49
U.S. Textile and Apparel Trade
U.S. Trade in Textile Products
Overall, the United States has a strong export position in yarns and fabrics, with global export
shipments of $12.9 billion in 2016 (see Table 1). For two decades, the United States has posted a
modest trade surplus in these products. The U.S. trade surplus in textiles in 2016 came to $1.6
billion. When made-up textile articles are included, the United States ran a textile trade deficit of
$18.8 billion in 2016.50 Import penetration—the share of U.S. demand met by textile imports—
reached roughly 40% in 2016, up from 35.5% in 2010 (see Appendix A).
Table 1. U.S. Exports of Textiles to the World
(in millions of U.S. dollars, by selected years)
Fabric Yarn
Made-Up
Articlesa
Textile Mill
Products
Total
Fabric and
Yarn Total
1990 $2,903 $2,141 $1,232 $6,276 $5,044
1995 $4,770 $2,818 $1,727 $9,315 $7,588
2000 $7,420 $3,030 $2,258 $12,708 $10,450
2005 $8,810 $3,157 $2,586 $14,553 $11,967
2010 $7,637 $4,316 $3,152 $15,105 $11,953
2016 $8,563 $4,347 $3,572 $16,482 $12,910
Source: U.S. Department of Commerce, Office of Textiles and Apparel Trade (OTEXA), Export Market Report,
accessed August 7, 2017.
a. Made-up articles include home furnishings and other consumer goods such as towels, tablecloths, and
bedsheets.
48 Karina Fernandez-Stark, Stackey Frederick, and Gary Gereffi, The Apparel Global Value Chain: Economic
Upgrading and Workforce Development, Duke Center on Globalization, Governance & Competitiveness, November
2011, p. 11, http://www.cggc.duke.edu/pdfs/2011-11-11_CGGC_Apparel-Global-Value-Chain.pdf. 49 See “Sewbots to Move Deeper into Activewear and Beyond,” Innovation in Textiles, August 17, 2017, and Kelly
McSweeney, “Made in the USA—by Robots,” ZDNet, July 28, 2017. 50 OTEXA, Textile and Apparel Trade Balance Report, accessed September 6, 2017, http://otexa.trade.gov/tbrexp.htm.

Renegotiating NAFTA and U.S. Textile Manufacturing
Congressional Research Service 9
Table 2 shows that the United States exported nearly $6 billion in yarns and fabrics to its NAFTA
partners in 2016, with U.S. export shipments of $4.3 billion to Canada and $1.6 billion to
Mexico. NAFTA partners account for nearly half (46%) of U.S. yarn and fabric exports. Last
year, the United States registered a bilateral trade surplus in yarns and fabrics with both NAFTA
partners of $4.1 billion and a surplus of more than $720 million in made-up textile products.
Although U.S. textile products can be more expensive than those from other countries, apparel
producers in Canada and Mexico use U.S.-made textiles in products that are exported to the
United States because the goods may enter the United States free of tariffs.
In addition, in 2016 about $2.4 billion of U.S.-made yarns and fabrics was exported to the
Dominican Republic-Central America Free Trade Agreement (CAFTA-DR) region and $46
million was imported from the region, resulting in a $2.3 billion trade surplus.51 A tiny amount of
U.S. yarns and fabrics ($52 million in 2016) was exported from the United States to the
Caribbean Basin Initiative (CBI) countries, representing less than 1% of total U.S. yarn and fabric
exports last year. By comparison, the United States exported almost a fifth of its textiles outside
the Western Hemisphere last year, to the 28-member European Union and China.
Table 2. U.S. Yarn and Fabric Exports, by Countries or Region
(in millions of U.S. dollars, by selected years)
1994
1994 %
Share 2000
2000 %
Share 2016
2016 %
Share
World $6,491 — $10,450 — $12,910 —
NAFTA $2,577 40% $6,005 57% $5,969 46%
CAFTA-DRa $349 5% $760 7% $2,383 18%
EU-28 $1,291 20% $1,477 14% $1,494 12%
China $140 2% $209 2% $750 6%
CBIb $53 1% $64 1% $52 0.4%
Source: U.S. Department of Commerce, Office of Textiles and Apparel, accessed August 14, 2017.
a. CAFTA-DR countries include Costa Rica, the Dominican Republic, El Salvador, Guatemala, Honduras, and
Nicaragua.
b. Caribbean Basin Initiative (CBI) countries include Antigua and Barbuda, Aruba, Bahamas, Barbados, Belize,
British Virgin Islands, Dominica, Grenada, Guyana, Haiti, Jamaica, Montserrat, Netherlands Antilles, St. Kitts
and Nevis, St. Lucia, St. Vincent and the Grenadines, and Trinidad and Tobago.
U.S. Trade in Apparel Products
In the apparel sector, import penetration reached more than 90% of U.S. demand in 2016 (see
Appendix A), when the U.S. trade deficit in apparel products was $77.5 billion.52 Whereas
Mexico accounted for about 4% of imported apparel for the U.S. market in 2016, about 35% of
imported apparel came from China. Vietnam, a fast-growing source of apparel for the U.S.
51 The Dominican Republic-Central America Free Trade Agreement (CAFTA-DR; P.L. 109-53) was signed in 2004,
first with five Central American countries (Costa Rica, El Salvador, Guatemala, Honduras, and Nicaragua) and then
with the Dominican Republic. The United States is also a member. CAFTA-DR was implemented on a rolling basis
between 2006 and 2009 as countries made sufficient progress to complete their commitments under the agreement. 52 OTEXA, Textile and Apparel Trade Balance Report, accessed August 15, 2017, http://otexa.ita.doc.gov/tbrbal.htm.

Renegotiating NAFTA and U.S. Textile Manufacturing
Congressional Research Service 10
market, furnished 13% of imports. The United States had a trade surplus in apparel products with
Canada of $1.4 billion and a trade deficit with Mexico of $2.7 billion last year.
Mexico’s apparel exports to the United States grew rapidly following the signing of NAFTA in
1994 and extended through 2000. By then, Mexico was the largest source of apparel imports into
the U.S. market, reaching a market share of 14.4%. Mexico benefited from quota-free access to
the U.S. market, which gave its apparel an advantage over other products from other countries,
which were subject to U.S. quotas on many textile and apparel imports through 2004. The quota
system made it necessary for buyers of textile and apparel products to source from countries for
which quotas for particular products were available. Once other countries were no longer
constrained by textile and apparel quotas, however, Mexican apparel exports to the United States
began to shrink.
The elimination of almost all textile and apparel quotas did not eliminate import tariffs. Tariffs on
textile and apparel imports vary considerably, but major textile- and apparel-producing countries
face average U.S. tariff rates of 7.9% for textiles and 11.6% for clothing. Rates on particular
products may be as high as 32% (see Appendix C).53 However, its exemption from these tariffs
under NAFTA has not been sufficient to maintain the level of Mexican apparel exports to the
United States, as Mexico’s apparel industry has an unfavorable cost structure compared to the
leading Asian apparel-exporting countries.
Textile and Apparel Trade in the Western Hemisphere
Since NAFTA was implemented, producers in North America, particularly Mexico, have had to
adjust to intensifying global competition. Some of this competition comes from other textile and
apparel producers in the Western Hemisphere, an influence largely bolstered by the CAFTA-DR
yarn-forward rule of origin. Still, the most significant competitive challenge for textile and
apparel production in North America has come from outside the region, specifically China and
Vietnam. Although neither country has a preferential trading relationship with the United States,
they have become the leading sources of lower-cost apparel for U.S. importers and retailers.
Canada and Mexico
Within the NAFTA supply chain, the United States typically exports textiles to Mexico or
Canada, which turn U.S.-made yarns and fabrics into apparel, home furnishings, or other
industrial textiles for sale in the U.S. market. Canada and Mexico have more limited textile and
apparel trade with one another, although some Canadian apparel producers have turned to Mexico
for lower-wage assembly operations.
Canadian producers of textiles tend to focus on higher-value-added products, often technical
textiles for the aerospace, construction, medical, agricultural, and defense industries.54 Canadian
clothing companies compete directly with U.S.-owned apparel brands in designing and producing
high-end attire and specialty garments.55 Canada ships about 90% of its garments to the United
States.56
53 WTO, World Tariff Profiles 2016, p. 175. 54 International Trade Administration, 2016 Top Markets Report: Technical Textiles, Canada, May 2016, p. 1,
http://www.trade.gov/topmarkets/pdf/Textiles_Canada.pdf. 55 Industry Canada, Canadian Apparel Industry Profile, https://www.ic.gc.ca/eic/site/026.nsf/eng/h_00070.html. 56 Grace I. Kunz, Elena Karpova, and Myrna B. Garner, “The Americas and the Caribbean Basin,” in Going Global:
The Textile and Apparel Industry (Fairchild Books, 2016), p. 326.

Renegotiating NAFTA and U.S. Textile Manufacturing
Congressional Research Service 11
Similar to Canada, Mexico’s apparel industry relies almost entirely on the U.S. market for
exports. Its cut and assembly operations often use U.S.-made fabrics to produce basic items such
as denim jeans and T-shirts, which are then exported to the United States. For example,
manufacturers of cotton T-shirts or cotton twill trousers in Mexico can avoid a 16.5% import duty
if U.S. inputs are used.57
Geographic proximity to the United States gives Mexican apparel
producers an advantage over Asian producers, allowing quick replenishment of items for which
time is a critical factor. Mexico’s focus on basic apparel items suggests that U.S. importers could
quickly source from elsewhere if duty savings under NAFTA are eliminated. But even now, some
U.S. fashion companies say the duty savings are not worth the time and resources required to
comply with the NAFTA rules of origin and documentation requirements.58 In 2016, roughly 16%
of qualifying textile and apparel imports from NAFTA failed to take advantage of the duty-free
benefits and instead paid applicable tariffs.59
Central America and the Caribbean
Central America and the Caribbean is another source of regional competition for NAFTA-based
textile and apparel producers. The CAFTA-DR region and the Caribbean have limited textile
production—virtually all fibers are imported yielding export opportunities for U.S. yarn and
fabric producers—but ample to cut fabric and make apparel. CAFTA-DR includes provisions
structured much like NAFTA’s, with a few important differences.60 CAFTA-DR and the
Caribbean Basin Initiative allow regional apparel products to enter the United States duty-free as
long as the yarn and fabrics used for these manufactures originate in the region.61 A special U.S.
preference program encourages apparel imports from Haiti, and the United States also has free-
trade agreements with Colombia, Peru, and Chile, with each adhering to a yarn-forward rule of
origin, with some exceptions.
Competition from China and Vietnam
Notwithstanding rising labor and production costs, no other country, including U.S. NAFTA
partners, comes close to competing with China’s enormous capacity to make complex textiles and
apparel. China, which provided more than a third of total U.S. garment imports, was the top
supplier of apparel to the United States, with U.S. imports registering at $29 billion in 2016, and
it led in U.S. imports in the yarn, fabric, and made-up textile categories.62 It is also the world’s
largest manufacturer of man-made fibers, a large producer of cotton, and a major supplier of
yarns, fabrics, and trims.
57 The 2017 Normal Trade Relations (NTR) duty rate is 16.5% of value for cotton T-shirts (HTS 6109.10.00) and
16.6% for men’s woven cotton pants (HTS 6203.42.40). Tariff savings for other products can be found on the USITC
website at http://dataweb.usitc.gov/scripts/tariff_current.asp. 58 Sheng Lu, 2017 Fashion Industry Benchmarking Study, United States Fashion Industry Association, July 2017, p. 23. 59 CRS calculation based on statistics from OTEXA, “U.S. Imports Under Free Trade Agreements,”
http://otexa.trade.gov/msrpoint.htm. 60 Under CAFTA-DR certain apparel components such as visible lining fabrics, sewing thread, narrow elastic fabric,
and pocketing fabric must originate in the region for apparel containing them to qualify for duty-free treatment. The
agreement also allows for cumulation of inputs for originating goods among the CAFTA-DR countries and for certain
inputs from Mexico, subject to a limit. 61 The Caribbean Basin Initiative (CBI) was initially launched in 1983 through the Caribbean Basin Economic
Recovery Act (P.L. 98-67), and expanded in 2000 through the Caribbean Basin Trade Partnership Act (CBTPA; P.L.
106-200). The CBI was expanded again in the Trade Act of 2002 (P.L. 107-201). The CBI provides beneficiary
countries with duty-free access to the U.S. market for most goods, including apparel products. 62 OTEXA, U.S. Textiles and Apparel Imports by Category, retrieved August 17, 2017.

Renegotiating NAFTA and U.S. Textile Manufacturing
Congressional Research Service 12
Vietnam, which had a small garment manufacturing sector a decade ago, is the second-largest
exporter of apparel to the United States (see Figure 3).63 In 2016, Vietnam’s apparel shipments to
the United States totaled $10.9 billion, accounting for 13% of all U.S. apparel imports. Vietnam
tends to sell fewer basic apparel products (e.g., T-shirts and trousers) and more shirts, suits, and
overcoats in the United States than do Mexico and other trading partners in the Western
Hemisphere.64 On the textile side, Vietnam’s apparel sector buys the majority of its yarns and
fabrics regionally, from China and other suppliers such as South Korea and Taiwan. It purchases a
limited amount from the United States. The Vietnamese government has announced plans to
substantially increase its yarn and fabric capacity in the coming years.
The highly competitive textile and apparel sectors in China and Vietnam are a consideration in the
current NAFTA renegotiations. For example, U.S. textile manufacturers are concerned about
existing NAFTA exceptions, such as tariff preference level (TPL) rules, which allow Mexico and
Canada to bring in a limited amount of yarn and fabric each year from China and Vietnam duty
free and use those imports in products for the U.S. market. Because of this, the U.S. textile
industry has urged that yarns and fabrics from China and Vietnam be excluded from all NAFTA
benefits. A separate issue, but one that could in the long term affect the NAFTA textile and
apparel supply chain, is whether the United States will decide to enter into a free-trade agreement
with Vietnam in coming years. Textiles and apparel from Vietnam would have had free access to
the U.S. market under the recently negotiated Trans-Pacific Partnership trade agreement, but the
United States did not ratify the agreement and withdrew from the Partnership in January 2017.
Figure 3. U.S. Apparel Imports, Selected Countries
Source: U.S. Department of Commerce, OTEXA, accessed August 2017.
63 Vietnam became a WTO member in 2007, entitling it to lower U.S. tariffs. The United States also removed all quotas
on textile and clothing imports from Vietnam. In 2015, Vietnam’s applied duties were 9.6% for textiles and 19.8% for
apparel. See WTO, World Tariff Profiles 2017, http://stat.wto.org/TariffProfiles/VN_e.htm. 64 For example, in 2016, Vietnam provided close to a quarter of total U.S. imports of women’s or girls’ blouses, shirts,
and suits, both knitted and woven. CRS analysis based on Global Trade Atlas data, HTS 6104 (women’s or girls’ suits
and ensembles) and HTS 6106 (women’s or girls’ blouses and shirts).
Renegotiating NAFTA and U.S. Textile Manufacturing
Congressional Research Service 13
Possible Effects of Potential Trade Agreement Modifications
If NAFTA were changed or terminated such that Mexican producers lose duty-free access to the
U.S. market, it is possible that CAFTA’s textile and apparel industry, as well as manufacturers in
the Caribbean or free-trade agreement partners in South America, could benefit if increased
foreign investment and trade follow. For these countries, as is the case for NAFTA partners, tariff
preferences appear to be important in keeping apparel producers in the Western Hemisphere
competitive in the U.S. market, and thereby helping to preserve export markets for U.S.-made
textiles. Beyond apparel, if NAFTA were terminated, U.S.-made technical and industrial fabrics
would lose their protected access to Canada and Mexico.
NAFTA Provisions Affecting Textiles and Apparel
Rules of Origin
Rules of origin are an important aspect of trade agreements affecting the textile and apparel
industries. They generally stipulate how much processing must occur within the region for a
product to obtain duty-free trade benefits.65 The U.S. textile industry generally wants to ensure
that textiles and apparel are chiefly manufactured within the NAFTA region. Apparel brands and
retailers say this requirement reduces their sourcing and manufacturing flexibility. As such, the
apparel industry generally opposes the yarn-forward standard, supporting instead simplified and
more flexible rules of origin in new or renegotiated U.S. trade agreements. One possible outcome
in the NAFTA renegotiation might be a modification of these rules.
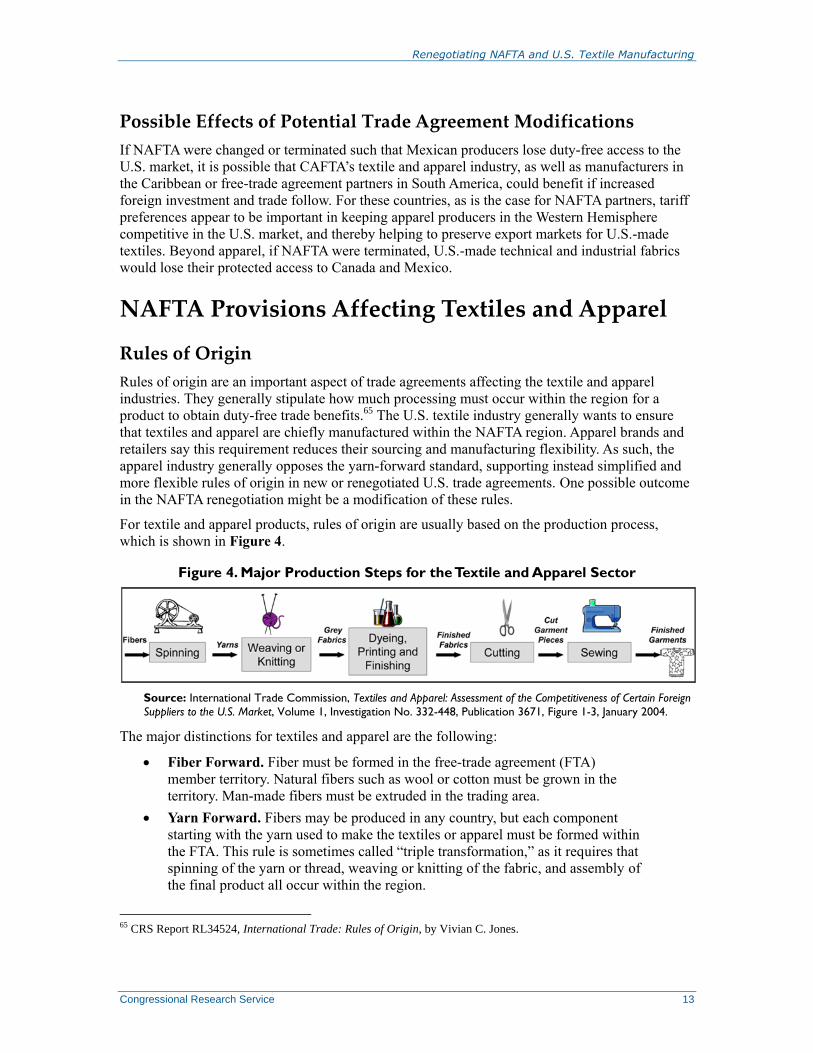
For textile and apparel products, rules of origin are usually based on the production process,
which is shown in Figure 4.
Figure 4. Major Production Steps for the Textile and Apparel Sector
Source: International Trade Commission, Textiles and Apparel: Assessment of the Competitiveness of Certain Foreign
Suppliers to the U.S. Market, Volume 1, Investigation No. 332-448, Publication 3671, Figure 1-3, January 2004.
The major distinctions for textiles and apparel are the following:
Fiber Forward. Fiber must be formed in the free-trade agreement (FTA)
member territory. Natural fibers such as wool or cotton must be grown in the
territory. Man-made fibers must be extruded in the trading area.
Yarn Forward. Fibers may be produced in any country, but each component
starting with the yarn used to make the textiles or apparel must be formed within
the FTA. This rule is sometimes called “triple transformation,” as it requires that
spinning of the yarn or thread, weaving or knitting of the fabric, and assembly of
the final product all occur within the region.
65 CRS Report RL34524, International Trade: Rules of Origin, by Vivian C. Jones.
Renegotiating NAFTA and U.S. Textile Manufacturing
Congressional Research Service 14
Fabric Forward. Producers may use fibers and yarns from any country, but
fabric must be knitted or woven in FTA member countries.66
Cut and Sew. Only the cutting and sewing of the finished article must occur in
FTA member countries, providing maximum flexibility for sourcing.67
NAFTA was the first FTA to include the yarn-forward rule of origin.68 Since then, the rule has
become standard in nearly every FTA negotiated by the United States.69 As described earlier in
this report, NAFTA’s rule of origin ensures a large market for U.S. yarns and fabrics because they
are produced only in limited quantities in Canada and Mexico.
In the original NAFTA agreement, there was a textile and apparel safeguard. It allowed the United
States or any other NAFTA member to reimpose tariffs if import surges caused or threatened to
cause serious damage to domestic industry. The safeguard option expired on January 1, 2004, a
decade after NAFTA’s entry into force. NAFTA also established a Committee on Textile Trade
and Apparel Matters, which may be convened at the request of any NAFTA member, to raise
concerns under the FTA regarding mutual trade in these products.
Exceptions to Rules-of-Origin Requirements
When certain inputs are not available in the partner countries, NAFTA allows for several
exceptions to its detailed rules-of-origin requirements. This gives producers flexibility to use
materials not widely produced in North America.
Tariff Preference Levels
Under NAFTA, TPLs are an exception to the textile rules of origin. This concession to the apparel
industry allows duty-free access for limited quantities of wool, cotton, and man-made fiber
apparel made with yarn or fabric produced or obtained from outside the NAFTA region, thereby
permitting the use of some yarns and fabrics from China and other Asian suppliers.70 In nearly
every year since 2010, Mexico has come close to exporting the maximum allowable amount of
cotton and man-made fiber apparel with duty-free foreign content.71 Canada’s TPL fill rates are
typically highest for cotton and man-made fiber fabric and made-up products, but are not usually
fully filled. NAFTA’s TPL program requires special paperwork to be filed with U.S. Customs and
Border Protection to make a TPL claim.72
66 There is no legal definition of the terms fiber forward, yarn forward, and fabric forward. 67 U.S. Customs and Border Protection (CBP), What Every Member of the Trade Community Should Know About:
Textile and Apparel Rules of Origin. 68 NAFTA’s Annex 401 provides the specific rules of origin applied to goods, including Section XI covering textiles
and textile articles (Chapter 50-63). See CBP, Annex 401, https://www.cbp.gov/trade/nafta/annex-401. 69 One exception is the U.S.-Jordan FTA, implemented in 2001; it has a more liberal “cut and sew” rule of origin,
which requires only fabric be cut and assembled to qualify for duty-free treatment. 70 NAFTA Annex 300-B established TPLs for textile and apparel goods assembled in Canada and Mexico from non-
NAFTA-originating materials in Canada and Mexico. 71 Annual data compiled from OTEXA’s Textile and Apparel Import TPL reports, 2010-2016, http://otexa.trade.gov/
agoa-cbtpa/98220511_2016_TPL.htm. 72 CBP, 3550-085 Claims Under the North American Free Trade Agreement Tariff Preference Level Program,
November 12, 2013, https://www.cbp.gov/document/directives/3550-085-claims-under-north-american-free-trade-
agreement-tariff-preference.

Renegotiating NAFTA and U.S. Textile Manufacturing
Congressional Research Service 15
The issue of NAFTA TPLs divides textile manufacturers and the apparel sector. In the NAFTA
renegotiation, the United States has reportedly proposed an end to the NAFTA TPL regime, as
urged by textile manufacturers.73 Apparel and retail groups, on the other hand, claim that
abandoning the TPL regime could disrupt the regional supply chains that have developed over
more than two decades. It is not clear that eliminating the TPL program would result in a
substantial return of textile production or jobs to the United States; if it were to raise the cost of
Mexican apparel production, it could instead result in imports from other countries displacing
imports from Mexico. Mexico and Canada reportedly oppose the elimination of the NAFTA TPL
program.74
Other NAFTA Exemptions
Apparel produced in the NAFTA region benefits from duty-free access to the United States even
if certain inputs, such as sewing threads, pocketing, and narrow elastics, are not made in the
NAFTA countries. NAFTA also has a de minimis threshold that permits up to 7% of a garment’s
content, by weight, to come from outside the NAFTA region. Textile manufacturers generally
want these exemptions eliminated in a revised NAFTA agreement, while apparel companies and
retailers contend that the exemptions are critical for Mexican apparel plants to be able to adapt
quickly to shifting consumer demand.
Short Supply Process
NAFTA has a short supply process, whereby its rules of origin may be amended through
consultation among the NAFTA partners if yarns and fabrics are not available in commercial
quantities for specific products.75 Under Annex 401 of NAFTA, apparel inputs in short supply
include fine-count cotton knit fabrics for nightwear; linen; silk; cotton velveteen and fine-wale
corduroy fabrics; and certain hand-woven Harris Tweed wool fabrics.76 Apparel and retail groups
contend that the procedure for determining that a product is in short supply is burdensome, and
they want a renegotiated NAFTA agreement to include “defined timetables and clearer
requirements to achieve speedier outcomes” for materials that could come from outside the FTA
region.77 According to press reports, U.S. negotiators have proposed that the short-supply list be
incorporated in the NAFTA agreement itself, as is the case with the CAFTA-DR agreement,78
which lists more than 150 fibers, yarns, and fabrics that are considered to be in short supply.79
73 Eight groups representing U.S. textile manufacturers sent a letter to the chairmen and ranking members of the Senate
Finance Committee and House Ways & Means Committee on October 2, 2017, calling for the elimination of the
NAFTA TPL. In that letter, the groups estimated $725 million worth of textiles and apparel was shipped by Mexico
and Canada to the United States under the TPL program in 2015. The letter is available from the report author. 74 Jack Caporal, “Textile Groups Tell ‘Big Four’ to Back Striking NAFTA Tariff Preference Levels,” Inside U.S.
Trade, October 6, 2017. 75 NAFTA’s short supply process requires a request for a rule-of-origin change that allows sourcing of specific fiber,
yarn, or fabrics from outside the region. For more information see CBP, Textile and Apparel Products, Rules of Origin,
May 29, 2014, https://www.cbp.gov/trade/nafta/guide-customs-procedures/provisions-specific-sectors/textiles. 76 U.S. Customs and Border Protection (CBP), How Do I Read Tariff Shift Rules: And Other Textile & Apparel Rules of
Origin Questions You Were Afraid to Ask, October 2007, pp. 35-38, https://www.cbp.gov/sites/default/files/documents/
tariff_shift_3.pdf. 77 CAFTA-DR’s short supply list of specific fibers, yarns, or fabrics, which can be used in any product, is in Annex
3.25 of the agreement. Its short supply mechanism includes tighter timelines than in earlier short supply processes,
allows items to be deemed in partial short supply, and provides for items to be added and removed from the short
supply list. 78 Jack Caporal, “U.S. Tables Textiles Short-Supply List Similar to CAFTA's, Sticks to TPL Elimination,” Inside U.S.
(continued...)

Renegotiating NAFTA and U.S. Textile Manufacturing
Congressional Research Service 16
Other Provisions
The U.S. textile industry wants the NAFTA renegotiation to address certain exemptions granted to
Canada and Mexico under the Kissell Amendment (6 U.S.C. §453b), a Buy American-type law
that requires 100% U.S. content for textile and apparel purchases by the Department of Homeland
Security, with limited exceptions.80 The Kissell Amendment treats manufacturers in Mexico,
Canada, and Chile as “American” sources, thus opening U.S. government procurement to
imported goods from these countries.81 Another priority for the textile industry in the NAFTA
renegotiation is to avoid any future change to government procurement rules that could
undermine the Berry Amendment (10 U.S.C. §2533a), a 100% domestic-in-origin requirement for
textile and apparel items purchased by U.S. national security agencies.
Customs Enforcement and Trade Facilitation
Customs enforcement is particularly important to the industry, as textile and apparel trade
accounts for approximately 40% of all U.S. duty revenue and involves 20% of all U.S.
importers.82 According to U.S. Customs and Border Protection, more than $21.1 billion of entered
textiles and wearing apparel claim preferential tariff treatment, placing textiles and apparel at a
high risk for noncompliance.83 This makes the issue of transshipment of special relevance to the
U.S. textile and apparel industry because of concerns that major textile- and apparel-producing
countries such as China are shipping products through countries that have free-trade agreements
with the United States, including the NAFTA countries.84
Conclusion As the NAFTA renegotiations progress, there are at least three possible outcomes: (1) no change
to the textile and apparel provisions in NAFTA; (2) adjustments to NAFTA, such as changes to
rules of origin; or (3) full U.S. withdrawal from NAFTA.85 Over the long run, global textile and
apparel supply chains would adjust to a modified NAFTA or to its elimination, but it is unclear
how long that may take.
(...continued)
Trade, October 14, 2017. 79 CAFTA-DR’s short supply list can be found on OTEXA’s website at http://web.ita.doc.gov/tacgi/CaftaReqTrack.nsf/
aa4a8d4e4e834fe4852572c700477f2e/f30332701dfb867f852572c70047dfa0?OpenDocument. 80 The Kissell Amendment applies only to purchases by the Coast Guard and the Transportation Security
Administration. 81 See CRS Report R44850, Buying American: Protecting U.S. Manufacturing Through the Berry and Kissell
Amendments, by Michaela D. Platzer. 82 CBP, Textiles and Wearing Apparel, Office of Trade, Priority Trade Issue, December 1, 2016, https://www.cbp.gov/
sites/default/files/assets/documents/2016-Dec/FY%202016%20-%20Textiles_PTI%20Brochure.pdf. 83 CBP, Priority Trade Issue: Textiles, https://www.cbp.gov/trade/priority-issues/textiles. 84 Transshipment is when an exported product is shipped through an intermediate country before routing it to the
country intended to be its final destination. Sometimes the intermediate exporting country may be incorrectly
represented as the country of origin, which is illegal. 85 When NAFTA entered into force on January 1, 1994, the United States and Canada agreed to suspend operation of
the free-trade agreement of 1989. If the United States withdraws from NAFTA, it is possible the U.S.-Canada Free
Trade Agreement could “snap-back” into force, but a presidential proclamation may be required.

Renegotiating NAFTA and U.S. Textile Manufacturing
Congressional Research Service 17
Under a withdrawal scenario, some analysts believe U.S. textile manufacturers could see a
reduction in net income by as much as 1 percentage point if the result is less demand for U.S.-
made yarns and fabrics within the NAFTA region.86 According to one textile and apparel industry
expert, ending NAFTA would likely result in U.S. apparel brands and retailers importing more
garments from other suppliers, such as China and Vietnam. Moreover, U.S. textile manufacturers
could lose export sales to Mexico, the United States’ single largest export market. It is possible
that Asian textile and apparel suppliers would benefit the most from NAFTA’s dismantlement by
taking market share from Mexico.87 Whatever the outcome of the NAFTA renegotiation, in the
medium and long run, the profitability of the North American textile and apparel industry will
likely depend less on NAFTA preferences such as yarn forward and more on the capacity of
producers in the region to innovate to remain globally competitive.
Another matter worth considering is that although the United States withdrew from the proposed
TPP in January 2017, the 11 remaining TPP countries are continuing to pursue a TPP-type trade
deal.88 If negotiations among the TPP-11 move forward, this could affect the supply chains
established under NAFTA, although the implications are unknown because no specific proposals
for a possible TPP-11 agreement have been tabled to date. If the TPP-11 countries strike a trade
deal, one possible effect is that the amount of textiles and apparel sourced from the newly
established TPP region would increase.89 Canada and Mexico are both parties to the TPP talks,
and a TPP-11 agreement could result in them importing more textile and apparel products from
other TPP countries, including Vietnam. This could ultimately be a disadvantage for U.S.-based
producers. How the inclusion of Canada and Mexico in a fresh TPP arrangement would affect
their participation in NAFTA is unknown.
It may take a couple of years to know exactly what changes the NAFTA renegotiation will bring,
and how they will affect the existing textile and apparel regional supply chain. President Trump
currently has Trade Promotion Authority until July 1, 2018, allowing him to negotiate trade
agreements that Congress must approve or reject without amendment. This authority expires on
July 1, 2018, but current law allows it to be extended through July 1, 2021.90
86 Joe Terino, “Is Your Supply Chain Ready for a NAFTA Overhaul?,” Harvard Business Review, June 30, 2017. 87 Sheng Lu, “What Will Happen to the U.S. Textile and Apparel Industry if NAFTA is Gone?,” April 26, 2017,
https://shenglufashion.wordpress.com/2017/04/26/what-will-happen-to-the-u-s-textile-and-apparel-industry-if-nafta-is-
gone/. 88 In January 2017, President Trump directed USTR to withdraw the United States as a signatory to the TPP agreement,
and USTR gave notification to that effect on January 30, 2017. See Letter from Maria L. Pagan, Acting United States
Trade Representative, to Trans-Pacific Partnership Depositary, Ministry of Foreign Affairs and Trade, January 30,
2017, https://ustr.gov/sites/default/files/files/Press/Releases/1-30-
17%20USTR%20Letter%20to%20TPP%20Depositary.pdf. 89 The other likely TPP-11 countries are seen as Australia, Brunei Darussalam, Chile, Malaysia, New Zealand, and
Singapore. 90 See CRS In Focus IF10038, Trade Promotion Authority (TPA), by Ian F. Fergusson.

Renegotiating NAFTA and U.S. Textile Manufacturing
Congressional Research Service 18
Appendix A. Textile Industry Overview
2010 2015 2016 2010-
2016
Total U.S. manufacturing employment
(all industries) 11,487,496 12,291,676 12,295,670 7%
Textile mills (NAICS 313) 119,385 116,773 113,660 -5%
Textile product mills (NAICS 314) 119,145 115,466 115,767 -3%
Total textile employment 238,530 232,239 229,427 -4%
Apparel (NAICS 315) 157,587 135,263 128,781 -18%
All textiles and apparel (T&A) 396,117 367,502 358,208 -10%
T&A employment as % of total mfg. employment 3.4% 3.0% 2.9%
Total value of shipments, in millions of U.S. $
Total U.S. manufacturing $4,915,151 $5,549,100 $5,436,549 11%
Textile mills (NAICS 313) $29,654 $30,629 $30,146 2%
Textile product mills (NAICS 314) $21,409 $25,666 $25,889 21%
Total textile shipments $51,063 $56,295 $56,035 10%
Apparel manufacturing (NAICS 315) $13,156 $11,473 $11,951 -9%
All textiles and Apparel (T&A) $64,219 $67,781 $67,504 5%
T&A shipments as % of total mfg. shipments 1.3% 1.2% 1.2%
U.S. imports for consumption
Textile mills (NAICS 313) $6,525 $8,395 $8,003 23%
Textile products (NAICS 314) $15,825 $20,216 $20,364 29%
Total textile imports $22,350 $28,611 $28,367 27%
Apparel imports (NAICS 315) $75,411 $89,519 $89,509 19%
All textiles and apparel $97,761 $118,130 $117,876 21%
U.S. Exports
Textile mills (NAICS 313) $7,833 $8,756 $8,078 3%
Textile products (NAICS 314) $2,582 $2,909 $2,809 9%
Total textile exports $10,415 $11,665 $10,887 5%
Apparel exports (NAICS 315) $3,070 $3,179 $2,874 -6%
All textiles and apparel $13,485 $14,844 $13,761 2%
Apparel imports share of U.S. market 88.20% 91.52% 90.79%
Textile imports share of U.S. market 35.48% 39.06% 38.59%
Source: CRS, with data from U.S. Department of Labor, Quarterly Census of Employment and Wages; Census
Bureau, Manufacturers’ Shipments, Inventories, and Orders; and USITC Dataweb. All data updated in August
2017.
Notes: NAICS 313 covers yarn, thread, and fabric, and NAICS 314 corresponds to made-up, nonapparel textiles
articles such as sheets and towels. NAICS 315 covers cut-and-sew and knit-to-shape apparel.

Renegotiating NAFTA and U.S. Textile Manufacturing
Congressional Research Service 19
Appendix B. Top 10 States in Textile Employment
1994 2016 % Change # Change
United States 698,415 229,427 -67% -468,988
Georgia 105,321 47,787 -55% -57,534
North Carolina 117,584 34,231 -71% -83,353
South Carolina 94,653 18,913 -80% -75,740
California 31,837 16,128 -49% -15,709
Alabama 35,526 9,307 -74% -26,219
Texas 12,871 7,426 -42% -5,445
Pennsylvania 23,933 7,287 -70% -16,646
New York 23,934 7,228 -70% -16,706
Virginia 26,347 6,895 -74% -19,452
Tennessee 20,027 5,957 -70% -14,070
Top 10 States Employment Total 492,033 161,159 -67% -330,874
Other 40 States Plus DC 206,382 68,268 -67% -138,114
Top 10 States % of Total Employment 70% 70%
Source: CRS, with data compiled from U.S. Bureau of Labor Statistics, Quarterly Census of Employment and
Wages, updated in August 2017.
Notes: Textile employment data cover two NAICS codes, 313 and 314. The 50 states and Washington, DC, do
not sum to the national total because the national total includes suppressed data and Puerto Rico.

Renegotiating NAFTA and U.S. Textile Manufacturing
Congressional Research Service 20
Appendix C. Selected Apparel and Textile Duties
Ad Valorema Tariff Ranges
Country Yarn
Woven
Fabric Knit Fabric
Non-
Woven
Fabric
Industrial
Fabric Apparel
FTA Member Countries
Australia 0%-5% 0%-5% 5% 5% 0-5% 0-5%
Chile 6% 6% 6% 6% 6% 6%
Colombia 0%-15% 0%-10% 0%-10% 0%-10% 0%-10% 10%
Israel 0%-6% 0%-6% 0%-6% 0%-6% 0%-6% 0%-6%
Jordan 0%-20% 0% 0% 0% 0%-20% 0%-20%
Morocco 2.5% 2.5%-17.5% 10%-17.5% 2.5% 2.5%-25% 2.5%-25%
Panama 0%-15% 0%-15% 0% 0% 0%-15% 0%-15%
Peru 0%-11% 0%-11% 0%-11% 0%-6% 0%-11% 6%-11%
South Korea 0-8% 2%-13% 10% 8% 8%-10% 8%-13%
CAFTA-DR
Costa Rica 0%-5% 0%-9% 0%-9% 0% 0%-9% 0%-14%
Dominican
Republic
0% 0%-14% 0%-8% 0% 0%-20% 3%-20%
El Salvador 0%-5% 0%-10% 0%-10% 0% 0%-10% 0%-15%
Guatemala 0-5% 0%-10% 0%-10% 0% 0%-10% 0%-15%
Honduras 0%-5% 0%-15% 0%-10% 0% 0%-10% 0%-15%
Nicaragua 0%-5% 0%-10% 0%-10% 0% 0%-10% 0%-15%
NAFTAb
Mexico 0%-10% 10%-15% 0%-10% 10% 0%-10% 20%
Canada 0%-8% 0% 0% 0% 0%-18% 0%-18%
Other Countries
Brunei 0% 0% 0% 0% 0%-10% 0%
Japan 0%-6.9% 2.5%-12.5% 4%-9.8% 0%-4.3% 2.8%-6.6% 4.4%-12.8%
Malaysia 0%-30% 0%-10% 15% 20% 0%-20% 0%-20%
New Zealand 0%-5% 0%-5% 0%-5% 5% 0%-5% 0%-10%
Vietnam 0%-10% 12% 12% 12% 0%-12% 5%-20%
United States 0%-13.2% 0%-25% 0%-18.5% 0% 0%-14.1% 0%-32%

Renegotiating NAFTA and U.S. Textile Manufacturing
Congressional Research Service 21
Ad Valorema Tariff Ranges
Country Yarn
Woven
Fabric Knit Fabric
Non-
Woven
Fabric
Industrial
Fabric Apparel
Other Countries
China 5%-9% 6%-18% 10%-12% 10% 8%-14% 14%-25%
European
Unionc
0%-5% 3%-8% 6.5%-8% 4.3% 4%-8% 6.3%-12%
Philippines 1%-10% 1%-10% 1%-10% 15% 0%-15% 1%-15%
Thailand 1%-5% 5%-17.5% 5% 5% 1%-30% 10%-30%
Source: CRS, with information from U.S. Department of Commerce, Office of Textiles and Apparel (OTEXA),
updated August 19, 2017.
Note: U.S. trade agreements generally follow a yarn-forward system for textiles and apparel rules of origin, with
the notable exceptions of the U.S.-Israel FTA and the U.S.-Jordan FTA, which have more liberal “cut and sew”
standard based on value-added calculations requiring only that fabric be cut and assembled to qualify.
a. Ad valorem tariff rates are based on the value of the goods.
b. Textile and apparel goods manufactured in the United States enter Canada and Mexico duty-free under
NAFTA if they qualify under the rules of the agreement.
c. Members of the European Union apply the EU common external tariff to goods from non-EU countries.

Renegotiating NAFTA and U.S. Textile Manufacturing
Congressional Research Service 22
Appendix D. Selected Textile and Apparel Industry
Comments on NAFTA Negotiating Objectives Links to several statements by industry representatives for U.S. fiber and textile manufacturers,
U.S. fashion brands, and U.S. apparel retailers are listed here. These statements reflect a
consensus from all stages of the textile and apparel supply chain that NAFTA should continue
because it helps maintain both sectors’ overall competitiveness. Without NAFTA, according to
these statements, current textile and apparel production and jobs could be shifted to other regions
of the world, especially low-cost markets in Asia. The comments also suggest a few general
recommendations for other policy issues of interest, including matters related to improving
intellectual property rights to combat counterfeit goods, preventing restrictions on e-commerce
and digital trade, improving regulatory cooperation, and updating NAFTA’s labor provisions.
Organization Links to Comments on NAFTA Renegotiation
National Council of Textile Organizations https://www.regulations.gov/document?D=USTR-2017-0006-
0999
American Fiber Manufacturers Association https://www.regulations.gov/document?D=USTR-2017-0006-
0897
National Cotton Council of America https://www.regulations.gov/document?D=USTR-2017-0006-
1047
American Apparel & Footwear Association https://www.regulations.gov/document?D=USTR-2017-0006-
1140
Retail Industry Leaders Association https://www.regulations.gov/document?D=USTR-2017-0006-
1159
United States Fashion Industry Association https://www.regulations.gov/document?D=USTR-2017-0006-
0800
National Retail Federation https://www.regulations.gov/document?D=USTR-2017-0006-
0854
U.S. Industrial Fabrics Institute & Narrow Fabrics
Institute
https://www.regulations.gov/document?D=USTR-2017-0006-
0801
Source: “Requests for Comments: Negotiating Objectives Regarding Modernization of North American Free
Trade Agreements with Canada and Mexico,” http://www.regulations.gov, Docket Number USTR-2017-0006.
Note: Industry comments were submitted on June 12, 2017, before the USTR held its NAFTA hearing on June
27-29.

Renegotiating NAFTA and U.S. Textile Manufacturing
Congressional Research Service 23
Author Contact Information
Michaela D. Platzer
Specialist in Industrial Organization and Business
[email protected], 7-5037
Acknowledgments
Amber Wilhelm, Visual Information Specialist, contributed the graphics to this report.