Embed Size (px)
Citation preview

Relation between microbiological quality, metabolite production
and sensory quality of equilibrium modified atmosphere packaged
fresh-cut produce
L. Jacxsens, F. Devlieghere*, P. Ragaert, E. Vanneste, J. Debevere
Laboratory of Food Microbiology and Food Preservation, Department of Food Technology and Nutrition,
Faculty of Agricultural and Applied Biological Sciences, Ghent University, Coupure links, 653, 9000 Ghent, Belgium
Received 25 November 2001; received in revised form 28 March 2002; accepted 29 August 2002
Abstract
The quality of four types of fresh-cut produce, packaged in consumer-sized packages under an equilibrium modified
atmosphere and stored at 7 jC, was assessed by establishing the relation between the microbial outgrowth and the
corresponding production of nonvolatile compounds and related sensory disorders.
In vitro experiments, performed on a lettuce-juice-agar, demonstrated the production of nonvolatile compounds by spoilage
causing lactic acid bacteria and Enterobacteriaceae. Pseudomonas fluorescens and yeasts, however, were not able to produce
detectable amounts of nonvolatile metabolites.
The type of spoilage and quality deterioration in vivo depended on the type of vegetable. Mixed lettuce and chicory endives,
leafy tissues, containing naturally low concentrations of sugars, showed a spoilage dominated by Gram-negative
microorganisms, which are not producing nonvolatile compounds. Sensory problems were associated with visual properties
and the metabolic activity of the plant tissue. Mixed bell peppers and grated celeriac, on the other hand, demonstrated a fast and
intense growth of spoilage microorganisms, dominated by lactic acid bacteria and yeasts. This proliferation resulted in
detectable levels of organic acids and the rejection by the trained sensory panel was based on the negative perception of the
organoleptical properties (off-flavour, odour and taste).
The applied microbiological criteria corresponded well with detectable changes in sensory properties and measurable
concentrations of nonvolatile compounds, surely in the cases where lactic acid bacteria and yeasts were provoking spoilage.
Consequently, the freshness of minimally processed vegetables, sensitive for outgrowth of lactic acid bacteria and yeasts (e.g.,
carrots, celeriac, bell peppers, mixtures with non-leafy vegetables) can be evaluated via analysis of the produced nonvolatile
compounds.
D 2002 Elsevier Science B.V. All rights reserved.
Keywords: Microbial quality; Sensory quality; Vegetables; Metabolite production; Packaging
1. Introduction
Deterioration of fresh-cut vegetables is at the same
time autolytically due to further respiration, transpira-
tion and enzymatic activity of the living tissue after
0168-1605/02/$ - see front matter D 2002 Elsevier Science B.V. All rights reserved.
doi:10.1016/S0168-1605(02)00376-8
* Corresponding author. Tel.: +32-9-264-61-77; fax: +32-9-
225-55-10.
E-mail address: [email protected] (F. Devlieghere).
www.elsevier.com/locate/ijfoodmicro
International Journal of Food Microbiology 83 (2003) 263–280

harvest and processing, as from microbiological ori-
gin, due to proliferation of spoilage microorganisms
on the plant tissue (Nguyen-the and Carlin, 1994).
Brown discolouration of cut surfaces has been
recognised as an important defect of fresh-cut vege-
tables (Bolin and Huxsoll, 1991; Heimdal et al., 1995;
Lopez-Galvez et al., 1997; Watada and Qi, 1999;
Ahvenainen, 2000). The visual properties of the
packaged product are indeed important parameters
for consumers in the evaluation of the quality of
minimally processed vegetables: absence of discolou-
ration (enzymatic browning of cut surfaces, yellowing
of green vegetables and pale colour of bright vegeta-
bles) and absence of mechanical damage (i.e., foiled
lettuce leaves, absence of cutting damage) are primary
demands (Bolin et al., 1977; Bolin and Huxsoll, 1991;
Watada and Qi, 1999; Varoquaux, 2001).
In addition to visual defects, some flavour defects
may be induced by applying modified atmospheres
(Heimdal et al., 1995; Beaudry, 2000) and/or by micro-
bial outgrowth (Carlin et al., 1989; Fleet, 1992; Lopez-
Galvez et al., 1997). For example, exposure to elevated
CO2 levels (10–20%) may result in the suppression of
various metabolic processes (Kays, 1991; Mathooko,
1996; Watkins, 2000). However, in presence of suffi-
cient O2, the sensory quality is less affected (Mathooko,
1996; Lopez-Galvez et al., 1997; Watkins, 2000). Off-
flavour development in fresh-cut vegetables can also be
provoked by a lack of O2. A shift from an aerobic
towards an anaerobic atmosphere will provoke a fer-
mentative metabolism under low O2 levels (Kader et
al., 1989; Kays, 1991; Beaudry, 2000). The severity of
off-flavour production will depend on the time of
exposure to conditions below the minimum required
O2 concentration and/or above the maximum tolerated
CO2 concentration (Beaudry, 1999; Beaudry, 2000;
Watkins, 2000).
Not only the fermentative metabolism of the plant
tissue itself but also microorganisms can be responsible
for the presence of off-flavours during storage of fresh-
cut vegetables. Especially, the outgrowth of lactic acid
bacteria can be accompanied with production of
organic acids such as lactic acid and acetic acid. Carlin
et al. (1989) and Kakiomenou et al. (1996) isolated
Leuconostoc mesenteroides, as the main spoiler of
grated carrots. Leuconostoc spp. are heterofermentative
and produce, next to lactic acid, also ethanol and CO2.
Lactobacillus spp. are responsible for a cheesy, acidic
flavour of fresh-cut celery, stored in low O2 conditions
(Robbs et al., 1996a,b). The production of organic
acids will cause a drop in the pH of the product (Carlin
et al., 1989; Jacxsens et al., 1999a). Also, high amounts
of yeasts (>105 CFU/g) (Candida spp.) can provoke an
off-flavour of fresh-cut produce due to the production
of CO2, ethanol, organic acids and volatile esters
(Babic et al., 1992; Fleet, 1992). However, little infor-
mation is generally known about the relation between
the outgrowth of spoilage microorganisms, their pro-
duction of metabolites (volatile and nonvolatile) and
the perception of the decay of minimally processed
vegetables by consumers.
This research work had the objective to character-
ise the production of nonvolatile compounds and the
consumption of sugars by important spoilage-causing
microorganisms (Gram-negative, Gram-positive and
yeasts) of fresh-cut produce in vitro on a lettuce-juice-
agar under equilibrium modified atmosphere (EMA)
conditions. An in vivo study on EMA packaged fresh-
cut mixed lettuce, mixed shredded bell peppers, shred-
ded chicory endive and grated celeriac was further-
more performed in order to relate the microbial
growth, the sensory quality and the metabolite pro-
duction as a function of the storage time.
2. Materials and methods
2.1. In vitro experiments
2.1.1. Isolation/identification of spoilage micro-
organisms on shredded mixed lettuce
Commercially available packaged mixed lettuce
(16% radicchio (Cichorium intybus var. foliosum L.),
10% endive (Cichorium endiva L.), 19% curled endive
(C. endiva L.) and 55% cos lettuce (Lactuca sativa var.
longifolia)) was purchased and stored until the indi-
cated end of shelf life at 7 jC. At that moment, total
psychrotrophic count (spread plate on Plate Count
Agar, PCA; Oxoid; CM325, Unipath, Basingstoke,
Hampshire, UK, incubated for 5 days at 22 jC) andnumber of yeasts (spread plate on Yeast Glucose
Chlorampenicol, YGC; Sanofi Diagnostics Pasteur;
64104, Marnes-La-Coquette, France, incubated for 3
days at 30 jC) was analysed.From the PCA plates, different typical colonies were
isolated and purified via a 4� 4 plating on Tryptone
L. Jacxsens et al. / International Journal of Food Microbiology 83 (2003) 263–280264

Soya Agar (TSA; Oxoid; CM131). After incubation at
30 jC for 24 h, they were characterised by classical
identification tests (Gram-straining, oxidase (identifi-
cation sticks oxidase (Oxoid; BR64A)), catalase (H2O2
30% (Vel; 90320; Merck Eurolab, Leuven, Belgium)
diluted until 3%)). They were further identified via a
biochemical identification kit for Gram-negative bac-
teria (BBL CristalTM E/NF, Becton Dickinson, Cock-
eysville, MD, USA). The identification was confirmed
by LMG Culture Collection (Ghent University, Ghent,
Belgium), applying Biolog GN 2 (biochemical test
based on the ability to oxidise 95 different carbon
sources) (Biolog, California, USA). Three strains were
identified (PR1, PR2 and PR3).
Two lactic acid bacteria were selected for the in vitro
study: Leuconostoc gasicomitatum (PR4) and Lactoba-
cillus brevis (PR5), isolated previously from fresh-cut
produce, stored at 4 jC (Jacxsens et al., 2001).
From the YGC plates, colonies were purified via a
4� 4 plating on YGC, and incubated at 30 jC for 24 h.
They were identified with a biochemical kit for yeasts
(ID32C, bioMerieux, Marcy l’Etoile, France) and the
identification was confirmed by IHEM Culture Col-
lection (Brussels, Belgium), applying the auxano-
graphic method (Vanbreuseghem et al., 1978). Two
yeast strains were identified: PR6 and PR7.
The strains PR1, PR2 and PR3 were stored on PCA-
slants, PR4 and PR5 on MRS-slants (Oxoid; CM361)
and PR6 and PR7 on SAB-slants (Sabouraud Liquid
Medium (Oxoid; CM147) + 15 g/l agar (Oxoid; L11))
at 4 jC.
2.1.2. Simulation agar for mixed lettuce: lettuce-
juice-agar
The microorganisms (PR1 until PR7) were inocu-
lated on a simulation agar for fresh-cut produce in
order to be able to define the relation between their
growth characteristics, sugar consumption and produc-
tion of nonvolatile metabolites. Five different types of
lettuce were applied for this: green ‘‘lollo bionta’’, red
‘‘lollo rosso’’ (L. sativa var. crispa), radicchio, endive
and curled endive. From each type of lettuce, 20% was
used, because this composition was also utilised in the
final in vivo experiments (Section 2.2.1). After wash-
ing with cold tap water (60 s), the lettuce was dried for
60 s by means of a manual kitchen centrifuge (Zyliss,
Bern, Switzerland) and centrifuged (Braun, type 4290,
Kronberg, Germany) to obtain juice and pulp. The
juice was heated for 2 h at 80 jC to denature enzymes
and proteins. The juice was filtered through a filter
(Retsch, 200 Am, Haan, Germany). The yield of the
juice was finally 50% (v/w). Agar (Oxoid; L11) was
added to the filtrate (15 g/l) even as 0.6% (v/v) oil
(colza oil, Vandemoortele, Izegem, Belgium) to pre-
vent excessive foaming during boiling. The solution
was autoclaved for 15 min at 121 jC. The pH was
measured (electrode (PH 915600, Orion, Boston, USA)
and measure unit (model 525A, Ankersmit, Boston,
USA)) and was 5.6.
2.1.3. Determination of growth characteristics on the
lettuce-juice-agar
Growth curves of the spoilage microorganisms PR1
until PR7 were made under EMA conditions (3% O2
and 2–5% CO2 (balanced by N2)) at 7 jC. The
inoculumwas prepared from the slants, grafted in broth
(for PR1, PR2 and PR3, Brain Heart Infusion broth was
used (BHI; Oxoid; CM225); for PR4 and PR5, deMan-
Rogosa-Sharp broth (MRS; Oxoid; CM359); for PR6
and PR7, SAB). After 24-h incubation at 30 jC, asubculture was taken (0.1 ml in 5 ml broth), incubated
for 16 h at 30 jC followed by 8 h at 7 jC, in order to
allow adaptation of the strain to the low temperature.
The inoculum size depended on the initial count
analysed on the mixed lettuce (105–106 CFU/plate/
56 cm2/g for PR1, PR2 and PR3, or 103–104 CFU/
plate/56 cm2/g for PR4, PR5, PR6 and PR7). It was
determined that 1 g mixed lettuce was comparable to
the surface of a Petri dish (56 cm2).
Six inoculated plates were packaged inside a bag
of 30� 40 cm (high-barrier film, Euralpack, Wom-
melgem, Belgium) with an oxygen transmission rate
of 2 ml O2/(m2 24 h atm) and CO2 transmission rate
of 5.2 ml CO2/(m2 24 h atm) at 23 jC and 90%
relative humidity. The initial atmosphere (3% O2, 2–
5% CO2, balanced by N2) was introduced by using a
gas packaging unit (gas mixer, WITT M618-3MSO,
Gasetechnik, Germany; vacuum compensation cham-
ber, Multivac A300/42 Hagenmuller, Wolfertschwen-
den, Germany). Air Products (Vilvoorde, Belgium)
supplied the gases (Fresh Line). The gas concentra-
tion inside the packages was analysed before opening
with a CO2/O2 gas analyser (Servomex Food Package
Analyser, Series 1400, Crowborough, Sussex, UK).
At each analysis point, three plates from each bag
were applied to determine the growth curve, and
L. Jacxsens et al. / International Journal of Food Microbiology 83 (2003) 263–280 265

three were analysed for the consumption of sugars
and production of nonvolatile compounds (Section
2.1.4). To enumerate the growth curve, the lettuce-
juice-agar of a plate was aseptically transferred to a
sterile stomacher bag, diluted with peptone saline
solution (PPS, 8.5 g/l NaCl; Vel 8605 + 1 g/l peptone,
Oxoid; L34) and homogenised for 60 s with a Col-
worth Stomacher 400 (Steward Laboratory, London,
UK). Tenfold dilution series were made in peptone
saline solution for plating on specific media: PCA for
the strains PR1, PR2 and PR3, MRS for the strains
PR4 and PR5, and YGC for the strains PR6 and PR7.
These plates were all incubated for 3 days at 30 jC.Results were expressed as CFU/cm2. The growth
curve was estimated via the Baranyi model at con-
stant temperature with the determination of four
parameters: the initial count (N0), the maximum
population density (Nmax), the lag phase (k) and the
maximum growth rate (lmax) (Grijspeerdt and Van-
rolleghem, 1999).
2.1.4. Determination of consumption of sugars/
production of metabolites
Three plates of the in vitro test were, on each
analysing point, analysed by High Performance Liquid
Chromatography (HPLC) for the content of sugars
(glucose, fructose, sucrose and oligosaccharides), or-
ganic acids (lactic acid, citric acid, acetic acid, suc-
cinate, adipic acid and propionic acid) and ethanol.
The complete lettuce-juice-agar of a plate was intro-
duced in a stomacher bag and diluted with water (1:1).
This was manually homogenised to a fluid solution,
which was transferred in an Eppendorf tube. The tubes
were centrifuged (20 min/14,000 rpm) (Eppendorf,
Centrifuge 5415 C, Hamburg, Germany). The super-
natant was filtered (Millipore, 0.22 Am, Waters TCM,
Bedford, USA) and this filtrate was injected in the
HPLC (100 Al). The HPLC contained a precolumn
(Cat. number 125-0129, Hercules, Biorad, Laarne,
Belgium), a separation column (Aminex HPX-87H,
Biorad) existing out of a polystyrene matrix with
sulfonic acid in acid state as functional group, a
temperature controller (TCM, Waters, Millipore), a
RI-detector (Model 132, Gilson Unipoint, Villiers-
Le-Bel, France) and software (Gilson Unipoint). As
mobile phase, 5 mM H2SO4 (Vel) was applied with a
flow rate of 0.6 ml/min and the temperature was set at
35 jC.
2.2. In vivo experiments
2.2.1. Preparation of the vegetables
The produce was industrially prepared in a vege-
table processing industry (Allgro, Sint-Lievens-Hou-
tem, Belgium). Mixed lettuce is a commercially
available mixture of 20% endive, 20% curled endive,
20% radicchio lettuce, 20% lollo rosso and 20% lollo
bionta lettuces (red and green variety). Chopped
bell peppers are a mixture of green, red and yellow
shredded bell peppers (Capsicum annuum L.) (0.4�1 cm). The chicory endives (C. intybus L.) were
manually hand-cut in 0.5-cm slides with a sharp
knife. The grated celeriac (Apium graveolens var.
rapaceum L.) was peeled and grated in thin sticks
(0.3� 0.3� 4 cm) by Compacto Kitchen Cutter
(Philips, Eindhoven, the Netherlands). The chicory
endives and the grated celeriac were immersed in
cold tap water for 60 s and dried for 60 s by means
of a manual kitchen centrifuge (Zyliss) to remove the
remaining water.
2.2.2. Packaging of the vegetables
For the mixed lettuce, two types of packaging
material were applied. A commercial available and
nowadays widely applied BOPP film (30 Am), PVdC
coated with an oxygen transmission rate of 15 ml O2/
(m2 24 h atm) at 7 jC and 90% relative humidity (Van
der Windt Packaging, Hoogstraten, Belgium). The
other film was a prototype of a high permeable pack-
aging film in which equilibrium modified atmosphere
conditions (3–5% O2 and 5–10% CO2) could sustain
(Jacxsens et al., 1999a,b, 2000). The applied pack-
aging configurations for the high permeable films
(Hyplast, Hoogstraten, Belgium) were calculated
based on a mathematical model (Jacxsens et al.,
2000) and are given in Table 1. The initial atmosphere
(3% O2 and 2–5% CO2) was introduced immediately
inside the packages via active modification of the
atmosphere. The same packaging technique as in
Section 2.1.3 was applied. The packages were stored
at 7 jC. Analyses were performed in triplicate on day
0 (production day) and regularly until days 10–13.
2.2.3. Analysis of the headspace gas composition
The O2 and CO2 concentration (volume %) of the
headspace of the packages were analysed by applying
a Servomex gas analyser (Section 2.1.3).
L. Jacxsens et al. / International Journal of Food Microbiology 83 (2003) 263–280266

2.2.4. Analysis of the microbiological quality
Growth of the most important groups of micro-
organisms, associated with the spoilage of minimally
processed vegetables, was followed during the in vivo
storage experiment. From each package, 30 g was
taken with 270 ml peptone saline solution (PPS, 8.5
g/l NaCl; Vel 8605 + 1 g/l peptone, Oxoid; L34) in a
sterile stomacher bag and homogenised for 60 s with a
Colworth Stomacher 400 (Steward Laboratory). Ten-
fold dilution series were made in peptone saline
solution for plating. To enumerate the total aerobic
psychrotrophic count (TPC), pour plates were made on
PCA and incubated for 5 days at 22 jC. The number of
lactic acid bacteria (LAB) was followed on a pour plate
with top layer on MRS, incubated for 3 days at 30 jC.Yeasts were followed on a spread plate on YGC,
incubated for 3 days (yeasts) at 30 jC. The outgrowthof the TPC, LAB and yeasts on the mixed lettuce was
as well fitted by the Baranyi equation in order to be
able to compare the obtained growth characteristics
with the ones obtained via the in vitro growth curves
(Section 2.1.3).
2.2.5. Analysis of pH
During the storage experiments, the pH of the
vegetables was followed as well. A sample of 50 g
was homogenised by a mixer (Commercial blender
8010, Waring, New Hartford, CT, USA). The pH was
measured with the same instrument as in Section
2.1.2.
2.2.6. Analysis of the sensory quality
The sensory quality was evaluated via a taste
panel. The panel contained 8–10 trained members.
The first part (organoleptical characteristics as taste,
crispness (texture evaluation), odour/off-flavour) was
judged under red light to exclude interference of
visual judgement. Under daylight, the visual charac-
teristics such as colour, general appearance and gen-
eral freshness were evaluated. Scores were given from
1 ( = excellent fresh) until 10 ( = completely deterio-
rated). The sample was considered as unacceptable for
a sensory characteristic when the score was higher
than 5 ( = just acceptable).
2.2.7. Analysis of the consumed sugars and produced
nonvolatile metabolites
A sample of 50 g fresh-cut vegetables was centri-
fuged (Braun, type 4290) and the juice was filtered
over a paper filter (5971/2, Schleicher and Schuell,
Dassel, Germany). The filtrate was further centrifuged
(20 min/14,000 rpm) (Eppendorf, Centrifuge 5415 C).
The supernatant was again filtered (0.22 Am, Milli-
pore) and this filtrate was injected in the HPLC
column (100 Al) (Section 2.1.4).
2.3. Statistics
The in vitro experiments were conducted in tripli-
cate. Results of the growth curves and metabolite
concentrations are given by the mean and the 95%
Table 1
Applied packaging configurations and packaging films in order to obtain equilibrium modified atmosphere packages for fresh-cut produce at
7 jC
Type of vegetable Fill
weight
(kg)
Package
dimensions
(length�width)a
(cm2)
Required
oxygen
transmission rate
(ml O2/(m2 24 h atm))b
Applied
oxygen
transmission rate
(ml O2/(m2 24 h atm))
Bell peppers
(mixed, shredded)
(0.4� 1 cm)
0.15 19� 15 2838 2897F 471
Celeriac (grated) 0.15 19� 15 3337 3530F 286
Chicory endives
(0.5 cm)
0.15 19� 15 3400 3704F 574
Lettuce
(mixed, shredded)
0.25 20� 23.5 2270 2270F 312
a Single-sided.b Calculated based on a mathematical model (Jacxsens et al., 2000) in order to store the EMA packages at 7 jC.
L. Jacxsens et al. / International Journal of Food Microbiology 83 (2003) 263–280 267

confidence interval. The parameters of the Baranyi
model were estimated by SPSS 9.0 for Windows,
applying the Levenberg–Maranquardt algorithm and
minimising the residual sum of squared errors of the
biomass and optimising R2 towards 1. Each in vivo
storage experiment was conducted in triplicate. The
enumeration of the spoilage microorganisms as well as
the HPLC analysis, the headspace gas composition and
the pH are given by the mean and 95% confidence
interval. The mean and the 95% confidence interval of
the scores of the individual sensory properties were
calculated.
3. Results and discussion
3.1. In vitro growth of spoilage microorganisms,
metabolite production/sugar consumption
3.1.1. In vitro growth of spoilage microorganisms on
lettuce-juice-agar
Gram-negative microorganisms, isolated from the
mixed lettuce on the indicated end of shelf life, were
respectively Pantoea agglomerans (PR1), Rahnella
aquatilis (PR2) and Pseudomonas fluorescens (PR3).
The isolated yeasts were respectively Candida humi-
cola (PR6) and Cryptococcus laurentii (PR7). Growth
characteristics of the microorganisms PR1 until PR7
are summarised in Table 2. The gas composition
stayed stable until the end of the growth curve (sta-
tionary phase) when the O2 concentration started to
decrease. The lag phases of the Gram-negative micro-
organisms are not significantly different from each
other. C. laurentii had a longer lag phase compared to
Candida spp. and both lactic acid bacteria. The
maximum specific growth rate of C. humicola is
significantly lower than the one of P. agglomerans
and C. laurentii. Magnuson et al. (1990) reported a
Table 2
Growth characteristics of spoilage microorganisms of fresh-cut produce on lettuce-juice-agar, stored under 3% O2/2–5% CO2 (balanced by N2)
at 7 jC: lag phase k (h), maximum specific growth rate lmax (1/h), initial count N0 (log CFU/cm2) and maximum population density Nmax (log
CFU/cm2) (F 95% confidence interval), estimated via the Baranyi model
Spoilage microorganism k (h) lmax (1/h) N0 (log CFU/cm2) Nmax (log CFU/cm2) R2
Pantoea agglomerans 47.5 (32.3–62.6) 0.066 (0.047–0.085) 4.25 (3.88–4.61) 8.47 (8.12–8.82) 0.982
Rahnella aquatilis 48.7 (25.0–72.4) 0.054 (0.030–0.079) 4.59 (4.18–5.00) 8.22 (7.77–8.67) 0.969
Pseudomonas fluorescens 45.7 (28.5–62.9) 0.068 (0.043–0.093) 3.85 (3.44–4.26) 7.84 (7.36–8.31) 0.976
Leuconostoc gasicomitatum 1.5 (–35.5–38.5) 0.042 (0.029–0.055) 2.24 (1.46–3.02) 8.02 (7.37–8.67) 0.967
Lactobacillus brevis 13.7 (–12.2–39.6) 0.055 (0.040–0.070) 2.30 (1.57–3.03) 8.23 (7.77–8.70) 0.975
Candida humicola 15.4 (–8.3–39.2) 0.038 (0.030–0.045) 1.87 (1.48–2.27) 7.21 (6.85–7.56) 0.988
Cryptococcus laurentii 73.8 (61.0–86.6) 0.067 (0.050–0.085) 2.03 (1.72–2.35) 6.85 (6.50–7.20) 0.980
Table 3
In vitro acid production (mg/ml lettuce-juice-agarF 95% confi-
dence interval) of Pantoea agglomerans and Rahnella aquatilis on
lettuce-juice-agar, stored under 3% O2/2–5% CO2 (balanced by N2)
at 7 jC
Rahnella aquatilis
Time (h) Number of
microorganisms
(log CFU/cm2)
Succinate
(mg/ml)
0 4.59 – a
133.3 7.82 –
138.8 7.97 0.196
(0.100–0.292)
162.1 8.14 0.466
(0.272–0.660)
186.3 8.19 0.333
(0.299–0.367)
Qualitative detection of adipic acid and propionic acid after 138.8 h
Pantoea agglomerans
Time (h) Number of
microorganisms
(log CFU/cm2)
Succinate
(mg/ml)
Acetic acid
(mg/ml)
0 4.25 – –
135.5 8.38 – –
144.5 8.36 0.607
(0.466–0.748)
0.605
(0.482–0.728)
160.5 8.43 0.604
(0.370–0.838)
0.622
(0.455–0.789)
167.5 8.44 0.828
(0.738–0.918)
0.835
(0.683–0.987)
Qualitative detection of adipic acid and propionic acid after 144.5 h
a No detection of the metabolites.
L. Jacxsens et al. / International Journal of Food Microbiology 83 (2003) 263–280268

lower lmax of yeasts compared to bacteria on lettuce.
Bennik et al. (1998) published for R. aquatilis and P.
fluorescens a lmax of 0.13/h and 0.11/h, respectively,
on BHI agar under 1.5% O2 and 5% CO2 at 8 jC.These values are the double of the values summarised
in Table 2. A possible explanation is that the BHI agar
is a richer growth medium compared to the applied
lettuce-juice-agar for the microorganisms. However,
the composition of the lettuce-juice-agar is more
similar to the composition of minimally processed
vegetables. Also the temperature is slightly higher,
which can also provoke an increase of the growth rate.
The applied O2 concentration is as well different but
the decreased O2 concentration has no inhibiting
effect on the growth in these ranges (Bennik et al.,
1995, 1998).
3.1.2. In vitro production of metabolites/consumption
of sugars by spoilage microorganisms
No metabolite production was detected by P.
fluorescens. This bacterium shows no fermentative
character, in contrast to the Enterobacteriaceae and the
lactic acid bacteria (ICMSF, 1996). In the stationary
phase, the O2 concentration dropped towards 0% and
from that moment, acetic acid and succinate were
developed by P. agglomerans and only succinate by
R. aquatilis (Table 3). These Enterobacteriaceae are
able to ferment sugars to acids under anaerobic con-
ditions (ICMSF, 1996). Also adipic acid and propionic
acid were detected, but no quantification was possible.
The metabolites, produced by L. gasicomitatum and L.
brevis, are different from the ones produced by the
Enterobacteriaceae and are produced earlier in the
growth curve (late exponential phase) (Table 4).
Lactic acid bacteria are micro-aerophilic and will
grow faster under the low O2 concentrations (ICMSF,
1996). L. brevis produced more lactic acid and also
ethanol compared to L. gasicomitatum. Both lactic
acid bacteria are heterofermentative and next to lactic
acid, also acetic acid and ethanol was produced
(ICMSF, 1996; Bjorkroth et al., 2000).
The yeasts C. humicola and C. laurentii produced
no detectable nonvolatile compounds during the in
vitro growth curve analysis. Fleet (1992) reported that
some species of Cryptococcus and Candida, but also
Rhodotorula spp. and Pichia spp., are able to con-
Table 4
In vitro metabolite production (mg/mlF 95% confidence interval) of Leuconostoc gasicomitatum and Lactobacillus brevis on lettuce-juice-agar,
stored under 3% O2/2–5% CO2 (balanced by N2) at 7 jC
Leuconostoc gasicomitatum
Time (h) Number of
microorganisms
(log CFU/cm2)
Lactic acid (mg/ml) Acetic acid (mg/ml)
0 2.24 –a –
133.0 7.18 – –
138.0 7.30 0.185 (� 0.036–0.406) 0.184 (0.045–0.323)
161.5 7.69 0.602 (0.322–0.882) 0.495 (0.264–0.726)
210.0 7.97 2.466 (2.261–2.671) 2.175 (1.996–2.354)
Lactobacillus brevis
Time (h) Number of
microorganisms
(log CFU/cm2)
Lactic acid (mg/ml) Acetic acid (mg/ml) Ethanol (mg/ml)
0 2.30 – – –
70.0 5.37 – – –
86.5 6.18 0.063 (0.049–0.078) 0.037 (� 0.016–0.090) –
120.0 7.49 1.071 (1.065–1.077) 0.304 (0.245–0.363) –
138.0 7.89 1.643 (1.268–2.018) 0.613 (0.397–0.829) –
185.0 8.20 3.211 (2.918–3.504) 1.764 (1.154–2.374) –
210.0 8.22 4.428 (3.881–4.975) 2.207 (1.975–2.439) 0.246 (� 0.044–0.536)
a No detection of the metabolites.
L. Jacxsens et al. / International Journal of Food Microbiology 83 (2003) 263–280 269

sume sugars under aerobic conditions, but not under
the anoxic conditions, which were created at the end
of the growth curves. However, most yeasts are able
to ferment sugars under facultative anaerobic condi-
tions accompanied with the release of CO2, ethanol,
acids and volatile esters (Fleet, 1992; ICMSF, 1996).
Initially, oligosaccharides, which could be assimi-
lated by the inoculated microorganisms as a function
of their needs, were present in the lettuce-juice-agar.
The detected oligosaccharides could be stachyose (a
tetrasaccharide existing out of 2 U galactose, 1 U
glucose and 1 U fructose). In the case of R. aquatilis
(Fig. 1), oligosaccharides were converted at the begin-
ning of the exponential phase to glucose and fructose
(decrease in concentration of oligosaccharides and
slight increase in concentration of glucose and fruc-
tose). At the end of the exponential phase and during
the stationary phase, the concentration of oligosac-
charides decreased again, but this was accompanied
with a sharp decrease in the concentration of fructose
and glucose. At that moment, the population density
and the consumption of nutrients were high and
monosaccharides, formed from the hydrolysis of the
oligosaccharides, were immediately fermented with
the production of acids as a consequence (Table 3).
The sucrose concentration stayed constant while the
concentration of citric acid changed during the time.
This pattern in the evolution of the concentration of
sugars, citric acid and oligosaccharides was as well
found for P. agglomerans, although there was no
decrease in the concentration of the oligosaccharides
at the beginning of the exponential phase (data not
shown).
Fig. 2 illustrates this evolution for the lettuce-juice-
agar, inoculated with L. gasicomitatum. Both the
glucose and the sucrose concentration decreased at
the beginning of the stationary phase and evolved
towards zero at the end of this phase. At that moment,
also the concentration of fructose, oligosaccharides
and citric acid decreased. Out of the fermentable
sugars, lactic acid, acetic acid and ethanol were
produced (Table 4) (ICMSF, 1996; Batt, 2000). These
changes were as well found with the growth of L.
brevis (data not shown). Bjorkroth et al. (2000)
published that out of sucrose slime was produced by
L. gasicomitatum. Carlin et al. (1989) detected a
decrease in the sucrose concentration of 55% in
packaged, grated carrots after 14 days storage at 10
Fig. 1. Evolution of concentration (F 95% confidence interval) of sugars ((n) glucose, (E) sucrose, (.) fructose, (x) oligosaccharides),
concentration of citric acid (� ), growth curve (5) and estimated growth curve via Baranyi model (—) on the lettuce-juice-agar, inoculated with
R. aquatilis, stored under 3% O2 and 2–5% CO2 (balanced by N2) at 7 jC. Dashed line indicates the begin of the exponential phase, full line
indicates the end of the exponential phase.
L. Jacxsens et al. / International Journal of Food Microbiology 83 (2003) 263–280270

jC. All Gram-positive bacteria were identified as L.
mesenteroides. A decrease in citric acid can be due to
the breakdown to diacetyl by lactic acid bacteria
(Bozogen and Yurdugul, 2000).
Changes in sugar concentrations were not found
for the yeasts and P. fluorescens, possibly because no
fermentative character could be established for these
strains.
3.2. In vivo growth of spoilage microorganisms and
their metabolite production
3.2.1. Headspace gas composition
The gas composition in packages from BOPP film
with mixed lettuce changed fast towards anoxic con-
ditions (day 3). The film is not sufficiently permeable
to balance the produce respiration by diffusion of O2
(Exama et al., 1993). The most difficult task at this
moment in the technology of minimally processed
vegetables is to reach the optimal EMA conditions
inside the packages. The main problem is that only a
few packaging materials on the market are permeable
enough to compensate the respiration of fresh-cut
vegetables. Most films do not result in optimal O2
and CO2 conditions, especially when the produce has
a high respiration rate (Ahvenainen, 2000; Lange,
2000). In the permeable packaging film, the O2 level
dropped towards 1% but stayed constant during fur-
ther storage. The minimal O2 concentration for lettuce
is reported as 0.5% (Beaudry, 2000). The gas compo-
sition stayed stable inside the packages filled with
shredded chicory endive and grated celeriac, but
changed towards anoxic conditions at the end of the
shelf life for the mixed bell peppers (days 6–7). The
shift from a steady state to an anoxic atmosphere
occurred when the microbial contamination became
high on the minimally processed vegetables (Figs. 3–
5). In the case of chicory endives and grated celeriac,
an increase of the O2 concentration was measured,
respectively from days 9 and 7, probably because of a
decreased vitality and respiration of the plant tissue at
the end of the storage period (Kays, 1991).
Carbon dioxide could not accumulate to levels
above 10% due to the high permeability of the applied
packaging films. However, in the BOPP packaging
film, concentrations were build up until 20% CO2 at
Fig. 2. Evolution of concentration (F 95% confidence interval) of sugars ((n) glucose, (E) sucrose, (.) fructose, (x) oligosaccharides),
concentration of citric acid (� ), growth curve (5) and estimated growth curve via Baranyi model (—) on the lettuce-juice-agar, inoculated with
L. gasicomitatum, stored under 3% O2 and 2–5% CO2 (balanced by N2) at 7 jC. Full line indicates the end of the exponential phase.
L. Jacxsens et al. / International Journal of Food Microbiology 83 (2003) 263–280 271

day 6, because of the lower permeability of this type
of packaging film (Exama et al., 1993; Lange, 2000).
3.2.2. Microbial spoilage of the EMA packaged
minimally processed vegetables
The initial contamination of TPC was compro-
mised between the goal and the tolerance criteria,
proposed by CNERNA-CNRS (1996) and Debevere
(1996), for fresh-cut produce on the production day
(105–106 CFU/g TPC) except for the mixed bell
peppers (Fig. 3). Consequently, the mixed bell pep-
pers reached the limiting criterium of 108 CFU/g of
TPC very fast (between days 3 and 4), followed by the
grated celeriac (between days 5 and 6). Shredded
chicory endives contained only after day 8 more than
108 CFU/g TPC. A difference was found between the
outgrowth on the mixed lettuce, stored in the two
atmospheres: the accumulation of CO2 inside BOPP
packages and also the created anoxic conditions
prevented a fast outgrowth of the TPC (Church and
Parsons, 1995). The experiment was interrupted at day
6 because of unacceptable sensory quality. The EMA
packaged lettuce reached the limit of TPC at day 6
and no further outgrowth was detected (Fig. 3).
The goal and tolerance limit for lactic acid bacteria
of fresh-cut produce at the day of production (LAB) is
set between 103 and 104 CFU/g (Debevere, 1996).
Apparently, some problems existed in reaching these
limits for the industrially prepared mixed lettuce and
mixed bell peppers (Fig. 4). High initial counts of
lactic acid bacteria on minimally processed vegetables
indicate a bad disinfection of cutting machines, a
temperature abuse or a too long storage period of the
product (Brocklehurst et al., 1987; Dijk et al., 1999).
The growth of the LAB on the shredded chicory
endives was slow. Grated celeriac, on the other hand,
showed a fast growth pattern, comparable with the
growth of LAB on grated carrots (both are root
vegetables, containing a high concentration of sugars)
(Carlin et al., 1989; Kakiomenou et al., 1996; Jacxsens
et al., 1999a). The fastest growth was detected on the
mixed bell peppers, where the limit of 107 CFU/g was
exceeded after 3 days of storage at 7 jC. The limit of
107 CFU/g for LAB on fresh-cut vegetables is only
valid when at the same time organoleptical tests show
that the sensory quality is still acceptable. The low
pervasive character of the metabolites of the LAB,
compared to the ones produced by Gram-negative
microorganisms, allows often higher amounts of
LAB (until 108 CFU/g) (Carlin et al., 1989; Kakiome-
nou et al., 1996).
Also for yeasts, an initial count between 103 and
104 CFU/g is defined as goal and tolerance limit,
respectively, at the day of production (Debevere,
1996). The end of the microbiological shelf life is
reached, when the limit of 105 CFU/g is exceeded.
Fig. 3. Growth of total psychrotrophic count (log CFU/gF 95% confidence interval) during storage at 7 jC under equilibrium modified
atmosphere (EMA) ((n) grated celeriac, (.) mixed lettuce, (E) shredded chicory endive, (w) mixed bell peppers) or in packaged in BOPP film
((o) mixed lettuce). Full line indicates the shelf life limiting number of 108 CFU/g TPC.
L. Jacxsens et al. / International Journal of Food Microbiology 83 (2003) 263–280272

Above this number, a negative effect on the sensory
properties can occur, characterised by gas production,
off-flavour development and visible colony formation
(Fleet, 1992). Yeasts exceeded the limit for mixed
lettuce packaged under EMA on day 6, grated celeriac
on day 5, mixed bell peppers on day 7 (Fig. 5). No
important outgrowth was enumerated on the mixed
lettuce, packaged in the BOPP film, due to the
unfavourable CO2 concentration for yeasts (Church
and Parsons, 1995). Previous work demonstrated as
well the slow growth of yeasts on shredded chicory
endives at 7 jC under EMA (Jacxsens et al., 1999a)
but not in Jacxsens et al. (2001) at 4 jC. At that
temperature, no outgrowth of competitive LAB was
noticed, which was the case at 7 jC (Fig. 4; Jacxsens
et al., 1999a). At 4 jC, grated celeriac was rejected
after 3 days storage under EMA because of too high
concentrations of yeasts (Jacxsens et al., 2001).
3.2.3. Evolution of type of spoilage microorganisms
as a function of storage time
P. fluorescens was initially the most dominating
microorganism, and remained important during the
further storage of mixed lettuce, stored under EMA or
Fig. 5. Growth of yeasts (log CFU/gF 95% confidence interval) during storage at 7 jC under equilibrium modified atmosphere (EMA) ((n)
grated celeriac, (.) mixed lettuce, (E) shredded chicory endive, (w) mixed bell peppers) or in packaged in BOPP film ((o) mixed lettuce). Full
line indicates the shelf life limiting number of yeasts of 105 CFU/g.
Fig. 4. Growth of lactic acid bacteria (log CFU/gF 95% confidence interval) during storage at 7jC under equilibrium modified atmosphere
(EMA) ((n) grated celeriac, (.) mixed lettuce, (E) shredded chicory endive, (w) mixed bell peppers) or in packaged in BOPP film ((o) mixed
lettuce). Full line indicates the shelf life limiting number of LAB of 107 CFU/g. Dashed line indicates the shelf life limiting number of LAB if no
detrimental sensory properties are detected.
L. Jacxsens et al. / International Journal of Food Microbiology 83 (2003) 263–280 273

anoxic conditions at 7 jC (Table 5). No difference
was found between the two atmospheres: in anoxic
conditions, a slightly lower percentage P. fluorescens
was detected in favour of facultative anaerobic P.
agglomerans and R. aquatilis.
In the case of grated celeriac, the Gram-positive
microorganisms, and more specifically, Lactobacillus
plantarum, dominated the spoilage flora. They counted
about 70% of the total flora and this number remained
constant during storage. R. aquatilis became important
at the end of the storage period, with 32% at day 13.
Next to this, Pseudomonas spp. are frequently isola-
ted, commonly associated with the spoilage of celery
(Robbs et al., 1996a,b). Only one type of yeast was
identified on the grated celeriac, Candida curvata.
These yeasts are responsible for a softening of the
product as they are able to produce pectinolytic
enzymes (Fleet, 1992).
Gram-negative Pseudomonas spp. dominated the
spoilage flora of shredded chicory endives. The lactic
acid bacteria L. plantarum and yeasts Cryptococcus
humicola were identified as well. The microbial flora,
present on the shredded chicory endives, is rather
uniform. Bennik et al. (1998) detected a shift from P.
viridiflava to P. fluorescens after 7 days storage at 8
jC under 1.5% O2–20% CO2–78.5% N2 on shredded
chicory endives.
No important role of Gram-negative bacteria was
found in the spoilage of mixed bell peppers, only P.
agglomerans became important at the end of the
storage period (days 7 and 10). They are able to
produce lactic acid under 10% O2 (Huber, 2000).
Lactic acid bacteria were the most important spoilers
(80% of the total flora). L. brevis has been identified
as dominating the lactic acid bacteria, capable of
producing lactic acid in a heterofermentative way
(Teixeira, 2000). An almost uniform yeast flora was
detected on the mixed bell peppers consisting out of
Kloeckera spp.
3.2.4. Change in pH during storage
The pH of the shredded chicory endives stayed
stable around 6, during the whole storage period of 13
days. The same pH was measured for the grated
celeriac, until at day 13, the pH of the celeriac then
dropped from 6.0 to 5.5 (outgrowth of LAB, Fig. 4).
The pH of the mixed bell peppers, on the other hand,
decreased from pH 5.0 at day 6 until pH 4.0 at day 10.
This pH drop can be explained by the outgrowth of
LAB, which exceeded an amount of 107 CFU/g
between days 3 and 4 on the mixed bell peppers.
The pH of the mixed lettuce increased during storage
from 5.9 until maximum 6.2. The pH of the lettuce,
packaged under anoxic conditions, increased slightly
faster. This pH increase is typical for vegetables in
which Gram-negative microorganisms play an impor-
tant role in the spoilage. King et al. (1991) measured a
pH increase of minimally processed lettuce from 5.8
until 6.3 in 24 days storage at 2 jC. Also Hao et al.
(1999) found an increase in the pH of broccoli florets
stored at 4 jC in low O2 (1–3%). This pH increase
can result from the breakdown of proteins with the
release of basic compounds as a result. Lettuces
contain in average 1.4 g/100 g proteins (Nubel,
1999). This breakdown is apparently more important
than the production of acids during spoilage (Section
3.2.6).
3.2.5. Comparison of in vitro and in vivo growth of
spoilage microorganisms on mixed lettuce
The R2 of the Baranyi equation for the LAB was
lower compared to the other groups of microorgan-
Table 5
Predominant Gram-negative spoilage microorganisms (expressed in % suspected colonies on the selective media) on mixed lettuce, stored under
equilibrium modified atmosphere (EMA) or anoxic conditions (BOPP film) at 7 jC
Type of microorganism Day 0 Day 3 Day 6 Day 10
EMA Anoxic EMA Anoxic EMA
Pantoea agglomeransa 27.3 16.1 19.7 20.5 18.9 11.3
Rahnella aquatilisa 26.7 20.8 17.5 15.2 28.5 20.8
Pseudomonas fluorescensa 42.2 57.6 51.3 44.3 39.7 55.4
a Isolated from PCA plates (% is balanced by non identified colonies).
L. Jacxsens et al. / International Journal of Food Microbiology 83 (2003) 263–280274

isms (Table 6) because no pronounced outgrowth of
LAB was detected on the mixed lettuce. Comparing
Tables 2 and 6, it can be noticed that the lag phase of
the Gram-negative microorganisms, counted on TPC,
showed a trend to be slightly longer during the in vivo
experiment than in the in vitro experiment, although
not significant, due to large confidence intervals of the
estimated lag phases. The same result was found for
the LAB, where the difference was more pronounced
but still not significant. The microorganisms on the
vegetables started to grow slightly later compared to
the ones on the lettuce-juice-agar. This result could be
expected because the cell wall of the vegetables forms
a barrier and this rigid structure is not present any-
more in the case of the in vitro experiments. Only
pectinolytic microorganisms, such as Pseudomonas
spp., Erwinia spp., and yeasts, such as Candida spp.,
can develop fast on vegetables. Once these micro-
organisms have broken the barrier of the cell wall,
also the other spoilage causing microorganisms have
enough nutrients available to grow (Robbs et al.,
1996a,b; Liao et al., 1997; Heard, 2000). Neverthe-
less, it can be concluded that the applied simulation
medium (lettuce-juice-agar) was a good substitute for
fresh-cut produce. Growth rates were also very similar
between the in vitro and in vivo experiments. Bennik
et al. (1998) found a lmax for Enterobacteriaceae and
Pseudomonas spp. of 0.059/h and 0.053/h, respec-
tively, on shredded chicory endive, stored under 1.5%
O2–20% CO2 (balance N2) at 8 jC. This was close tothe lmax of the TPC (Table 6) and the Gram-negative
microorganisms (Table 2). The yeasts have a lower
growth rate compared to bacteria, which was also
demonstrated by Magnuson et al. (1990).
3.2.6. Production of metabolites/consumption of
sugars during storage of fresh-cut vegetables
The pattern of the consumption of sugars and
production of metabolites during the storage of grated
celeriac is demonstrated in Fig. 6. Fast outgrowth of
LAB and yeasts in the first 3 days of storage (Figs. 4
and 5) was accompanied with the consumption of
glucose, fructose, sucrose and conversion of oligo-
saccharides into these molecules. Oligosaccharides
are faster converted into sucrose, fructose and glu-
cose from day 3 as an increase is detected in their
concentration. The oligosaccharides, on the other
hand, are produced from the enzymatic breakdown
(enzymes from the plant tissue and microorganisms)
of polysaccharides such as pectines (from day 4). The
produced sugars are consumed faster by microorgan-
isms from day 7 than they are produced. From day
10, the microbial contamination is high (Figs. 3–5),
the available sugars are consumed in a high rate and
the conversion of polysaccharides into oligosacchar-
ides is slowed down, possibly due to the lower
general metabolic activity of the plant tissue at the
end of the storage period. Lactic acid and acetic acid
could be quantified from day 5. Concentrations of
lactic acid and acetic acid increased respectively from
0.046F 0.012 mg/ml lettuce juice at day 5 (>107
CFU LAB/g) until 5.660F 0.016 mg/ml at day 13
(108 CFU LAB/g), and 0.189F 0.047 mg/ml at day 5
until 1.283F 0.655 mg/ml at day 13. The chemical
composition of grated celeriac is comparable to
grated carrots. Spoilage of grated carrots, under
EMA systems, is characterised by the occurrence of
an acid taste and odour due to the production of lactic
acid and/or acetic acid accompanied with a slime
Table 6
Growth characteristics of spoilage microorganisms (total psychrotrophic count (TPC), lactic acid bacteria (LAB) and yeasts) on mixed lettuce,
stored under equilibrium modified atmosphere at 7 jC: lag phase k (h), maximum specific growth rate lmax (1/h), initial count N0 (log CFU/g)
and maximum population density Nmax (log CFU/g) (F 95% confidence interval), estimated via Baranyi model
Microorganism k (h) lmax (1/h) N0
(log CFU/g)
Nmax
(log CFU/g)
N0
(log CFU/cm2)aNmax
(log CFU/cm2)aR2
TPC 68.9
(50.7–87.1)
0.057
(0.03–0.08)
5.74
(5.43–6.05)
7.99
(7.79–8.18)
3.99
(3.68–4.30)
6.24
(6.04–6.43)
0.987
LAB 56.2
(14.1–98.4)
0.066
(–0.06–0.19)
4.53
(3.75–5.32)
6.59
(6.18–7.00)
2.78
(2.00–3.57)
4.84
(4.43–5.25)
0.939
Yeasts 56.2
(33.6–78.9)
0.043
(0.02–0.07)
3.83
(3.53–4.13)
6.20
(5.98–6.41)
2.08
(1.78–2.38)
4.45
(4.23–4.66)
0.992
a N0 and Nmax were converted to CFU/cm2 taking into consideration that 1 g mixed lettuce is c 56 cm2 lettuce, to make comparison with
Table 2 possible.
L. Jacxsens et al. / International Journal of Food Microbiology 83 (2003) 263–280 275
production and loss of texture (Carlin et al., 1989;
Jacxsens et al., 1999a).
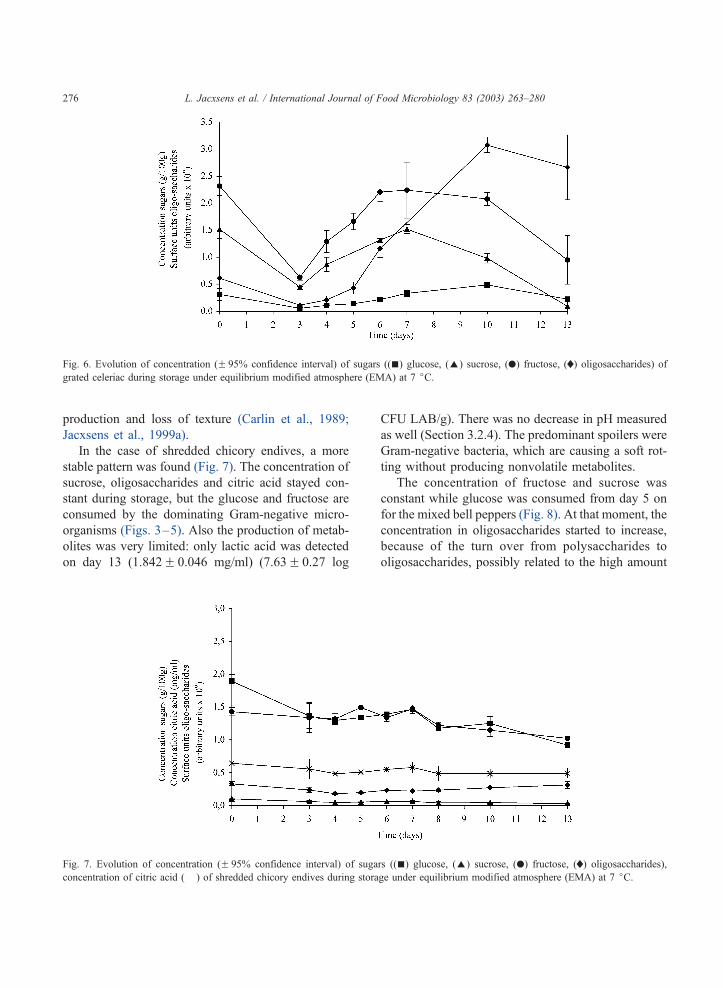
In the case of shredded chicory endives, a more
stable pattern was found (Fig. 7). The concentration of
sucrose, oligosaccharides and citric acid stayed con-
stant during storage, but the glucose and fructose are
consumed by the dominating Gram-negative micro-
organisms (Figs. 3–5). Also the production of metab-
olites was very limited: only lactic acid was detected
on day 13 (1.842F 0.046 mg/ml) (7.63F 0.27 log
CFU LAB/g). There was no decrease in pH measured
as well (Section 3.2.4). The predominant spoilers were
Gram-negative bacteria, which are causing a soft rot-
ting without producing nonvolatile metabolites.
The concentration of fructose and sucrose was
constant while glucose was consumed from day 5 on
for the mixed bell peppers (Fig. 8). At that moment, the
concentration in oligosaccharides started to increase,
because of the turn over from polysaccharides to
oligosaccharides, possibly related to the high amount
Fig. 6. Evolution of concentration (F 95% confidence interval) of sugars ((n) glucose, (E) sucrose, (.) fructose, (x) oligosaccharides) ofgrated celeriac during storage under equilibrium modified atmosphere (EMA) at 7 jC.
Fig. 7. Evolution of concentration (F 95% confidence interval) of sugars ((n) glucose, (E) sucrose, (.) fructose, (x) oligosaccharides),
concentration of citric acid (� ) of shredded chicory endives during storage under equilibrium modified atmosphere (EMA) at 7 jC.
L. Jacxsens et al. / International Journal of Food Microbiology 83 (2003) 263–280276

of microorganisms and autolytic activity of the plant
tissue. The microbial spoilage of the mixed bell
peppers was going very fast and was dominated by
LAB and yeasts. Consequently, a fast and intense
metabolite production was measured. Acetic acid was
detectable from day 5 (0.307F 0.276 mg/ml lettuce
juice) (7.32F 0.41 log CFU LAB/g and 5.19F 0.49
log CFU yeasts/g) until day 10 (3.602F 0.417 mg/ml)
(7.96F 0.19 log CFU LAB/g and 6.43F 0.21 log CFU
yeasts/g). Lactic acid was formed 1 day later, at day 6
(1.192F 0.237 mg/ml) (7.69F 0.01 log CFU LAB/g
and 5.16F 0.02 log CFU yeasts/g) until day 10
(2.421F 0.354mg/ml). However, propionic acid could
also be detected from day 7 (0.073F 0.035 mg/ml)
until day 10 (0.349F 0.097 mg/ml). The acids are
probably produced by L. brevis, the dominating LAB
(3.2.3.). Again, the breakdown of citric acid can be
attributed to the production of diacetyl, producing an
off-flavour, by LAB (Bozogen and Yurdugul, 2000).
The mixed lettuce, packaged under EMA condi-
tions, showed no metabolite production during the
whole storage period at 7 jC (10 days). The dominating
microorganisms were the same as for the shredded
chicory endives (Gram-negative bacteria) although the
yeasts were the limiting microorganisms (Figs. 3 and
5). Because no acid production was detected, the pH of
the mixed lettuce could increase (Section 3.2.4). Also,
the concentration of sugars remained constant over the
storage period. Only sucrose was consumed after 5
days of storage (data not shown), at that moment, a high
amount of TPC and yeasts was counted (Figs. 3 and 5).
However, for the mixed lettuce, stored in the com-
mercial BOPP film, metabolite production was de-
tected. This was probably more related to the anaero-
bic respiration (anoxic conditions inside the packages)
than to growth of microorganisms (Figs. 3–5), because
only ethanol was detected. After 3 days of storage at 7
jC, the packages became anoxic (Fig. 3) (0% O2–
13.8% CO2) and the ethanol production started
(0.045F 0.063 mg/ml) until day 6 (0.235F0.018 mg/
ml). No change in sugars (fructose, glucose, sucrose
and oligosaccharides) was detected during the 6 days of
storage of the mixed lettuce in the BOPP type of
packaging film. Lopez-Galvez et al. (1997) related
the development of off-flavours, judged by a trained
taste panel, to the production of ethanol and acetalde-
hyde in the lettuce tissue when stored under 0.2–1.5%
O2 and 5–30% CO2 at 5 jC, conditions which are
comparable to those created in the BOPP packages.
3.2.7. Sensory quality
The evolution of the sensory properties of the mixed
lettuce differed for the specific lettuce components:
endive and lollo bionta suffered faster from enzymatic
discolouration and soft rotting compared to the other
components (Artes and Martinez, 1996). At day 6, the
Fig. 8. Evolution of concentration (F 95% confidence interval) of sugars ((n) glucose, (E) sucrose, (.) fructose, (x) oligosaccharides),
concentration of citric acid (�) of mixed bell peppers during storage under equilibrium modified atmosphere (EMA) at 7 jC.
L. Jacxsens et al. / International Journal of Food Microbiology 83 (2003) 263–280 277

mixed lettuce stored under EMA conditions was found
to be unacceptable by the trained panel. The main
property was the odour, which was described as
‘‘musty’’. The taste followed the same pattern as the
odour. This musty odour and taste was probably
provoked by production of volatile compounds by
plant metabolism and/or microbial metabolism. How-
ever, no nonvolatile compounds were detected via
HPLC analysis (Section 3.2.6).
The mixed lettuce, stored in the BOPP film, was
becoming unconsumable on day 4. Again, the odour
and the taste were the limiting properties, which were
described as alcoholic and fermented. In the anoxic
conditions, a high concentration of ethanol was de-
tected, because of the anaerobic respiration (Kays,
1991; Peppelenbos, 1996).
The mixed bell peppers are rejected at day 6 based
on their organoleptical properties (acid odour and taste)
but also a massive water loss was found, and conse-
quently, a loss of the crispness (texture). Shredded
endive, on the other hand, is very sensitive for enzy-
matic discolouration (Jacxsens et al., 2001) and the
colour was the limiting sensory property at day 6. Taste
and odour became a problem at day 13, when the
microbial contamination was high (Figs. 3–5) and
lactic acid was detected (Section 3.2.6). Also the grated
celeriac is very sensitive to enzymatic browning (Jacx-
sens et al., 2001) and it was rejected based on the colour
at day 5, while the organoleptical properties were
unacceptable from day 6.
3.2.8. Microbial growth–metabolite production–
sensory quality interaction
It was not possible to define a clear relation
between the growth of microorganisms/evaluation of
the organoleptical properties/metabolite production
for the tested leafy vegetables packaged under EMA
(Table 7). Their microbial spoilage was dominated by
Gram-negative microorganisms, not producing non-
volatile compounds in measurable concentrations for
analysis by HPLC. Their shelf life was limited by the
visual properties (enzymatic browning) or volatile
compounds. It indicates that the sensory approach to
determine the shelf life of leafy vegetables, next to
microbial analysis, is the best. An agreement could be
found between the development of the off-flavours
inside the BOPP packages, filled with mixed lettuce,
and the production of ethanol, inherent to the anaero-
bic respiration of plant tissue.
Sugar-rich product, such as the mixed bell peppers
and grated celeriac, showed a different type of spoil-
age: dominated by lactic acid bacteria and yeasts.
From the moment that acids were detectable by the
HPLC analysis, the trained sensory panel rejected the
minimally processed vegetables, based on their acid
taste and odour. In these cases, metabolic studies can
predict the shelf life period.
4. Conclusions
The applied lettuce-juice-agar was found to be a
good simulation medium for fresh-cut produce. Esti-
mated lag phase and growth rate both in vitro and in
vivo corresponded well.
The applied microbiological criteria for the most
important spoilage-causing microorganisms (>108
CFU/g for TPC, >105 CFU/g yeasts, >107–108
CFU/g LAB) corresponded well with the detectable
changes in sensory properties and measurable metab-
Table 7
Overview of the shelf life (days) of packaged fresh-cut vegetables, stored at 7 jC, based on the microbiological quality (exceeding limiting
number of total psychrotrophic count (TPC), lactic acid bacteria (LAB) or yeasts (Y)), the sensory quality and production of nonvolatile
metabolites
Type of fresh-cut
vegetable
Shelf life based
on microbial count (days)
Shelf life based on
sensory quality (days)
Beginning of metabolite
production (days)
Mixed lettuce (EMA) 6–10 TPC, – a LAB, 6 Y 6 (musty taste and odour, colour) –b
Mixed lettuce (BOPP) – a TPC, – a LAB, – a Y 4 (fermented, alcoholic taste and odour) 3 (ethanol)
Grated celeriac 6 TPC, 5–7 LAB, 4–5 Y 5 (colour), 6 (acid taste and odour) 5 (lactic acid and acetic acid)
Mixed bell peppers 5 TPC, 4–7 LAB, 7 Y 6 (acid taste and odour) 5 (acetic acid), 6 (lactic acid)
Shredded chicory endives 10 TPC, 13 LAB, –a Y 6 (colour), 13 (acid taste and odour) 13 (lactic acid)
a Limit not exceeded.b No metabolite production.
L. Jacxsens et al. / International Journal of Food Microbiology 83 (2003) 263–280278

olite production. This was most obvious when LAB
and yeasts are provoking the spoilage. The limit of
107 CFU/g LAB has always to be evaluated together
with the sensory properties because only after 2–3
days storage at levels between 107 and 108 CFU/g
LAB, detectable amounts of lactic acid and acetic acid
were found and spoilage became notable for the
trained sensory panel.
Spoilage of leafy tissues, containing naturally low
quantities of sugars, is mainly attributed to the pro-
liferation of Gram-negative microorganisms, which
are not producing nonvolatile metabolites. A sensory
approach can be proposed as a fast evaluation of their
shelf life. Sugar-rich produce, on the other hand,
demonstrated a fast and intense growth of LAB and
yeasts. Consequently, metabolic studies can be suffi-
cient to evaluate the freshness of these products. The
obtained results demonstrate as well the necessity of
judging the quality of fresh-cut vegetables not solely
on bacterial counts but also on sensory quality aspects.
Acknowledgements
Authors want to thank Hyplast (Hoogstraten,
Belgium) for supplying the plastic packaging films,
the Laboratory of Food Chemistry and Analysis of
Prof. Dr. Ir. Huyghebaert for the applied HPLC
equipment. Allgro (Sint-Lievens-Houtem, Belgium)
provided the industrially prepared vegetables.
References
Ahvenainen, R., 2000. Minimally processing of fresh produce. In:
Alzamora, S., Tapia, M., Lopez-Malo, A. (Eds.), Minimally
Processed Fruits and Vegetables (Fundamental Aspects and Ap-
plications). Aspen Publication, Maryland, USA, pp. 277–290.
Artes, F., Martinez, J., 1996. Influence of packaging treatments on
the keeping quality of ‘Salinas’ lettuce. Lebensm.-Wiss. Tech-
nol. 29, 664–668.
Babic, I., Hilbert, G., Nguyen-the, C., Guiraud, J., 1992. The yeast
flora of stored ready-to-use carrots and their role in spoilage. Int.
J. Food Sci. Technol. 27, 473–484.
Batt, C., 2000. Lactobacillus/introduction. In: Robinson, R., Batt,
C., Patel, P. (Eds.), Encyclopedia of Food Microbiology. Aca-
demic Press, London, UK, pp. 1134–1136.
Beaudry, R., 1999. Effect of O2 and CO2 partial pressure on se-
lected phenomena affecting fruit and vegetable quality. Post-
harvest Biol. Technol. 15, 293–303.
Beaudry, R., 2000. Responses of horticultural commodities to low
oxygen: limits to the expanded use of modified atmosphere
packaging. HortTechnology 10, 491–500.
Bennik, M., Smid, E., Rombouts, F., Gorris, L., 1995. Growth of
psychrotrophic foodborne pathogens in a solid surface model
system under the influence of carbon dioxide and oxygen. Food
Microbiol. 12, 509–519.
Bennik, M., Vorstman, W., Smid, E., Gorris, L., 1998. The influ-
ence of oxygen and carbon dioxide on the growth of prevalent
Enterobacteriaceae and Pseudomonas species isolated from
fresh and controlled-atmosphere-stored vegetables. Food Micro-
biol. 15, 459–469.
Bjorkroth, K., Geisen, R., Schillinger, U., Weiss, N., De Vos, P.,
Holzapfel, W., Korkeala, H., Vandamme, P., 2000. Character-
ization of Leuconostoc gasicomitatum sp. nov., associated with
spoiled raw tomato-marinated broiler meat strips packaged
under modified-atmosphere conditions. Appl. Environ. Micro-
biol. 66, 3764–3772.
Bolin, H., Huxsoll, C., 1991. Effect of preparation and storage
parameters on quality retention of salad-lettuce. J. Food Sci.
56 (60–62), 67.
Bolin, H., Stafford, A., King, A., Huxsoll, C., 1977. Factors affect-
ing the storage stability of shredded lettuce. J. Food Sci. 42,
1319–1321.
Bozogen, F., Yurdugul, S., 2000. Malolactic fermentation. In: Robin-
son, R., Batt, C., Patel, P. (Eds.), Encyclopedia of Food Micro-
biology, vol. 3. Academic Press, London, UK, pp. 2311–2316.
Brocklehurst, T., Zaman-Wong, C., Lund, B., 1987. A note on the
microbiology of retail packs of prepared salad vegetables. J.
Appl. Bacteriol. 63, 409–415.
Carlin, F., Nguyen-the, C., Cudennec, P., Reich, M., 1989. Micro-
biological spoilage of fresh ready-to-use carrots. Sci. Aliments
9, 371–386.
Church, I., Parsons, A., 1995. Modified atmosphere packaging
technology: a review. J. Sci. Food Agric. 67, 143–152.
CNERNA-CNRS, 1996. Les legumes de 4ieme gamme. In: Jouve,
J.L. (Ed.), La qualite microbiologique des aliments (maıtrise et
criteres). Polytechnica, Paris, France, pp. 68–122.
Debevere, J., 1996. Criteria en praktische methoden voor de bepal-
ing van de houdsbaarheidsdatum in de etikettering. In: Tem-
merman, G., Cremer, C., Thyssen, M., Debevere, J. (Eds.),
Etikettering, houdbaarheid en bewaring (voedingsmiddelen en
recht 2). Die Keure, Brugge, Belgium, pp. 35–64.
Dijk, R., Beumer, R., De Boer, E., Bosboom, M., Brinkman, E.,
Debevere, J., Van Dijk, J., Dijkstra, A., Stegeman, H., 1999.
Microbiologie van voedingsmiddelen: methoden, principes en
criteria. Keesing Noordervliet, Houten, The Netherlands. 464 pp.
Exama, A., Arul, J., Lencki, R., Lee, L., Toupin, C., 1993. Suit-
ability of plastic films for modified atmosphere packaging of
fruits and vegetables. J. Food Sci. 56, 1365–1370.
Fleet, G., 1992. Spoilage yeasts. Crit. Rev. Biotechnol. 12 (1/2),
1–44.
Grijspeerdt, K., Vanrolleghem, P., 1999. Estimating the parameters
of the Baranyi model for bacterial growth. Food Microbiol. 16,
593–605.
L. Jacxsens et al. / International Journal of Food Microbiology 83 (2003) 263–280 279

Hao, Y., Brackett, R., Beuchat, L., Doyle, M., 1999. Microbiologi-
cal quality and production of botulinal toxin in film-packaged
broccoli, carrots and green beans. J. Food Prot. 62, 499–508.
Heard, G., 2000. Microbial safety of ready-to-eat salads and min-
imally processed vegetables and fruits. Food Sci. Technol. To-
day 14, 15–21.
Heimdal, H., Kuhn, B., Poll, L., Larsen, L., 1995. Biochemical
changes and sensory quality of shredded and MA-packaged ice-
berg lettuce. J. Food Sci. 60, 1265–1268, 1276.
Huber, T., 2000. Enterobacter. In: Robinson, R., Batt, C., Patel, P.
(Eds.), Encyclopedia of Food Microbiology, vol. 1. Academic
Press, London, UK, pp. 598–603.
International Commission on Microbiological Specifications for
Foods (ICMSF), 1996. In: Roberts, T., Baird-Parker, A., Tomp-
kin, R. (Eds.), Microorganisms in Foods, vol. 5. Blackie Aca-
demic & Professional, London, UK. 513 pp.
Jacxsens, L., Devlieghere, F., Falcato, P., Debevere, J., 1999a. Be-
haviour of L. monocytogenes and Aeromonas spp. on fresh-cut
produce packaged under equilibrium modified atmosphere. J.
Food Prot. 62, 1128–1135.
Jacxsens, L., Devlieghere, F., Debevere, J., 1999b. Validation of a
systematic approach to design EMA packages for fresh cut pro-
duce. Food Sci. Technol. 32, 425–432.
Jacxsens, L., Devlieghere, F., De Rudder, T., Debevere, J., 2000.
Designing equilibrium modified atmosphere packages for fresh-
cut vegetables subjected to changes in temperature. Food Sci.
Technol. 33, 178–187.
Jacxsens, L., Devlieghere, F., Van der Steen, C., Debevere, J., 2001.
Effect of high oxygen modified atmosphere packaging on mi-
crobial growth and sensory qualities of fresh-cut produce. Int. J.
Food Microbiol. 71, 197–210.
Kader, A., Zagory, D., Kerbel, E., 1989. Modified atmosphere
packaging of fruits and vegetables. Crit. Rev. Food Sci. Nutr.
28, 1–30.
Kakiomenou, K., Tassou, C., Nychas, G., 1996. Microbiological,
physiochemical and organoleptic changes of shredded carrots
stored under modified storage. Int. J. Food Sci. Technol. 31,
359–366.
Kays, S.J., 1991. Postharvest Physiology of Perishable Plant Prod-
ucts. Van Nostrand-Reinhold, New York, USA, p. 532.
King, A., Magnuson, J., Torok, T., Goodman, N., 1991. Microbial
flora and storage quality of partially processed lettuce. J. Food
Sci. 56, 459–461.
Lange, D., 2000. New film technologies for horticultural products.
HortTechnology 10, 487–490.
Liao, C., Sullivan, J., Grady, J., Wong, L., 1997. Biochemical char-
acterization of pectate lyases produced by fluorescent pseudo-
monads associated with spoilage of fresh fruits and vegetables.
J. Appl. Microbiol. 83, 10–16.
Lopez-Galvez, G., Peiser, G., Nie, X., 1997. Quality changes in
packaged salad products during storage. Z. Lebensm.-Unters.
Forsch. 205, 64–72.
Magnuson, J., King, A., Torok, T., 1990. Microflora of partially
processed lettuce. Appl. Environ. Microbiol. 56, 3851–3854.
Mathooko, F., 1996. Regulation of respiratory metabolism in fruits
and vegetables by carbon dioxide. Postharvest Biol. Technol. 9,
247–264.
Nguyen-the, C., Carlin, F., 1994. The microbiology of minimally
processed fresh fruits and vegetables. Crit. Rev. Food Sci. Nutr.
34, 371–401.
Nubel, 1999. Belgische voedingsmiddelentabel, 3rd ed. Nubel,
Brussels, Belgium, pp. 39–44.
Peppelenbos, H., 1996. The use of gas exchange characteristics to
optimize CA storage and MA packaging of fruits and vegeta-
bles. PhD thesis, University of Wageningen. 157 pp.
Robbs, P., Bartz, J., McFie, G., Hodge, N., 1996a. Causes of decay
of fresh-cut celery. J. Food Sci. 61, 444–448.
Robbs, P., Bartz, J., Sargent, G., McFie, G., Hodge, N., 1996b.
Potential inoculum sources for decay of fresh cut celery. J. Food
Sci. 61, 449–452, 455.
Teixeira, P., 2000. Lactobacillus brevis. In: Robinson, R., Batt, C.,
Patel, P. (Eds.), Encyclopedia of Food Microbiology, vol. 2.
Academic Press, London, UK, pp. 1144–1151.
Vanbreuseghem, R., De Vroey, Ch., Tasashio, M., 1978. Guide
pratique de mycologie medicale et veterinaire, vol. 2. Masson,
Paris, France, pp. 241–242.
Varoquaux, P., 2001. Unit operations for fresh-cut produce. Confer-
ence Proceedings of Second International Conference on Fresh-
Cut Produce, 13–14 September 2001. Campden & Chorley-
wood Food Research Association Group, Chipping Campden,
UK.
Watada, A., Qi, L., 1999. Quality of fresh-cut produce. Postharvest
Biol. Technol. 15, 201–205.
Watkins, C., 2000. Responses of horticultural commodities to high
carbon dioxide as related to modified atmosphere packaging.
HortTechnology 10, 501–506.
L. Jacxsens et al. / International Journal of Food Microbiology 83 (2003) 263–280280