Embed Size (px)
Citation preview

MICROBIOLOGICAL METHODS FOR ASSESSING
SOIL QUALITY

MICROBIOLOGICAL
METHODS FOR
ASSESSING SOIL
QUALITY
Edited by
Jaap BloemAlterra,Wageningen,The Netherlands
David W. HopkinsUniversity of Stirling, UK
and
Anna BenedettiIstituto Sperimentale per la Nutrizione delle Piante, Rome, Italy
CABI Publishing

CABI Publishing is a division of CAB International
CABI Publishing CABI Publishing CAB International 875 Massachusetts AvenueWallingford 7th FloorOxfordshire OX10 8DE Cambridge, MA 02139UK USA
Tel: +44 (0)1491 832111 Tel: +1 617 395 4056Fax: +44 (0)1491 833508 Fax: +1 617 354 6875E-mail: [email protected] E-mail: [email protected]: www.cabi-publishing.org
© CAB International 2006. All rights reserved. No part of this publication may be reproduced in any form or by any means, electronically, mechanically, by photocopying, recording or otherwise, without the prior permission of the copyright owners.
A catalogue record for this book is available from the British Library, London, UK.
Library of Congress Cataloging-in-Publication Data
Microbiological methods for assessing soil quality / edited by Jaap Bloem, DavidW. Hopkins, and Anna Benedetti.
p. cm.Includes index.ISBN 0-85199-098-3 (alk. paper)1. Soil microbiology. 2. Soils--Quality. 3. Soils--Analysis.
I. Bloem, Jaap, 1958- II. Hopkins, David W., Dr. III. Benedetti, Anna, Dr.IV. Title.
QR111.M39 2005579�.1757--dc22
2005001632ISBN-13: 978 0 0851 99 098 9ISBN-10: 0 85199 098 3
Typeset by Columns Design Ltd, ReadingPrinted and bound in the UK by Biddles Ltd, King’s Lynn
Contents
Editors ix
Abbreviations xi
Part I: Approaches to Defining, Monitoring, Evaluating and 1Managing Soil Quality
1 Introduction 3Anna Benedetti and Oliver Dilly
2 Defining Soil Quality 15Richard G. Burns, Paolo Nannipieri, Anna Benedetti and David W. Hopkins
3 Monitoring and Evaluating Soil Quality 23Jaap Bloem, Anton J. Schouten, Søren J. Sørensen, Michiel Rutgers, Adri van der Werf and Anton M. Breure
4 Managing Soil Quality 50Michael Schloter, Jean Charles Munch and Fabio Tittarelli
5 Concluding Remarks 63Anna Benedetti, Philip C. Brookes and James M. Lynch
Part II: Selected Methods 71
6 Microbial Biomass and Numbers 73
6.1 Estimating Soil Microbial Biomass 73Andreas Fließbach and Franco Widmer
v

6.2 Microbial Biomass Measurements by Fumigation–Extraction 77Philip C. Brookes and Rainer Georg Joergensen
6.3 Substrate-induced Respiration 84Heinrich Höper
6.4 Enumeration and Biovolume Determination of 93Microbial CellsManfred Bölter, Jaap Bloem, Klaus Meiners and Rolf Möller
7 Soil Microbial Activity 114
7.1 Estimating Soil Microbial Activity 114Oliver Dilly
7.2 Soil Respiration 117Mikael Pell, John Stenström and Ulf Granhall
7.3 Soil Nitrogen Mineralization 127Stefano Canali and Anna Benedetti
7.4 Nitrification in Soil 136Annette Bollmann
7.5 Thymidine and Leucine Incorporation to Assess 142Bacterial Growth RateJaap Bloem and Popko R. Bolhuis
7.6 N2O Emissions and Denitrification from Soil 150Ulrike Sehy, Michael Schloter, Hermann Bothe and Jean Charles Munch
7.7 Enzyme Activity Profiles and Soil Quality 158Liz J. Shaw and Richard G. Burns
8 Soil Microbial Diversity and Community Composition 183
8.1 Estimating Soil Microbial Diversity and Community 183CompositionJan Dirk van Elsas and Michiel Rutgers
8.2 Soil Microbial Community Fingerprinting Based on Total 187Community DNA or RNAJan Dirk van Elsas, Eva M. Top and Kornelia Smalla
8.3 Phospholipid Fatty Acid (PLFA) Analyses 204Ansa Palojärvi
8.4 Substrate Utilization in BiologTM Plates for Analysis of CLPP 212Michiel Rutgers, Anton M. Breure and Heribert Insam
9 Plant–Microbe Interactions and Soil Quality 228
9.1 Microbial Ecology of the Rhizosphere 228Philippe Lemanceau, Pierre Offre, Christophe Mougel, Elisa Gamalero,Yves Dessaux, Yvan Moënne-Loccoz and Graziella Berta
vi Contents

9.2 Nodulating Symbiotic Bacteria and Soil Quality 231Alain Hartmann, Sylvie Mazurier, Dulce N. Rodríguez-Navarro,Francisco Temprano Vera, Jean-Claude Cleyet-Marel, Yves Prin, AntoineGaliana, Manuel Fernández-López, Nicolás Toro and Yvan Moënne-Loccoz
9.3 Contribution of Arbuscular Mycorrhiza to Soil Quality and 248Terrestrial EcotoxicologySilvio Gianinazzi, Emmanuelle Plumey-Jacquot, Vivienne Gianinazzi-Pearson and Corinne Leyval
9.4 Concepts and Methods to Assess the Phytosanitary Quality 257of SoilsClaude Alabouvette, Jos Raaijmakers, Wietse de Boer, Régina Notz,Geneviève Défago, Christian Steinberg and Philippe Lemanceau
9.5 Free-living Plant-beneficial Microorganisms and Soil Quality 270Yvan Moënne-Loccoz, Sheridan L. Woo, Yaacov Okon, René Bally, Matteo Lorito, Philippe Lemanceau and Anton Hartmann
10 Census of Microbiological Methods for Soil Quality 296Oliver Dilly
Index 301
Contents vii
Editors
Editors-in-Chief
Jaap BloemDepartment of Soil Sciences, Alterra, PO Box 47, NL-6700 AA Wageningen, TheNetherlands
David W. HopkinsSchool of Biological and Environmental Sciences, University of Stirling, StirlingFK9 4LA, UK
Anna BenedettiConsiglio per la ricerca e la sperimentazione in Agricoltura, Istituto Sperimentaleper la Nutrizione delle Piante, Via della Navicella, 2, 00184 Rome, Italy
Editorial Board
Richard G. BurnsSchool of Land and Food Sciences, The University of Queensland, Brisbane,Queensland 4072, Australia
Oliver DillyLehrstuhl für Bodenschutz und Rekultivierung, Brandenburgische TechnischeUniversität, Postfach 101344, D-03013 Cottbus, Germany
Andreas FließbachResearch Institute of Organic Agriculture (FiBL), Ackerstrasse, CH-5070 Frick,Switzerland
ix

Philippe LemanceauUMR 1229 INRA/Université de Bourgogne, ‘Microbiologie et Géochimie des Sols’,INRA-CMSE, BP 86510 21065, Dijon cedex, France
James M. LynchForest Research, Alice Holt Lodge, Farnham GU10 4LH, UK
Yvan Moënne-LoccozUMR CNRS 5557 Ecologie Microbienne, Université Claude Bernard (Lyon 1), 43bd du 11 Novembre, 69622 Villeurbanne cedex, France
Paolo NannipieriDipartimento de Nutrizione delle Pianta e Scienza del Suolo, Università di Firenze,Piazzale di Cascine 28, Florence, Italy
Fabio TittarelliConsiglio per la ricerca e la sperimentazione in Agricoltura, Istituto Sperimentaleper la Nutrizione delle Piante, Via della Navicella, 2, 00184 Rome, Italy
Jan Dirk van ElsasDepartment of Microbial Ecology, Groningen University, Kerklaan 30, NL-9750 RA Haren, The Netherlands
x Editors

Abbreviations
AIM acetylene inhibition methodAM arbuscular mycorrhizaAO acridine orangeAODC acridine orange direct countAPS ammonium persulphateARDRA amplified ribosomal DNA restriction analysisATP adenosine 5'-triphosphateAUDPC area under the disease progress curveAWCD average well colour developmentBAS basal respiration(BC/TOC) C biomass/total organic C (ratio)BNF biological nitrogen fixationCAC citric acid cycleCEC cation exchange capacityCEN Comité Européen de NormalisationCFE chloroform fumigation–extractionCFU colony-forming unitsCLPP community-level physiological profilesCmic microbial biomassCOST COopération dans le domaine de la recherche Scientifique
et TechniqueCSLM confocal scanning laser microscopyCV coefficient of variationCWDEs cell-wall-degrading enzymesDAPI 4',6-diamidino-2-phenylindole-dihydrochlorideDEPC diethyl-pyrocarbonateDFS differential fluorescent stainDGGE denaturing gradient gel electrophoresisDMSO dimethyl sulphoxide
xi

dNTP deoxynucleoside 5'-triphosphatedpm disintegrations per minutedps disintegrations per seconddsDNA double-stranded DNADTAF 5-(4,6-dichlorotriazin-2-yl) aminofluoresceindTTP deoxythymidine triphosphateDW dry weightEAP Environmental Action ProgrammeEL ester-linkedEPA Environmental Protection AgencyEU European UnionFAME fatty acid methyl ester (analysis)FAO Food and Agriculture OrganizationFB Fluorescent BrightenerFDA fluorescein diacetateFID flame ionization detectorFISH fluorescence in situ hybridizationGC gas chromatographGC–MS GC coupled with a mass spectrometerGM genetically modifiedHPLC high-pressure liquid chromatographIC ion chromatographINT iodonitrotetrazolium chlorideINTF iodonitrotetrazolium formazanIPP intact phospholipid profilingIR infraredISO International Organization for StandardizationKAc potassium acetateMIC50 mean inhibitory concentration at 50%MIDI or MIS Microbial Identification SystemMNBas basal nitrogen mineralizationMPN most probable numberMST mean survival timeMUB modified universal bufferMUF methylumbelliferylNbio N in microbial biomassNdfa nitrogen derived from the atmosphereNMDS non-metric multidimensional scalingNtot total soil nitrogenOECD Organization for Economic Co-operation and Developmentp.a. pro analysis (reagent purity)PBS phosphate-buffered salinePCA principal components analysisPCR polymerase chain reactionPGPF plant-growth-promoting fungiPGPR plant-growth-promoting rhizobacteriaPLFA phospholipid fatty acid (analysis)
xii Abbreviations

p-NPP p-nitrophenyl phosphateqCO2 metabolic quotientQN nitrogen mineralization quotientRAPD random amplified polymorphic DNARCF relative centrifugal forcerpm revolutions/minuteRQ respiratory quotientRS ripper subsoilingSDS sodium dodecyl sulphateSEM scanning electron microscopySINDI Soil Indicators (New Zealand) SIR substrate-induced respirationSOM soil organic matterSQI Soil Quality IndexSSC standard saline citrateSSCP single-strand conformation polymorphismSSSA Soil Science Society of AmericaTEM transmission electron microscopyTGGE temperature gradient gel electrophoresisT-RFLP terminal restriction fragment length polymorphismTY tryptone-yeast extractUV ultravioletv/v volume in volumeWHC water-holding capacityw/v weight in volume
Abbreviations xiii

I Approaches to Defining,Monitoring, Evaluating andManaging Soil Quality

1 Introduction
ANNA BENEDETTI1 AND OLIVER DILLY2
1Consiglio per la ricerca e la sperimentazione in Agricoltura, IstitutoSperimentale per la Nutrizione delle Piante, Via della Navicella, 2, 00184Rome, Italy; 2Lehrstuhl für Bodenschutz und Rekultivierung, BrandenburgischeTechnische Universität, Postfach 101344, D-03013 Cottbus, Germany
Introduction
Having adopted the Treaty on Biological Diversity of Rio de Janeiro(UNCED, 1992), many governments are becoming increasingly concernedabout sustaining biodiversity and maintaining life support functions. In sev-eral countries, national or regional programmes have been established tomonitor soil quality and/or the state of biodiversity. Most monitoring pro-grammes include microbiological indicators, because soil microorganismshave key functions in decomposition and nutrient cycling, respond promptlyto changes in the environment and reflect the sum of all factors regulatingnutrient cycling (see also Chapter 3). Currently the European Union (EU) andmany countries all over the world are working on legislation for the protec-tion of soil quality and biodiversity. Policy makers, as well as land users, needindicators and monitoring systems to enable them to report on trends for thefuture and to evaluate the effects of soil management. This book detailsapproaches and microbiological methods for assessing soil quality.
The European Commission has been promoting cooperation and thecoordination of nationally funded research through so-called COST actions(‘COopération dans le domaine de la recherche Scientifique et Technique’;http://cost.cordis.lu/src/whatiscost.cfm, accessed 27 April 2004). COSTAction 831 ‘Biotechnology of Soil: Monitoring, Conservation andRemediation’ started in October 1997 and ended in December 2002. Animportant aim of COST Action 831 was the development of a handbook onmicrobiological methods for assessing soil quality. COST Action 831 hasenabled working groups of European soil microbiologists to discuss andevaluate the potential use of microbiological, biochemical and moleculartools to assess soil quality. The scientific community is constantly chal-lenged by operative institutions, such as national and local authorities, stateboards, private boards, consultants and standardization agencies, to deliver
©CAB International 2006. Microbiological Methods for Assessing Soil Quality(eds J. Bloem et al.) 3

feasible methods for acquiring representative biological data on soil quality.This is extremely difficult, since soil microorganisms respond and adaptrapidly to environmental conditions. In addition, the impacts caused byhuman activities may be barely distinguishable from natural fluctuations,especially when changes are detected late and comparison with historicaldata or unaffected control sites is not possible.
Various authors have made numerous suggestions. For instance,Domsch (1980) and Domsch et al. (1983) proposed that any alteration,caused by either natural agents or pollutants, which returns to normalmicrobiological values within 30 days should be considered normal fluctua-tion; alterations lasting for 60 days can be regarded as tolerable, whereasthose persisting for over 90 days are stress agents. Brookes (1995) suggestedthat no parameter should be used alone, but that related parameters shouldbe identified and utilized together as an ‘internal control’, e.g. biomass car-bon (C) and total soil organic C. In general, there is an approximate linearrelationship between these two variables, so when soils show marked varia-tions from what is considered to be the normal ratio between biomass Cand total organic C in a particular soil management system, climate and soiltype, this ratio becomes an indicator of deterioration and change in soilecosystem functions.
Criteria for Indicators of Soil Quality
Criteria for indicators of soil quality relate mainly to: (i) their utility indefining ecosystem processes; (ii) their ability to integrate physical, chemi-cal and biological properties; and (iii) their sensitivity to management andclimatic variations (Doran, 2000). These criteria apply to soil organisms,which are thus useful indicators of sustainable land management. Ideally,soil organisms and ecological indicators should be:
1. Sensitive to variations in management;2. Well correlated with beneficial soil functions;3. Useful for elucidating ecosystem processes;4. Comprehensible and useful to land managers;5. Easy and inexpensive to measure.
Brookes (1995) proposed the following criteria for selecting a microbio-logical parameter as an indicator of soil pollution.
1. It should be possible to determine the property of interest accurately andprecisely in a wide range of soil types and conditions.2. Determination should be easy and of low cost, as many samples must beanalysed.3. The nature of the parameter must be such that control determinations arealso possible, so that the effect of the pollutant can be assessed exactly.4. The parameter must be sensitive enough to detect pollution, but also sta-ble enough to avoid false alarms.
4 A. Benedetti and O. Dilly

5. The parameter must have general scientific validity based on reliable sci-entific knowledge.6. If the reliability of a single parameter is limited, two or more indepen-dent parameters should be selected. In this case their interrelations inunpolluted areas must also be known.
These two approaches are synergetic, as the criteria proposed by Doran(2000) focus on the sphere of interest, while Brookes’ (1995) criteria identifythe requisites of an indicator.
Two crucial points had to be clarified by the working groups of COSTAction 831 before any choice of, or suggestion about, microbial indicators ofsoil quality was made:
1. Who is the handbook for? 2. How do we define soil quality?
Potential Users of this Handbook
This handbook is aimed at professionals, students and organizations work-ing in the field of agriculture and the environment, such as:
• soil scientists, colleges, universities, libraries;• consultants in environmental risk assessment and soil management;• analysis laboratories, e.g. those involved in ecological monitoring;• international (e.g. EU, Organization for Economic Cooperation and
Development (OECD), Food and Agriculture Organization (FAO)),national, regional and local authorities involved in soil protection andmanagement;
• international (e.g. ISO and CEN) and national standardization agencies.
It aims to provide clear instructions to technicians operating outside ofthe scientific research sector, and is meant to provide a seamless linkbetween science and application. In contrast to earlier books on microbio-logical methods (for instance Alef and Nannipieri, 1995), this handbookfocuses on a limited number of methods which are applicable, or alreadyapplied, in regional or national soil quality monitoring programmes. It alsoprovides an overview of monitoring programmes implemented in severalcountries.
The people who create, study and assess innovative solutions using sci-entific methods are seldom involved directly in transferring information toend-users. This can create a knowledge gap that often leads to misinforma-tion or poor information. The purpose of this book is to provide applicablemicrobiological methods for assessing soil quality. Part I provides anoverview of approaches to defining, monitoring, evaluating and managingsoil quality. In Part II, methods are described in sufficient detail to enablethis handbook to be used as a practical guide in the laboratory. Finally,Chapter 10 gives a census of the main methods used in over 30 Europeansoil microbiological laboratories.
Introduction 5

Defining Soil Quality
During a COST 831 Joint Working Groups meeting on ‘Defining soil qual-ity’, held in Rome in December 1998 (Benedetti et al., 2000), there was broaddiscussion about the criteria for the definition of ‘soil quality and/or quali-ties of soils’. This can be applied to a wide range of agricultural soils,forestry soils, grazing pastures, natural environment soils, etc., and mayinclude different climate zones. However, the focus of our activities is in theCOST domain of agriculture and biotechnology. An overview on definingsoil quality is given in Chapter 2.
Evaluating Soil Quality
Once the aim and the potential users of the handbook had been defined, thenext step was to establish how to evaluate soil quality, and which parame-ters and methods to adopt. Many questions had to be answered and weredebated during a Joint Working Groups meeting on ‘Evaluating soil qual-ity’, in Kiel, Germany (May 2000). The issues ranged from problems relatedto sampling, storage and pre-incubation of soil samples for microbiologicalanalyses, to the choice of the most efficient methods and indicators (Bloemand Breure, 2003). An overview on evaluating soil quality is given inChapter 3.
The methods can be divided into four groups, depending on the infor-mation they can provide:
1. Soil microbial biomass and number.2. Soil microbial activity. 3. Soil microbial diversity and community structure.4. Plant–microbe interactions.
Soil microbial biomass and activity are relatively easy to determineusing routine methods, and are used to assess soil quality. For monitoringprogrammes where large amounts of samples have to be processed, oftenthe soil is sieved, mixed and pre-incubated under standardized conditionsin the laboratory to reduce variation and to facilitate comparison betweendifferent locations and different sampling dates. Direct analyses of micro-bial biomass and activity of field samples are also possible, and are oftenperformed in more fundamental research. However, the higher variationfound in direct analysis usually requires more replicates in space and timethan with pre-incubated samples. Compared to biomass and activity, soilmicrobial diversity and community structure is more complicated to mea-sure, and requires more specialized techniques, which are less easy to stan-dardize. However, molecular techniques for their assessment are rapidlyimproving. The study of plant–microbe interactions is also relatively spe-cialized and time consuming, and often requires in situ determinations thatare rarely performed in optimal conditions. Field temperature and humid-ity can vary greatly and also reach extreme values which are very
6 A. Benedetti and O. Dilly

unfavourable for microbiological activity. Moreover, substrate concentrationand pH values are seldom optimal.
Methods
Once the parameters and methods for assessing soil quality had beenselected, the detailed protocol for each method was proposed and discussedduring a combined meeting of working groups on ‘Microbiological meth-ods for soil quality’, in Wageningen, The Netherlands (November 2001).Here, the preparation of the methods section of the handbook was initiated.
1. Soil microbial biomass and number
All the methods capable of defining the weight and number of soil microor-ganisms in a soil sample are included. The conventional methods for deter-mining numbers of microbes living in soil are based on viable or directcounting procedures (Zuberer, 1994; Alef, 1995; Alef and Nannipieri, 1995;Dobereiner, 1995; Lorch et al., 1995). Viable counting procedures require cul-turable cells and comprise two approaches: the plate count technique andthe most probable number (MPN) technique. Some unculturable soilmicroorganisms may be potentially culturable if adequate nutritional condi-tions for their growth could be provided. However, many remain uncultur-able because they are dormant and require special resuscitation beforeregaining the ability to grow; or they are non-viable but still intact anddetectable by microscopy (Madsen, 1996). Using specific culture media, spe-cific functional groups of microbes can be counted. However, even withgeneral growth media, the numbers of microbes detected are usually atleast an order of magnitude lower than those obtained by directmicroscopy.
Direct enumeration techniques allow the counting of total numbers ofboth bacteria and fungi, but usually give no indication of the compositionof the respective communities. Generally, with these techniques, a knownamount of homogenized soil suspension is placed on a known area of amicroscope slide, the microorganisms are then stained with a fluorescentdye and are counted using a microscope (Bloem et al., 1995). A disadvantageof microscopic counts is that visual counting is subjective and relativelytime consuming. Therefore biochemical and physiological methods, e.g.chloroform fumigation extraction of microbial carbon and nitrogen, andsubstrate-induced respiration, are most commonly used (Chapter 6).
2. Soil microbial activity
Biochemical techniques are described that reveal information about themetabolic processes of microbial communities, both in their entirety (e.g.
Introduction 7

respiration and mineralization) and according to functional groups (e.g.nitrification and denitrification).
Microbial activity can be divided into potential and actual activity.Actual activity means the activity microorganisms develop when conditionsnecessary for metabolism are less than optimal, as occurs in the open field.This activity can be determined using field sensors, but to date no serial androutine methods are available. Therefore potential activity is usually deter-mined. Potential activity means metabolic activity, including enzymaticactivities, that soil microorganisms are capable of developing under optimalconditions of, for example, temperature, humidity, nutrients and substrates.
Biochemical methods can be divided into two subgroups. The firstincludes the methods that measure active populations in their entirety, usu-ally without adding substrates. The second contains methods that are able todefine the activity and potential activity of specific organisms or metabolicgroups, usually after adding specific substrates; for example, respirometrictests with specific carbon sources, and potential nitrification after addition ofammonium. A selection of commonly used methods is given in Chapter 7.
3. Soil microbial diversity and community structure
This group of methods includes the most up-to-date techniques for acquir-ing ecological and molecular data.
Traditionally, culturing techniques have been used for the analysis ofsoil microbial communities. However, only a small fraction (< 0.1%) of thesoil microbial community has been determined using this approach. Anumber of methods are currently available for studies on soil microbialcommunities. The use of molecular techniques for investigating microbialdiversity in soil communities continues to provide new understanding ofthe distribution and diversity of organisms in soil habitats. The use of RNAor DNA sequences, combined with fluorescent oligonucleotide probes, pro-vides a powerful approach for the characterization and study of soilmicrobes that cannot currently be cultured. Among the most useful of thesemethods are those in which small subunit RNA genes are amplified fromsoil-extracted nucleic acids. Using these techniques, microbial RNA genescan be detected directly from soil samples and sequenced. These sequencescan then be compared with those from known microorganisms.Additionally, group- and taxon-specific oligonucleotide probes can bedeveloped from these sequences, making direct determination of microor-ganisms in soil habitats possible.
Phospholipid fatty acid analysis and community-level physiological pro-files have also been utilized successfully by soil scientists, to access a greaterproportion of the soil microbial community than can be obtained using cul-turing techniques. In recent years, molecular methods for soil microbial com-munity analysis have provided new understanding of the phylogeneticdiversity of microbial communities in soil (Insam et al., 1997; Loczko et al.,1997; Hill et al., 2000); Chapter 8 describes a selection of these methods.
8 A. Benedetti and O. Dilly

4. Plant–microbe interactions
The rhizosphere is recognized as the zone of influence of plant roots on theassociated biota and soil (Lynch, 1998). Most studies to date have involvedan ecophysiological description of this region, with emphasis on the influxof nutrients to plants, including nutrient supply mediated by symbionts(e.g. mycorrhizal fungi and nitrogen-fixing Rhizobium bacteria) and free-liv-ing microorganisms (e.g. plant-growth-promoting bacteria), and the effluxof photosynthetic carbon compounds, which provide essential substratesfor the associated biota, from plant roots (rhizodeposition products). Thesequalitative and quantitative studies have been very valuable for generatingenergy budgets of plant and crop productivity.
Some of the methods used in the rhizosphere are the same as thoseused in bulk soil for determination of biomass, activity and diversity (asdescribed in Chapters 6, 7 and 8). In addition, there are more specific tech-niques; for example, those for evaluating soil-nodulating potential (of nitro-gen fixers), bioassays using arbuscular mycorrhizal fungi, bio-indicators forassessing phytosanitary soil quality and assessment of indigenous free-liv-ing plant-beneficial bacteria. Chapter 9 provides a selection of methods thatrelate soil microbial activity to plants.
Relationships Between Different Parameters and Evaluation ofResults
None of the four method groups stands alone (Fig. 1.1). They can often beinterfaced, and the decision to include one method in a given categoryrather than another is a consequence of the type of interpretation one wantsto give to the results obtained. For instance, the soil adenosine triphosphate(ATP) content has been used as an indicator of both biomass (group 1) andactivity (group 2). The use of ATP as an index of microbial biomass is basedon the assumption that ATP is present as a relatively constant component ofmicrobial cells, and that it is not associated with dead cells nor adsorbed tosoil particles. A significant correlation was found between the ATP contentand the microbial biomass of different soils (Jenkinson, 1988). However, thelinear relationship between ATP and microbial biomass only holds whenboth are determined after soil pre-incubation at constant temperature andmoisture conditions. The ATP content changes rapidly, depending on thephysiological state of the cell. Therefore, it was hypothesized that ATP con-tent measured immediately after sampling reflects microbial activity ratherthan biomass (Jenkinson et al., 1979). The accuracy of interpretation andcomparison of ATP values in different soils depends on the methods used toextract ATP from soil as well as on soil handling (Nannipieri et al., 1990); forthis reason, ATP determination was not included in our selection ofmethods.
The substrate-induced respiration (SIR) method, introduced byAnderson and Domsch (1975, 1978), depends on microbial biomass as wellas activity, and reflects the metabolically active component of the microbial
Introduction 9

10 A. Benedetti and O. Dilly
Plant–
microorganism
relationship
Soilmicrobial activity
Soilmicrobial diversity
and communitystructure
Soil microbial biomass
and number
Living biomass SIR, A
TPS
oil enzyme
ecological profileP
LFA, etc.
Fig. 1.1. Relationships between different soil microbiological parameters. SIR, substrate-induced respiration; ATP, adenosine triphosphate; PLFA, phospholipid fatty acid.

biomass. The microbial respiratory activity (usually determined as CO2 evo-lution) of a glucose-amended soil is stimulated to a maximum within a fewminutes after adding saturating amounts of substrate. The enhanced rate ofrespiration is usually stable for 6–8 h and is assumed to depend on the levelof microbial biomass of the soil (Sparling, 1995). Thus, the initial respiratoryresponse to glucose is taken as an index of the soil microbial biomass beforethe start of microbial growth (Howarth and Paul, 1994; Sparling, 1995).After about 8 h, an increase in the respiratory activity up to a plateau phasereflects microbial growth.
Similar considerations apply to the community-level physiological pro-file method (CLPP or BiologTM), which provides information about: (i) thestructure of the microbial community (group 3); (ii) the efficiency of specificfunctional groups of microorganisms in metabolizing specific substrates(groups 2 and 3); or (iii) enzymatic activities (group 2). Functional diversity,as determined by CLPP, reflects both the genetic diversity and the physio-logical activity of organisms inhabiting the system, and is more importantfor the long-term stability of an ecosystem than diversity at the taxonomicallevel (Garland and Mills, 1991). These so-called ‘multifunctional methods’may be considered as complementary to Brookes’ (1995) concept of ‘internalcontrol’, which describes biochemical and chemical parameters as beinginterrelated.
In fact, one of the most complex parts of the soil microbiologist’s workis in the assessment of relationships between different parameters, as itembraces the choice of the appropriate monitoring techniques and consid-eration of the interpretative criteria of results obtained by the previouslymentioned methods.
How should the analytically acquired results be evaluated, which infor-mation should be deduced and what strategies should be adopted? Luckily,the literature comes to our rescue and proposes approaches for the inte-grated processing of results, such as amoeba, star or cobweb diagrams andthe use of a Soil Quality Index (SQI) to summarize large amounts of data(Chapter 3). Recently, Herrick (2000) affirmed that soil quality appears to bean ideal indicator of sustainable land management, provided that:
1. Causal relationships between soil quality and ecosystem functions aredemonstrated, including biodiversity conservation, biomass productionand conservation of soil and water resources.2. The power of soil quality indicators to predict response to disturbance isincreased.3. Accessibility of monitoring systems to land managers is increased.4. Soil quality is integrated with other biophysical and socio-economic indi-cators.5. Soil quality is placed in a landscape context.
Introduction 11

12 A. Benedetti and O. Dilly
Table 1.1. Groups of microbiological, biochemical and molecular methods.
Method groups
1. Soil microbial 2. Soil microbial 3. Soil microbial 4. Plant–microbe biomass and activity diversity and interactionsnumber community structure
Chloroform Without substrate Molecular methods Nodulating symbiotic fumigation Soil respiration based on microbial bacteriaextraction N mineralization DNA or RNA Arbuscular mycorrhizaSubstrate-induced With substrate or Community-level Phytosanitary soil respiration tracer physiological qualityDirect microscopic Nitrification profiles (BIOLOG) Free-living plant-beneficialcounts Thymidine and Phospholipid fatty microorganisms
leucine acid analysisincorporationN2O emission anddenitrification
Handbook Contents
In conclusion, the first three chapters of this handbook introduce the threemain topics that are decisive factors leading to the choice and subsequentuse of some selected microbiological parameters as environmental indica-tors:
Defining soil quality → Monitoring and evaluating soil quality → Managing soilquality
Issues related to ‘Managing soil quality’ (Chapter 4) were presented anddiscussed during the final COST 831 Joint Working Groups meeting inBudapest, Hungary (September 2002).
The general section is followed by a technical section where the meth-ods are set out into four groups, according to the classification above (Table1.1).
A brief description is given of the potential of each method group(Chapters 6–9), with a selection of only some of the parameters available,i.e. the ones having the requisites set down in the introduction. The selectedparameters are accompanied by a detailed description of the methodaccording to the design used for ISO standardization.
The final chapter gives the results of a census of the main methods usedin over 30 European laboratories which have participated in COST Action831.

Introduction 13
References
Alef, K. (1995) Nutrient sterilization, aerobicand anaerobic culture technique. In: Alef,K. and Nannipieri, P. (eds) Methods inApplied Soil Microbiology and Biochemistry.Academic Press, New York, pp. 123–133.
Alef, K. and Nannipieri, P. (1995) Methods inApplied Soil Microbiology and Biochemistry.Academic Press, New York.
Anderson, J.P.E. and Domsch, K.H. (1975)Measurement of bacterial and fungal con-tributions to soil respiration of selectedagricultural and forest soil. CanadianJournal of Microbiology 21, 314–322.
Anderson, J.P.E. and Domsch, K.H. (1978) Aphysiological method for the quantitativemeasurement of microbial biomass in soil.Soil Biology and Biochemistry 10, 215–221.
Benedetti, A., Tittarelli, F., Pinzari, F. and DeBertoldi, S. (2000) Proceedings of the JointWGs Meeting of the Cost Action 831Biotechnology of Soil: Monitoring,Conservation and Remediation, 10–11December 1998, Rome. EuropeanCommunities, Luxembourg.
Bloem, J. and Breure, A.M. (2003) Microbialindicators. In: Markert, B.A., Breure A.M.and Zechmeister, H.G. (eds) Bioindicators/Biomonitors – Principles, Assessment, Concept.Elsevier, Amsterdam, pp. 259–282.
Bloem, J., Bolhuis, P.R., Veninga, M.R. andWieringa, J. (1995) Microscopic methodsfor counting bacteria and fungi in soil. In:Alef, K. and Nannipieri, P. (eds) Methodsin Applied Soil Microbiology andBiochemistry. Academic Press, New York,pp. 162–173.
Brookes, P.C. (1995) The use of microbialparameters in monitoring soil pollutionby heavy metals. Biology and Fertility ofSoil 19, 269–279.
Dobereiner, J. (1995) Isolation and identifica-tion of nitrogen fixing bacteria from soiland plants. In: Alef, K. and Nannipieri, P.(eds) Methods in Applied Soil Microbiologyand Biochemistry. Academic Press, NewYork, pp. 134–135.
Domsch, K.H. (1980) Interpretation and eval-uation of data. Recommended Tests forAssessing the Side-effects of Pesticides on the
Soil Microflora. Weed ResearchOrganization Technical Report No. 59,pp. 6–8.
Domsch, K.H., Jagnow, G. and Anderson,T.H. (1983) An ecological concept for theassessment of side-effects of agrochemi-cals on soil micro-organisms. ResidueReviews 86, 65–105.
Doran, J.W. (2000) Soil health and sustain-ability: managing the biotic component ofsoil quality. Applied Soil Ecology 15, 3–11.
Garland, J.L. and Mills, A.L. (1991)Classification and characterization of het-erotrophic microbial communities on thebasis of patterns of community-level sole-carbon-source utilization patterns. Appliedand Environmental Microbiology 57,2351–2359.
Herrick, J.E. (2000) Soil quality: an indicatorof sustainable land management? AppliedSoil Ecology 15, 75–83.
Hill, G.T., Mitkowski, N.A., Aldrich-Wolfe,L., Emele, L.R., Jurkonie, D.D., Ficke, A.,Maldonado-Ramirez, S., Lynch, S.T. andNelson, E.B. (2000) Methods for assessingthe composition and diversity of soilmicrobial communities. Applied SoilEcology 15, 25–36.
Howarth, W.R. and Paul, E.A. (1994)Microbial biomass. In: Weaver, R.W.,Angle, S., Bottomley, P., Bezdicet, D.,Smith, S., Tabatabai, A. and Woollen, A.(eds) Methods of Soil Analysis. Part 2:Microbiological and Biochemical Properties.Soil Science Society of America, Madison,Wisconsin, pp. 753–773.
Insam, H., Amor, K., Renner, M. and Crepaz,C. (1997) Changes in functional abilities ofthe microbial community during com-posting of manure. Microbial Ecology 31,77–87.
Jenkinson, D.S. (1988) Determination ofmicrobial biomass carbon and nitrogen insoil. In: Wilson, J.K. (ed.) Advances inNitrogen Cycling in Agricultural Ecosystems.CAB International, Wallingford, UK,pp. 368–386.
Jenkinson, D.S., Davidson, S.A. and

14 A. Benedetti and O. Dilly
Powlson, D.S. (1979) Adenosine triphos-phate and microbial biomass in soil. SoilBiology and Biochemistry 11, 521–527.
Loczko, E., Rudaz, A. and Aragno, M. (1997)Diversity of anthropogenically influencedor disturbed soil microbial communities.In: Insam, H. and Rangger, A. (eds)Microbial Communities Functional VersusStructural Approaches. Springer-Verlag,Berlin, pp. 57–67.
Lorch, H.J., Benckieser, G. and Ottow, J.C.G.(1995) Basic methods for countingmicroorganisms in soil and water. In: Alef,K. and Nannipieri, P. (eds) Methods inApplied Soil Microbiology and Biochemistry.Academic Press, New York, pp. 136–161.
Lynch, J.M. (1998) What is the rhizosphere? In:Atkinsons, D. (ed.) Proceedings of Inter CostActions 821, 830, 831 Meeting. AgriculturalSchool, 17–19 September, Edinburgh.
Madsen, E.L. (1996) A critical analysis ofmethods for determining the compositionand biogeochemical activities of soilmicrobial communities in situ. In: Stotzky,
G. and Bollag, J.M. (eds) Soil Biochemistry,vol. 9, Marcel Dekker, New York,pp. 287–370.
Nannipieri, P., Ceccanti, B. and Grego, S.(1990) Ecological significance of the bio-logical activity in soil. In: Bollag, J.M. andStotzky, G. (eds) Soil Biochemistry, vol. 6,Marcel Dekker, New York, pp. 293–355.
Sparling, G.P. (1995) The substrate-inducedrespiration method. In: Alef, K. andNannipieri, P. (eds) Methods in Applied SoilMicrobiology and Biochemistry. AcademicPress, New York, pp. 397–404.
UNCED (United Nations Conference onEnvironment and Development) (1992)Agenda 21. June, Rio de Janeiro.
Zuberer, D.A. (1994) Recovery and enumera-tion of viable bacteria. In: Weaver, R.W.,Angle, S. and Bottomley, P. (eds) Methodsof Soil Analysis. Part 2: Microbiological andBiochemical Properties. Soil Science Societyof America Book Series, No. 5, Madison,Wisconsin, pp. 119–144.

2 Defining Soil Quality
RICHARD G. BURNS,1 PAOLO NANNIPIERI,2 ANNA BENEDETTI3
AND DAVID W. HOPKINS4
1School of Land and Food Sciences, The University of Queensland,Brisbane, Queensland 4072, Australia; 2Dipartimento de Nutrizione dellePianta e Scienza del Suolo, Università di Firenze, Piazzale di Cascine 28,Florence, Italy; 3Consiglio per la ricerca e la sperimentazione in Agricoltura,Istituto Sperimentale per la Nutrizione delle Piante, Via della Navicella, 2,00184 Rome, Italy; 4School of Biological and Environmental Sciences,University of Stirling, Stirling FK9 4LA, UK
Abstract
Environmental quality is a complex concept. Defining one component of it, soilquality, is therefore usually attempted using indicators that represent, with differinglevels of approximation, particular constituents, processes or conditions. In thischapter, we review briefly the ideal characteristics of a soil quality indicator andthen outline some of the national frameworks for assessing soil quality that havebeen proposed. A recurrent theme of the existing frameworks is the use of parame-ters that individually give useful information, but which can be aggregated to pro-vide an overall indicator or index of soil fertility.
Introduction
Environmental quality is a composite of the desirable properties of soil, air andwater. For water and air, where relatively precise analyses can be reported, ana-lytical data do not necessarily provide an holistic assessment of the quality ofthese components of the biosphere. Soils represent an even more complex envi-ronment because they are an intimate mixture of the living and non-livingcomponents and because they vary naturally in both space and time over arange of scales. Defining soil quality is, therefore, usually attempted usingsomewhat arbitrarily chosen chemical, biological and physical indicators whichrepresent particular constituents, processes or conditions. A good indicator ofquality must have several characteristics. It must be representative of the sitesto which it is being applied; it must be accessible both in terms of the avail-ability of the methods required to measure it and the ease with which themeasurements can be interpreted by the end-user; and it must be reliable,
©CAB International 2006. Microbiological Methods for Assessing Soil Quality(eds J. Bloem et al.) 15

meaning that it must be reproducible and applicable to a range of sites. Sincesoil quality cannot be summarized by a single component or process, its assess-ment must include information about several indicators. These, depending onthe stated purpose, may have different scales of measurement (e.g. aggregates,horizons, profiles, catchments) and make a different proportional contributionto the evaluation of fertility. For example, in order to describe the extent, natureand likely impact of a pollutant in a particular soil, it is necessary to employ arange of indicators. These will include the concentration of the pollutants andtheir vertical and horizontal distribution across the site, and intrinsic soil fac-tors such as pH, clay and organic matter content, and ion exchange capacity.All these must be considered because they will influence the bioavailability ofthe pollutant and, therefore, its persistence, movement and effect on selectedimportant processes. On the other hand, if the objective is prediction of plantnutrient availability, legume nodulation or natural biological control, otherfactors will assume importance. From the extensive literature, it is possible todeduce several characteristics that might contribute to an ideal indicator of soilfertility, and many of these have been summarized in the literature; forexample, the Organization for Economic Co-operation and Development(OECD, 1999), recognized seven categories, as follows.
1. Political relevance and user benefits; indicators should:
• provide a representative picture of the environmental conditions and ofthe societal pressures or reactions to the changing state of the environ-ment;
• be simple, easy to interpret and able to indicate temporal trends;• be reactive to environmental changes and to related human activity;• provide a basis for international comparisons;• have national worth and be applicable to nationally relevant regional
themes;• have threshold or reference values, such that users can evaluate the sig-
nificance of the indicator values.
2. Analytical validity; analyses should:
• be well founded, both technically and scientifically;• be based, where possible, on international standards and have interna-
tional consensus in terms of validity;• be easily applied to economic models, forecast estimates and informa-
tion systems.
3. Measurability; measurements should:
• be easily available or made available at a reasonable cost:benefit ratio;• be adequately documented and of verified quality;• be able to be updated at regular intervals according to well-defined
procedures.
4. Representativeness; indicators should:
• correlate with a specific phenomenon or characteristic;
16 R.G. Burns et al.

• correlate with previously reported effects with the minimum of statisti-cal dispersion;
• not be easily obscured by profile factors;• have sufficient general validity to many analogous, non-identical situa-
tions.
5. Accessibility; indicators should:
• be easily measurable;• offer the possibility of being monitored automatically;• be easy to sample and have a threshold of analytical detection which is
accessible by standard techniques.
6. Reliability; indicators should:
• have minimum systematic errors.
7. Operativeness; indicators should:
• be easily and directly utilizable for quantifying acts of intervention,costs and benefits.
The above list serves as a guide to the selection of useful indicators, but itshould be recognized that no single indicator can meet all requirements.Furthermore, a major problem in the use of any indicator is the establish-ment of threshold or reference values. This is only possible if many data areavailable and, even then, is a somewhat subjective choice, based on the cur-rent and projected use of the land (see also Chapter 3).
According to the OECD (1999) the ‘definitions of indicators as a concept(let alone specific indicators), vary widely’ and, furthermore, different agen-cies and authors use their own terms and definitions. These include: vari-ables, parameters, measures, statistical measures, proxy measures, values,measuring instruments, fractions, indices, a piece of information, empiricalmodels of reality and signs! The OECD (1993) bravely attempted to define afew of these terms, thus:
• parameter – a property that is measured or observed;• indicator – a value derived from parameters, which points to or pro-
vides information about, or describes, the state with a significanceextending beyond that directly associated with a parameter value; and
• index – a set of aggregated or weighted parameters or indicators.
Any parameter that gives useful information on soil quality can be usedas an indicator, and a set of indicators can be aggregated into an index.However, in order to correctly apply the terminology it is necessary tounderstand the meaning of each term. For example, soil organic matter con-tent is universally recognized as an indicator of soil quality and, in general,the organic carbon content of an agricultural soil is a parameter closely corre-lated with the organic matter content. At temperate latitudes, the averageorganic matter content falls between 1% and 5%. A reduction of thisquantity over a period of time is likely to be an index of impoverishment
Defining Soil Quality 17

and could be a strong indicator of the loss of soil fertility and deteriorationof other soil properties – such as structural stability and water retention.Similarly, the effectiveness of an amendment can be evaluated by measur-ing the increase in organic carbon, which then becomes an indicator of effec-tiveness of the fertilizer used. Organic matter, together with otherparameters, can thus become an index of soil quality. An example of a soilquality index is given in Chapter 3. Thus, a change in the value of a singleparameter outside a certain range can be the important sign of qualityimprovement or reduction.
International Indicators of Soil Quality
Since the beginning of the 1980s, a decrease in soil productive capacity hasbeen observed in more than 10% of cultivated land worldwide, as evi-denced by soil erosion, atmospheric pollution, amount of land in farming,excessive grazing, salinization and desertification (Francaviglia, 2004; Van-Camp et al., 2004).
A definitive set of basic indicators for the evaluation of soil quality hasnot yet been provided, despite various international proposals, includingthat published by the Soil Science Society of America (SSSA). This is duemainly to the continuing difficulty in defining soil quality and how it can beassessed. Many definitions have been suggested in recent years, but onethat best represents the concept was given by Doran and Parkin (1994): ‘Thecapacity of the soil to interact with the ecosystem in order to maintain bio-logical productivity, environmental quality and to promote animal andplant health.’ This definition is similar to the three essential criteria for soilquality that were identified by the Rodale Institute (1991), namely:
• productivity – the soil’s capacity to increase plant biological productivity;• environmental quality – the soil’s capacity to attenuate environmental
contamination, pathogens and external damage; and• health of living organisms – the interrelation between soil quality and ani-
mal, plant and human health.
The parameters for the evaluation of soil quality can be subdivided intothose that are physical, chemical and biological. However, integrationamong them is fundamental to our understanding. Currently, definitions ofsoil quality standards are being discussed within international regulatorybodies. The US Environmental Protection Agency (EPA), for example, hasproposed over 1800 parameters as chemical indicators of soil quality.Within the OECD, agroenvironmental indicators (there are approximately250), including those related to soil quality, are currently being defined. Sofar, 58 have been proposed as soil quality indicators, but some of them aredifferent approaches to assessment of the same indicator, for exampleorganic matter content estimated by modelling and by analysis. The indica-tors and parameters in Table 2.1 have been proposed for soil and site assess-ment by the ISO Technical Committee 190 on ‘Soil Quality’ and correspond
18 R.G. Burns et al.
to the physical, chemical and biological parameters essential in the consid-eration of soil restoration.
Although approaches to assessing soil quality have developed inde-pendently in several countries, there is considerable overlap between theparameters listed in Table 2.1, those proposed by the SSSA (Table 2.2), andthose used in New Zealand (Table 2.3). In the case of both the USA and
Defining Soil Quality 19
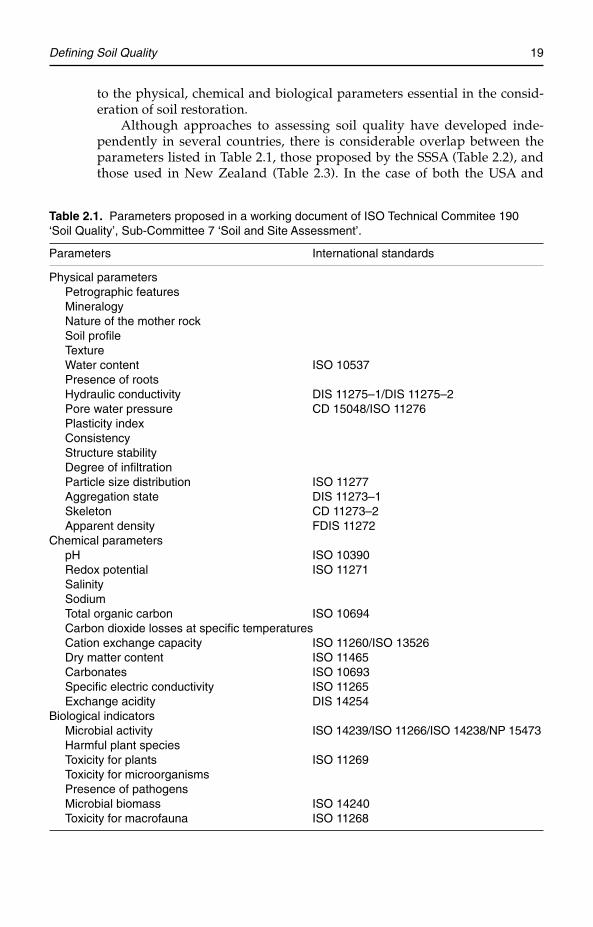
Table 2.1. Parameters proposed in a working document of ISO Technical Commitee 190‘Soil Quality’, Sub-Committee 7 ‘Soil and Site Assessment’.
Parameters International standards
Physical parametersPetrographic featuresMineralogyNature of the mother rockSoil profileTextureWater content ISO 10537Presence of rootsHydraulic conductivity DIS 11275–1/DIS 11275–2Pore water pressure CD 15048/ISO 11276Plasticity indexConsistencyStructure stabilityDegree of infiltrationParticle size distribution ISO 11277Aggregation state DIS 11273–1Skeleton CD 11273–2Apparent density FDIS 11272
Chemical parameterspH ISO 10390Redox potential ISO 11271SalinitySodiumTotal organic carbon ISO 10694Carbon dioxide losses at specific temperaturesCation exchange capacity ISO 11260/ISO 13526Dry matter content ISO 11465Carbonates ISO 10693Specific electric conductivity ISO 11265Exchange acidity DIS 14254
Biological indicatorsMicrobial activity ISO 14239/ISO 11266/ISO 14238/NP 15473Harmful plant speciesToxicity for plants ISO 11269Toxicity for microorganismsPresence of pathogensMicrobial biomass ISO 14240Toxicity for macrofauna ISO 11268

New Zealand, there is acceptance of a range of complementary parameters.The New Zealand Soil Indicators (SINDI) approach relies on a small set ofindicators matched to particular national issues, so that Olsen P is, forexample, prioritized as the principal indicator of soil fertility, and directbiological assessment is limited to a nitrogen mineralization assay whichsimultaneously provides a soil fertility indicator and acts as a surrogate formicrobial biomass. Clearly, this approach reduces the demand for time-consuming and technically complex laboratory analyses. A useful featureof SINDI is that it is supported by an on-line assessment framework(http://sindi.landcare.cri.nz, accessed 25 November 2004), in which thevalues for the different indicators can be compared with the expectednorms for particular soil types, and in which there are links to manage-ment information and advice. Although there is no minimum dataset rec-ognized for the assessment of soil quality in Canada, the samemultifaceted approach was adopted by Agriculture and Agri-FoodCanada, which included assessment of the soil organic resources,structural condition, contamination and hydrological conditions (Actonand Gregorich, 1995).
Soil quality depends on several biological, chemical and physical soilproperties and, theoretically, its definition should require the determination
20 R.G. Burns et al.
Table 2.2. Physical, chemical and biological features proposed as basic indicators of soilquality and based on the definition of Doran and Parkin (1994).
Soil features Methodology
Physical indicatorsSoil texture Water-gauge methodDepth of the soil and root systems Soil excavation and extractionApparent density and infiltration Field determination with the use of infiltration ringsWater retention features Water content at pressures of 33 kPa and 1500 kPaWater content Gravimetrical analysis (weight loss over 24 h at 105°C)Soil temperature Thermometer
Chemical indicatorsTotal organic C and N Combustion (volumetric method)pH Field and laboratory determinations with pH meterElectrical conductivity Field and laboratory determinations with a
conductometerInorganic N (NH
4+ and NO3
–), P Field and laboratory determinations and K concentrations (volumetric method)
Biological indicatorsC and N from microbial biomass Fumigation/incubation with chloroform
(volumetric method) Potentially mineralizable N Anaerobic incubation (volumetric method)Soil respiration Field determination by means of covered
infiltration rings, and in the laboratory by measuring the biomass

of these properties. Biological parameters have assumed particular impor-tance in the assessment of soil quality because organisms respond morerapidly than most chemical and physical parameters to changes in land use,environmental condition or contamination (Doran and Parkin, 1994;Nannipieri et al., 2001; Nannipieri and Badalucco, 2002; Gil-Sotres et al.,2005). It is equally well established that soil organisms play crucial roles inmany processes that underpin soil quality, such as organic matter decompo-sition and nutrient cycling, nitrogen fixation and aggregate formation andstabilization. For this reason, the size of the soil microbial biomass, respira-tion, potential nitrogen (N) mineralization, enzyme activities, abundance offungi, nematodes and earthworms have all been used as indicators of soilquality (Lee, 1985; Doran, 1987; Dick et al., 1988; Kennedy and Papendick,1995; Wall and Moore, 1999). The following chapters present some of themethods commonly used as indicators and critically evaluate their contri-bution to soil quality.
References
Defining Soil Quality 21
Table 2.3. Indicators of soil quality for New Zealand used in the SINDI (Soil Indicators)scheme (http://sindi.landcare.cri.nz).
Soil property Comments
Soil fertility indicatorOlsen P Plant-available phosphorusSoil pH Acidity or alkalinity of soil
Organic resourcesAnaerobic nitrogen mineralization Availability of the nitrogen reserve to plants and a
surrogate measure of microbial biomassTotal (organic) C Organic matter reserves, which is also positively
related to soil structure and ability to retain waterTotal N Organic N reserves
Soil physical qualityBulk density Soil compaction, physical environment for roots and
soil organismsMacroporosity Availability of water and air, retention of water,
drainage properties
Acton, D.F. and Gregorich, L.J. (1995) TheHealth of Our Soils – Towards SustainableAgriculture in Canada. Centre for Land andBiological Resources Research, ResearchBranch, Agriculture and Agri-FoodCanada, Ottawa.
Dick, R.P., Rasmunssen, P.E. and Kerle, E.A.(1988) Influence of long term residuemanagement on soil enzyme activities in
relation to soil chemical properties of awheat-fallow system. Biology and Fertilityof Soils 6, 159–164.
Doran, J.W. (1987) Microbial biomass andmineralizable nitrogen distrubution in no-tillage and plowed soils. Biology andFertility of Soils 5, 68–75.
Doran, J.W. and Parkin, T.B. (1994) Definingand assessing soil quality. In: Defining Soil

Quality for a Sustainable Environment, SoilScience Society of America SpecialPublication no. 35. SSSA, Madison,Wisconsin.
Francaviglia, R. (ed.) (2004) Agriculturalimpacts on soil erosion and soil biodiver-sity: developing indicators for policyanalysis. Proceedings of the OECD ExpertMeeting on Soil Erosion and Soil BiodiversityIndicators, 25–28 March 2003, Rome, Italy.OECD, Paris. Available at: http://webdomino1.oecd.org/comnet/agr/soil_ero_bio.nsf (accessed 17 December 2004).
Gil-Sotres, F., Trasar-Cepeda, C., Leiros, M.C.and Seoane, S. (2005) Different approachesto evaluating soil quality using bio-chemical properties. Soil Biology &Biochemistry 37, 877–887.
Kennedy, A.C. and Papendick, R.I. (1995)Microbial characteristics of soil quality.Journal of Soil and Water Conservation 50,243–248.
Lee, K.E. (1985) Earthworms: Their Ecology andRelationship with Soil and Land Use.Academic Press, London.
Nannipieri, P. and Badalucco, L. (2002)Biological processes. In: Kenbi, D.K. andNieder, R. (eds) Handbook of Processes andModelling in the Soil–Plant System. TheHaworth Press Inc., Binghampton, NewYork, pp. 57–82.
Nannipieri, P., Kandeler, E. and Ruggiero, P.(2001) Enzyme activities and microbiologi-cal and biochemical processes in soil. In:Burns, R.G. and Dick, R. (eds) Enzymes in
the Environment. Marcel Dekker, New York,pp. 1–33.
OECD (1993) OECD Core Set of Indicators forEnvironmental Performance Reviews – A syn-thesis report by the group on the state of theenvironment. Environmental Monographsno. 83. OECD/GD(93)179. Organization forEconomic Cooperation and Development,Paris.
OECD (1999) Environmental Indicators forAgriculture, vol. 2, Issues and Design. TheYork Workshop, Organization for Eco-nomic Cooperation and Development,Paris.
Rodale Institute (1991) Conference Report andAbstract, International Conference on theAssessment and Monitoring of Soil Quality.Emmaus, Pennsylvania, 11–13 July 1991.Rodale Press, Emmaus, Pennsylvania.
Van-Camp, L., Bujarrabal, B., Gentile, A.-R.,Jones, R.J.A., Montanarella, L., Olazabal, C.and Selvaradjou, S.-K. (2004) Reports of theTechnical Working Groups Establishedunder the Thematic Strategy for SoilProtection. EUR 21319 EN/3, 872 pp. Officefor Official Publications of the EuropeanCommunities, Luxembourg. Available at:http://eusoils.jrc.it/ESDB_Archive/eusoils_docs/doc.html#OtherReports (accessedon 17 December 2004).
Wall, D.H. and Moore, J.C. (1999) Interactionsunderground-soil biodiversity, mutualism,and ecosystem processes. BioScience 49,109–117.
22 R.G. Burns et al.

3 Monitoring and Evaluating SoilQuality
JAAP BLOEM,1 ANTON J. SCHOUTEN,2 SØREN J.SØRENSEN,3 MICHIEL RUTGERS,2 ADRI VAN DER WERF 4
AND ANTON M. BREURE2
1Department of Soil Sciences, Alterra, PO Box 47, NL-6700 AAWageningen, The Netherlands; 2Laboratory for Ecological RiskAssessment, RIVM, PO Box 1, NL-3720 BA Bilthoven, The Netherlands;3Department of General Microbiology, Institute of Molecular Biology,University of Copenhagen, Sølvgade 83H, DK 1307K Copenhagen,Denmark; 4Plant Research International, PO Box 16, NL-6700 AAWageningen, The Netherlands
Abstract
Soil quality influences agricultural sustainability, environmental quality and, conse-quently, plant, animal and human health. Microorganisms are useful indicators ofsoil quality because they have key functions in the decomposition of organic matter,nutrient cycling and maintenance of soil structure. We summarize methods used formonitoring biomass, activity and diversity of soil organisms and show some resultsof the Dutch Soil Quality Network.
In contaminated soils microbial community structure was changed, but diversitywas not always reduced. In contrast, microbial biomass and activity were reducedmarkedly. In agricultural soils there were large differences between different cate-gories of soil type and land use. Organic management resulted in an increased roleof soil organisms, as indicated by higher numbers and activity. Replacement of min-eral fertilizers by farmyard manure stimulated the bacterial branch of the soil foodweb. Reduced availability of mineral nutrients appeared to increase fungi, presum-ably mycorrhizas. Bacterial DNA profiles did not indicate low genetic diversity inagricultural soils, compared with some acid and contaminated soils. Organic farmsdid not show higher genetic diversity than intensively farmed areas. At extensivegrassland farms and organic grassland farms nitrogen mineralization was about50% higher than on intensively farmed areas. Also, microbial biomass and activity,and different groups of soil invertebrates, tended to be higher.
Soil biodiversity cannot be monitored meaningfully with only a few simple tools.Extensive and long-term monitoring is probably the most realistic approach to obtainobjective information on differences between, changes within, and human impact on,ecosystems. In most countries, microbial biomass, respiration and potential nitrogen
©CAB International 2006. Microbiological Methods for Assessing Soil Quality(eds J. Bloem et al.) 23

(N) mineralization are regarded as part of a minimum data set. Adding the mainfunctional groups of the soil food web brings us closer to understanding biodiversity,potentially enabling us to relate the structure of the soil community to functions.
Soil Quality Monitoring and Microbiological Indicators
Following adoption of the Treaty on Biological Diversity of Rio de Janeiro(UNCED, 1992), participating governments have been concerned about theprotection of endangered species, mainly plants and larger animals. Viablenature conservation areas, consisting of core areas linked by transitionzones, have been developed. In addition, there is increasing concern, atboth the national and the international level, about sustainable use of bio-diversity and maintenance of life support functions such as decompositionand nutrient cycling (FAO, 1999; OECD, 2003; Schloter et al., Chapter 4, thisvolume). In all soils, these vital ecosystem processes depend largely on theactivities of microorganisms and small soil invertebrates that are rarelyvisible with the naked eye (also called ‘cryptobiota’).
Soil quality determines agricultural sustainability, environmental qual-ity and, consequently, plant, animal and human health (Doran and Parkin,1996). This chapter provides an introduction to biological approachespresently used in different countries to monitor and evaluate soil quality.Monitoring was initiated in several countries in 1992, but little informationhas been exchanged or published in the international literature so far. Thischapter is based mainly on the experience of the Dutch Soil QualityNetwork (Schouten et al., 2000; Bloem and Breure, 2003; Bloem et al., 2004),and discussions of the working groups of EU COST Action 831‘Biotechnology of Soil, Monitoring, Conservation and Remediation’.
Soil quality has been defined as ‘the capacity of a soil to function withinecosystem boundaries to sustain biological productivity, maintain environ-mental quality, and promote plant and animal health’ (Doran and Parkin,1994; Stenberg, 1999). The phrase ‘within ecosystem boundaries’ impliesthat each soil is different. There are no absolute quality estimates and eachsoil must be evaluated in relation to natural differences such as soil type,land use and climate. The term ‘soil quality’ is often used to describe the fit-ness of a soil for (agricultural) use, while the term ‘soil health’ is seen moreas an inherent attribute regardless of land use. Often these terms are used assynonyms. There are many definitions of soil quality and soil health (Burnset al., Chapter 2, this volume). Quality or health of an ecosystem is a valuejudgement. Although ecological health has been criticized as a nebulousconcept in a scientific context, a useful consequence of that notion is thatenvironmental monitoring programmes need to adopt a holistic ecosystemapproach (Lancaster, 2000). Many different aspects need to be measured,including physical, chemical and biological characteristics. Here we focuson soil organisms and the processes they mediate.
An agricultural soil usually contains about 3000 kg (fresh weight) ofsoil organisms per hectare. This is equivalent to 5 cows, 60 sheep or 35
24 J. Bloem et al.

farmers living under the surface. Many thousands of species (or genotypes)contribute to a huge below-ground biodiversity. Soil invertebrates fragmentdead organic matter and thus facilitate decomposition. Their direct contri-bution to the biochemical modification or flux of organic residue is usuallysmall compared with the contribution of bacteria and fungi. Decompositionby bacteria and fungi causes release of mineral nutrients (mineralization)essential for plant growth. Mineralization is further performed by organ-isms that feed on bacteria and fungi (bacterivores and fungivores), such asprotozoa and nematodes. Some small soil invertebrates (e.g. nematodes)feed directly on plant roots (herbivores). Predators eat other, usuallysmaller, soil invertebrates, and omnivores feed on different food sources.All these trophic interactions in the soil food web contribute to the flow ofenergy and nutrients through the ecosystem (Hunt et al., 1987). Models pre-dict that the abundances of the different functional groups of organisms, i.e.the structure of the soil food web, affect the stability of the soil ecosystem(De Ruiter et al., 1995). Mycorrhizal fungi that live in symbiosis with plantroots promote the uptake of mineral nutrients by plants. Bacteria, fungi andinvertebrates glue soil particles together, form stable aggregates and thusimprove soil structure. Invertebrates also improve soil structure by mixingthe soil (bioturbation).
The following comprise the main functional groups of the soil food web:
• Earthworms consume plant residues and soil, including (micro)organ-isms. Often they form the major part of the soil fauna biomass, withmaximally 1000 individuals/m2, 3000 kg fresh biomass/ha, or a fewhundred kg of carbon (C) per hectare.
• Enchytraeids are relatives of earthworms with a much smaller size anda similar diet. Their population densities are between 102 and 106/m2,with a biomass up to 1 kg C/ha.
• Mites (fungivores, bacterivores, predators) have a size of about 1 mm,population densities of 104–105/m2, and a biomass of up to 0.1 kg C/ha.
• Springtails (fungivores, omnivores) also have a size of about 1 mm.They reach population densities of 103–105/m2 and a biomass of up to1 kg C/ha.
• Nematodes (bacterivores, herbivores, fungivores, predators/omni-vores) have a size of about 500 µm, population densities of 10–50/gsoil, and a biomass up to 1 kg C/ha.
• Protozoa (amoebae, flagellates, ciliates) are unicellular animals with asize of 2–200 µm, population densities of about 106 cells/g soil, and abiomass of about 10 kg C/ha.
• Bacteria are usually smaller than 2 µm, with population densities ofabout 109 cells/g soil, and a biomass of 50–500 kg C/ha.
• Fungal hyphae usually have diameters from 2 µm to 10 µm, and reachtotal lengths of 10–1000 m/g soil, and a biomass of 1–500 kg C/ha.
These cryptobiota (hidden soil life) play a key role in life support functions(Bloem et al., 1997; Brussaard et al., 1997, 2003; Bloem and Breure, 2003), butare not part of any recognized list of endangered species. It is questionable
Monitoring and Evaluating Soil Quality 25

whether a species-based approach is sufficient to attain a sustainable use ofecosystems inside, and especially outside, protected areas. Therefore,research networks have been initiated to monitor large areas, includingagricultural soils.
Since about 1993, national or regional programmes have been estab-lished in several countries to monitor soil quality and/or the state of biodi-versity (Stenberg, 1999; Nielsen and Winding, 2002). These include: Canada(23 sites), France, parts (Bundesländer) of Germany (about 350 sites; Höper,1999; Oberholzer and Höper, 2000), parts (cantons) of Switzerland (Maurer-Troxler, 1999), the Czech Republic, the UK, Austria, the USA (21 sites;Robertson et al., 1999) and New Zealand (500 sites; G. Sparling et al.,http://www.landcareresearch.co.nz, accessed 30 January 2004).
In The Netherlands, 200 sites are part of the Dutch Soil QualityNetwork, consisting of ten categories of a specific soil type with a specificland use, with 20 replicates per category (Schouten et al., 2000). The repli-cates are mainly conventional farms. The 200 sites are representative of 70%of the surface area of The Netherlands. In addition, 50–100 sites from out-side this network are sampled; for instance, organic farms or polluted areaswhich are supposed to be good and bad references, respectively. Each yeartwo types of soil and land use are sampled (40 sites plus reference sites).Thus, it takes 5 years to complete one round of monitoring the whole net-work of 200 sites plus references. In 1993, the Dutch network started toobtain policy information on abiotic soil status. The aim was to measurechanges over time and finally to evaluate the actual soil quality. A set of bio-logical indicators has been included since 1997, consisting of microbiologi-cal indicators and several soil fauna groups, in order to take a cross-sectionthrough the soil ecosystem.
In most countries one or more microbiological indicators have beenincluded. As part of a monitoring system, microorganisms are useful indi-cators of soil quality because they have key functions in decomposition oforganic matter and nutrient cycling, they respond promptly to changes inthe environment and they reflect the sum of all factors regulating the degra-dation and transformation of organic matter and nutrients (Stenberg, 1999;Bloem and Breure, 2003).
Sampling
For the application of microbiological indicators a lot of methodologicalchoices have to be made.
How can variation in space and time be accounted for?
Mainly by taking many replicates and aiming at long-term monitoring.Samples can be taken from replicated field plots or can be pooled from
26 J. Bloem et al.

larger areas. In The Netherlands, about 20 farms (replicates) spread over thecountry are sampled per category of soil type and land use. One mixedsample per farm (about 10–100 ha) is made up of 320 cores. These mixedsamples are used for chemical, microbiological and nematode analyses.Separate soil cores or blocks (six replicates per site) are taken for analysis ofmites, enchytraeids and earthworms. Some reference sites consist of smallercontaminated areas or experimental fields. Here replicated field plots(about 10 m × 10 m) are sampled.
Sampling depth is best decided by considering soil horizons and tillagedepth (Stenberg, 1999). In a ploughed arable field, 0–25 cm would be appro-priate; in grassland, and especially in forest, higher numbers of thinner lay-ers would be better. However, this would result in a variable samplingdepth or an increase in the number of samples by taking more than onelayer. Given the large number of samples, analysing more than one depthwould be too time consuming and expensive. Sampling 0–25 cm woulddilute microbial activity considerably in some grassland and forest soils,where life is concentrated closer to the surface. Therefore, in the Dutchmonitoring network, samples are taken from 0–10 cm depth and litter isremoved before sampling. To reduce variation caused by variable weatherconditions, samples are pre-incubated for 4 weeks at constant temperature(12°C) and moisture content (50% of water-holding capacity) before micro-biological analyses are performed. Since each soil and land-use type in themonitoring network is analysed once every 5 years, effects of a dry summer,for instance, should be minimized.
Samples can be sieved through 2 mm or 5 mm mesh-size, or not at all.In The Netherlands and in Sweden, soil is sieved through 5 mm and 4 mmmesh sizes, respectively (it is practically impossible to pass a heavy clay soilthrough a 2 mm sieve). Sieving is useful to reduce variation in process ratemeasurements, such as respiration and mineralization, to facilitate mixingand to allow identical subsamples to be sent to different laboratories.However, sampling and sieving are major disturbances, which generallyincrease microbial activity and also reduce soil structure. Therefore, theresults of the first week of incubation are not used for calculation of processrates.
When should samples be taken?
For microbiological parameters, early spring or late autumn is the best time.Then soil conditions are relatively mild and stable, and short-term effects ofthe crop are avoided. These periods are proposed in Sweden (Stenberg,1999). In The Netherlands, for practical reasons, samples are taken fromMarch to June. The land must be dry enough to access, and farmers prefersampling of arable land before soil tillage and sowing new crops. Samplingof about 50 farms takes 2–3 months.
Monitoring and Evaluating Soil Quality 27
Storage and Pre-incubation of Soil
How should samples be stored: at –20°C, 1–5°C or field temperature? Forhow long? Obviously it is best to perform soil biological analyses soon aftersampling. On the other hand, storage is inevitable when large amounts ofsamples from many sites have to be handled. The preferred method forstoring soil samples in different countries appears to be related to the cli-mate. In Sweden and Finland, freezing at –20°C for at most 1 year is prac-tised. Stenberg et al. (1998) found that the effects of freezing were generallysmaller than those of refrigeration. They suggested that microflora in north-ern soils, subjected annually to several freeze and thaw cycles, may haveadapted to this stress factor. In the UK, Denmark, Germany andSwitzerland soil samples are stored at 4°C, and in Italy samples are air-dried. It is generally recommended that samples for microbial analysis arestored at 2–4°C (Wollum, 1994; Nielsen and Winding, 2002). Biomass andactivity usually tend to decrease during storage because available organicsubstrates are slowly depleted. This decrease is supposed to be slower at4°C in a refrigerator, and may be stopped by freezing. However, in frozensamples we have found more than 50% reduction in bacterial cell numbersas counted by direct microscopy.
Using sandy soil from arable fields and grassland (Korthals et al., 1996),we investigated the effects of storage for 6 months at 12°C, 2°C and –20°C.After storage, the soil was pre-incubated for 4 weeks at 12°C and 50% water-holding capacity, and subsequently analysed. The samples were taken in May,when the moisture content in the field was between 14% and 20% (w/w), cor-responding to 47–67% of the water-holding capacity of the soil. The soil was afimic anthrosol (FAO classification) with a texture of 3% clay, 10% silt, 87%sand, an organic carbon content of 2–3% (w/w) and a pH(-KCl) of 5. Theresults of the stored samples were compared to results of microbiologicalanalyses started 1 day after sampling. With all storage methods, bacterial bio-mass, as determined by microscopy and image analysis, did not decline ingrassland soil but was strongly reduced (–70%) in arable soil (Fig. 3.1).
Bacterial growth rate (thymidine incorporation) showed the opposite: itremained high in arable soil but was strongly reduced in grassland soil dur-ing storage at 12°C and 2°C. Thus, grassland bacteria (apparently k-strate-gists or persisters) survived better than arable soil bacteria (apparentlyr-strategists or colonizers). Grassland may select for persisters because it isa more stable environment with a relatively constant food supply fromgrass roots, whereas arable soils may favour colonizers because substrateinputs are highly seasonal. Thus, effects of storage may be different for dif-ferent microbial communities (e.g. from grassland versus arable land) andparameters (e.g. biomass versus growth rate). After freezing, growth ratehad doubled in arable soil. With all storage methods, respiration (CO2 evo-lution) decreased by at least 40%. N mineralization was strongly reducedafter storage at –20°C and in the arable soil also at 2°C. This may have beencaused by N immobilization during re-growth of bacteria when the temper-ature was increased. Reduction in N mineralization was less at 12°C but
28 J. Bloem et al.

here it had decreased in grassland soil and increased in arable soil. Stenberget al. (1998) reported that N mineralization capacity was greatly influencedby freezing, but that other parameters, such as basal respiration and micro-bial biomass, were only a little affected. After storage for 6 months,followed by 1 month pre-incubation, the number of bacterial DNA bands,as obtained by denaturing gradient gel electrophoresis, was reduced byabout 20%, and some qualitative changes had occurred in the DNA bandingpattern, regardless of the storage temperature. Our results support the viewthat soil samples for microbiological analyses should be stored for as short atime as possible (Anderson, 1987; Zelles et al., 1991).
In the Dutch monitoring programme, storage of soil samples for 1–2months is inevitable. This will cause extra variation in the results. InGermany and Switzerland, soil samples are stored for 6 months at most. InThe Netherlands, a storage temperature of 12°C was chosen, which is closeto the average annual soil temperature. The optimum storage method maydiffer for different microbiological parameters. However, using more thanone storage method increases handling time and cost of monitoring.Moreover, microbiological parameters can best be related to each otherwhen they are measured in the same portion of soil. In the Dutch soil moni-toring network, after storage at 12°C, the samples are pre-incubated for 4weeks at 12°C and 50% of the water-holding capacity. In Sweden, afterfreezing, samples are pre-incubated for a few days. In the UK, Germany
Monitoring and Evaluating Soil Quality 29
0
50
100
150
200
Field +12°C +2°C −20°C
Grass Arable
(Not stored) Storage temperature for 6 months
Bac
teria
l bio
mas
s (µ
g C
/g s
oil)
0
20
40
60
80
100
120
140
Field +12°C +2°C −20°C
Grass Arable
(Not stored) Storage temperature for 6 months
C m
iner
aliz
atio
n (m
g C
/kg/
wk)
0
10
20
30
40
50
Field +12°C +2°C −20°C
Grass Arable
(Not stored) Storage temperature for 6 months
Thy
mid
ine
inco
rpor
atio
n(p
mol
/g/h
)
0
5
10
15
20
Field +12°C +2°C −20°C
Grass Arable
(Not stored) Storage temperature for 6 months
N m
iner
aliz
atio
n (m
g N
/kg/
wk)
Fig. 3.1. Effect of storage of soil samples on bacterial biomass and growth rate (thymidineincorporation), soil respiration (C mineralization) and N mineralization. Error bars indicatestandard error (SE), n = 3.

and Italy, after storage soils are pre-incubated for 1–2 weeks. Also, the opti-mum time of pre-incubation may depend on the parameters to be mea-sured. Measurement of potential microbial activities in slurries at 37°C, asin Sweden (Torstensson et al., 1998), may require a shorter pre-incubationthan measurements in soil under conditions similar to those in the field, asin The Netherlands.
Methods and Choice of Indicators
A range of methods is used to assess the amount (biomass), activity anddiversity of soil organisms (Akkermans et al., 1995; Alef and Nannipieri,1995). No one method is best suited for all purposes and they need calibra-tion and standardization before use (Paul et al., 1999). A selection of meth-ods is described in this book. Here, we summarize methods that areapplicable to relatively large amounts of samples and which are alreadyused in monitoring programmes.
Biomass
For methods see Chapter 6.
• Chloroform fumigation extraction (CFE): the soil is fumigated withchloroform, which permeabilizes cell membranes. The increase inextractable organic carbon (and nitrogen), compared to an unfumigatedcontrol, is a measure of the total microbial biomass (C and N).
• Substrate-induced respiration (SIR): a substrate (glucose) is added tosoil at a saturating concentration and is utilized by microorganisms.The increased CO2 evolution in the first few hours before a growthresponse occurs, compared to that of an unamended control, is a mea-sure of the (responsive) microbial biomass.
• Direct microscopy can be combined with automatic image analysis(Bloem et al. 1995, Paul et al., 1999): number and body size are deter-mined and biomass is calculated. This can be done for different groups,e.g. fungi and bacteria. Fungi and bacteria are counted directly in soilsmears after fluorescent staining. Since their numbers are much lower,soil invertebrates (nematodes, springtails, mites, etc.) are extracted fromthe soil before counting and identification.
Activity
For methods see Chapter 7.
• Respiration: CO2 evolution under standardized conditions in the labo-ratory, without addition of substrates (basal respiration).
30 J. Bloem et al.

• Bacterial growth rate: incorporation rate of [3H]thymidine and[14C]leucine into bacterial DNA and proteins during a short incubation(1 h).
• Potential N mineralization: increase in mineral N under standardizedmoisture content and temperature in the laboratory, without addition ofsubstrate.
• Potential nitrification: conversion of added NH4+ via NO2
– to NO3–
under optimal conditions.• Enzyme activities, e.g. dehydrogenase, phosphatase, cellulase.
Diversity/community structure
For methods see Chapter 8.• DNA profiles obtained by DGGE or TGGE (denaturing or temperature
gradient gel electrophoresis): DNA is extracted from soil, amplified byPCR (polymerase chain reaction) and separated by gel electrophoresis.This results in a banding pattern where the number of DNA bandsreflects the dominant genotypes and genetic diversity (Fig. 3.2).
• Community-level physiological profiles (CLPP): the ability to utilize arange of (31 or 95) sole-carbon-source substrates is tested in BiologTM mul-tiwell plates. Colour development in a well indicates utilization of a spe-cific substrate. The pattern of colour development characterizes thefunctional diversity, if equal amounts of bacterial cells are added. If a fixedamount of soil is added, it reflects the number of active bacteria (Fig. 3.3).
• Phospholipid fatty acid (PLFA) analysis: PLFAs are essential membranecomponents of living cells. Specific PLFAs predominate in certain taxo-nomic groups and are relatively conservative in their concentrationswithin them. Measuring the concentrations of different PLFAs extractedfrom soils can, therefore, provide a biochemical fingerprint of the soilmicrobial community. The PLFA profiles reflect the community struc-ture and show which groups are dominant. PLFAs do not, however,give any quantitative information about the number of species.
• Soil fauna: (usually microscopic) enumeration and identification offunctional groups or species.
All these methods measure different aspects of microbial communities,and a combination of methods is needed for monitoring the diversity andfunctioning of soil microorganisms.
The choice of methods depends on the questions asked and both theexpertise and budget available. Microbial biomass, respiration per unit ofbiomass (qCO2) and also biodiversity are regarded as the most sensitiveparameters, especially to assess the effects of soil contamination (Brookes,1995; Giller et al., 1998). The following is a list of the methods used for mon-itoring in several countries.
• Germany: microbial biomass (SIR), respiration, soil enzymes (Höper,1999).
Monitoring and Evaluating Soil Quality 31
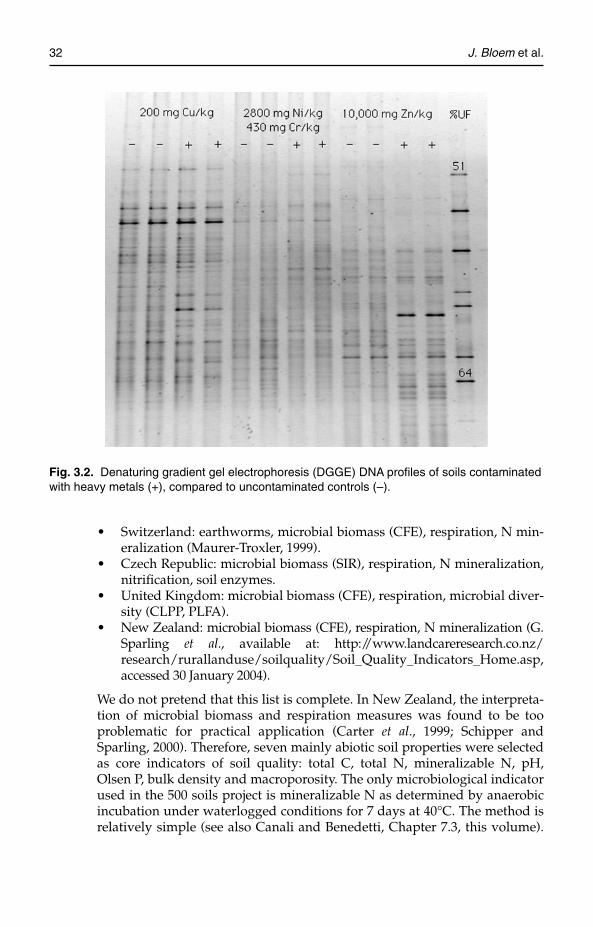
• Switzerland: earthworms, microbial biomass (CFE), respiration, N min-eralization (Maurer-Troxler, 1999).
• Czech Republic: microbial biomass (SIR), respiration, N mineralization,nitrification, soil enzymes.
• United Kingdom: microbial biomass (CFE), respiration, microbial diver-sity (CLPP, PLFA).
• New Zealand: microbial biomass (CFE), respiration, N mineralization (G.Sparling et al., available at: http://www.landcareresearch.co.nz/research/rurallanduse/soilquality/Soil_Quality_Indicators_Home.asp,accessed 30 January 2004).
We do not pretend that this list is complete. In New Zealand, the interpreta-tion of microbial biomass and respiration measures was found to be tooproblematic for practical application (Carter et al., 1999; Schipper andSparling, 2000). Therefore, seven mainly abiotic soil properties were selectedas core indicators of soil quality: total C, total N, mineralizable N, pH,Olsen P, bulk density and macroporosity. The only microbiological indicatorused in the 500 soils project is mineralizable N as determined by anaerobicincubation under waterlogged conditions for 7 days at 40°C. The method isrelatively simple (see also Canali and Benedetti, Chapter 7.3, this volume).
32 J. Bloem et al.
Fig. 3.2. Denaturing gradient gel electrophoresis (DGGE) DNA profiles of soils contaminatedwith heavy metals (+), compared to uncontaminated controls (–).

Mineralizable N is regarded as a measure of readily decomposed organic N,and as a measure of biological activity (Hill et al., 2004). Thus, in most coun-tries a relatively small number of variables is monitored, usually at a rela-tive large number of sites (up to 500 in New Zealand). In the USA, incontrast, a large number of methods and variables are used at a limitednumber of 21 long-term ecological research sites (Robertson et al., 1999).
In the Dutch Soil Quality Network, besides chemical and physical vari-ables, nematodes have been measured since 1993. Since 1997 a wider rangeof biological variables has been included (Schouten et al., 2000):
• bacterial biomass (microscopy and image analysis);• bacterial growth rate (thymidine and leucine incorporation into DNA
and proteins);• bacterial functional diversity (substrate utilization profiles using
BiologTM);• bacterial genetic diversity (DNA profiles using DGGE);• potential carbon and nitrogen mineralization (6-week laboratory incu-
bations);• nematodes, abundance and diversity;• mites, abundance and diversity;• enchytraeids, abundance and diversity;• earthworms, abundance and diversity.
Thus, important processes and functional groups of the soil food webare included. A relatively large number of biological variables was chosenbecause monitoring of soil biodiversity had a high priority. Each variable ismeasured in a single specialized laboratory, using a single method.
Monitoring and Evaluating Soil Quality 33
Control soil Copper-polluted soil
Fig. 3.3. Community-level physiological profiles: utilization of different substrates in BiologTM
plates.

Earthworms, enchytraeids, mites and nematodes are included as importantfunctional groups of soil fauna. Microbial indicators currently used are bac-terial biomass, growth rate, functional diversity and genetic diversity(Bloem and Breure, 2003). These different microbial indicators are measuredin the same subsamples of soil after pre-incubation for 4 weeks at 12°C and50% of the water-holding capacity (WHC). Potential carbon and nitrogenmineralization are determined in soil incubated for 6 weeks at 20°C and50% WHC. C and N mineralization rates are calculated from differences inCO2 and mineral N concentrations between week six and week one. Resultsof the first week are not used, to avoid disturbance effects of samplehandling.
Results from Contaminated and Experimental Reference Sites
In the Dutch Soil Quality Network, large areas of about 50 ha (mainlyfarms) are sampled and the replicates within categories of soil type andland use are spread all over the country. Some of the reference sites weresmaller long-term experimental fields and contaminated sites. Such sites areexpected to show the most clear and contrasting results.
In a heavily contaminated field soil (10,000 mg zinc/kg), bacterial DGGEDNA profiles showed a significantly reduced diversity compared to remedi-ated plots (31 versus 50 DNA bands). Also, in a slightly contaminated soil(160 mg copper/kg), the number of DNA bands was reduced from 50 to 42.However, in a soil contaminated with nickel and chromium (2800 mg/kg and430 mg/kg, respectively) there was no reduction in the number of DNAbands. In all cases contamination caused significant qualitative changes in theDNA profiles (Fig. 3.2). Also, community-level physiological profiles(BiologTM) indicated changes in the community structure (results not shown).Thus, community structure changed, but diversity was not always reduced inseriously contaminated soils. Biomass contents for different groups of organ-isms, respiration and mineralization were much more reduced than diversity.Bacterial growth rate (thymidine incorporation) was the most sensitive, withdecreases of more than 70% (Bloem and Breure, 2003). Thus, biological indi-cators showed significant reductions in contaminated soils.
Less extreme effects may be expected in agricultural soils. Sustainableagriculture aims at maintaining good crop yields with minimal impact onthe environment, while at least avoiding deterioration in soil fertility andproviding essential nutrients for plant growth. Further, sustainable agricul-ture supports a diverse and active community of soil organisms, exhibits agood soil structure and allows for undisturbed decomposition (Mäder et al.,2002). Therefore, agricultural practices are adjusted to integrate organic, ormore extensive, management. The main principles are to restrict stockingdensities, avoid synthetic pesticides, avoid mineral fertilizers and useorganic manure (Hansen et al., 2001). Finally, this will result in an increasedrole of soil organisms, e.g. decomposers, nitrogen fixers and mycorrhizas, inplant nutrition and disease suppression.
34 J. Bloem et al.

Indeed, larger microbial biomass, diversity (BiologTM), enzyme activi-ties, more mycorrhizas and higher earthworm abundance have beenobserved in organic farming during a 20-year experiment in Switzerland(Mäder et al., 2002). Application of farmyard manure, instead of mineralfertilizer, stimulates the bacterial branch of the soil food web. In fields thathad received farmyard manure for 45 years (Marstorp et al., 2000), we founda fourfold greater bacterial biomass than in fields that received only mineralnitrogen (Fig. 3.4). Bacterial biomass was lower (twofold) with sewagesludge. However, a larger input of organic matter does not necessarily leadto more bacterial biomass. Arable fields under integrated farming showedgreater bacterial activity but not a significantly larger bacterial biomass(Bloem et al., 1994); this was attributed to bacterivorous protozoa andnematodes, which reached 20–60% greater densities. N mineralization bythe soil food web was 30% higher than in conventional fields. This com-pensated for a 35% smaller input of mineral fertilizer in the integrated fieldsand supported a crop yield of 90% of that in the conventional fields.
In grassland plots that received no (O) or incomplete (N only, or PK)mineral fertilization for 50 years, there was up to 2.5 times more fungal bio-mass than in plots with full mineral fertilization (NPK) (Fig. 3.5). Liming(Ca) had the same effect as fertilization because this stimulated mineraliza-tion of the high amount of organic matter (20%) in this clay soil. Part of thefungal biomass may have been mycorrhizas, which support plant nutritionat low availability of mineral nutrients. The grassland plots that received nomineral nitrogen had high plant diversity (40 species) whereas N-fertilizedplots contained low plant diversity (20 species). There was no simple quan-titative relationship between above-ground and below-ground diversity. Thenumbers of bacterial DNA bands (61–72) were not significantly different.Nevertheless, there are qualitative relationships between above- and below-ground diversity. Principal component analysis clearly separated soilbacterial DNA profiles of grassland plots from those of arable plots on the
Monitoring and Evaluating Soil Quality 35
020406080
100120140160180
Ca(NO3)2 NH4SO4 Manure Sludge
Bac
teria
l bio
mas
s (µ
g C
/g s
oil)
Fig. 3.4. Effect of fertilization on bacteria inarable fields, Ultuna, Sweden; experimentbegan 1956. Error bars indicate SE, n = 3.
Fig. 3.5. Effect of fertilization on fungalhyphae in grassland, Ossekampen, TheNetherlands; experiment began 1950. Errorbars indicate SE, n = 2. O, no NPK.
0
250
500
750
1000
1250
1500
O N PK NPK Ca
Fun
gal b
iom
ass
(µg
C/g
soi
l)

same soil sampled on the same date. However, with samples of four differ-ent seasons, temporal variation in the DNA profiles impeded a clear separa-tion. Spatial variation in DNA profiles was small between replicate plots onthe same field, but large between different sites. The variation between10–20 farms of the same category was as large as the differences betweencategories of intensive, organic and extensive grassland farms on sand.Therefore, qualitative information (community structure) is more difficultto handle than quantitative information, such as the number of species(richness) and relative abundances (evenness). Richness and evenness arecombined in the Shannon diversity index (Atlas and Bartha, 1993).
The Dutch Soil Quality Network: Results of the First Year
In the first year (1997), a pilot study was performed to test whether theselected biological variables were sufficiently reproducible when applied inlarge-scale monitoring using mixed samples of whole farms. In that year,mites were included at only two reference farms, where the total food webstructure was determined, including important functional groups such asfungi and protozoa. Thus, for these two farms, C and N mineralization werecalculated using a food web model, where mineralization rates are calcu-lated from the observed biomasses of different functional groups of soilorganisms. Food web modelling was also used to predict food web stability(De Ruiter et al., 1995). The budget was not sufficient to adopt this funda-mental and comprehensive approach in the routine programme. Originally,potential nitrification was included in the programme, but in 1999 this indi-cator was replaced by potential C and N mineralization. Also in 1999,genetic diversity of bacteria was included because of increased political andscientific interest in biodiversity and because molecular techniques becameavailable for routine use.
Results of the first year (1997) of the Dutch Soil Quality Network aresummarized in Table 3.1. In this year agricultural grasslands on sea-clay andhorticultural farms (bulbs and vegetables) on various soils were sampled.Sea-clay (Dutch classification) encompasses soils in loam and clay depositsof marine origin. Both types of soil are managed intensively, but frequenciesof soil tillage and pesticide application are higher in horticulture. Soil pH-KCl was 6.5 in both categories. The grassland soils had a significantly highercontent of clay (24% versus 7%) and organic matter (6.2% versus 2.8%) thanthe horticultural soils. Correspondingly, the cation exchange capacity (CEC)was significantly lower in the horticultural soils (6.5 cmol+/kg versus22 cmol+/kg). In spite of the lower P-binding capacity, the horticultural soilshad a higher phosphate content (0.77 mg P2O5/g versus 0.41 mg P2O5/gsoil), which is attributed to a higher degree of fertilization. Contents ofheavy metals (cadmium, copper, lead and zinc), some formerly used per-sistent pesticides (DDT, HCB, dieldrin and lindane) and polyaromatichydrocarbons (phenanthrene and benzo(a)pyrene) were at acceptableconcentrations and not significantly different between the categories.
36 J. Bloem et al.

Monitoring and Evaluating Soil Quality 37
Table 3.1. Indicators measured in 20 agricultural grasslands on sea-clay and 17 horticulturalfarms on various soils.
StatisticalGrassland on significance
sea-clay Horticulture of differenceSoil biota Indicators (n = 20) (n = 17) Grl. – Hort.
Bacteria Thymidine incorp. 179 108 ***(pmol/g/h)Leucine incorp. (pmol/g/h) 847 392 ***Bacterial biomass (mg C/g) 232.4 56 ***Colony-forming units (107/g) 17.1 2.6 ***Potential nitrification 93 74 ***(mg NO3-N/kg/week)
Biolog™ LogCFU-50 (number of 3.73 2.87 ***CFU corresponding with 50% activity)H-coefficient (evenness of 0.39 0.60 ***decomposition of 31 substrates)Gg50 (�g soil with 50% 95 44 *activity)
Nematodes Abundance (number/100 g) 4,629 2,069 ***Number of taxa 26.1 21.8 *Maturity index 1.77 1.47 ***Trophic diversity index 2.12 1.51 ***Number spec. bacterial 11.4 13.3 *feedingNumber spec. carnivores 0.4 0.6 nsNumber spec. hyphal 2.1 2.1 nsfeedingNumber spec. omnivores 1.0 1.2 nsNumber spec. plant 11.4 4.5 ***feedingNumber of functional 3.9 4.3 nsgroups
Enchytraeids Abundance (number/m2) 24,908 16,096 **Number of taxa 8.2 5.5 ***Biomass (g/m2) 5.6 1.1 ***Number of Friderica 8,654 1,300 ***(number/m2)
Earthworms Abundance (number/m2) 317 40 ***Biomass (g/m2) 70.1 3.8 ***Endogé-species (deeper 2.10 0.82 ***in soil)Epigé-species (closer to 1.2 0.06 ***surface)
(n = 1) (n = 1)
Mites Abundance (number/m2) 37,900 18,100Number of species 23 20Number of functional 8 10groups
Food web N-mineralization (kg N/ha/yr) 335 115(model- C-mineralization (kg C/ha/yr) 6,150 1,750calculations) Stability 0.47 0.61
CFU, colony-forming units; Grl., grassland; Hort., horticulture; ns, not significant.

In a single soil, thymidine incorporation, leucine incorporation and bac-terial biomass usually show coefficients of variation (CV) of 10%, 5% and30%, respectively. In the national monitoring programme, variation is muchlarger because of differences between farms. The variation between 20 repli-cate farms of the same category was about 30% for the growth rate mea-surements and about 60% for the biomass measurements. With 20replicates, this results in standard errors of about 7% and 13% of the mean.This is sufficient to establish statistical differences between categories.Analyses of variance of (log transformed) data yielded a significance (P)< 0.001 for most indicators (Table 3.1), thus demonstrating reproducibilityand discriminative power.
Thymidine and leucine incorporation indicated a 50% lower bacterialgrowth rate in horticulture compared to grassland. Bacterial biomass in hor-ticulture was only 25% of the biomass in the grasslands. Thus, the specificgrowth rate per unit of bacterial biomass was twofold higher in the horticul-tural soils. Also, the results of the BiologTM assay indicated a greater specificactivity of bacteria in the horticultural soils. Using BiologTM ECO-plates, thedecomposition of 31 different carbon sources can be tested (in triplicate) in96 wells of a microtitre plate. Of each soil suspension, four different dilutionswere incubated in BiologTM ECO-plates, and colony-forming units (CFU)were counted in parallel (for methods see Rutgers and Breure, 1999; Breureand Rutgers, 2000; Chapter 8, this volume). LogCFU-50, the number of CFUgiving 50% activity, was smaller in the horticultural soils, and thus the activ-ity per CFU greater. The activity in BiologTM plates is measured as averagecolour development in the wells, reflecting respiration and growth. Potentialnitrification was high in all grasslands and in most horticultural soils. Onaverage, the rate of potential nitrification was 20% smaller in horticulture. Inthree (out of 17) horticultural farms, potential nitrification rate was at least50% slower than in the other soils. Most indicators were lower in the horti-cultural soils. Food web modelling, applied to only two farms, indicatedlower carbon and nitrogen mineralization in the soil of a horticultural farmcompared to a grassland farm. Predicted soil food web stability was higheron the horticultural farm. It may be speculated that under intensive manage-ment more stress-resistant organisms are selected.
Presentation of results
The large amount of data in Table 3.1 is not suitable for presentation toeither policy makers or the public. The results can be presented in a moreclear and illustrative way for diagnostic purposes using the AMOEBAmethod (Ten Brink et al., 1991), or similar cobweb or star diagrams(Stenberg, 1999; Mäder et al., 2002). The former method results in anamoeba-like graphical representation of all indicator values, scaled againsta historical, undisturbed or desired situation. As an example, the indicatordata from one organic grassland farm were used as a reference for theintensively managed farms (Fig. 3.6).
38 J. Bloem et al.

The value of each variable in the reference was scaled as 100%. Thisyields a circle of 100% values for the reference. In the example, mite faunaand total food web structure were omitted due to lack of data from the ref-erence. Almost all the indicative parameters of the 20 grassland farmsappeared within the 100% circle. Apparently, biodiversity within functionalgroups, and process rates, were lower in intensive than in organic grass-land. Only bacterial biomass was much greater (312%), which was reflectedin the diversity of bacterial-feeding nematodes (126%). Despite the largebacterial biomass, its activity (indicated by the number of colony-formingunits, potential nitrification and [14C]leucine and [3H]thymidine incorpora-tion) was approximately 90% of the reference, so the specific activity wassmaller.
The indexed indicator values used to construct the AMOEBA can befurther condensed into a Soil Quality Index (SQI), using the average factor-ial deviation from the reference value (Ten Brink et al., 1991). The index iscalculated as follows:
where m is the reference (set to 100%) and n are the measured values as per-centages of the reference.
SQI =−
−=∑
101log
log logm
m n
n
ii
n
Monitoring and Evaluating Soil Quality 39
Fig. 3.6. AMOEBA presentation of indicator values from the grassland farms on sea-clay,relative to those in the reference (circle), which is set to 100%. In this case the reference isonly one organic farm (from Schouten et al., 2000). The graph facilitates a clear overview ofthe differences between categories of soil type and land use. The indicators are described inmore detail in Table 3.1.

For example:Reference Sample
Indicator 1 100 50Indicator 2 100 200log reference = 2, log sample is 1.7 and 2.3, respectively.The (absolute) difference between reference and sample is: For indicator 1: |2 – 1.7| = 0.3For indicator 2: |2 – 2.3| = 0.3 The sum of the differences is 0.6 and the average difference is 0.3.The average value of the sample is 2 – 0.3 = 1.7 on the log scale. Back trans-formed this gives an SQI of 101.7 = 50%.
Thus, in this SQI a value of 50% has the same weight as one of 200% ofthe reference value (both a factor two). For the AMOEBA in Fig. 3.6, thisexercise resulted in an SQI value of 65% for the intensively managed farmsversus the single organic farm. AMOEBA-like figures and derived indicescan be used as tools for comparison (in space and time) and for relativelysimple presentation of complicated results. It must be realized that they areonly simplified reflections of complex ecosystems and should not be takenas absolute values. The SQI approach has been applied mainly on sites withlocal contamination, where an uncontaminated reference is available. It ismore difficult to define a proper reference for larger areas with diffuse cont-amination, and for the different categories of soil type and land use of theDutch Soil Quality Network.
The Dutch Soil Quality Network: Results of a 5-year Cycle
After the pilot study in 1997, the programme was evaluated in 1998 andcontinued in 1999 by sampling of grassland farms on sand with differentmanagement intensities: extensive, organic and intensive. The categoriesare based on the number of livestock units per hectare. One livestock unit isdefined as the amount of cattle, pigs and/or poultry excreting an average of41 kg N/ha/yr. The organic farms had been certified for at least 5 yearsbefore sampling, used compost and/or farmyard manure and no biocides,and had on average 1.6 livestock units/ha. Extensive farms used mineralfertilizer and less farmyard manure and had 2.3 livestock units/ha.Intensive farms used mineral fertilizer and farmyard manure and had 3.0livestock units/ha. In 2000, highly intensive (Int+) farms with pigs (5.1 live-stock units/ha) on sand, and forest on sand were sampled. Intensive arablefarms on sand followed in 2001, when further sampling on farms was pre-vented by an outbreak of foot-and-mouth disease. Therefore, organic arablefarms on sand and grassland farms on peat could not be sampled asplanned in 2001. In 2002, sampling organic arable farms on sand was com-pleted. Also in 2002, arable farms on sea-clay (both intensive and organic)and grassland farms on river clay (intensive) were sampled. River-clay(Dutch classification) encompasses loam and clay soils in river deposits.
40 J. Bloem et al.
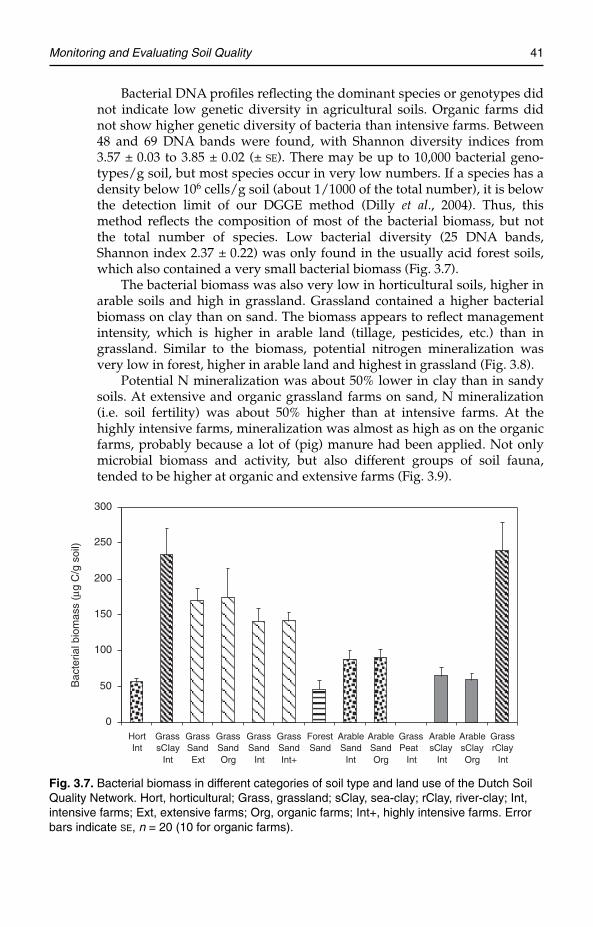
Bacterial DNA profiles reflecting the dominant species or genotypes didnot indicate low genetic diversity in agricultural soils. Organic farms didnot show higher genetic diversity of bacteria than intensive farms. Between48 and 69 DNA bands were found, with Shannon diversity indices from3.57 ± 0.03 to 3.85 ± 0.02 (± SE). There may be up to 10,000 bacterial geno-types/g soil, but most species occur in very low numbers. If a species has adensity below 106 cells/g soil (about 1/1000 of the total number), it is belowthe detection limit of our DGGE method (Dilly et al., 2004). Thus, thismethod reflects the composition of most of the bacterial biomass, but notthe total number of species. Low bacterial diversity (25 DNA bands,Shannon index 2.37 ± 0.22) was only found in the usually acid forest soils,which also contained a very small bacterial biomass (Fig. 3.7).
The bacterial biomass was also very low in horticultural soils, higher inarable soils and high in grassland. Grassland contained a higher bacterialbiomass on clay than on sand. The biomass appears to reflect managementintensity, which is higher in arable land (tillage, pesticides, etc.) than ingrassland. Similar to the biomass, potential nitrogen mineralization wasvery low in forest, higher in arable land and highest in grassland (Fig. 3.8).
Potential N mineralization was about 50% lower in clay than in sandysoils. At extensive and organic grassland farms on sand, N mineralization(i.e. soil fertility) was about 50% higher than at intensive farms. At thehighly intensive farms, mineralization was almost as high as on the organicfarms, probably because a lot of (pig) manure had been applied. Not onlymicrobial biomass and activity, but also different groups of soil fauna,tended to be higher at organic and extensive farms (Fig. 3.9).
Monitoring and Evaluating Soil Quality 41
0
50
100
150
200
250
300
HortInt
GrasssCIay
Int
GrassSandExt
GrassSandOrg
GrassSand
Int
GrassSandInt+
ForestSand
ArableSand
Int
ArableSandOrg
GrassPeat
Int
ArablesClay
Int
ArablesClayOrg
GrassrClay
Int
Bac
teria
l bio
mas
s (µ
g C
/g s
oil)
Fig. 3.7. Bacterial biomass in different categories of soil type and land use of the Dutch SoilQuality Network. Hort, horticultural; Grass, grassland; sClay, sea-clay; rClay, river-clay; Int,intensive farms; Ext, extensive farms; Org, organic farms; Int+, highly intensive farms. Errorbars indicate SE, n = 20 (10 for organic farms).

42 J. Bloem et al.
0
2
4
6
8
10
12
14
HortInt
GrasssCIay
Int
GrassSandExt
GrassSandOrg
GrassSand
Int
GrassSandInt+
ForestSand
ArableSand
Int
ArableSandOrg
GrassPeat
Int
ArablesClay
Int
ArablesClayOrg
GrassrClay
Int
Pot
entia
l N m
iner
aliz
atio
n(m
g N
kg/
soil/
wee
k)
Fig. 3.8. Potential N mineralization in different categories of soil type and land use of theDutch Soil Quality Network. Hort, horticultural; Grass, grassland; sClay, sea-clay; rClay, river-clay; Int, intensive farms; Ext, extensive farms; Org, organic farms; Int+, highly intensivefarms. Error bars indicate SE, n = 20 (10 for organic farms).
0
50
100
150
200
250
300Bacterial biomass
Bacterial growth rate
Bacterial genetic diversity
Bacterial functional diversity*
Bacterivorous nematodes
Fungivorous nematodes*
Herbivorous nematodes*
Mites
Enchytraeids*
Earthworms*
Potential C mineralization*
Potential N mineralization*
IntensiveOrganicExtensive
Fig. 3.9. Soil biological variables at organic, extensive and intensive grassland farms onsand. Intensive is set to 100%; * indicates a statistically significant difference (P � 0.05,analysis of variance) between categories.

Analysis of variance indicated statistically significant differences for bacte-rial functional diversity (colour development in BiologTM plates/g soil; in fact,activity), fungivorous nematodes, herbivorous nematodes, enchytraeids,earthworms, potential C mineralization (respiration) and potential N mineral-ization. Bacterial growth rate (thymidine incorporation) was 60% higher inorganic than in intensive grassland on sand (23.6 ± 4.8 versus 14.8 ± 2.9 pmolthymidine/g soil/h, ± SE, n = 10 for organic and 20 for intensive farms).Similarly, bacterial growth rate was 200% higher in organic than in intensivearable land on sand (114 ± 18 pmol/g/h versus 46.6 ± 3.9 pmol/g/h), and33% higher in organic than in intensive arable land on clay (153 ±26 pmol/g/h versus 115 ± 11 pmol/g/h). Both on sand and on clay there wasno difference in N mineralization between intensive and organic arable farms(Fig. 3.8). The differences between categories of farms are less significant thandifferences between treatments in long-term experimental fields. This may becaused by several reasons. Sampling at the farm level causes greater variationthan sampling in replicated experimental fields. Furthermore, it may take along time, perhaps decades rather than 5 years, before soil organisms increasesignificantly after a change in management. The categories used here arerather broad, and there are relatively large differences between farms withinone category. With more detailed analysis, using narrow clusters instead ofbroad categories of farms, trends can be detected. Bacterial biomass and bac-terivorous nematodes tend to decrease with increasing stocking density ongrassland farms on sand (Fig. 3.10).
Monitoring and Evaluating Soil Quality 43
r2 (Cmic)=0.69
0
100
200
300
400
500
600
700
800
900
1.25 1.75 2.25 2.75 3.25 3.75 4.25 4.75
Livestock units
Ave
rage
bac
teria
l bio
mas
s (µ
g/g
dry
soil)
20
40
60
80
100
120
140
160
180
200
Bac
teria
l-fee
ding
nem
atod
es (
mg/
kg d
ry s
oil)
Fig. 3.10. Scatterplot of the average bacterial biomass (circles) and the bacterial-feedingnematode biomass (squares) along an increasing farming intensity gradient (livestockunits/ha).The open symbols represent narrow clusters. The exponential trendline for bacterialbiomass is fitted on wider clusters (closed circles) of 0.5 livestock unit width (n = 9, � = 0.05;vertical error bars for 5% bacterial biomass ). (From Mulder et al., 2003.)

When sufficient data (> 200 sites) become available after completingone 5-year cycle of monitoring, habitat response models can be developedto predict the value of biological variables from environmental variablessuch as stocking density, pH, organic matter content, clay, etc. (Oberholzerand Höper, 2000; Mulder et al., 2003).
Thus, experience with monitoring soil life shows large differencesbetween categories of soil type and land use, and significant effects of man-agement on most groups of organisms and potential C and N mineraliza-tion.
Measuring Soil Biodiversity: Impediments and Research Needs
Soil ecosystems are complex. Therefore, many different aspects need to bemeasured (Lancaster, 2000). It is important to use a set of various indicators,and not a few indicators selected a priori, which are supposed to be the mostsensitive. Some indicators are more sensitive to contamination (e.g. bacter-ial growth rate); others are more sensitive to differences in soil fertility andagricultural management (e.g. N mineralization).
The complexity of biodiversity implies that time and money are majorimpediments for thorough monitoring. Techniques are available, but exten-sive monitoring is expensive. The costs of sampling and analysing one site(mixed sample of one farm) of the Dutch Soil Quality Network in 2002 were€5500. This amounts to €330,000 per year for 60 sites. Still, the importantfunctional groups of fungi and protozoa are not (yet) included in the rou-tine programme. Protozoa are the major bacterivores, but showed strongtemporal variation, and fungi usually had a very low biomass in Dutchagricultural soils (Bloem et al., 1994; Velvis, 1997). However, recently fungaldominance was found in a few agricultural soils, especially at low mineralN fertilization (Fig. 3.5). This indicates that the role of fungi may increasewhen fertilization is reduced, e.g. in sustainable agriculture and set-asideland. Therefore, the fungal to bacterial ratio deserves more research as apotentially simple indicator of efficient nutrient use and sustainability(Bardgett and McAlister, 1999; Mulder et al., 2003). Based on the resultsobtained, in 2004 fungi were included in the indicator set. On the otherhand, bacterial genetic diversity based on DGGE DNA profiles was omitted,because quantitative differences appeared to be small and qualitative resultsappeared difficult to interpret, especially in large-scale monitoring.
Relationships between below-ground biodiversity, in terms of speciesrichness and function, are still not clear. Experimental reduction of bio-diversity in soil did not significantly affect functioning in terms of decom-position and mineralization (Griffiths et al., 2001). Nevertheless, bio-diversity may play a role in stability against perturbation and stress, innutrient retention and in suppression of plant diseases (Griffiths et al.,2000). Fundamental research is still needed to clarify the importance of soilbiodiversity. Species identity (community structure) is probably moreimportant than species richness, but is more difficult to analyse. New
44 J. Bloem et al.

techniques, such as microarrays (DNA chips), are needed to monitor largenumbers of species, genes and functions, and may offer new opportunitiesto link diversity to function.
Using approaches as described here, biodiversity and functioning ofsoil ecosystems can be monitored. In pollution gradients, it is possible touse a local unpolluted control (Bloem and Breure, 2003). However, in manycases such a reference is not available. Generally, the value of an indicator isaffected not only by stress factors, but also by soil type, land use and vege-tation. Therefore, reference values for specific soil types have to be deducedfrom many observations, e.g. 20 replicates per type. The choice of a desiredreference is a political rather than a scientific issue, and depends on theaims of land use. A biologically active and fertile soil is needed in (organic)farming, but a high mineralization of nutrients from organic matter mayhamper conversion of agricultural land to a species-rich natural vegetation.For a specific soil and land-use type, the reference could be the currentaverage of 20 conventional farms, or the average of 20 organic farms. Soilsshowing very low or very high indicator values may be suspect and needfurther examination. Sufficient data and experience are needed to makejudgements of desirable reference values. Monitoring changes of indicatorsover time can reduce the importance of (subjective) reference values. Suchchanges may be easier to interpret than momentary values (Lancaster,2000). Spatially extensive and long-term monitoring may be not ideal, but itis probably the most realistic approach to obtain objective information ondifferences between, temporal changes within, and human impact onecosystems.
To make progress with monitoring and understanding the complexityof soil life it is necessary to start. Methods are already available. Differencesbetween methods and laboratories occur with any variable, and can be min-imized by using a limited number of specialized laboratories for each vari-able. For any purpose, standardization and intercalibration are necessary.Learning by doing is inevitable, thus long-term and extensive monitoringprogrammes need to be flexible. To begin with, monitoring programmesmay be relatively simple with a limited number of variables, which shouldbe increased when possible. Better one indicator than nothing, but the morethe better. Choosing a minimum data set and ranking of indicators remainsa subjective exercise. Looking at monitoring programmes established in dif-ferent countries, it appears that microbial biomass, respiration and potentialN mineralization are commonly regarded as part of a minimum data set.These are very useful, but more data are needed if we aim at monitoringbiodiversity. Adding the main functional groups of the soil food web bringsus closer to understanding biodiversity and provides the potential to relatethe structure of the soil community to ecosystem functioning and environ-mental stress (Mulder et al., 2005).
Monitoring and Evaluating Soil Quality 45

Acknowledgements
We thank many colleagues for their invaluable contribution to the results:An Vos, Popko Bolhuis, Meint Veninga, Gerard Jagers op Akkerhuis, HenkSiepel and Wim Dimmers, Alterra, Wageningen, The Netherlands; ChristianMulder, Marja Wouterse, Rob Baerselman, Niels Masselink, Margot Groot,Ruud Jeths and Hans Bronswijk, RIVM, Bilthoven, The Netherlands; WimDidden, Sub-department of Soil Quality, Wageningen University, TheNetherlands; Harm Keidel, Christel Siepman and others, Blgg bv,Oosterbeek, The Netherlands; and Ernst Witter, Department of SoilSciences, Swedish University of Agricultural Sciences, Uppsala, Sweden, forproviding samples from Ultuna (Fig. 3.4).
References
46 J. Bloem et al.
Akkermans, A.D.L., van Elsas, J.D. and DeBruijn, F.J. (eds) (1995) Molecular MicrobialEcology Manual. Kluwer AcademicPublishers, Dordrecht, The Netherlands.
Alef, K. and Nannipieri, P. (eds) (1995)Methods in Applied Soil Microbiology andBiochemistry. Academic Press, London.
Anderson, J.P.E. (1987) Handling and storageof soils for pesticide experiments. In:Somerville, L. and Greaves, M.P. (eds)Pesticide Effects on Soil Microflora. Taylor &Francis, London, pp. 45–60.
Atlas, R.M. and Bartha, R. (1993) MicrobialEcology. Fundamentals and Applications.The Benjamin/Cummings PublishingCompany, Redwood City, California,pp. 140–145.
Bardgett, R.D. and McAlister, E. (1999) Themeasurement of soil fungal:bacterial bio-mass ratios as an indicator of ecosystemself-regulation in temperate meadowgrasslands. Biology and Fertility of Soils 29,282–290.
Bloem, J. and Breure, A.M. (2003) Microbialindicators. In: Markert, B., Breure, A.M.and Zechmeister, H. (eds) Bioindicators/Biomonitors – Principles, Assessment, Con-cepts. Elsevier, Amsterdam, pp. 259–282.
Bloem, J., Lebbink, G., Zwart, K.B.,Bouwman, L.A., Burgers, S.L.G.E., DeVos, J.A. and De Ruiter, P.C. (1994)Dynamics of microorganisms, microbi-vores and nitrogen mineralisation in win-ter wheat fields under conventional and
integrated management. Agriculture,Ecosystems and Environment 51, 129–143.
Bloem, J., Veninga, M. and Shepherd, J.(1995) Fully automatic determination ofsoil bacterium numbers, cell volumes andfrequencies of dividing cells by confocallaser scanning microscopy and imageanalysis. Applied and EnvironmentalMicrobiology 61, 926–936.
Bloem, J., De Ruiter, P.C. and Bouwman, L.A.(1997) Food webs and nutrient cycling inagro-ecosystems. In: van Elsas, J.D.,Trevors, J.T. and Wellington, E. (eds)Modern Soil Microbiology. Marcel Dekker,New York, pp. 245–278.
Bloem, J., Schouten, A.J., Didden, W., Jagersop Akkerhuis, G., Keidel, H., Rutgers, M.and Breure, A.M. (2004) Measuring soilbiodiversity: experiences, impedimentsand research needs. In: Francaviglia, R.(ed.) Agricultural impacts on soil erosion andsoil biodiversity: developing indicators for pol-icy analysis, Proceedings of an OECDexpert meeting, 25–28 March 2003, Rome,Italy. OECD, Paris, p. 109–129. Availableat: http://webdomino1.oecd.org/comnet/agr/soil_ero_bio.nsf (accessed 26 October2004).
Breure, A.M. and Rutgers, M. (2000) Theapplication of Biolog plates to character-ize microbial communities. In: Benedetti,A., Tittarelli, F., De Bertoldi, S. and Pinzari,F. (eds) Biotechnology of Soil: Monitoring,Conservation and Bioremediation, Proceed-

ings of the COST Action 831 joint workinggroup meeting 10–11 December 1998,Rome, Italy. (EUR 19548), EU, Brussels,pp. 179–185.
Brookes, P.C. (1995) The use of microbialparameters in monitoring soil pollutionby heavy metals. Biology and Fertility ofSoils 19, 269–279.
Brussaard, L., Behan-Pelletier, V.M., Bignell,D.E., Brown, V.K., Didden, W., Folgarait,P., Fragoso, C., Freckman, D.W., Gupta,V.V.S.R., Hattori, T., Hawksworth, D.L.,Klopatek, C., Lavelle, P., Malloch, D.W.,Rusek, J., Söderström, B., Tiedje, J.M. andVirginia, R.A. (1997) Biodiversity andecosystem functioning in soil. Ambio 26,563–570.
Brussaard, L., Kuyper, T.W., Didden,W.A.M., De Goede, R.G.M. and Bloem, J.(2003) Biological soil quality from bio-mass to biodiversity – importance andresilience to management stress and dis-turbance. In: Schjønning, P., Christensen,B.T. and Elmholt, S. (eds) Managing SoilQuality – Challenges in Modern Agriculture.CAB International, Wallingford, UK,pp. 139–161.
Carter, M.R., Gregorich, E.G., Angers, D.A.,Beare, M.H., Sparling, G.P., Wardle, D.A.and Voroney, R.P. (1999) Interpretation ofmicrobial biomass measurements for soilquality assessment in humid temperateregions. Canadian Journal of Soil Science 79,507–520.
De Ruiter, P.C., Neutel, A.-M. and Moore,J.C. (1995) Energetics, patterns of interac-tion strengths, and stability in real ecosys-tems. Science 269, 1257–1260.
Dilly, O., Bloem, J., Vos, A. and Munch, J.C.(2004) Bacterial diversity during litterdecomposition in agricultural soils.Applied and Environmental Microbiology 70,468–474.
Doran, J.W. and Parkin, T.B. (1994) Definingand assessing soil quality. In: Doran, J.W.,Coleman, D.C., Bezdicek, D.F. andStewart, B.A. (eds) Defining Soil Quality fora Sustainable Environment, SpecialPublication 35. American Society ofAgronomy, Madison, Wisconsin, pp. 3–21.
Doran, J.W. and Parkin, T.B. (1996)Quantitative indicators of soil quality: aminimum data set. In: Doran, J.W. andJones, A.J. (eds) Methods for Assessing SoilQuality, Special Publication 49. SoilScience Society of America, Madison,Wisconsin, pp. 25–37.
FAO (1999) Sustaining AgriculturalBiodiversity and Agro-ecosystem Functions.Report available at: http://www.fao.org/sd/epdirect/EPre0065.htm (accessed 9April 2004).
Giller, K.E., Witter, E. and McGrath, S.P.(1998) Toxicity of heavy metals tomicroorganisms and microbial processesin agricultural soils: a review. Soil Biologyand Biochemistry 20, 1389–1414.
Griffiths, B.S., Ritz, K., Bardgett, R.D., Cook,R., Christensen, S., Ekelund, F., Sørensen,S., Bååth, E., Bloem, J., De Ruiter, P.,Dolfing, J. and Nicolardot, B. (2000)Ecosystem response of pasture soil com-munities to fumigation-induced microbialdiversity reductions: an examination ofthe biodiversity–ecosystem function rela-tionship. Oikos 90, 279–294.
Griffiths, B.S., Ritz, K., Wheatly, R., Kuan,H.L., Boag, B., Christensen, S., Ekelund,F., Sørensen, S.J., Muller, S. and Bloem, J.(2001) An examination of the biodiver-sity–ecosystem function relationship inarable soil microbial communities. SoilBiology and Biochemistry 33, 1713–1722.
Hansen, B., Alroe, H.F. and Kristensen, E.S.(2001) Approaches to assess the environ-mental impact of organic farming withparticular regard to Denmark. AgricultureEcosystems and Environment 83, 11–26.
Hill, R., Frampton, C., Cuff, J. and Sparling,G. (2004) National soil quality review andprogramme design, unpublished report.
Höper, H. (1999) BodenmikrobiologischeUntersuchungen in der Bodendauerbeo-bachtung in Deutschland. VBB-Bulletin 3,13–14. Arbeitsgruppe Vollzug Boden-biologie, FiBL, CH-5070 Frick,Switzerland [in German].
Hunt, H.W., Coleman, D.C., Ingham, E.R.,Ingham, R.E., Elliott, E.T., Moore, J.C.,Rose, S.L., Reid, C.F.F. and Morley, C.R.(1987) The detrital food web in a short-
Monitoring and Evaluating Soil Quality 47

grass prairie. Biology and Fertility of Soils 3,57–68.
Korthals, G.W., Alexiev, A.D., Lexmond,T.M., Kammenga, J.E. and Bongers, T.(1996) Long-term effects of copper andpH on the nematode community in anagroecosystem. Environmental Toxicologyand Chemistry 15, 979–985.
Lancaster, J. (2000) The ridiculous notion ofassessing ecological health and identify-ing the useful concepts underneath.Human and Ecological Risk Assessment 6,213–222.
Mäder, P., Fliessbach, A., Dubois, D., Gunst,L., Fried, P. and Niggli, U. (2002) Soil fer-tility and biodiversity in organic farming.Science 296, 1694–1697.
Marstorp, H., Guan, X. and Gong, P. (2000)Relationship between dsDNA, chloro-form labile C and ergosterol in soils of dif-ferent organic matter contents and pH.Soil Biology and Biochemistry 32, 879–882.
Maurer-Troxler, C. (1999) Einsatz bodenbiol-ogischer Parameter in der langfristigenBodenbeobachtung des Kantons Bern.VBB-Bulletin 3, 11–13. ArbeitsgruppeVollzug Bodenbiologie. FiBL, CH-5070Frick, Switzerland [in German].
Mulder, Ch., De Zwart, D., Van Wijnen, H.J.,Schouten, A.J. and Breure, A.M. (2003)Observational and simulated evidence ofecological shifts within the soil nematodecommunity of agroecosystems under con-ventional and organic farming. FunctionalEcology 17, 516–525.
Mulder, Ch., Cohen, J.E., Setälä, H., Bloem, J.and Breure, A.M. (2005) Bacterial traits,organism mass, and numerical abundancein the detrital soil food web of Dutch agri-cultural grasslands. Ecology Letters 8, 80–90.
Nielsen, M.N. and Winding, A. (2002)Microorganisms as indicators of soilhealth. National Environmental ResearchInstitute (NERI), Denmark, TechnicalReport no. 388. Available at: http://www.dmu.dk (accessed 30 January 2004).
Oberholzer, H.R. and Höper, H. (2000)Reference systems for the microbiologicalevaluation of soils. Verband DeutscherLandwirtschaftlicher Untersuchungs- undForschungsanstalten 55, 19–34.
OECD (2003) Agriculture and Biodiversity:Developing Indicators for Policy Analysis.Proceedings from an OECD expert meet-ing Zurich, Switzerland, November 2001.OECD, Paris.
Paul, E.A., Harris, D., Klug, M. and Ruess, R.(1999) The determination of microbial bio-mass. In: Robertson, G.P., Coleman, D.C.,Bledsoe, C.S. and Sollins, P. (eds) StandardSoil Methods for Long-term EcologicalResearch. Oxford University Press, NewYork, pp. 291–317.
Robertson, G.P., Coleman, D.C., Bledsoe, C.S.and Sollins, P. (eds) (1999) Standard SoilMethods for Long-term Ecological Research.Oxford University Press, New York.
Rutgers, M. and Breure, A.M. (1999) Riskassessment, microbial communities, andpollution induced community tolerance.Human and Ecological Risk Assessment 5,661–670.
Schipper, L.A. and Sparling, G.P. (2000)Performance of soil condition indicatorsacross taxonomic groups and land uses.Soil Science Society of America Journal 64,300–311.
Schouten, A.J., Bloem, J., Didden, W.A.M.,Rutgers, M., Siepel, H., Posthuma, L. andBreure, A.M. (2000) Development of a bio-logical indicator for soil quality. SETACGlobe 1, 30–32.
Stenberg, B. (1999) Monitoring soil quality ofarable land: microbiological indicators.Acta Agriculturae Scandinavica, Section B,Soil and Plant Science 49, 1–24.
Stenberg, B., Johansson, M., Pell, M., Sjödahl-Svensson, K., Stenström, J. andTorstensson, L. (1998) Microbial biomassand activities in soil as affected by frozenand cold storage. Soil Biology andBiochemistry 30, 393–402.
Ten Brink, B.J.E., Hosper, S.H. and Colijn, F.(1991) A quantitative method for descrip-tion and assessment of ecosystems: theAMOEBA-approach. Marine PollutionBulletin 23, 265–270.
Torstensson, L., Pell, M. and Stenberg, B.(1998) Need of a strategy for evaluation ofarable soil quality. Ambio 27, 1–77.
UNCED (United Nations Conference onEnvironment and Development) (1992)Agenda 21. June 1992, Rio de Janeiro.
48 J. Bloem et al.

Velvis, H. (1997) Evaluation of the selectiverespiratory inhibition method for measur-ing the ratio of fungal:bacterial activity inacid agricultural soils. Biology and Fertilityof Soils 25, 354–360.
Wollum, A.G. (1994) Soil sampling for micro-biological analysis. In: Weaver, R.W.,Angle, S., Bottomley, P., Bezdicek, D.F.,Smith, S., Tabatabai, A. and Wollum, A.G.(eds) Methods of Soil Analysis. Part 2:
Microbiological and Biochemical Properties.Soil Science Society of America, Madison,Wisconsin, pp. 1–14.
Zelles, L., Adrian, P., Bai, Q.Y., Stepper, K.,Adrian, M.V., Fischer, K., Maier, A. andZiegler, A. (1991) Microbial activitymeasured in soils stored under differenttemperature and humidity conditions.Soil Biology and Biochemistry 23, 955–962.
Monitoring and Evaluating Soil Quality 49

4 Managing Soil Quality
MICHAEL SCHLOTER,1 JEAN CHARLES MUNCH1 AND FABIOTITTARELLI2
1GSF Research Centre for Environment and Health, Institute of SoilEcology, PO Box 1129, D-85764 Neuherberg, Germany; 2Consiglio per laricerca e la sperimentazione in Agricottura, Istituto Sperimentale per laNutrizione delle Piante, Via della Navicella, 2, 00184 Rome, Italy
Abstract
Soil quality is defined as the ‘continued capacity of soil to function as a vital livingsystem, within ecosystem and land use boundaries, to sustain biological productiv-ity, promote the quality of air and water environments, and maintain plant, animaland human health’. Therefore it is not surprising that the sustainable conservationof soil quality is a key issue not only in scientific discussions, but also in politicalcontroversies. However, conservation of agricultural soils is often a topic of conflictas, on the one hand, it is a major goal to produce crops with high yields and, on theother hand, soil quality should be maintained. In this chapter this clash will bedescribed in detail and some examples of how different farming management sys-tems affect soil quality will be given. Furthermore, how to measure soil quality eas-ily and whether sensitive indicators are available are still open questions. Therefore,another part of this chapter will focus on questions about indicator developmentand use in practice.
Introduction
During recent years the European Commission has given increasing impor-tance to the role played by soil as a strategic compartment for many of theenvironmental issues affecting our countries and the planet as a whole. In2001, publishing its Sustainable Development Strategy (COM 2001, 264), theEuropean Commission noted that soil loss and declining fertility were erod-ing agricultural land viability. In 2002 (Decision 1600/2002), the EuropeanParliament and the Council laid down the Sixth Environmental ActionProgramme (Sixth EAP), which covers a period of 10 years, starting from 22July 2002. The Programme addresses the key environmental objectives andpriorities of the Community, which will be met through a range ofmeasures, including legislation and strategic approaches. In Article 6,
©CAB International 2006. Microbiological Methods for Assessing Soil Quality50 (eds J. Bloem et al.)

‘Objectives and priority areas for action on nature and biodiversity’, theSixth EAP foresees the development of a thematic strategy on soil protec-tion ‘addressing the prevention of, inter alia, pollution, erosion, desertifica-tion, land degradation, and hydrogeological risks taking into accountregional diversity, including specificities of mountain and arid areas’. Onthe basis of this input, the European Commission published aCommunication entitled ‘Towards a thematic strategy for soil protection’(COM 2002, 179), which is intended as a first contribution for building onthe political commitment to soil protection. The Communication listed thefollowing as main threats to soil in the EU and candidate countries: erosion,decline in organic matter, soil contamination, soil sealing, soil compaction,decline in soil biodiversity, salinization, floods and landslides. All thesethreats degrade soil processes, and are considered to be driven and exacer-bated by human activity. In this context, soil microbiologists have the exper-tise to contribute to the ongoing discussion on soil protection through theelaboration of the concept of soil quality and, in particular, of soil qualitymanagement. This is the main objective of the following chapter, which,after a short theoretical dissertation on soil quality and soil quality indica-tors, provides a few case studies to demonstrate the effects of different agri-cultural production methods on soil microbial community structure andfunctions.
Soil Quality and Agricultural Sustainability
Sustainable agriculture is based on the conservation of natural resourcesand on the concept of productivity linked closely to the maintenance of asystem aimed at saving energy and resources in the mid to long term,through optimizing recycling and enhancing biodiversity, and through bio-logical synergy. The emphasis on ‘sustainable agriculture’ and, more gener-ally, on ‘sustainable land use’, initiated the development of the soil qualityconcept during the 1990s. Despite the fact that during the past 10 yearsmany different definitions of soil quality have been proposed, the followingseems to be one of the most widely accepted, and is suitable for the purposeof sustainable soil management: ‘the capacity of a soil to function withinecosystem boundaries to sustain biological productivity, maintain environ-mental quality, and promote plant and animal health’. In a more simplisticway, this definition of soil quality, like those proposed by other authors andnot reported in this chapter, refers to the capacity of a soil to function at pre-sent and in the future, for an indefinite period of time. The concept of soilquality has become a tool for assessing the sustainability of soil manage-ment systems and has been adopted by users at different educational levels,such as policy makers, land managers and farmers. According to Karlen etal. (2001), the use of soil quality as a tool for the assessment of humanimpact on natural resources is based on the distinction between inherentand dynamic characteristics of soil. Inherent characteristics are those deter-mined by parent material, climate, vegetation and so on, which are not
Managing Soil Quality 51

influenced by human activity. They contribute to an inherent soil quality,which is meaningful in determining the capacity of a soil for a specific landuse. On the other hand, dynamic characteristics are those subjected tochange as a consequence of a specific soil management system. So, dynamicsoil quality can be measured and used to compare different agriculturalpractices and/or farming systems on similar soils, or in the same soil over aperiod of time. To succeed in soil quality assessment, the issue of whichtypes of measurements should be made in order to evaluate the effect ofmanagement on soil function must be solved. Soils have physical, chemicaland biological properties that interact in a complex way to give them theirquality or capacity to function (Seybold et al., 1997). So, soil quality cannotbe measured directly, but can be assessed through the measurement ofchanges of its attributes, or attributes of the ecosystem which areconsidered as indicators. Of course, we need standards for the evaluationof management systems that allow an assessment of their sustainability.Two different approaches are employed in the evaluation of sustainablemanagement systems: the comparative assessment and the dynamicassessment.
Comparative and Dynamic Assessment of SustainableManagement Systems
Comparative and dynamic assessment are the two main approachesemployed in the evaluation of sustainable management systems. In thecomparative approach, the performance of a system is determined in rela-tion to alternatives. On the other hand, in the dynamic approach a manage-ment system is assessed in terms of its performance determined over aperiod of time. According to the comparative approach, the characteristics,biotic and abiotic soil attributes of alternative systems are compared at timet and a decision about the relative sustainability of each system is based onthe magnitude of the measured parameters. The main limit of this approachis that, if only outputs are measured, it provides little information about theprocess that created the measured condition. On the other hand, the maindisadvantage of the dynamic approach is that it needs measurements ofindicators for at least two points in time and consequently does not providean immediate assessment of soil quality (Seybold et al., 1997). Moreover, itcan be misleading in the case of a soil that functions at its highest attainablelevel, which it cannot improve, or when it is functioning at its lowest attain-able level and cannot go lower; both these cases would show a static trend,indicating sustaining systems, but they would have completely differentquality.
In our opinion, the two approaches to assessment are complementary,since they allow different scales of evaluation. While monitoring trends ismore useful for evaluation at the level of the farm, the comparative assess-ment seems to be more suitable to a wider scale of evaluation (on a regionalscale).
52 M. Schloter et al.

Indicators of Soil Quality
According to the above discussion, in order to be useful as an indicator ofthe sustainability of agricultural practices and of land management, indica-tors of soil quality should give some measure of the capacity of a soil tofunction in terms of plant and biological productivity and environmentalquality (Seybold et al., 1997). As reported in the introduction, indicators ofsoil quality should be:
• sensitive to long-term change in soil management and climate, but suffi-ciently robust not to change as a consequence of short-term changes inweather conditions;
• well correlated with beneficial soil functions;• useful for understanding why a soil will or will not function as desired;• comprehensible and useful to land managers;• easy, and not expensive, to measure;• where possible, components of existing soil databases.
Due to the complexity of the system, there cannot be a single indicatorof soil quality to assess a specific soil management system, but a minimumdata set of attributes regarding soil physical, chemical and biological prop-erties must be selected. Furthermore, the suitability of soil quality indica-tors depends on the kind of land, land use and scale of assessment.Different land uses may require different properties of soil and, conse-quently, some soil quality indicators in a given situation can be more help-ful than others for the purpose of the assessment (Karlen et al., 2001).Another aspect, closely related to the previous one, which should always bestressed, is that the final aim of soil quality assessment is different in anagricultural soil and in a natural ecosystem. As stated by Singer and Ewing(2000), ‘in an agricultural context soil quality may be managed in order tomaximize production without adverse environmental effects, while in a nat-ural ecosystem soil quality may be observed as a baseline value or set ofvalues against which future changes in the system may be compared’. As ageneral consideration, each combination of soil type, land use and climatecalls for a different set of practices to enhance soil quality. Whereas, withinthe same country, different pedoclimatic conditions require different man-agement practices in order to reach the same sustainability goals, even morecomplex issues are related to soil quality management in tropical areas or,in general, in less-developed countries.
Soil Organic Carbon Pools and Processes
Since organic matter, or more specifically organic carbon and the carbon (C)cycle as a whole, can have an important effect on soil functioning, all theattributes linked to the soil C cycle are usually recommended as compo-nents in any minimum data set for soil quality evaluation.
According to a simplified scheme, soil organic matter (SOM) can be
Managing Soil Quality 53

divided into two pools: non-living and living. Non-living SOM includesmaterials of different age and origin, which can be further divided intopools or fractions as a function of their turnover characteristics. For exam-ple, the humified fraction is more resistant to decay. The stability andlongevity of this pool is a consequence of chemical structure and organo-mineral association. This pool of soil organic matter influences differentaspects of soil quality, such as the fate of ionic and non-ionic compounds,the increase of soil cation exchange capacity and the long-term stability ofmicroaggregates (Herrick and Wander, 1997). The interpretation guidelinefor the sake of soil quality assessment is that the higher the humified frac-tion of SOM, the higher is its contribution to soil quality.
Living soil organic matter represents only a small percentage of totalsoil organic carbon, and includes soil micro-, meso- and macroorganisms. Inparticular, soil microbial biomass is regarded as the most active anddynamic pool of SOM, and plays an important role in driving soil mineral-ization processes. Three main aspects of soil microbial biomass are usuallyconsidered for their effect on soil functions: pool size, activity and diversity.The determination of the total amount of carbon immobilized within micro-bial cells permits the determination of soil microbial biomass as a pool ofsoil organic matter. Since this pool is responsible for the decomposition ofplant and animal residues and for the immobilization and mineralization ofplant nutrients, it is finally responsible for the maintenance of soil fertility(Brookes, 2000). For this reason, the concept of microbial biomass has devel-oped as an ‘early warning’ of changing soil conditions and as an indicatorof the direction of change. Carbon mineralization activity, as a key processof the soil C cycle, determines the rapidity of the organic matter degrada-tion process in soil. Many studies have been carried out recently in order toverify, directly or indirectly, the potential for increasing carbon storage insoil by manipulating C inputs to minimize the rate of carbon mineralization(Jans-Hammermeister et al., 1997; Fließbach and Mäder, 2000). The sensitiv-ity of the carbon mineralization process to changes in soil management islow, because small microbial populations, in degraded soil, can mineralizeorganic matter to the same extent and at the same rate as large microbialpopulations in undegraded soils (Brookes, 1994). More sensitive to soilmanagement changes, and more helpful as a soil quality indicator, is thecombination of the two measurements, relating to both size and activity ofmicrobial biomass. Carbon mineralization activity/unit of biomass (bio-mass-specific respiration) and the mineralization coefficient (respiredcarbon/total organic carbon) indicate efficiency in carbon utilization andenergy demand. Finally, increasing importance has been given recently tosoil microbial diversity measurements as indicators of community stabilityand of impact of stress on that community.
Interactions between the diversity of primary producers (plants) andthat of decomposers (microbial communities), the two key functionalgroups that form the basis of all ecosystems (Loreau, 2001), have major con-sequences for agricultural management. Soil microorganisms control themineralization of natural compounds and xenobiotics. Furthermore, bacte-
54 M. Schloter et al.

ria and fungi exist at extremely high density and diversity in soils, and canreact to changing environmental conditions rapidly, by adjusting: (i) activityrates; (ii) gene expression; (iii) biomass; and (iv) community structure. Someof these parameters might be perfect indicators for evaluating soil quality(Schloter et al., 2003a).
Research interest in microbial biodiversity over the past 25 years hasincreased markedly, as microbiologists have become interested in the sig-nificance of biodiversity for ecological processes. Most of the work illus-trates a dominant interest in questions concerning the effect of specificenvironmental factors on microbial biodiversity, the spatial and temporalheterogeneity of this biodiversity, and quantitative measures of populationstructure (for a review see Morris et al., 2002). However, since the rise ofavailability of molecular genetic tools in microbial ecology in the early1990s, it has become apparent that we know only a very small part of thediversity of the microbial world. Most of this unexplored microbial diver-sity seems to be hidden in yet uncultured microbes. Use of new direct meth-ods, independent of cultivation, based on the genotype (Amann et al., 1995)and phenotype (Zelles et al., 1994) of the microbes, enables a deeper under-standing of the composition of microbial communities. For example, usingthe rDNA-directed approach of dissecting bacterial communities by ampli-fying the 16S rDNA (rrs) gene from soil samples by polymerase chain reac-tion (PCR), and studying the diversity of the acquired rrs sequences, almostexclusively new sequences became apparent, which are only related to acertain degree to the well-studied bacteria in culture collections (Amann etal., 1995). Based on molecular studies, it can be estimated that 1 g of soil isthe habitat of more than 109 bacteria, belonging to about 10,000 differentmicrobial species (Ovreas and Torsvik, 1998).
Using these new methods for studies in agricultural ecosystems, itcould be clearly proven that the highest influence on microbial communitystructure and function, mainly in the rhizosphere, derives from used cropsand applied agrochemicals. Miethling et al. (2000) conducted a greenhousestudy with soil–plant microcosms, in order to compare the effect of the cropspecies lucerne (Medicago sativa) and rye (Secale cereale), soil origin (differentcropping history) and a bacterial inoculant (Sinorhizobium meliloti) on theestablishment of plant-root-colonizing microbial communities. Three com-munity-level targeting approaches were used to characterize the variationof the extracted microbial rhizosphere consortia: (i) community-level physi-ological profiles (CLPP); (ii) fatty acid methyl ester (FAME) analysis; and(iii) diversity of PCR-amplified 16S rRNA target sequences from directlyextracted ribosomes, determined by temperature gradient gel electrophore-sis (TGGE). All approaches identified the crop species as the major determi-nant of microbial community characteristics. The influence of soil wasconsistently of minor importance, while a modification of the lucerne-associated microbial community structure after inoculation with S. melilotiwas only consistently observed by using TGGE. In a study by Yanget al. (2000), the DNA sequence diversities for microbial communities infour soils affected by agricultural chemicals (mainly triadimefon and
Managing Soil Quality 55
ammonium bicarbonate and their intermediates) were evaluated by ran-dom amplified polymorphic DNA (RAPD) analysis. The richness, modifiedrichness, Shannon–Weaver index and a similarity coefficient of DNA werecalculated to quantify the diversity of accessed DNA sequences. The resultsclearly showed that agricultural chemicals affected soil microbial commu-nity diversity at the DNA level. The four soil microbial communities weredistinguishable in terms of DNA sequence richness, modified richness,Shannon–Weaver index and coefficient of DNA similarity. Analysis alsoshowed that the amounts of organic C and microbial biomass C were low inthe soil treated by pesticide (mainly triadimefon and its intermediates), buthigh in the soil where the chemical fertilizer (mainly ammonium bicarbon-ate and its intermediates) was applied. Combined, the above results mayindicate that pesticide pollution caused a decrease in the soil microbial bio-mass but maintained a high diversity at the DNA level, compared to thecontrol without chemical pollution. In contrast, chemical fertilizer pollutioncaused an increase in the soil biomass but a decrease in DNA diversity.
Managing Soil Quality: Case Studies
Managing soil quality relates to agricultural soils which are subjected to dif-ferent agricultural practices as a consequence of the management systemadopted. As a function of the specific objective that farmers and/or landmanagers and/or policy makers want to reach, relevant soil functionsand/or parameters should be individualized and measured, in order tounderstand whether the specific soil management system adopted reachesthe prefixed aims. Below are some examples of how agricultural manage-ment can influence microbial community structure and function.
Influence of precision farming and conventional agricultural management onmicrobial community structure and function
Precision farming summarizes cultivation practices that allow for spatialand temporal variability of soil attributes and crop parameters within anagricultural field. Distinct areas in a field are managed by applying differ-ent levels of input, depending on the yield potential of the crop in that par-ticular area. Benefits of these actions are: reduction of the cost for cropproduction, thus conserving resources while maintaining high yield; andminimizing the risk of environmental pollution (Dawson, 1997).
In two studies, from Hagn et al. (2003a) and Schloter et al. (2003b),microbial community structure and function and their dynamics wereinvestigated in relation to season, soil type and farming management prac-tice. The research was done using soils from high- (H) and low-yield areas(L) of a field site, cultivated with winter wheat under two different farmingmanagement systems (precision farming, P; conventional farming, C) overthe growing period.
56 M. Schloter et al.

It was demonstrated that the microbial biomass and the microbial com-munity structure, measured using the phospholipid fatty acid techniqueand DNA-based methods in the top soils of the investigated plots, were notinfluenced by precision farming. Both parameters showed a typical sea-sonal run, which was independent of the farming management type.Microbial biomass was reduced during the summer months, due to the dryweather conditions and the hot temperatures in the top soil. The microbialcommunity structure changed mainly after the application of fertilizers andwas associated with high amounts of root exudates in late spring.
As fungal communities are essential for the reduction of soil erosion,degradation of complex organic compounds and biocontrol (Hagn et al.,2003b), fungal diversity was studied in detail using cultivation-independentmethods (direct extraction of DNA from soil followed by PCR amplificationof a subunit of the 18S rDNA and fingerprinting (DGGE)) as well as cultiva-tion-dependent techniques (isolation of pure cultures). Comparison of thePCR amplicons by DGGE patterns, reflecting the total fungal community,showed no differences between the sampling sites and no influence of thefarming management systems. Only small differences were observed overthe growing period. For the identification of active hyphae, cultivation-dependent techniques were used. The resulting isolates were subculturedand grouped by their morphology and genotype. In contrast to the cultiva-tion-independent approaches, clear site-specific and seasonal effects on thefungal community structure could be observed. However, no effects of thedifferent farming management techniques were seen. These results clearlyindicate that the potential fungal community (including spores) is not influ-enced by the investigated factors, whereas active populations show a clearresponse to environmental changes (soil type and season). The most abun-dant group, consisting of Trichoderma species, was investigated in moredetail using strain-specific genotype-based fingerprinting techniques aswell as a screening for potential biocontrol activity against the wheatpathogen Fusarium graminearum. The genotypic distribution, as well as thepotential biocontrol activity, revealed clear site-specific patterns, reflectingthe soil type and the season. A clear response of the Trichoderma ecotypes todifferent farming management techniques was not seen.
Enzyme activities in the nitrogen cycle were more affected by precisionfarming. Proteolytic activity was significantly increased by precision farm-ing, especially on low-yield plots; also, nitrification and denitrificationactivities showed a clear response to application of fertilizers. In summer,due to the low microbial biomass, all measured activities were very low andshowed no sustained reaction to farming management.
These results indicated that the structure of the entire microbial com-munity is not influenced by precision farming compared to conventionalagriculture. However, the applied farming management type had a visibleinfluence on the induction or repression of gene transcription and expres-sion.
Managing Soil Quality 57

Influence of changes from conventional to organic farming on microbialcommunity structure and function
The influence of two farming systems in southern Germany on aggregategreenhouse gas emission (CO2, CH4 and N2O) was investigated by Flessa etal. (2002). One system (farm A) conformed to the principles of integratedfarming (recommended by the official agricultural advisory service) and theother system (farm B) followed the principles of organic farming (neithersynthetic fertilizers nor pesticides were used). Farm A consisted of 30.4 hafields (mean fertilization rate 188 kg N/ha), 1.8 ha meadows, 12.4 ha set-aside land and 28.6 adult beef steers (year-round indoor stock keeping).Farm B consisted of 31.3 ha fields, 7 ha meadows, 18.2 ha pasture, 5.5 haset-aside land and a herd of 35.6 adult cattle (grazing period 6 months).
The integrated assessment of greenhouse gas emissions included thosefrom fields, pasture, cattle, cattle waste management, fertilizer productionand consumption of fossil fuels. Soil N2O emissions were estimated from 25year-round measurements on differently managed fields. Expressed perhectare farm area, the aggregate emission of greenhouse gases was 4.2 MgCO2 equivalents (conventional farming) and 3.0 Mg CO2 equivalents(organic farming). Nitrous oxide emissions (mainly from soils) contributedthe major part (about 60%) of total greenhouse gas emissions in both farm-ing systems. Methane emissions (mainly from cattle and cattle waste man-agement) were approximately 25%, and CO2 emissions were lowest (c.15%). Mean emissions related to crop production (emissions from fields,fertilizer production, and the consumption of fossil fuels for field manage-ment and drying of crops) were 4.4 Mg CO2 equivalents/ha and 3.2 Mg CO2equivalents/ha field area for farms A and B, respectively. On average, 2.53%of total N input by synthetic N fertilizers, organic fertilizers and cropresidues were emitted as N2O-nitrogen. Total annual emissions per cattleunit (live weight of 500 kg) from enteric fermentation and storage of cattlewaste were about 25% higher for farm A (1.6 Mg CO2 equivalents) thanfarm B (1.3 Mg CO2 equivalents). Taken together, these results indicatedthat conversion from conventional to organic farming led to reducedemissions per hectare, but yield-related emissions are not reduced.
In another study by Schloter et al. (2004), the effects on microbial com-munity structure of conventional farming and ecological farming were com-pared. Plots under ecological farming for 4–40 years were compared withplots under conventional farming practice. To characterize the soil micro-bial community structure under both systems, a hierarchical approach wasapplied (phospholipid fatty acids to describe differences in superfamiliesand domains, 16S rDNA pattern to describe species variability, and enrich-ment of Ochrobactrum spp. to describe microdiversity of ecotypes). To char-acterize functions both at the community level and at the level of theenriched Ochrobactrum antrophi populations, the EcoBiolog® system wasused. Although no differences in the microbial biomass were observed (thetwo highest biomass values were found in the soil of a conventional farm-ing plot and a plot that had been under ecological farming practice for 40
58 M. Schloter et al.

years), the results clearly indicated that there was a significant shift inmicrobial community structure between the conventionally farmed plotsand the plots under ecological farming practice. The use of the phospho-lipid fatty acid (PLFA) method and the statistic evaluation of the results byprincipal component analysis (PCA) revealed significant changes of themicrobial community on a high taxonomic level. Just 2 years after changingfarming practice, shifts in the structure of the microflora were visible. Thelonger the ecological farming practice was applied to the plots, the greaterthe differences were. The main shifts were found in the Gram-positivebacteria. After extraction of total DNA from soil, amplification of thevariable region V6/V8 of the 16S rDNA and fingerprinting using DGGE,three main clusters (conventional farming, 2 years’ ecological farming and40 years’ ecological farming) were visible. The main differences were notfound in the total diversity (Shannon index), but in the abundance ofcharacteristic species in each soil (Simpson index). For the soils that wereunder ecological farming practice for 40 years, Actinomycetes appeared to behighly abundant. After enrichment by specific antibodies and classifyingthe ecotypes by the EcoBiolog® system, 24 ecotypes could be defined.Significant differences in ecotype variability were only observed in the plotsthat had been under ecological farming practice for 40 years. Using theEcoBiolog®system, it could be shown that differences in the microbialcommunity structure led to a change of function: in the conventional soilspecialized microbes (which can utilize only a small part of the used Csources) were dominant, whereas in the plots under ecological farmingpractice generalists dominated. These results could be shown at the level ofthe whole microbial community and were confirmed on the microdiversitylevel.
Sustainable Management of Soils
Sustainable management of soils is an environmental issue worldwide, butis most urgent in less-developed countries. Many of the problems faced bytropical countries concern soil degradation. As a consequence of populationpressure and the lack of new land, fallow rotation is shortened, resulting insoil erosion. Since, in many tropical soils, a large proportion of availableplant nutrients are in the topsoil, soil erosion causes a substantial loss infertility and a deterioration of soil physical structure. As the cost of reclama-tion of eroded soil is prohibitive for many less-developed countries, soilerosion is considered to be one of the greatest threats to the sustainability ofagricultural production in tropical countries (Scholes et al., 1994). Otherconstraints to crop productivity in tropical soils are of chemical or nutrientorigin: aluminium toxicity, acidity, high phosphorus fixation with ironoxides, low nutrient reserves and high secondary salinization of irrigatedland (Lal, 2002). Large areas of sub-Saharan Africa and South Asia arecharacterized by the constraints reported above. According to Lal (2002),the goals of sustainable agriculture in these areas can be summarized as:
Managing Soil Quality 59

• food security;• reversal of soil degradative trends;• improvement of surface and ground water quality;• sequestration of C in soil in order to reduce the negative effect of emis-
sion of greenhouse gases.
The identification of the goals of sustainable agriculture in tropicalcountries does not, in itself, solve the issue of managing soil quality, sincethe same objectives can be reached following different soil managementsystems, as a consequence of socio-economic considerations and politicaldecisions. A typical example regarding less-developed countries is thedebate about one of the most serious problems among those listed above:food security. In order to enhance food production to meet the needs of thepopulation, during the past 30 years some areas of the tropics have experi-enced a dramatic increase in per capita food production. This improvementis mainly based on the introduction of new crop varieties on fertile soilsheavily supplied with water, fertilizers and pesticides. While, on a regionalscale and from a macroeconomic point of view, many Asian countries cannow theoretically satisfy the need of their ever-growing populations for riceand wheat, in poorer rural areas the numbers of undernourished people arestill extremely high. In these areas, smallholder farming systems seem tobetter guarantee food security. On a farm scale, traditional cropping sys-tems based on different food crops, rather than a single high-yield cashcrop, the use of indigenous crop varieties, organic fertilizers produced on-farm and minimum tillage can be more efficient for reaching self-suffi-ciency. In terms of sustainability of soil management for food security on afarm level, smallholder farming systems are characterized by agriculturalpractices that improve soil resistance to degradation and its capacity torecover rapidly after a perturbation.
Conclusion
In contrast to the high complexity of microbial communities in soil, theideal soil microbiological and biochemical indicator to determine soil qual-ity should be simple to measure, should work equally well in all environ-ments and should reliably reveal which problems exist where. It is unlikelythat a sole ideal indicator can be defined with a single measure, because ofthe multitude of microbiological components and biochemical pathways.Therefore, a minimum data set is frequently applied (Carter et al., 1997).The basic indicators and the number of measures needed are still under dis-cussion, and depend on the aims of the investigations. National and inter-national programmes for monitoring soil quality presently include biomassand respiration measurements, but also extend to determination of nitrogenmineralization, microbial diversity and functional groups of soil fauna.
It is still unclear whether observed changes in microbial communitystructure are lasting, and whether naturally occurring environmental fac-
60 M. Schloter et al.

tors can influence the genotypic ability of the soil microbiota to recoverafter harsh conditions and become healthy again (Sparling, 1997). Researchon the resilience of soil microbiota is therefore a significant task of microbialecology.
References
Managing Soil Quality 61
Amann, R., Ludwig, W. and Schleifer, K.H.(1995) Phylogenetic identification and insitu detection of individual microbial cellswithout cultivation. MicrobiologicalReviews 59, 143–149.
Brookes, P.C. (1994) The use of microbialparameters in monitoring soil pollutionby heavy metals. Biology and Fertility ofSoils 19, 269–279.
Brookes, P.C. (2000) Changes in soil micro-bial properties as indicators of adverseeffects of heavy metals. In: Benedetti, A.(ed.) Indicatori per la Qualità del Suolo.Fischer, Heildelberg, pp. 205–227.
Carter, M.R., Gregorich, E.G., Anderson,D.W., Doran, J.W., Janzen, H.H. andPierce, F.J. (1997) Concepts of soil, qualityand their significance. In: Gregorich, E.G.and Carter, M.R. (eds) Soil Quality for CropProduction and Ecosystem Health. Elsevier,Amsterdam, pp. 1–19.
Dawson, C.J. (1997) Management for spatialvariability. In: Stafford, V. (ed.) PrecisionAgriculture ‘97. BIOS Scientific PublishersLtd, Oxford, pp. 45–58.
Flessa, H., Ruser, R., Dörsch, P., Kamp, T.,Jimenez, M.A., Munch, J.C. and Beese, F.(2002) Integrated evaluation of green-house gas emissions (CO2, CH4, N2O)from two farming systems in southernGermany. Agriculture, Ecosystems andEnvironment 91, 175–189.
Fließbach, A. and Mäder, P. (2000) Microbialbiomass and size-density fractions differbetween soils of organic and conventionalagricultural systems. Soil Biology andBiochemistry 32, 757–768.
Hagn, A., Pritsch, K., Schloter, M. and Munch,J.C. (2003a) Fungal diversity in agriculturalsoil under different farming managementsystems with special reference to biocon-trol strains of Trichoderma spp. Biology andFertility of Soils 38, 236–244.
Hagn, A., Geue, H., Pritsch, K. and Schloter,M. (2003b) Assessment of fungal diversityand community structure in agriculturalused soils. Microbiological Post 37, 665–680.
Herrick, J.E. and Wander, M.M. (1997)Relationship between soil organic carbonand soil quality in cropped and range-land soils: the importance of distribution,composition and biological activity. In:Lal, R., Kimble, J.M. and Stewart, B.A.(eds) Soil Processes and the CarbonCycle. CRC Press, Boca Raton, Florida,pp. 405–425.
Jans-Hammermeister, D.C., McGill, W.B. andIzaurralde, R.C. (1997) Management ofsoil C by manipulation of microbialmetabolism: daily vs. pulsed C additions.In: Lal, R., Kimble, J.M. and Stewart, B.A.(eds) Soil Processes and the Carbon Cycle.CRC Press, Boca Raton, Florida,pp. 321–334.
Karlen, D.L., Andrews, S.S. and Doran, J.W.(2001) Soil quality: current concepts andapplications. In: Sparks, D.L. (ed.)Advances in Agronomy, Vol. 7. AcademicPress, London, pp. 1–39.
Lal, R. (2002) The potential of soils of thetropics to sequester carbon and mitigatethe greenhouse effect. In: Sparks, D.L.(ed.) Advances in Agronomy, Vol. 76.Academic Press, London, pp. 1–30.
Loreau, M. (2001) Microbial diversity, pro-ducer–decomposer interactions andecosystem processes: a theoretical model.Proceedings of the Royal Society for BiologicalScience 268, 303–309.
Miethling, R., Wieland, G., Backhaus, H. andTebbe, C.C. (2000) Variation of microbialrhizosphere communities in response tocrop species, soil origin, and inoculationwith Sinorhizobium meliloti L33. MicrobialEcology 40, 43–51.

Morris, C.E., Bardin, M., Berge, O., Frey-Klett, P., Fromin, N., Girardin, H.,Guinebretiere, M.H., Lebaron, P., Thiery,J.M. and Troussellier, M. (2002) Microbialbiodiversity: approaches to experimentaldesign and hypothesis testing in primaryscientific literature from 1975 to 1999.Microbiological and Molecular BiologyReviews 66, 592–616.
Ovreas, L. and Torsvik, V.V. (1998) Microbialdiversity and community structure in twodifferent agricultural soil communities.Microbial Ecology 36, 303–315.
Schloter, M., Dilly, O. and Munch, J.C.(2003a) Indicators for evaluating soilquality. Agriculture, Ecosystems andEnvironment 98, 255–262.
Schloter, M., Bach, H.J., Sehy, U., Metz, S.and Munch, J.C. (2003b) Influence of pre-cision farming on the microbial commu-nity structure and selected functions innitrogen turnover. Agriculture, Ecosystemsand Environment 98, 295–304.
Schloter, M., Bergmüller, C., Friedel, J.,Hartmann, A. and Munch, J.C. (2005)Effects of different farming practice on themicrobial community structure. Applied andEnvironmental Microbiology (submitted).
Scholes, M.C., Swift, M.J., Heal, O.W.,Sanchez, P.A., Ingram, J.S.I. and Dalal, R.(1994) Soil fertility in response to thedemand for sustainability. In: Woomer,
P.L. and Swift, M.J. The BiologicalManagement of Tropical Soil Fertility. JohnWiley & Sons, New York, pp. 1–14.
Seybold, C.A., Mausbach, M.J., Karlen, D.L.and Rogers, H.H. (1997) Quantification ofsoil quality. In: Lal, R., Kimble, J.M. andStewart, B.A (eds) Soil Processes and theCarbon Cycle. CRC Press, Boca Raton,Florida, pp. 387–404.
Singer, M.J. and Ewing, S. (2000) Soil quality.In: Sumner, M.E. (ed.) Handbook of SoilScience. CRC Press, Boca Raton, Florida,pp. 271–298.
Sparling, G.P. (1997) Soil microbial biomass,activity and nutrient cycling as indicatorsof soil health. In: Pankhurst, C., Doube,B.M. and Gupta, V. (eds) BiologicalIndicators of Soil Health. CAB International,Wallingford, UK, pp. 97–119.
Yang, Y., Yao, J., Hu, S. and Qi, Y. (2000)Effects of agricultural chemicals on DNAsequence diversity of soil microbial com-munity: a study with RAPD marker.Microbial Ecology 39, 72–79.
Zelles, L., Bai, Q., Ma, X., Rackwitz, R.,Winter, K. and Beese, F. (1994) Microbialbiomass, metabolic activity and nutri-tional status determined from fatty acidpatterns and polyhydroxybutyrate inagriculturally managed soils. Soil Biologyand Biochemistry 26, 439–446.
62 M. Schloter et al.

5 Concluding Remarks
ANNA BENEDETTI,1 PHILIP C. BROOKES2 AND JAMES M.LYNCH3
1Consiglio per la ricerca e la sperimentazione in Agricoltura, IstitutoSperimentale per la Nutrizione delle Piante, Via della Navicella, 2, 00184Rome, Italy; 2Agriculture and Environment Division, Rothamsted Research,Harpenden AL5 2JQ, UK; 3Forest Research, Alice Holt Lodge, FarnhamGU10 4LH, UK
Soil quality has been defined as the capacity of the soil to produce healthy andnutritious crops (Paperdick and Parr, 1992), but it is also important to considerthe studies where indicators of soil quality have been sought for forestry(Moffat, 2003). The related concepts of soil resilience (the ability of the soil torecover after disturbance) and soil degradation (the loss of the soil’s capacityto produce crops) also need to be considered alongside quality assessments(Elliott and Lynch, 1994). In this context, toxicity measurements are necessary,and recently a range of biosensors has become available for this purpose.
The aim of this handbook is to provide a practical guide on how to usebiochemical, microbiological and molecular indicators to define soil quality.It must be stressed that non-experts cannot expect to resolve such a com-plex issue without the assistance of experts in the field; nevertheless, thetopic will be addressed humbly. We are all aware that there are no absolutebenchmarks for assessing biological soil fertility, while there are chemical orphysical indicators that are easy to define, interpret and understand. On thecontrary, biological indicators, e.g. soil microbial biomass concentration,require especially careful interpretation. There is no such thing as absolutehigh or low values, values that remain constant over time and in space;there are sets or families of similar values, and also other, and thereforeinterpretable, values. It must be kept in mind that a variability of 20% iscommon for biological populations, and this is one of the reasons why it isrecommended that several indicators are utilized to produce an index todescribe the behaviour of soil microorganisms.
An index can be a set of several indicators that are developed anddeduced from parameters, as implicit in the definition provided by theOECD, ‘Set of parameters or aggregate of weighed indicators’ (1993).Moreover, biological indicators have to be related to physical, chemical and
©CAB International 2006. Microbiological Methods for Assessing Soil Quality(eds J. Bloem et al.) 63

agronomic indices, etc. and be relevant to the nature of the type of study tobe performed.
Selected biochemical, microbiological and molecular parameters avail-able to the operator are given in this handbook (for instance in Chapter 3).Once the exact aim of the investigation has been defined, the list of parame-ters can usually be streamlined and reduced to answer the questions asked.
Activity carried out within the framework of EU COST Action 831revealed that the selected factors need to be arranged in a hierarchical scaleof indicators in function of the study goal. The topic of hierarchical scales ofdifferent indicators is widely debated, and it is evident that each singleresearcher is more skilled at using the parameters used in his or her labora-tory. A guide to the hierarchical use of indicators is provided by the OECDrequirements (1999), whereby indicators must:
• be clearly correlated with a certain phenomenon or a certain featurethat is being investigated or monitored;
• be highly correlated with the above-mentioned effect with minimalstatistical variability;
• be unobscured by much less significant responses;• have a sufficiently generalized, albeit not identical, validity in many
analogous situations.
It is clear that hierarchical levels can change depending upon whetherthe indicator is required for monitoring, for accurate characterization of aparticular environment, for assessing or restoring previous changes, or forstarting up research. If the aim is to study soil quality in terms of fertility,the hierarchical level represented in Fig. 5.1 could be applicable:
1. Biomass-carbon (C) and respiration rate.2. Functional diversity.3. Genetic diversity.4. Case-by-case in-depth probes (heavy metals, genetically modified organ-isms, air pollution, erosion, etc.).
We should take the same approach we would all adopt if we were to have amedical check-up. The first thing a physician does is to carry out a series ofroutine basic examinations. The physician will probably only call for furthertests if irregularities occur in these basic ones, which may indicate anunderlying pathology. Then the physician may move to more sophisticatedtests, indicated by the findings in the first set. These can then be followedby other, much more sophisticated and specific diagnostic investigations.
Likewise, the first step in assessing biological soil fertility, i.e. theexpression of microbial turnover, is to perform simple biochemical tests.The same tests can be used effectively for environmental monitoring. Thenext step could be to study the functional diversity of the ecosystem,followed by genetic diversity, and then case-by-case in-depth probes. Todate, some methodologies, for example the ecophysiological profile andbacterial and fungal DNA studies, are rarely utilized in nationwide, large-scale monitoring programmes.
64 A. Benedetti et al.

Moreover, a minimum hierarchical level must also be identified forother correlated indicators, in order to prevent false-negative and -positiveresults. In the case where soil fertility is related to crop yield, physical fertil-ity is just as important as chemical and biological fertility. Obviously, how-ever, the correct functioning of aerobic microorganisms will not occurunder, for example, conditions of oxygen limitation, extremes of pH or ele-vated salinity. Thus, it is crucial to build other hierarchical scales, which, forchemical soil parameters, could be represented by the following:
1. Organic matter.2. pH.3. Available nutrients.4. Various types of pollutants, etc.
The following parameters could be adopted for physical soil fertility indica-tors (Pagliai and Vignozzi, 2000; Pagliai et al., 2000):
1. Porosity.2. Aggregate stability.3. Compactness.4. Sealing along the profile.5. Structure loss.6. Superficial crusts and potential risk of their formation.7. Fissuring.8. Erodability.
The hierarchical scales will then be put together in an attempt to identify aminimum data set taken from the point where the different hierarchicalscales overlap (Fig. 5.2).
Concluding Remarks 65
C biomass andrespiration rate
Base molecular analysis
Genetic and functional diversity
Case-by-case in-depth probes
Fig. 5.1. Hierarchical scales of microbiological, biochemical and molecular parameters todefine the biological fertility of a soil.

The extent of the study is represented by the circles in Fig. 5.2. Thehierarchical scales to be used in different studies obviously differ, and rangefrom environmental, pedological and agronomic parameters to social andeconomic ones. The approaches adopted in two case studies are describedbelow.
Soil Sealing, Compaction and Erosion
Large areas of the central part of Italy are representative of the hillside envi-ronments of the Tuscan–Romagna Mountains (site 1) and of the clay hillsideenvironments of central southern Italy (site 2). The soils, containing smallamounts of organic carbon, are characterized by low structural stability andpoor regeneration capacity: they must be managed correctly to minimizethe potential risks of formation of surface crusts, sealed surfaces and com-paction by farming machinery. The effects of such hazardous degradation ina hilly environment – the reduced rainwater infiltration rate and thecreation of preferential surface runoff courses – play a role in triggeringwidespread and channelled erosion processes.
66 A. Benedetti et al.
Fig. 5.2. Model showing a minimum data set for assessing soil quality and environmentalsustainability. The minimum data set increases with the extent of the study (circles). A,physical parameters; B, climatic parameters; C, chemical parameters; D, microbiologicalparameters; E, land use; F, biological parameters; G, management; H, etc.

Soil management is crucial for the prevention and control of degradation.Different tillage systems, i.e. deep ploughing, shallow ploughing, minimumtillage and ripper subsoiling, have different effects on soil conditions.Adoption of ripper subsoiling tillage is capable of reducing structuraldamage caused by deep ploughing, lessening the risk of formation of surfacecrusts and the presence of compacted layers in the profile. This was revealedby the findings of the micromorphological analysis and quantification of thepore system in site 1. Moreover, ripper subsoiling conserves more organiccarbon than does deep ploughing, especially in the topsoil layer. Also, theamounts of humified organic matter in soil managed by ripper subsoiling isgreater than in soils following deep ploughing (Dell’Abate et al., 2004).
Soil microbial activity has been verified by the determination of the soilmicrobial biomass carbon and its respiration (Table 5.1), and subsequentlyusing the metabolic quotient (qCO2) and the C biomass/total organic C(BC/TOC) ratio.
Data concerning the quantity and the activity of the microbial biomassfor the two different situations demonstrate that ripper subsoiling (RS) is abetter management practice than deep ploughing for the maintenance ofthe total organic resource, and also of the living fraction. In fact, the contentof microbial biomass is greater in RS for both the depths.
Results obtained for the two different management practices showedthat qCO2 was comparable in the two layers in the soil submitted to rippersubsoiling (RS), while in the soil in which the deep ploughing (DP) waspractised, qCO2 was higher at a depth of 20–40 cm.
A high value of qCO2 in the ploughed zone (DP) highlights a situation ofnon-equilibrium due to the adopted practice. This conclusion can be alsoreached by analysing the BC/TOC ratio: the value of microbial biomass in thedeepest layer of the DP case was halved in comparison to the value found inRS to the same depth, while total organic carbon was practically constant.
In site 2, the effects of two other types of soil management (a compari-son of continuous wheat and continuous lucerne) were assessed, in a fieldexperiment established in 1994. In this case, the porosity values obtained inthe 0–5 cm soil depth for the two areas on which the crops were grownshow that after heavy rain, soils supporting lucerne gave a higher porositypercentage than those from the wheat-growing area. The protective actionof the vegetation cover of lucerne decreased soil surface vulnerability to the
Concluding Remarks 67
Table 5.1. Soil microbial biomass carbon (BC), C biomass/total organic carbon ratio(BC/TOC) and metabolic quotient (qCO2).
BC BC/TOC qCO2Sample soil (µg/g) (%) (mg CO2-C/mg Cmic.h)
RS (0–20 cm) 203.8 ± 26.9 2.290 ± 0.004 0.0013 ± 0.0003(20–40 cm) 137.7 ± 23.6 1.996 ± 0.004 0.0017 ± 0.0003
DP (0–20 cm) 121.3 ± 69.8 1.989 ± 0.012 0.0019 ± 0.0011(20–40 cm) 73.8 ± 9.8 1.118 ± 0.01 0.0034 ± 0.0008
RS, ripper subsoiling; DP, deep ploughing.

impact of rainfall and thus lessened the risk of formation of crusts.Moreover, wheat did not seem to be the most suitable crop as it depletedthe organic matter in the top horizon of the soil, while lucerne conservedthe organic matter better. Removal of the finest soil particles by water erosionled to preferential loss of the most stable and most strongly sorbed organicfraction (humin), which, in contrast, accumulated in the deeper layer.
The quantity of microbial biomass in the soil cultivated with lucerne (L)was higher than that in the soil cultivated with wheat (W) (Table 5.2), andthis was also confirmed by the respiration data (data not shown): comparedto wheat, the lucerne crop is more effective in preserving the total soilorganic carbon and also improves soil microbial life. The C biomass/totalorganic carbon rate had comparable values for the two crops for eachdepth. Also, the specific respiration (qCO2) showed comparable values inthe two cases for the two depths. It was higher under both the crops in thedeepest layer, and this underlines a stress condition.
In this study, the lucerne covering showed a positive effect on the quan-tity of organic carbon and microbial biomass. On the other hand, microbialmetabolism was not affected by the different crop (similar BC/TOC valuesand metabolic quotients at the same depths). Wheat removed carbon fromthe soil but it did not modify microbial metabolism.
The rational answer to this environmental risk is to avoid sowing wheatin these soils, but indubitably wheat is a more profitable crop than, forexample, lucerne. It is clear that the radical changes in agriculture, wherethe aims are to produce high yield and, at the same time, conserve ‘land-scaping farming’ environments, must strike a balance or set a limit ofdegradation (Baroccio et al., 2002).
Impact of Cultivation of Genetically Modified Plants
The EU Directive 18/2001 sets the general criteria on emission of geneticallymodified (GM) plants in Europe. For the first time, this law fixed a limit onsoil, nitrogen and carbon recycling. What does this mean? Carbon andnitrogen mineralization or humification parameters should be able to detectcarbon and nitrogen recycling in soil, as they are indicators of biomassactivity and ecosystem functions.
68 A. Benedetti et al.
Table 5.2. Soil microbial biomass carbon (BC), C biomass/total organic carbon ratio(BC/TOC) and metabolic quotient (qCO2).
BC BC/TOC qCO2Sample soil (µg/g) (%) (mg CO2-C/mg Cmic.h)
W (0–20 cm) 153.0 ± 40.2 3.188 ± 0.004 0.0017 ± 0.0005(20–40 cm) 89.9 ± 43.6 1.427 ± 0.008 0.0032 ± 0.0016
L (0–20 cm) 263.9 ± 144.0 3.341 ± 0.018 0.0013 ± 0.0007(20–40 cm) 151.3 ± 63.1 1.780 ± 0.007 0.0029 ± 0.0014
W, wheat; L, lucerne.

During the past decade some authors have tested different parametersin soil growing GM and non-GM plants (Gebhard and Smalla, 1999;Lottmann et al., 1999; Hopkins et al., 2002; Bruinsma et al., 2003; Ceccherini etal., 2003). The investigation focused on soil respiration rate, biomass C, nitri-fication test, humification parameters, total organic carbon and the metabolicquotient to evaluate the impact of GM plants. Molecular (DGGE and PCRanalysis) and ecophysiological tests (BiologTM analysis) were also carriedout. The results demonstrated that biological, chemical and ecophysiologicalparameters alone were not able to detect the delayed impact of GM plantson diversity and microbial biomass activity, but that molecular analysis wasmore efficient. Baseline biological soil fertility and also microbial populationmanagement and natural fluctuations play a crucial role in this case.Molecular analysis detects possible changes in microbial diversity, suchas richness and evenness, but also reveals the persistence of transgenesin soil.
In conclusion, some useful criteria that can be adopted to select soilquality indicators are as follows:
1. Correlate soil quality with land use. Define the use of the agricultural,forestry, pasture, public nature parks, unused industrial areas, industrialareas, marginal areas, etc. The choice of indicators depends on the type ofsoil investigated and the indicators suitable for the type of soil. For exam-ple, it may be more useful to determine substrate-induced respiration (SIR)instead of simple CO2 evolution in forestry or pasture soils in homeostasis,and also in soils stressed by pollution and other factors. 2. Perform a case-by-case probe on the nature of the problems to be stud-ied. Negative/positive/unknown impact, potential pollutants, recoveryactions, new growing systems, GM plants, etc. When assessing the effects ofheavy metals, for example, total genetic diversity and possibly even singlespecies diversity have to be assessed along with functional diversity andthe system’s resistance to perturbation. The EU Directive 18/2001 on GMplants recommends assessing nitrogen and carbon recycling when evaluat-ing impact, while it would be constructive to specify other parameters, suchas mycorrhizal infection capacity, in mycorrhizic plants.3. Identify which hierarchical scales can be related to observations.4. Identify a minimum data set of indicators that can be correlated witheach other. 5. If available, compare the observations with historical data from the mon-itoring framework, or repeat the same observations during the time.
Those involved in drafting this handbook aimed to ensure that poten-tial users address the issue positively. Serial determinations are stronglyrecommended in order to detect the vital cycles of soil organisms, and, inturn, to understand soil functions and better manage soil conservation. Thedevelopment of a new common language can be achieved thanks to theimplementation of projects for monitoring biological fertility on variousscales and the creation of institutional databanks and networks. Hopefully,this handbook will achieve this goal.
Concluding Remarks 69

Baroccio, F., Dell’Abate, M.T. and Benedetti,A. (2002) Effect of different soil manage-ment on organic matter conservation:chemical and microbiological indicators.In: Nardi, S., Albuzio, A., Bottacin, A.,Carden, D.E., Concheri, G., Ferretti, M.,Chisi, R., Malagoli, M. and Masi, A. (eds)Proceeding of XX Convegno nazionale dellaSocietà di Chimica Agraria, Padova, Italy,pp. 29–36.
Bruinsma, M., Kowalchuk, G.A. and vanVeen, J.A. (2003) Effects of geneticallymodified plants on microbial communi-ties and processes in soil. Biology andFertility of Soils 37, 329–337.
Ceccherini, M.T., Potè, J., Kay, E., Van, V.T.,Maréchal, J., Pietramellara, G.,Nannipieri, P., Vogel, T.M. and Simonet, P.(2003) Degradation and transformabilityof DNA from transgenic leaves. Appliedand Environmental Microbiology 69,673–678.
Dell’Abate, M.T., Benedetti, A. and Baroccio,F. (2005) Example n. 1: Fagna experimen-tal site. In: Dell’Abate, M.T., Benedetti, A.,Pagliai, M. and Sequi, P. (eds) Atlas of SoilQuality Indicators. Agriculture andForestry Ministry, Rome (in press).
Elliott, L.F. and Lynch, J.M. (1994) Biodiversityand soil resilience. In: Greenland, D.J. andSzabolcs, I. (eds) Soil Resilience andSustainable Land Use. CAB International,Wallingford, UK, pp. 353–364.
EU Council Directive 2001/18/CE (2001)Concerning the voluntary emission onenvironment of genetically modifiedorganisms.
Gebhard, F. and Smalla, K. (1999) Monitoringfield releases of genetically modifiedsugar beet for persistence of transgenicplant DNA and horizontal gene transfer.FEMS Microbiology Ecology 28, 261–272.
Hopkins, D.W., Marinari, S., Webster, E.A.,Tilston, E.L. and Halpin, C. (2002)Decomposition in soil of residues fromplants with genetic modifications tolignin biosynthesis. Symposium on theImpact of GMOs: Soil Microbiology andNutrient Dynamics. IGMO, Vienna.
Lottmann, J., Heuer, H., Smalla, K. and Berg,G. (1999) Influence of transgenic T4-lysozyme-producing potato plants onpotentially beneficial plant-associatedbacteria. FEMS Microbiology Ecology 29,365–377.
Moffat, A.J. (2003) Indicators of soil qualityfor UK forestry. Forestry 76, 547–568.
OECD (1993) Environmental monographs n.83. OECD Core Set of Indicators forEnvironmental Performance Reviews. OECD,Paris.
OECD (1999) Environmental Indicators forAgriculture. Issues and Design, The YorkWorkshop, Vol. 2. OECD, Paris.
Pagliai, M. and Vignozzi, D. (2000) Il sistemadei pori quale indicatore delle qualitàstrutturali dei suoli. Accademia Nazionaledelle Scienze detta dei XL. Memorie diScienze Fisiche e naturali 118° XXIV,229–238.
Pagliai, M., Pellegrini, S., Vignozzi, N.,Rousseva, S. and Grasselli, O. (2000) Thequantification of the effect of subsoil com-paction on soil porosity and related phys-ical properties under conventional toreduced management practices. In: Horn,R., van den Akker, J.J.H. and Arvidsson, J.(eds) Subsoil Compaction. Distribution,Processes and Consequences. Advances in GeoEcology 32, 305–313.
Paperdick, R.I. and Parr, J.F. (1992) Soil qual-ity – the key to a sustainable agriculture.American Journal of Alternative Agriculture7, 2–3.
70 A. Benedetti et al.
References

II Selected Methods

6 Microbial Biomass and Numbers
6.1 Estimating Soil Microbial Biomass
ANDREAS FLIEßBACH1 AND FRANCO WIDMER2
1Research Institute of Organic Agriculture (FiBL), Ackerstrasse,CH-5070 Frick, Switzerland; 2Agroscope FAL Reckenholz,Reckenholzstrasse 191, CH-8046 Zürich, Switzerland
Introduction
Soils provide the base for a rich and diverse community of microorganisms.The quality of a soil can be defined by the ability to perform functions in theecosystem of which it is a part. Soil microbiology has been a discipline cov-ering topics such as nitrogen and organic matter transformations and nitro-gen fixation. Transformation and the effects of pollutants were topics thatbecame important with increasing awareness of environmental damage.The potential value of the soil resource for sustainable land use has beenrecognized and endorses the need to understand the processes involved inorganic matter cycling as well as the amount of organisms in soil and theirfunctions. The effects of land use and management on environmental qual-ity, or even on the global carbon balance, have been highlighted in therecent past.
Most soil functions are directly or indirectly related to the soil micro-biota, which may explain the effort expended in developing techniques todetermine with confidence the number, volume and diversity of organismsin soil. In ecosystem research, the cycling of most elements is driven partlyor completely by the amount and activity of organisms that assimilate min-eral compounds or decompose organic matter.
As early as 1909, Engberding was doubtful whether microbial numberson agar plates would give representative cell counts for agricultural soils(Engberding, 1909). But it wasn’t until 1996 that researchers were able todemonstrate experimentally that plate counts show only a very small pro-portion of the total soil microbial community, even though such microbes
©CAB International 2006. Microbiological Methods for Assessing Soil Quality(eds J. Bloem et al.) 73

exist and are viable (Torsvik et al., 1996). Therefore, techniques that arebased on isolating and cultivating microorganisms are considered not toreflect the whole microbial community.
Soil fertility is a central aim of sustainable land use. Organic farmingsystems, especially, emphasize the role of soil microorganisms in elementcycling and their value for a healthy soil (Mäder et al., 2002). Reliablemeasurement and interpretation of biological soil quality, in a world thatrealizes once more the potential of the soil natural resource, is an importanttask.
Approaches for Estimating Soil Microbial Biomass
As for most quantitative analyses, it is necessary to account for method-ological, spatial and temporal variability, which can be done by analysingan appropriate number of replicates in the laboratory and in the field. Foragricultural fields, four replicate bulk samples, each consisting of at least 15single cores, may reduce spatial variability to less than 10%. Analytical vari-ability can be checked by a representative reference soil – stored at opti-mum conditions for each purpose – and being analysed with each batch ofanalysis.
Direct cell counting
Observing and counting microorganisms in their soil habitat is consideredto reliably reflect the number and volume of microbial cells in soil. Usingstaining techniques, it is possible to distinguish microbes from soil particlesand to determine activity and biomass. In situ hybridization techniquesusing specific RNA probes may finally serve as powerful tools for countingspecific organisms or functional groups in soil. Reliable techniques inmicrobial biovolume estimation in soil are reviewed and described byBölter et al. in Section 6.4.
The microbial biomass approach
Jenkinson and Powlson (1976a) invented an approach that overcame theisolation–cultivation bias. This chloroform fumigation incubation methodwas originally checked by (more time-consuming) direct microscopic mea-surements. They pointed out that ‘soil microbes are the eye of the needle,through which all organic material that enters the soil must pass’, and theydefined the whole microbial community as a black box – the ‘holisticapproach’. This is a quantitative approach of pools and fluxes and hardlyconsiders specific organisms or functional groups of the microbial commu-nity. The microbial biomass, as such, has been inserted as an active pool of
74 A. Fließbach and F. Widmer

soil organic matter in recently developed models on organic matter cycling.In Section 6.2, Brookes and Joergensen explain this approach based onchloroform fumigation.
Jenkinson and Powlson’s approach served as the reference forAnderson and Domsch (1978), who invented a physiological method forestimating microbial biomass in soils that has since become very popular –the substrate-induced respiration (SIR) method. Section 6.3 by Höper dealswith the advantages and shortcomings of this method as it is now used, aswell as the chloroform fumigation and microscopic methods, for monitor-ing and survey of soils.
Molecular markers
A major step towards a more detailed analysis of the microbial communitywas the development of molecular markers and advances in extractingthem directly from soil organisms. The advantage of these markers is theirspecificity to living cells or even taxa. However, differing amounts in cellsof different species at different physiological states may limit their use asparameters for microbial biomass estimation.
ATP
Adenosine 5’-triphosphate (ATP) occurs in living cells and does not persistin soils. The procedure for extracting ATP from soils has been validated fora wide range of soils (Contin et al., 2001) and a critical review of the methodis given by Martens (2001). Provided a standardized procedure is used,Jenkinson and Ladd (1981) found, and Jenkinson (1988) and Contin et al.(2001) confirmed, a remarkably constant ATP content of the microbial bio-mass of 10–12 µmol ATP/g microbial biomass C. These authors recommendthe use of a strongly acidic extractant as crucial to denature soil phos-phatases, whereas Martens (2001) recommends extraction with dimethylsulphoxide (DMSO) and Na3PO4, as proposed by Bai et al. (1988).
Membrane compounds of microbial cells
Microbial membranes contain a great number of lipid compounds that canbe extracted directly from soil. The variable content of signature fatty acidsin microbial cells of different taxa makes it difficult to relate them to specificbiomass, but as they can be extracted quantitatively from the soil, the sumof fatty acids may serve as a biomass indicator. Zelles (1999) reviews thepotential and limitations of the use of fatty acids for biomass estimation.
Nucleic acid analysis of the microbial cells
Direct nucleic acid extraction from soil has gained much attention in thepast few years, since it holds great potential for describing soil microorgan-
Estimating Soil Microbial Biomass 75

isms that were not accessible by use of cultivation-dependent techniques(see also Chapter 8, this volume). DNA is a biomolecule, tightly associatedwith living organisms, and thus might serve as a biomass indicator.However, in the past it has proven very difficult to reliably extract totalDNA from soils of different textures, and it became commonly acceptedthat DNA quantities detected in soils are very variable and barely meaning-ful or useful as a biomass indicator. However, recent advances in soil DNAextraction protocols have indicated that DNA, and even RNA, can be recov-ered efficiently from soil (Borneman and Triplett, 1997; Bundt et al., 2001;Bürgmann et al., 2001), and correlation of DNA quantities and biomass hasbeen demonstrated in a few cases (Curci et al., 1997; Bundt et al., 2001;Macrae et al., 2001; Taylor et al., 2002). A broader validation of DNA extrac-tion protocols for quantitative extraction of DNA from soils may be benefi-cial in at least two ways. First, it may serve as a simple and rapidlydetermined biomass indicator, and, secondly, it would allow further dissec-tion of the structure of the microbial biomass by use of molecular tools(Chapter 8, this volume).
Methods Standardized for Soil Quality Determination
ISO-certified methods are described for soil microbial biomass determina-tion: the chloroform fumigation extraction and the substrate-induced respi-ration technique. For comparing quantitative results originating fromdifferent laboratories, samples have to be exchanged in order to assure reli-ability of the absolute values. Thresholds or minimum/maximum valuesfor microbial biomass are often discussed. For soil quality evaluation it maybe interesting to see if predicted and measured values show much of a dif-ference. If there is, this could be used as an indication of disturbance of thesystem. Finally, and as pointed out by most authors in soil quality research,it is recommended to use a set of methods, in particular with respect tomicrobial functions, that are of ecological importance. Soil microbial bio-mass itself may be interpreted as the mediator of some soil functions, andapparently plays key roles in physical stability and nutrient cycling.
76 A. Fließbach and F. Widmer

6.2 Microbial Biomass Measurements byFumigation–Extraction
PHILIP C. BROOKES1 AND RAINER GEORG JOERGENSEN2
1Soil Science Department, IACR-Rothamsted, HarpendenAL5 2JQ, UK; 2Department of Soil Biology and Plant Nutrition,University of Kassel, Nordbahnhofstraße, D-37213Witzenhausen, Germany
Introduction
The soil microbial biomass responds much more quickly than most other soilfractions to changing environmental conditions, such as changes in substrateinputs (e.g. Powlson et al., 1987) or increases in heavy metal content (Brookesand McGrath, 1984). This, and much other similar, research supports theoriginal idea of Powlson and Jenkinson (1976) that biomass is a much moresensitive indicator of changing soil conditions than, for example, the totalsoil organic matter content. Thus, the biomass can serve as an ‘early warn-ing’ of such changes, long before they are detectable in other ways.
Linked parameters (e.g. biomass-specific respiration or biomass as apercentage of soil organic C) are also useful as they have their own intrinsic‘internal controls’ (see Barajas et al., 1999 for a discussion of this). Thismay permit interpretation of measurements in the natural environment,where, unlike in controlled experiments, there may not be suitable non-contaminated soil (for example) to provide good ‘control’ or ‘background’measurements.
Here we provide experimental details of two measurements of biomasswhich have proved useful in environmental studies, particularly at lowlevels (i.e. around European Union limits) of pollution by heavy metals,namely soil microbial biomass C and biomass ninhydrin N.
Principle of the Method
Following chloroform fumigation of soil, there is an increase in the amountof various components coming from the cells of soil microorganisms whichare lysed by the fumigant and made partially extractable (Jenkinson andPowlson, 1976b). Organic C (Vance et al., 1987), total N and NH4-N (Brookeset al., 1985), and ninhydrin-reactive N (Amato and Ladd, 1988; Joergensenand Brookes, 1990) can be measured in the same 0.5 M K2SO4 extract.Further information on fumigation–extraction and other microbiologicalmethods is given by Alef and Nannipieri (1995).
© CAB International 2006. Microbiological Methods for Assessing Soil Quality(eds J. Bloem et al.) 77

Materials and Apparatus
• A room or incubator adjustable to 25°C• An implosion-protected desiccator• A vacuum line (water pump or electric pump)• A horizontal or overhead shaker• A deep-freezer at –15°C• Folded filter papers (e.g. Whatman 42 or Schleicher & Schuell 595 1/2)• Glass conical flasks (250 ml)
Chemicals and Reagents
• Ethanol-free chloroform (CHCl3)• Soda lime• 0.5 M Potassium sulphate (K2SO4) (87.1 g/l)
Procedure
Fumigation–extraction
A moist soil sample of 50 g is divided into two subsamples of 25 g. The non-fumigated control samples are placed in 250 ml conical flasks and thenimmediately extracted with 100 ml 0.5 M K2SO4 (ratio extractant:soil is 4:1)for 30 min by oscillating shaking at 200 rpm (or 45 min overhead shaking at40 rpm) and then filtered through a folded filter paper. For the fumigatedtreatment, 50 ml glass vials containing the moist soils are placed in a desicca-tor containing wet tissue paper and a vial of soda lime. A beaker containing25 ml ethanol-free CHCl3 and a few boiling chips is added and the desiccatorevacuated until the CHCl3 has boiled vigorously for 2 min. The desiccator isthen incubated in the dark at 25°C for 24 h. After fumigation, CHCl3 isremoved by repeated (sixfold) evacuation and the soils are transferred to250 ml bottles for extraction with 0.5 M K2SO4. All treatments are replicatedthree times. All K2SO4 extracts are stored at –15°C prior to analysis.
Biomass C estimated by dichromate oxidation
Principle of the method
In the presence of strong acid and dichromate, organic matter is oxidizedand Cr(+VI) reduced to Cr(+III). The amount of dichromate left is back-titrated with iron II ammonium sulphate (Kalembasa and Jenkinson, 1973)and the amount of carbon oxidized is calculated.
78 P. Brookes and R.G. Joergensen

Additional materials and apparatus
• Liebig condenser• 250 ml round-bottom flask• Burette
Additional chemicals and reagents
• 66.7 mM potassium chromate (K2Cr2O7) (19.6125 g/l)• Concentrated phosphoric acid (H3PO4)• Concentrated sulphuric acid (H2SO4)• 40.0 mM iron II ammonium sulphate [(NH4)2[Fe(SO4)2] × 6H2O]• 25 mM 1.10-phenanthroline-ferrous sulphate complex solution
All chemicals are analytical reagent grade and distilled or de-ionized wateris used throughout.
• Digestion mixture: two parts conc. H2SO4 are mixed with one part conc.H3PO4 (v/v).
• Titration solution: iron II ammonium sulphate (15.69 g/l) is dissolved indistilled water, acidified with 20 ml conc. H2SO4 and made up to1000 ml with distilled water.
Procedure
To 8 ml soil extract in a 250 ml round-bottom flask, 2 ml of 66.7 mM (0.4 N)K2Cr2O7 and 15 ml of the H2SO4/H3PO4 mixture are added. The mixture isgently refluxed for 30 min, allowed to cool and diluted with 20–25 mlwater, added through the condenser as a rinse. The excess dichromate ismeasured by back-titration with 40.0 mM iron II ammonium sulphate,using 25 mM 1.10-phenanthroline-iron II sulphate complex solution as anindicator.
Calculation of results
CALCULATION OF EXTRACTABLE ORGANIC C FOLLOWING DICHROMATEDIGESTION
C (µg/ml) = [(HB – S) / CB] × N × [VD/VS] × E × 1000
where: S = consumption of titration solution by the sample (ml); HB = con-sumption of titration solution by the hot (refluxed) blank (ml); CB = con-sumption of titration solution by the cold (unrefluxed) blank (ml); N =normality of the K2Cr2O7 solution; VD = added volume of the K2Cr2O7 solu-tion (ml); VS = added volume of the sample (ml); and E = 3, conversion ofCr(+VI) to Cr(+III), assuming that, on average, all organic C is as [C(0)].
C (µg/g soil) = C (µg/ml) × (VK + SW)/DW
Biomass Measurements by Fumigation–Extraction 79

where: VK = volume of K2SO4 extractant (ml); SW = volume of soil water(ml); and DW = dry weight of sample (g).
CALCULATION OF BIOMASS C
Biomass C (BC) = EC/kEC
where: EC = (organic C extracted from fumigated soils) – (organic Cextracted from non-fumigated soils) and kEC = 0.38 (Vance et al., 1987).
Biomass C by UV-persulphate oxidation
Principle of the method
In the presence of potassium persulphate (K2S2O8), extractable soil organiccarbon is oxidized by ultraviolet (UV) light to CO2, which is measuredusing infrared (IR) or photo-spectrometric detection.
Additional materials and apparatus
Automatic carbon analyser with IR-detection (e.g. Dohrman DC 80) or con-tinuous-flow systems with colourimetric detection (Skalar, Perstorp).
Additional chemicals and reagents
• K2S2O8• Concentrated H3PO4• Sodium hexametaphosphate [(Na(PO4)6)n]• Oxidation reagent: 20 g K2S2O8 are dissolved in 900 ml distilled water,
acidified to pH 2 with conc. H3PO4 and made up to 1000 ml• Acidification buffer: 50 g sodium hexametaphosphate are dissolved in
900 ml distilled water, acidified to pH 2 with conc. H3PO4 and made upto 1000 ml
Procedure
For the automated UV-persulphate oxidation method, 5 ml K2SO4 soilextract are mixed with 5 ml acidification buffer. Any precipitate of CaSO4 inthe soil extracts is dissolved by this procedure. The K2S2O8 is automaticallyfed into the UV oxidation chamber, where the oxidation to CO2 is activatedby UV light. The resulting CO2 is measured by IR absorption.
Calculation of results
CALCULATION OF EXTRACTABLE ORGANIC C
C (µg/g soil) = [(S × DS) – (B × DB)] × (VK + SW)/DW
80 P. Brookes and R.G. Joergensen

where: S = C in sample extract (µg/ml); B = C in blank extract (µg/ml); DS= dilution of sample with the acidification buffer; DB = dilution of blankwith the acidification buffer; VK = volume of K2SO4 extractant (ml); SW =volume of soil water (ml); and DW = dry weight of sample (g).
CALCULATION OF BIOMASS C
Biomass C (BC) = EC/kEC
where: EC = (organic C extracted from fumigated soils) – (organic Cextracted from non-fumigated soils) and kEC = 0.45 (Wu et al., 1990;Joergensen, 1996a).
Biomass C by oven oxidation
Extractable soil organic C is oxidized to CO2 at 850°C in the presence of aplatinum catalyser. The CO2 is measured by infrared absorption using anautomatic analyser (Shimadzu 5050, Dimatoc 100, Analytic Jena). The newoven systems use small sample volumes – so they are able to measure C inextracts containing large amounts of salts. The procedure is similar to theautomated UV-persulphate oxidation method, except that the samples arediluted with water and acidified using a few drops of HCl instead of thehexametaphosphate acidification buffer. The calculations of extractable Cand biomass C are identical to those used in the automated UV-persulphateoxidation method.
Determination of ninhydrin-reactive nitrogen
Principle of the method
Ninhydrin forms a purple complex with molecules containing α-aminonitrogen and with ammonium and other compounds with free α-aminogroups, such as amino acids, peptides and proteins (Moore and Stein, 1948).The presence of reduced ninhydrin (hydrindantin) is essential to obtainquantitative colour development with ammonium. According to Amatoand Ladd (1988), the amount of ninhydrin-reactive compounds, releasedfrom the microbial biomass during the CHCl3 fumigation and extraction by2 M KCl, is closely correlated with the initial soil microbial biomass carboncontent.
Additional apparatus
• Boiling water bath• Photo-spectrophotometer
Biomass Measurements by Fumigation–Extraction 81

Additional chemicals and solutions
• Ninhydrin• Hydrindantin• Dimethyl sulphoxide (DMSO)• Lithium acetate dihydrate• Acetic acid (96%)• Citric acid• Sodium hydroxide (NaOH)• Ethanol (95%)• L-Leucine• Ammonium sulphate ((NH4)2SO4)• Lithium acetate buffer: lithium acetate (408 g) is dissolved in water
(400 ml), adjusted to pH 5.2 with acetic acid and finally made up to 1 lwith water
• Ninhydrin reagent: ninhydrin (2 g) and hydrindantin (0.3 g) are dis-solved in dimethyl sulphoxide (75 ml), 25 ml of 4 M lithium acetatebuffer at pH 5.2 are then added (Moore, 1968)
• Citric acid buffer: citric acid (42 g) and NaOH (16 g) are dissolved inwater (900 ml), adjusted to pH 5 with 10 M NaOH if required, thenfinally made up to 1 l with water
Procedure
The procedure is described according to Joergensen and Brookes (1990) formeasuring biomass C and microbial ninhydrin-reactive N in K2SO4 soilextracts. A 10 mM L-leucine (1.312 g/l) and a 10 mM ammonium-N[(NH4)2SO4 0.661 g/l] solution are prepared separately in 0.5 M K2SO4 anddiluted within the range 0–1000 µM N. The standard solutions, K2SO4 soilextracts or blank (0.6 ml) and the citric acid buffer (1.4 ml) are added to20 ml test tubes. The ninhydrin reagent (1 ml) is then added slowly, mixedthoroughly and closed with loose aluminium lids. The test tubes are thenheated for 25 min in a vigorously boiling water bath. Any precipitateformed during the addition of the reagents then dissolves. After heating, anethanol:water mixture (4 ml 1:1) is added, the solutions are thoroughlymixed again and the absorbance read at 570 nm (1 cm path length).
Calculation of results
CALCULATION OF EXTRACTED NINHYDRIN-REACTIVE N (NNIN)
Nnin(µg/g soil) = (S – B)/L × N × (VK + SW)/DW
where: S = absorbance of the sample; B = absorbance of the blank; L = mil-limolar absorbance coefficient of leucine; N = 14 (atomic weight of nitro-gen); VK = volume of K2SO4 extractant (ml); SW = volume of soil water(ml); and DW = dry weight of the sample (g).
82 P. Brookes and R.G. Joergensen

CALCULATION OF MICROBIAL NINHYDRIN-REACTIVE N
Bnin = (Nnin extracted from the fumigated soil) – (Nnin extracted from thenon-fumigated soil)
CALCULATION OF MICROBIAL BIOMASS CARBON
Biomass C = Bnin × 22 (soils pH-H2O > 5.0)Biomass C = Bnin × 35 (soils pH-H2O � 5.0)
The conversion factors were obtained by correlating the microbial biomassC and Bnin in the same extracts of 110 arable, grassland and forest soils bythe fumigation–extraction method (Joergensen, 1996b).
Discussion
Biomass measurements are certainly useful in studies of soil protection.They have the advantage that they are relatively cheap and simple, as wellas being rapid. There is now a considerable amount of literature to showthat these measurements are useful in determining effects of stresses on thesoil ecosystem. Biomass ninhydrin measurements have two advantagesover biomass C. First, a reflux digestion is not required for ninhydrin N.This makes it very suitable for situations with minimal laboratory facilities.Secondly, in both biomass C and N measurements the fraction coming fromthe biomass is determined following subtraction of an appropriate ‘control’.With biomass C this value is often half of the total, while with biomass nin-hydrin N it is commonly about 10 or less. This causes considerably lesserror in its determination. Both parameters are very closely correlated, how-ever, so biomass C may be readily estimated from biomass ninhydrin N, asdescribed above. One feature of the fumigation–extraction method fre-quently caused concern. Upon thawing of frozen K2SO4 soil extracts, awhite precipitate of CaSO4 occurs in near-neutral or alkaline soils.However, this causes no analytical problems in either method and may besafely ignored.
Acknowledgements
IACR receives grant-aided support from the Biotechnology and BiologicalSciences Research Council of the United Kingdom.
Biomass Measurements by Fumigation–Extraction 83

6.3 Substrate-induced Respiration
HEINRICH HÖPER
Geological Survey of Lower Saxony, Friedrich-Missler-Straße46/48, D-28211 Bremen, Germany
Introduction
The method of substrate-induced respiration was developed by Andersonand Domsch (1978). It is based on the principle that, under standardizedconditions, the metabolism of glucose added in excess is limited by theamount of active aerobic microorganisms in the soil. During the first hoursafter substrate addition there is no significant growth of the microbial popu-lations, and the respiratory response is proportional to the amount ofmicrobial biomass in the soil. Anderson and Domsch (1978) established aconversion factor by correlating the substrate-induced respiration with themicrobial biomass determined by the fumigation–incubation method: 1 mlCO2/h corresponded to 40 mg microbial biomass carbon (Cmic).
For the measurements of substrate-induced respiration, Anderson andDomsch (1978) used a continuously operating CO2-analyser (Ultragas 3,Wösthoff, Bochum, Germany); however, soil samples were not permanentlyaerated and were flushed with CO2-free air only 20 min before measure-ment, thus leading to a temporary increase in CO2 and depletion in O2 inthe soil sample. Later, respiration was also measured by oxygen consump-tion (Sapromat, Voith, Germany) in closed vessels (Beck, 1984).
Heinemeyer et al. (1989) developed a system where soil samples arecontinuously aerated with ambient air and the CO2 production is detectedby an infrared gas analyser. This very sensitive system allows the detectionof respiration rates at high resolution after the addition of glucose.Concentration changes of less than 1 µl/l CO2 are detectable. The problemof CO2 absorption in carbonate-rich soils is overcome by the continuousflow. Kaiser et al. (1992) compared the soil microbial biomass as analysed bythe so-called Heinemeyer device with the fumigation–extraction methodaccording to Vance et al. (1987) and proposed changing the conversion fac-tor to 30 mg Cmic/1 ml CO2/h. This factor can also be used for mineral hori-zons of forest soils, as can be derived from the data of Anderson andJoergensen (1997) (Fig. 6.1).
The substrate-induced respiration method is based on the detection of arespiratory response of soil microorganisms on supply of glucose. Thus,only glucose-responsive and active organisms are measured. Based on thisprinciple, the substrate-induced respiration method detects predominantlybacterial biomass. In some cases, as in peat and marsh soils, differences
© CAB International 2006. Microbiological Methods for Assessing Soil Quality84 (eds J. Bloem et al.)

between the fumigation–extraction method and the substrate-induced res-piration method were attributed to population structure, e.g. bacteria-to-fungi ratio, differing from those of common aerobic soils (Anderson andJoergensen, 1997; Brake et al., 1999; Joergensen and Scheu, 1999; Chander etal., 2001). Additionally, in several non-fertilized soils, nitrogen and phos-phorus can become the limiting factors for microbial growth and the maxi-mum initial respiratory response (Dilly, 1999). In this case, the amendedglucose substrate should be enriched with a nitrogen, phosphorus, potas-sium and sulphur source (Palmborg and Nordgren, 1993).
Nevertheless, the method has been calibrated to determine the total soilmicrobial biomass (Anderson and Domsch, 1978) in a wide range of agricul-tural and forest soils. The results of the fumigation–extraction method andthe substrate-induced respiration method were well correlated (Kaiser et al.,1992; Anderson and Joergensen, 1997). Also, Lin and Brookes (1996) con-firmed a good relationship between the fumigation–extraction method for agroup of amended and unamended soils, and concluded that these soilshad the same SIR response, although the activity status of the soil microor-ganisms and the community structure should be different.
Principle of the Method
The method of substrate-induced respiration is based on the principle thatmicroorganisms react to the addition of glucose with an immediate respira-tion response that is proportional to their biomass as long as the organismsdo not utilize the glucose for growth. Under standardized conditions, espe-cially with respect to temperature and water content of the sample, and if
Substrate-induced Respiration 85
Fig. 6.1. Relation between substrate-induced respiration (SIR) and microbial biomass (Cmic)measured by the chloroform fumigation–extraction (CFE) method in mineral horizons offorest soils. Data were recalculated from Anderson and Joergensen (1997).

glucose is given in excess without being inhibitory, the only factor limitingthe respiratory response within the first hours is the amount of microorgan-isms. The optimal glucose concentration should be tested in preliminaryassays. In arable soils with an expected microbial biomass below800 mg Cmic/kg soil, a glucose amendment of 3000 mg/kg is often used.
A typical respiration curve is shown in Fig. 6.2, where the respirationrate is almost constant during the first 3 h after glucose amendment andincreases due to microbial growth between 4 and 14 h.
The respiration rate after glucose supply can be measured by anymethod for measuring respiration rates in general. Nevertheless, methodsthat permit hourly monitoring of the respiration rates should be preferred,as the initial respiratory response of the soil sample on glucose supply canbe derived from the actual curve shape (see Section 7.2). As an example ofcontinuous measurement, the procedure using the Heinemeyer soil biomassanalyser (Heinemeyer et al., 1989) will be described in more detail below.Under low-budget conditions, an approach for soil respiration as developedby Jäggi (1976), based on static incubation with an alkali trap, can be used(Beck et al., 1993; Anonymous, 1998; Pell et al., Section 7.2).
Materials and Apparatus
General equipment
• Room or chamber at constant temperature of 22 ± 1°C• Balance (1000 g, resolution 0.1 g)
Heinemeyer soil biomass analyser
• SIR soil biomass analyser (Heinemeyer et al., 1989) with an infrared gasanalyser and a flow meter for flow rates < 500 ml/min
• 24 fibreglass tubes, inner diameter 4 cm, length 25 cm. 48 sample hold-ers of rubber foam
• Bubble meter, 100 ml, to control the flow meter• Plastic beakers to permit homogeneous incorporation of glucose into
the soil• Hand mixer
Static incubation in airtight jars (Jäggi, 1976)
• Incubation vessels: SCHOTT-bottles with ISO thread, 250 ml• Vessels for the soil material: flanged test tubes of polypropylene, inner
diameter 29 mm × 105 mm, with lateral holes (3 cm below the fringe, 12holes with 2 mm diameter) for gas exchange
86 H. Höper

• Rubber seal: O-ring 35 mm × 5 mm• Burette, volume 20 ml or 10 ml, with CO2 trap
Chemicals and solutions
General reagents
• Glucose–talcum mixture, ratio 3:7; add 150 g glucose p.a. to 350 g tal-cum
Heinemeyer soil biomass analyser
• Reference gases 330 µl/l CO2 and 400 µl/l CO2 in synthetic air• Soda lime with indicator to produce CO2-free air• Demineralized water with a small amount of phosphoric acid to reduce
the pH to about 5.0
Static incubation in airtight jars (Jäggi, 1976)
• Demineralized water (H2O, electric conductivity < 5 µS/cm)• Sodium hydroxide solution 0.025 M: sodium hydroxide solution 0.1 mol/l
Titrisol diluted in 4 l H2O• Hydrochloric acid 0.025 M: hydrochloric acid 0.1 mol/l Titrisol diluted in
4 l H2O
Substrate-induced Respiration 87
Fig. 6.2. Respiration rates converted to microbial biomass of a soil after the supply of3000 mg glucose/kg soil.

• Phenolphthalein solution: 0.2 g phenolphthalein (C20H14O4, M =318.33 g/mol) dissolved in 200 ml ethanol (60%)
• Barium chloride solution 0.5 M: 12.22 g barium chloride (BaCl2 2H2O, M =244.28 g/mol, p.a.) dissolved in 100 ml H2O
Procedure
General procedure
Sample preparation
Soils are partially dried or rewetted to 40–60% of the maximum water-hold-ing capacity and passed through a 2 mm sieve. The water content of the soilshould be as wet as possible but allowing the soil to be sieved and maintainthe aggregate structure. Until the analysis, soil samples should be stored at4°C. In order to reduce the effects of fresh organic matter amendments tothe soil just before sampling, a pre-incubation of 1 week at about 22°Cbefore the measurement is advised.
Determination of the optimal glucose concentration
Glucose is added in excess to the soil in order to get the maximum initialrespiratory response. It has to be ascertained that the glucose does notinhibit microbial activity. At least five different concentrations should betested. In agricultural soils, concentrations between 500 mg/kg and6000 mg/kg soil are appropriate. Replicates are not necessary at this stageof assessment. The glucose concentration leading to the maximum initialrespiratory response is optimal for measuring microbial biomass.
Measurement of microbial biomass
The measurement should last 24 h to control the exponential growth and tobe sure that glucose was the only limiting factor for microbial respiration.
Heinemeyer soil biomass analyser
Glucose incorporation and measurement of respiration rate
At least three replicates should be analysed. To establish a concentration of3000 mg glucose/kg soil, 0.5 g of the glucose–talcum mixture is added tohumid soil, corresponding to 50 g on a oven-dry basis, in a plastic beakerand thoroughly mixed for 2 min using the hand mixer. Soils should be han-dled with care in order to avoid disaggregation and the formation of a soilpaste. As quickly as possible, the samples should be transferred into thefibreglass tubes and fixed at each side by sample holders, and the measure-
88 H. Höper

ment of the respiration rate should be started. The flow rate is adjusted foreach sample to about 200 ± 200 ml/min.
Calibration
The CO2 concentration difference has to be calibrated at least once a week,following the manual. The flow meter should be calibrated by the manufac-turer every second year. An internal control using a bubble meter should beperformed at least once every 6 months.
Static incubation in airtight jars (Jäggi, 1976)
Blanks
Prepare five blanks per batch without soil, handled like the soil-containingvessels, in order to be able to correct for CO2 trapping in the alkali trap dur-ing handling and titration.
Preparation of alkali traps
Label incubation vessels and soil vessels. Add 20 ± 0.1 ml of 0.025 Msodium hydroxide solution into the incubation vessel. For one batch thesame solution has to be used (to have the same relation to the blanks). Theflask containing the sodium hydroxide solution has to be equipped with aCO2 trap (soda lime) to avoid CO2 adsorption from ambient air flowing intothe flask.
First incubation time (2 h)
Glucose (60 mg) is added to the pre-incubated soil (corresponding to 20 gon an oven-dry matter basis). Soil and glucose are mixed thoroughly with aspatula and the mixture is used to fill the soil vessels. The soil vessels aretransferred into a climate chamber or an incubator at 22°C for 2 h, as a start-ing time for glucose consumption.
Main incubation time (4 h)
After exactly 2 h the soil vessels are transferred into incubation vessels con-taining 20 ml 0.025 M sodium hydroxide solution, which are carefullyclosed and incubated for another 4 h. At least four replicates are recom-mended.
Titration
After 4 h, the soil vessels are removed. The sodium hydroxide solution istitrated immediately. Before titration, CO3
2– is precipitated with 1 ml 0.5 Mbarium chloride solution. Subsequently, four drops of the phenolphthalein
Substrate-induced Respiration 89

solution, as indicator, are added per incubation vessel and the vessel isimmediately titrated with 0.025 M HCl until decoloration of the indicator.The consumed volume of the 0.025 M HCl solution is read (in ml).
Calculation
Heinemeyer soil biomass analyser
Cmic = 30 Fs * (Cs – Cb)/SW
where: Cmic = carbon in microbial biomass (mg C/kg dry soil); Fs = flowrate of the air passing the sample (l/h); Cs = CO2-concentration of CO2-enriched air, coming from the sample tube (ml/l); Cb = CO2-concentrationof air coming from an empty reference tube (blank) (ml/l); SW = dry mattersample weight (kg); and 30 = constant (mg Cmic h/ml CO2).
Static incubation in airtight jars (Jäggi, 1976)
The HCl readings of the five blanks are averaged (blank = BL). The amountof microbial biomass carbon (Cmic) for each sample (SA) is calculated as fol-lows:
where: Cmic = carbon in microbial biomass (mg Cmic/kg dry soil); BL =mean of the HCl readings of the five blanks (ml HCl); SA = HCl readings ofthe samples (ml HCl); k = concentration of the HCl solution; 22 = factor(1 ml 1 M HCl corresponds to 22 mg CO2); 1000 = conversion factor g soilinto kg soil; 1.8295 = density of CO2 at 22°C (mg/ml) (density of CO2 at 0°Cand 1013.2 hPa is 1.9768 mg/ml); SW = sample weight (g soil dry matter);and 4 = conversion factor 4 h to 1 h.
Discussion
Technical advantages of SIR
The SIR, especially when using the Heinemeyer device, has some advan-tages over the fumigation methods. First, it has a very low determinationlimit of about 5–10 mg Cmic/kg of soil. Thus, the method is also suitable forthe assessment of subsoil samples. The standard deviation between repli-cates is also very low and was estimated by Höper and Kleefisch (2001), forroutine analysis within the soil monitoring programme of Lower Saxony,Germany, to be in the median 2.2% and, in 90% of the cases, below 5.2%(Table 6.1).
Ck
mic = −( ) × ×× ×
3022 1000
1 8295 4BL SA
SW.
90 H. Höper

Use of SIR for monitoring of soil quality
Substrate-induced respiration has been used in several soil monitoring pro-grammes (Beck et al., 1995; Kandeler et al., 1999; Höper and Kleefisch, 2001;Machulla et al., 2001; Oberholzer and Höper, 2001; Rampazzo and Mentler,2001). In the Soil Monitoring Programme of Lower Saxony (Germany),sources of variability were examined using a defined sampling strategy (16cores of 4 cm diameter, 0–20 cm depth in arable land; 0–10 cm and10–20 cm depth in grassland; sampling period between mid-February andmid-March). Variability due to space and year was rather low, and could beattributed partially to the fact that a baseline variation had to be considered,i.e. the variation between repeated samplings of the same area taken at thesame time (Table 6.1). Due to the low spatial and interannual variation, itwas already possible to detect significant changes of microbial biomass onsome monitoring plots after 5 years. Between 1996 and 2000 a significantdecrease in microbial biomass was found in some acid soils and in soilswith a low organic matter input (Höper and Kleefisch, 2001).
For the evaluation of measurements, a reference system was establishedbased on the prediction of microbial biomass from abiotic soil properties. Toevaluate a given soil, the measured value was compared to the value calcu-lated on the basis of a multiple regression equation with organic C or Ncontent, pH and clay or sand content of the soil (Höper and Kleefisch, 2001;Oberholzer and Höper, 2001). It was possible to establish a common refer-ence system for soils from Lower Saxony, northern Germany andSwitzerland (Oberholzer and Höper, 2001). As a whole range of differentland uses, climatic conditions and other soil conditions (e.g. water regime)were integrated, the standard error was rather high, ranging from 24% to32% of the predicted value.
Substrate-induced Respiration 91
Table 6.1. Sources of variability for substrate-induced respiration (SIR) measurements withthe Heinemeyer soil biomass analyser (Heinemeyer et al., 1989) in the Soil MonitoringProgramme of Lower Saxony, Germany, 1996–2000 (Höper and Kleefisch, 2001).
Sources of Coefficient of 90% variability Explanation variation (median) quantile
Analytical Between 3 analytical replicates 2.2 5.2Repeated sampling Between 5 bulk samples of 16 7.4 n.d.
sample cores each of the same plotSpatial Between 4 subplots of 250 m2 in 9.6 17.4
the same field 12.8a 37.5a
Temporal Between samples of the same plot 14.1 26.1(interannual) and the same annual period over 15.3a 40.9a
3–5 years
aArable versus grassland soils.

Use of SIR for ecotoxicological risk assessment
The SIR has been broadly used for ecotoxicological risk assessment of soilscontaminated with heavy metals or organic contaminants (e.g. pesticides orTNT), for example by Beck (1981), Wilke (1988), Harden et al. (1993),Fließbach et al. (1994), Kandeler et al. (1996), Barajas et al. (1999), Chander etal. (2001) and Frische and Höper (2003). In contaminated soils, SIR biomasshas been a more sensitive parameter than microbial biomass estimated byfumigation–extraction, and both methods were less correlated than in theabove example (Chander et al., 2001). Probably the glucose responsive andmore active part of the microflora, determining the SIR biomass, is moresensitive to pollution than the total microbial biomass, as measured bio-chemically.
The use of substrate-induced respiration curves for ecotoxicological soilassessment is of growing interest (Palmborg and Nordgren, 1993; Johanssonet al., 1998) and has recently been standardized (ISO standard 17155). Theshape of the respiration curve is changing with increasing contaminant con-tent; especially, the time lag before the start of exponential growth and thetime until maximal respiration rate increase and maximum growth ratedecreases (Winkel and Wilke, 1997; Johansson et al., 1998; Wilke and Winkel,2000).
Drawbacks and limits of SIR
The SIR is a physiological method, based on the measurement of potentialactivity of microorganisms in the soil. It is calibrated against chloroformfumigation methods for measuring soil microbial biomass carbon in a largevariety of soils. Nevertheless, differences between SIR and chloroformfumigation methods have been observed under specific situations, such ascontaminated grassland soils or peatlands (Brake et al., 1999; Chander et al.,2001). Under these conditions, SIR, as a potential activity parameter, is obvi-ously affected by soil conditions in a different way than microbial biomassestimated by chloroform fumigation methods, as a mass parameter.
Finally, SIR is a black-box method, not differentiating between differentgroups of microorganisms (e.g. bacteria versus fungi). Nevertheless, alsoas a black-box method, the benefit of SIR in monitoring of soil qualityand ecotoxicological soil assessment has been shown in a large number ofpublications.
92 H. Höper

6.4 Enumeration and Biovolume Determination ofMicrobial Cells
MANFRED BÖLTER,1 JAAP BLOEM,2 KLAUS MEINERS1 AND ROLF MÖLLER1
1Institute for Polar Ecology, University of Kiel, Olshausenstraße40, D-24098 Kiel, Germany; 2Department of Soil Sciences,Alterra, PO Box 47, NL-6700 AA Wageningen, The Netherlands
Introduction
Number and biomass of microorganisms are basic properties for soil eco-logical studies. They can be related to parameters describing microbialactivity, soil health and other intrinsic soil descriptors (Kepner and Pratt,1994). This often includes detailed analyses of the microbial communities,focusing on differentiation between individual organisms, growth forms,size classes, metabolic signatures or other specific properties.
The search for tools to count bacteria by microscopy in soil has a long tra-dition. The introduction of fluorescence stains and epifluorescencemicroscopy has found wide acceptance for aquatic and terrestrial ecologicalstudies (Trolldenier, 1973; Zimmermann, 1975, 1977; Hobbie et al., 1977). It hasresulted in different applications and techniques for individual disciplines inmarine microbiology, limnology and soil science (Bloem and Vos, 2004).
However, a basic restriction of total microscopic counts is the lack ofdiscrimination between active and inactive cells. Another problem is posedby the small cell size, which is mostly less than 0.5 µm in diameter in nat-ural samples, a fact that cannot be attributed only to dwarf or resting cells –although most of them are suspected to be non-culturable (Bakken andOlsen, 1987) and their growth rates can be very low (Bååth, 1994).
New techniques and image analysis have made microscopy an appro-priate tool to get an independent insight into the soil communities. It hasbecome a basic step for soil ecology and provides baselines for other indi-rect measures of biomass and activity (Bloem et al., 1995a; Liu et al., 2001;Bölter et al., 2002). The following shall focus on basic ways of cell enumera-tion and related methodologies to evaluate microbial biovolume, and onmicrobial biomass calculated thereof. An example of results in contami-nated soil is given.
Principles of Microbiological Counting
The list of appropriate dyes and staining procedures is long, and the use offluorescent dyes has increased for various new applications. The introduc-
© CAB International 2006. Microbiological Methods for Assessing Soil Quality(eds J. Bloem et al.) 93

tion of molecular probes into microbial ecology is a main field for the appli-cation of fluorescent dyes. Although most procedures focus on bacteria,several attempts have also been made to develop techniques for studies onfungi and yeasts (e.g. Pringle et al., 1989; Deere et al., 1998). Some of thedyes are very sensitive and can be used to enumerate viruses (Fuhrman,1999; Marie et al., 1999). In most recent studies using fluorescentmicroscopy, the following dyes have been used.
DAPI (4’,6-diamidino-2-phenylindole-dihydrochloride)
This is a blue fluorescent stain, which binds to double-stranded DNA(dsDNA) and RNA, but in different modes. It has become a popular stain inaquatic research for enumerations of bacteria and protozoa, and is widelyused as a counterstain or parallel stain in fluorescence in situ hybridization(FISH) protocols. The fluorescence of DAPI, when bound to dsDNA, canbest be excitated at 358 nm (UV); the maximum emission is at 461 nm(Haughland, 1999). When bound to RNA, the emission maximum shifts to500 nm. Hence, excitation can best be performed by using xenon or mercuryarc lamps. DAPI is also used as a stain in laser scanning microscopy and inflow cytometry.
Acridine orange
Acridine orange (AO) has strong affinity to acidic organelles (Haughland,1999). It can be used to stain eukaryotic and prokaryotic cells. The greenand red fluorescence has been used to discriminate between live and deadcells (Strugger, 1949; Bank, 1988), viable and non-viable bacterial spores(Sharma and Prasad, 1992) or to monitor physiological activity (McFeters etal., 1991). This has been attributed to the different fluorescence colourswhen bound to DNA and RNA (Traganos et al., 1977). The dye shows brightgreen fluorescence when it is fixed to double-stranded nucleic acid; a redlight is emitted when bound to single-stranded nucleic acid. More recently,this statement has been modified: green fluorescent bacteria are in astationary phase and actively growing bacteria show red fluorescence(Haugland, 1999).
DTAF (5-(4,6-dichlorotriazin-2-yl) aminofluorescein)
This has been preferred for automatic image analysis of bacteria in soilsmears because of the low background staining (Bloem et al., 1995a,b; Paulet al., 1999). It binds covalently to proteins.
94 M. Bölter et al.
Differential fluorescent stain
Differential fluorescent stain (DFS) is a nucleic acid stain, which has yieldedgood results for bacteria, as well as fungal hyphae, in soil. This is a mixtureof europium(III) thenoyltrifluoroacetonate (europium chelate) and thedisodium salt of 4,4’-bis(4-anilino-6-bis(2-hydroxyethyl)amino-S-triazin-2-ylamino)2,2’-stilbene disulphonic acid, which is also called FluorescentBrightener (FB), Calcofluor White, Tinopal, or Fluostain I. In the DFS mix-ture, europium chelate stains DNA and RNA red, and FB stains celluloseand polysaccharides (cell walls) blue. Blue cells are assumed to be inactiveor dead. Red cells are assumed to be active because in these cells the fluo-rescence is dominated by the europium chelate, indicating a higher nucleicacid content and a higher growth rate. The discrimination between activeand inactive bacterial cells and fungal hyphae is an advantage of DFS(Morris et al., 1997). A disadvantage is that the europium cannot be detectedwith a confocal laser scanning microscope for automatic image analysis(Bloem et al., 1995b). Europium is a phosphorescent dye, which starts lightemission microseconds after excitation. This is too slow for a confocal laserscanning microscope, but it is no problem for conventional epifluorescencemicroscopy. The stained cells can be identified and discriminated fromother particles and thus serve as a base for their enumeration, measurementor identification.
Materials and Apparatus
Sampling and storage
To obtain samples for microbiological analyses, clean, or sometimes sterile,sampling devices are needed. Samples should be stored frozen, cool or air-dried until analysis. It should be kept in mind that any storage may influ-ence the original community, e.g. freezing may reduce bacterial number.Pre-incubation after freezing restores bacterial number, but not necessarilyto the original density (Bloem et al., Chapter 3, this volume). Details on stor-age problems can be found in the literature for various purposes – the beststrategy, however, is direct observation without long times between sam-pling and analyses (Ross et al., 1980, West et al., 1986, 1987; Turley andHughes, 1994; Stenberg et al., 1998).
Sample preparation
Various methods have been employed to separate bacteria from particles(e.g. Lindahl and Bakken, 1995). Methods using detergents or ultrasonictreatments are widely used. They can provide good results in coarse materi-als or organic substrates, but may cause severe problems when used in sam-ples with high loads of silt or clay. Fine particles, just in the size of small
Enumeration and Biovolume Determination 95

rods or cocci, often occur after ultrasonic treatments. Before attemptingsuch procedures, normal hand shaking can be employed as a first attempt.Bloem et al. (1995b) have compared different methods for preparing soilsuspensions and found no positive effects of detergents and deflocculants.Too much mixing and sonication results in loss of cells. Bloem et al. (1995b)and Paul et al. (1999) recommended homogenization of soil suspensions(20 g in 190 ml) for 1 min at maximum speed (20,000 rev/min) in a (Waring)blender, for counting both bacteria and fungi. Soil samples with high con-tents of coarse material can be allowed to settle for a short time (approxi-mately 1 min) before subsamples are used. Soil suspensions fixed withformaldehyde (3.7% final concentration) can be stored for 1 week at 2°C. Itis safest to make the preparations as soon as possible after fixation and storethe stained slides.
Staining and filtration
Preparation of filters
Identification and discrimination of small objects need a well-definedbackground. The use of black (polycarbonate) membrane filters is recom-mended. A pore size of 0.2 µm should be used for counting bacteria. Thestaining can take place on the filter, or in solution and then be filtered bylow vacuum (0.2 kP/cm2). The filter is then mounted on a microscope slideand the stained bacteria are viewed with an epifluorescence microscope.Unbound dyes can interfere with the filter material and cause backgroundstaining, so a washing step may be necessary.
Preparation of soil smears
Bacteria can also be counted directly on a glass slide in a soil smear (Babiukand Paul, 1970). A smear is prepared by drying 10 µl of a homogenized soilsuspension on a printed microscopic slide. Bloem et al. (1995b) reported lessbackground staining and less fading of fluorochromes in smears than on fil-ters. Soil films in smears are completely flat, which is a great advantage forautomatic image analysis.
Microscopy
The correct optical presentation of objects below the micrometer range mayraise several problems, due to the limited depth of focus of normal lenses.The use of confocal laser scanning microscopy is thus a good tool becauseimages of different focal planes are combined to one image with extendedfocus. In addition, halo effects are avoided. Illumination and halo effectsmay lead to overestimation of sizes. Kato (1996) makes the point for carefulconsideration of halo effects and low visibility of cell protoplasm with
96 M. Bölter et al.

DAPI, which may result in underestimation of biovolumes. DAPI has beenreported to yield about 40% lower estimates of cell volumes than AO(Suzuki et al., 1993).
Discrimination between small bacteria and unspecific particles needs tobe performed carefully. Human subjectivity is another important factorwhen comparing and analysing data from various laboratories (Domsch etal., 1979; Nagata et al., 1989), beside problems with accurate size measure-ment (Suzuki et al., 1993), which has important effects on biovolume calcu-lations.
Equipment
Epifluorescence microscope fitted with filters for excitation of cells withblue light (wavelength c. 470 nm, for AO and DTAF) and UV (c. 365 nm, forDAPI and DFS), and equipped with a 100× oil-immersion lens for bacteriaand a 40× (50×) lens(es) for fungi. For direct counting and sizing, an eye-piece graticule can be used (May, 1965), e.g. G12 New Porton Grid(Graticules Ltd, Tonbridge, Kent, UK). For digital image analysis, video-cameras can be connected to personal computers equipped with imageanalysis software.
Chemicals and Solutions
General supplies
• Particle-free water• Prestained polycarbonate filters (diameter: 25 mm; pore size: 0.2 µm); it
is also possible to use normal polycarbonate filters stained in a solutionof 2 mg/l Irgalan-Black in 2% acetic acid fixed with 0.2% formaline.After staining for about 12 h the filters are washed with particle-freedistilled water until no black stain is visible in the washing water
• Cellulose acetate filters (diameter: 25 mm; pore size: 0.4–0.6 µm) mustbe used as backing filters to support homogeneous distribution of bac-teria on the polycarbonate filter
• Clean microscope slides and cover slips• Non-fluorescent immersion oil (e.g. Cargill Type A, Cargill Ltd, Cedar
Grove, New Jersey, USA)• Tips for micro-pipettes (200 µl and 1–10 ml)• Box for storage of microscope slides• For soil smears: printed microscope slides (e.g. Cel-Line (Erie Scientific,
Portsmouth, New Hampshire, USA) or Bellco (Vineland, New Jersey,USA)) with a hole of 12 mm diameter in the centre. Wipe the slides with70% ethanol and, finally, with a little undiluted liquid soap to promoteeven spreading of soil suspension
Enumeration and Biovolume Determination 97
Solutions
Filter all the following solutions through a 0.2 µm membrane before use.
• Particle-free formalin (37%) (two times 0.2 µm filtered)• For bacteria on filters:
– acridine orange (AO) (e.g. Sigma Chemical Co., St Louis, Missouri,USA), 1 mg/ml (can be stored at 4°C for some days). If it is not fixedwith formalin, the solution needs to be filtered (0.2 µm) before its nextuse. Contamination occurs frequently!– as an alternative to AO, the dye DAPI (e.g. Sigma Chemical Co.) canbe used; prepare stock solution: 1 mg/ml (can be stored frozen in thedark for several weeks); and working solution: 10 µg/ml
• For soil smears stained with DTAF (bacteria) or DFS (bacteria andfungi):– buffer solution consisting of 0.05 M Na2HPO4 (7.8 g/l) and 0.85%NaCl, adjusted to pH 9– stain solution consisting of 2 mg DTAF dissolved in 10 ml of thebuffer (should not be stored for longer than a day)– DFS solution is prepared by dissolving 3.5 g/l europium chelate(Kodak, Eastman Fine Chemicals, Rochester, New York, USA) and50 mg/l fluorescent brightener, C40H42N12O10S2 Na2 (FW 960.9,Fluostain I, Sigma Chemical Co.), in 96% ethanol. Fluorescent bright-ener C40H42N12O10S2 without Na2 needs addition of NaOH (1 drop/ml)to get it into solution (Serita Frey, personal communication). After a fewminutes, when the powder has dissolved completely, dilute to 50%ethanol with an equal volume particle-free water. In order to avoid highcounts in blanks (preparations without soil added) due to precipitationof europium chelate, it is better to prepare the DFS solution 1 daybefore use and to filter the stain through a 0.2 µm pore-size membraneimmediately before use. With all stains, blanks should be checked regu-larly.
Procedure
The protocol for the method is simple: the objects are stained with anappropriate fluorochrome, filtered on to a polycarbonate membrane andcounted by epifluorescence microscopy. The individual steps are easy andcan even be performed in field labs.
Preparation of the soil suspension
Weigh approximately 1 g fresh soil into a clean glass vial, add 10 ml of par-ticle-free distilled water fixed with particle-free buffered formalin (final con-centration: 1%) and shake vigorously for 1 min.
98 M. Bölter et al.

High dilution of the soil is also important to minimize masking of bac-teria by soil particles. Masking is likely to occur when more than 1 mg ofsoil is added per cm2 on the microscope slide (Bloem et al., 1995b). Coarseparticles are removed by settling for 1 min before subsamples are taken forthe filtration (see below). Many laboratories homogenize the soil suspen-sions to disperse bacteria, e.g by using a blender for 1 min at maximumspeed (Bloem et al., 1995b, Paul et al., 1999).
Staining
Equip the filtration unit with a cellulose-acetate backing filter (0.4–0.6 µmpore size) to spread the vacuum evenly. Put the black-stained polycarbonatefilter (shiny side up) on top of it. The polycarbonate-filter must fit close andflat to the backing filter, without any air bubbles or folds.
1. Staining with AO
Pipette 5 ml of particle-free water into the funnel, add 100 µl of the soilsuspension, add 500 µl of the AO solution, mix the water/sample/dyesolution carefully and stain for about 3 min.
2. Staining with DAPI
Pipette 5 ml of particle-free water into the funnel, add 100 µl of the soil sus-pension, mix carefully and filter the samples down at low vacuum (maxi-mum: –150 mbar) until approximately 1 ml remains. Stop filtration byreleasing the vacuum from the filtration unit, add 700 µl of the DAPI work-ing solution and stain for 8 min.
After staining (methods 1 or 2), suck the solution softly with low vac-uum (maximum: –200 mbar), until all the water has gone. Transfer the drypolycarbonate filter from the vacuum device, and mount it (bacteria on top)on a microscope slide, using a thin smear of non-fluorescent immersion oil(e.g. Cargill Type A). Wynn-Williams (1985) recommends Citifluor® as aphotofading retardant, which also accentuates different colour contrastsbetween organisms. Take care that no air is under the filter. Add a smalldrop of the immersion oil on top of the filter and mount a cover slip. Pressthe cover slip down carefully until the oil moves out from the edges of thecover slip and the filter. Lateral movements of the cover slip must beavoided; they can result in unequal distribution of the bacteria. To avoidcross-contamination, wash the funnel of the filtration unit thoroughly withparticle-free distilled water between samples. The cellulose-acetate backingfilter can be used for several filtrations.
Enumeration and Biovolume Determination 99

3. Staining bacteria in soil smears with DTAF
Smear 10 µl soil suspension evenly in the hole on a glass slide. The water-repellent coating keeps the suspension in a well-defined area. Allow thesmears to air-dry completely; this fixes the organisms to the slide. The slidesare placed flat on paper tissue in a plastic tray. Flood the spots of dried soilwith drops of stain for 30 min at room temperature. To prevent drying, thetissue is moistened before, and the trays are covered during staining. Rinsethe slides three times for 20 min with buffer and finally for a few secondswith water, by putting them in slide holders and passing them through fourbaths. After air-drying, mount a cover slip with a small drop of immersionoil. The edges of the cover slip can be sealed with nail varnish. The slidescan be stored at 2°C for at least a year (Bloem and Vos, 2004).
4. Staining fungal hyphae in soil smears with DFS
Prepare smear as above. After air-drying, stain the slides for 1 h in a bathwith DFS solution. Flooding with drops of DFS is also possible if drying iseffectively prevented during staining. Evaporation of ethanol may lead toprecipitation of europium chelate, resulting in fluorescent spots, which maybe confused with bacteria. Rinse the slides three times for 5 min in bathswith 50% ethanol. After air-drying, mount a cover slip with a small drop ofimmersion oil. The slides can be stored at 2°C for at least a year (Morris etal., 1997; Bloem and Vos, 2004).
Examination of the slide
Check the slide for one focal plane. A large drop of immersion oil can resultin floating cells, i.e. a slide with two focal plains. Check for equal distribu-tion of cells on the filter. Bacterial number per counting area should rangebetween 20 and 50 cells. If the number of cells is too low or too high, differ-ent aliquots of the sample dilution (10–500 µl) or different sample inputs(0.1–3 g) can be used. Filters can be frozen immediately and stored at –20°Cin the dark for later analysis.
Counting and calculations
Counting proceeds by use of an epifluorescence microscope at randomlychosen fields following a cross-pattern on the slide. To minimize subjectiv-ity, ensure that the filter is not observed while the field of view is changed.A minimum of 400 cells or a minimum of 20 counting squares can be recom-mended as a general rule. The optimum number of fields depends on theaverage number of bacteria per field. If the bacteria are randomly distrib-uted, and there are at least 25 cells per field, ten fields are usually sufficient.When there are only a few cells per field, it is better to increase the numberof counted fields. With a free computer program, the random distribution of
100 M. Bölter et al.

bacteria on the slide and the optimum number of fields can be checked dur-ing counting (Bloem et al., 1992).
Total numbers of bacteria are calculated from the mean count of bacteriaper counting area, the effective filtration area, the dilution factor of the soilsuspension, the amount of soil used and the filtration volume as follows:
TBC = (D × B × M)/W
where: TBC = total bacterial count per g soil (cells/g); D = dilution causedby suspension and subsequent subsampling of the soil; B = mean count ofbacteria per counting area; M = microscope factor (filtration area/area ofcounting field); and W = weight of oven-dry soil sample (g).
Sizing of the bacteria can be performed with different methods, e.g.with eyepiece graticules or digital image analysis systems. Fungi arecounted at about 400-fold magnification. Check for unstained (brown)hyphae using transmitted light instead of epifluorescence. In one or twotransects over the filter (about 50–100 fields), hyphal lengths are estimatedby counting the number of intersections of hyphae with (all) the lines of thecounting grid (Bloem et al., 1995b, Paul et al., 1999). Usually, many fields areneeded because most fields contain no hyphae.
The hyphal length, H (µm), is calculated as:
H = (n × π × a)/(2 × l)
where: n = number of intersections per grid; a = grid area (µm2); l = totallength of lines in the counting grid (µm).
The total length of fungal hyphae F (per mg soil) is calculated as:
F = H × 10–6 × (A/B) × (1/S)
where: H = hyphal length (µm/grid); 10�6 = conversion of µm to m; A =area of the slide covered by sample; B = area of the grid; and S = amount ofsoil on the slide.
Calculation of biovolume
Several methods have been used for the estimation of bacterial biovolume,including electronic sizing, flow cytometry and different microscopic tech-niques (Bratbak, 1985). The latter are scanning electron microscopy (SEM),transmission electron microscopy (TEM), confocal laser scanningmicroscopy, normal light microscopy and widely used epifluorescencemicroscopic techniques (Bratbak and Dundas, 1984; Bratbak, 1993; Bloem etal., 1995a). The microscopic estimation of cell volumes is based on measure-ment of the linear dimensions (length, width, perimeter) of individual bac-terial cells. These parameters may be obtained with an eyepiece graticule,using photomicrographs or videocamera-equipped microscopes and digitalimage analysis (Bloem et al., 1995a; Posch et al., 1997).
Linear dimensions are converted to cell volumes using stereometric for-mulas. A widely used formula, applicable for cocci and rods as well as fila-ments, has been given by Krambeck et al. (1981):
Enumeration and Biovolume Determination 101

V = (π/4) × W2 × (L – W/3)
where: V = volume (µm3); L = length (µm); and W = width (µm); for cocci,length = width. This equation can also be used for fungal hyphae when thediameter has been estimated.
Other calculations distinguish between distinct bacterial morphotypesand use various geometrical bodies to approximate cell shapes. Additionalformulas are based on multiple measurement features derived by com-puter-assisted microscopy (Posch et al., 1997; Blackburn et al., 1998).Assuming a linear relationship between length and width for bacteria, anapproximation for increasing cell width with cell length can be applied(Zimmermann, 1975; Bölter et al., 1993). Special demands for volume calcu-lations need to be taken into consideration when cyanobacteria, fungi oralgae are under inspection, and special conversion factors at species level orfor morphological groups need to be taken into consideration (Bölter, 1997).
Calculation of bacterial biomass
The bacterial biomass is calculated by multiplication of the product of cellnumber and average cell volume with a conversion factor. The easiest con-version can be performed by the assumption that 80% of the biovolumeconsists of water, and the remaining dry weight (20%) is considered to be50% carbon. This rough estimate has found several refinements due to spe-cific habitats, populations, or other considerations. Problems arise sincemicrobial communities are natural consortia of bacteria and fungi. Van Veenand Paul (1979) describe significantly different ratios for bacteria, yeastsand filamentous fungi, depending on actual water content. The spans forspecific weights of bacteria and fungi range from 0.11 g/cm3 to 1.4 g/cm3.
Three different models have been used to convert bacterial numbersand cell volumes into biomass values (Norland, 1993).
• The constant ratio model assumes a constant, size-independent car-bon:biovolume ratio and neglects the potential condensation of carbonin smaller cells.
• The constant biomass model assumes a constant carbon content of cellswith different biovolumes, e.g. a standard carbon unit per cell.
• The allometric model assumes that the dry-weight:volume ratiodepends on cell volume, and that smaller bacteria have a higher dry-weight:volume ratio than larger ones. This model considers that thecell quota of different cell constituents may vary with cell size. Theallometric models are expressed as power functions:
m = C × Va
where: m = carbon content; C = conversion factor (carbon per unit volume)V = cell volume; and a = scaling factor.
All models neglect the fact that cell quotas of different majorconstituents, including water, vary not only with cell size but also with
102 M. Bölter et al.

bacterial species, and depend on the physiological condition of the organ-isms (Bratbak, 1985; Fagerbakke et al., 1996; Troussellier et al., 1997). Most ofthe experimentally derived conversion factors are based on single species ordistinct assemblages (mainly planktonic bacteria). Transferring these factorsto other environments is problematic.
As a rough estimate, fungal biomass can be calculated from the bio-volume using a specific carbon content of 1.3 × 10�13 g C/µm3. Becausesmaller cells tend to have a higher density, a higher specific carbon contentof 3.1 × 10�13 g C/µm3 is used for bacteria (Bloem et al., 1995b).
Methodological Remarks
Clean containers and working solutions are a must for reliable results ofbacterial numbers. Controls (blank filters) should be performed routinely tocheck for bacterial contamination of staining solutions and particle-freewater used in the protocol.
A potential source of error is the subjectivity of the method, e.g. differ-ences between the operators’ judgement of what is a bacterial cell and whatis detritus, and particle or size classifications. It is important to compareindividual results and discuss criteria of cell identification in order to getconsistency between researchers. Determination of bacterial counts of rela-tively small sampling sets should be performed by one person.
The effective filter area is not the total area of the filter, but the area ofthe filter through which the soil suspension has been filtered. The effectivefilter area varies with different filtration units.
Error propagation and statistical considerations
Many working steps are involved from first sample preparation to finalresults on counts and biomass. Each of these carries a specific error thatinfluences the final result. Therefore, one of the most important questions is:how exact is the final result?
Errors are unavoidable, but they should be reduced to a minimum.Typical errors during biomass calculation (Table 6.2) are due to:
• Sample collection: this error source is not predictable. It is necessary tokeep in mind that samples and subsamples have to be representativefor the site of analysis.
• Sample preparation: weighing with lab balances (sample mass, watercontent) may cause an error of approximately 0.1% to maximally 1%.Dilutions and aliquots, handled with pipettes, can have an error ofapproximately 1%. Effective filtration or smear area can be estimatedwith a precision of c. 1% (blunt diameter).
• Image analysis: calibration of the length measurement is part of imageanalysis; its resolution is restricted to pixel size. The resulting countingfield area provides another error of approximately 2%.
Enumeration and Biovolume Determination 103

Counting and calculations
Not all objects on a filter or smear can be counted. Thus, statistical methodsneed to be used to assess the variation and statistical significance of thecounts. The first question to be answered is how many organisms need tobe counted? It is recommended to analyse at least 20 counting fields, each ofwhich should contain at least 20 objects, up to a maximum of 50. The opti-mal number of objects per counting field must be obtained by diluting theoriginal sample.
All counts per counting field must fit a Poisson distribution in order tobe summarized by a significant mean value. The test for Poisson distributioncan be performed by the chi-square test. The error of the mean is calculatedby square root of (B/n), where B is the mean count of bacteria per countingarea, and n is the total count. This mean value for the counting fields can beused to calculate a total count valid for the entire sample. It is obvious thatthe error due to the counting procedure is much greater than other errors,e.g. the effective filter area. Hence, much effort must be put into its mini-mization by aiming for great accuracy in sample preparation and data evalu-ation. Counts of bacteria are often used for determinations of biomass, usinga uniform mean cell volume or a mean carbon content per cell, or via thedetermination of a sample-specific biovolume. The first approach is a roughestimate, neglecting individual properties of the communities, and shouldbe used only when details of the community cannot be obtained.
104 M. Bölter et al.
Table 6.2. Error Propagation – example.
Typical value Typical error Relative error (%)
Sample preparationSample weight 1 g 0.001 g 0.1Water content 10 % 0.1 % 1.0Dilution 10 ml 0.1 ml 1.0Aliquot 100 µl 1 µl 1.0Diameter filter 20 mm 0.1 mm 0.5Filter area 2.9 cm2 3.0 mm2 1.0
CalibrationPixel length 0.1 µm 1 nm 1.0Counting field 2340 µm2 48 µm2 2.1
CountingObjects per counting e.g. 356/26 = 13.7field due to Poisson 0.2 1.4distribution
Error propagationMean cell volume +7.15
–6.68 %Total bacterial number +6.64 %
–6.75 %Bacterial biovolume +13.79 %
–13.90 %

The other way offers a more precise data set and provides data for com-parisons between individual communities and samples. The classical wayfor this procedure is the use of size classes of objects (Bölter et al., 1993). Theboundaries of such classes can be preset classes according to empiricalknowledge about ecologically reasonable categories, which may provide abest fit to the community from known data or the size classes, or they canbe calculated in order to obtain optimal fits, for example:
b = (xmax – xmin)/[1 + 3.32log(n)]
where: b = width of size class; xmax = maximal x value; xmin = minimal xvalue; and n = number of observations.
The use of preset size classes is recommended since comparisonsbetween numbers of objects of individual size classes can be performed.Descriptions of communities can be performed using histograms.Contents of size classes can be compared by appropriate statistical tests.The number of organisms per size class can be aggregated if individualclasses do not contain enough objects to perform such tests. It is necessaryto mention that descriptors of size histograms, e.g. mean values ormedians, need special attention in the case of open classes (e.g. all cells <0.25 µm). For such classes, only medians are allowed as descriptors (Sachs,1984; Lozan and Kausch, 1998). Extremes can be omitted by the ‘4 sigma-rule’ (Sachs, 1984).
Comparisons between total numbers or numbers per size class becomepossible by various measures, their skewness and kurtosis or other statisti-cal properties. Often, bimodal distributions or log-normal distributions canbe observed. The latter are most typical for data obtained in natural envi-ronments. They are characterized by high standard deviations or high vari-ation coefficients (Sachs, 1984). It is necessary to discriminate between rodsand cocci for size classifications.
Before further use of calculated means, etc., the distribution has to bechecked at least for symmetry. Normal distribution can be assessed by theDavid test (two-sided test, 5%) (Lozan and Kausch, 1998). As stated above,non-normal distributions are most typical for data obtained in natural envi-ronments. In this case, data have to be transformed into a normal distribu-tion first. A logarithmic transformation is mostly successful. All relevantcalculations and tests can be performed on a log-normal distribution as on anormal distribution. For further use in biomass calculations, results must beretransformed.
Estimating a maximum error of the final result
To gain a statement of the precision of the final results of mean cell volume,total bacterial number or bacterial biovolume, all individual errors have tobe considered together as they appear in the equations. Following errorpropagation, the absolute values sum up to a maximum overall error of thefinal result (Table 6.2). This can be used for worst-case scenarios. An easy
Enumeration and Biovolume Determination 105

way to evaluate maximum error is to add up the percentages of individualerrors.
Discussion
The use of direct counts and estimates of bacterial volume, biomass or otherparameters derived thereof is an important tool to understand the microbialhabitat and microbial processes. As an example, results from a site pollutedwith heavy metals are given in Fig. 6.3. At the site of a galvanizingcompany, soil samples were taken at the most polluted spot around aformer basin, and at distances of 10 m and 50 m (unpolluted control).Nickel (Ni) and chromium (Cr) contents were 2800/430, 930/1300 and< 5.0/< 10 mg/kg dry soil, respectively. In the sandy soil under grass, thefollowing characteristics were determined: pH-KCl 6.0, 5.7 and 5.9; organicmatter 3.9%, 4.5% and 2.9% (w/w); and clay 8.0%, 2.5% and 3.7%. Bacteriawere measured by image analysis in DTAF-stained soil smears (Bloem et al.,1995a,b). In the most polluted soil, bacterial number was 50% lower than inthe unpolluted control (Fig. 6.3a). The average cell volume was 30% smaller(Fig 6.3b). Thus, the bacterial biomass (calculated from number and vol-ume) was only 35% of the level in the unpolluted soil (Fig. 6.3c). The resultsof the microscopic measurements were confirmed by independent mea-sures of bacterial growth rate by thymidine incorporation (see Section 7.5,this volume) – the bacterial growth rate was greatly reduced (Fig. 6.3d).Similar levels of heavy metals in clay soil showed no significant ecologicaleffects. The bioavailability of contaminants is reduced by clay, organic mat-ter and a higher pH. Thus, actual ecological effects of contamination can bedemonstrated by measuring soil microorganisms.
This view into the ‘home’ of the organisms under evaluation, and theuse of proper descriptors, provides insights in the community structure andthus allows better and more relevant interpretations of results from bio-chemical or physiological approaches. Shifts in populations can be followedand their inherent changes become visible. This holds especially true forspeculations on the ‘active’ biomass or ‘active’ community involved inmetabolic processes. New techniques of differential staining procedures canbe applied, associated with enormous progress in digital image analysis.Nevertheless, care must be taken while interpreting individual local aspectsand projecting data from microscopic views into the full scale of theenvironment. This problem, mostly neglected, holds true not only for thismethod, but also needs to be respected in all calculations in environmentalresearch.
106 M. Bölter et al.

Normative References for Chapter 6
Enumeration and Biovolume Determination 107
Bac
teria
(10
9 /g
soil)
0
2
4
6
Cel
l vol
ume
(µm
3 )
0.0
0.1
0.2
0.3
Thy
mid
ine
inco
rpor
atio
n
a bB
acte
rial b
iom
ass
(µg
C/g
soi
l)
0
100
200
300
400
(pm
ol/g
soi
l per
h)
0
2
4
6
8
10
12c d
< 10
< 5.0
1300
930
430
2800
< 10
< 5.0
1300
930
430
2800Cr (mg/kg)
Ni (mg/kg)
Fig. 6.3. Reduced bacterial number (a), mean cell volume (b), biomass (c) and growth rate(d) in heavy metal (chromium and nickel) contaminated soil. Error bars indicate the leastsignificant difference at P = 0.05.
http://www.iso.org (accessed 27 October2004)
ISO 14240–1 (1997) Soil quality – Determi-nation of soil microbial biomass – Part 1:Substrate-induced respiration method.
ISO 14240–2 (1997) Soil quality – Determi-
nation of soil microbial biomass – Part 2:Fumigation–extraction method.
ISO 17155 (2002) Soil quality – Determi-nation of abundance and activity of soilmicroflora using respiration curves.
References for Chapter 6
Alef, K. and Nannipieri, P. (1995) Methods inApplied Soil Microbiology and Biochemistry.Academic Press, London.
Amato, M. and Ladd, J.N. (1988) Assay formicrobial biomass based on ninhydrin-reactive nitrogen in extracts of fumigatedsoils. Soil Biology and Biochemistry 20,107–114.
Anderson, J.P.E. and Domsch, K.H. (1978) Aphysiological method for the quantitativemeasurement of microbial biomass insoils. Soil Biology and Biochemistry 10,215–221.
Anderson, T.H. and Joergensen, R.G. (1997)Relationship between SIR and FE esti-mates of microbial biomass C in deciduous

forest soils at different pH. Soil Biology andBiochemistry 29, 1033–1042.
Anonymous. (1998) Bestimmung der mikro-biellen Biomasse (SubstratinduzierteRespiration; Isermeyer-Ansatz), MethodeB-BM-IS. In: Agroscope FAL (ed.)Referenzmethoden der Eidgenössischen land-wirtschaftlichen Forschungsanstalten, Vol. 2:Bodenuntersuchungen zur Standort-Charakter-isierung. Agroscope FALReckenholz, Eidgenössische Forschung-sanstalt für Agrarökologie und Landbau,Zürich-Reckenholz.
Bååth, E. (1994) Thymidine and leucineincorporation in soil bacteria with differ-ent cell size. Microbial Ecology 27, 267–278.
Babiuk, L.A. and Paul, E.A. (1970) The use offluorescein isothiocyanate in the determi-nation of the bacterial biomass of grass-land soil. Canadian Journal of Microbiology16, 57–62.
Bai, Q.Y., Zelles, L., Scheunert, I. and Korte,F. (1988) A simple effective procedure forthe determination of adenosine triphos-phate in soils. Chemosphere 17, 2461–2470.
Bakken, L.R. and Olsen, R.A. (1987) The rela-tionship between cell size and viability ofsoil bacteria. Microbial Ecology 13, 103–114.
Bank, H.L. (1988) Rapid assessment of isletviability with acridine orange and propid-ium iodide. In Vitro Cellular andDevelopmental Biology 24, 266–273.
Barajas, A.M., Grace, C., Ansorena, J.,Dendooven, L. and Brookes, P.C. (1999)Soil microbial biomass and organic C in agradient of zinc concentrations around aspoil tip mine. Soil Biology andBiochemistry 31, 867–876.
Beck, T. (1981) Untersuchungen über die tox-ische Wirkung der in Siedlungsabfällenhäufigen Schwermetalle auf dieBodenmikroflora. Zeitschrift fürPflanzenernährung und Bodenkunde 144,613–627.
Beck, T. (1984) Mikrobiologische und bio-chemische Charakterisierung land-wirtschaftlich genutzter Böden. I.Mitteilung: die Ermittlung einer boden-mikrobiologischen Kennzahl. Zeitschriftfür Pflanzenernährung und Bodenkunde 147,456–466.
Beck, T., Öhlinger, R. and Baumgarten, A.(1993) Bestimmung der Biomasse mittelsSubstrat-Induzierter Respiration (SIR). In:Schinner, F., Öhlinger, R., Kandeler, E. andMargesin, R. (eds) BodenbiologischeArbeitsmethoden. Springer Verlag, Berlin,pp. 68–72.
Beck, T., Capriel, P., Borchert, H. andBrandhuber, R. (1995) The microbial bio-mass in agricultural soils, 2nd communi-cation. The relationships betweenmicrobial biomass and chemical andphysical soil properties. AgribiologicalResearch 48, 74–82.
Blackburn, N., Hagström, A., Wikner, J.,Cuadros-Hansson, R. and Bjørnsen, P.K.(1998) Rapid determination of bacterialabundance, biovolume, morphology, andgrowth by neural network-based imageanalysis. Applied and EnvironmentalMicrobiology 64, 3246–3255.
Bloem, J. and Vos, A. (2004) Fluorescentstaining of microbes for total directcounts. In: Kowalchuk, G.A., De Bruijn,F.J., Head, I.M., Akkermans, A.D.L. andvan Elsas, J.D. (eds) Molecular MicrobialEcology Manual, 2nd edn. KluwerAcademic Publishers, Dordrecht, TheNetherlands, pp. 861–874.
Bloem, J., Van Mullem, D.K. and Bolhuis,P.R. (1992) Microscopic counting and cal-culation of species abundances and statis-tics in real time with an MS-DOS personalcomputer, applied to bacteria in soilsmears. Journal of Microbiological Methods16, 203–213.
Bloem, J., Veninga, M. and Shepherd, J.(1995a) Fully automatic determination ofsoil bacterial numbers, cell volumes andfrequencies of dividing cells by confocallaser scanning microscopy and imageanalysis. Applied and EnvironmentalMicrobiology 61, 926–936.
Bloem, J., Bolhuis, P.R., Veninga, M.R. andWieringa, J. (1995b) Microscopic methodsfor counting bacteria and fungi in soil. In:Alef, K. and Nannipieri, P. (eds) Methodsin Applied Soil Microbiology andBiochemistry. Academic Press, London,pp. 162–173.
Bölter, M. (1997) Microbial communities in
108 Microbial Biomass and Numbers

soils and on plants from King GeorgeIsland (Arctowski Station, MaritimeAntarctica). In: Battaglia, B., Valencia, J.and Walton, D.W.H. (eds) AntarcticCommunities: Species, Structure andSurvival. Cambridge University Press,Cambridge, pp. 162–169.
Bölter, M., Möller, R. and Dzomla, W. (1993)Determination of bacterial biovolumewith epifluorescence microscopy: com-parison of size distributions from imageanalysis and size classifications. Micron24, 31–40.
Bölter, M., Bloem, J., Meiners, K. and Möller,R. (2002) Enumeration and biovolumedetermination of microbial cells – amethodological review and recommenda-tions for applications in ecologicalresearch. Biology and Fertility of Soils 36,249–259.
Borneman, J. and Triplett, E.W. (1997) Rapidand direct method for extraction of RNAfrom soil. Soil Biology and Biochemistry 29,1621–1624.
Brake, M., Höper, H. and Joergensen, R.G.(1999) Land use-induced changes in activ-ity and biomass of microorganisms inraised bog peats at different depths. SoilBiology and Biochemistry 31, 1489–1497.
Bratbak, G. (1985) Bacterial biovolume andbiomass estimations. Applied andEnvironmental Microbiology 49, 1488–1493.
Bratbak, G. (1993) Microscope methods formeasuring bacterial biovolume: epifluo-rescence microscopy, scanning electronmicroscopy, and transmission electronmicroscopy. In: Kemp, P.F., Sherr, B.F.,Sherr, E.B. and Cole, J.J. (eds) Handbook ofMethods in Aquatic Microbial Ecology.Lewis Publishers, Boca Raton, Florida,pp. 309–317.
Bratbak, G. and Dundas, I. (1984) Bacterialdry matter content and biomass estima-tions. Applied and EnvironmentalMicrobiology 48, 755–757.
Brookes, P.C. and McGrath, S.P. (1984) Theeffects of metal toxicity on the soil micro-bial biomass. Journal of Soil Science 35,341–346.
Brookes, P.C., Landman, A., Pruden, G. andJenkinson, D.S. (1985) Chloroform fumi-
gation and the release of soil nitrogen: arapid direct extraction method for mea-suring microbial biomass nitrogen in soil.Soil Biology and Biochemistry 17, 837–842.
Bundt, M., Widmer, F., Pesaro, M., Zeyer, J.and Blaser, P. (2001) Preferential flowpaths: biological ‘hot spots’ in soils. SoilBiology and Biochemistry 33, 729–738.
Bürgmann, H., Pesaro, M., Widmer, F. andZeyer, J. (2001) A strategy for optimizingquality and quantity of DNA extractedfrom soil. Journal of Microbiological Methods45, 7–20.
Chander, K., Dyckmans, J., Höper, H. andJörgensen, R.G. (2001) Long-term effectson soil microbial properties of heavy met-als from industrial exhaust deposition.Journal of Plant Nutrition and Soil Science164, 657–663.
Contin, M., Todd, A. and Brookes, P.C. (2001)The ATP concentration in the soil micro-bial biomass. Soil Biology and Biochemistry33, 701–704.
Curci, M., Pizzigallo, M.D.R., Crecchio, C.,Mininni, R. and Ruggiero, P. (1997) Effectsof conventional tillage on biochemicalproperties of soils. Biology and Fertility ofSoils 25, 1–6.
Deere, D., Shen, J., Vesey, G., Bell, P.,Bissinger, P. and Veal, D. (1998) Flowcytometry and cell sorting for yeast via-bility assessment and cell selection. Yeast30, 147–160.
Dilly, O. (1999) Nitrogen and phosphorusrequirement of the microbiota in soils ofthe Bornhoeved Lake district. Plant andSoil 212, 175–183.
Domsch, K.H., Beck, T., Anderson, J.P.E.,Söderström, B., Parkinson, D. andTrolldenier, G. (1979) A comparison ofmethods for soil microbial populationand biomass studies. Zeitschrift fürPflanzenernährung und Bodenkunde 142,520–522.
Engberding, D. (1909) VergleichendeUntersuchungen über die Bakterienzahlim Ackerboden in ihrer Abhängigkeit vonäusseren Einflüssen. Centralblatt fürBakteriologie Abt II 23, 569–642.
Fagerbakke, K.M., Heldal, M. and Norland,S. (1996) Content of carbon, nitrogen, oxy-
Microbial Biomass and Numbers 109

gen, sulfur and phosphorus in nativeaquatic and cultured bacteria. AquaticMicrobial Ecology 10, 15–27.
Fließbach, A., Martens, R. and Reber, H.H.(1994) Soil microbial biomass and activityin soils treated with heavy metal contami-nated sewage sludge. Soil Biology andBiochemistry 26, 1201–1205.
Frische, T. and Höper, H. (2003) Soil micro-bial parameters and luminescent bacteriaassays as indicators for in-situ bioremedi-ation of TNT-contaminated soils.Chemosphere 50, 415–427.
Fuhrman, J.A. (1999) Marine viruses andtheir biogeochemical and ecologicaleffects. Nature 399, 541–548.
Harden, T., Joergensen, R.G., Meyer, B. andWolters, V. (1993) Soil microbial biomassestimated by fumigation–extraction andsubstrate-induced respiration in twopesticide-treated soils. Soil Biology andBiochemistry 25, 679–683.
Haughland, R.P. (ed.) (1999) Molecular Probes:Handbook of Fluorescent Probes and ResearchChemicals. Molecular Probes Inc., 7th edn,Eugene, Oregon (CD-rom edn). Availableat: http://www.probes.com (accessed 27October 2004).
Heinemeyer, O., Insam, H., Kaiser, E.-A. andWalenzik, G. (1989) Soil microbial bio-mass and respiration measurements: anautomated technique based on infraredgas analysis. Plant and Soil 116, 191–195.
Hobbie, J.E., Daley, R.J. and Jasper, S. (1977)Use of nucleopore filters for counting bac-teria by fluorescence microscopy. Appliedand Environmental Microbiology 33,1225–1228.
Höper, H. and Kleefisch, B. (2001)Untersuchung bodenbiologischerParameter im Rahmen der Boden-Dauerbeobachtung in Niedersachsen.Bodenbiologische Referenzwerte undZeitreihen. Arbeitshefte Boden 2001/4,1–94.
Jäggi, W. (1976) Die Bestimmung der CO2-Bildung als Mass der bodenbiologischenAktivität. Schweizerische landwirtschaftlicheForschung 15, 371–380.
Jenkinson, D.S. (1988) Determination ofmicrobial biomass carbon and nitrogen in
soil. In: Wilson J.R. (ed.) Advances inNitrogen Cycling in Agricultural Systems.CAB International, Wallingford, UK,pp. 368–386.
Jenkinson, D.S. and Ladd, J.N. (1981)Microbial biomass in soil: measurementand turnover. In: Paul, E.A. and Ladd,J.N. (eds) Soil Biochemistry, Vol. 5. MarcelDecker, New York, pp. 415–471.
Jenkinson, D.S. and Powlson, D.S. (1976a)The effects of biocidal treatments onmetabolism in soil – V. A method for mea-suring soil biomass. Soil Biology andBiochemistry 8, 209–213.
Jenkinson, D.S. and Powlson, D.S. (1976b)The effects of biocidal treatments onmetabolism in soil – I. Fumigation withchloroform. Soil Biology and Biochemistry 8,167–177.
Joergensen, R.G. (1996a) The fumigation–extraction method to estimate soil micro-bial biomass: calibration of the kEC value.Soil Biology and Biochemistry 28, 25–31.
Joergensen, R.G. (1996b) Quantification ofthe microbial biomass by determiningninhydrin-reactive N. Soil Biology andBiochemistry 28, 301–306.
Joergensen, R.G. and Brookes, P.C. (1990)Ninhydrin-reactive nitrogen measure-ments of microbial biomass in 0.5 MK2SO4 soil extracts. Soil Biology andBiochemistry 22, 1023–1027.
Joergensen, R.G. and Scheu, S. (1999)Response of soil microorganisms to theaddition of carbon, nitrogen and phos-phorus in a forest Rendzina. Soil Biologyand Biochemistry 31, 859–866.
Johansson, M., Pell, M. and Stenström, J.(1998) Kinetics of substrate-induced respi-ration (SIR) and denitrification: applica-tions to a soil amended with silver. Ambio27, 40–44.
Kaiser, E.-A., Mueller, T., Joergensen, R.G.,Insam, H. and Heinemeyer, O. (1992)Evaluation of methods to estimate thesoil microbial biomass and the relation-ship with soil texture and organicmatter. Soil Biology and Biochemistry, 24,675–683.
Kalembasa, S.J. and Jenkinson, D.S. (1973) Acomparative study of titrimetric and
110 Microbial Biomass and Numbers

gravimetric methods for the determina-tion of organic carbon in soil. Journal of theScience of Food and Agriculture 24,1085–1090.
Kandeler, E., Kampichler, C. and Horak, O.(1996) Influence of heavy metals on thefunctional diversity of soil microbial com-munities. Biology and Fertility of Soils 23,299–306.
Kandeler, E., Tscherko, D. and Spiegel, H.(1999) Long-term monitoring of microbialbiomass, N mineralisation and enzymeactivities of a Chernozem under differenttillage management. Biology and Fertility ofSoils 28, 343–351.
Kato, K. (1996) Image analysis of bacterialcell size and diversity. In: Colwell, R.R.,Simidu, U. and Ohwada, K. (eds)Microbial Diversity in Time and Space.Plenum Press, New York, pp. 141–147.
Kepner, R.L. and Pratt, J.R. (1994) Use of flu-orochromes for direct enumeration oftotal bacteria in environmental samples:past and present. Microbiology andMolecular Biology Reviews 58, 603–615.
Krambeck, C., Krambeck, H.-J. andOverbeck, J. (1981) Microcomputer-assisted biomass determination of plank-ton bacteria on scanning electronmicrographs. Ambio 42, 142–149.
Lin, Q. and Brookes, P.C. (1996) Comparisonof methods to measure microbial biomassin unamended, ryegrass-amended andfumigated soils. Soil Biology andBiochemistry 28, 933–939.
Lindahl, V. and Bakken, L.R. (1995)Evaluation of methods for extraction ofbacteria from soil. FEMS MicrobiologyEcology 16, 135–142.
Liu, J., Dazzo, F.B., Glagoleva, O., Yu, B. andJain, A.K. (2001) CMEIAS: a computer-aided system for the image analysis ofbacterial morphotypes in microbial com-munities. Microbial Ecology 41, 173–194.
Lozan, J.L. and Kausch, H. (1998) AngewandteStatistik für Naturwissenschaftler, 2nd edn.Parey, Berlin.
Machulla, G., Barth, N., Heilmann, H. andPälchen, W. (2001) Bodenmikro-biologische Untersuchungen an land-wirtschaftlich genutzten Boden-
Dauerbeobachtungsflächen (BDF II) inSachsen. Mitteilungen der DeutschenBodenkundlichen Gesellschaft 96, 359–360.
Macrae, A., Lucon, C.M.M., Rimmer, D.L.and O’Donnell, A.G. (2001) SamplingDNA from the rhizosphere of Brassicanapus to investigate rhizobacterial com-munity structure. Plant and Soil 233,223–230.
Mäder, P., Fließbach, A., Dubois, D., Gunst,L., Fried, P. and Niggli, U. (2002) Soil fer-tility and biodiversity in organic farmingsystems. Science 296, 1694–1697.
Marie, D., Brussard, C.P.D., Thyrhaug, R.,Bratbak, G. and Vaulot, D. (1999)Enumeration of marine viruses in cultureand natural samples by flow cytometry.Applied and Environmental Microbiology 65,45–52.
Martens, R. (2001) Estimation of ATP in soil:extraction methods and calculation ofextraction efficiency. Soil Biology andBiochemistry 33, 973–982.
May, K.R. (1965) A new graticule for particlecounting and sizing. Journal of ScientificInstruments 42, 500–501.
McFeters, G.A., Singh, A., Byun, S., Williams,S. and Callis, P.R. (1991) Acridine orangestaining reaction as an index of physio-logical activity in Escherichia coli. Journal ofMicrobiological Methods 13, 87–97.
Moore, S. (1968) Amino acid analysis:aqueous dimethyl sulfoxide as solvent forthe ninhydrin reaction. Journal of BiologicalChemistry 243, 6281–6283.
Moore, S. and Stein, W.H. (1948) Photometricninhydrin method for use in the chro-matography of amino acids. Journal ofBiological Chemistry 176, 367–388.
Morris, S.J., Zink, T., Conners, K. and Allen,M.F. (1997) Comparison between fluores-cein diacetate and differential fluorescentstaining procedures for determining fun-gal biomass in soils. Applied Soil Ecology 6,161–167.
Nagata, T., Someya, T., Konda, T.,Yamamoto, M., Morikawa, K., Fukui, M.,Kuroda, N., Takahashi, K., Oh, S.-W.,Mori, M., Araki, S. and Kato, K. (1989)Intercalibration of the acridine orangedirect count method of aquatic bacteria.
Microbial Biomass and Numbers 111

Bulletin of the Japanese Society of MicrobialEcology 4, 89–99.
Norland, S. (1993) The relationship betweenbiomass and volume of bacteria. In: Kemp,P.F., Sherr, B.F., Sherr, E.B. and Cole, J.J.(eds) Handbook of Methods in AquaticMicrobial Ecology. Lewis Publishers, BocaRaton, Florida, pp. 303–307.
Oberholzer, H.R. and Höper, H. (2001)Reference systems for the microbiologicalevaluation of soils. VDLUFA-Schriftenreihe55/II, 19–34.
Palmborg, C. and Nordgren, A. (1993) Soilrespiration curves, a method to test theabundance, activity and vitality of themicroflora in forest soils. In: Torstensson,L. (ed.) MATS Guidelines: Soil BiologicalVariables in Environmental HazardAssessment. Swedish EnvironmentalProtection Agency, Uppsala, Sweden,pp. 149–153.
Paul, E.A., Harris, D., Klug, M. and Ruess, R.(1999) The determination of microbial bio-mass. In: Robertson, G.P., Coleman, D.C.,Bledsoe, C.S. and Sollins, P. (eds) StandardSoil Methods for Long-term EcologicalResearch. Oxford University Press, NewYork, pp. 291–317.
Posch, T., Pernthaler, J., Alfreider, A. andPsenner, R. (1997) Cell-specific respiratoryactivity of aquatic bacteria studied withthe tetrazolium reduction method, cyto-clear slides and image analysis. Appliedand Environmental Microbiology 63,867–873.
Powlson, D.S. and Jenkinson, D.S. (1976) Theeffects of biocidal treatments on metabo-lism in soil. II. Gamma irradiation, auto-claving, air-drying and fumigation. SoilBiology and Biochemistry 8, 179–188.
Powlson, D.S., Brookes, P.C. andChristensen, B.T. (1987) Measurement ofsoil microbial biomass provides an earlyindication of changes in total soil organicmatter due to straw incorporation. SoilBiology and Biochemistry 19, 159–164.
Pringle, J.R., Preston, R.A., Adams, A.E.,Stearns, T., Drubin, D.G., Haarer, B.K. andJones, E.W. (1989) Fluorescencemicroscopy methods for yeasts. Methodsin Cell Biology 31, 357–435.
Rampazzo, N. and Mentler, A. (2001)Influence of different agricultural landuse on soil properties along theAustrian–Hungarian border. Bodenkultur52(2), 89–115.
Ross, D.J., Tate, K.R., Cairns, A. and Meyrick,K.F. (1980) Influence of storage on soilmicrobial biomass estimated by three bio-chemical procedures. Soil Biology andBiochemistry 12, 369–374.
Sachs, L. (1984) Angewandte Statistik, 6th edn.Springer-Verlag, Berlin.
Sharma, D.K. and Prasad, D.N. (1992) Rapididentification of viable bacterial sporesusing a fluorescence method. Biotechnicand Histochemistry 67, 27–29.
Stenberg, B., Johansson, M., Pell, M., Sjödahl-Svensson, K., Stenström, J. andTorstensson, L. (1998) Microbial biomassand activities in soils as affected by frozenand cold strorage. Soil Biology andBiochemistry 30, 393–402.
Strugger, S. (1949) Fluoreszenzmikroskopie undMikrobiologie. Verlag Schaper, Hanover,Germany.
Suzuki, M.T., Sherr, E.B. and Sherr, B.F. (1993)DAPI direct counting underestimates bac-terial abundances and average cell sizecompared to AO direct counting. Limnologyand Oceanography 38, 1566–1570.
Taylor, J.P., Wilson, B., Mills, M.S. and Burns,R.G. (2002) Comparison of microbial num-bers and enzymatic activities in surfacesoils and subsoils using various techniques.Soil Biology and Biochemistry 34, 387–401.
Torsvik, V., Sørheim, R. and Goksøyr, J.(1996) Total bacterial diversity in soil andsediment communities – a review. Journalof Industrial Microbiology 17, 170–178.
Traganos, F., Darzynkiewicz, Z., Sharpless, T.and Melamed, M.R. (1977) Simultaneousstaining of ribonucleic and deoxyribonu-cleic acids in unfixed cells using acridineorange in a flow cytofluorometric system.Journal of Histochemistry and Cytochemistry25, 46–56.
Trolldenier, G. (1973) The use of fluorescencemicroscopy for counting soil microorgan-isms. In: Rosswall, T. (ed.) ModernMethods in the Study of Microbial Ecology.Bull Ecol Res Comm (Stockholm) 17, 53–59.
112 Microbial Biomass and Numbers

Troussellier, M., Bouvy, M., Courties, C. andDupuy, C. (1997) Variation of carbon con-tent among bacterial species under starva-tion condition. Aquatic Microbial Ecology13, 113–119.
Turley, C.M. and Hughes, D.J. (1994) The effectof storage temperature on the enumerationof epifluorescence-detectable bacterial cellsin preserved sea-water samples. Journal ofthe Marine Biological Association of the UnitedKingdom 74, 259–262.
Van Veen, J.A. and Paul, E.A. (1979)Conversion of biovolume measurementsof soil organisms, grown under variousmoisture tensions, to biomass and theirnutrient content. Applied andEnvironmental Microbiology 37, 686–692.
Vance, E.D., Brookes, P.C. and Jenkinson,D.S. (1987) An extraction method for mea-suring soil microbial C. Soil Biology andBiochemistry 19, 703–707.
West, A.W., Ross, D.J. and Cowling, J.C.(1986) Changes in microbial C, N, P, andATP contents, numbers and respiration onstorage of soil. Soil Biology andBiochemistry 18, 141–148.
West, A.W., Sparling, G.P. and Grant, W.D.(1987) Relationships between mycelialand bacterial populations in stored, air-dried and glucose-amended arable andgrassland soils. Soil Biology andBiochemistry 19, 599–605.
Wilke, B.M. (1988) Long term effects of inor-ganic pollutants on the microbial activityof a sandy Cambisol. Zeitschrift fürPflanzenernährung und Bodenkunde 151,131–136.
Wilke, B.M. and Winkel, B. (2000) Einsatzmikrobiologischer Methoden in derBewertung sanierter Böden und in derÖkotoxikologie. VDLUFA-Schriftenreihe55/II, 35–46.
Winkel, B. and Wilke, B.M. (1997) Wirkungvon TNT (2,4,6-Trinitrotoluol) aufBodenatmung und Nitrifikation.Mitteilungen der Deutschen Bodenkund-lichen Gesellschaft 85, 631–634.
Wu, J., Joergensen, R.G., Pommerening, B.,Chaussod, R. and Brookes, P.C. (1990)Measurement of soil microbial biomass C– an automated procedure. Soil Biologyand Biochemistry 22, 1167–1169.
Wynn-Williams, D.D. (1985) Photofadingretardant for epifluorescence microscopyin soil micro-ecological studies. SoilBiology and Biochemistry 17, 739–746.
Zelles, L. (1999) Fatty acid patterns of phos-pholipids and lipopolysaccharides in thecharacterisation of microbial communitiesin soil: a review. Biology and Fertility ofSoils 29, 111–129.
Zimmermann, R. (1975) Entwicklung undAnwendung von fluoreszenz- undrastere lektronen-mikroskopischenMethoden zur Ermittlung derBakterienmenge in Wasserproben. PhDthesis, Universität Kiel, Kiel, Germany.
Zimmermann, R. (1977) Estimation of bacter-ial number and biomass by epifluores-cence microscopy and scanning electronmicroscopy. In: Rheinheimer, G. (ed.)Microbial Ecology of a Brackish WaterEcosystem. Springer, Heidelberg, Germany,pp. 103–120.
Microbial Biomass and Numbers 113
7 Soil Microbial Activity
7.1 Estimating Soil Microbial Activity
OLIVER DILLY
Lehrstuhl für Bodenökologie, Technische Universität München,D-85764 Neuherberg and Okologie-Zentrum, Universität Kiel,Schauenburgerstraße 112, D-24118 Kiel, Germany; Presentaddress: Lehrstuhl für Bodenschutz und Rekultivierung,Brandenburgische Technische Universität, Postfach 101344,D-03013 Cottbus, Germany
Why and How to Estimate Soil Microbial Activity
Microbial communities in soil consist of a great diversity of species explor-ing their habitats by adjusting population abundance and activity rates toenvironmental factors. Soil microbial activities lead to the liberation ofnutrients available for plants, and are of crucial importance in biogeochemi-cal cycling. Furthermore, microorganisms degrade pollutants and xenobi-otics, and are important in stabilizing soil structure and conserving organicmatter for sustainable agriculture and environmental quality. Microbialactivities are regulated by nutritional conditions, temperature and wateravailability. Other important factors affecting microbial activities are protonconcentrations and oxygen supply.
To estimate soil microbial activity, two groups of microbiologicalapproaches can be distinguished. First, experiments in the field that oftenrequire long periods of incubation (e.g. Hatch et al., 1991; Alves et al., 1993)before significant changes of product concentrations are detected, e.g. 4–8weeks for the estimation of net N mineralization. In this case, variations ofsoil conditions during the experiment are inevitable, e.g. aeration and site-specific temperature, and may influence the results (Madsen, 1996).Secondly, short-term laboratory procedures, which are usually carried outwith sieved samples at standardized temperature, water content andpH value. Short-term designs of 2–5 h minimize changes in community
©CAB International 2006. Microbiological Methods for Assessing Soil Quality114 (eds J. Bloem et al.)

structure during the experiments (Brock and Madigan, 1991). Such micro-bial activity measurements include enzymatic assays that catalyse sub-strate-specific transformations and may be helpful to ascertain effects of soilmanagement, land use and specific environmental conditions (Burns, 1978).
Laboratory methods have the advantage of standardizing environmen-tal factors and, thus, allowing the comparison of soils from different geo-graphical locations and environmental conditions, and also data fromdifferent laboratories. In contrast, approaches in the field are consideredadvantageous for integrating site-specific environmental factors, such astemperature, water and oxygen availability and the microbial interactionswith plants and animals. Besides net N mineralization measurements,decomposition experiments with litterbags are frequently used. Litterbagsof approximately 20 × 20 cm length and width, with 2–5 mm mesh size arefilled with site-specific litter (e.g. 10 g dry material) or cellulose (e.g. filterpaper) with or without additional N, distributed in the investigated soiland sampled throughout the year to determine remaining mass, physical,chemical and biological characteristics (Dilly and Munch, 1996). Litterbagstudies with smaller mesh size are used when estimating the participationof meso- and macrofauna. However, suppressive and stimulating effects ofthe fauna on the soil microbiota are not considered in such studies(Mamilov et al., 2001). Finally, soil respiration determined in the field suffersfrom separating the activity of microorganisms and other organisms, suchas animals and plants, which vary significantly in different systems andthroughout the season (Dilly et al., 2000).
The group of methods on soil microbial activities embraces biochemicalprocedures revealing information on metabolic processes of microbial com-munities. They are frequently used to gain information on ‘functionalgroups’. However, laboratory results refer to microbial capabilities, as theyare determined under optimal conditions of one or more factors, such astemperature, water availability and/or substrate. These activities have com-mon units: 1/h, 1/day or 1/year.
Here, six methods have been selected for the estimatation of soil micro-bial activity. Two methods (Section 7.2 ‘Soil Respiration’ and Section 7.3‘Soil Nitrogen Mineralization’) refer to C and N cycling, respectively, andno substrate is added. Section 7.4 ‘Nitrification in Soil’ and Section 7.5‘Thymidine and Leucine Incorporation to Assess Bacterial Growth Rate’ fol-low the transformation after addition of substrate and tracer, respectively.‘Nitrification in soil’ can also be estimated without substrate (ammonium)addition. Occasionally, assays without substrate addition are identified as‘actual activity’ and those with substrate addition ‘potential activity’.However, this classification is critical and confusing, since actual activityshould refer to activity under the natural environmental conditions and theresponse to, for example, changing temperature (Q10 values) and site-specific water supply. The in situ method described in Section 7.6 ‘N2OEmissions and Denitrification from Soil’ considers specific pathways of thenitrogen cycle and estimates levels of one of the most important radiativelyactive trace gases in the atmosphere, contributing to at least 5% of observed
Estimating Soil Microbial Activity 115
global warming (Myhre et al., 1998). Enzyme activities in soil are responsi-ble for the flux of carbon, nitrogen and other essential elements in biogeo-chemical cycles. Measuring ‘Enzyme Activity Profiles’ (Section 7.7), andunderstanding the factors that regulate enzyme expression and the rates ofsubstrate turnover, are the first stages in characterizing soil metabolicpotential, fertility and quality. The highly abundant and diverse microor-ganisms in soil have high metabolic potentials. Generally, soil microorgan-isms are growth limited and, thus, may poorly exploit their capabilities.Combining measurements with reference to both carbon and nitrogencycling may give information concerning the microbial adjustment to nutri-tional conditions. Microbial activities related to microbial biomass are usedfor evaluating environmental conditions, for example the metabolic quo-tient, which is the ratio between CO2 production and microbial C content(Anderson and Domsch, 1993). Finally, soil microbial activities of C and Ncycles should be related to soil C and N stocks, providing information con-cerning transformation intensity in labile pools by looking at substratetransformation and product formation.
116 O. Dilly

7.2 Soil Respiration
MIKAEL PELL, JOHN STENSTRÖM AND ULF GRANHALL
Department of Microbiology, Swedish University of AgriculturalSciences, Box 7025, SE-750 07, Uppsala, Sweden
Introduction: Definition of, and Objectives for, Measuring SoilRespiration
Respiration is probably the process most closely associated with life. It isthe aerobic or anaerobic energy-yielding process whereby reduced organicor inorganic compounds in the cell serve as primary electron donors andimported oxidized compounds serve as terminal electron acceptors. Duringthe respiration process, the energy-containing compound falls down aredox ladder, commonly consisting of glycolysis, the citric acid cycle (CAC)and, finally, the electron transport chain.
In a less strict sense, respiration can be defined as the uptake of oxygenwhile, at the same time, carbon dioxide is released. However, in the soilecosystem CO2 is also formed by other processes, such as fermentation andabiotic processes, e.g. CO2 release from carbonate. In addition, several typesof anaerobic respiration can take place where, for example, NO3
– or SO42–
are used by microorganisms as electron acceptors; hence, O2 is then not con-sumed as in aerobic respiration. Thus, when CO2 or O2 are used as indicesof respiration, they actually represent carbon mineralization or aerobic res-piration, respectively.
Basal respiration (BAS) is the steady rate of respiration in soil, whichoriginates from the turnover of organic matter (predominantly native car-bon). The rate of BAS reflects both the amount and the quality of the carbonsource. BAS may therefore constitute an integrated index of the potential ofthe soil biota to degrade both indigenous and antropogenically introducedorganic substances under given environmental conditions. In the following,respiration, and measurements thereof, refer to BAS unless otherwisestated.
Soil respiration is a key process for carbon flux to the atmosphere. Soilwater content, oxygen concentration and the bioavailability of carbon arethe main factors that regulate soil respiration. Perhaps the most importantregulator is water, since it will dissolve organic carbon as well as oxygenand, by diffusion, control the access rate of these substances to the cell.Hence, water facilitates the availability of organic carbon and energy, while,at the same time, it restricts access to oxygen. Moreover, water will delaythe exchange of CO2 between the soil surface and the atmosphere. The dif-fusion constraints often obstruct the interpretation of the results in terms of
© CAB International 2006. Microbiological Methods for Assessing Soil Quality(eds J. Bloem et al.) 117

enzyme kinetics. The optimal water content in soil for respiration is thoughtto be 50–70% of the soil’s water-holding capacity (Orchard and Cook, 1983).
Soil respiration is attributed to a wide range of microorganisms, such asfungi, bacteria, protozoa and algae. Moreover, the soil fauna contributes sig-nificantly. Generally, the microbial contribution to the total release of CO2(excluding root respiration) is thought to be about 90%, compared to 10%released by the fauna (Paustian et al., 1990). Although fungal biomass oftendominates microbial biomass (Hansson et al., 1990; Bardgett and McAlister,1999) the relation fungi:bacteria with respect to respiration may vary con-siderably, due to, for example, type of ecosystem or soil management(Persson et al., 1980). To complete the picture, plant roots also contributebetween 12% and 30% to the total release of CO2 through respiration in thefield (Buyanovsky et al., 1987; Steen, 1990).
When the carbon mineralization capacity is estimated by means of soilrespiration, it is important to consider that the soil may act as a sink forCO2. Both chemolithotrophic bacteria and phototrophic bacteria and plantsfix CO2 into their biomass. Also, different volumes of O2 are needed for themineralization of specific amounts of various carbon sources, i.e. the respi-ration quotient (RQ) is seldom the often-assumed quotient of 1. Dilly (2001)reported that RQ values for BAS in various soil ecosystems are frequently< 1. Moreover, if the oxygen content of the soil is lowered, mineralizationcan occur through anaerobic respiration or fermentation, meaning that CO2is released without O2 being consumed.
Principle of Measurements
Methods can be divided into those intended for measuring respiration: (i)in the field; and (ii) in the laboratory.
Measurement of soil respiration in the field is usually accomplished bycovering a specific soil surface with a gas-tight chamber. During incubationfor a specific time, under ambient climate conditions, changes in gas com-position (CO2 or O2) are monitored. Alternatively, soil probes can be pushedinto the soil and gases withdrawn from a desired depth. Field measure-ments are the only way to assess the general microbial activity under nat-ural conditions. Hence, field methods give the sum of respiration of allorganisms (including roots) under conditions that can seldom be controlledby the investigator and therefore often result in large spatial and temporalvariations in gas fluxes.
One way to simplify and standardize the work is to sample a largenumber of intact soil cores and bring them to the laboratory for incubationunder constant temperature and/or moisture content. Establishment of atemperature–response curve can partly transform the results into thoseencountered under field conditions. However, the pore volume of the soilcore is probably reduced by the sampling procedure, and the incubationvessel will generate ‘wall effects’, resulting in altered gas fluxes in a coreincubation device.
118 M. Pell et al.

Laboratory-based techniques, although usually having less resemblanceto natural soil conditions, are easier to handle. Besides allowing the mea-surement of the basal soil respiration under standardized conditions, suchtechniques also permit well-designed and controlled experiments to be per-formed, addressing specific questions (Torstensson and Stenström, 1986).Substrates containing inorganic N and P can be added to eliminate limitingfactors other than the carbon source, thereby enabling measurement of theenzymatic capacity to mineralize the intrinsic organic material or someadded organic test compound.
In all laboratory-based techniques, proper sample treatment and stor-age are essential for accurate results. Besides the recommendations given inISO 10381–6 (1993), the soil samples should be transported from the field tothe laboratory as quickly as possible (within hours), or be stored in refriger-ated containers. At the laboratory, the moist samples should be sievedthrough a screen with 2–5 mm mesh width. Sometimes the soil must bepartially dried, at a constant temperature of +2°C to +4°C, before sieving ispossible. Soils from northern countries (Scandinavia), at least, can be storedat –20°C for up to 12 months without affecting the activity (Stenberg et al.,1998a). Before performing an analysis of respiration, the soil should be pre-incubated for at least 1 week, to allow the initial carbon flush to diminish.When handling a soil, it is important to know that all kinds of soil distur-bances, such as agitation and cycles of drying–wetting and freezing–thaw-ing, will result in bursts of CO2.
Whether measurements of soil respiration are based on the analyses ofconsumption of O2 or the production of CO2, two methods could be used(Table 7.1).
1. Static methods, where the gases are collected within a closed incubationsystem containing the soil, or an incubation chamber placed over the soilsurface.2. Dynamic systems, where CO2-free air flows continuously through theincubation system and the gas composition is analysed at the outlet.
More complete lists of principles and examples of performances can befound in Stotzky (1965), Anderson (1982), Bringmark and Bringmark (1993),Zibilske (1994), Alef (1995) and Öhlinger et al. (1996). International stan-dards for tests of soil quality by respiration are suggested in ISO 16072(2001) and ISO 17155 (2001).
We have chosen to focus on two static methods, both suitable for rou-tine measurements of large numbers of soil samples. Both methods can beused in agricultural soils (Hadas et al., 1998; Yakovchenko et al., 1998; Goyalet al., 1999; Svensson, 1999; Stenström et al., 2001) as well as the mor layer offorest soils (Palmborg and Nordgren, 1993; Bringmark and Bringmark,2001a,b).
The first method, ‘Basal respiration by titration’, is simple and can beperformed by most soil laboratories. The method can be modified easily fordetermination of biomass or degradation capacity of organic 14C com-pounds. Several variations of this old method exist and the method
Soil Respiration 119

described below, based on experience from our lab, is a modification ofmethods described by Bringmark and Bringmark (1993), Zibilske (1994) andÖhlinger et al. (1996).
The second method, ‘Basal respiration, substrate-responsive soil micro-bial biomass, and its active and dormant part’, requires special equipment,but is ideal for detailed studies of kinetics and soil microbial subpopula-tions. This method quantifies:
1. The basal respiration rate (BAS); 2. The substrate-induced respiration rate (SIR); and 3. The distribution between active (r) and dormant (K) microorganisms inthe substrate-responsive biomass.
Computerized equipment that allows frequent and automated mea-surement and storage of data on CO2 production is needed. The method isbased on experience from our laboratory and has been used to study thekinetics of the reversible r K transition (Stenström et al., 2001) and howthe biomass and the r/K distribution are affected by the concentration andcontact time of silver in the soil (Johansson et al., 1998), and by the soilwater content and the antibiotic cycloheximide (Stenström et al., 1998).
Basal Respiration by Titration
Principles of the method
Carbon dioxide produced from soil is trapped in a sodium hydroxidesolution according to the formula:
CO2 + 2NaOH Na2CO3 + H2O
As long as the alkaline solution contains a large excess of OH–, the chemicalreaction is forced to the right as CO2 is dissolved. At the end of the incubationthe non-consumed OH– is titrated with an acid, e.g. hydrochloric acid (HCl).
→
↔
120 M. Pell et al.
Table 7.1. Determination of CO2 and O2 in static and dynamic set-ups for the measurementof soil respiration.
Gas Sample Principle
CO2 Absorption in alkali Gain of weightTitration of remaining OH�
Decrease in conductivityCO2 Headspace concentration IR absorption
Gas chromatographyO2 Headspace concentration Gas chromatography
ElectrodeChange in partial pressure or gas volume(only static system)
IR, infrared.

Materials and apparatus
• Standard laboratory equipment• The incubation vessel should have a wide opening and hold at least
500 ml. The vessel should be sealable in a rapid and reliable manner.Glass jars for food preserving with a rubber gasket and metal mountare suitable
• Small plastic cups, one (50 ml) with a perforated lid to hold the soilsample and the other (e.g. a scintillation vial) to hold the NaOHsolution
• Burette, magnetic stirrer and magnetic stirring bar (4 × 14 mm)
Auto-titration equipment will assist the analysis; for example, in our labthis includes:
• Autoburette ABU 80• Titrator TTT 60• Standard pH meter PHM82• Combined pH electrode E16M306
(supplied by Radiometer, Copenhagen, Denmark).
Chemicals and solutions
• Freshly prepared sodium hydroxide (NaOH) solutions (1 M and 0.1 M)• Diluted hydrochloric acid (HCl) solution (0.05 M)• Barium chloride (BaCl2) solution (0.05 M)• Autoburette or phenolphthalein indicator solution (0.1 g/100 ml 60%
(v/v) ethanol)
All chemicals should be prepared using CO2-free distilled water. Boil thewater and, after some cooling, close the flasks with stoppers. Concentratesfor preparation of 0.1 M NaOH and 0.05 M HCl can be bought from com-mercial manufacturers. The concentrations of NaOH should be adjustedaccording to the rate of BAS and duration of incubation.
Procedure
• 40 g of soil with a water-holding capacity (WHC) of 50–70% is weighedout into a plastic cup. Close the perforated lid and place the sample in ahumid place at constant room temperature (see below).
• Pre-incubate for 10 days to let the initial flush of CO2 cease. During thepre-incubation, loss of water from the soil must be compensated for.
• Alternatively, fill a scintillation vial with 2 ml 1 M NaOH and place theopened sample cup and scintillation vial in the incubation vessel on afilter paper moistened with CO2-free water. Close the vessel and pre-incubate for 10 days at constant room temperature of 22°C.
Soil Respiration 121

• At the start of the basal respiration measurement, open the incubationvessel and replace the scintillation vial with a new vial with 2 ml offresh 0.1 M NaOH. Make sure that the filter paper is moistened. Closethe vessel and incubate for 24 h at 22°C.
• Remove the absorption cup and add 4 ml 0.05 M BaCl2 to precipitatecarbonate as BaCO3. Titrate the remaining OH– to a pH of 8.30 with0.1 M HCl, using an autoburette; or add three to four drops of phenol-phthalein and titrate with 0.05 M HCl to the endpoint of the indicator.
• If respiration measurements are to be continued, repeat the BAS mea-surement and titration steps above until the study period is finished. Atleast triplicate samples should be measured. Three incubation vesselswithout soil should be used as blanks.
• Dispensers for dosing NaOH will increase the start-up speed. A highdegree of neutralization of the OH– solution by CO2 will result in lessreliable results and should therefore be avoided. Continuous incubationfor several days can be achieved if additional vials with NaOH areplaced in the incubation vial.
• After establishment of the basal respiration, SIR could be determinedafter the addition of a SIR substrate containing glucose (Alvarez andAlvarez, 2000; Section 6.3, this volume).
• The degradation capacity of a 14C-labelled substance can be determinedby amending the soil with this substance (Torstensson and Stenström,1986). A second scintillation vial with NaOH is then placed into theincubation vessel. After incubation, this vial is analysed for labelled[14C]CO2 using a liquid scintillation counter. Soil without added sub-stance is used as a control.
Calculations
The basal respiration rate (BAS) in units of µg CO2-C/g DW per hour can becalculated from the formula:
(7.1)
where MC is the molar weight of carbon (Mw = 12.01); Vb and Vs the vol-ume, in ml, of 0.05 M HCl consumed in the titration of the blanks (mean ofthree replicates) and the sample, respectively; Sdw is gram dry weight ofsoil; and t is the incubation time in hours. Since two OH– are consumed perCO2 precipitated, a factor of 2 must be included in the formula. If otherconcentrations of HCl are used, the formula must be adjusted.
Discussion
Due to the many and diverse groups of respiring microorganisms in soil,even a small change in basal activity must be considered as a serious effect.
BAS b s=× −( ) ×
× ××
M V V
S tC
dw
0 05
2103
.
122 M. Pell et al.

Soil respiration is therefore a major component of the soil quality concept(cf. ISO TC 190) and is included in monitoring programmes to assess soilquality (Torstensson et al., 1998), as well as responses to various natural oranthropogenic-induced influences (Brookes, 1995; Franzluebbers et al., 1995;Pankhurst et al., 1995; Yakovchenko et al., 1996; Stenberg et al., 1998b;Benedetti, 2001; Svensson and Pell, 2001).
With regard to soil quality, standard microbial respiration (CO2evolved) is included as one of only two indicators suggested for assessing‘soil life and soil biodiversity’ (Benedetti, 2001). It is also included in theISO TC 190 ‘Soil Quality’ parameters necessary to consider regarding soilrestoration. Differences between temperate and tropical soils concerning theenergy content of their organic matter pool have also been studied by COSTmembers using basal respiration (Grisi et al., 1998). The energetic efficiencyof the microbial communities using respiration quotients has been dis-cussed largely by Dilly and co-workers (Dilly, 2001).
Besides being a generally accepted measure of total soil organism activ-ity, basal respiration may, with certain modifications, give additional infor-mation regarding environmental impact. For example, small increases inbasal respiration that follow small additions of easily metabolizable C com-pounds can be used to study the resulting priming effects on overall C-min-eralization (Anderson and Domsch, 1978; Dalenberg and Jager, 1981, 1989;Falchini et al., 2001). Secondly, microbial-specific respiration (an indicator ofstress) has been used particularly for monitoring metal-contaminated soils(Brookes and McGrath, 1984; Chander and Brookes, 1991; Bringmark andBringmark, 2001a,b; Pasqual et al., 2001).
Basal Respiration, Substrate-responsive Microbial Biomass andits Active and Dormant Part
Principles of the method
Carbon dioxide produced from soil in a closed vessel is trapped in a potas-sium hydroxide solution. This results in a proportional decrease in its elec-trical conductivity, which is measured with platinum electrodes in eachincubation vessel.
Apparatus and materials
The Respicond respirometer (Nordgren Innovations AB, Umeå, Sweden) isfully computerized and suitable for the measurement of 96 samples at 30-min intervals. Since the conductometric measurements are very tempera-ture sensitive, the respirometer should be installed in a room at constanttemperature (22 ± 0.02°C).
Soil Respiration 123

Chemicals and solutions
• Potassium hydroxide (KOH) solution (0.2 M), prepared using CO2-free(boiled) water
• C:N:P substrate: a mixture of 7.5 g glucose, 1.13 g NH4(SO4)2 and 0.35 gKH2PO4 is thoroughly ground and mixed in a mortar and thereaftermixed into 10 g of talcum powder. This substrate can be stored at roomtemperature
Procedure
• 10 ml of the 0.2 M KOH solution is added to the conductometric cup ofthe incubation vessel.
• Portions of 20 g (dry weight) of soil, with moisture content of 60%WHC, are weighed into the 250 ml incubation vessels. The vessels areclosed and installed in the water bath.
• The programme is started with measurements of accumulated CO2twice every hour for each vessel.
• Include at least three vessels without soil in the measurement.• When the initial flush of CO2 has ceased, continue the measurement for
two more days.• Replace the KOH solution in the cup of each vessel with 10 ml of a new
solution if more than 10% of the KOH has been consumed in any vessel(i.e. if more than 4.4 mg of CO2 has been produced).
• Thoroughly mix 0.19 g of the substrate into each soil sample. Record thetime at which the substrate is added to each vessel. Continue the mea-surements until the maximum respiration rate has been obtained in allsoil samples.
Calculations
Export data on CO2 accumulation and rate of CO2 production to a spread-sheet program.
Transform the CO2 data (in mg) to CO2-C (in µg)/g dry weight (DW) ofsoil per hour by multiplying each value by 0.2728 × 1000/DW = 13.64.
Due to the disturbance in temperature obtained during addition of thesubstrate, some initial erratic data have to be removed from the data set(Fig. 7.1). Data belonging to this disturbed period are identified by plottingthe rate data for the empty vessels against t.
Calculate the basal respiration rate (BAS), i.e. the slope by linearregression of accumulated CO2 data against t for the 48 h before substrateaddition.
Upon addition of a saturating amount of glucose to a soil sample, activeand dormant microorganisms in the soil behave differently. The active
124 M. Pell et al.

organisms (r) immediately start to grow exponentially, while the dormantones (K) respond by initiating a constant production rate of CO2 (Stenströmet al., 2001). Thus,
(7.2)
where dp/dt is the total rate of CO2 formation and µ is the specific growthrate of active organisms. The accumulated amount of CO2 is obtained byintegrating Eq. (7.2):
(7.3)
where p0 is a fitting parameter that accounts for the initial conductivity ofthe KOH solution of each jar at the time of addition of the substrate. TheSIR rate (Fig. 7.1) is defined as the respiration rate obtained instantaneouslyon the addition of the substrate. Thus,
(7.4)
which is obtained by solving Eq. (7.2) for t = 0. The value of SIR obtainedcan be converted to biomass as discussed by Höper (Section 6.3, this vol-ume). Numerical parameter values of Eq. (7.3) are obtained by non-linearregression of accumulated data that belong to the period during whichgrowth is exponential and K is constant. This period is identified as the timefrom substrate addition until data plotted according to ln(dp/dt) against tstart to fall below the straight line so obtained.
SIR = +r K
p pr
Kt= + −( ) +0 1�
eµt
dpdt
r Kt= +eµ
Soil Respiration 125
Time (h)
–20 –10 0 10 20 30
)
0
10
20
30
BAS
SIRt = 0 = r + K
Total respiration rate = r*eµt + K
Kr r*eµt
Res
pira
tion
rate
(µg
CO
2-C
/g s
oil p
er h
)
Fig. 7.1. Respiration curve divided into the two phases, basal respiration (BAS) obtainedbefore substrate addition, and the total respiration rate after substrate addition. Substrate-induced respiration (SIR) is the sum of respiration rate of active (r) and dormant (K) soilmicroorganisms triggered by substrate addition at t = 0.

Discussion
This method refers directly to the objectives of the COST Action 831, asfollows:
• to improve the effectiveness of microbial and molecular methods so toimprove monitoring, conservation and remediation of soil;
• to use new microbial parameters as better indicators of environmentalimpact;
• to help early detection of any fertility decline of natural ecosystems bythe setting up of efficient and rapid methods of soil pollution diagnosis.
The arguments for use of this method are:
• Standardized (basal) respiration measurements are relatively insensi-tive means for monitoring environmental impact or soil health(Brookes, 1995).
• Microbial and respiratory quotients may be more useful to determinetrends with time and to compare soils than measurements of basal orsubstrate-induced respiration only; but if the quality of the carbon sub-strates differs greatly, or if soils are of different types, the interpretationof such quotients becomes very difficult (Sparling, 1997; Granhall,1999).
• The method described here, being more sensitive and accurate, couldhelp in the early detection of soil pollution and its following remedia-tion, as it describes the basic respiration rate, the total glucose-respon-sive biomass, and the sizes of the active (r) and the dormant (K)microbial populations.
126 M. Pell et al.
7.3 Soil Nitrogen Mineralization
STEFANO CANALI AND ANNA BENEDETTI
Consiglio per la ricerca e la sperimentazione in Agricoltura,Istituto Sperimentale per la Nutrizione delle Piante, Via dellaNavicella, 2, 00184 Rome, Italy
Introduction
The process of nitrogen (N) mineralization in the soil can be defined as theconversion of organic N into mineral forms available to plants, which takesplace through the biochemical transformation mediated by microorganisms(Stevenson, 1985).
The first step (ammonification) involves the conversion of organic Ninto NH4
+ and is performed exclusively by heterotrophic microorganisms,able to operate in both aerobic and anaerobic conditions. The second step(conversion of NH4
+ into NO3–), defined as nitrification, occurs mainly
through the activity of two groups of autotrophic aerobic bacteria:Nitrosomonas (from NH4
+ into NO2–) and Nitrobacter (from NO2
– into NO3–).
In cultivated, well-aerated soils, nitrate is the predominant available min-eral form of the element. On the other hand, if low O2 concentrations arepresent in the soil (i.e. waterlogged conditions), NH4
+ accumulates(Stevenson, 1985).
Nearly always, the mineralization process is accompanied by theimmobilization of N, due to the activities of the soil living biomass and,since the two gross processes take place simultaneously, the increase ofmineral N concentration at a defined time indicates the net mineralization(Powlson and Barraclough, 1993).
The possible use of soil N mineralization as an index of soil quality isrelevant because of the relation of this process with the capacity of the soilto supply N for crop growth, and also because of the risk of water andatmospheric pollution. Thus, N mineralization is often included in minimumdata sets set up to evaluate the capacity of a soil to operate within theboundaries of the ecosystem: to promote biological productivity, to main-tain environmental quality and to safeguard the health of plants and ani-mals (Doran and Parkin, 1994).
The mineralization process is driven by factors able to influence themicrobial activity in the soil. The most relevant factors are soil temperature,moisture, pH, O2 concentration, energy and other nutritive elements avail-able for the accumulation of produced mineral N in the system. If, duringthe N mineralization measurement, these factors are not controlled, the val-ues may vary within the range and the measurements are performed under‘current conditions’. On the other hand, if one (or more) factor that drives
© CAB International 2006. Microbiological Methods for Assessing Soil Quality(eds J. Bloem et al.) 127

the microbial mineralization process is controlled and set at its optimalvalue, the measurements are carried out under ‘potential conditions’– theseare used in laboratory incubation methods.
According to the considerations outlined above, methods for the evalu-ation of N mineralization in the soil can be divided into those for the evalu-ation of the gross or the net mineralization activity, and these proceduresare classified into two groups: methods for measuring the actual mineral-ization (field condition) and methods for the evaluation of potential miner-alization. The aim of this section is to review the most widespread methodsused to measure N mineralization in agricultural soils, describing proce-dures and discussing the advantages and limitations of their application.
Methods for measuring the actual mineralization activity (field conditions)
Net mineralization measurements
Net nitrogen mineralization can be evaluated by the application of the Nbalance equation to a defined soil–plant system (Powlson and Barraclough,1993):
M = ∆NH4+ + ∆NO3
– + ∆Plant + loss
where ∆NH4+ and ∆NO3
– represent the differences of ammonia and nitrateconcentrations at the end and at the beginning of a defined period of time.‘∆Plant’ is the amount of nitrogen uptake by the crop and ‘loss’ is the Nleaving the system via leaching and gaseous emission (ammonia volatiliza-tion, denitrification and nitrogen oxide evolution during the nitrification) inthe same period.
Although direct measurement of N uptake by annual herbaceous cropsis relatively easy, great difficulties arise in the case of perennial tree crops(e.g. fruit crops). In any case, it is probably true that the most importantlimitation of this procedure is that the measurement of losses under fieldconditions is an extremely difficult task and, for this reason, the nitrogenbalance is often applied without taking into account all the losses in thesystem in question, which means that the results obtained are not accurate.
An indirect approach to the evaluation of the net rate of N mineraliza-tion by applying the N balance consists of the use of some soil contents thatprevent the N uptake on the part of the plant and reduce the losses in thesystem (Hart et al., 1994). These methods employ closed-top solid cylindersor buried bags, carried out in intact soil cores to reduce soil disturbances.
The main advantage of this procedure is that, even when it is per-formed in a simplified way (no account for crop uptake and losses), it sup-plies a rough indication of the actual net mineralization, which is useful forthe evaluation of the impact of the process on field conditions in themedium or long term.
128 S. Canali and A. Benedetti

Gross mineralization measurements: the isotopic dilution technique
Techniques using 15N label and employing the pool dilution principle arebased on the measurement of the change in 15N abundance of a labelledammonium soil pool receiving nitrogen at a natural abundance throughmineralization (Powlson and Barraclough, 1993). The measured changes arethen described according to a specific set of equations (Kirkham andBartholomew, 1954; Barraclough et al., 1985; Nishio et al., 1985; Mary et al.,1998) capable of quantifying the size of the soil N pools and the rate of thegross processes (i.e. mineralization, immobilization, nitrification). Thismethod has proven very useful in understanding how soil and crop man-agement affect the N turnover, in situ or in intact soil cores (Recous et al.,2001).
In order to obtain useful quantitative estimates, the application of thetechnique requires four basic assumptions.
• Ammonium-consuming processes (plant uptake and nitrification) donot discriminate between 14N and 15N.
• Added label mixes with native soil ammonium, such that labelled andunlabelled N are used in proportion to the relative amounts present inthe system.
• Over the experimental period, all rate processes can be described by azero-order equation.
• Labelled nitrogen immobilized over the experimental period is not re-mineralized.
These assumptions have been verified exclusively for a short-term period,and the procedure supplies reliable information only for instantaneousrates of nitrogen mineralization.
The limited popularity of this technique is probably due to the (rela-tively) high costs of the equipment required to perform 15N analyses, andbecause of the unwieldy formulation of the equations used to describe theprocesses quantitatively.
Methods for measuring the potential mineralization activity (laboratoryincubation methods)
These methods involve the laboratory incubation of the soil for a definedperiod of time and in conditions that promote the N mineralization fromorganic sources. The N mineral produced is then measured.
The methods are generally classified on the basis of the length of theincubation period and the incubation conditions. In this section we shalldiscuss short-term static incubation methods (aerobic and anaerobic) and along-term aerobic dynamic method.
All laboratory incubation procedures considered measure the net nitro-gen mineralization and, since at least the temperature, which is one of themost relevant factors affecting the process, is set to an optimal value, the N
Soil Nitrogen Mineralization 129

mineralization activity is measured under potential conditions.Consequently, the results obtained must be interpreted as a relative indica-tion of the process rate.
Short-term static incubation procedures
The static aerobic incubation procedure was described first by Bremner(1965). The soil sample is mixed with a defined amount of washed sand andthe mixture is moistened with water and incubated at 30°C for 15 days. Atthe end of the incubation, NH4
+-N, NO3–-N and NO2
–-N are extracted bymeans of a concentrated saline solution (KCl) and then evaluated.According to this procedure, the two main factors affecting the mineraliza-tion (water contents of the system and the temperature) are set at definedoptimal values and the presence of sand should allow adequate O2 avail-ability.
This is a widespread and well-known method and, in accordance withits general principles, many minor modifications have been proposed bydifferent authors in order to reduce the incubation time and to facilitate lab-oratory procedures.
Waring and Bremner (1964) and then Keeney (1982) proposed the short-term static anaerobic incubation procedure. The rate of the N mineralizationprocess is determined by measuring the quantity of NH4
+-N produced dur-ing 7 days of waterlogged incubation at a temperature of 40°C.
In the above-mentioned incubation conditions, mineralization oforganic N is performed only by microorganisms that are able to operateunder anaerobic conditions. This method has been used to study nitrogentransformation in paddy soils and, according to this procedure, Sahrawatand Ponnamperuma (1978) and Sahrawat (1983) measured the net mineral-ization process in tropical rice soils.
This method can also be applied to agricultural aerated soils. In fact,even in this type of soil, waterlogged conditions can occur for a limitedperiod of time (rainy periods) and anaerobic conditions can be found at anytime inside soil aggregates. Indeed, Keeney and Nelson (1982), Stanford(1982) and Meisinger (1984) found satisfactory relationships between theresults obtained through the anaerobic and the aerobic procedures. Ourhypothesis is that even in the Mediterranean soil of southern Italy, charac-terized by extreme conditions in which waterlogged situations hardly everoccur, the anaerobic and the aerobic procedures for measuring the net Nmineralization process supply substantially the same indicative results.
This method, as compared to the aerobic static procedure, has severaladvantages that make it an attractive solution when a rapid procedure isneeded to supply a relative assessment of N mineralization. Theseadvantages include: (i) simplicity and ease of adaptation in laboratoryroutines; (ii) a short incubation time (7 days); (iii) a low impact of samplepretreatment on test results; (iv) the elimination of problems related tooptimum water contents and water loss during the incubation; and (v) the
130 S. Canali and A. Benedetti

requirement of only a few machines and reagents (Bremner, 1965; Keeney,1982; Lober and Reeder, 1993).
The long-term dynamic incubation procedure
This procedure was initially proposed by Stanford and Smith (1972). It isbased on aerobic long-term incubation at 35°C, and, within the incubationperiod, the mineral nitrogen produced (NH4
+-N, NO3–-N and NO2
–-N) isleached at predetermined intervals (after 2, 4, 8, 16, 22 and 30 weeks). Nmineralization is described by fitting the cumulative experimental data ofmineralized N according to a first-order kinetic model.
Soil samples are incubated in a combined filtration–incubation con-tainer. Full-potential conditions are imposed by mixing soil with washedquartz sand (1:1 p/p) to allow for an adequate O2 availability in the system.Water is added to reach the optimum pH value. Mineral nitrogen isremoved by leaching to reduce the re-immobilization of mineralized nitro-gen and/or to avoid feedback effects on the mineralization process. In orderto prevent any limiting effects due to the absence (or reduced concentra-tion) of other elements, after each leaching a nutritive solution, minus N, isapplied to the soil.
The long-term incubation should allow problems linked to the influ-ence of pre-treatment of the samples in the N mineralization process to beovercome; for this purpose, Stanford and Smith (1972) suggested that theresults obtained during the first 2 weeks of incubation should be ignored.Benedetti et al. (1994, 1996) suggested that the results obtained during thefirst 2–3 weeks of incubation give an indication of the size of the labile min-eralizable N pool and/or the biomass nitrogen pool of soils.
Furthermore, after the first weeks of incubation, depending on the spe-cific characteristics of the different soil types, the system generally reaches asteady-state condition. When this new balance is observed, it is possible toobtain indications regarding basal N mineralization (MNBas). Thus, it is pos-sible to use basal N mineralization to calculate the N mineralization coeffi-cient (MNBas/Ntot) and the N mineralization quotient (QN = MNBas/Nbio).
When the first-order kinetic model is applied in order to describe theexperimental results of potentially mineralizable nitrogen (N0), and the rateconstant (k) is calculated (Stanford and Smith, 1972), the first parameter (N0)is considered to be a nitrogen availability index and, together with the kconstant (the dimension of which is 1/t), it is capable of describing thelong-term N fertility status of the soils.
Benedetti and Sebastiani (1996) determined N0 and k by the Stanfordand Smith method for a number of Italian soils. These authors also con-firmed that significantly less reliable estimates of potentially mineralizableN were obtained by using data for up to only 22 weeks of incubation.
Despite the advantages described above, this method is characterizedby several disadvantages which are concerned with the substantial timeand apparatus requirements (Bundy and Meisinger, 1994). For this reason,
Soil Nitrogen Mineralization 131

this method is usually used only when reliable and long-term N mineraliza-tion information (i.e. basal N mineralization) is required.
Conclusions
Actual net and gross N mineralization rate (field conditions) should bedetermined when the aim of the study is to evaluate the absolute rate of theprocess (i.e. the capability of soils or organic fertilizers to supply N to thecrop).
Methods to assess the potential mineralization (laboratory methods)may be used when performing a comparison of different soil samples orapplying several methods for evaluating the same soil.
The anaerobic static incubation procedure is strongly recommendedwhen a quick, work-saving, inexpensive procedure (i.e. field surveyapproach on a large, regional scale) is needed. We do not yet have confirma-tion about the potential correlation between the results obtained with theaerobic and the anaerobic static procedure for all climatic and pedologicalsituations.
The aerobic long-term dynamic procedure (Stanford and Smithmethod) can be applied whenever reliable and exhaustive quantitativeinformation about net N mineralization in potential conditions is necessary.
Anaerobic N Mineralization
Principle of the method
This method is based on incubation of waterlogged soil for 7 days at 40°C.At the end of the incubation, accumulated ammonium is measured.
Materials and apparatus
• Incubator at 40°C• Shaking apparatus• Filter paper (N-free)• Glass or plastic tubes (50 ml) with rubber stoppers and screw caps• Glass Erlenmeyer flasks (300 ml)• Plastic bottles (100 ml)
Chemicals and solution
• 4 M KCl solution: dissolve 298 g of KCl in 750 ml of distilled water in a1000 ml glass flask; bring up to volume with distilled water
132 S. Canali and A. Benedetti

Procedure
• Put 40 ml of distilled water into the tube and add 16 g of soil (threereplicates).
• Close the tube by the rubber stopper and the cap, and then shake man-ually until the soil is completely suspended.
• Incubate for 7 days at 40°C. During the incubation, re-suspend the soildaily by manual shaking.
• After the incubation, transfer the soil–water suspension into the 300 mlErlenmeyer flask.
• Wash the incubation tube with 10 ml of the 4 N KCl solution and trans-fer the obtained suspension into the Erlenmeyer flask; repeat the sameprocedure three times, in order to use 40 ml of the 4 N KCl solution inall. No soil particles should remain in the incubation tube.
• Shake the Erlenmeyer flask containing the soil suspension for 1 h andthen filter the supernatant through a filter paper into the plastic 100 mlbottle.
• Use the clear filtrate for ammonium determination, according to thechosen method.
• Samples that are not to be incubated are prepared by putting 16 g of thesame soil + 40 ml of distilled water + 40 ml of the 4 N KCl solution intothe 300 ml Erlenmeyer flask. Shake and filter according to the proce-dure reported above.
Calculation
• Mineralized nitrogen during 7 days of incubation is calculated by sub-tracting the ammonium measured (µg NH4
+-N/g soil) in the samplethat was not incubated from that measured in the incubated sample.
• In order to verify that anaerobic conditions occurred during incubation,the presence of nitrate and nitrite should be assessed – only traces ofNO3
–-N and NO2–-N should be found.
Long-term Aerobic N Mineralization
Principle of the method
The method is based on the aerobic incubation of soil (mixed with quartzsand) in optimal conditions of moisture and temperature for soil microbialactivity. Mineralized nitrogen is removed periodically by leaching, and thendetermined at fixed times for 30 weeks.
Soil Nitrogen Mineralization 133

Materials and apparatus
• Ceramic Buchner funnel (outer diameter 55 mm)• Thermostatic system
Chemicals and solutions
• Quartz sand (granulometry: 0.2–0.8 mm)• Glass-fibre diskettes (diameter chosen according to the Buchner funnel
used)• Leaching solution: 0.01 M calcium chloride (CaCl2)• Nutritive N-minus solution: 0.002 M CaSO4.2H2O; 0.002 M MgSO4;
0.005 M Ca(HPO4)2. H2O; 0.0025 M K2SO4
Procedure
• Mix 10 g of soil (air-dried and sieved at 2 mm) with quartz sand in theratio 1:1, and put the mixture in a ceramic Buchner funnel (outer diame-ter 55 mm), on the bottom of which is placed a glass-fibre diskette(three replicates).
• Remove the mineral nitrogen (present in the soil at the beginning of theexperiment) by leaching the system ‘soil + quartz sand’ with 180 ml of0.01 M CaSO4, followed by the addition of 20 ml of the nutritive N-minus solution. Remove excess water with a vacuum system (60 cmHg).Incubate at 30°C. Gaseous exchange through the opened portion of thefunnels guarantees the maintenance of aerobic conditions.
• After 2 weeks, remove the mineralized nitrogen by leaching again with100 ml of 0.01 M CaSO4 and then add 20 ml of the nutritive ‘N-minus’solution, followed by the vacuum application as described above.Incubate again, performing a series of leachings after 2, 4, 8, 12, 16, 22and 30 weeks. In order to avoid soil dryness during the incubationperiod, add distilled water to the mixture of soil + quartz sand, untilreaching the optimal value of soil moisture.
• Determine NH4+-N, NO3
�-N and NO2�-N in the clear leached solution
according to the chosen method.
Calculation
The total mineralized nitrogen is calculated as the sum of NH4+-N, NO3
–-Nand NO2
–-N content after each leaching. N0 (potentially mineralized nitrogen) could be calculated by fitting the
cumulative experimental data by the first-order equation:
134 S. Canali and A. Benedetti

Nt = N0 (1 – e–kt)
where: Nt = mineralized nitrogen (cumulated value, in mg N/kg soil); N0 =potentially mineralizable nitrogen (mg N/kg soil); k = kinetic constant (in1/week); and t = time (in weeks).
Soil Nitrogen Mineralization 135

7.4 Nitrification in Soil
ANNETTE BOLLMANN
University of Aarhus, Department of Microbial Ecology, NyMunkegade Bygning 540, 8000 Aarhus C, Denmark; Presentaddress: Northeastern University, Department of Biology, 360Huntington Avenue, 134 Mugar Life Science Building, Boston,MA 02115, USA
State of the Art
Ammonium (NH4+) plays a central role in the terrestrial nitrogen cycle. It is
produced by mineralization of organic matter or by nitrogen (N2) fixationby nitrogen-fixing bacteria. Consumption of NH4
+ occurs through assimila-tion by bacteria and plants, and conversion to nitrite and nitrate by nitrifica-tion. Nitrification is the oxidation of ammonia (NH3) to nitrate (NO3
–) vianitrite (NO2
–), carried out by two separate groups of specialized bacteria.The ammonia-oxidizing bacteria are obligate aerobic, chemolithoauto-trophic bacteria with a pH optimum around 7–8, which convert ammoniainto nitrite. They belong to the �-subgroup of the Proteobacteria. The nitrite-oxidizing bacteria, catalysing the conversion of nitrite to nitrate, are physio-logically and phylogenetically more diverse than the ammonia-oxidizingbacteria. Some are capable of mixotrophic or heterotrophic growth and dis-similatory nitrate reduction, and they belong to different classes of theProteobacteria. These bacteria live in soils, sediments, fresh and marinewater, and wastewater treatment systems (Prosser, 1989; Koops andPommerening-Röser, 2001; Kowalchuk and Stephen, 2001).
There are different ways to determine nitrification: measurement ofgross nitrification rates by 15N methods, measurement of net nitrificationrates by determining the nitrate accumulation, and measurement of thepotential nitrification by measuring rates under optimal conditions. Theavailable methods are reviewed by Schinner et al. (1992), Mosier andSchimel (1993), Hart et al. (1994) and Schmidt and Belser (1994).
Gross nitrification
15N tracer studies
The substrate pool (NH4+) is labelled to follow the fate of the label in the
system (Myrold and Tiedje, 1986). This method has been used to determinegross nitrification, but some problems have become evident. The in situ
© CAB International 2006. Microbiological Methods for Assessing Soil Quality136
ammonium concentration is changed by the addition of the labelled sub-strate and/or by the in situ production of ammonium by other processes. Inaddition, the product of nitrification (nitrate/nitrite) can be removed byassimilation or dissimilation processes.
15N dilution method
The product pool (NO3–) is labelled and, by following the dilution of the
15N NO3– pool, the gross nitrification rate can be calculated (Kirkham and
Bartholomew, 1954). Good detailed descriptions of this highly recom-mended method to determine gross nitrification rates are available inDavidson et al. (1991), Mosier and Schimel (1993) and Hart et al. (1994).
Net nitrification
The measurement of net nitrification in the laboratory and in the field isbased on the determination of the accumulation of NO3
– over time (Beck,1979; Hart and Binkley, 1985; Davidson et al., 1990). Measuring the accumu-lation of NO3
– does not give a good indication about the real size of thenitrification process, because it does not take into account the immobilizedNO3
– fraction, the denitrified NO3– fraction and the NO3
– fraction convertedback to NH4
+. Additionally, the long incubation periods of up to 3 weekscan cause changes in the populations of the ammonia- and nitrite-oxidizingbacteria.
Nitrification potential
The nitrification potential is a method to determine the maximum nitrifyingactivity under optimal conditions. This method will be described in detail.
Description of the ammonia oxidizer population
Molecular fingerprinting methods, such as denaturing gradient gel elec-trophoresis (DGGE) and restriction fragment analysis, are available todescribe communities of ammonia-oxidizing bacteria, based on the 16SrRNA gene or amoA gene (Kowalchuk et al., 1997; Rotthauwe et al., 1997;Stephen et al., 1999; Nicolaisen and Ramsing, 2002).
Principle of the Method
The nitrification potential is a method to measure the maximal nitrifyingactivity under optimized conditions (Belser, 1979; Hart et al., 1994). By keep-ing the basic requirements of the ammonia-oxidizing bacteria (NH4
+, O2,
Nitrification in Soil 137

pH and water) within the optimal range, effects of toxic substances,fertilization or management processes can be determined. Changes in thepopulations of the ammonia- or nitrite-oxidizing bacteria will not have asignificant influence, because potential rates can be determined in short-term experiments (within 24 h). This method, or very similar methods, hasbeen used to determine the nitrification potential in paddy soils (Bodelier etal., 2000), in agricultural soils (Mader, 1994; Stoyan et al., 2000) and insediments (Bodelier et al., 1996).
Materials and Apparatus
• 250 ml Erlenmeyer flasks, closed with aluminium foil to reduce evapo-ration
• Shaker • Eppendorf pipettes and pipette tips with cut-off tips, to prevent block-
ing of the tip with soil or sediment for sampling • 1.5 ml Eppendorf cups and Eppendorf cup centrifuge with cooling• HPLC (high-pressure liquid chromatograph), IC (ion chromatograph)
or autoanalyser to determine nitrite and nitrate• In case no HPLC, IC or autoanalyser is available: photometer and other
equipment to determine nitrite and nitrate photometrically (Keeneyand Nelson, 1982)
Chemicals and Solutions
• 0.1 M potassium dihydrogen phosphate solution: dissolve 13.61 g KH2PO4in 1l of water
• 0.1 M dipotassium hydrogen phosphate solution: dissolve 17.42 g K2HPO4in 1l water
• Ammonium stock solution: 1 M NH4+: dissolve 66.07 g ammoniumsulphate (NH4)2SO4 in 1l of water
• Sodium hydroxide solution and sulphuric acid to adjust the pH value• Reagents for photometric NO2
– determination:– sulphanilamide solution: add 150 ml of ortho-phosphoric acid care-fully to 700 ml water, add 10 g sulphanilamide, stir and warm up a littleto dissolve the sulphanilamide, add 0.5 g α-naphthyl ethylene diaminedihydrochloride and top up to 1 l (store in a dark bottle in the fridge)– calibration stock solution: 10 mM NO2
–: dissolve 0.69 g sodium nitritein 1l of water
• Reagents for photometric NO3– determination:
– 0.5% sodium salicylate solution (prepare fresh): dissolve 0.5 g sodiumsalicylate in 100 ml water– concentrated sulphuric acid (95–97%)– seignette salt solution: dissolve 300 g sodium hydroxide in 800 ml water,then add 6 g potassium sodium tartrate and fill up to an end volume of 1l
138 A. Bollmann

– calibration stock solution: 10 mM NO3–: dissolve 0.849 g sodium
nitrate in 1l of water
Procedure
Nitrification potential
• Prepare a working solution (1 mM PO43–, 5 mM NH4
+, pH 7.5): addper l, 2 ml of the KH2PO4, 8 ml of the K2HPO4 and 5 ml NH4
+ stocksolution and adjust the pH value to 7.5.
• Put 10 g soil into a 250 ml Erlenmeyer flask (at least three replicates).• Determine the gravimetric water content of the soil.• Add 100 ml of the working solutions to the flasks.• Put on the shaker at 200 rpm. • Incubate for 26 h and take samples directly after the start and after 1, 3,
6, 22 and 26 h. • Take a 1.5 ml sample into an Eppendorf cup, by pipetting 2 × 0.75 ml
with a cut-off 1 ml pipette tip on an Eppendorf pipette; shake samplesdirectly before sampling, because the sample should have the samesoil:solution ratio as the slurry.
• Put the sample immediately on ice. • Spin down for 10 min at 12,000 × g at 4°C.• Transfer the supernatant to a new Eppendorf cup.• Store the samples overnight at 4°C or for longer storage at –20°C.• Dilute the samples and determine nitrite and nitrate.
Determination of nitrite
• Put 2 ml of sample (concentration lower than 50 µM NO2–) or calibra-
tion solution (0–50 µM NO2–) into a test tube.
• Add 0.5 ml sulphanilamide solution and mix well.• Incubate in the dark for 15 min.• Measure the extinction at 540 nm against water.
Determination of nitrate
• Put 1 ml of sample (concentration lower than 1 mM NO3–) or calibration
solution (0–1 mM NO3–) into a test tube.
• Add 0.5 ml sodium salicylate solution and mix well.• Dry the mixture in an oven at 110°C overnight.• The next steps should be performed carefully in a fumehood:
Nitrification in Soil 139

– add 0.5 ml concentrated sulphuric acid to dissolve the dried solutionin the test tube;– add 4 ml water and mix well;– add 3 ml seignette salt-solution and mix well;– incubate for 10 min;– measure the extinction at 430 nm against water.
Calculations
Calibration
• Plot the extinctions against the NO2– or NO3
– concentrations (µM).• Determine the slope and the intercept with the Y-axis via linear regres-
sion.
Determination of the NO2– or NO3
– concentrations in the sample
Determine the NO2– and the NO3
– concentrations (µM) from the calibrationcurve:
where: Exs = extinction of the sample; Exb = extinction of the blank; int =intercept with the Y-axis calculated from the calibration curve; slo = slopeof the calibration curve.
Transform the concentrations from (µM) to (µg N/g DW)
where: DW = weight of the oven-dry soil (g); 14 = conversion factor (1 Mnitrogen = 14 g nitrogen); and
= conversion factor for the soil solution.
Determination of the potential nitrification rate
• Sum up the NO2– and NO3
– concentrations (= NOx).• Plot the NOx concentrations (µg N/g DW) against the time (h) and
determine the potential nitrification rate by calculating the slope vialinear regression (µg N/g DW/h).
100 101000
+ −( )
DW
NO or NO conc g N/g DW NO or NO conc M
DW
DW2 3 2 3− − − −( ) = ( ) ×
+ −( )
×
µ µ
100 101000
14
NO or NO conc Mint
sloxs xb
2 3− − ( ) =
−( ) −�
E E
140 A. Bollmann

Note: The potential nitrification rate is the maximum nitrification rate of asample under optimal conditions without growth of the cells during theincubation period. Under certain circumstances ammonia-oxidizing bacte-ria can have a lag phase until they become fully active, indicating that theyreach maximal activity after several hours of incubation. In other cases theyare very active – the ammonium can be completely consumed after severalhours of incubation and the NOx concentration no longer increases.Therefore, it is very important to take several samples during the timecourse of the incubation, to calculate the potential nitrification rate from themaximal increase of NOx concentration against time and to cross-check theNOx concentrations with the added ammonium concentrations.
Discussion
Measurement of the potential nitrification rate gives a good insight into thequality of a soil. Nitrification is a process carried out by highly specializedbacteria, which are very sensitive to changes in the environment, environ-mental stress, and toxic substances. Therefore, nitrification is a useful micro-biological parameter for describing soil quality.
Optimal initial ammonium concentration
There is a strong relationship between the ammonia oxidation (potentialnitrification) rate and the initial NH4
+ concentration. This relationship candiffer a lot between different soils (Stark and Firestone, 1996). So it wouldbe useful to conduct a pre-experiment to determine the relationshipbetween NH4
+ concentration and ammonium oxidation rate for the particu-lar soil. Then the nitrification potential at different initial NH4
+ concentra-tions (usually between 0.1 mM NH4
+ and 5 mM NH4+) can be determined
and the following experiments can be done with an initial NH4+ concentra-
tion at which the ammonia oxidation rate is maximal.
Addition of chlorate (ClO3–) to inhibit nitrite oxidation
ClO3– inhibition of nitrite oxidation is a widely used method to determine
potential ammonia oxidation rates (Belser and Mays, 1980; Berg andRosswall, 1985). ClO3
– acts as a competitive inhibitor of nitrite oxidation. Itis most effective at low nitrite concentrations (Belser and Mays, 1980). Theuse of ClO3
– is critical because Nitrobacter winogradskii (a nitrite oxidizer) isable to convert ClO3
– to chlorite (ClO2–). ClO2
– inhibits Nitrosomonaseuropaea (Hynes and Knowles, 1983) and other ammonia-oxidizing bacteria.Therefore, the use of the chlorate inhibition method is questionable.
Nitrification in Soil 141

7.5 Thymidine and Leucine Incorporation to AssessBacterial Growth Rate
JAAP BLOEM AND POPKO R. BOLHUIS
Department of Soil Sciences, Alterra, PO Box 47, NL-6700 AAWageningen, The Netherlands
Introduction
Besides biomass and respiration, bacterial growth rate is a key parameterinvolved in microbial functioning in soil food webs and nutrient cycling(Bloem et al., 1997). Moreover, growth or reproduction is very sensitive tocontamination, and is thus a useful indicator of stress. Growth rate cannoteasily be calculated from increases in biomass or cell number, because oftenincreases are balanced by losses. Losses may be caused by bacterivores suchas protozoa and nematodes, or by viruses. Since about 1980, measurementof [3H]thymidine incorporation during short incubations (about 1h ) hasbecome the method of choice to determine bacterial growth rate in waterand sediments (Fuhrman and Azam, 1982; Moriarty, 1986). Thymidine isincorporated into bacterial DNA and thus reflects DNA synthesis or celldivision. Since about 1990, the method has also been used for bacteria in soil(Bååth, 1990; Michel and Bloem, 1993). Thymidine incorporation has beenfound to be more sensitive to contamination than biomass and respiration,in both water and soil (Jones et al., 1984; Bååth, 1992). A plausible explana-tion for a reduced growth rate in contaminated environments is thatmicroorganisms under stress (e.g. heavy metals or pH) divert energy fromgrowth to cell maintenance (Kilham, 1985; Giller et al., 1998). Physiologicalprocesses for detoxification require additional energy. Thus, less energy isavailable for synthesis of new biomass (growth). This may explain whybacterial growth rate appears to be one of the most sensitive indicators ofheavy metal stress in contaminated soils (Bloem and Breure, 2003).
Leucine incorporation into proteins has been introduced as an alterna-tive to the commonly used thymidine method, but can also serve as anindependent check (Kirchman et al., 1985). Using [3H]thymidine and[14C]leucine in a dual-label approach, both parameters can be measured in asingle assay. Here we describe a protocol for simultaneous measurement ofthymidine and leucine incorporation into soil bacteria. Differences betweenthese protocols for thymidine incorporation and those published in previ-ous handbooks (Bååth, 1995; Christensen and Christensen, 1995) are dis-cussed. We describe measurement of thymidine incorporation in a soilslurry. Bacteria may also be first extracted from the soil and further treatedlike a water sample. This relatively simple, but more indirect, method is
© CAB International 2006. Microbiological Methods for Assessing Soil Quality142

especially useful for determining soil bacterial community tolerance toheavy metals and pH, for example (Bååth, 1992). A thorough review ofthymidine incorporation has been given by Robarts and Zohary (1993).
Principle of the Method
Thymidine is a precursor of thymine, one of the four bases in the DNA mol-ecule. Leucine is an amino acid which is incorporated in proteins. Whensufficient thymidine is added, de novo synthesis is inhibited, and labelledthymidine is incorporated. Bacterial growth rate is reflected by the incorpo-ration rate of [3H]thymidine and [14C]leucine into bacterial macromoleculesduring a short incubation of 1 h. If the incubation period is short enough,growth rate is not affected by incubation. Using a dual-label approach (3Hand 14C) both parameters are measured in a single assay.
Thymidine versus leucine
Thymidine incorporation is more proportional to growth rate than leucineincorporation because bacterial DNA content (usually 2–5 fg/cell) is moreconstant than protein content. Fungi do not incorporate thymidine becausethey lack the key enzyme thymidine kinase. Growth rates of fungi can beestimated by [14C]acetate incorporation into ergosterol (Bååth, 2001). Onlybacteria incorporate thymidine, but not all bacteria are able to do so (e.g.pseudomonads, some anaerobes, nitrifiers and sulphate reducers cannotincorporate thymidine). All bacteria incorporate leucine, but leucine canalso be incorporated by other organisms. However, the usual concentrationof about 2 µM is probably too low, and the incubation time of 1 h is proba-bly too short, to label cells bigger than most bacteria. Bigger cells have a lesssuitable surface to volume ratio. Incorporation rates of leucine into proteinsare an order of magnitude higher than those of thymidine into DNA, thuslower growth rates can be measured with greater precision. Since bothmethods have advantages and limitations, their use is complementary.
Materials and Apparatus
• Centrifuge• Polypropylene centrifuge tubes (13 ml) with screw cap (e.g. Falcon) for
incubation of samples• Incubator at 30°C• Ice• Cellulose nitrate membrane filters, 0.2 µm pore size: filters are pre-
washed with unlabelled thymidine and leucine to minimize adsorptionof unincorporated labelled thymidine and leucine
Bacterial Growth Rate: Thymidine and Leucine Incorporation 143

• Filtration manifold to handle larger number of samples (e.g. Millipore,for 12 filters)
• Liquid scintillation counter to measure 3H and 14C
Chemicals and Solutions
Radioisotopes
• Methyl-[3H]thymidine (TRK 300, 1 mCi/ml, 25 Ci/mmol =925 GBq/mmol, 40 µM) and L-[U-14C]leucine (CFB 67, 0.05 mCi/ml,0.31 Ci/mmol = 11.5 GBq/mmol) (Amersham Ltd, Amersham, UK)
• The isotopes are stored at 4°C before use; we store them no longer than3 months
• Per sample (tube) we use: 1.5 µl [14C]leucine, 2.0 µl [3H]thymidine and16.5 µl unlabelled thymidine (2.35 mg/l). This corresponds to 2 µM and2.78 kBq (= 0.075 µCi) [14C]leucine and 2 µM and 74 kBq (= 2 µCi)[3H]thymidine per tube
PJ mineral solution
Soil is suspended in a mineral solution (Prescott and James, 1955), made upas follows:
• Make up three stock solutions, each with 100 ml of distilled (or Milli Q)water:– stock solution A: 0.433 g CaCl2.2H2O and 0.162 g KCl– stock solution B: 0.512 g K2HPO4– stock solution C: 0.280 g MgSO4.7H2O
• The final dilution consists of 1 ml of each stock solution and 997 ml ofdistilled water
Solution for extraction of macromolecules
5 ml per tube of:
• 0.3 N NaOH (12 g/l; solubilizes DNA, hydrolyses RNA)• 25 mM EDTA (9.3 g/l; breaks up aggregates)• 0.1% SDS (1 g/l; sodium dodecyl sulphate, lyses membranes)
Both SDS and EDTA inhibit nucleases and breakdown of DNA
• 1 N HCl (82.6 ml/l; 1.3 ml/tube)• 29% TCA (trichloroacetic acid; 290 g/l; 1.3 ml/tube)• 5% TCA (50 g/l; 15 ml/tube)
144 J. Bloem and P.R. Bolhuis

• 5 mM thymidine (1.21 g/l) and 5 mM leucine (0.65 g/l) (1 ml/tube;unlabelled)
• 0.1 N NaOH (4 g/l; 1 ml/vial)• Ethylacetate (1 ml/vial)
Procedure
Incubation of soil suspension with labelled thymidine and leucine
• Homogenize 20 g soil in 95 ml mineral medium (PJ) by hand shakingfor 30 s.
• Allow settling for 1 min to remove coarse soil particles.• Add 100 µl soil suspension (20 mg soil) to the centrifuge tubes.• Add 20 µl labelled [3H]thymidine and [14C]leucine (both 2 µM final con-
centration).• Incubate for 1 h at in situ temperature; growing cells incorporate thymi-
dine and leucine.• Stop incorporation by adding 5 ml of extraction mixture (0.3 N NaOH,
25 mM EDTA and 0.1% SDS).• Blanks are prepared by adding the extraction mixture immediately after
the start of the incubation.• At this stage the samples may be stored. We found no effect of 3 days’
storage at 4�C in the dark, on thymidine and leucine incorporation.Dixon and Turley (2000) incubated marine sediment slurries on boardship, and stored them in a freezer until later analysis in the laboratory.
Extraction of labelled macromolecules
• The suspension is left at 30°C overnight (18–20 h) to extract macromol-ecules in the warm base solution.
• Mix and centrifuge (40 min, 5000 × g, 25°C) to remove soil particles.• Aspire the supernatant with macromolecules and cool on ice for 5 min.• Neutralize the base suspension with 1.3 ml ice-cold 1 N HCl.• Add 1.3 ml ice-cold 29% TCA (w/v) and cool on ice for 15 min to pre-
cipitate the macromolecules.• Collect the precipitated macromolecules on a 0.2 µm cellulose nitrate
membrane filter.• Wash filters three times with 5 ml ice-cold 5% TCA to remove unin-
corporated label, and transfer to glass scintillation vial.• Add 1 ml 0.1 N NaOH to dissolve macromolecules and 1 ml ethylacetate
to dissolve the filter. Shake, leave for half an hour and shake again.• Add (15 ml) scintillation fluid. Shake vial and leave for at least 1 h to
reduce chemoluminescence.• Count radioactivity (dpm) of 3H and 14C.
Bacterial Growth Rate: Thymidine and Leucine Incorporation 145

Calculation
The number of blanks equals the number of replicates. Because the blankshave no individual relationship with the replicates, the mean value of theblanks is subtracted from each replicate. After subtraction of blanks, thecounted dpm of 3H and 14C, respectively, are multiplied by 0.00284 to calcu-late pmol thymidine (1 picomol = 10�12 mol), and by 0.0759 to calculatepmol leucine incorporated per g soil per hour. These factors are based onthe specific activity (Bq/mol, 1 Bq = 1 dps or 60 dpm) of thymidine andleucine as given above.
Using conversion factors, pmol/g per h can be converted to cells andcarbon produced. Conversion factors have been established by growingbacteria at well-defined growth rates in continuous cultures (Bloem et al.,1989; Ellenbroek and Cappenberg, 1991; Michel and Bloem, 1993). Forthymidine, the mean conversion factor was 0.5 × 10¹⁸ cells/mol thymidine.The range was 0.2–1.1 × 10¹⁸. In the literature, much higher factors (range0.13–7.9 × 10¹⁸) have been published (Bååth and Johansson, 1990;Christensen, 1991). Given the uncertainties, we usually avoid conversionfactors and express thymidine incorporation as pmol/g soil/h.
Discussion
Bacterial growth rate appears to be a more sensitive indicator of contamin-ation than biomass or respiration. We compared the effects of copper pollu-tion on bacterial biomass (microscopic measurements), growth rate(thymidine incorporation) and respiration (CO2 evolution) in an arablesandy soil. The soil was originally unpolluted, with a background concen-tration of 25 mg Cu/kg. Jars were filled with 180 g gamma-sterilized soil,amended with 360 mg lucerne meal and 40 mg wheat straw meal, and re-inoculated with soil organisms (Bouwman et al., 1994). In addition, differentamounts of CuSO4 were added, using three microcosms per treatment. Twodays after amendment, bacterial growth rate, as determined by thymidineincorporation, was already significantly reduced at a low copper additionof 10 mg/kg (Fig. 7.2). Bacterial biomass and respiration were reduced athigher copper concentrations of 100 mg/kg and 1000 mg/kg.
In this experiment, thymidine incorporation was converted to growthrate using a conversion factor of 0.5 × 10¹⁸ cells/mol (Michel and Bloem,1993), a cell volume of 0.2 µm3 and a specific carbon content of 3.1 ×10�13 g C/µm3 (Bloem et al., 1995). This resulted in a calculated growth rateof 50 µg C/g soil/day (Fig. 7.2). However, the respiration rate was only10 µg C/g soil/day. Assuming a growth efficiency of, at most, 50%, thegrowth rate should roughly equal the respiration rate. Thus, the growth ratewas probably overestimated by at least a factor of 5. Using advanced meth-ods and avoiding conversion factors, Harris and Paul (1994) determinedspecific rates of DNA synthesis from the specific activities of the DNA pre-cursor deoxythymidine triphosphate (dTTP) and purified bacterial DNA
146 J. Bloem and P.R. Bolhuis

after [3H]thymidine incorporation. Their growth rate estimates were inagreement with respiration rates and much lower than those found in someother studies. This indicates that commonly used conversion factors tend tooverestimate bacterial growth rate.
The thymidine incorporation procedure described here is based mainlyon Findlay et al. (1984) and Thorn and Ventullo (1988), with some modifica-tions (Michel and Bloem, 1993). The procedure can be summarized as fol-lows:
• Incubate soil suspension with [3H]thymidine and [14C]leucine for 1 h.• Extract macromolecules in warm base overnight.• Remove soil particles by centrifugation.• Cool supernatant on ice and precipitate macromolecules with cold acid
(TCA).• Collect macromolecules (including DNA and proteins) on a cellulose
nitrate membrane filter.• Count radioactivity (3H and 14C).
With this procedure, thymidine and leucine incorporation can be deter-mined simultaneously. The procedure differs in some aspects from the
Bacterial Growth Rate: Thymidine and Leucine Incorporation 147
Fig. 7.2. Effects of copper pollution on biomass, growth rate and respiration rate of soil bacteriain microcosms, measured 2 days after amendment. Error bars indicate SD, n = 3.

procedures for thymidine incorporation described in two previous hand-books. Each procedure probably works well for the conditions it wasoriginally tested for, but it may have shortcomings under other conditions.
Christensen and Christensen (1995):
• Used a concentration of 200 nM thymidine. For some soils this is suffi-cient, but in other soils at least 1 µM may be needed for maximumincorporation. Ideally, the optimum concentration should be deter-mined by a saturation experiment for each soil, to minimize dilution byunlabelled precursors of thymine which may be present in the environ-ment. Specific techniques to estimate isotope dilution are time consum-ing and not very accurate (Michel and Bloem, 1993; Robarts andZohary, 1993). For routine use with large numbers of different samples(in monitoring networks) we use 2 µM thymidine (and leucine).
• Extracted in 0.6 N NaOH for 1 h at 60°C. This may cause degradation ofDNA and lower recovery than a milder extraction in 0.3 N NaOH at30°C for at least 12 h (Findlay et al., 1984; Thorn and Ventullo, 1988).
• Added no EDTA and SDS. EDTA and SDS have been reported toincrease recovery by inhibiting nucleases, and promoting cell lysis andbreakdown of soil aggregates (Findlay et al., 1984; Thorn and Ventullo,1988; Bååth and Johansson, 1990).
• Used cellulose acetate filters. Cellulose nitrate is recommended to bindDNA (Robarts and Zohary, 1993).
• Did not pre-wash filters with cold (unlabelled) thymidine: this maycause higher values of blanks (Robarts and Zohary, 1993).
The procedure of Bååth (1995) can be summarized as follows:
• Incubate with [3H]thymidine.• Centrifuge to collect bacteria and soil.• Extract macromolecules in warm base overnight at 60°C. • Centrifuge to remove soil particles.• Precipitate macromolecules with acid (TCA) on ice.• Centrifuge twice with 5% TCA to wash macromolecules.• Hydrolyse DNA in 5% TCA at 90°C for 30 min.• Centrifuge.• Collect supernatant (‘DNA fraction’) and measure radioactivity.
This procedure uses five centrifugation steps and may be more timeconsuming. Bååth and Johansson (1990) found little effect of extraction tem-perature on the recovery of added [14C]DNA. In contrast, at 60°C and 90°C,we found 30% and 90% lower thymidine incorporation than at 30°C. Thismay indicate degradation of DNA at higher temperatures. In Bååth’s proto-col, the incorporation into total macromolecules is not measured, but theDNA fraction is isolated using hot acid. In principle, it is better to isolate theDNA fraction. However, DNA has been reported to hydrolyse incompletely(about 50%) in hot acid, and this procedure may lead to underestimates ofDNA synthesis (Servais et al., 1987; Robarts and Zohary, 1993). Using hotacid hydrolysis, we sometimes found 80% incorporation into the ‘DNA
148 J. Bloem and P.R. Bolhuis

fraction’. On other occasions we found as little as 0% incorporation into the‘DNA fraction’ of actively growing (and incorporating) bacteria from con-tinuous cultures (Bloem et al., 1989). Robarts and Zohary (1993) criticized(mis)use of acid–base hydrolysis, and alternatively proposed to purify theDNA by rinsing the filters with 50% phenol–chloroform to remove proteins,and with 80% ice-cold ethanol to remove lipids. Using this method, wefound between 10% and 100% incorporation into DNA. Since proteins areremoved, this method requires separate samples for measuring leucineincorporation.
Thus, a minor fraction of the total thymidine incorporation may be intoDNA. Measured incorporation into DNA underestimated actual DNA syn-thesis by a factor of 6–8 (Jeffrey and Paul, 1988; Ellenbroek andCappenberg, 1991). This may be caused by a rate-limiting step in the incor-poration of labelled thymidine, resulting in intracellular dilution with unla-belled thymine. Part of the (apparently) low incorporation into DNA maybe caused by incomplete hydrolysis of DNA in hot acid (Robarts andZohary, 1993). However, two alternative methods, using enzymatic degra-dation with DNase or the DNA synthesis inhibitor mitomycin, confirmed alow (about 35%) incorporation into DNA (Ellenbroek and Cappenberg,1991). Even incorporation into total macromolecules (DNA, proteins, lipids)underestimated real DNA synthesis in continuous culture by at least a fac-tor of two (Bloem et al., 1989; Ellenbroek and Cappenberg, 1991).
Given the difficulties with measuring actual DNA synthesis, and theapparently consistent empirical relationship between (total) thymidineincorporation and bacterial growth rate (Bloem et al., 1989; Ellenbroek andCappenberg, 1991; Michel and Bloem, 1993), we have chosen to use incor-poration of [3H]thymidine and [14C]leucine into total macromolecules. Thisis generally sufficient to indicate relative effects on bacterial growth rates.
Bacterial Growth Rate: Thymidine and Leucine Incorporation 149
7.6 N2O Emissions and Denitrification from Soil
ULRIKE SEHY,1 MICHAEL SCHLOTER,1 HERMANN BOTHE2 AND
JEAN CHARLES MUNCH1
1GSF – National Research Centre for Environment and Health,Institute for Soil Ecology, Ingolstädter Landstraße 1, D-85758Oberschleissheim, Germany; 2University of Cologne, Instituteof Botany, Gyrhofstraße 15, D-50923 Cologne, Germany
Introduction
The emission of nitrogenous gases from soil plays a crucial role in theglobal nitrogen cycle, as nitrate or ammonia are turned into gaseous prod-ucts, which return to the atmosphere. Gases involved include ammonia,nitric oxide, nitrous oxide and dinitrogen. For nitric oxide, nitrous oxideand dinitrogen, two microbial processes, nitrification and denitrification,are considered to be the most important biotic sources (Granli andBo/ckman, 1994). Both processes may occur simultaneously in micrositesand are controlled by various soil- and weather-dependent parameters.
Denitrification
During denitrification, nitrate is reduced via nitrite, NO and N2O to N2.Denitrification is an energy-yielding process, in which microorganisms uti-lize nitrate as an alternative terminal respiratory electron acceptor underoxygen-limited conditions. The ability for denitrification is widespreadamongst microorganisms. It is known that approximately 50% of all knownbacteria can denitrify (or at least carry out some partial denitrification reac-tions). In addition, some species of fungi and archaebacteria have also beendescribed as denitrifiers. Overall, the occurrence of denitrification in organ-isms of totally unrelated affiliations suggests that denitrification has beendistributed evolutionarily by lateral gene transfer.
The single steps of the denitrification process are catalysed by specificreductases. The first reaction, the conversion of nitrate to nitrite, is catalysedby a molybdenum (Mo)-containing nitrate reductase. All nitrate reductaseshave a molybdopterin cofactor and contain FeS centres, and, in addition,some possess cytochrome b or c. Several forms of nitrate reductases exist(membrane-bound, periplasmic and also an assimilatory enzyme with simi-lar characteristics to the dissimilatory enzymes), which make the study ofthis step interesting but also complex, particularly since some organismscontain more than one type of enzyme.
© CAB International 2006. Microbiological Methods for Assessing Soil Quality150

The next step in the denitrification pathway is the reduction of nitrite tonitric oxide, which is catalysed by nitrite reductase. Bacteria express twodifferent forms of nitrite reductase, containing either a cytochrome (nirS) orcopper (nirK) in their prosthetic group. Organisms possess one of the twoenzymes. The cytochrome-containing nitrite reductase appears to be morewidespread among bacteria, whereas the Cu-enzyme apparently is evolution-arily more conserved. The product of the reaction, NO, is highly reactive andtoxic, and is also an important signalling molecule for plant or animal life.Intact denitrifying organisms evolve, at best, minute amounts of this gas,which is effectively utilized by the cytochrome b, c containing nitric oxidereductase. The conversion of NO to N2O, catalysed by this enzyme, involvesthe formation of the dinitrogen bond, which is biochemically an extremelyinteresting, and currently poorly understood, reaction. Finally, nitrous oxideis reduced to the dinitrogen molecule by nitrous oxide reductase, whichcontains Cu atoms in a novel tetra-nuclear cluster at the active site.
Nitrification
While denitrification generates N, NO and N2O, nitrification can produceonly NO and N2O. Nitrification is the conversion of inorganic or organicnitrogen from a reduced to a more oxidized state. Chemoautotrophic bacte-ria are largely, or solely, responsible for the nitrification in soils with a pHabove 5.5 (Focht and Verstraete, 1977); at lower pH values there is evidencefor acid-tolerant heterotrophic nitrifiers (Schimmel et al., 1984). The het-erotrophic nitrifiers (e.g. bacteria, such as strains from Arthrobacter, andfungi, such as Aspergillus) do not derive energy from the oxidation of NH4
+.In arable soils, the production of nitrate by heterotrophs appears to beinsignificant in relation to that brought about by chemoautotrophs (Pauland Clark, 1989), which is in contrast to potential nitrification levels in acidforest soils (Kilham, 1987).
Consequences of the activity of denitrifying and nitrifying microorganisms
Due to the action of denitrifying and nitrifying microorganisms, the globaldinitrogen content in the atmosphere is in balance (due to the formation ofthe nitric oxide, nitrous oxide and dinitrogen from nitrate and ammonia).On the other hand, nitrogenous oxides, also released from soils and waters,have several impacts on the chemistry of the atmosphere and radiationprocesses. Nitrous oxide is next to carbon dioxide (CO2) and methane (CH4)in its importance as a potent greenhouse gas. Nitric acid and its chemicaloxidation product, NO2, are major constituents of acid rain, and NO andalso N2O interact with ozone in complex reactions and are major causes ofthe destruction of the protective ozone layer in the stratosphere.
Nitrate is the main source of nitrogen for the growth of plants in agri-culture, but it can simultaneously be used by microorganisms in soils.
N2O Emissions and Denitrification from Soil 151

Denitrification is generally regarded as an anaerobic process, but there areindications that it may also take place in well-aerated soils. The conditionsthat favour denitrification in soils have been elucidated in detail. It is clearthat any use of nitrate by bacteria means a loss of N for the growth ofplants. Thus, denitrification also has a severe impact on agriculture.
In addition, products of denitrification (nitrate respiration) havemanifold other, mainly adverse, effects on the atmosphere and on waters.
Measurement of NO, N2O and N2
While the products N2O and NO can be easily measured as trace gases,using gas chromatography, the determination of N2 is not straightforwardbecause comparatively small amounts of N2 produced during denitrifica-tion have to be distinguished from a large background of 78% N2 in theatmosphere (Aulakh et al., 1992). The methods available for measuringdenitrification in the field are based on the use of the stable isotope 15N, oron acetylene for blockage of the enzyme N2O-reductase.
Principle of the Method
The acetylene inhibition method (AIM) was developed utilizing the factthat acetylene (C2H2) blocks the enzymatic reduction of N2O to N2(Balderston et al., 1976; Yoshinari and Knowles, 1977) when present in arange of 1–10% v/v (Granli and Bøckman, 1994). In soils treated withacetylene, the amount of N2O released thus represents both N2O and N2produced during denitrification.
There are basically two methods available for the application of theAIM in the field:
1. Chamber methods: in which enclosures are placed over the soil to separatethe soil atmosphere from the ambient atmosphere (Ryden et al., 1979;Burton and Beauchamp, 1984; Mosier et al., 1986; Aulakh et al., 1991).Denitrification measurements can be made either with open chambers,where acetylene is forced through the cover and N2O is collected at the out-let for analysis, or with closed chambers, where N2O is allowed to accumu-late before withdrawal for analysis.2. Soil core methods: in which undisturbed soil cores are taken and incubatedin the laboratory or in the field (Parkin et al., 1985; Ryden et al., 1987; Aulakhet al., 1991; Jarvis et al., 2001). For denitrification measurements, soil coresare collected in the field, by driving a small cylinder into the soil, then incu-bated together with acetylene. Two methods are commonly used: one is toincubate soil cores statically in containers with acetylene and to collect gassamples through rubber septa (Burton and Beauchamp, 1984). In anothermethod, soil air and acetylene are recirculated through the macropores ofthe soil and the outgoing air is directly connected to a gas chromatographfor quantification of N2O (Parkin et al., 1984, 1985).
152 U. Sehy et al.
The following sections will focus on the measurement of N2O fromdenitrification. However, with slight modifications of the methods (no acety-lene inhibition), it is possible to measure all nitrous gases (see also Fig. 7.3).
Materials and Apparatus
Chamber method
• PVC rings (diameter, 30 cm; area, 0.07 m2; volume, 15 l) • Rubber stopper• Stainless-steel tubes (6 mm diameter) • 10 ml VacutainersTM (Becton and Dickinson, Heidelberg, Germany)• Gas chromatograph equipped with a flame ionization detector (e.g.
Shimadzu GC 14, Duisburg, Germany)• 63Ni-electron capture detector
Soil core method
• Plastic tubes of 9 cm length and 4.5 cm diameter• Rubber stopper• Stainless-steel tubes (6 mm diameter) • 10 ml VacutainersTM (Becton and Dickinson)• Gas chromatograph equipped with a flame ionization detector (e.g.
Shimadzu GC 14)• 63Ni-electron capture detector
Chemicals and solutions
• Acetone-free acetylene
Procedure
Chamber method (Mogge et al., 1998, 1999)
For each experimental site, PVC rings are driven into the soil to a depth of10 cm. During the sampling process the rings are sealed by a lid equippedwith a rubber stopper. Gas samples should be taken at the beginning and atthe end of the sampling period. Beforehand, a linear increase in N2O con-centration during the sampling period should be proven. In situ measure-ments of N2O should usually be repeated weekly.
For measurement of denitrification N losses, additional soil chambersare supplied with acetone-free acetylene by diffusion, using four perforated
N2O Emissions and Denitrification from Soil 153

stainless-steel tubes (6 mm diameter) for each cover. The use of flow meters,together with a timer, allows the addition of different amounts of acetyleneinto different soil types, to ensure equal concentrations of acetylene(0.5–1.5%) during a period of 48 h. Acetylene concentrations are determinedby a gas chromatograph equipped with a flame ionization detector(Shimadzu GC 14). In situ measurements of denitrification N losses areusually repeated every 14 days.
Evacuated 10 ml VacutainersTM should be used for sampling and stor-ing gas samples from the chamber atmosphere, after a pretreatmentdescribed by Heinemeyer and Kaiser (1996). Gas samples can be analysedfor N2O by a 63Ni-electron capture detector equipped with an automaticsample-injection system (Heinemeyer and Kaiser, 1996).
Soil core methods (Rudaz et al., 1999)
Three to 5 months before the start of the measurements, plastic tubes mustbe put into the soil and placed in 450 ml jars without removing the soil core.The jars are closed with a lid containing a rubber septum to take gas sam-ples from the headspace. The jars should be placed in the soil and coveredwith grass in order to avoid a change in temperature. Samples from eachsite are treated with acetylene (12 kPa) to estimate total N flux from denitri-fication. To determine N2O fluxes, controls are not treated with acetylene.Each sample should be incubated for 6 h. Every 2 h, gas samples (7 ml) arewithdrawn with a syringe and transferred in a pre-evacuated gas sampleflask (9.1 ml). The procedure described above is carried out in the field. Inthe lab, N2O is analysed with a gas chromatograph fitted with an electroncapture detector. Figure 7.3 shows a possible set-up for the measurement ofnitrous oxide emissions with and without acetylene-inhibition techniques(from Mogge et al., 1998).
Calculations
From Bauernfeind (1996).If a calibration gas mixture (with known mixing ratio) is used for calibra-tion, the µl N2O must be calculated from the injected volume. To set up thecalibration curve, plot the injected µg N2O under standard conditions (20°C,293 K and 101,300 Pa).
µg N2O injected =
From the calculated µg N2O of the sample from the calibration curve,the µg N2O-N/g dm/h can be calculated.
µg N2O-N/g dm/h = X V× × ×× ×
0.6363 100IV SW +%dmt
P MW 10R T
n6× × × ×
×
−V 10 9
154 U. Sehy et al.

where: P = standard atmospheric pressure (101,300 Pa); Vn = injected vol-ume of N2O standard (µl); 10�9 = conversion factor (1 µl = 10�9 m3); MW =molecular weight of N2O; 106 = conversion factor (1 g = 106 µg); R = gasconstant (8.31 J/mol.K); T = standard temperature (293 K); X = µg N2O ofthe injected sample volume; V = total volume of incubation flask minus soilvolume (ml); 0.06363 = factor to convert N2O to N2O-N; IV = injected sam-ple volume (ml); t = incubation time (h); SW = initial soil weight; and %dm= soil dry matter in percent.
Discussion
General advantages and disadvantages of the acetylene inhibition method
The principles of the described methods, as well as advantages and dis-advantages, have been reviewed by Aulakh et al. (1992) and Tiedje et al.(1989). Major advantages of the AIM are the applicability in undisturbed andin fertilized ecosystems, the low cost of the sampling and the analyticalequipment (especially compared to 15N-based methods) and the high sensi-tivity (a loss of about 1 g N/ha per day can be measured; Duxbury, 1986).The main disadvantage of the acetylene inhibition method is the inhibitionof nitrification by acetylene; thus, denitrification can only proceed fromnitrate already present in the soil (McCarty and Bremner, 1986). This mightlead to underestimation of real denitrification rates, especially in unfertil-ized, natural ecosystems (Tiedje et al., 1989; Aulakh et al., 1992). Furthermore,the dispersal of acetylene in the soil and diffusion of N2O out of the soil canbe severely hindered in heavy and/or wet soils, or in compacted zones(Klemedtsson et al., 1990; Granli and Bo/ckman, 1994). Finally, acetylene canbe biodegraded after a long time exposure of the microflora. However, this
N2O Emissions and Denitrification from Soil 155
A B C D E F G H/I
Fig. 7.3. Set-up for the measurement of nitrous oxide emissions with and without theacetylene-inhibition technique. A, gas vessel; B, pressure gauge, magnetic valve, timer; C,acetone trap (sulphuric acid, 95%); D, gas pipe; E, quickfit connector; F, flow meter; G,diffusion tubes; H, soil ring (with acetylene); I, soil ring (without acetylene).

can be avoided by restricting measurements to less than a week (Terry andDuxbury, 1985) and by choosing new points for measurements.
Soil core versus chamber methods
Advantages of chamber methods are the minimal disturbance of naturalconditions in the field (Klemedtsson et al., 1990). With chamber methods,actual fluxes of N gases from the soil to the atmosphere are measured, whilecores give more direct estimates of N gas production by biological processes(Tiedje et al., 1989).
Soil core methods have been considered superior to chamber methodsin very wet soils, due to better gas diffusion of acetylene into, and of N2Oout of, the smaller soil volume monitored in the former (Ryden et al., 1987).
A major criticism of the soil core method is that the aeration status ofthe soil is influenced by the coring procedure and the incubation. This hasrecently been addressed by Jarvis et al. (2001), who designed an incubationbox for square-section soil cores with minimum exposure of surfaces to air.
Other methods
The various 15N methods used in denitrification research have beenreviewed by Myrold (1990). The principle of the 15N mass balance methodis the measurement of the amount of applied 15N-labelled fertilizer in differ-ent soil pools and in the plant. The amount of N unaccounted for isassumed to be lost by denitrification (Aulakh et al., 1992). In the 15N gas fluxmethod, highly enriched (20–80%) 15N-labelled fertilizer is applied to soil;the soil is then covered with a chamber, and the flux of N2 and N2O follow-ing denitrification is measured by quantifying the increase in 15N-labelledgases in the chamber headspace (Stevens and Laughlin, 1998).
It has been stated that 15N methods are preferable to the acetylene inhi-bition method in heavy-textured soils where acetylene diffusion is hindered(Granli and Bo/ckman, 1994). However, quantification of denitrification ratesusing the 15N gas flux method may also suffer from hindered diffusion ofN2O out of the soil, as well as from N2O being dissolved in soil water(Myrold, 1990). Furthermore, a possible increase in the denitrification rateand change in the N2O/N2 ratio might occur after addition of 15N-NO3
–
(Granli and Bo/ckman, 1994). In addition, dilution of 15NO3– with soil NO3
–
by various soil processes will cause an underestimate of denitrification ifnot corrected for. Finally, a uniform distribution of added 15NO3
– is difficult.However, a uniformly labelled soil nitrate pool is the prerequisite for thecorrect calculation of N2 flux in the 15N gas flux method (Hauck et al., 1958).
Tiedje et al. (1989) reviewed a number of studies comparing 15N andacetylene inhibition methods. They concluded that both methods gavesimilar estimates of N loss, but high spatial variability of the denitrificationprocess may be partly responsible for the lack of statistical difference
156 U. Sehy et al.

between the methods. Recently, Watts and Seitzinger (2000) showed thatdenitrification rates measured with a 15N gas flux method and acetyleneinhibition methods may differ substantially. Malone et al. (1998) combinedthe 15N gas flux method with the acetylene inhibition technique in order toconfirm the assumption that acetylene had completely blocked N2Oreductase for their particular soil and condition.
N2O Emissions and Denitrification from Soil 157

7.7 Enzyme Activity Profiles and Soil Quality
LIZ J. SHAW1 AND RICHARD G. BURNS2
1Imperial College London, Department of Agricultural Sciences,Wye Campus, Wye TN25 5AH, UK; 2School of Land and FoodSciences, The University of Queensland, Brisbane,Queensland 4072, Australia
Introduction
Enzyme activities in soil are primarily the expression of bacteria, fungi andplant roots, and are responsible for the flux of carbon, nitrogen and otheressential elements in biogeochemical cycles. Measuring enzymatic catalysisand understanding the factors that regulate enzyme expression and therates of substrate turnover are the first stages in characterizing soil meta-bolic potential, fertility and quality, as well as a guide to the resilience of thesoil when subjected to various natural and anthropogenic impacts.Furthermore, substrate catalysis and enzyme responses, when combinedwith the other soil properties described in this handbook, may provideenough information to allow the rational manipulation of soil processes forcommercial and environmental benefit. Three obvious advantages of a bet-ter understanding of soil enzyme activities are the enhancement of plantnutrient solubilization, the inhibition of phytopathogens, and the stimula-tion of pollutant degradation. These beneficial influences are likely to bemost strongly expressed in the rhizosphere (Shaw and Burns, 2003).
Soil enzyme assays are far from uniform and usually employ incuba-tion conditions that are dissimilar to those encountered in the natural envi-ronment. As a consequence, interpretation of the data is difficult,controversial, and sometimes downright misleading. Furthermore, evenwhen the problems associated with the design of meaningful assays appearto have been considered and resolved, there are large variations in activityin both space and time; soil is heterogeneous. For example, enzyme–sub-strate interactions in macro-aggregates are different from those in micro-aggregates (Ladd et al., 1996), reaction rates in the rhizosphere are likely tobe dissimilar to those in the non-rhizosphere (Reddy et al., 1987; Kandeler etal., 2002), and the surface soil will display a different range and level ofactivities than the sub-surface soil (Taylor et al., 2002). Perhaps introducingeven greater complexity is the fact that most biogeochemical processes aremediated, in toto, by many enzymes located in one or more locations withinthe soil matrix.
Most enzymes in soil are directly associated with viable cells and func-tion within the confines of the microbial cell membrane (i.e. are truly intracel-
© CAB International 2006. Microbiological Methods for Assessing Soil Quality158

lular). Others, the extracellular enzymes, are secreted and catalyse reactionsat the outer surfaces of the cell wall and in the surrounding environment. Inaddition, many strictly intracellular enzymes (especially hydrolases) arereleased from leaking cells and lysing dead cells, but remain functional for aperiod of time. This is because these, together with the truly extracellularenzymes, become intimately associated with clays and organic (humic) col-loids. Clay– and humic–enzyme complexes form a long-term persistent cat-alytic component of soils, but one that may be poorly correlated withmicrobial numbers and the biomass (Burns, 1982; Nannipieri et al., 2002).
Thus, estimation of a suite of soil enzyme activities integrates both theintra- and extracellular biogeochemical activities of the soil biological sys-tem and should be a key aspect of soil quality assessment.
Numerous methods have been developed to measure the activities ofthe hundreds of enzymes that catalyse reactions involved in soil nutrientcycling (for an extensive review, see Tabatabai and Dick, 2002). Here wedescribe the methods for measuring three undeniably important, yet con-trasting, enzymatic processes. The first of these is an exclusively intracellu-lar process and depends on the reduction of tetrazolium salts. The second isthe result of both intracellular and extracellular microbial activity duringwhich fluorescein diacetate is hydrolysed. In both assays, the products ofthe reaction are a result of the activities of many different enzymes. Forexample, fluorescein diacetate can be hydrolysed by the action of lipases,proteases and esterases (Alef and Nannipieri, 1995), and tetrazolium saltsare reduced by a number of enzymes integral to the intact cell and reflectthe total oxidative potential of the soil microbial community (Dick, 1997).While useful to describe overall microbial activity in soil (in terms of eitherelectron transport activity or hydrolytic capability), these activities do notyield much information regarding the rate of specific catalytic steps, such asnutrient acquisition and biogeochemical cycling, processes which definesoil health (Dick, 1997). Therefore, the third type of assay is more appropri-ate for estimating the activity of hydrolytic enzymes involved in, for exam-ple, specific stages in C, N, P and S acquisition. Table 7.2 shows examples ofhydrolases commonly assayed, and the soil health function they mediate.As can be seen, a common approach when assaying the activity of soilhydrolases is to use artificial p-nitrophenyl-linked substrates. These estersare hydrolysed to p-nitrophenol, which is easily determined by colorimetry.Thus, since the principle of the p-nitrophenyl-linked substrate hydrolaseassay is the same, one enzyme, phosphomonoesterase, is chosen as anexample.
Dehydrogenase Activity
Principle of the method
The aerobic microbial oxidation of organic substrates is mediated bythe membrane-bound electron transport chain that transfers electrons or
Enzyme Activity Profiles and Soil Quality 159

160L.J. S
haw and R
.G. B
urnsTable 7.2. Examples of commonly assayed soil hydrolases, their function and measurement method (adapted from Alef and Nannipieri(1995); Acosta-Martinez and Tabatabai (2001)).
Enzyme Commissionclassification Enzyme Function Assay substrate Assay product
Phosphatases3.1.3.1 and 3.1.3.2 Alkaline and acid RNa2PO4 � H2O → R-OH � p-Nitrophenyl phosphateb p-Nitrophenol
phosphatase Na2HPO43.1.4.1 Phosphodiesterase R2NaHPO4 � H2O → R-OH � Bis-p-Nitrophenyl phosphateb p-Nitrophenol
RNaHPO4Sulphatase
3.1.6.1 Arylsuphatase ROSO3� � H2O → R-OH � p-Nitrophenyl sulphateb p-Nitrophenol
RNaHPO4Glycosidases
3.2.1.20 �-Glucosidase Glucoside-R � H2O → glucose � p-Nitrophenyl-�-D- p-NitrophenolR-OH glucopyranosideb
3.2.1.21 �-Glucosidase Glucoside-R � H2O → glucose � p-Nitrophenyl-�-D- p-NitrophenolR-OH glucopyranisideb
3.2.1.22 �-Galactosidase Galactoside-R � H2O → galactose � p-Nitrophenyl-�-D- p-NitrophenolR-OH galactopyranisideb
3.2.1.23 �-Galactosidase Galactoside-R � H2O → galactose � p-Nitrophenyl-�-D- p-NitrophenolR-OH galactopyranisideb
Amidohydrolases and arylamidases3.5.1.1 L-Aspariginase L-Asparagine � H2O → L-Aspartate � L-Asparaginea NH4-N
NH33.5.1.2 L-Glutaminase L-Glutamine � H2O → L-Glutamate � L-Glutaminea NH4-N
NH33.5.1.4 Amidase R-CONH2 � H2O → NH3 � R-COOH Formamidea NH4-N3.5.1.5 Urease Urea � H2O → CO2 � 2NH3 Ureaa NH4-N
aNatural substrate.bSynthetic substrate.

hydrogen from substrates via electron carrier proteins and oxidoreductasesto O2, the final electron acceptor. Thus, dehydrogenases exist as an integralpart of intact cells and represent the total oxidative activities of soil microor-ganisms during the initial stages of organic matter breakdown (Dick, 1997).The concept of estimating microbial activity in soil by quantifying dehydro-genase activity relies on the ability of a tetrazolium salt, iodonitrotetra-zolium chloride (INT), to act as an artificial electron acceptor in the place ofoxygen. Tetrazolium compounds are characterized by a heterocyclic ringstructure which readily accepts hydrogen atoms (and electrons) andbecomes reduced. Thus, upon incubation, water-soluble INT becomes bio-logically reduced to form the purple, water-insoluble, iodonitrotetrazoliumformazan (INTF). This can be extracted using an organic solvent and theamount produced determined colorimetrically. The method, detailed below,and recommended as the standard assay, is an INT-based method originallydescribed by Benefield et al. (1977), and adapted from Trevors (1984a,b) andvonMersi and Schinner (1991).
Materials and apparatus
• Glass McCartney bottles (28 ml) with rubber-lined screw caps, steril-ized by autoclaving
• Semi-micro clear polystyrene spectrophotometer cuvettes (1 ml)• Microcentrifuge with a rotor to fit 1.5 ml microcentrifuge tubes• Autoclave• Spectrophotometer set to 464 nm• Incubator at 25°C
Chemicals and solutions
• INT solution: dissolve INT (Sigma-Aldrich Co. Ltd, Dorset, UK) in dis-tilled water to give a 0.2% (w/v) solution and sterilize by passingthrough a 0.2 µm filter into a clean sterile container. Note that INT issparingly soluble in water (solubility limit = 0.3% (w/v), thereforeallow for sufficient time (> 2 h) for the INT to become completelydissolved
• Extractant: N,N-dimethyl formamide:ethanol (1:1, v/v)• INTF master standard solution (500 µg/ml): dissolve 25.0 mg of INTF
(Sigma) in ~40 ml of extractant. Decant to a 50 ml volumetric flask andbring up to the mark with extractant
• INTF working standard solutions: prepare INTF working solutions bypipetting the following volumes of the INTF master solution to 10 mlvolumetric flasks and make up to the mark with a mixture of extrac-tant:distilled water (5:2, v/v)
Enzyme Activity Profiles and Soil Quality 161

Procedure
• Soil, freshly collected from the field, should be sieved (< 2.8 mm), fieldmoist and stored at 4°C prior to the assay. (NB. This is essential for allenzyme assays.)
• Weigh replicate soil samples (1 g) into sterile McCartney bottles andadd 4 ml of INT solution (0.2%).
• Close the lids and incubate at 25°C for 48 h in the dark.• Sterile controls (to account for any abiotic INT reduction) should consist
of autoclaved soil (121°C, 20 min on three consecutive days).Spectrophotometer blanks for both autoclaved and non-autoclavedtreatments should consist of soil with the INT solution replaced withdistilled water. Controls and blanks should be treated like the samples.
• After the incubation period, extract soil by addition of 10 ml of theextractant and incubate in the dark with agitation for 1 h.
• After the extraction period, transfer ~1.2 ml of the extractant/soil mix-ture to 1.5 ml microcentrifuge tubes and remove soil by centrifugation(relative centrifugal force (RCF) = 11,600 × g for 5 min).
• Transfer 1 ml of supernatant fraction to spectrophotometer cuvettes anddetermine absorbance at 464 nm (OD464nm) against the appropriate blank.
• At the same time, construct a calibration curve by determining OD464nmvalues for the working standard solutions of INTF (0–25 µg/ml).
Calculation
Using the calibration curve, calculate INTF concentrations from the corre-sponding OD464nm value.
Dehydrogenase activity (µg INTF/g dry soil/48 h) = ([INTFs] – [INTFc]) × 14edw
where: [INTFs] is the INTF concentration (µg/ml) in the sample; [INTFc] isthe INTF concentration in the sterile control; edw is the equivalent dryweight of 1 g of soil (determined by loss of weight of field-moist subsamples
162 L.J. Shaw and R.G. Burns
Working INTF standard Volume of master concentration (µg/ml) solution (µl) in 10 ml
0 01 202 404 806 120
10 20015 30025 500

after heating at 105°C until constant weight); and 14 is the volume (ml) ofsolution added in the assay (INT + extractant).
Discussion
Although INT reductase activity is used widely in soil ecotoxicologyresearch (Gong et al., 1999; Welp, 1999; Moreno et al., 2001), no standardmethod has been adopted, and, consequently, assay parameters, such aspH, incubation temperature and time, substrate concentration and extrac-tant solvent used, vary depending on the soil type and experiment beingconducted.
The 48-h incubation period in the method described above is based onthe research of Trevors (1984a,b), which allows the accumulation of measur-able product and the estimation of dehydrogenase activity at temperatures(i.e. 25°C) more likely to be found in the natural environment. In addition,in the method described above, soil is assayed without use of a buffer andthe ‘natural’ dehydrogenase activity is determined (vonMersi and Schinner,1991). A pH optimum of 7–7.5 has been determined for INT reduction(vonMersi and Schinner, 1991), with very little activity below a pH of 6.6 orabove 9.5 (Trevors, 1984a). Thus, in order to obtain statistically meaningfulvalues for the dehydrogenase actvity of either acidic or alkaline soils, it maybe necessary to use a buffered system (vonMersi and Schinner, 1991; Tayloret al., 2002). Other studies (Trevors et al., 1982; Trevors, 1984b) have deter-mined INT reduction in soils incubated with labile carbon sources (glucoseand yeast extract) in an attempt to quantify ‘potential’ as well as ‘natural’activity.
The dehydrogenase assay has been a useful parameter in comparableecotoxicological studies within the same soil type. For example, Welp (1999)used INT reductase activity to examine the toxicity of total and water-solu-ble concentrations of metals in a loess soil. Gong et al. (1999) also useddehydrogenase activity in the toxicity assessment of TNT-contaminatedsoil. However, Obbard (2001) has shown that INTF undergoes abioticinteraction with copper, leading to decreased absorbance. Thus, in copper-contaminated soils, biotic complexation between INTF and Cu may lead toan underestimate of dehydrogenase activity.
Fluorescein Diacetate Hydrolysis
Principle of the method
Fluorescein diacetate (FDA) is a relatively non-polar compound. As a resultof this it is assumed that it diffuses easily through the cell membrane, whereit is hydrolysed by non-specific esterases to the fluorescent compound,fluorescein (Rotman and Papermaster, 1966). In addition, FDA can also behydrolysed by extracellular enzymes produced by the soil microflora, such
Enzyme Activity Profiles and Soil Quality 163

as proteases, lipases and esterases. Thus, FDA hydrolysis has been sug-gested as a measure of the global hydrolytic capacity of soils and a broad-spectrum indicator of soil biological activity (Bandick and Dick, 1999;Perucci et al., 1999).
The method described below is based on that described by Adam andDuncan (2001). Soil is incubated with the substrate, FDA, at 25°C for30 min. The amount of fluorescein formed is determined colorimetricallyfollowing extraction with an organic solvent mixture.
Materials and apparatus
• Glass McCartney bottles (28 ml) with rubber-lined screw caps; steril-ized by autoclaving
• Semi-micro clear polystyrene spectrophotometer cuvettes (1 ml)• Centrifuge(s) with rotor(s) to fit 1.5 ml microcentrifuge tubes and glass
McCartney bottles• Spectrophotometer set to 490 nm• Shaking incubator at 25°C
Chemicals and solutions
• Potassium phosphate buffer (60 mM, pH 7.6): dissolve 8.7 g of K2HPO4and 1.3 g of KH2PO4 in 1 l of distilled water; sterilize by autoclaving(121°C, 20 min)
• FDA solution (1 mg/ml): dissolve 25 mg fluorescein diacetate (3’6’-diacetyl-fluoresein, Sigma-Aldrich) in 25 ml acetone; store at –20°C
• Extractant (2:1 chloroform:methanol): add 666 ml of chloroform (ARgrade) to a 1-l volumetric flask, make up to the mark with methanol(AR grade) and mix thoroughly
• Fluorescein master solution (2000 µg/ml): dissolve 113.2 mg fluoresceindisodium salt in 50 ml of potassium phosphate buffer (60 mM, pH 7.6)
• Fluorescein working standard solutions: prepare fluorescein working solu-tions by pipetting the following volumes of the fluorescein master solu-tion into 100 ml volumetric flasks and make up to the mark withpotassium phosphate buffer:
164 L.J. Shaw and R.G. Burns
Working fluorescein standard Volume of master concentration (µg/ml) solution (µl) in 100 ml
0 01 502 1003 1504 2005 250

Procedure
• Soil, freshly collected from the field, should be sieved (< 2.8 mm), fieldmoist and stored at 4°C prior to the assay.
• Weigh 1 g soil sample into sterile McCartney bottles and add 7.5 mlpotassium phosphate buffer (pH 7.6, 60 mM) and allow to equilibrate at25°C on an end-over-end shaker.
• Start the reaction by the addition of 0.1 ml FDA solution (1000 µg/ml)and return the samples to the shaker. Incubate at 25°C for 30 min.
• Spectrophotometer blanks should consist of the soil and buffer mixturewith the FDA solution replaced by 0.1 ml acetone. Incubate as the sam-ples.
• After the 30 min have elapsed, immediately add 7.5 ml ofchloroform:methanol (2:1) to samples and blanks to stop the reaction.Replace the lids and mix the contents thoroughly (10 s, vortex mixer).
• Centrifuge the tubes at a low speed (RCF = 300 × g for 2 min) to clarifythe phases.
• Transfer 1.2 ml of the upper phase to a 1.5 ml microcentrifuge tube andcentrifuge (RCF = 16,500 × g for 5 min) to remove suspended fines.
• Decant 1 ml of supernatant fraction to a 1 ml cuvette and measureabsorbance at 490 nm on a spectrophotometer against the soil blank.
• To construct a calibration curve, pipette triplicate 7.5 ml aliquots of eachconcentration of fluorescein working standards into McCartney bottles,extract with chloroform:methanol and determine the OD490nm of theclarified upper phase as for the samples.
Calculation
Using the calibration curve, calculate the mass of fluorescein produced ineach assay from the corresponding OD490nm value and divide by the equiv-alent dry weight of soil (determined by loss of weight of field-moist sub-samples after heating at 105°C until constant weight). Fluorescein diacetatehydrolysis activity is expressed as µg fluorescein/g dry soil/0.5 h.
Discussion
The method for FDA hydrolysis described above does not use abiotic con-trols. We tested the FDA hydrolysis assay with four soil types and found noabiotic hydrolysis of FDA using autoclaved soil as the control (Shaw andBurns, unpublished results). Based on this evidence, we suggest that, onceestablished, it may not be necessary to include an abiotic control, despite asingle report that FDA can be hydrolysed spontaneously without microbialactivity (Guilbault and Kramer, 1964).
Buffer addition can directly or indirectly alter the nutrient conditions ofthe microbial community and therefore its hydrolytic activity (Battin, 1997).
Enzyme Activity Profiles and Soil Quality 165

Consequently, to better estimate the ‘natural’ FDA hydrolysis capacity of asoil, a non-buffered system should be used. However, sensitivity of theassay may be problematic for acidic soils, due to the decreased fluorescenceof fluorescein at low pH. Nevertheless, it may be possible for post-assayadjustment of the pH of the aqueous phase prior to measurement toimprove the sensitivity of fluorescein detection. It should also be mentionedthat spontaneous hydrolysis of FDA is reported at pH values greater than8.5 (Guilbault and Kramer, 1964), and this should be considered whenmaking decisions regarding FDA hydrolysis measurements in alkaline soils.
Dumontet et al. (1997) suggested that FDA hydrolysis may be a suitabletool to measure early detrimental effects of pesticides on soil microbial bio-mass, as it is both sensitive and non-specific. Indeed, the FDA assay hasbeen used in ecotoxicological studies to investigate the influence of pollu-tants (Vischetti et al., 1997; Perucci et al., 1999) or field management effects(Bandick and Dick, 1999; Haynes and Tregurtha, 1999) on soil microorgan-isms. However, variable responses have been recorded for pollutant effectson FDA hydrolysis. For example, Vischetti et al. (1997) reported increases inFDA hydrolysis rates in silty clay loam soil treated with rimsulfuron (asulphonylurea herbicide), whereas Perucci et al. (2000) described a declinein FDA hydrolysis activity after application of the same herbicide to a soil-swelling clay. Since Vekemans et al. (1989) have reported that FDA hydrol-ysis and microbial biomass content are closely correlated, negativepollutant effects on FDA hydrolysis activity can generally be explained interms of reduced biomass due to the toxicity of the pollutant. Positiveeffects of organic pollutants on FDA activity have been interpreted as beingeither due to the utilization of the molecule as a source of growth by themicrobial biomass, or due to the toxic effect of the pollutant, causing celllysis and release of intracellular hydrolytic enzymes (Perucci et al., 1999).Thus, the challenge is to develop methodology to distinguish betweenintracellular and extracellular activity. Perucci et al. (2000) introduced theconcept of specific hydrolytic activity (qFDA), where the per cent FDAhydrolysed is expressed per unit of microbial biomass carbon. Thisapproach may help distinguish between increases in FDA activity whichresulted from the growth of microorganisms on the pollutant or from thelysis of cells, releasing endocellular hydrolases.
Phosphomonoesterase Activity
Principle of the method
Soil humic material contains significant amounts of organic phosphates, inwhich phosphorus is bound to carbon via ester linkages. Phosphatases(which may be of plant, microbial or animal origin) catalyse the hydrolysisof phosphate esters to inorganic phosphorus. Phosphatases are classifiedaccording to the type of substrate upon which they act. For example,phosphomonoesterases (e.g. phytase, nucleotidases, sugar phosphatases)
166 L.J. Shaw and R.G. Burns

catalyse the hydrolysis of organic phosphomonoesters, whereas phospho-diesterases (e.g. nucleases, phospholipases) catalyse the hydrolysis oforganic phosphodiesters (Alef and Nannipieri, 1995) (see Table 7.2).However, it is likely that phosphatases have broad substrate specificity,such that phosphomono- and phosphodiesterases share common substrates(Pant and Warman, 2000). It has been estimated that phosphatase-labileorganic P makes up a significant component of the total soil P pool and,therefore, is potentially an important source of P for plants (Hayes et al.,2000). Thus, phosphatase activity is of paramount importance as a soil qual-ity indicator.
The methodology described below involves the use of an artificial sub-strate, p-nitrophenyl phosphate (p-NPP). The product of phosphomo-noesterase activity, p-nitrophenol, is a yellow chromophore under alkalineconditions and can be detected colorimetrically. The much used method ofTabatabai and Bremner (1969) is described.
Materials and apparatus
• Erlenmeyer flasks (50 ml) and stoppers• Incubator at 37°C• Spectrophotometer set to 400 nm• Semi-micro clear polystyrene spectrophotometer cuvettes (1 ml)• Filter papers (Whatman No. 12) or centrifuge• Volumetric flasks (1000 ml and 100 ml)
Chemicals and solutions
• Toluene• Modified universal buffer (MUB) stock solution: dissolve 12.1 g Tris, 11.6 g
maleic acid, 14 g citric acid and 6.3 g boric acid in 500 ml 1 M NaOH;dilute the solution to 1000 ml with distilled water; store at 4°C
• MUB (pH 6.5): adjust 200 ml of MUB stock solution to pH 6.5 using0.1 M HCl. Make the volume up to 1000 ml with distilled water
• p-NPP solution (115 mM): dissolve 2.13 g of disodium p-nitrophenylphosphate hexahydrate (Sigma-Aldrich) in 50 ml MUB; store at 4°C
• Sodium hydroxide solution (0.5 M)• CaCl2 solution (0.5 M)• p-Nitrophenol master solution (1000 µg/ml): dissolve 1 g p-nitrophenol
(spectrophotometric grade; Sigma-Aldrich) in 1000 ml of distilledwater; store at 4°C
• p-Nitrophenol working solution (10 µg/ml): dilute 1 ml of p-nitrophenolmaster solution to 100 ml with distilled water
Enzyme Activity Profiles and Soil Quality 167

Procedure
• Soil, freshly collected from the field, should be sieved (< 2.8 mm), fieldmoist and stored at 4°C prior to the assay.
• Place 1 g soil in a 50 ml Erlenmeyer flask and add 4 ml of MUB, 0.25 mlof toluene and 1 ml of p-NPP solution.
• Swirl contents to mix, stopper and incubate at 37°C for 1 h.• At the end of the incubation, add 1 ml 0.5 M CaCl2 and 4 ml 0.5 M
NaOH and swirl to mix.• Remove soil by filtration (Whatman No. 12) or centrifugation.• Transfer the filtrate/supernatant fraction to a spectrophotometer
cuvette and determine the absorbance at 400 nm.• For the controls, add 1 ml of p-NPP solution after the addition of CaCl2
(1 ml) and NaOH (4 ml) but immediately before filtration/centrifugation.• For the calibration, pipette 0, 1, 2, 3, 4 and 5 ml aliquots of the working
p-nitrophenol standard solution into 50 ml Erlenmeyer flasks. Adjustthe volume to 5 ml by addition of distilled water and proceed asdescribed for determining p-nitrophenol after the incubation of the soilsamples. Plot the mass of p-nitrophenol in each reaction (0–50 µg)against the OD400nm reading.
Calculation
Using the calibration curve, calculate the mass of p-nitrophenol produced ineach assay from the corresponding OD400nm value, correct using blank read-ings, and divide by the equivalent dry weight of soil (determined by loss ofweight of field-moist subsamples after heating at 105°C until constantweight).
Phosphomonoesterase activity is expressed as µg p-nitrophenol/g drysoil/h.
Discussion
Phosphomonoesterase is a generic name for a group of enzymes whichcatalyse the hydrolysis of esters of phosphoric acid. However, both acid(pH optimum of 4–6.5) and alkaline (pH optimum of 9–10) phosphataseshave been found in soil (Speir and Ross, 1978). It is suggested that the ratesof synthesis of acid and alkaline phosphatases are dependent on the soil pHand that acid phosphatase is predominant in acid soils and alkaline phos-phatase is predominant in alkaline soils (Juma and Tabatabai, 1978). Theassay described above is buffered to pH 6.5, since this was the maximumactivity recorded in the two soils tested by Tabatabai and Bremner (1969).However, the MUB may be adjusted to different pH values by titration witheither 0.1 M NaOH or 0.1 HCl (Alef and Nannipieri, 1995). In addition,
168 L.J. Shaw and R.G. Burns

‘natural’ activity may be determined using a non-buffered system, sub-stituting distilled water for the MUB (Tabatabai and Bremner, 1969).
Apart from varying the pH of the assay and other slight modifications,for example using less soil in determinations of phosphatase activity in rhi-zosphere soil (Tarafdar and Jungk, 1987) or its application to measuring theactivity associated with roots (Asmar and Gissel-Nielsen, 1997), the p-NPPmethod has become standard for most studies. However, in soils with highorganic matter content, the method is hampered by large amounts of inter-fering organic materials (Trasar-Cepeda and Gilsotres, 1987; Freeman et al.,1995). Schneider et al. (2000) were able to get over this problem for highorganic matter forest soils by increasing the CaCl2 concentration (to 2 M) anddecreasing the NaOH concentration (to 0.2 M). In peat-accumulating wet-land soil samples, however, Freeman and co-workers employed the use ofmethylumbelliferyl (MUF)-linked phosphate coupled to high-performanceliquid chromatography to separate the interferences from the compound ofinterest (Freeman, 1997). This method has the potential to quantify both theMUF-substrate and free-MUF product (Freeman and Nevison, 1999).
Acid and alkaline phosophomonoesterases have been used successfully,in combination with other enzyme activities, to detect heavy metal contami-nation in Mediterranean soil (Belen Hinojosa et al., 2004).
Interpretation of Assay Data and Conclusions
Definitions of a high-quality soil relate mainly to its ability to producehealthy and abundant crops, but also include the soil’s capacity to functionas a mature and sustainable ecosystem, capable of degrading organic inputs(Trasar-Cepeda et al., 2000). Although soil physical and chemical propertiesare important for soil function, it has been suggested that soil biochemicalproperties are the most useful indicators of soil quality, as they intimatelyreflect soil nutrient cycles and the ability of soil to break down organicmatter (including organic xenobiotics) (Trasar-Cepeda et al., 2000).
However, interpretation of enzyme assay data can be problematic, inparticular, dissecting what underlying mechanism(s) is responsible for ameasured change in the activity of a particular enzyme. Potentialmechanisms relate to microbial growth/death, enzyme de-repression/repression, and enzyme inhibition/activation. For example, an increase inthe measured activity of a particular soil enzyme in response to dis-turbance may be interpreted in terms of five different non-mutuallyexclusive processes: (i) enzyme induction; (ii) enzyme activation; (iii) ashift in community structure to a species which produces greaterquantities of the enzyme; (iv) microbial growth; and (v) cell lysis andrelease of intracellular enzymes.
Consequently, in order to aid interpretation of enzyme measurements,concurrent measurement of other parameters, such as those describing therelative contribution of intracellular and extracellular enzymes (reviewed indetail by Nannipieri et al., 2002), microbial biomass (Vischetti et al., 1997;
Enzyme Activity Profiles and Soil Quality 169

Perucci et al., 1999) and microbial diversity (Waldrop et al., 2000), areextremely valuable.
The existence of methodological artefacts should also be taken intoaccount when interpreting assay data. For example, physical disturbanceassociated with the collection of the soil sample and sample pretreatment(e.g. air-drying and sieving) will disrupt soil structure at the aggregate andsub-aggregate scale. Consequently, the accessibility of substrates, previ-ously physically inaccessible due to their location within aggregates andsmall pores, will be increased, thereby altering the environmental parame-ters that determine the total amount or activity present (Tate, 2002). Thus,before the soil sample is actually used in an enzyme assay, it should be rec-ognized that, compared to the in situ activity expressed in the field, samplecollection and storage will undoubtedly have resulted in changed activityprofiles (Shaw and Burns, 1996).
Artefacts arising from the actual assay methodology itself are numerousand have been reviewed by Speir and Ross (2002). Briefly, the followingpoints should be recognized when interpreting assay data:
• Most enzymes are assayed by using artificial substrates that either maynot serve as a substrate for all enzymes catalysing the reaction innature, or may be more easily transformed than the natural substrate.
• Assays are usually conducted under artificial conditions; the system isbuffered to the optimal pH of the enzyme, at enzyme-saturating sub-strate concentrations, and at temperatures higher than normallyencountered in soil.
• Most assay protocols involve the use of water-saturated systems, andoften agitation of the samples to negate diffusional constraints. Thus,the interaction between the enzyme and substrate is maximized.
In this section, we have described simple colorimetric methods for theassay of three soil enzyme activities: dehydrogenase, fluorescein diacetatehydrolase and phosphomonoesterase. We highlight studies where the method-ology has been employed in soil quality and ecotoxicological assessment.When discussing problems associated with assay interpretation, it should beremembered that there is a methodological revolution under way in whichmicroscopy (e.g. atomic force and confocal microscopy), genomic and post-genomic (stable isotope probing, reporter genes, soil proteomics) techniquesare being combined with the more established biochemical methods to solvethe long-established problems and anomalies associated with soil enzymology.
Normative References (ISO, DIN) for Chapter 7
Basal respiration by titration
ISO 10381–6 (1993) Soil quality – Sampling – Guidance on the collection,handling and storage of soil for the assessment of aerobic microbialprocesses in the laboratory.
170 L.J. Shaw and R.G. Burns

ISO 11465 (1993) Soil quality – Determination of dry matter and water con-tent on mass basis – Gravimetric method.
ISO 11274 (1998) Soil quality – Determination of the water retention charac-teristics.
ISO 16072 (2001) Soil quality – Laboratory methods for determination ofmicrobial soil respiration.
ISO 17155 (2001) Soil quality – Determination of abundance and activity ofsoil microflora using respiration curves.
Basal respiration, substrate-responsive microbial biomass, and its active anddormant part
For handling the soils see above.ISO 17155 (2001) Soil quality – Determination of abundance and activity of
soil microflora using respiration curves.ISO 16072 (2001) Soil quality – Laboratory methods for determination of
microbial soil respiration.
Nitrification
The ISO and DIN norm describes a method very similar to the measure-ment of net nitrification. As already stated, underestimations of the nitrifi-cation rates are possible when using those methods.
Dehydrogenase activity
ISO/DIN 23753–2 (draft standard). Soil quality – Determination of dehy-drogenase activity in soil – Part 2 method using iodotetrazolium chloride(INT).
Fluorescein diacetate hydrolysis
None available.
Phosphomonoesterase activity
None available.
Soil Microbial Activity 171

Acosta-Martinez, V. and Tabatabai, M.A.(2001) Arylamidase activity in soils: effectof trace elements and relationships to soilproperties and activities of amidohydro-lases. Soil Biology and Biochemistry 33,17–23.
Adam, G. and Duncan, H. (2001)Development of a sensitive and rapidmethod for the measurement of totalmicrobial activity using fluorescein diac-etate (FDA) in a range of soils. Soil Biologyand Biochemistry 33, 943–951.
Alef, K. (1995) Soil respiration. In: Alef, K.and Nannipieri, P. (eds) Methods inApplied Soil Microbiology and Biochemistry.Academic Press, London, pp. 214–218.
Alef, K. and Nannipieri, P. (eds) (1995)Methods in Applied Soil Microbiology andBiochemistry. Academic Press, London.
Alvarez, C.R. and Alvarez, R. (2000) Short-term effects of tillage systems on activemicrobial biomass. Biology and Fertility ofSoils 31, 157–161.
Alves, B.L.R., Urquiaga, S., Cadisch, G.,Souto, C.M. and Boddy, R.M. (1993) Insitu estimation of soil nitrogen mineraliza-tion. In: Mulongoy, K. and Merckx, R.(eds) Soil Organic Matter Dynamics andSustainability of Tropical Agriculture. Wiley-Sayce, Leuven, Belgium, pp. 173–180.
Anderson, J.P.E. (1982) Soil respiration. In:Page, A.L. et al. (eds) Methods of SoilAnalysis, Part 2. Chemical andMicrobiological Properties, 2nd edn. Agron.Monogr. 9 ASA and SSSA, Madison,Wisconsin, pp. 831–871.
Anderson, J.P.E. and Domsch, K.H (1978) Aphysiological method for the quantitativemeasurements of microbial biomass insoils. Soil Biology and Biochemistry 10,215–221.
Anderson, T.H. and Domsch, K.H. (1993)The metabolic quotient for CO2 (qCO2) asa specific activity parameter to assess theeffects of environmental conditions, suchas pH, on the microbial biomass of forestsoils. Soil Biology and Biochemistry 25,393–395.
Asmar, F. and Gissel-Nielsen, G. (1997)
Extracellular phosphomono- and phos-phodiesterase associated with andreleased by the roots of barley genotypes:a non-destructive method for the mea-surement of the extracellullar enzymes ofroots. Biology and Fertility of Soils 25,117–122.
Aulakh, M.S., Doran, J.W. and Mosier, A.R.(1991) Field evaluation of four methodsfor measuring denitrification. Soil ScienceSociety American Journal 55, 1332–1338.
Aulakh, M.S., Doran, J.W. and Mosier, A.R.(1992) Soil denitrification – significance,measurement and effects of management.Advances in Soil Sciences 18, 1–57.
Bååth, E. (1990) Thymidine incorporationinto soil bacteria. Soil Biology andBiochemistry 22, 803–810.
Bååth, E. (1992) Measurement of heavy metaltolerance of soil bacteria using thymidineincorporation into bacteria after homoge-nization-centrifugation. Soil Biology andBiochemistry 24, 1167–1172.
Bååth, E. (1995) Incorporation of thymidineinto DNA of soil bacteria. In: Akkermans,A.D.L., van Elsas, J.D. and DeBruijn, F.J.(eds) Molecular Microbial Ecology Manual.Kluwer Academic Publishers, Dordrecht,The Netherlands, pp. 2.8.2, 1–9.
Bååth, E. (2001) Estimation of fungal growthrates in soil using 14C-acetate incorpora-tion into ergosterol. Soil Biology andBiochemistry 33, 2011–2018.
Bååth, E. and Johansson, T. (1990)Measurement of bacterial growth rates onthe rhizoplane using 3H-thymidine incor-poration into DNA. Plant and Soil 126,133–139.
Balderston, W.L., Sherr, B. and Payne, W.J.(1976) Blockage by acetylene of nitrousoxide reduction in Pseudomonas perfec-tomarinus. Applied and EnvironmentalMicrobiology 31, 504–508.
Bandick, A.K. and Dick, R.P. (1999) Fieldmanagement effects on soil enzyme activ-ities. Soil Biology and Biochemistry 31,1471–1479.
Bardgett, R.D. and McAlister, E. (1999) Themeasurement of soil fungal:bacterial bio-
172 Soil Microbial Activity
References for Chapter 7

mass ratios as an indicator of ecosystemself-regulation in temperate meadowgrasslands. Biology and Fertility of Soils 29,282–290.
Barraclough, D., Geens, E.L., Davies, G.P.and Maggs, J.M. (1985) Fate of fertilisernitrogen. III. The use of single and doublelabelled 15N ammonium nitrate to studynitrogen uptake by ryegrass. Journal of SoilScience 36, 593–603.
Battin, T.J. (1997) Assessment of fluoresceindiacetate hydrolysis as a measure of totalesterase activity in natural stream sedi-ment biofilms. The Science of the TotalEnvironment 198, 51–60.
Bauernfeind, G. (1996) Actual and potentialdenitrification rates by acetylene-inhibi-tion technique. In: Schinner, F., Öhlinger,R., Kandeler, E. and Margesin, R. (eds)Methods in Soil Biology. Springer Verlag,Berlin, pp. 151–155.
Beck, T.H. (1979) Die Nitrifikation in Böden.Zeitschrift für Pflanzenernährung undBodenkunde 142, 344–364.
Belen Hinojosa, M., Carreira, J.A., Garcia-Ruiz, R. and Dick, R.P. (2004) Soil mois-ture pre-treatment effects on enzymeactivities as indicators of heavy metal-contaminated and reclaimed soils. SoilBiology and Biochemistry 36, 1559–1568.
Belser, L.W. (1979) Population ecology ofnitrifying bacteria. Annual Review ofMicrobiology 33, 309–333.
Belser, L.W. and Mays, E.L. (1980) Specificinhibition of nitrite oxidation by chlorateand its use in assessing nitrification insoils and sediments. Applied andEnvironmental Microbiology 39, 505–510.
Benedetti, A. (2001) Defining soil quality:introduction to Round Table. In:Benedetti, A. et al. (eds) COST Action 831 –Joint Meeting of Working GroupsBiotechnology of Soil Monitoring,Conservation and Remediation. RoundTable: Defining Soil Quality, Rome, 10–11December 1998. EUR 19225 – COSTAction 831 – Report of 1997–1998.European Communities, Luxembourg,pp. 266–269.
Benedetti, A. and Sebastiani, G. (1996)Determination of potentially mineraliz-
able nitrogen in agricultural soil. Biologyand Fertility of Soils 21, 114–120.
Benedetti, A., Canali, S. and Alianiello, F.(1994) Mineralisation dynamics of theorganic nitrogen: soil management effects.Proceedings of the N-immobilisation work-shop. November, Macaulay Land UseResearch Institute, Aberdeen, UK.
Benedetti, A., Vittori Antisari, L., Canali, S.,Giacchini, P. and Sequi, P. (1996)Relationship between the fixed ammo-nium and the mineralization of theorganic nitrogen in soil. In: VanCleemput, O. et al. (eds) Progress inNitrogen Cycling Studies. KluwerAcademic Publishers, Dordrecht, TheNetherlands, pp. 23–26.
Benefield, C.B., Howard, P.J.A. and Howard,D.M. (1977) The estimation of dehydroge-nase activity in soil. Soil Biology andBiochemistry 9, 67–70.
Berg, P. and Rosswall, T. (1985) Ammoniumoxidizer numbers, potential and actualoxidation rates in two Swedish arablesoils. Biology and Fertility of Soils 1,131–140.
Bloem, J. and Breure, A.M. (2003) Microbialindicators. In: Markert, B., Breure, A.M.and Zechmeister, H. (eds) Bioindicators/Biomonitors – Principles, Assessment,Concepts. Elsevier, Amsterdam, pp.259–282.
Bloem, J., Ellenbroek, F., Bär-Gilissen, M.J.B.and Cappenberg, T.E. (1989) Protozoangrazing and bacterial production in strati-fied Lake Vechten, estimated with fluores-cently labelled bacteria and thymidineincorporation. Applied and EnvironmentalMicrobiology 55, 1787–1795.
Bloem, J., Bolhuis, P.R., Veninga, M.R. andWieringa, J. (1995) Microscopic methodsfor counting bacteria and fungi in soil. In:Alef, K. and Nannipieri, P. (eds) Methodsin Applied Soil Microbiology andBiochemistry. Academic Press, London,pp. 162–173.
Bloem, J., de Ruiter, P.C. and Bouwman, L.A.(1997) Food webs and nutrient cycling inagro-ecosystems. In: van Elsas, J.D.,Trevors, J.T. and Wellington, E. (eds)Modern Soil Microbiology. Marcel Dekker,New York, pp. 245–278.
Soil Microbial Activity 173
Bodelier, P.L.E., Libochant, J.A., Blom,C.W.P.M. and Laanbroek, H.J. (1996)Dynamics of nitrification and denitrifica-tion in root-oxygenated sediments andadaptation of ammonia-oxidizing bacteriato low-oxygen or anoxic habitats. Appliedand Environmental Microbiology 62,4100–4107.
Bodelier, P.L.E., Hahn, A.P., Arth, I.R. andFrenzel, P. (2000) Effects of ammonium-based fertilisation on microbial processesinvolved in methane. Biogeochemistry 51,225–257.
Bouwman, L.A., Bloem, J., van den Boogert,P.H.J.F., Bremer, F., Hoenderboom, G.H.J.and de Ruiter, P.C. (1994) Short-term andlong-term effects of bacterivorous nema-todes and nematophagous fungi oncarbon and nitrogen mineralization inmicrocosms. Biology and Fertility of Soils17, 249–256.
Bremner, J.M. (1965) Nitrogen availabilityindex. In: Black, C.A., Evans, D.D., White,J.L., Ensminger, L.E. and Clark, F.E. (eds)Methods of Soil Analysis Part 2. Agronomy9, American Society of Agronomy,Madison, Wisconsin, pp. 1324–1341.
Bringmark, E. and Bringmark, L. (1993)Standard respiration, a method to test theinfluence of pollution and environmentalfactors on a large number of samples.MATS Guideline – Test 03. In: Torstensson,L. (ed.) Guidelines. Soil Biological Variablesin Environmental Hazard Assessment.Report No. 4262, Swedish EPA,Stockholm, pp. 34–39.
Bringmark, L. and Bringmark, E. (2001a) Soilrespiration in relation to small-scale pat-terns of lead and mercury in mor layers ofSouthern Swedish forest sites. Water, Airand Soil Pollution: Focus 1, 395–408.
Bringmark, L. and Bringmark, E. (2001b)Lowest effect levels of lead and mercuryon decomposition of mor layer samples ina long-term experiment. Water, Air andSoil Pollution: Focus 1, 425–437.
Brock, T.D. and Madigan, M.T. (1991) Biologyof Microorganisms. Prentice-Hall,Englewood Cliffs, New Jersey.
Brookes, P.C. (1995) The use of microbialparameters in monitoring soil pollution
by heavy metals. Biology and Fertility ofSoils 19, 269–279.
Brookes, P.C. and McGrath, S.P. (1984) Effectsof metal toxicity on size of the soil micro-bial biomass. Journal of Soil Science 35,341–346.
Bundy, L.G. and Meisinger, J.J. (1994)Nitrogen availability indices. In: Weaver,R.W., Angle, J.S. and Bottomley, P.D. (eds)Methods of Soil Analysis. Part 2.Microbiological and Biochemical Properties.Soil Science Society of America, Madison,Wisconsin.
Burns, R.G. (1978) Soil Enzymes. AcademicPress, London.
Burns, R.G. (1982) Enzyme activity in soil:location and a possible role in microbialecology. Soil Biology and Biochemistry 14,423–427.
Burton, D.L. and Beauchamp, E.G. (1984)Field techniques using the acetyleneblockage of nitrous oxide reduction tomeasure denitrification. Canadian Journalof Soil Science 64, 555–562.
Buyanovsky, G.A., Kucera, C.L. and Wagner,G.H. (1987) Comparative analyses of car-bon dynamics in native and cultivatedecosystems. Ecology 68, 2023–2031.
Chander, K. and Brookes, P.C. (1991) Effectsof heavy metals from past application ofsewage sludge on microbial biomass andorganic matter accumulation in a sandyloam and silt loam U.K. soil. Soil Biologyand Biochemistry 23, 927–932.
Christensen, H. (1991) Conversion factorsrelating thymidine uptake to growth ratewith rhizosphere bacteria. In: Kleister,D.L. and Gregan, P.B. (eds) TheRhizosphere and Plant Growth. KluwerAcademic, Dordrecht, The Netherlands,pp. 99–102.
Christensen, H. and Christensen, S. (1995)[3H]Thymidine incorporation techniqueto determine soil bacterial growth rate. In:Alef, K. and Nannipieri, P. (eds) Methodsin Applied Soil Microbiology andBiochemistry. Academic Press, London,pp. 258–261.
Dalenberg, J.W and Jager, G. (1981) Primingeffect of small glucose additions to 14C-labelled soil. Soil Biology and Biochemistry13, 219–223.
174 Soil Microbial Activity

Dalenberg, J.W. and Jager, G. (1989) Primingeffect of some organic additions to 14C-labelled soil. Soil Biology and Biochemistry21, 443–448.
Davidson, E.A., Stark, J.M. and Firestone,M.K. (1990) Microbial production andconsumption of nitrate in an annualgrassland. Ecology 71, 1968–1975.
Davidson, E.A., Hart, S.C., Shanks, C.A. andFirestone, M.K. (1991) Measuring grossnitrogen mineralisation, immobilisationand nitrification by 15N isotopic pool dilu-tion in intact soil cores. Journal of SoilScience 42, 335–349.
Dick, R.P. (1997) Soil enzyme activities asintegrative indicators of soil health. In:Pankhurst, C., Doube, B. and Gupta, V.(eds) Biological Indicators of Soil Health.CAB International, Wallingford, UK,pp. 121–156.
Dilly, O. (2001) Microbial respiratory quo-tient during metabolism and after glucoseamendment in soils and litter. Soil Biologyand Biochemistry 33, 117–127.
Dilly, O. and Munch, J.C. (1996) Microbialbiomass content, basal respiration andenzyme activities during the course ofdecomposition of leaf litter in a blackalder (Alnus glutinosa (L.) Gaertn.) forest.Soil Biology and Biochemistry 28, 1073–1081.
Dilly, O., Bach, H.J., Buscot, F., Eschenbach,C., Kutsch, W.L., Middelhoff, U., Pritsch,K. and Munch, J.C. (2000) Characteristicsand energetic strategies of the rhizospherein ecosystems of the Bornhöved Lake dis-trict. Applied Soil Ecology 15, 201–210.
Dixon, J.L. and Turley, C.M. (2000) The effectof water depth on bacterial numbers,thymidine incorporation rates and C:Nratios in northeast Atlantic surficial sedi-ments. Hydrobiologia 440, 217–225.
Doran, J.W. and Parkin, T.B. (1994) Definingand assessing soil quality. In: Defining SoilQuality for a Sustainable Environment.Special publication Number 35, SoilScience Society of America, Madison,Wisconsin, pp. 3–21.
Dumontet, S., Perucci, P. and Bufo, S.A.(1997) Les amendments organiques ettraitements avec les herbicides: influencesur la biomasse microbienne du sol. In:
Congres du Groupment Francais desPesticides, 21–22 Mai. BRGM-Orleans,France.
Duxbury, J.M. (1986) Advantages of theacetylene method of measuring denitrifi-cation. In: Hauck, R.D. and Weaver, R.W.(eds) Field Measurement of DinitrogenFixation and Denitrification. Soil ScienceSociety of America, Madison, Wisconsin,pp. 73–92.
Ellenbroek, F. and Cappenberg, T.E. (1991)DNA synthesis and tritiated thymidineincorporation by heterotrophic freshwaterbacteria in continuous culture. Applied andEnvironmental Microbiology 57, 1675–1682.
Falchini, L., Muggianu, M., Landi, L. andNannipieri, P. (2001) Influence of solubleorganic C compounds present in root exu-dates on soil N dynamics. In: Benedetti,A. et al. (eds) COST Action 831 – JointMeeting of Working Groups Biotechnology ofSoil Monitoring and Remediation. RoundTable: Defining Soil Quality. Rome, 10–11December 1998. EUR 19225 – COSTAction 831 – Report of 1997–1998.European Communities, Luxembourg,pp. 288–289.
Findlay, S., Meyer, J.L. and Edwards, R.T.(1984) Measuring bacterial production viarate of incorporation of [3H]thymidineinto DNA. Journal of MicrobiologicalMethods 2, 57–72.
Focht, D.D. and Verstraete, W. (1977)Biochemical ecology of nitrification anddenitrification. Advances in MicrobialEcology 1, 135–214.
Franzluebbers, A.J., Zuberer, D.A. and Hons,F.M. (1995) Comparison of microbiologi-cal methods for evaluating quality andfertility of soil. Biology and Fertility of Soils19, 135–140.
Freeman, C. (1997) Using HPLC to eliminatequench interference in fluorogenic sub-strate assays of microbial enzyme activity.Soil Biology and Biochemistry 29, 203–205.
Freeman, C. and Nevison, G.B. (1999)Simultaneous analysis of multipleenzymes in environmental samples usingmethylumbelliferyl substrates and HPLC.Journal of Environmental Quality 28,1378–1380.
Soil Microbial Activity 175

Freeman, C., Liska, G., Ostle, N., Jones, S.E.and Lock, M.A. (1995) The use of fluoro-genic substrates for measuring enzymeactivity in peatlands. Plant and Soil 175,147–152.
Fuhrman, J.A. and Azam, F. (1982)Thymidine incorporation as a measure ofheterotrophic bacterioplankton produc-tion in marine surface waters: evaluationand field results. Marine Biology 66,109–120.
Giller, K.E., Witter, E. and McGrath, S.P.(1998) Toxicity of heavy metals tomicroorganisms and microbial processesin agricultural soils: a review. Soil Biologyand Biochemistry 30, 1389–1414.
Gong, P., Siciliano, S.D., Greer, C.W., Paquet,L., Hawari, J. and Sunahara, G.I. (1999)Effects and bioavailability of 2,4,6-trinitro-toluene in spiked and field-contaminatedsoils to indigenous microorganisms.Environmental Toxicology and Chemistry 18,2681–2688.
Goyal, S., Chander, K., Mundra, M.C. andKapoor, K.K. (1999) Influence of inorganicfertilizers and organic amendments onsoil organic matter and soil microbialproperties under tropical conditions.Biology and Fertility of Soils 29, 196–200.
Granhall, U. (1999) Microbial biomass deter-minations. Comparisons between somedirect and indirect methods. COST 831 –Working Group 4 Meeting, Granada, Spain,15–16 July, 1999.
Granli, T. and Bøckman, O.C. (1994) Nitrousoxide from agriculture. Norwegian Journalof Agricultural Sciences Supplement 12,1–128.
Grisi, B., Grace, C., Brookes, P.C., Benedetti,A. and Dell’Abate, M.T. (1998)Temperature effects on organic matterand microbial dynamics in temperate andtropical soils. Soil Biology and Biochemistry30, 1309–1315.
Guilbault, G.C. and Kramer, D.N. (1964)Fluorometric detection of lipase, acylase,alpha- and gamma-chymotrypsin andinhibitors of these enzymes. AnalyticalChemistry 36, 409–412.
Hadas, A., Kautsky, L. and Portnoy, R. (1998)Mineralization of composted manure and
microbial dynamics in soil as affected bylong-term nitrogen management. SoilBiology and Biochemistry 28, 733–738.
Hansson, A.J., Andrén, O., Boström, S.,Boström, U., Clarholm, M., Lagerlöf, J.,Lindberg, T., Paustian, K., Pettersson, R.and Sohlenius, B. (1990) Structure of theagroecosystem. In: Andrén, O., Lindberg,T., Paustian, K. and Rosswall, T. (eds)Ecology of Arable Land. Organisms, Carbonand Nitrogen Cycling. (Ecological Bulletin)40, 41–83.
Harris, D. and Paul, E.A. (1994)Measurement of bacterial growth rates insoil. Applied Soil Ecology 1, 277–290.
Hart, S.C. and Binkley, D. (1985) Correlationsamong indices for forest nutrient avail-ability in fertilized and unfertilizedloblolly pine plantations. Plant and Soil 85,11–21.
Hart, S.C., Stark, J.M., Davidson, E.A. andFirestone, M.K. (1994) Nitrogen mineral-ization, immobilisation and nitrification.In: Weaver, R.W., Angle, J.S. andBottomley, P.D. (eds) Methods of SoilAnalysis. Part 2, Microbiological andBiochemical Properties. Soil Science Societyof America, Madison, Wisconsin,pp. 985–1018.
Hatch, D.J., Jarvis, S.C. and Reynolds, S.E.(1991) An assessment of the contributionof net mineralization to N cycling in grassswards using a field incubation method.Plant and Soil 138, 23–32.
Hauck, R.D., Melsted, S.W. and Yankwich,P.E. (1958) Use of N-isotope distributionin nitrogen gas in the study of denitrifica-tion. Soil Science 86, 287–291.
Hayes, J.E., Richardson, A.E. and Simpson,R.J. (2000) Components of organic phos-phorus in soil extracts that are hydrolysedby phytase and acid phosphatase. Biologyand Fertility of Soils 32, 279–286.
Haynes, R.J. and Tregurtha, R. (1999) Effectsof increasing periods under intensivearable vegetable production on biological,chemical and physical indices of soil qual-ity. Biology and Fertility of Soils 28, 259–266.
Heinemeyer, O. and Kaiser, E.A. (1996)Automated gas injector system for gaschromatography: atmospheric nitrous
176 Soil Microbial Activity

oxide analysis. Soil Science Society AmericaJournal 60, 808–811.
Hynes, R.K. and Knowles, R. (1983)Inhibition of chemoautotrophic nitrifica-tion by sodium chlorate and sodium chlo-rite: a reexamination. Appied andEnvironmental Microbiology 45, 1178–1182.
Jarvis, S.C., Hatch, D.J. and Lovell, R.D.(2001) An improved soil core incubationmethod for the field measurement of den-itrification and net mineralization usingacetylene inhibition. Nutrient Cycling inAgroecosystems 59, 219–225.
Jeffrey, W.H. and Paul, J.H. (1988)Underestimation of DNA synthesis by[3H]thymidine incorporation in marinebacteria. Applied and EnvironmentalMicrobiology 54, 3165–3168.
Johansson, M., Pell, M. and Stenström, J.(1998) Kinetics of substrate-induced respi-ration (SIR) and denitrification: applica-tions to a soil amended with silver. Ambio27, 40–44.
Jones, R.B., Gilmour, C.C., Stoner, D.L., Weir,M.M. and Tuttle, J.H. (1984) Comparisonof methods to measure acute metal andorganometal toxicity to natural aquaticmicrobial communities. Applied andEnvironmental Microbiology 47, 1005–1011.
Juma, N.G. and Tabatabai, M.A. (1978)Distribution of phosphomonoesterases insoils. Soil Science 126, 101–108.
Kandeler, E., Marschner, P., Tscherko, D.,Gahoonia, T. and Nielsen, N. (2002)Microbial community composition andfunctional diversity in the rhizosphere ofmaize. Plant and Soil 238, 301–312.
Keeney, D.R. (1982) Nitrogen availabilityindexes. In: Page, A.L. et al. (eds) Methods ofSoil Analysis. Part 2, 2nd edn. AgronomyMonograph 9, Soil Science Society ofAmerica, Madison, Wisconsin, pp. 711–733.
Keeney, D.R. and Nelson, D.W. (1982)Nitrogen – inorganic forms. In: Black,C.A., Evans, D.D., White, J.L., Ensminger,L.E. and Clark, F.E. (eds) Methods of SoilAnalysis, Part 2. American Society ofAgronomy, Madison, Wisconsin, pp.682–687.
Kilham, K. (1985) A physiological determina-tion of the impact of environmental stress
on the activity of microbial biomass.Environmental Pollution 38, 283–294.
Kilham, K. (1987) A new perfusion systemfor the measurement and characterizationof potential rates of soil nitrification. Plantand Soil 97, 227–232.
Kirchman, D., K’Nees, E. and Hodson, R.(1985) Leucine incorporation and itspotential as a measure of protein synthe-sis by bacteria in natural aquatic ecosys-tems. Applied and EnvironmentalMicrobiology 49, 559–607.
Kirkham, D. and Bartholomew, W.V. (1954)Equations for following nutrient transfor-mations in soil utilizing data. Soil ScienceSociety American Proceedings 18, 33–34.
Klemedtsson, L., Hansson, G. and Mosier,A.R. (1990) The use of acetylene for thequantification of N2 and N2O productionfrom biological processes in soil. In:Revsbech, N.P. and Sorensen, J. (eds)Denitrification in Soil and Sediment, Vol. 56.Plenum Press, New York, pp. 167–180.
Koops, H.P. and Pommerening-Röser, A.(2001) Distribution and ecophysiology ofthe nitrifying bacteria emphasizing cul-tured species. FEMS Microbial Ecology 37,1–9.
Kowalchuk, G.A. and Stephen, J.R. (2001)Ammonia-oxidizing bacteria: a model formolecular microbial ecology. AnnualReview in Microbiology 55, 485–529.
Kowalchuk, G.A., Stephen, J.R., de Boer, W.,Prosser, J.I., Embley, T.M. andWoldendorp, J.W. (1997) Analysis ofammonia-oxidizing bacteria of the betasubdivision of the class proteobacteria incoastal sand dunes by denaturing gradi-ent gel electrophoresis and sequencing ofPCR-amplified 16s ribosomal DNA frag-ments. Applied and EnvironmentalMicrobiology 63, 1489–1497.
Ladd, J.N., Forster, R.C., Nannipieri, P. andOades, J.M. (1996) Soil structure and bio-logical activity. Soil Biochemistry 9, 23–78.
Lober, R.W. and Reeder, J.D. (1993) Modifiedwaterlogged incubation method forassessing nitrogen mineralization in soilsand soil aggregates. Soil Science SocietyAmerican Journal 57, 400–403.
Mader, T. (1994) Auswirkungen einer prax-
Soil Microbial Activity 177

isüblichen Anwendung von Gardoprim(Terbuthylazin) auf mikrobielle und bio-chemische Stoffumsetzungen sowie seinabbauverhalten im Feld- undLaborversuch. Hohenheimer BodenkundlicheHefte, 19.
Madsen, E.L. (1996) A critical analysis ofmethods for determining the compositionand biogeochemical activities of soilmicrobial communities in situ. In: Stotzky,G. and Bollag, J.M. (eds) Soil Biochemistry,Vol. 9. Marcel Dekker, New York,pp. 287–370.
Malone, J.P., Stevens, R.J. and Laughlin, R.J.(1998) Combining the 15N and acetyleneinhibition techniques to examine theeffect of acetylene on denitrification. SoilBiology and Biochemistry 30, 31–37.
Mamilov, A.Sh., Byzov, B.A., Zvyagintsev,D.G. and Dilly, O.M. (2001) Predation onfungal and bacterial biomass in a soddy-podzolic soil amended with starch, wheatstraw and lucerne meal. Applied SoilEcology 16, 131–139.
Mary, B., Recous, S. and Robin, D. (1998) Amodel for calculating nitrogen fluxes insoil using 15N tracing. Soil Biology andBiochemistry 30, 1963–1979.
McCarty, G.W. and Bremner, J.M. (1986)Inhibition of nitrification in soil byacetylenic compounds. Soil Science SocietyAmerican Journal 50, 1198–1201.
Meisinger, J.J. (1984) Evaluating plant avail-able N in soil crop systems. In: Hauck,R.D. et al. (eds) Nitrogen in Crop Production.American Society of Agronomy, Madison,Wisconsin, pp 391–416.
Michel, P.H. and Bloem, J. (1993) Conversionfactors for estimation of cell productionrates of soil bacteria from tritiated thymi-dine and tritiated leucine incorporation.Soil Biology and Biochemistry 25, 943–950.
Mogge, B., Kaiser, E.A. and Munch, J.C.(1998) Nitrous oxide emissions and deni-trification N-losses from forest soils in theBornhöved Lake region (NorthernGermany). Soil Biology and Biochemistry 30,703–710.
Mogge, B., Kaiser, E.-A. and Munch, J.C.(1999) Nitrous oxide emissions and deni-trification N-losses from agricultural soils
in the Bornhöved Lake region: influenceof organic fertilizers and land-use. SoilBiology and Biochemistry 31, 1245–1252.
Moreno, J., Garcia, C., Landi, L., Falchini, L.,Pietramellara, G. and Nannipieri, P. (2001)The ecological dose value (ED50) forassessing Cd toxicity on ATP content anddehydrogenase and urease activities ofsoil. Soil Biology and Biochemistry 33,483–489.
Moriarty, D.J.W. (1986) Measurement of bac-terial growth rates in aquatic systemsfrom rates of nucleic acid synthesis.Advances in Microbial Ecology 9, 245–292.
Mosier, A.R. and Schimel, D.S. (1993)Nitrification and denitrification. In:Knowles, R. and Blackburn, T.H. (eds)Nitrogen Isotope Techniques. AcademicPress, San Diego, California, pp. 181–208.
Mosier, A.R., Guenzi, W.D. and Schweizer,E.E. (1986) Field denitrification estimationby nitrogen-15 and acetylene inhibitiontechniques. Soil Science Society AmericanJournal 50, 831–833.
Myhre, G., Highwood, E.K., Shine, K.P. andStordal, F. (1998) New estimates of radia-tive forcing due to well mixed greenhousegases. Geophysical Research Letters 25,2715–2718.
Myrold, D.D. (1990) Measuring denitrifica-tion in soils using 15N techniques. In:Revsbech, N.P. and Sorensen, J. (eds)Denitrification in Soil and Sediment. PlenumPress, New York, pp. 181–198.
Myrold, D.D. and Tiedje, J.M. (1986)Simultaneous estimation of several nitro-gen cycle rates using 15N: theory andapplication. Soil Biology and Biochemistry18, 559–568.
Nannipieri, P., Kandeler, E. and Ruggiero, P.(2002) Enzyme activities and microbiolog-ical and biochemical processes in soil. In:Burns, R.G. and Dick, R.P. (eds) Enzymesin the Environment. Marcel Dekker, NewYork, pp. 1–33.
Nicolaisen, M.H. and Ramsing, N.B. (2002)Denaturing gradient gel electrophoresis(DGGE) approaches to study the diversityof ammonia-oxidizing bacteria. Journal ofMicrobiological Methods 50, 89–203.
Nishio, T., Kanamori, T. and Fjuimoto, T.
178 Soil Microbial Activity

(1985) Nitrogen transformation in an aer-obic soil as determined by a 15NH4
+ dilu-tion technique. Soil Biology andBiochemistry 17, 149–154.
Obbard, J.P. (2001) Measurement of dehydro-genase activity using 2-p-iodophenyl-3-p-nitrophenyl-5-phenyltetrazolium chloride(INT) in the presence of copper. Biologyand Fertility of Soils 33, 328–330.
Öhlinger, R., Beck, T., Heilmann, B. andBeese, F. (1996) Soil respiration. In:Schinner, F., Öhlinger, R., Kandeler, E. andMargesin, R. (eds) Methods in Soil Biology.Springer-Verlag, Berlin, pp. 93–110.
Orchard, V.A. and Cook, F.J. (1983)Relationships between soil respirationand soil moisture. Soil Biology andBiochemistry 15, 447–453.
Palmborg, C. and Nordgren, A. (1993) Soilrespiration curves, a method to test theabundance, activity and vitality of themicroflora in soils. In: Torstensson, L.(ed.) Guidelines. Soil Biological Variables inEnvironmental Hazard Assessment. Report4262, Swedish EPA, Stockholm,pp. 149–156.
Pankhurst, C.E., Hawke, B.G., McDonald,H.J., Kirkby, C.A., Buckerfield, J.C.,Michelsen, P., O’Brian, K.A., Gubta,V.V.S.R. and Double, B.M. (1995)Evaluation of soil biological properties aspotential bioindicators of soil health.Australian Journal of ExperimentalAgriculture 35, 1015–1028.
Pant, H.K. and Warman, P.R. (2000)Enzymatic hydrolysis of soil organicphosphorus by immobilized phos-phatases. Biology and Fertility of Soils 30,306–311.
Parkin, T.B., Kaspar, H.F., Sexstone, A.J. andTiedje, J.M. (1984) A gas-flow soil coremethod to measure field denitrificationrates. Soil Biology and Biochemistry 16,323–330.
Parkin, T.B., Sexstone, A.J. and Tiedje, J.M.(1985) Comparison of field denitrificationrates by acetylene-based soil core andnitrogen-15 methods. Soil Science SocietyAmerican Journal 49, 94–99.
Pasqual, J.A., Hernandez, T. and Garcia, C.(2001) In: Benedetti, A. et al. (eds) COST
Action 831 – Joint Meeting of WorkingGroups Biotechnology of Soil Monitoring,Conservation and Remediation. RoundTable: Defining Soil Quality. Rome, 10–11December 1998. EUR 19225 – COSTAction 831 – Report of 1997–1998.European Communities, Luxembourg,p. 310.
Paul, E.A. and Clark, F.E. (1989) SoilMicrobiology and Biochemistry. AcademicPress, Inc., San Diego, California, 275 pp.
Paustian, K., Bergström, L., Jansson, P.E. andJohnsson, H. (1990) Ecosystem dynamics.In: Andrén, O., Lindberg, T., Paustian, K.and Rosswall, T. (eds) Ecology of ArableLand. Organisms, Carbon and NitrogenCycling. (Ecological Bulletin) 40, 153–180.
Persson, T., Bååth, E., Clarholm, M.,Lundkvist, B.E. and Sohlenius, H. (1980)Trophic structure, biomass dynamics andcarbon metabolism of soil organisms in aScots pine forest. In: Ågren, G.I.,Andersson, F., Falk, S.O., Lohm, U. andPerttu, K. (eds) Structure and Function ofNorthern Coniferous Forests. (EcologicalBulletin) 32, 419–459.
Perucci, P., Vishetti, C. and Battistoni, F.(1999) Rimsulfuron in a silty clay loamsoil: effects upon microbiological and bio-chemical properties under varying micro-cosm conditions. Soil Biology andBiochemistry 31, 195–204.
Perucci, P., Dumontet, S., Bufo, S.A.,Mazzatura, A. and Casucci, C. (2000)Effects of organic amendment and herbi-cide treatment on soil microbial biomass.Biology and Fertility of Soils 32, 17–23.
Powlson, D.S. and Barraclough, D. (1993)Mineralization and assimilation insoil–plant system. In: Knowles, R. andBlack, T.H. (eds) Nitrogen IsotopeTechniques. Academic Press, San Diego,California, pp. 209–242.
Prescott, D.M. and James, T.W. (1955)Culturing of Amoeba proteus onTetrahymena. Experimental Cell Research 8,256–258.
Prosser, J.I. (1989) Autotrophic nitrification inbacteria. Advances in Microbial Physiology30, 125–181.
Recous, S., Luxhoi, J., Fillery, I.R.P., Jensen,
Soil Microbial Activity 179

L.S. and Mary, B. (2001) Soil temperatureeffects on N mineralisation, immobilisa-tion and nitrification using 15N dilutiontechniques. Abstracts of the 11th NitrogenWorkshop, 9–12 September, Reims, France.
Reddy, G.B., Faza, A. and Bennett, R. (1987)Activity of enzymes in rhizosphere andnon-rhizosphere soils amended withsludge. Soil Biology and Biochemistry 19,203–205.
Robarts, R.D. and Zohary, T. (1993) Fact orfiction – bacterial growth rates and pro-duction as determined by [methyl-3H]-thymidine? Advances in Microbial Ecology13, 371–425.
Rotman, B. and Papermaster, B.W. (1966)Membrane properties of living mam-malian cells as studied by enzymatichydrolysis of fluorogenic esters.Proceedings of the National Academy ofScience USA 55, 134–141.
Rotthauwe, J.H., Witzel, K.P. and Liesack, W.(1997) The ammonia monooxygenasestructural gene amoa as a functionalmarker: molecular fine-scale analysis ofnatural ammonia-oxidizing populations.Applied and Environmental Microbiology 63,4704–4712.
Rudaz, A.O., Walti, E., Kyburz, G., Lehmann,P. and Fuhrer, J. (1999) Temporal variationin N2O and N2 fluxes from a permanentpasture in Switzerland in relation to man-agement, soil water content and soil tem-perature. Agriculture, Ecosystems andEnvironment 73, 83–91.
Ryden, J.C., Lund, L.J., Letey, J. and Focht,D.D. (1979) Direct measurement of deni-trification loss from soils. II. Developmentand application of field methods. SoilScience Society American Journal 43,110–118.
Ryden, J.C., Skinner, J.H. and Nixon, D.J.(1987) Soil core incubation system for thefield measurement of denitrification usingacetylene-inhibition. Soil Biology andBiochemistry 19, 753–757.
Sahrawat, K.L. (1983) Mineralization of soilorganic nitrogen under waterlogged con-dition in relation to other properties oftropical rice soils. Australian Journal of SoilResearch 21, 133–138.
Sahrawat, K.L. and Ponnamperuma, F.N.(1978) Measurement of exchangeableNH4
+ in tropical land soils. Soil ScienceSociety of America Journal 42, 282–283.
Schimmel, E.L., Firestone, M.K. and Killham,K.S. (1984) Identification of heterotrophicnitrification in a sierran forest soil. Appliedand Environmental Microbiology 48,802–806.
Schinner, F., Oehlinger, R. and Kandeler, E.(1992) Bodenbiologische Arbeitsmethoden.Springer, Berlin.
Schmidt, E.L. and Belser, L.W. (1994)Autotrophic nitrifying bacteria. In:Weaver et al. (eds) Methods in Soil AnalysisPart 2, Microbiological and BiochemicalProperties, SSSA Book Series No. 5. SoilScience Society of America, Madison,Wisconsin, pp. 159–177.
Schneider, K., Turrion, M.-B. and Gallardo, J.-F. (2000) Modified method for measuringacid phosphatase activities in forest soilswith high organic matter content.Communications in Soil Science and PlantAnalysis 31, 3077–3088.
Servais, P., Martinez, J., Billen, G. and Vives-Rego, J. (1987) Determining [3H]thymi-dine incorporation into bacterioplanktonDNA: improvement of the method byDNase treatment. Applied andEnvironmental Microbiology 53, 1977–1979.
Shaw, L.J. and Burns, R.G. (1996)Construction and equilibration of arepacked soil column microcosm. SoilBiology and Biochemistry 28, 1117–1120.
Shaw, L.J. and Burns, R.G. (2003)Biodegradation of organic pollutants inthe rhizosphere. Advances in AppliedMicrobiology 53, 1–60.
Sparling, G.P. (1997) Soil microbial biomass,activity and nutrient cycling. In:Pankhurst, C.E., Doube, B.M. and Gupta,V.V.S.R. (eds) Biological Indicators of SoilHealth. CAB International, Wallingford,UK, pp. 97–120.
Speir, T.W. and Ross, D.J. (1978) Soil phos-phatase and sulphatase. In: Burns, R.G.(ed.) Soil Enzymes. Academic Press,London, pp. 197–250.
Speir, T.W. and Ross, D.J. (2002) Hydrolyticenzyme activities to assess soil degrada-
180 Soil Microbial Activity

tion and recovery. In: Burns, R.G. andDick, R.P. (eds) Enzymes in theEnvironment. Marcel Dekker, New York,pp. 407–431.
Stanford, G. (1982) Assessment of soil nitro-gen availability. In: Stevenson, F.J. (ed.)Nitrogen in Agricultural Soils. AgronomyMonograph 22. ASA and SSSA, Madison,Wisconsin.
Stanford, G. and Smith, S.J. (1972) Nitrogenmineralization potentials of soils. SoilScience Society American Proceedings 38,99–102.
Stark, J.M. and Firestone, M.K. (1996) Kineticcharacteristics of ammonium-oxidizercommunities in a California oak wood-land-annual grassland. Soil Biology andBiochemistry 28, 1307–1317.
Steen, E. (1990) Agricultural outlook. In:Andrén, O., Lindberg, T., Paustian, K. andRosswall, T. (eds) Ecology of Arable Land.Organisms, Carbon and Nitrogen Cycling.(Ecological Bulletin) 40, 181–192.
Stenberg, B., Johansson, M., Pell, M., Sjödal-Svensson, K., Stenström, J. andTorstensson, L. (1998a) Microbial biomassand activities in soil as affected by frozenand cold storage. Soil Biology andBiochemistry 30, 393–402.
Stenberg, B., Pell, M. and Torstensson, L.(1998b) Integrated evaluation of varia-tions in biological, chemical and physicalsoil properties. Ambio 27, 9–15.
Stenström, J., Stenberg, B. and Johansson, M.(1998) Kinetics of substrate-induced respi-ration (SIR): theory. Ambio 27, 35–39.
Stenström, J., Svensson, K. and Johansson,M. (2001) Reversible transition betweenactive and dormant microbial states insoil. FEMS Microbiology Ecology 36,93–104.
Stephen, J.R., Chang, Y.J., Macnaughton, S.J.,Kowalchuk, G.A., Leung, K.T., Flemming,C.A. and White, D.C. (1999) Effect of toxicmetals on indigenous soil p-subgroupproteobacterium ammonia oxidizer com-munity structure and protection againsttoxicity by inoculated metal-resistant bac-teria. Applied and EnvironmentalMicrobiology 65, 95–101.
Stevens, R.J. and Laughlin, R.J. (1998)
Measurement of nitrous oxide and di-nitrogen emissions from agricultural soils.Nutrient Cycling in Agroecosystems 52,131–139.
Stevenson, F.J. (1985) The Internal Cycle ofNitrogen in Soil. Cycle of Soil C, N, P, S,Micronutrients. J. Wiley & Sons, NewYork, pp. 155–215.
Stotzky, G. (1965) Microbial respiration. In:Black C.A. et al. (eds) Methods in SoilAnalysis, Part 2. Agronomy Monograph 9.ASA, Madison, Wisconsin, pp. 1550–1572.
Stoyan, H., de Polli, H., Bohm, S., Robertson,G.P. and Paul, E.A. (2000) Spatial hetero-geneity of soil respiration and relatedproperties at the plant scale. Plant and Soil222, 203–214.
Svensson, K. (1999) Effect of different crop-ping systems on soil microbial activities.COST 831 – Working Group 4 Meeting,Granada, Spain, 15–16 July.
Svensson, K. and Pell, M. (2001) Soil micro-bial tests for discriminating between dif-ferent cropping systems and fertilizerregimes. Biology and Fertility of Soils 33,91–99.
Tabatabai, M.A. and Bremner, J.M. (1969)Use of p-nitrophenyl phosphate for assayof soil phosphatase activity. Soil Biologyand Biochemistry 1, 301–307.
Tabatabai, M.A. and Dick, W.A. (2002)Enzymes in soil: research and develop-ments in measuring activities. In: Burns,R.G. and Dick, R.P. (eds) Enzymes in theEnvironment. Marcel Dekker, New York,pp. 567–596.
Tarafdar, J.C. and Jungk, A. (1987)Phosphatase activity in the rhizosphereand its relation to the depletion of soilorganic phosphorus. Biology and Fertilityof Soils 3, 199–204.
Tate, R.L. (2002) Microbiology and enzymol-ogy of carbon and nitrogen cycling. In:Burns, R.G. and Dick, R.P. (eds) Enzymesin the Environment. Marcel Dekker, NewYork, pp. 227–248.
Taylor, J., Wilson, B., Mills, M. and Burns, R.(2002) Comparison of microbial numbersand enzymatic activities in surface soilsand subsoils using various techniques.Soil Biology and Biochemistry 34, 387–401.
Soil Microbial Activity 181
Terry, R.E. and Duxbury, J.M. (1985)Acetylene decomposition in soils. SoilScience Society American Journal 49, 90–94.
Thorn, P.M. and Ventullo, R.M. (1988)Measurement of bacterial growth rates insubsurface sediments using the incorpo-ration of tritiated thymidine into DNA.Microbial Ecology 16, 3–16.
Tiedje, J.M., Simkins, S. and Groffman, P.M.(1989) Perspectives on measurement ofdenitrification in the field including rec-ommended protocols for acetylene basedmethods. Plant and Soil 115, 261–284.
Torstensson, L. and Stenström, J. (1986)‘Basic’ respiration rate as a tool for predic-tion of pesticide persistence in soil.Toxicity Assessment: An InternationalQuarterly 1, 57–72.
Torstensson, M., Pell, M. and Stenberg, B.(1998) Need of strategy for evaluation ofsoil quality data: arable soil. Ambio 27, 4–8.
Trasar-Cepeda, M. and Gilsotres, F. (1987)Phosphatase-activity in acid high organic-matter soils in Galacia (NW Spain). SoilBiology and Biochemistry 19, 281–287.
Trasar-Cepeda, C., Leiros, M., Seoane, S. andGil-Sotres, F. (2000) Limitations of soilenzymes as indicators of soil pollution.Soil Biology and Biochemistry 32, 1867–1875.
Trevors, J.T. (1984a) Effect of substrate con-centration, inorganic nitrogen, O2 concen-tration, temperature and pH ondehydrogenase activity in soil. Plant andSoil 77, 285–293.
Trevors, J.T. (1984b) Dehydrogenase activityin soil: a comparison between the INTand TTC assay. Soil Biology andBiochemistry 16, 673–674.
Trevors, J.T., Mayfield, C.I. and Inniss, W.E.(1982) Measurement of electron transportsystem (ETS) activity in soil. MicrobialEcology 8, 163–168.
Vekemans, X., Godden, B. and Penninckx,M.J. (1989) Factor-analysis of the relation-ships between several physiochemicaland microbiological characteristics ofsome Belgian agricultural soils. SoilBiology and Biochemistry 21, 53–58.
Vischetti, C., Perucci, P. and Scarponi, L.(1997) Rimsulfuron in soil: effect of per-sistence on growth and activity of micro-bial biomass at varying environmentalconditions. Biogeochemistry 39, 165–176.
vonMersi, W. and Schinner, F. (1991) Animproved and accurate method for deter-mining the dehydrogenase activity ofsoils with iodonitrotetrazolium chloride.Biology and Fertility of Soils 11, 216–220.
Waldrop, M.P., Balser, T.C. and Firestone,M.K. (2000) Linking microbial communitycomposition to function in a tropical soil.Soil Biology and Biochemistry 32, 1837–1846.
Waring, S.A. and Bremner, J.M. (1964)Ammonium production in soil underwaterlogged conditions as an index ofnitrogen availability. Nature 201, 951–952.
Watts, S.H. and Seitzinger, S.P. (2000)Denitrification rates in organic and min-eral soils from riparian sites: a compari-son of N2 flux and acetylene inhibitionmethods. Soil Biology and Biochemistry 32,1383–1392.
Welp, G. (1999) Inhibitory effects of the totaland water-soluble concentrations of ninedifferent metals on the dehydrogenaseactivity of a loess soil. Biology and Fertilityof Soils 30, 132–139.
Yakovchenko, V., Sikora, L.J. and Kaufmann,D.D. (1996) A biologically based indicatorof soil quality. Biology and Fertility of Soils21, 245–251.
Yakovchenko, V., Sikora, L.J. and Millner,P.D. (1998) Carbon and nitrogen mineral-ization of added particulate and macroor-ganic matter. Soil Biology and Biochemistry30, 2139–2146.
Yoshinari, T. and Knowles, R. (1977)Acetylene inhibition of nitrous oxidereduction by denitrifying bacteria.Biochem Biophys Res Commun 69, 705–710.
Zibilske, L.M. (1994) Carbon mineralization.In: Weaver, R.W. et al. (eds) Methods of SoilAnalysis, Part 2. Microbiological andBiochemical Properties. SSSA, Madison,Wisconsin, pp. 835–863.
182 Soil Microbial Activity

8 Soil Microbial Diversity andCommunity Composition
8.1 Estimating Soil Microbial Diversity and CommunityComposition
JAN DIRK VAN ELSAS1 AND MICHIEL RUTGERS2
1Department of Microbial Ecology, Groningen University,Kerklaan 30, NL-9750 RA Haren, The Netherlands; 2NationalInstitute for Public Health and the Environment, Antonie vanLeeuwenhoeklaan 9, NL-3721 MA Bilthoven, The Netherlands
Soils are complex and very heterogeneous environments that may containas many as 10 billion or more bacterial cells per gram, in addition to largenumbers of other microorganisms such as fungi and protozoa, as well asseveral macroorganisms, collectively called macrofauna. Although microor-ganisms determine the chemical balance in the soil, interact with plants inpositive and negative ways, and even influence soil structure, we have littleunderstanding of the structure and dynamics of these microbial communi-ties, as well as of their enormous diversity. However, over the past decadeour perspective with respect to the microbial diversity and communitystructure of soils has improved enormously. This is in large part due to therapid development and application of culture-independent methods thatallow the characterization of soil microbial communities. For a long period,spanning almost 100 years, plating (counting colony-forming units, CFU)on different media was the technique of choice to investigate the microbialdiversity of soil. However, the relative proportion of bacteria that growreadily on agar plates with common bacteriological media to those countedby microscopical approaches varies from 0.1–1% in pristine forest soils to10% in environments such as arable soil. This implies that assessments ofthe microbial diversity of these habitats, in terms of species richness andabundance, are grossly underestimated (Amann et al., 1995). Since so fewsoil microorganisms can be cultivated by standard techniques, the new
©CAB International 2006. Microbiological Methods for Assessing Soil Quality(eds J. Bloem et al.) 183

culture-independent approaches, in particular cloning, sequencing andfingerprinting of ribosomal RNA (rRNA) genes, have already revealedevidence for the existence of an astonishing wealth of novel organisms, ofwhich many are quite different from those known among the culturedisolates (Liesack and Stackebrandt, 1992). Still, as of today, any estimationsof the extant numbers of, for example, prokaryotic species are mere guesses,but estimates of 4000 or more species per g of soil have been suggested(Torsvik et al., 1990). In addition to continuously increasing our knowledgeof the microbial diversity in soils, culture-independent methods, several ofwhich are described in this chapter, also allow us to better understand thestructure and dynamics of soil microbial communities. These methodsallow us to monitor changes in either the overall microbial or bacterialcommunity structure, or in more detail, changes in the prevalence of phylo-genetic subgroups.
The ultimate goal of most assessments is to understand the overallfunctioning of soil microbial communities in terms of, for example, the fluxof energy, as well as resources, through the system, and how this is influ-enced by natural environmental changes as well as human impact. Manymethods are currently available that aid in the description of the diversityand functioning of soil microbial communities (summarized in Table 8.1).The methods described in this chapter form a subset of this wide range ofmethods. Together, they allow us to describe soil microbial communities inan indirect way, each with their limitations. However, they may be appliedas routine methods in a comparative fashion, in order to provide a pictureof soil microbial communities from three angles.
On the other hand, in order to understand the final outcome of themany functions carried out by different microbial populations, or by coop-eration between such populations, we need to better understand the struc-ture of the microbial communities of soil. Answers to questions such as:what species are there, what is the relative abundance of the different popu-lations, are the organisms active or dormant and do they interact (via chem-ical signals, intermediate metabolites or by genetic interactions) arefundamental for a better understanding of the functioning and robustnessof the microbial community. To answer these questions, methods areneeded that can distinguish between the different populations present,quantify their abundance (population sizes) and, ideally, locate them in situ.Thus, there has been a perceived need for sensitive methods that can iden-tify which microbial populations are affected by a certain environmentalchange (e.g. in time or upon human impact). One example is a recent studythat has shown that long-term herbicide applications clearly affect thestructure and diversity of specific microbial groups, as shown by 16S rRNAmolecular community fingerprinting (Seghers et al., 2003). The fingerprint-ing method, based on universal bacterial primers, did not show significantdifferences between the herbicide-treated and the control soil in this study.However, upon zooming in on specific populations or phylogenetic sub-groups, such as the methanotrophs, differences in community structurewere observed. Whether these differences in community structure also
184 J.D. van Elsas and M. Rutgers

Soil M
icrobial Diversity and C
omm
unity Com
position185
Table 8.1. Methods to assess the microbial diversity of soils.
Type Method Description Reference
Phenotypic CLPP Community-level physiological profiling Garland and Mills (1991)Cell components FAME Fatty acid methyl ester Buyer and Drinkwater (1997);
Zelles (1999)PLFA Phospholipid fatty acid analysis Frostegård et al. (1993);
Zelles (1999)Molecular/genetic Cloning/sequencing of amplified Sequence analysis of clone library, resulting Akkermans et al. (1995);
16S ribosomal RNA genes (rDNA) in overview of abundant clone types Kowalchuk et al. (2004)16S rDNA-based PCR and PCR may be followed by any one of the Akkermans et al. (1995);fingerprintings: fingerprinting methods to determine the Kowalchuk et al. (2004);– DGGE/TGGE diversity of the community on the basis of van Elsas et al. (2000)– SSCP the 16S rRNA-based phylogenetic marker – ARDRA– T-RFLP
Dot blot hybridization of 16S Hybridization using short 16S rRNA gene- Heuer et al. (1999)rRNA genes based fragments as probes; probes
generated from V6 region are highly specific per strain
Base composition profiles Expressed as mole percent guanine + Torsvik et al. (1990);cytosine (% G + C) Nüsslein and Tiedje (1998)
Direct PCR detection PCR amplification of target gene followed van Elsas et al. (1997)by detection on gel, or after hybridization
FISH Fluorescent in situ hybridization of 16S rRNA Akkermans et al. (1995);Amann et al. (1995)
DNA reassociation ‘C0t curves’: reassociation time is a Torsvik et al. (1990)measure for the genetic diversity in a sample

translate into a change in function, or in a community that is less fit to dealwith other forms of stress, is not known. It is known that there is a lot offunctional redundancy in soils, which may serve as a buffering capacity incases of severe disturbance. There is, however, no guarantee that the soilmicrobial community will completely take over the role of populations thathave disappeared. How can we estimate or predict whether a slightlychanged microbial community will be as resistant to future stressors asbefore the alteration?
During the past two decades, phenotypic and nucleic acid-basedmethods have been developed to better characterize the structure anddiversity of microbial communities. Table 8.1 lists these methods. Threemethods are discussed and described in detail in this chapter. They are:
1. Soil microbial community DNA- or RNA-based profiling methods.2. Phospholipid-based methods (PLFA, phospholipid fatty acid).3. Community-level physiological profiling (CLPP) tests based on the useof BiologTM metabolic response plates.
All three methods are not based on isolated and purified organisms, butrather give a picture of different aspects of the microbial community basedon a method that uses total macromolecules or cells extracted from soil. Thedifferent methods address different questions and therefore analyse eitherdifferent sub-groups of the total microbial community or different aspectsof the community. Together they form a solid basis for up-to-date soilmicrobial community analyses.
186 J.D. van Elsas and M. Rutgers

8.2 Soil Microbial Community Fingerprinting Based onTotal Community DNA or RNA
JAN DIRK VAN ELSAS,1 EVA M. TOP2 AND KORNELIA SMALLA3
1Department of Microbial Ecology, Groningen University,Kerklaan 30, NL-9750 RA Haren, The Netherlands;2Department of Biological Sciences, 347 Life SciencesBuilding, University of Idaho, Moscow, ID 83844–3051, USA;3Institute for Microbiology, Virology and Biosafety, BiologischeBundesanstalt, Messeweg 11/12, Braunschweig, Germany
Introduction
Soil microbial community DNA and/or RNA extraction methods devel-oped in the past decade have paved the way for direct, cultivation-indepen-dent, studies of microbial diversity in soils. The direct extraction andanalysis of total microbial community DNA or RNA from soil was shown tobe fundamental as the basis to describe the in situ soil microbiota and itsdiversity. After the pioneering work of Torsvik and co-workers in the early1980s (e.g. Torsvik, 1980), the extraction of microbial DNA from soil hasfound its way into basically every soil microbiology laboratory in theworld. During the past decade in particular, a multitude of different extrac-tion protocols has been published. The Molecular Microbial Ecology Manual,first and second editions (Akkermans et al., 1995; Kowalchuk et al., 2004),contains examples of all of these protocols. This proliferation of protocols isoften explained by the large variations between soils in chemical character-istics, which necessitates the application of different protocols to almostevery new soil. However, in the past few years, many laboratories havereplaced their often-laborious ‘pet’ protocols with rapid commercial kit-based protocols, which appear to work comparably well in almost everyinstance. Two current products, the Bio101 and MoBio soil DNA extractionkits, seem to cover most of the kit-based extraction protocols that are cur-rently in use.
All the different protocols, even the kit-based ones, can be grouped intwo basically different types of approaches:
1. Disruption of bonds between microbial cells and soil particles, resultingin the release of largely bacterial or archaebacterial cells, followed by celllysis and extraction.2. Direct cell lysis within the soil matrix in a slurry, and DNA extractionfrom the soil slurry (Ogram et al., 1987).
© CAB International 2006. Microbiological Methods for Assessing Soil Quality(eds J. Bloem et al.) 187

While the former method provides DNA that is considered to be represen-tative for the prokaryotic (bacterial or archaeal) fractions of the microbialcommunity in soil, the latter has been shown to provide higher DNA yields,but is less specific for prokaryotes, as it also contains eukaryotic (fungal)and extracellular DNA (Steffan et al., 1988; van Elsas et al., 2000). Both meth-ods coextract low levels of extracellular DNA from soil, which should betaken into account in the interpretation of results, i.e. whether positivedetection indicates the presence of microbial cells carrying target DNA ormerely extracellular target DNA. In spite of these potential problems, thedirect lysis and extraction method has become the favourite DNA extractionmethod in many laboratories working with soil. On the other hand, recentadvances have shown definite advantages of the indirect methods, withrespect to the specificity of detection (Duarte et al., 1998).
Direct community DNA extraction from soil, as developed by Ogram etal. (1987), has been shown to provide a substantial amount of total soil bac-terial DNA, but was also found to be prone to unavoidable yield losses.Moré et al. (1994) showed that many direct protocols are likely to extractDNA mainly from easy-to-lyse cells, whereas, in particular, the minutemicrobial forms (dwarfs) that are abundant in soil are often excluded. Sincethe original protocols encompassed tedious caesium chloride (CsCl) gradi-ent and/or hydroxyapatite chromatography purification steps, many morerecent protocols have attempted to simplify the original protocol of Ogramet al. (van Elsas et al., 2000). Examples of these simplified protocols can befound in the literature (Pillai et al., 1991; Porteous and Armstrong, 1991;Selenska and Klingmüller, 1991a,b; van Elsas et al., 1991; Tsai and Olson,1992; Smalla et al., 1993a; Duarte et al., 1998; van Elsas et al., 2000). Someprotocols extract RNA in addition to DNA. Others (e.g. Smalla et al., 1993a;Griffith et al., 2000) have been selected as preferred ones in the MolecularMicrobial Ecology Manual (Akkermans et al., 1995; Kowalchuk et al., 2004).
The nucleic acid extraction methods are thus useful for several pur-poses (Trevors and van Elsas, 1989). First, they provide insight into theprevalence and/or activity of specific genes in microbial communities insoil ecosystems, resulting in a better understanding of the functioning andselection of such genes under specific soil conditions. Secondly, by using16S/18S or 23S/25S ribosomal RNA gene sequences as ‘signature mole-cules’ (biomarkers), overall community DNA analysis can be the basis fordescription of microbial community structures. This can be achieved byapplying fingerprinting techniques such as temperature or denaturing gra-dient gel electrophoresis (TGGE or DGGE), terminal restriction fragmentlength polymorphism (T-RFLP), or single-strand conformational polymor-phism (SSCP). These and other methods have been described in theMolecular Microbial Ecology Manual (Akkermans et al., 1995; Kowalchuk et al.,2004). In all three methods, PCR products that represent a ‘picture’ of thesoil microbial community are generated with sets of conserved primers, andare subsequently separated by either one of the aforementioned fingerprint-ing methods. The basis of the fragment separation differs between thesemethods, as follows. SSCP takes advantage of the conformational changes
188 J.D. van Elsas et al.

that occur stochastically in single-stranded DNA (or RNA) molecules, andresult in different migration behaviour in polyacrylamide gels. T-RFLP isbased on the detection, by a fluorescent label, of a terminal fragment pro-duced by enzymatic restriction of the mixed amplicons, thereby identifyingphylotypes with a unique terminal restriction fragment (T-RF). DGGE andTGGE are based on the use of denaturing or temperature gradients, respec-tively. Both gradient types separate double-stranded DNA molecules bytheir specific migration distance, which is determined by their meltingbehaviour resulting from the nucleotide sequence. All of these methodsyield a fingerprint pattern that is a representation of the microbial commu-nity structure in the soil. Depending on the primers used in the initial PCRamplification, different microbial groups can be targeted. For instance, arange of primer sets has become available that target total bacteria, totalfungi or specific bacterial groups, such as the α- or �-subgroups of the pro-teobacteria, the high-G+C% Gram-positives, the pseudomonads, the bacilli,and Burkholderia spp. (Van Overbeek et al., 2005). Primers for specific fungalgroups, such as different vesicular arbuscular mycorrhizae, are also underdevelopment or have been published (de Souza, personal communication).
Thus, the analysis of the various fingerprints obtained from thesemicrobial community DNA extracts allows us to make inferences about thetypes of microorganisms present within the extractable cell fraction of thesoil. This obviously includes the non- or poorly culturable cells, which rep-resent the largest fraction of cells that can be found in most soils (silentmajority). The new angle on soil microbial diversity offered by the directDNA-based methods has already led to the discovery of a wealth of novelorganisms. For instance, several new deep-branching groups of proteobac-teria have recently been described, based on the analysis of 16S ribosomalRNA gene clones generated from DNA of total soil communities.
In this section, we discuss the use of two nucleic acid extraction meth-ods, one DNA extraction method developed and used routinely in our labo-ratories (method I; modified from Smalla et al., 1993a), and oneminiaturized DNA/RNA extraction method (method II) recently imple-mented in our labs (Gomes et al., 2004). We then describe the use of 16Sribosomal RNA gene (rDNA)-based PCR coupled to DGGE analysis todescribe the microbial diversity in soil. It has been shown that restrictableand PCR-amplifiable DNA of relatively high molecular weight can beobtained with the majority of nucleic acid extraction protocols. The micro-bial diversity measurements are, to some extent, dependent on the DNAextraction method used, and hence it is important to use one standardprotocol in routine analyses.
Principle of the Methods
In many laboratories, soil nucleic acid extraction is nowadays performed byusing commercially available kits. The main driving force of this develop-ment has been the relative ease of use and speed offered by these kits.
Soil Microbial Community Fingerprinting 189

Several groups have shown that such kits extract microbial communityDNA which is roughly, but not completely, similar to that obtained by themore traditional approaches. However, for specific purposes, e.g. whennovel results should be compared to previous results obtained by tradi-tional extraction, and in the light of their robustness, the traditional proto-cols are still in use. Below, we present one robust and highly versatiletraditional approach (method I) and one approach modified from a highlyaccepted commercial kit-based method (method II).
Soil nucleic acid extraction method I
This method will primarily extract DNA from soil, although RNA is some-times coextracted. The method is based on an efficient lysis of bacterial cellsin the soil matrix in a slurry, followed by quick removal of soil particles andhumic compounds, using different rapid purification steps. Removal ofhumic material, proteins, RNA and polysaccharides, as well as other soilcompounds (minerals), is required to obtain DNA of sufficient purity forhybridization, restriction or PCR amplification analysis, as well as forcloning purposes (Steffan et al., 1988; Smalla et al., 1993a,b; Tebbe andVahjen, 1993). The protocol is based on the direct extraction protocol ofOgram et al. (1987) for the extraction of DNA from sediments, as adapted bySmalla et al. (1993a), with omission of the laborious and often inefficientpurification via hydroxyapatite chromatography. We adopted bead beatingof soil slurries in a Braun’s cell homogenizer (B. Braun Diessel Biotech,Melsungen, Germany) as the method of choice for cell lysis, since this strat-egy was shown to yield higher quantities of DNA than freeze/thaw lysis(Smalla et al., 1993a). However, in laboratories that do not possess a beadbeater, freeze/thaw-assisted cell lysis (either using or not using lyticenzymes) may be used as an alternative. Careful control of the bead-beatingtime and conditions was essential to obtain DNA of large fragment size.This is important, since severely sheared DNA is unsuitable for PCR-baseddetection of specific genes or analysis of community structure, e.g. usingbacterial 16S ribosomal RNA gene sequences as targets. Following cell lysis,extraction with cold phenol in the presence of soil particles separated theDNA from contaminating compounds, while offering protection fromnucleases. Subsequent precipitation steps with CsCl and potassium acetate(KAc) were included to further remove impurities (proteins, RNA, humicmaterial) from the DNA. For some soils, e.g. several silt loams, DNApreparations thus obtained are of sufficient purity to serve as targets forrestriction, amplification or hybridization analysis. For other soils, e.g. ahigh organic matter loamy sand, a final clean-up step was required, per-formed by adsorption/elution over commercially available glassmilk(Geneclean II kit, Bio 101, La Jolla, California, USA) or resin spin columns(Wizard DNA Clean-Up System, Promega, Madison, Wisconsin, USA). Inour experience, this flexible protocol allows for the extraction and purifica-tion of high-quality DNA from virtually any soil type (van Elsas et al., 1997).
190 J.D. van Elsas et al.

Soil nucleic acid extraction method II
This nucleic acid extraction protocol, which will produce a mixture of DNAand RNA, is based on the use of a commercially available kit (Bio 101, LaJolla, California, USA), which allows an upscaling of the extraction andworking in small reaction vessels. The protocol (Gomes et al., 2004) is amodification of the method described by Hurt et al. (2001). Because harshcell lysis is crucial to obtain nucleic acids representing the microbial com-munity in bulk and rhizosphere soils, a bead-beating step was added to theprotocol of Hurt et al. (2001) to ensure the efficient disruption of the cells.Smalla et al. (1993a) had already shown that bead beating yields higheramounts of DNA than freeze/thaw lysis. To process many samples in paral-lel, a miniaturization of the protocol was required. The whole procedurewas scaled down to 0.5 g (wet weight) of soil. Materials, volumes andequipment were adapted to this miniaturized scale, making the protocolsimple, fast and suitable for processing large numbers of samples within ashort period of time. However, degradation of RNA was still observed withthe modifications mentioned above. Therefore, an RNA-protecting sub-stance, ethanol or isopropanol, was added before breaking up the cells(Gomes et al., 2004), as it is known that this reduces the degree of RNAdegradation. We recommend the addition of ethanol as the most efficientstep to achieve this. The extraction buffer of Hurt et al. (2001) was, thus,slightly modified and kept in the incubation step after bead beating.
PCR amplification
Following extraction and purification of the soil nucleic acids, either theDNA is subjected directly to PCR using standard protocols, or RNA is firstreverse-transcribed, after which the copy DNA (cDNA) produced is PCR-amplified. PCR has become the method of choice for the enrichment of spe-cific target sequences for subsequent detection, or even cloning (Akkermanset al., 1995; Kowalchuk et al., 2004). The method is based on the cyclic enzy-matic ‘inward’ extension of primers at two opposite ends of a DNA tem-plate, resulting in the generation of numerous copies of this template. Theamplification cycle, which consists of template denaturing, primer-to-targetannealing and primer extension steps, is achieved by concerted changes inreaction temperature, most easily performed in a programmable thermalcycler. Due to the high denaturing temperature (often 94°C), DNA poly-merases used in the PCR have to be thermostable, for example the fre-quently used Thermus aquaticus Taq polymerase.
To achieve the desired specificity, primer choice is fundamental, as dis-cussed above. In addition, the primers should be checked as to whetherthey actually perform well in a soil DNA background, as differences withrespect to inhibition of the action of the polymerase have been foundbetween different primer sets. Following PCR, the amplicons obtained
Soil Microbial Community Fingerprinting 191
should be carefully checked for quality and quantity by electrophoresis inagarose gel, using standard procedures (Sambrook et al., 1989).
Denaturing gradient gel electrophoresis (DGGE)
In order to obtain a fingerprint of the soil microbial community targeted,the PCR products obtained with soil DNA as the target are subjected toelectrophoresis over a polyacrylamide gel containing a gradient of denatur-ing substances via standard procedures. This method is described fully inthe Molecular Microbial Ecology Manual (Akkermans et al., 1995; Kowalchuket al., 2004) and is summarized under ‘Procedures’ (below). The method isable to separate DNA fragments of the same length but with differentnucleotide sequences, such as those generated by PCR with 16S or 18S ribo-somal RNA gene-based primers. The separation is based on the differen-tially decreased mobility of the partially melted DNA molecules in alinearly increasing gradient of denaturants (urea and formamide). The melt-ing occurs in discrete melting domains of the molecule. Once the meltingcondition of a particular region is reached, the helical structure of the dou-ble strand turns into a partially melted structure with greatly reducedmigration in the gel. Differences in the sequences of the molecular typeswill cause their migration behaviour to differ. This results in a banding pat-tern, in which each band, in principle, represents a different molecular type.
In practical terms, a GC-clamp (a 40 bp high-guanine-plus-cytosine-containing stretch) has to be attached to the 5’-end of one primer. The clampprevents complete melting of the molecules in the denaturing gradient,which results in partially melted molecules of which the migration is almostcompletely halted.
The DGGE gel has to be run under constant voltage for 4–16 h, after whichthe gel is stained by ethidium bromide, SYBR green or SYBR gold, or by silvernitrate. The stained gel can be visualized under UV light and gel pictures canbe further analysed using relevant computer programs, such as GELCOMPAR
(Rademaker, 1995). To calibrate the method and the analysis, a marker contain-ing amplicons of known position in the gel needs to be run in parallel (definingthe relative positions of bands). If needed, specific bands from the patterns canbe excised from the gel, re-amplified and subjected to sequencing.
Materials and Apparatus
Soil DNA extraction
• Bead beater (Braun’s cell homogenizer) or similar• Glass beads (0.10–0.11 mm)• Common laboratory ware (glass or plastic tubes, microcentrifuge tubes,
vials, pipettes) • Gel electrophoresis apparatus and electricity source
192 J.D. van Elsas et al.

PCR
• Reaction tubes or arrays• Thermal cycling apparatus, e.g. Perkin-Elmer (Nieuwerkerk a/d IJssel,
NL) or similar • Gel electrophoresis apparatus and source
Denaturing gradient gel electrophoresis (DGGE)
• DGGE apparatus, e.g. Ingeny (Goes, The Netherlands), PhorU and power• Gradient maker• Software program for analysis of banding patterns, e.g. GELCOMPAR
(Applied Maths, Sint-Martens-Latem, Belgium)
Chemicals and Solutions
Soil DNA extraction
• Tris-buffered phenol, pH 8.0• 120 mM sodium phosphate buffer, pH 8.0• Lysozyme• 20% sodium dodecyl sulphate (SDS)• Chloroform:iso-amylalcohol (24:1)• 5 M NaCl • Ice-cold 96% ethanol• TE buffer pH 8.0 (10 mM Tris–HCl pH 8.0, 1 mM EDTA pH 8.0;
Sambrook et al., 1989)• 8 M KAc• CsCl• 0.1% diethyl-pyrocarbonate (DEPC) solution
PCR
• Sterile deionized water• Buffer for Taq DNA polymerase Stoffel fragment (Perkin Elmer) 10ו Each dNTP (1 mM) mix, 5ו MgCl2 25 mM • Primer 1 10 µM• Primer 2 10 µM• Formamide• T4 gene 32 protein (5 mg/ml)• Taq DNA polymerase Stoffel fragment (10 U/µl)
Soil Microbial Community Fingerprinting 193

DGGE
• Formamide (Merck, Darmstadt, Germany), deionized using standardprocedure (e.g. by 5% AG 501-X8 resin treatment). Avoid contact withskin and eyes
• AG 501-XS Resin (BioRad Laboratories, Veenendaal, The Netherlands)• Tris base (Boehringer, Mannheim, Germany)• Acetic acid, anhydrous (Merck)• 30% Acrylamide (4K Mix 37.5:1). May cause cancer. Toxic if in contact with
skin and if swallowed• Urea• Ammonium persulphate (APS) (BioRad) 20% in Milli-Q water• TEMED (N,N,N,N’-tetramethyl ethylenediamine) (Sigma, Zwijndrecht,
The Netherlands)• SYBR Gold 1, 10,000× concentrated in dimethyl sulphoxide (DMSO)
(Molecular Probes, Leiden, The Netherlands), per gel:– 250 µl 20× Tris–acetate–EDTA (TAE)– 9.75 ml Milli-Q water– 2.5 µl SYBR Gold 1
• 20× TAE:– 97 g Tris base in 500 ml Milli-Q water; set at pH 7.8 with acetic acid– 32.8 g sodium acetate – 40 ml 0.5 M EDTA (pH 8)– adjust volume to 1l with Milli-Q water
• Solution A:– 100 ml 30% acrylamide 4K mix (37.5:1)– 5 ml 50× TAE– adjust volume to 500 ml with sterile Milli-Q water– store in dark at room temperature
• Solution B:– 100 ml 30% acrylamide 4K mix (37.5:1)– 5 ml 50× TAE– add 50 ml of sterile Milli-Q water– 168 g urea (Wm = 60.06 g/mole)– 160 ml formamide, deionized– adjust volume to 500 ml with sterile Milli-Q water, heat 1 h at 37°C– store in dark at room temperature
• Stacking gel solution:– 26.67 ml 30% acrylamide (37.5:1)– 1 ml 50× TAE– adjust volume to 100 ml with sterile Milli-Q water – store in dark at room temperature
• Loading buffer (6×):– 0.05% (w/v) bromophenol blue– 40% (w/v) sucrose– 0.1 M EDTA (pH 8.0)– 0.5% (w/v) SDS
194 J.D. van Elsas et al.

Procedures
Soil nucleic acid extraction method I
The procedure described will primarily extract microbial DNA from soil. Itis based on the extraction of 10 g of soil. It can be scaled down easily toaccommodate 1–5 g soil samples. The full procedure is often needed toobtain restrictable and amplifiable DNA from a loamy sand soil with highorganic matter content, whereas purification until (and including) purifica-tion step I can be sufficient for DNA from soils with low organic matter con-tent (e.g. silt loam types).
1. Resuspend 10 g of soil in 15 ml 120 mM sodium phosphate buffer pH 8.0(Sambrook et al., 1989) in a 50 ml polypropylene tube.2. Lysozyme treatment (optional):2. (i) Add 75 mg lysozyme to the soil suspension, homogenize and incubate
for 15 min at 37°C.2. (ii) Chill on ice.3. Bead-beating lysis:2. (i) Transfer the soil suspension obtained under 1 (above) to a bead-beat-
ing vial containing 15 g glass beads (0.09–0.13 mm diameter).2. (ii) Homogenize three times for 90 s in the bead beater (MSK cell homo-
genizer, B. Braun Diessel Biotech) at 4000 oscillations/min with intervalsof 15–30 s.
2. (iii) Transfer the lysate to a 45 ml centrifuge or 50 ml polypropylene tube.2. (iv) Add 900 µl of 20% sodium dodecyl sulphate (SDS) and mix well.2. (v) Leave either on ice for 1 h to enhance lysis, or at room temperature
for 15 min.4. Freeze/thaw lysis: As an alternative to bead beating, freeze/thaw lysis can beapplied. However, we strongly recommend bead beating, as it results in morecomplete lysis.2. (i) Add 900 µl of 20% SDS to the soil slurry obtained under 2 (above) and
mix.2. (ii) Freeze at –20°C (or –80°C) for 1 h, then keep at 37°C for 30–45 min.2. (iii) Repeat freeze/thaw cycle twice.5. Extraction and precipitation:2. (i) Add an equal volume of Tris-buffered phenol pH 8.0 (Sambrook et al.,
1989) to the lysed cell slurry obtained under 3 (above).2. (ii) Mix well (manually) and centrifuge for 5 min at 10,000 × g (or 15 min
at 3000 × g for polypropylene tubes) at room temperature.2. (iii) Recover the aqueous (upper) phase in a new centrifuge (or
polypropylene) tube.2. (iv) Back-extract the phenol/soil mixture with 5 ml 120 mM sodium
phosphate buffer (pH 8.0).2. (v) Pool the aqueous phases.2. (vi) Extract the pooled aqueous phases with an equal volume of chloro-
form/iso-amylalcohol (24:1).
Soil Microbial Community Fingerprinting 195

2. (vii) Recover the upper aqueous phase. If a heavy interphase is present,extract the aqueous phase again with an equal volume ofchloroform/iso-amylalcohol.
2. (viii) Add 0.1 volume of 5 M NaCl and two volumes of ice-cold 96%ethanol. Keep at –80°C for 20 min or at –20°C for at least 1 h (oftenovernight).
2. (ix) Centrifuge for 5–10 min at 10,000 × g (or 15–20 min at 3000 × g forpolypropylene tubes).
2. (x) Discard the supernatant and wash the pellet with ice-cold 70%ethanol. Air-dry pellet.
2. (xi) Resuspend pellet in 1–1.5 ml (sterile) TE buffer pH 8.0 (10 mMTris–HCl pH 8.0, 1 mM EDTA pH 8.0). Due to the volume of the pellet,the final volume may be larger.
2. (xii) The solution at this stage is called the crude extract.6. Purification step I: CsCl and KAc precipitations. Perform all steps at roomtemperature, unless stated otherwise.2. (i) Add 0.5 g CsCl to 500 µl crude extract.2. (ii) Incubate for 1–3 h.2. (iii) Centrifuge for 20 min at maximum speed in an Eppendorf centrifuge.2. (iv) Recover the supernatant (≈500 µl) in a 10 ml tube.2. (v) Add 2 ml deionized water and 1.5 ml iso-propanol. Mix and incubate
for a minimum of 5 min at room temperature. 2. (vi) Centrifuge for 15 min at 10,000 × g. When polypropylene tubes are
employed, use maximally at 3000 × g for 20 min. Check degree of pelleting.2. (vii) Discard supernatant and resuspend pellet in 500 µl TE buffer (pH
8.0) and transfer the suspension to a new Eppendorf tube.2. (viii) Add 100 µl 8 M KAc, mix and incubate for 15 min at room tempera-
ture.2. (ix) Centrifuge for 15 min at maximum speed in an Eppendorf
centrifuge.2. (x) Recover supernatant and add 0.6 volume of iso-propanol, mix and
incubate for 5 min at room temperature.2. (xi) Centrifuge for 15 min at full speed in an Eppendorf centrifuge.2. (xii) Wash pellet with ice-cold 70% ethanol, dry and resuspend it in
500 µl TE buffer (pH 8.0).7. Purification step II: Wizard DNA Clean-Up System (Promega, Madison,Wisconsin, USA). The system is based on DNA adsorption to clean-up resinin 6 M guanidine thiocyanate, washing with 80% iso-propanol and elutionwith TE buffer or deionized water. The reagents can be kept at roomtemperature protected from exposure to direct sunlight. 2. (i) Add 1 ml of DNA clean-up resin to 250 µl partially purified DNA
extract (after purification step I) in an Eppendorf tube and mix by gentlyinverting several times.
2. (ii) Attach the syringe barrel of a 2.5 ml disposable luer-lock syringe tothe extension of the Wizard minicolumn.
2. (iii) Pipette the suspension from the Eppendorf tube into the syringebarrel. Using the plunger, push the slurry slowly into the minicolumn.
196 J.D. van Elsas et al.

2. (iv) To wash the column, pipette 2 ml of 80% iso-propanol into thesyringe barrel. Gently push the solution through the minicolumn.
2. (v) Remove syringe and place the minicolumn containing the loadedresin on top of an Eppendorf tube. Centrifuge for 20 s at full speed in anEppendorf centrifuge to dry the resin. Leave the minicolumn at roomtemperature for 5–15 min to evaporate traces of iso-propanol still present.
2. (vi) Transfer the minicolumn to a new Eppendorf tube. Apply 125 µl ofprewarmed (60–70°C) TE buffer (pH 8.0) or deionized water and leavefor 5–10 min. The DNA will remain intact on the minicolumn for up to30 min. Centrifuge for 20 s at full speed in an Eppendorf centrifuge toelute the bound DNA.
2. (vii) Repeat step (vi) using the same Eppendorf tube. The total volume ofeluate will be about 250 µl.
2. (viii) Discard minicolumn. The purified DNA may be stored at 4°C or–20°C.
2. (ix) If needed (as judged by colour and/or suitability for restrictiondigestion or amplification), repeat steps (i)–(viii).
Soil nucleic acid extraction method II
Before starting the extraction, it is important to prepare RNase-free solu-tions and materials. Non-disposable materials must be immersed in 0.1%diethyl-pyrocarbonate (DEPC) solution and autoclaved. Alternatively,glassware and metal spatulas can be baked at 400°C for 4 h to inactivateRNases, or cleaned with RNase Away (Molecular Bio-Products, San Diego,California, USA). All solutions must be prepared with deionized water pre-viously treated with 0.1% (vol/vol) DEPC. Add DEPC to the water andincubate for at least 2 h at 37°C to inactivate RNase. The water must beautoclaved after treatment to destroy DEPC.
1. Add soil samples (up to 0.5 g wet weight) into 2 ml microcentrifugetubes containing 0.4 g glass beads (0.10–0.11 mm). Bacterial pellets (up to0.5 g wet weight) extracted from environmental samples or microbial cul-tures can also be processed by following the next steps. Keep samples onice.2. Add up to 0.8 ml of ethanol to the samples until they are totallyimmersed. Homogenize the samples twice by using the FastPrep FP120bead-beating system (Bio 101, Vista, California, USA) at 5.5 m/s for 30 s.Alternatively, bead beating can be performed by using a cell homogenizer(B. Braun Diessel Biotech) twice for 30 s (4000 oscillations/min). Samplesshould be kept on ice (30 s) between the bead-beating steps.3. Centrifuge the tubes for 5 min at 16,000 × g. Discard the supernatant andadd 1.0 ml of extraction buffer pH 7.0 (1% hexadecyl trimethylammoniumbromide (CTAB), 2% SDS, 1.5 M NaCl, 100 mM sodium phosphate bufferpH 7.0, 10 mM Tris–HCl pH 7.0 and 1 mM EDTA pH 8.0). Mix the samplesthoroughly and incubate for 30 min at 65°C, mixing carefully every 10 min.
Soil Microbial Community Fingerprinting 197

4. Centrifuge the tubes at 16,000 × g for 5 min and transfer the supernatantinto 2 ml tubes containing 1 ml aliquots of chloroform:isoamyl alcohol(24:1) previously chilled on ice. Mix the samples thoroughly and centrifugeat 16,000 × g for 5 min.5. Transfer the upper phase into new microcentrifuge tubes. Precipitate thenucleic acid by addition of 0.6 volume of isopropanol, incubation for atleast 30 min at room temperature, and centrifugation at 16,000 × g for20 min. Pelleted nucleic acids can be either washed with 70% (vol/vol)ethanol for subsequent RNA/DNA separation or directly stocked into0.5 ml 70% (vol/vol) ethanol at –70°C until use.6. Before starting the RNA/DNA recovery procedure, centrifuge suspen-sions at 16,000 × g for 5 min, carefully remove the ethanol and air-dry thepellet containing the nucleic acids for 5 min (do not dry the pellet com-pletely). Dissolve the nucleic acids in 200 µl of DEPC-treated deionizedwater.7. Collect 100 µl of the extracted nucleic acids for RNA purification usingthe RNeasy Mini Kit (QIAGEN GmbH, Germany) according to the manu-facturer’s instructions. If necessary, this step can be repeated for better RNApurification. Use the other 100 µl aliquot for DNA purification using theGENECLEAN spin kit (Q Biogene, USA) according to the manufacturer’sinstructions. Alternatively, to obtain higher yields, DNA and RNA can beseparated at once from the same sample by using the QIAGEN RNA/DNAmini kit (QIAGEN GmbH, Germany). However, according to our experi-ence, further purification steps might be necessary before using the nucleicacids recovered for PCR applications and gene expression analysis.
PCR
Since DNA amplification via PCR is extremely sensitive, care should betaken not to contaminate the sample material or new PCR reaction mixeswith target DNA or PCR products resulting from previous reactions, sincethis might lead to false positives. Aerosols, which may form when samplescontaining target DNA or PCR product are handled, are notorious sourcesof contamination. Therefore, sample preparation and processing, setting upof the PCR reaction mixes, and, in particular, handling of the PCR products,all have to be performed with extreme care. To avoid the occurrence offalse-positive results, we find it adequate to have separate sample prepara-tion, PCR and product analysis rooms, with separate equipment, includingpipettes. In addition, all glass- and plasticware used in the PCR roomshould be exclusively handled there. Further, PCR reagents should only beprepared in the PCR room, and divided in aliquots, which are then stored at–20°C.
A notorious problem when using PCR amplification systems based onconserved regions of the 16S ribosomal RNA gene is the presence of thesebacterial sequences as contaminants in many commercially available
198 J.D. van Elsas et al.

enzymes. To avoid amplification of this instead of target DNA, resulting infalse results when amplifying soil DNA with conserved 16S ribosomal RNAgene-based primers, enzyme solutions as well as PCR reaction mixesshould be treated so as to remove any 16S ribosomal gene sequences.Several strategies have been developed for this, e.g. treatment with pso-ralen, UV irradiation or treatment with DNase (Steffan et al., 1988). We com-monly treat the PCR reaction mixes and the Taq polymerase with DNase I,as outlined below.
The PCR protocol described in the following will address the ampli-fication of soil DNA using eubacterial primers to generate fingerprints ofbacterial communities of soil. For amplification of other microbial groups,such as the fungi or specific bacterial groups, the reader is referred to therelevant literature.
Treatment of (Taq) DNA polymerase with DNase I to remove contaminatingbacterial DNA
1. Add 10 µl DNase I (10 U/µl) to PCR reaction mix (without Taq poly-merase and primers) for ten reactions.2. Add 0.1 µl DNase I to 5 µl Taq DNA polymerase Stoffel fragment(10U/µl).3. Incubate tubes for 30 min at 37°C, then inactivate DNase I by heating at98°C for 10 min. The reaction mix as well as enzyme can be used directly forPCR.
The enzyme used is AmpliTaq DNA Polymerase, Stoffel fragment(Perkin Elmer/Cetus). In our laboratory, this enzyme was shown to be leastinhibited by soil impurities. However, several other enzymes may work aswell on soil-derived DNA.
Procedure
1. Prepare master mix of reagents for any number of 50 µl reactions. Eachmixture contains (final amounts in 50 µl final reaction volume):
Sterile deionized water 23.45 µlStoffel buffer 10× 5 µl (final conc. 1×)Each dNTP (1 mM) 10 µl (final conc. 200 µM)mix – 5×MgCl2 25 mM 7.5 µl (final conc. 3.75 mM)Primer 1 10 µM 1 µl (final conc. 0.2 µM)Primer 2 10 µM 1 µl (final conc. 0.2 µM)Formamide* 0.5 µl (final conc. 1%)T4 gene 32 protein (5 mg/ml)* 0.05 µl (final conc. 0.25 µg/50 µl)Taq DNA polymerase 0.5 µl (final conc. 0.1 U/µl)Stoffel fragment (10 U/µl)
Soil Microbial Community Fingerprinting 199

Total volume 49 µl. Cover with two drops of heavy mineral oil. An aliquotof 1 µl soil DNA extract is added through the oil to the reaction mixturecontaining all other components in the ‘hot start’ procedure (see 3 below)prior to starting thermal cycling.
*Formamide (Merck) is added to enhance specific primer annealing. T4gene 32 protein (Boehringer) is added since it enhances the stability of sin-gle-stranded DNA, facilitating primer annealing (Tebbe and Vahjen, 1993).We found a sixfold lower concentration than that used by Tebbe and Vahjen(1993) to be optimal.2. Prepare positive and negative controls, as indicated above.3. ‘Hot start’ procedure: pre-heat the PCR mixture at 95°C for 2 min prior toadding enzyme or target DNA, in order to denature any bonds adventi-tiously or erroneously formed between primers and target.4. Run PCR in a programmable thermal cycler, for 25–40 cycles. Often, themachine can be set so as to run the amplification cycles overnight. 5. After thermal cycling, perform a final primer extension at 72°C (e.g.10 min), and keep reaction mixtures at 4°C until analysis.
Denaturing gradient gel electrophoresis (DGGE) of PCR products
Denaturing gradient gel electrophoresis (DGGE) separates DNA moleculesof similar size by virtue of differences in their internal sequence (i.e. theirmelting behaviour) in a gradient of increasing denaturant (formamide andurea) strength. The gels are run at 60°C in a DGGE apparatus for 16 h.
Denaturing polyacrylamide gels
Polyacrylamide gels are formed by the polymerization of monomeric acry-lamide into polymeric acrylamide chains and the cross-linking of thesechains by N,N’-methylene bisacrylamide. The polymerization reaction isinitiated by the addition of ammonium persulphate (APS), and the reactionis accelerated by TEMED (N,N,N’,N’-tetramethylethylenediamine), whichcatalyses the formation of free radicals from APS. The porosity of the gel isdetermined by the length of the chains and the degree of cross-linking. Thelength of the chains is determined by the concentration of acrylamide in thepolymerization reaction.
The protocol below is described for use with the Ingeny PhorU system,which is recommended for ease of use.
1. Choose the steepness of the desired gradient, e.g. 50–75%, using the sug-gested mixtures for the ‘upper’ solution (e.g. 50%), and for the lower solu-tion (e.g. 75%, see Table 8.2).2. Prepare 25 ml of each of these solutions in a 50 ml bluecap tube. Also,place 5 ml of solution A in a 12 ml bluecap tube (for stacking gel). Leave atroom temperature for at least 30 min.3. Thaw a tube with 10% APS from freezer (–20°C).
200 J.D. van Elsas et al.

4. Prepare set-up for casting the gel (see ‘Step by step’ manual IngenyPhorU-2, pp. 8–9). Clean glass plates and spacers, respectively, withKOH/methanol, soap and water, deminerilized water and ethanol. Dry theplates.5. Add 150 µl 10% APS to the ‘upper’ and the ‘lower’ solution.6. Add 12 µl TEMED to the ‘upper’ and the ‘lower’ solution, mix well, andproceed immediately with the following steps (7 and 8).7. Place 25 ml of ‘lower’ solution (highest denaturant concentration, e.g.75%) in the chamber of the gradient mixer connected to the pump. Opentap to the other chamber to let the air in the tap escape, and close. Transferliquid from the other chamber back to the right chamber using a Pasteurpipette. Add magnetic stirring rod. 8. Place 25 ml of ‘upper’ solution (lowest denaturant concentration, e.g.50%) in the other, empty chamber.9. Switch on magnetic stirrer (position 4) to stir the ‘lower’ solution. Switchon pump and immediately carefully open the tap connecting the two cham-bers. Pump speed should be 4–6 ml/min. Gel should be cast in 15 min.Leave for 15–30 min to solidify.10. Add 50 µl 10% APS and 7 µl TEMED to 5 ml solution A (stacking gel –8% acrylamide). Using a 5 ml syringe with a long needle, slowly pour thetop part of the gel by hand. Avoid air bubbles. Add the comb. Wait for atleast 1 h for the gel to polymerize completely. 11. Switch on buffer tank at 60°C (takes 45 min to heat up). The buffer tankcontains 15 l of 0.5× TAE.12. After gel polymerization, all screws should be adjusted to just touch theplexiglass pressure unit. Place the cassette in the buffer tank. Push the U-shaped spacer all the way down now. Little air bubbles under the gel can beremoved by holding the cassette at an angle. Remove the comb. Tighten theupper two screws again. Connect buffer flow to connector on cassette. Fillupper buffer tank and close the tap.13. Connect the electrical plugs. Add the samples. Set power supply to thedesired voltage (e.g. 75 V) and time (e.g. 16 h). Wait 10 min, while elec-trophoresis is in progress, before opening the upper buffer flow again. Thereservoir should not overflow.14. After running, remove gel. Stain with SYBR Gold (1 h) and rinse.Observe on UV transilluminator.
Calculation
The molecular community profiles can be loaded into a software programsuch as GELCOMPAR – see Rademaker (1995) for details. The program willdigitize the profiles and can assign values to each band, in accordance withits intensity. The matrix of band intensity values per lane can then be usedin any statistical approach that allows rigid comparison of the profiles.Depending on the purpose of the comparisons, principal components
Soil Microbial Community Fingerprinting 201

analysis, canonical correspondence/variant analysis or discriminant analy-sis can be employed on the basis of the collective data. See relevant litera-ture as well as Section 8.3 of this volume.
Discussion
The DNA extraction protocols selected and described here are very suitablefor the detection of specific microorganisms and their genes in soil (Smallaet al., 1993a; Duarte et al., 1998; van Elsas et al., 2000). However, as dis-cussed, there may still be some doubt as to the localization of such DNAsequences, i.e. inside cells or extracellularly. As this is a potential probleminherent to all soil DNA extraction protocols, including the cell extraction-based ones, results obtained should be carefully interpreted as to theirmeaning for the actual cell populations present. Furthermore, even thoughthe bead beater is known to lyse a major part of bacterial species efficiently,including many Gram-positives, there is no absolute certainty that cell lysisis representative for the soil bacterial community. The findings of Moré et al.(1994) suggest that lysis may well be confined to the larger cell-size fractionof the microbial community, leaving a major fraction of minute cells un-lysed. This feature also has to be taken into account when the protocol is tobe used for microbial community structure studies in soil. In fact, it is clearthat with this, or any other, DNA extraction protocol, only a limited view ofthe soil microbiota can be obtained, due to the fact that the extraction/lysisefficiency is commonly below 100% of the total detectable cell populations.The primers used for PCR amplification of soil DNA are obviously determi-native for the level at which different microbial groups can be assessed.Thus, diversity indices can be produced for broad microbial groups, such asall bacteria or all fungi. At a finer level of resolution, a picture of the diver-sity of specific groups (such as the α- or �-proteobacteria, the high-G+C%actinomycetes or the pseudomonads) can be obtained. The advantage ofusing the group-specific approach is that the enormous complexity of themicroflora in soil can be reduced to a level that is better interpretable. In
202 J.D. van Elsas et al.
Table 8.2. Mixtures of solutions A (0% denaturants) and B (80% denaturants) to achievedesired denaturant concentrations.
Denaturant concentration (%) Solution A (ml) Solution B (ml)
25 17.2 7.830 15.6 9.435 14.1 10.940 12.5 12.545 11 1450 9.4 15.665 4.7 20.370 3.1 21.975 1.6 23.4

fact, one can focus on those microbial groups that are less numerous in thesoil, and would have been overlooked in pictures obtained for the broadgroupings, as they would be minority organisms there.
The fingerprints obtained via DGGE separation are often robust andreliable for a given soil or soil treatment, reporting on the microbial diver-sity status of the sample. The fingerprint obtained quite often provides arepresentative picture of the numerically dominant types in the microbialgroup targeted. However, as with any method applied to soil, the DGGEdata are not without caveats. These caveats have been described extensivelyin the literature, and will be discussed only briefly here. First, whereas PCRamplification will often be without bias, that is, each particular sequencewill be amplified at about the same rate, sometimes aberrations from thiscommon rate have been observed. This results in a phenomenon called‘preferential amplification’, in which a particular sequence is amplified at a(much) higher rate than others, leading to a distorted picture of the relativeabundance of the different microbial types present. Secondly, a fraction ofthe bands that make up the DGGE profile are actually chimeric sequences,which are the result of an aberrant PCR process; the percentage at whichchimeras can be formed varies, but low frequencies (a few percent) to fre-quencies as high as 30% have been reported. To get a handle on this PCRartefact, one can use sequence analysis followed by the feature‘Check_chimera’ available in several sequence analysis programs.
Other features of PCR-DGGE analysis of soil DNA are the known factsthat some bacterial types can produce multiple bands on DGGE (a result ofthe presence of several slightly different rRNA operons in the same cell),and that fragments of different sequence can migrate to the same gel posi-tions. Therefore, a note of caution is in place with respect to the interpret-ation of the profiles generated by DGGE, and the use of these profiles toproduce diversity indices.
With all these cautionary remarks in mind, one can safely state that thecurrent protocol opens a wide window for studying the diversity of totalmicrobial populations in soil at various different levels of resolution, anability that one could only dream of just a decade ago. It is foreseen thatdevelopments will continue and that the current methodology will berefined, or even superceded, by other direct methods, such as the use ofDNA microarray technology. However, we would like to propose the cur-rently described method as the method of choice for routine assessments ofthe microbial diversity of soil, possibly at two levels, i.e. that of total bacte-ria (Kowalchuk et al., 2004) and of total fungi (Vainio and Hantula, 2000).
Soil Microbial Community Fingerprinting 203

8.3 Phospholipid Fatty Acid (PLFA) Analyses
ANSA PALOJÄRVI
MTT – Agrifood Research Finland, FIN-31600 Jokioinen,Finland
Introduction
The analysis of ester-linked (EL) phospholipid fatty acids (PLFAs) is anacknowledged biochemical approach to microbial community characteriza-tion. PLFAs are constituents of all cell membranes, and have no storagefunction. Under the conditions expected in naturally occurring communi-ties, phospholipids represent a relatively consistent fraction of cell mass,even though some changes are detected in pure cultures due to changes ingrowth media composition or temperature (Harwood and Russel, 1984).Lipid analysis offers an alternative that does not rely upon the cultivation ofmicroorganisms. Current extraction and derivatization methods permiteffective recovery of PLFAs from living organisms (White, 1988). PLFAsalso degrade quickly upon an organism’s death (White, 1988), if the degrad-ing enzymatic activity is not inhibited (see Zelles et al., 1997), which allowsthe detection of rapid changes in microbial populations.
Extraction and subsequent analysis by gas chromatography and massspectrometry provides precise resolution, sensitive detection and accuratequantification of a broad array of PLFAs. Each analysis yields a profile com-posed of numerous PLFAs defined on the basis of compound structure andthe quantity of each compound present in the sample. The advantage of themethod is that the amount of total PLFAs can be used as an indicator forviable microbial biomass, and that further characterization can be donebased on specific signature biomarker fatty acids. Taxonomically, themethod does not include Archaea, since they have ether-linked rather thanester-linked phospholipid fatty acids in their cell membranes. There are noindicated restrictions to the application of the method for any kinds of soiland environmental samples and it is relatively time- and cost-competitive.
The PLFA method has been applied for various environmental ques-tions. Changes in the PLFA patterns have been detected according to thedifferent levels of metal contamination (Pennanen, 2001). Agriculturalmanagement practices (Petersen et al., 1997; Schloter et al., 1998) and pesti-cide use (Widmer et al., 2001) have been shown to cause shifts in the PLFApatterns. Changes in the PLFA patterns have been detected after chloroformfumigation of soil (Zelles et al., 1997). Validation of PLFA in the determina-tion of microbial community structure has been reviewed, e.g. by Zelles(1999) and Pennanen (2001).
204

Certain PLFAs can serve as unique signatures for specific functionalgroups of microorganisms. Such biomarkers cannot detect individualspecies of microorganisms due to overlapping PLFA patterns. Nevertheless,comparison of total community PLFA profiles accurately mirrors shifts incommunity composition and provides a way to link community composi-tion to specific metabolic and environmental conditions. Signature fattyacids are listed by several authors (Morgan and Winstanley, 1997; Zelles,1999; Kozdrój and van Elsas, 2001a). For fungal biomarkers see Frostegårdand Bååth (1996), Miller et al. (1998) and Olsson (1999).
Principle of the Methods
The phospholipid fatty acid (PLFA) analysis is based on the single-phaseextraction of lipids described by Bligh and Dyer (1959). The lipids are frac-tionated into different lipid classes: neutral lipids, glycolipids and phospho-lipids (Fig. 8.1). Neutral and glycolipids are normally handled as wastefractions and disregarded in microbial community analysis, although theycan be used for other purposes, e.g. to describe the nutritional status ofmicrobes (White et al., 1998).
The phospholipid fraction is then methylated to give fatty acid methylesters (FAME) and analysed by gas chromatograph (GC) with flame-ioniza-tion detector (FID) or GC coupled with a mass spectrometer (GC–MS). Dueto the very variable contents of different PLFA in cell membranes, themethod without further fractionation (Fig. 8.1A) is able to detect the mostabundant ester-linked PLFA only. In most cases, 20–40 PLFA are identified.They make up most of the biomass, but not of the number of PLFA in thecells (see Zelles, 1999). This method has been successful in separating micro-bial communities in various experiments and it is applicable for monitoring.
Extended PLFA analysis discovers a very wide variety of cellular fattyacids, including both ester-linked and non-ester-linked PLFAs (Fig. 8.1B),and offers good potential for the use of signature fatty acids.
Whole-cell fatty acid patterns are based on FAME analysis after directsaponification and methylation of lipids without fractionation to differentfatty acid groups (Fig. 8.1C). The method was originally designed formicrobial identification of pure cultures (the commercially availableMicrobial Identification System (MIDI or MIS); Haack et al., 1994; Kozdrójand van Elsas, 2001b). Even though both the whole-cell fatty acid patternsand PLFA patterns are based on FAME analysis, it should be noted that themethods are not comparable. The whole-cell fatty acid patterns (often calledthe FAME method) comprise lipids derived from non-living organic matter(Petersen et al., 2002), and include storage lipids, which are more sensitiveto growth conditions. The PLFA and FAME methods have been reviewedby Zelles (1999).
In this section, a procedure for PLFA analysis is described which isbased on White et al. (1979), Frostegård et al. (1993) and Palojärvi et al.(1997), with slight modifications.
Phospholipid Fatty Acid Analyses 205

206 A. Palojärvi
Soil sample
One-phase extraction
Lipids
Alkaline methanolysis
Fractionation
PHOSPHOLIPIDSGlycolipids
Neutral lipidsAlkaline methanolysis
PLFAFAME
GC + FIDGC–MS
‘Whole-cell fatty acid patterns’
Unsubstituted FAs
Fractionation
EL-Hydroxy FAs Unsaponifiable FAs
Acidic hydrolysis
Fractionation
NEL-HYFANEL-UNSFAEL-HYFAEL-PUFAEL-MUFAEL-SATFA
Fractionation
GC–MS
‘Extended’
(A)(C)
(B)
FAME
EL-PLFA
Fig. 8.1. Flow diagram of the extraction and fractionation steps of (A) ester-linkedphospholipid fatty acid (EL-PLFA); (B) extended PLFA; and (C) whole-cell fatty acid analyses.Abbreviations: FAME, fatty acid methyl esters; GC, gas chromatograph; FID, flame-ionizationdetector; MS, mass spectrometer; FA, fatty acid; EL, ester linked; SATFA, saturated FA;MUFA, monounsaturated FA; PUFA, polyunsaturated FA; HYFA, hydroxy FA; NEL, non-esterlinked; UNSFA, unsubstituted FA. Figure modified after Zelles and Bai (1994) and Palojärviand Albers (1998).

Materials and Apparatus
In addition to standard laboratory equipment, the following supplies andapparatus are needed:
Supplies
• Glass test tubes and small glass bottles with Teflon-lined screw caps (ca.50 ml and 10 ml test tubes for centrifuge, 4–10 ml bottles for varioussolvent fractions)
• Disposable glass pipettes (Pasteur, Micro pipettes) and compatiblepipettors
• Nitrogen gas• Silicic acid (e.g. Unisil 100–200 mesh) or commercial solid-phase extrac-
tion columns (e.g. Varian Bond Elut SILICA Si 500 mg or 2 g)
Apparatus
• Fume hood• Vortex mixer• (Orbital) shaker• Centrifuge• Nitrogen evaporator• Gas chromatograph (GC) with flame-ionization detector (FID) or,
preferably, GC coupled with a mass spectrometer (GC–MS). The GCshould be equipped with a splitless injector and a long non-polarcapillary column (e.g. HP-5; 0.2 mm internal diameter, 0.33 µm filmthickness, 50 m column length)
Chemicals and solutions
• Citrate buffer (0.15 M Na3C6H5O7.2H2O, pH 4.0), or phosphate buffer
(50 mM K2HPO4, pH 7.4) • Solvents (chloroform stabilized with ethanol, methanol, acetone,
toluene, hexane, iso-octane); analytical grade or higher• Bligh-and-Dyer solution (chloroform:methanol:buffer, 1:2:0.8; v/v/v)• Methanol:toluene (1:1; v/v)• Methanolic KOH (0.2 M; make fresh daily)• Hexane:chloroform (4:1; v/v)• Acetic acid (1.0 M)• Internal standard 19:0 (methyl nonadeconoate; Sigma)
Phospholipid Fatty Acid Analyses 207

• Fatty acid methyl ester standards (e.g. Sigma, Supelco, Nu-Chek-Prep)
Note: All chemicals are analytical grade or higher; chloroform should bestabilized with ethanol. Phosphate buffer is widely used for PLFA extrac-tions, but Nielsen and Petersen (2000) showed that citric buffer gives thehighest PLFA yields.
Procedure
Lipid extraction
Lipid extractions are carried out on a few grams of fresh, frozen or freeze-dried soil. Fresh soil can be kept in a refrigerator for a few weeks (Petersenand Klug, 1994). The proper amount of soil should always be establishedbeforehand. The amount of PLFA in the sample should be high enough tobe above the detection limit. On the other hand, the presence of very highamounts of PLFA may cause problems during the analyses. In experimentswith different soils or treatments, it is recommended to standardize theamounts of material to give similar levels of microbial biomass. The single-phase extraction mixture contains chloroform, methanol and buffer in theratio 1:2:0.8. The water content of the sample is calculated and a sufficientamount of buffer is added. The following procedure is suitable for 1–4 g ofsoil.
• The soil sample is weighed into a 50 ml test tube.• Add buffer so that the total water content of the soil is 1.5 ml.• Add 1.9 ml chloroform, 3.7 ml methanol and 2.0 ml Bligh-and-Dyer
solution.• Mix well using a Vortex mixer.• Leave the sample in a (orbital) shaker at a low speed (ca. 200 rpm) for at
least for 4 h, or overnight, and centrifuge (c. 1000 � g for 10 min).• Transfer the supernatant to another 50 ml test tube, wash the soil pellet
with 2.5 ml Bligh-and-Dyer solution, repeat the mixing and centrifuga-tion, and combine the supernatants.
• To separate the solvent phase, add 3.1 ml chloroform and 3.1 ml buffer,and mix well with the Vortex (c. 1 min).
• Let the mixture stand overnight to separate the lower organic phase(chloroform) from the upper water–methanol phase.
• Transfer the organic phase into a small glass bottle.• The samples are placed in a water or sand bath (40°C) and dried under
a stream of N2 gas until near dryness.• The lipid samples are stored in a freezer.
208 A. Palojärvi

Lipid fractionation
• The lipids are separated into neutral, glyco- and phospholipids oncolumns containing silicic acid by eluting with chloroform, acetone andmethanol, respectively.
• Prior to separation, commercial columns (500 mg) must be activatedwith 6 ml chloroform.
• The dried lipid samples are transferred on to the columns in 3 × 100 µlchloroform.
• Elute neutral lipids with 6 ml chloroform and glycolipids with 12 mlacetone. For PLFA analysis, these are waste fractions.
• Phospholipids are eluted with 6 ml methanol into a 10 ml test tube.• The methanol fraction is reduced until dryness under N2 gas in a water
or sand bath (maximum temperature 30°C).
Internal standards
• A known amount of methyl nonadecanoate (19:0; Sigma) is added tothe phospholipid fraction as an internal standard.
• Methyl tridecanoate (13:0; Sigma) can be used as an additional internalstandard to indicate possible losses of short-chain fatty acids.
Mild alkaline methanolysis
• Samples are dissolved in 1 ml methanol:toluene solution.• Methanolic KOH (1 ml) is added, and the mixture is incubated in a
water bath (37°C, 15 min). Add immediately 2 ml hexane:chloroformsolution and 0.3 ml acetic acid to neutralize the solution (pH can bechecked from the lower phase; pH 5–7).
• Mix well with Vortex (c. 1 min) and centrifuge (c. 1000 � g for 5 min).• Transfer the upper, organic phase into a small glass bottle.• Wash the mixture once with 2 ml hexane:chloroform and combine the
upper, organic phase with the former one.• Reduce the sample with N2 gas without heating. Place the sample, re-
dissolved in 100 µl iso-octane (or hexane), in a GC vial with a glassinsert.
GC–MS or GC + FID analysis
The resulting fatty acid methyl esters (FAME) of ester-linked phospholipidfatty acids (EL-PLFA) are separated, quantified and identified by gaschromatography (GC) coupled with a mass spectrometer unit for peak
Phospholipid Fatty Acid Analyses 209

identification (GC–MS). Alternatively, the analysis can be carried out with aGC equipped with a flame-ionization detector (FID); in this case peak iden-tification is based on retention times only. The GC + FID analysis must beconfirmed from time to time against GC–MS. Helium is typically used as acarrier gas. The flow rate and temperature programming of the columnshould be adjusted for the individual instrument. An example of settings:flow rate 0.9 ml/min, initial temperature 70°C for 2 min, increase 30°C/minuntil 160°C, increase 3°C/min until 280°C, final temperature 280°C for10 min. The identification and the response factors of different PLFAcompounds are based on fatty acid methyl ester standards. Double-bondpositions can be determined with their dimethyl disulphide adducts(Nichols et al., 1986).
Fatty acid nomenclature
A short-hand nomenclature used to characterize fatty acids is as follows. Inthe expression X:Y�Z, X indicates the number of carbon atoms in the fattyacid, while Y indicates the degree of unsaturation (= the number of car-bon–carbon double bonds). The position of the first double bond from themethyl (or aliphatic; ‘�’) end of the molecule is represented by Z.Alternatively, double-bond positions from the carboxyl (‘∆’) end are some-times given. The suffixes ‘c’ and ‘t’ indicate cis and trans geometry, respec-tively. Because cis geometry is most common, c is often omitted. Theprefixes ‘i’ and ‘a’ refer to iso (the second carbon from methyl end) andanteiso (the third carbon from methyl end) branching; ‘br’ indicatesunknown methyl branching position. Other methyl branching is indicatedby the position of the additional methyl carbon from the carboxyl end fol-lowed by ‘Me’ (i.e. 10Me18:0). Some authors include the carbon of methylgroup in X and use the prefix ‘p’. This means, for example, that 10Me16:0 isidentical to p10–17:0. The number before the prefix ‘OH’ indicates the posi-tion of a hydroxy group from the carboxyl end (i.e. 3-OH14:0). α and � aresometimes used to indicate a hydroxy substitution at position 2 or 3 fromthe carboxyl end, respectively. Cyclopropane fatty acids are designated bythe prefix ‘cy’.
Calculation
The calculation of the concentrations of PLFA is shown in Eq. (8.1):
(8.1)
where: Cx = concentration of the fatty acid studied; Ax = peak area of thefatty acid studied; Ai = peak area of the internal standard; ci = absoluteamount of internal standard in the vial (µg); f = response factors of differentPLFA compounds (peak area to concentration ratio compared to internal
CA c f
A W Mxx i
i
nmol/gg
g g / mol( ) =
× [ ]× ×× [ ]× [ ]
µµ µ
1000
210 A. Palojärvi

standard; if not known, then = 1); W = amount of soil (g); and M = moleculeweight of the fatty acid (µg/µmol).
Note: The results can also be expressed as micrograms PLFA per gramdry soil. Often the relative contribution of different PLFA is of major interest(‘PLFA fingerprint’) and mole fractions (in percentage) are calculated.
Statistical analyses
Multivariate analyses can be applied to PLFA profiles. Principal compo-nents analysis (PCA) is most widely used (e.g. Palojärvi et al., 1997; Petersenet al., 1997). Canonical correspondence analysis enables determination ofthe influence of different environmental factors on the PLFA patterns(Bossio et al., 1998). Non-metric multidimensional scaling (NMDS; Siira-Pietikäinen et al., 2001) and neural computing methods (Noble et al., 2000)have also been applied recently.
Discussion
PLFA analysis is applicable for monitoring and detecting changes in the soilmicrobial communities. Additionally, viable microbial biomass estimatesand information on several biomarker PLFAs can be obtained. Several com-parisons have shown that PLFA can detect rapid changes and produceresults on microbial characterization comparable to other community-levelmethods (e.g. Widmer et al., 2001).
Further methodological perspectives: Macnaughton et al. (1997) sug-gested a pressurized hot solvent extraction to enable rapid and improvedextraction of lipids from large numbers of environmental samples. Intactphospholipid profiling (IPP), using liquid chromatography/electrosprayionization/mass spectrometry, is an advanced alternative to EL-PLFAanalysis by GC–MS (Fang et al., 2000). Further methods have been devel-oped for archaeal ether-linked lipids by Bai and Zelles (1997) and Fritze etal. (1999). Different isotope and radiolabelling techniques of PLFA havebeen applied to study specific biogeochemical processes and microbialactivity (Boschker et al., 1998; Roslev et al., 1998).
Phospholipid Fatty Acid Analyses 211

8.4 Substrate Utilization in BiologTM Plates for Analysisof CLPP
MICHIEL RUTGERS,1 ANTON M. BREURE1 AND HERIBERT INSAM2
1National Institute for Public Health and the Environment,Antonie van Leeuwenhoeklaan 9, NL-3721 MA Bilthoven, TheNetherlands; 2Universität Innsbruck, Institut für Mikrobiologie,Technikerstraße 25, A-6020 Innsbruck, Austria
Introduction
For characterization of the microbiology of soil samples, functional aspectsrelated to substrate utilization are as useful as taxonomic or structural inves-tigations based on DNA or RNA analysis (Grayston et al., 1998). An under-standing of the functional or metabolic diversity of microbial communities,particularly defined by the substrates used for energy metabolism, is inte-gral to our understanding of biogeochemistry (Hooper et al., 1995). Thus,diversity at the functional level rather than at the taxonomic level may becrucial for the long-term stability of an ecosystem (Pankhurst et al., 1996).
In addition, microbial community analysis on the basis of the best avail-able techniques only addresses a limited number of dominant features. Forinstance, using PCR-DGGE analysis based on the 16S ribosomal RNA genesequence, up to about 100 dominant DNA sequences can be recognized.The same holds for other techniques, such as phospholipid fatty acid(PLFA) profiling, morphological characterizations and metabolic diversityanalyses (Rutgers and Breure, 1999). Estimates of the numbers of species inmicrobial communities in soil and sediment range from 104–105 differentspecies/g dry weight (Torsvik et al., 1990; Dykhuizen, 1998). Consequently,irrespective of the technique, the danger exists that important parts of thecommunity will be overlooked. The use of complementary techniques, suchas those offered by the combination of DNA profiling and metabolic diver-sity analyses, reduces this danger.
Since first proposed by Garland and Mills (1991), in vitro community-level physiological profiles (CLPPs) have been used frequently to character-ize microbial communities of different habitats, ranging from sediments toseawater, and from oligotrophic groundwater to soils and composts (e.g.Garland and Mills, 1991, 1996; Grayston and Campbell, 1995; Insam et al.,1996; Grayston et al., 1998, 2001).
This section describes the determination of CLPP using 96-well platesfor metabolic substrate utilization. Microplate plates allow for easymeasurement of many microbial responses, making community analysispractical and open for laboratory automation.
212

Principle of the method
CLPP involves direct inoculation of environmental samples into BiologTM
microplates, incubation and spectrophotometric detection of heterotrophicmicrobial activity. Its simplicity and rapidity is attractive to the microbialecologist, but it requires careful data acquisition, analysis and interpreta-tion. The BiologTM system was initially developed for characterization ofpure isolates of Gram-positive (using GP2 plates, formerly GP plates) andGram-negative (using GN2 plates, formerly GN plates) heterotrophic iso-lates (Bochner, 1989). Development of a method for CLPP started with theapplication of GN2 plates and, to a lesser extent, GP2 plates, both contain-ing 95 different carbon sources. Recently, so-called ECO plates were devel-oped for CLPP of terrestrial communities (Insam, 1997). These platescontain 31 different carbon sources and allow for a triplicate experiment inone plate. GN2 and GP2 plates were recently introduced after GN and GPplates and now include a gellum-forming agent. ECO plates contain thisagent too. There are some indications of a different colour-forming regimebetween GN and GN2 plates (O’Connell et al., 2001).
Several approaches have been used to account for biases related toinoculum density, inoculum activity, incubation time and micro-environ-ment (Garland, 1997; Preston-Mafham et al., 2002). For instance, standard-ization of initial inoculum density is commonly used (Garland and Mills,1991), although it is laborious and there is still dispute about an appropriatecell enumeration method. Normalization of optical density (OD) readingsby dividing by average well colour development (AWCD) is bound to anumber of conditions (Haack et al., 1995; Heuer and Smalla, 1997; Konopkaet al., 1998). Single time-point readings and integration of the OD over timeare still most widely used, but bear the effect of inoculum density (Garlandand Mills, 1991). Following a proposition of continuous plate reading foranalysing the kinetics rather than the degree of colour development at agiven time, a sigmoidal growth model has been developed (Haack et al.,1995; Garland, 1997; Lindstrom et al., 1998). Again, some kinetic parametersare dependent on inoculum density and need to be normalized prior to sta-tistical analysis. Recently, a normalization procedure that employs inte-grated OD values derived from a number of dilutions of the same sample,rather than a single dilution level, has been developed as an inoculum-den-sity- and time-independent method of analysis (Gamo and Shoji, 1999;Garland and Lehman, 1999; Breure and Rutgers, 2000; Franklin et al., 2001).The inoculum-density-independent approach is being applied in theNetherlands Soil Monitoring Network. This network consists of about 300sampling locations (Bloem and Breure, 2003).
In this section, some analytical aspects of sampling and of the analysisof communities by CLPP are described. Considerations for sampling andstoring soil, sediment or surface water samples for CLPP analysis are dis-cussed. The overview is neither complete nor exhaustive. For this, thereader is referred to standard textbooks of soil microbial methods. Two dif-ferent methods for establishing CLPPs are described. The first method is
Substrate Utilization in BiologTM Plates 213

most often used and requires just one plate for a CLPP analysis. Thismethod requires careful inoculum standardization and subsequent dataanalysis in order to develop a CLPP which is independent of small changesin inoculum size and activity. The second method is based on inoculation ofserial sample dilutions, and requires a set of plates for just one CLPP analy-sis. This method is essentially inoculum-density independent, and can beused for comparing samples of different origin.
Sampling, storage and extraction
As for most biological investigations, fresh samples are often superior tostored samples. However, one has to realize that the microbial communitiesreflect the climatic conditions just before sampling, especially in shallowsoil horizons. This aspect is particularly true for physiology-based methodssuch as CLPP. Consequently, with remote sampling locations, or for moni-toring purposes, it is recommended to include an equilibration periodunder standardized conditions in the laboratory. For instance, in theNetherlands Soil Monitoring Network, sieved soil samples (2–4 mm mesh)are equilibrated for 4 weeks at 10°C, under 50% water-holding capacity(WHC). This procedure is thought to minimize the effect of gross climaticdifferences (such as rainfall and temperature) in the weeks before sampling(Bloem and Breure, 2003). If storage is necessary, samples may be stored upto 10 days at 4°C; for longer periods, freezing is recommended.
Extraction procedures range from simple horizontal shaking, head-over-head shaking, or blending of soil or sediment slurries in water, bufferor salt solutions, to elaborate sequential extractions (Hopkins et al., 1991).Usually, a few grams of soil, sediment or compost are sufficient. However, itis strongly recommended that soil sampling, storage and extraction proce-dures are standardized in order to make comparisons between CLPPs morereliable.
Materials and apparatus
Microplates and their inoculation
Two options are possible, the use of either BiologTM ECO plates or GN2plates, containing 31 or 95 different C sources, respectively, plus a waterwell (Biolog Inc., Hayward, California, USA). ECO plates contain threereplicates of the carbon substrate and control. The plates are inoculatedwith 130 µl suspension per well, diluted (in 1
4 strength Ringer solution) toobtain a cell density of approximately 1 × 10⁸ cells/ml (determined, forexample, by acridine orange direct count (AODC); Bloem et al., 1995). Theplates are then incubated at 20°C in the dark and subsequent colourdevelopment is measured every 12 h for 5 days (592 nm).
214 M. Rutgers et al.

For the inoculum-density-independent approach, serial threefolddilutions of the bacterial suspension are produced (30–3�11; with dense bac-terial suspensions it is better to use a more diluted series, e.g. 3�2–3�13). Thedilution series should essentially give a complete range of colour formationlevels from > 95% to < 5% average colour in the plate. Each dilution isinoculated in a section of an ECO plate (Fig. 8.2). The plates are thenincubated at 20°C in the dark under 90 ± 5% air humidity to avoid un-desired evaporation. Colour development is measured at 590 nm and750 nm every 8 h or 12 h for 7 days, using an autosampler and a microplatereader or spectrophotometer.
Microplate stackers and autosamplers might be used, since experimentsfor the analysis of CLPPs usually contain many plates. Commercially avail-able autosamplers and stackers can handle stacks of 20 to more than 100plates in one run.
Procedures
According to specific needs or availability of equipment, extraction proce-dures may be modified, inoculation densities may be altered, or single-point data reading may be replaced by continuous readings (alternativessee above). In the following, subheadings preceded by an ‘A’ relate to thesimple method with one BiologTM plate per sample. Subheadings precededby a ‘B’ relate to the inoculum-density-independent method using morethan one plate per sample.
Example of an extraction procedure
1. Blend 5 g fresh soil with 20 ml or 50 ml of 0.1% (w/v) sodium cholatesolution, 8.5 g cation exchange resin (Dowex 50WX8, 20–50 mesh, Sigma)and 30 glass beads. 2. (Optional) Shake the suspension on a head-over-head shaker (2 h, 4°C).3. Centrifuge at low speed (500 × g to 800 × g) for 2 min.4. Decant the supernatant into a sterilized flask. 5. (Optional) Resuspend the pellet in 10 ml Tris buffer (pH 7.4) and shakefor 1 h.6. Centrifuge as above and add the supernatant to the earlier extract.7. (Optional) If the extract is turbid or dark (due to clay or humic particles)centrifuge the resulting supernatant another time.
A. Dilution, inoculation and incubation (single-plate procedure)
1. Dilute the samples with 14 strength Ringer solution ten (sediment)- to
1000 (composts)-fold and check the cell density by acridine orange directcounting (AODC). As an alternative, substrate-induced respiration
Substrate Utilization in BiologTM Plates 215

(Anderson and Domsch, 1978) is recommended to determine microbial bio-mass of the soil samples. Appropriate dilutions of the extracts may then beused to obtain similar inocula.2. Dilute samples appropriately to obtain a cell density of approximately 1× 10⁸ cells/ml. In the case of background coloration of the extract, furtherdilutions are recommended. 3. Inoculate the plate with 100 µl bacterial suspension per well (BiologTM
recommends 150 µl per well, but this is somewhat difficult to handle).4. Cover the plates with a lid and incubate at 20°C in the dark (other tem-peratures are possible). Prevent undesired evaporation by putting the platesin polyethylene bags or in a humidified incubation chamber.5. Measure colour development (592 nm) every 12 h for 5 days using anautomated plate reader. Readings may be terminated if the average wellcolour density reaches an optical density of 2. If curve parameters or thearea under the curve are determined, make sure you always have the samereading intervals and the same number of readings (e.g. 10). In case of along lag-time, or low incubation temperature, incubation may be prolonged(reading interval up to 24 h).
B. Dilution, inoculation and incubation (inoculum-density-independentprocedure)
1. Make a dilution series of the bacterial suspension in physiological saltssolution or 14 strength Ringer, using threefold dilution steps. 2. Inoculate a minimum of 100 µl of 30–3�11 diluted bacterial suspension(mineral soil horizons, sandy soils) in 4 ECO plates (1 dilution per section =32 wells). Depending on the initial concentration of bacteria in the suspen-sion, another set of dilutions might be used (e.g. 3�2–3�13 in the case oforganic soils and clay).3. Cover the plates with a lid and incubate at 20°C in the dark (other tem-peratures are possible). Prevent undesired evaporation by putting the platesin polyethylene bags or in a humidified incubation chamber.
216 M. Rutgers et al.
bacterial concentrations (relative to undiluted sample)
plate 1 plate 2 plate 3 plate 4
3–1 3–2 3–3 3–4 3–5 3–6 3–7 3–8 3–9 3–10 3–11 3–12
Fig. 8.2. Series of BiologTM plates (ECO) demonstrating the loss of colour development afterstepwise dilution of the inoculum (dilution factor per step is 3 in this case). The loss of colourper well is indicative of the community-level physiological profile (CLPP).

4. Measure colour development (592 nm) every 8 h for 7 days using anautomated plate reader. Readings may be terminated if the average wellcolour density reaches an optical density of 2. If curve parameters or thearea under the curve are determined, make sure you always have the samereading intervals and the same number of readings (e.g. 20). In the case of along lag-time, or low incubation temperature, incubation may be prolonged(reading interval up to 24 h).
Calculation
A. Calculation and data management (single-plate procedure)
Correct raw OD data by blanking response wells against the well showingthe minimum absorbance value (R-minimum; Insam et al., 1996). Thisblanking avoids negative values when compared to subtracting the controlwell from the response well.
Two alternatives are suggested:
1. Calculate the AWCD from each plate at each reading time. For eachplate, those time points of reading are selected that have an AWCD closestto 0.6. Alternatively, other AWCDs (e.g. 0.30, 1.00) may be chosen.2. Normalize data by dividing each well OD by AWCD (Garland and Mills,1996). This is particularly important when inoculum densities are not stan-dardized prior to inoculation. Data analysis may be further elaborated bycalculating the area under the curve for each well OD for the entire periodof incubation (Guckert et al., 1996).
Another procedure that has been used successfully is the estimation ofkinetic parameters (K, r, s) by fitting the curve of OD versus time to a den-sity-dependent logistic growth equation (Lindstrom et al., 1998):
(8.2)
where: K is the asymptote (or carrying capacity); r determines the exponen-tial rate of OD change; t is the time following inoculation of the microplates;and s is the time when the midpoint of the exponential portion of the curve(i.e. when Y =K/2) is reached.
For statistical testing of results, and in particular if the use of MANOVAis planned, inoculate a sufficient number of replicates (one ECO plate con-tains three replicates) according to ni × q = n ≥ 31 + q + 2, where: q is thenumber of groups to be compared and ni is the replicate number requiredper group (sample sizes are equal in each group). For example, if twogroups are compared, an ni > 17 is required (i.e. 6 ECO plates; Insam andHitzl, 1999).
YK
r t s= =
+ ( )ODe592 - -1
Substrate Utilization in BiologTM Plates 217

B. Calculation and data management (inoculum-density-independentprocedure)
It is generally recognized that the inoculum density highly affects the out-come of the CLPP, and different methods exist to correct for this (seeabove). We propose a method to produce a CLPP which is independent ofthe concentration of microorganisms in the environmental sample or in theinoculum. This is done by inoculating a stack of BiologTM plates with aseries of three- or tenfold dilutions of the inoculum. The pattern of attenua-tion of colour development along the dilution gradient is regarded as char-acteristic for the CLPP. The final CLPP is then derived from the relativeabundances of all BiologTM substrate conversions of a sample, which is thedifference between the amount of inoculum required for 50% response of aspecific substrate conversion in the BiologTM plate and the amount of inocu-lum required for 50% response in the BiologTM plate on average. In this way,the problem of inoculum standardization is solved.
To determine this difference, the following concept has been established(Fig. 8.3A). The amount of inoculum (e.g. in log CFU/ml or in a dilutionfactor) in the sample that causes 50% of the maximal theoretical averageresponse in a BiologTM plate is determined from a dilution series. Thereafter,the amount of inoculum that causes 50% of the maximal theoreticalresponse for a specific substrate conversion is compared to that value (bothlog transformed values), resulting in a value for the relative abundance ofthat specific substrate conversion. According to this procedure, the finalCLPP consists of 95 (in case of GN2 plates) or 31 (in case of ECO plates) rel-ative abundance values, and the average abundance is zero.
The rationale for performing dilution experiments is that the responsein the BiologTM system cannot be related directly to the amount of organ-isms in the wells, due to non-linearities (Garland, 1997). Consequently,application of a range of cell concentrations in the experimental procedureis advised to escape from estimating the BiologTM response at extrapolatedcell concentrations (Garland and Lehman, 1999; Breure and Rutgers, 2000).
The response (A, for instance normalized well colour development, nor-malized area under the curve) per substrate (s) is then plotted against thebacterial concentrations in the wells (for instance CFU/ml), which leads toa curve that can be fitted with a log normal distribution (upper line in Fig.8.3A):
(8.3)
where: t is the asymptotical maximum of the curve at infinite cell concentra-tion; log CFU is the logarithm of the number of colony-forming units; logCFU50s is the inflexion point of the curve; and h is the Hill slope (dimen-sionless). The log CFU50s gives a measure for the amount of inoculum inthe sample necessary for 50% response of the specific activity.
It is recommended to standardize the responses by dividing theobserved response by the maximum theoretical response, because t (themaximum) can then be set to 1. The maximum theoretical response can be
At
hs CFU50s log CFU=
+ −( )1 10 log
218 M. Rutgers et al.

Substrate Utilization in BiologTM Plates 219
concentration factor bacteria
10–1
0.2
0.4
0.6
0.8
1
1.2
10–6
Log relative abundance 1.1
Rel
ativ
e B
iolo
g™ r
espo
nse
(AU
C)
AUC 31 substrates (average)
AUC 1 substrate
10–5 10–4 10–3 10–2 100
(A)
–2
–1
0
1
2
1 3 5 7 9 11 13 15 17 19 21 23 25 27 29 31
Biolog™ substrate (1 to 31)
Log
(rel
ativ
e ab
unda
nce)
(B)
Fig. 8.3. Outline of the procedure to construct a community-level physiological profile(CLPP) which is essentially independent of the inoculum density. (A) A range of inoculumdensities is inoculated in a series of BiologTM plates. Upon dilution, the average response inthe BiologTM plate, or the response of an individual well (e.g. well colour development, or theintegrated colour over time), decreases. The dilution of a specific response is fitted with asigmoidal curve (Eq. 8.3). The log relative abundance (log RA) is given by the differencebetween the curve for the average response in the plate and the response for a specificsubstrate; in this example approximately +1.1. (B) In the case of ECO plates, the CLPPconsists of 31 relative abundance values; the average abundance is zero. In this example,there was no colour formation in well number 10 at the highest inoculum concentration.Accordingly, this value was artificially set to –2 (see text).

derived from a collation of all previously performed experiments with thesame experimental set-up. If this is impossible (e.g. because it is the firstexperiment) be alert for unrealistic fits with respect to the value of t.
The rationale for using Eq. (8.3) resides in the assumption that maxi-mum response can be reached by infinitely concentrating the sample, whilezero response can be reached by an infinite dilution of the sample. Thesequential dilution of a discrete number of catalytic units (e.g. microorgan-isms) is distributed according to Poisson statistics. Although the sigmoidallog-normal distribution curve (Eq. 8.3) does not exactly describe this rela-tionship, it is often used as a robust and adequate approximation (e.g.Haanstra et al., 1985).
The average response in the whole BiologTM plate (Aaverage) was calcu-lated from the responses (As). Aaverage was then plotted as a function of thecell concentration and fitted with Eq. (8.3), yielding values for the inflexionpoint (log CFU50average) and the Hill slope (lower line in Fig. 8.3A). The Hillslope gives a measure for the evenness of the BiologTM substrate conversionsin a sample. Discussion of this parameter, although valuable for biodiver-sity studies, is beyond the scope of this chapter (but see Garland andLehman, 1999; Breure and Rutgers, 2000; Franklin et al., 2001).
Per well in the BiologTM plate the log CFU50s is used to determine therelative abundance (RA) of an activity in the community:
log RAs = log CFU50s – log CFU50average (8.4)
where RA is the number of organisms (in CFU/ml) able to perform 50%activity of the specific substrate conversion relative to the number of organ-isms converting 50% of all substrates in the BiologTM plate. Consequently,the average RA is zero, a positive value indicates that the potency to con-vert this substrate is above average in the particular sample, a negativevalue vice versa. In cases where there is insufficient colour formation evenat the highest inoculum concentrations, this value is artificially set to –2(substrate number 10 in Fig. 8.3.B). In cases of too much colour formation atthe lowest inoculum concentrations, this value is artificially set to +2. In thisway, unrealistically high and low values for the relative abundance (on alogarithmic scale) will be avoided.
Ultimately, this procedure yields a CLPP of relative abundancies for all31 (ECO plates) or 95 substrate (GN2 plates) conversions (Fig. 8.3B), whichis essentially independent of the number of cells in the inoculum. The onlyprerequisite is that the highest concentration contains a sufficient amount ofcells to colour the plate for at least about 60% of the theoretical maximum.The complete calculation procedure can be automated, for instance by usingvisual basic programming in Excel. Such visual basic software has beendeveloped in the Netherlands Soil Monitoring Network (Bloem and Breure,2003).
220 M. Rutgers et al.

Data analysis (single-plate and inoculum-density-independent procedure)
The CLPPs of samples can be collated in multivariate analysis using discrimi-nant analysis (DA), principal component analysis (PCA) and/or redundancyanalysis (RDA) for exploratory data analysis, and MANOVA for statisticaltesting (applied on DA, PCA, RDA factors, or single substrates, or on sub-strate groups (such as carbohydrates, amino acids, carboxylic acids, etc.)).
Discussion
Microbial biomass forms a major part of the total biomass in soil. The num-ber of species in soil is so high that it is not possible to characterize this bio-mass by determination of the abundance and composition of the speciespresent (e.g. Torsvik et al., 1990; Dykhuizen, 1998). Here, the use of BiologTM
plates to characterize the microbial biomass in soil is described as a specifictechnique to characterize a sample of the microbial community, i.e. that partwhich is able to proliferate in the wells of the BiologTM plate.
By determination of CLPPs in BiologTM plates, it is possible to distin-guish different microbial communities by use of standardized media. Itshows the metabolic activity of substrate-responsive microbial cells, afterextraction from soil in the medium. The profile, therefore, is dependent onthe extraction efficiency, and on how well the organisms are able to metabo-lize in the medium used. By standardization of the procedure of extractionand incubation, it is possible to distinguish between communities in areproducible way.
This is especially attractive when stability or succession of communitiesin time, or due to environmental changes, is investigated. It was seen earlierthat CLPP is dependent on the density of the inoculum. Therefore, it wasproposed to standardize the amount of cells in the inoculum (Garland andMills, 1991; Garland, 1997; Preston-Mafham, 2002). An easy method forachieving this is described in this section.
Inoculum standardization does not always provide the solution to dif-ferences in cell density, because it is inherently impossible to exactly predictthe response in BiologTM plates from any enumeration technique, and alsodue to non-linearity between the cell number and the BiologTM response.The alternative is to use an inoculum-density-independent method, basedon a series of inoculum concentrations. Consequently, this method con-sumes more than one BiologTM plate per sample. It has been applied in anational survey to determine the quality of soils in The Netherlands andhas shown good reproducibility and a strong discriminating powerbetween microbial communities in different soil types and soil management(Breure and Rutgers, 2000; Schouten et al., 2000; Bloem and Breure, 2003).
CLPPs give information on stability of, and changes in, the metaboliccapacities of microbial biomass, which may relate to microbial communitystructure. However, if changes occur, it is not possible to give a causal rela-tionship between (changes in) environmental conditions and changes in
Substrate Utilization in BiologTM Plates 221

community structure. Statistical techniques have to be invoked to coupleecological effects (and stress) and CLPP responses.
In conclusion, the diversity of soil microbial communities is generallyso high that it cannot be captured by one single method. The progress madein the use of methods based on ribosomal RNA and their genes has helpedto better understand microbial communities, but such data should be care-fully evaluated. For example, most methods only look at the ‘tip of the ice-berg’ of the microbial community, or, in other words, only detect or analysethe most dominant populations, in terms of numbers of organisms, biomol-ecules or physiological characteristics. This is fine as a first attempt tounderstand the system, as long as the conclusions drawn from these dataconsider these limitations. Several pitfalls of these methods, especiallywhen based on PCR amplification, have already been recognized anddescribed (Von Wintzingerode et al., 1997). There is clearly a need for moresensitive methods that give an estimate of the entire diversity, including thepopulations that are present in lower numbers but could play a crucial rolein the habitat. In addition, all of these methods do not necessarily tell uswhich organisms are most strongly involved in the mainstream energy fluxof the ecosystem. To achieve this, molecular ecology approaches should becomplemented with metabolic mass balance studies and new techniques tocorrelate soil microbial diversity and structure with soil function. Given theextremely fast development of these newer molecular methods during onlythe past two decades, current and future research will continue to generatenew methods that will allow us to further improve our understanding ofthe structure and function of soil microbial communities.
References for Chapter 8
222 M. Rutgers et al.
Akkermans, A.D.L., van Elsas, J.D. and DeBruijn, F.J. (1995) Molecular MicrobialEcology Manual. Kluwer Academic,Dordrecht, The Netherlands.
Amann, R.I., Ludwig, W. and Schleifer, K.H.(1995) Phylogenetic identification and insitu detection of individual microbial cellswithout cultivation. MicrobiologicalReviews 59, 143–169.
Anderson, J.P.E. and Domsch, K.H. (1978) Aphysiological method for the quantitativemeasurement of microbial biomass in soil.Soil Biology and Biochemistry 10, 215–221.
Bai, Q.Y. and Zelles, L. (1997) A method fordetermination of archaeal ether-linkedglycerolipids by high performance liquidchromatography with fluorescence detec-tion as their 9-anthroyl derivatives.Chemosphere 35, 263–274.
Bligh, E.G. and Dyer, W.J. (1959) A rapid
method of total lipid extraction andpurification. Canadian Journal ofBiochemistry and Physiology 37, 911–917.
Bloem, J. and Breure, A.M. (2003) Microbialindicators. In: Markert, B.A., Breure, A.M.and Zechmeister, H.G. (eds) Bioindicatorsand Biomonitors. Elsevier, Amsterdam,pp. 259–282.
Bloem, J., Bolhuis, P.R., Veninga, M.R. andWieringa, J. (1995) Microscopic methodsfor counting bacteria and fungi in soil. In:Alef, K. and Nannipieri, P. (eds) Methodsin Applied Soil Microbiology andBiochemistry. Academic Press, Toronto,pp. 162–191.
Bochner, B. (1989) Instructions for the use ofBiolog GP and GN microplates. Biolog Inc.,Hayward, California.
Boschker, H.T.S., Nold, S.C., Wellsbury, P.,Bos, D., de Graaf, W., Pel, R., Parkes, R.J.

and Cappenberg, T.E. (1998) Direct link-ing of microbial populations to specificbiogeochemical processes by 13C-labellingof biomarkers. Nature 392, 801–805.
Bossio, D.A., Scow, K.M., Gunapala, N. andGraham, K.J. (1998) Determinants of soilmicrobial communities: effects of agricul-tural management, season, and soil typeon phospholipid fatty acid profiles.Microbial Ecology 36, 1–12.
Breure, A.M. and Rutgers, M. (2000) Theapplication of Biolog plates to charac-terise microbial communities. In:Benedetti, A., Tittarelli, F., de Bertoldi, S.and Pinzari, F. (eds) Proceedings of theCOST Action 831, Joint Working GroupMeeting Biotechnology of Soil, Monitoring,Conservation and Bioremediation. 10–11December 1998, Rome, Italy, (EUR 19548),pp. 179–185.
Buyer, J.S. and Drinkwater, L.E. (1997)Comparison of substrate utilization assayand fatty acid analysis of soil microbialcommunities. Journal of MicrobiologicalMethods 30, 3–11.
Duarte, G.F., Rosado, A.S. and van Elsas, J.D.(1998) Extraction of ribosomal RNA andgenomic DNA from soil for studying thediversity of the indigenous bacterial com-munity. Journal of Microbiological Methods32, 21–29.
Dykhuizen, D.E. (1998) Santa Rosalia revis-ited: why are there so many species ofbacteria. Antonie van Leeuwenhoek 73,25–33.
Fang, J., Barcelona, M.J. and Alvarez, P.J.J.(2000) A direct comparison between fattyacid analysis and intact phospholipid pro-filing for microbial identification. OrganicGeochemistry 31, 881–887.
Franklin, R.B., Garland, J.L., Bolster, C.H.and Mills, A.L. (2001) Impact of dilutionon microbial community structure andfunctional potential: comparisons ofnumerical simulations and batch cultureexperiments. Applied and EnvironmentalMicrobiology 67, 702–712.
Fritze, H., Tikka, P., Pennanen, T., Saano, A.,Jurgens, G., Nilsson, M., Bergman, I. andKitunen, V. (1999) Detection of Archaealdiether lipid by gas chromatography from
humus and peat. Scandinavian Journal ofForest Research 14, 545–551.
Frostegård, Å. and Bååth, E. (1996) The useof phospholipid fatty acid analysis to esti-mate bacterial and fungal biomass in soil.Biology and Fertility of Soils 22, 59–65.
Frostegård, Å., Bååth, E. and Tunlid, A.(1993) Shifts in the structure of soil micro-bial communities in limed forests asrevealed by phospholipid fatty acidanalysis. Soil Biology and Biochemistry 25,723–730.
Gamo, M. and Shoji, T. (1999) A method ofprofiling microbial communities based ona most-probable-number assay that usesBiolog plates and multiple sole carbonsources. Applied and EnvironmentalMicrobiology 65, 4419–4424.
Garland, J.L. (1997) Analysis and interpreta-tion of community-level physiologicalprofiles in microbial ecology. FEMSMicrobiology Ecology 24, 289–300.
Garland, J.L. and Lehman, R.M. (1999)Dilution/extinction of community pheno-typic characters to estimate relative struc-tural diversity in mixed communities.FEMS Microbiology Ecology 30, 333–343.
Garland, J.L. and Mills, A.L. (1991)Classification and characterization of het-erotrophic microbial communities on thebasis of patterns of community-level-sole-carbon-source-utilization. Applied andEnvironmental Microbiology 57, 2351–2359.
Garland, J.L. and Mills, A.L. (1996) Patternsof potential C source utilization by rhizos-phere communities. Soil Biology andBiochemistry 28, 223–230.
Gomes, N.C.M., Costa, R. and Smalla, K.(2004) Rapid simultaneous extraction ofDNA and RNA from bulk and rhizos-phere soil. In: Kowalchuk, G.A., DeBruijn, F.J., Head, I.M., Akkermans, A.D.and van Elsas, J.D. (eds) MolecularMicrobial Ecology Manual, 2nd edn.Kluwer Academic, Dordrecht, TheNetherlands, pp. 159–170.
Grayston, S.J. and Campbell, C.D. (1995)Functional biodiversity of microbial com-munities in the rhizopheres of hybridlarch (Larix eurolepis) and Sitka spruce(Picea sitchensis). Tree Physiology 16,1031–1038.
Soil Microbial Diversity and Community Composition 223

Grayston, S.J., Wang, S., Campbell, C.D. andEdwards, A.C. (1998) Selective influenceof plant species on microbial diversity inthe rhizosphere. Soil Biology andBiochemistry 30, 369–378.
Grayston, S.J., Griffith, G.S., Mawdsley, J.L.,Campbell, C.D. and Bardgett, R.D. (2001)Accounting for variability in soil micro-bial communities of temperate uplandgrassland ecosystems. Soil Biology andBiochemistry 33, 533–551.
Griffith, R.I., Whiteley, A.S., O’Donnell, A.G.and Bailey, M.J. (2000) Rapid method forcoextraction of DNA and RNA from nat-ural environments for analysis of riboso-mal DNA- and rRNA-based microbialcommunity composition. Applied andEnvironmental Microbiology 66, 5488–5491.
Guckert, J.B., Carr, G.J., Johnson, T.D.,Hamm, B.G., Davidson, D.H. andKumagai, Y. (1996) Community analysisby Biolog: curve integration for statisticalanalysis of activated sludge microbialhabitats. Journal of Microbiological Methods27, 183–197.
Haack, S.K., Garchow, H., Odelson, D.A.,Forney, L.J. and Klug, M.J. (1994)Accuracy, reproducibility, and interpreta-tion of fatty acid methyl ester profiles ofmodel bacterial communities. Applied andEnvironmental Microbiology 60, 2483–2493.
Haack, S.K., Garchow, H., Klug, M.J. andForney, L.J. (1995) Analysis of factorsaffecting the accuracy, reproducibility,and interpretation of microbial commu-nity carbon source utilizations. Appliedand Environmental Microbiology 61,1458–1468.
Haanstra, L., Doelman, P. and Oude Voshaar,J.H. (1985) The use of sigmoidal doseresponse curves in soil ecotoxicologicalresearch. Plant and Soil 84, 293–297.
Harwood, J.L. and Russel, N.J. (1984) Lipidsin Plants and Microbes. George Allen &Unwin Ltd, London.
Heuer, H. and Smalla, K. (1997) Evaluationof community-level catabolic profilingusing Biolog GN microplates to studymicrobial community changes in potatophyllosphere. Journal of MicrobiologicalMethods 30, 49–61.
Heuer, H., Hartung, K., Wieland, G., Kramer,I. and Smalla, K. (1999) Polynucleotideprobes that target a hypervariable regionof 16S rRNA genes to identify bacterialisolates corresponding to bands of com-munity fingerprints. Applied andEnvironmental Microbiology 65, 1045–1049.
Hooper, D., Hawksworth, D. and Dhillion, S.(1995) Microbial diversity and ecosystemprocesses. In: Heywood, V.H. andWatson, R.T. (eds) Global BiodiversityAssessment. Cambridge University Press,Cambridge, pp. 433–443.
Hopkins, D.W., MacNaughton, S.J. andO’Donnell, A.G. (1991) A dispersion anddifferential centrifugation technique forrepresentatively sampling microorgan-isms from soil. Soil Biology andBiochemistry 23, 217–225.
Hurt, R.A., Qiu, X., Wu, L., Roh, Y., Palumbo,A.V., Tiedje, J.M. and Zhou, J. (2001)Simultaneous recovery of RNA and DNAfrom soils and sediments. Applied andEnvironmental Microbiology 67, 4495–4503.
Insam, H. (1997) A new set of substrates pro-posed for community characterization inenvironmental samples. In: Insam, H. andRangger, A. (eds) Microbial Communities.Springer-Verlag, Heidelberg, pp. 259–260.
Insam, H. and Hitzl, W. (1999) Data evalua-tion of community level physiological pro-files: a reply to the letter of PJA Howard.Soil Biology and Biochemistry 31, 1198–1200.
Insam, H., Amor, K., Renner, M. and Crepaz,C. (1996) Changes in functional abilities ofthe microbial community during compost-ing of manure. Microbial Ecology 31, 77–87.
Konopka, A., Oliver, L. and Turco, J.R. (1998)The use of carbon substrate utilizationpatterns in environmental and ecologicalmicrobiology. Microbiology Ecology 35,103–115.
Kowalchuk, G.A., De Bruijn, F.J., Head, I.M.,Akkermans, A.D.L. and van Elsas, J.D.(2004) Molecular Microbial Ecology Manual,2nd edn. Kluwer Academic, Dordrecht,The Netherlands.
Kozdrój, J. and van Elsas, J.D. (2001a)Structural diversity of microorganisms inchemically perturbed soil assessed bymolecular and cytochemical approaches.
224 Soil Microbial Diversity and Community Composition

Journal of Microbiological Methods 43,197–212.
Kozdrój, J. and van Elsas, J.D. (2001b)Structural diversity of microbial commu-nities in arable soils of a heavily industri-alised area determined by PCR-DGGEfingerprinting and FAME profiling.Applied Soil Ecology 17, 31–42.
Lindstrom, J.E., Barry, R.P. and Braddock, J.F.(1998) Microbial community analysis: akinetic approach to constructing potentialC source utilization patterns. Soil Biologyand Biochemistry 30, 231–239.
Macnaughton, S.J., Jenkins, T.J., Wimpee,M.H., Cormiér, M.R. and White, D.C.(1997) Rapid extraction of lipid biomark-ers from pure culture and environmentalsamples using pressurized accelerated hotsolvent extraction. Journal of MicrobiologicalMethods 31, 19–27.
Miller, M., Palojärvi, A., Rangger, A., Reeslev,M. and Kjoller, A. (1998) The use of fluo-rogenic substrates to measure fungalpresence and activity in soil. Applied andEnvironmental Microbiology 64, 613–617.
Moré, M.I., Herrick, J.B., Silva, M.C., Ghiorse,W.C. and Madsen, E.L. (1994) Quantitativecell lysis of indigenous microorganismsand rapid extraction of microbial DNAfrom sediment. Applied and EnvironmentalMicrobiology 60, 1572–1580.
Morgan, J.A.W. and Winstanley, C. (1997)Microbial biomarkers. In: van Elsas, J.D.,Trevors, J.T. and Wellington, E.M.H. (eds)Modern Soil Microbiology. Marcel Dekker,New York, pp. 331–352.
Nichols, P.D., Guckert, J.B. and White, D.C.(1986) Determination of monounsaturatedfatty acid double-bond position andgeometry for microbial monocultures andcomplex consortia by capillary GC–MS oftheir dimethyl disulphide adducts. Journalof Microbiological Methods 5, 49–55.
Nielsen, P. and Petersen, S.O. (2000) Ester-linked polar lipid fatty acid profiles of soilmicrobial communities: a comparison ofextraction methods and evaluation ofinterference from humic acids. Soil Biologyand Biochemistry 32, 1241–1249.
Noble, P.A., Almeida, J.S. and Lovell, C.R.(2000) Application of neural computing
methods for interpreting phospholipidfatty acid profiles of natural microbialcommunities. Applied and EnvironmentalMicrobiology 66, 694–699.
Nüsslein, K. and Tiedje, J.M. (1998)Characterization of the dominant and raremembers of a young Hawaiian soil bacte-rial community with small-subunit ribo-somal DNA amplified from DNAfractionated on the basis of its guanineand cytosine composition. Applied andEnvironmental Microbiology 64, 1283–1289.
O’Connell, S.P., Lehman, R.M. and Garland,J.L. (2001) Biolog media formulation (GN2vs. GN) affects microbial community-levelphysiological profiles. Proceedings of the 9thInternational Symposium on MicrobialEcology. Amsterdam, p. 164.
Ogram, A., Sayler, G.S. and Barkay, T.J.(1987) DNA extraction and purificationfrom sediments. Journal of MicrobiologicalMethods 7, 57–66.
Olsson, P.A. (1999) Signature fatty acids pro-vide tools for determination of the distrib-ution and interactions of mycorrhizalfungi in soil. FEMS Microbiology Ecology29, 303–310.
Palojärvi, A. and Albers, B. (1998) Extraktionund Bestimmung membrangebundenerPhospholipidfettsäuren. In: Remde, A.and Tippmann, P. (eds). MikrobiologischeCharakterisierung aquatischer Sedimente–Methodensammlung. Vereinigung fürAllgemeine und Angewandte Mikrobiologie(VAAM). R. Oldenbourg Verlag, München,pp. 187–195.
Palojärvi, A., Sharma, S., Rangger, A., vonLützow, M. and Insam, H. (1997)Comparison of Biolog and phospholipidfatty acid patterns to detect changes inmicrobial community. In: Insam, H. andRangger, A. (eds) Microbial Communities.Functional versus Structural Approaches.Springer Verlag, Berlin, pp. 37–48.
Pankhurst, C.E., Ophel-Keller, K., Doube,B.M. and Gupta, V.V.S.R. (1996)Biodiversity of soil microbial communi-ties in agricultural systems. Biodiversityand Conservation 5, 197–209.
Pennanen, T. (2001) Microbial communitiesin boreal coniferous forest humus
Soil Microbial Diversity and Community Composition 225

exposed to heavy metals and changes insoil pH – a summary of the use of phos-pholipid fatty acids, Biolog® and 3H-thymidine incorporation methods in fieldstudies. Geoderma 100, 91–126.
Petersen, S.O. and Klug, M.J. (1994) Effects ofsieving, storage, and incubation tempera-ture on the phospholipid fatty acid profileof a soil microbial community. Applied andEnvironmental Microbiology 60, 2421–2430.
Petersen, S.O., Debosz, K., Schjonning, P.,Christensen, B.T. and Elmholt, S. (1997)Phospholipid fatty acid profiles and Cavailability in wet-stable macro-aggre-gates from conventionally and organicallyfarmed soils. Geoderma 78, 181–196.
Petersen, S.O., Frohne, P.S. and Kennedy,A.C. (2002) Dynamics of a soil microbialcommunity under spring wheat. SoilScience Society of America Journal 66,826–833.
Pillai, S.D., Josephson, K.L., Bailey, R.L.,Gerba, C.P. and Pepper, I.L. (1991) Rapidmethod for processing soil samples forpolymerase chain reaction amplificationof specific gene sequences. Applied andEnvironmental Microbiology 57, 2283–2286.
Porteous, L.A. and Armstrong, J.L. (1991)Recovery of bulk DNA from soil by arapid, small-scale extraction method.Current Microbiology 22, 345–348.
Preston-Mafham, J., Boddy, L. andRanderson, P.F. (2002) Analysis of micro-bial community functional diversity usingsole-carbon source utilisation profiles, acritique. FEMS Microbiology Ecology 42,1–14.
Rademaker, J. (1995) Analysis of molecularfingerprints. In: Akkermans, A.D.L., vanElsas, J.D. and De Bruijn, F.J. (eds)Molecular Microbial Ecology Manual.Kluwer Academic, Dordrecht, TheNetherlands.
Roslev, P., Iversen, N. and Henriksen, K.(1998) Direct fingerprinting of metaboli-cally active bacteria in environmentalsamples by substrate specific radiola-belling and lipid analysis. Journal ofMicrobiological Methods 31, 99–111.
Rutgers, M. and Breure, A.M. (1999) Riskassessment, microbial communities, and
pollution-induced community tolerance.Human and Ecological Risk Assessment 5,661–670.
Sambrook, J., Fritsch, E.F. and Maniatis, T.(1989) Molecular Cloning. A LaboratoryManual, 2nd edn. Cold Spring HarborLaboratory Press, Cold Spring Harbor,New York.
Schloter, M., Zelles, L., Hartmann, A. andMunch, J.C. (1998) New quality of assess-ment of microbial diversity in arable soilsusing molecular and biochemical meth-ods. Journal of Plant Nutrition and SoilScience 161, 425–431.
Schouten, T., Bloem, J., Didden, W.A.M.,Rutgers, M., Siepel, H., Posthuma, L. andBreure, A.M. (2000) Development of a bio-logical indicator for soil quality. SetacGlobe 1, 30–33.
Seghers, D., Verthé, K., Reheul, D., Bulcke, R.,Siciliano, S.D., Verstraete, W. and Top, E.M.(2003) Effect of long-term herbicide appli-cations on the bacterial community struc-ture and function in an agricultural soil.FEMS Microbiology Ecology 46, 139–146
Selenska, S. and Klingmüller, W. (1991a)Direct detection of nif-gene sequences ofEnterobacter agglomerans in soil. FEMSMicrobiology Letters 80, 243–246.
Selenska, S. and Klingmüller, W. (1991b)DNA recovery and direct detection of Tn5sequences from soil. Letters in AppliedMicrobiology 13, 21–24.
Siira-Pietikäinen, A., Haimi, J., Kanninen, A.,Pietikäinen, J. and Fritze, H. (2001)Responses of decomposer community toroot-isolation and addition of slash. SoilBiology and Biochemistry 33, 1993–2004.
Smalla, K., Cresswell, N., Mendonca-Hagler,L.C., Wolters, A.C. and van Elsas, J.D.(1993a) Rapid DNA extraction protocolfrom soil for polymerase chain reaction-mediated amplification. Journal of AppliedBacteriology 74, 78–85.
Smalla, K., Van Overbeek, L.S., Pukall, R.and van Elsas, J.D. (1993b) Prevalence ofnptII and Tn5 in kanamycin-resistant bac-teria from different environments. FEMSMicrobiology Ecology 13, 47–58.
Steffan, R.J., Goksoyr, J., Bej, A.K. and Atlas,R.M. (1988) Recovery of DNA from soils
226 Soil Microbial Diversity and Community Composition

and sediments. Applied and EnvironmentalMicrobiology 54, 2908–2915.
Tebbe, C.C. and Vahjen, W. (1993)Interference of humic acids and DNAextracted directly from soil in detectionand transformation of recombinant DNAfrom bacteria and a yeast. Applied andEnvironmental Microbiology 59, 2657–2665.
Torsvik, V.L. (1980) Isolation of bacterialDNA from soil. Soil Biology andBiochemistry 12, 18–21.
Torsvik, V., Goksøyr, J. and Daae, F.L. (1990)High diversity of DNA of soil bacteria.Applied and Environmental Microbiology 56,782–787.
Trevors, J.T. and van Elsas, J.D. (1989) Areview of selected methods in environ-mental microbial genetics. CanadianJournal of Microbiology 35, 895–902.
Tsai, Y.-L. and Olson, B.H. (1992) Detection oflow numbers of bacterial cells in soils andsediments by polymerase chain reaction.Applied and Environmental Microbiology 58,754–757.
Vainio, E.J. and Hantula, J. (2000) Directanalysis of wood-inhabiting fungi usingdenaturing gradient gel electrophoresis ofamplified ribosomal DNA. MycologyResearch 104, 927–936.
van Elsas, J.D., Van Overbeek, L.S. andFouchier, R. (1991) A specific marker, pat,for studying the fate of introduced bacte-ria and their DNA in soil using a combi-nation of detection techniques. Plant andSoil 138, 49–60.
van Elsas, J.D., Mantynen, V. and Wolters,A.C. (1997) Soil DNA extraction andassessment of the fate of Mycobacteriumchlorophenolicum strain PCP-1 in differentsoils via 16S ribosomal RNA genesequence based most-probable-numberPCR and immunofluorescence. Biologyand Fertility of Soils 24, 188–195.
van Elsas, J.D., Smalla, K. and Tebbe, C.C.(2000) Extraction and analysis of microbialcommunity nucleic acids from environ-mental matrices. In: Jansson, J., van Elsas,J.D. and Bailey, M. (eds) Tracking GeneticallyEngineered Micro-organisms. LandesBioscience, Austin, Texas, pp. 29–52.
Van Overbeek, L.S., Van Vuurde, J.W.L. andvan Elsas, J.D. (2005) Application of mole-cular fingerprinting techniques for study-ing shifts in bacterial endophyticcommunities. In: Schultz, B. and Boyle, C.(eds) Bacterial Endophytes. Springer Verlag,Heidelberg (in press).
Von Wintzingerode, F., Göbel, U.B. andStackebrandt, E. (1997) Determination ofmicrobial diversity in environmental sam-ples: pitfalls of PCR-based rRNA analysis.FEMS Microbiology Reviews 21, 213–229.
White, D.C. (1988) Validation of quantitativeanalysis for microbial biomass, commu-nity structure, and metabolic activity.Archiv für Hydrobiologie Beihefte 31, 1–18.
White, D.C., Davis, W.M., Nickels, J.S., King,J.C. and Bobbie, R.J. (1979) Determinationof the sedimentary microbial biomass byextractible lipid phosphate. Oecologia 40,51–62.
White, D.C., Flemming, C.A., Leung, K.T.and MacNaughton, S.J. (1998) In situmicrobial ecology for quantitativeappraisal, monitoring, and risk assess-ment of pollution remediation in soils, thesubsurface, the rhizosphere and inbiofilms. Journal of Microbiological Methods32, 93–105.
Widmer, F., Fließbach, A., Laczko, E.,Schulze-Aurich, J. and Zeyer, J. (2001)Assessing soil biological characteristics: acomparison of bulk soil communityDNA-, PLFA-, and BiologTM-analyses. SoilBiology and Biochemistry 33, 1029–1036.
Zelles, L. (1999) Fatty acid patterns of phos-pholipids and lipopolysaccharides in thecharacterisation of microbial communitiesin soil: a review. Biology and Fertility ofSoils 29, 111–129.
Zelles, L. and Bai, Q.Y (1994) Fatty acid pat-terns of phospholipids and lipopolysac-charides in environmental samples.Chemosphere 28, 391–411.
Zelles, L., Palojärvi, A., Kandeler, E., vonLützow, M., Winter, K. and Bai, Q.Y.(1997) Changes in soil microbial proper-ties and phospholipid fatty acid fractionsafter chloroform fumigation. Soil Biologyand Biochemistry 29, 1325–1336.
Soil Microbial Diversity and Community Composition 227

9 Plant–Microbe Interactions andSoil Quality
9.1 Microbial Ecology of the Rhizosphere
PHILIPPE LEMANCEAU,1 PIERRE OFFRE,1 CHRISTOPHE MOUGEL,1
ELISA GAMALERO,2 YVES DESSAUX,3 YVAN MOËNNE-LOCCOZ4 AND
GRAZIELLA BERTA2
1UMR 1229 INRA/Université de Bourgogne, ‘Microbiologie etGéochimie des Sols’, INRA-CMSE, 17 rue Sully, BP 8651021065, Dijon cedex, France; 2Università del PiemonteOrientale ‘Amedeo Avogadro’, Department of Science andAdvanced Technology, Corso Borsalino 54, 15100 Alessandria,Italy; 3Institut des Sciences du Végétal, CNRS, UPR2355,Bâtiment 23, Avenue de la Terrasse, 91198 Gif-sur-Yvette,France; 4UMR CNRS 5557 Ecologie Microbienne, UniversitéClaude Bernard (Lyon 1), 43 bd du 11 Novembre, 69622Villeurbanne cedex, France
Soils are known to be oligotrophic environments, whereas the soil micro-biota is mostly heterotrophic, and consequently microbial growth in soil ismainly limited by the scarce sources of readily available carbon (Wardle,1992). Therefore, in soils, the microbiota is mostly in stasis (fungistasis/bac-teriostasis) (Lockwood, 1977). In contrast, plants are autotrophic organismsresponsible for most of the primary production resulting from photosynthe-sis. Significant amounts of photosynthetates are released from the plantroots to the soil, through a process called rhizodeposition. These productscomprise exudates, lysates, mucilage, secretions and compounds releasedfrom dead/dying sloughed-off cells, as well as gases including respiratoryCO2 and ethylene. Depending on plant species, age and environmental con-ditions, rhizodeposits can account for up to 40% of net fixed carbon (Lynchand Whipps, 1990). On average, 17% of net fixed carbon appears to be
©CAB International 2006. Microbiological Methods for Assessing Soil Quality228 (eds J. Bloem et al.)

released by the roots (Nguyen, 2003). This significant release of carbohy-drates in the soil by the plant roots stimulates the density and activity of themicrobiota located closely to the roots but also affects the physico-chemicalproperties of the neighbouring soil (Rovira, 1965; Curl and Truelove, 1986;Lynch and Whipps, 1990). Altogether, the modifications of the biologicaland physico-chemical properties of the soil induced by plant roots arecommonly called the rhizosphere effect; the rhizosphere, as proposed onecentury ago by Hiltner (1904), being the volume of soil surrounding roots inwhich the microflora is influenced by these roots.
Besides trophic interactions, the relations between plants and microor-ganisms are also mediated by toxic compounds involved in plant defencereactions against soilborne pathogens (Bais et al., 2004); similarly, varioussoilborne microbial populations have the ability to produce antibioticscontributing to their ecological fitness, which is especially important in acompetitive environment such as the rhizosphere (Mazzola et al., 1992).
Altogether these characteristics of the rhizosphere lead to the fact thatnot all microbial groups and populations are equally stimulated by the rhi-zodeposits. Specific microbial groups and populations have clearly beenshown to be preferentially associated with plant roots (Mavingui et al., 1992;Lemanceau et al., 1995; Edel et al., 1997). These populations, which areselected by the plant, are better adapted than the others to the rhizosphereenvironment. As an example, populations of fluorescent pseudomonadsassociated with the roots differ from soil counterparts in terms of carbon andenergetic metabolism: they are more frequently able to use specific organiccompounds such as trehalose (electron donors) and they show a higher abil-ity to mobilize ferric iron and to dissimilate nitrogen oxides (electron accep-tors) (Lemanceau et al., 1988, 1995; Clays-Josserand et al., 1995; Frey et al.,1997). Populations able to develop strategies to counteract toxic compoundsproduced by the host plant or by other root-associated microbial popula-tions will have a competitive advantage over the others (Duffy et al., 2003).
In plant-selected microbial populations, the rapid adaptation of themetabolism to the changing conditions of the rhizosphere relies on theirability to perceive the variations of the environment. Among the perceptionsystems described so far, two-component systems allow bacteria to senseand respond to a wide range of environmental changes. The minimal sys-tem consists of two proteins: a sensor and a transducer (Stock et al., 1989).Signalling in the rhizosphere also involves microbe–microbe communica-tion. This is the case of the so-called ‘quorum sensing system’, which allowsbacterial populations to sense their densities and to regulate cell physiology,including enzyme and antibiotic synthesis at the population level, makingtheir response to the environmental variation more efficient and concerted(Whitehead et al., 2001). Signalling also occurs between plants andmicrobes. Various regulatory signals are perceived by receptors and trans-duced via downstream effectors, and they mediate information that caninfluence plant–microbe interactions. The corresponding signal moleculesare difficult to detect and so far only a few of them have been described(Hirsch et al., 2003). However, well-known examples are the isoflavonoids
Microbiological Ecology of the Rhizosphere 229

and flavonoids present in root exudates of various leguminous plants,which activate Rhizobium genes responsible for the nodulation process(Peters, 1986; Bais et al., 2004).
Trophic and toxic-mediated interactions, together with communications,lead to the selection of the most adapted populations, to variations of theirphysiology, and then to shifts in the structure and activity of the microbialcommunity. These variations are known to affect plant health and growth.Depending on its persistence, the rhizosphere effect may not only affect thegrowth and health of the current crop, but may also affect the soil quality.
The rhizosphere, being a major hot-spot for soil microorganisms, isexpected to affect various parameters relevant for soil quality: soil(micro)structure, degradation and mineralization of organic xenobiotic com-pounds, mobilization and speciation of heavy metals, contribution to thephytoextraction of these toxic elements, enrichment of symbiotic and free-living microbial populations favourable to plant growth and health. The soilquality determined by the indigenous microbial populations will affect thegrowth and health of the plants. In this way, plant–microbe interactionsmay be considered as a feedback loop, in which: (i) the plant modifies theenvironment of soilborne microorganisms through the release of variouscompounds; (ii) these variations are perceived by the soil microbiota; (iii)this perception by specific populations leads to a variation of their physiol-ogy and the selection of the populations most adapted, and in turn to a shiftin the microbial community and activity; and (iv) these variations affect thegrowth and health of the plant and then root exudation patterns, in such away that the rhizosphere environment is being modified. This feedbackloop is a dynamic process submitted to a continuous incrementation,which, in the long term, drives the coevolution of plant and associatedmicroorganisms.
A major challenge in the study of rhizosphere ecology is to makeprogress in our knowledge of the impact of the plant on the soilbornemicrobiota. Indeed, the rhizosphere effect appears to be plant- and evencultivar-specific. These studies have to take into account not only specificmicrobial groups and culturable populations, but also microbial communi-ties, in an untargeted way. The expected output of the correspondingresearch will be to monitor the indigenous microbiota via the cultivation ofspecific plant genotypes and the application of particular agricultural prac-tices (crop rotation, intercropping) in order to favour beneficial indigenouspopulations and disfavour those that are detrimental for the plant and,more generally, for soil quality.
In the present chapter, information will be given on methods to: (i)assess soil quality in relation to the contribution of nodulating symbioticbacteria promoting growth of legumes via nitrogen fixation; (ii) usearbuscular mycorrhiza for characterization of soil quality in relation toecotoxicology; (iii) assess the phytosanitary soil quality resulting fromboth antagonistic and pathogenic microbial populations; and (iv) assessindigenous populations of free-living plant-beneficial microorganisms.
230 P. Lemanceau et al.

9.2 Nodulating Symbiotic Bacteria and Soil Quality
ALAIN HARTMANN,1 SYLVIE MAZURIER,1 DULCE N. RODRÍGUEZ-NAVARRO,2
FRANCISCO TEMPRANO VERA,2 JEAN-CLAUDE CLEYET-MAREL,3
YVES PRIN,3 ANTOINE GALIANA,3 MANUEL FERNÁNDEZ-LÓPEZ,4
NICOLÁS TORO4 AND YVAN MOËNNE-LOCCOZ5
1UMR 1229 INRA/Université de Bourgogne, ‘Microbiologie etGéochimie des Sols’, INRA-CMSE, BP 86510, 21065 Dijoncedex, France; 2Centro de Investigación y Formación Agraria(CIFA), Las Torres y Tomejil, Aparatdo Oficial, E-41200 Alcaládel Río (Sevilla), Spain; 3Laboratoire des SymbiosesTropicales et Méditerranéennes, UMR INRA/IRD/CIRAD/AGRO-M 1063, Campus International de Baillarguet, 34398Montpellier cedex 5, France; 4Grupo de Ecología Genética,Estación Experimental del Zaidín, Consejo Superior deInvestigaciones Científicas, Profesor Albareda 1, 18008Granada, Spain; 5UMR CNRS 5557 Ecologie Microbienne,Université Claude Bernard (Lyon 1), 43 bd du 11 Novembre,69622 Villeurbanne cedex, France
Introduction
Several bacterial taxa are involved in symbiotic interactions with plantroots, in which the microorganism nodulates the root and fixes nitrogen.These diazosymbiotic bacteria include five genera (Rhizobium,Mesorhizobium, Sinorhizobium, Azorhizobium and Bradyrhizobium; often collec-tively referred to as rhizobia) and close to 30 species of the Rhizobiaceaefamily (Young et al., 2001), which are associated with plants (designated aslegumes) from the three botanical families Papilionoideae, Mimosoideae andCesalpinioideae, as well as an actinobacterial genus (Frankia), which nodu-lates non-legume plants such as Alnus or Casuarina. The diversity of rhizo-bial populations in soil has been studied extensively. For a majority ofrhizobial species, the ability to engage in a symbiotic relationship with alegume implies plasmid-borne genes. Recently, the documented range ofbacterial partners capable of nitrogen fixation within legume nodules hasbeen revised with the inclusion of another α-proteobacterium(Methylobacterium nodulans; Sy et al., 2001) and of �-proteobacteria (Moulinet al., 2001). Here, we will focus on diazosymbionts from the α-proteobacte-ria interacting with legumes (Table 9.1), and adopt the usual term ‘rhizobia’to designate these bacteria.
© CAB International 2006. Microbiological Methods for Assessing Soil Quality231

232 A. Hartmann et al.
Table 9.1. List of known rhizobia–legume symbiotic interactions. Names of legumesnodulated by more than one rhizobial species are in bold.
Bacterial symbiont (genus, speciesand biovar) Principal host legumes
RhizobiumR. leguminosarum
bv. viciae Pisum (pea), Lens, Lathyrus, Viciabv. trifolii Trifoliumbv. phaseoli Phaseolus (bean)
R. tropici Phaseolus (bean), Leucaena, etc.R. etli
bv. phaseoli Phaseolus (bean)bv. mimosae Mimosa affinis
R. gallicumbv. gallicum Phaseolus (bean), Onobrychis, Leucaena, etc.bv. phaseoli Phaseolus (bean)
R. giardiniibv. giardinii Phaseolus (bean), Leucaena, etc.bv. phaseoli Phaseolus (bean)
R. galegae Galega spp.R. hainanense Desmodium spp., etc.R. mongolense Medicago ruthenicaR. huautlense Sesbania spp.R. undicola Neptunia natansR. yanglingense Amphicarpaea, Coronilla, etc.
SinorhizobiumS. meliloti Medicago, Trigonella, MelilotusS. fredii Glycine max (soybean), etc.S. teranga
bv. sesbaniae Sesbania, etc.bv. acaciae Acacia
S. sahelibv. sesbaniae Sesbania, etc.bv. acaciae Acacia
S. medicae MedicagoS. morelense Leucaena leucocephala
MesorhizobiumM. loti LotusM. huakuii Astragalus sinicusM. ciceri Cicer arietinumM. mediterraneum Cicer arietinumM. tianshanense Glycine max (soybean), Glycyrrhiza, etc.M. plurifarium Acacia, LeucaenaM. amorphae Amorpha fruticosaM. chacoense Prosopis alba
BradyrhizobiumB. japonicum Glycine max (soybean)B. elkanii Glycine max (soybean)B. liaoningensis Glycine max (soybean)
AzorhizobiumA. caulinodans Sesbania rostrata

The legume–rhizobia symbiosis is extremely important for the nitrogencycle in natural terrestrial ecosystems, as well as under agronomic condi-tions. Indeed, in traditional crop rotation systems, it has been used toenhance soil fertility and the productivity of non-legume crops sinceancient times (Tilman, 1998), long before the identification by Hellriegel andWilfarth (1888) of rhizobia as the source of fixed nitrogen in root nodules.Certain legumes are major crops throughout the world, and grain legumesare grown over almost 1.5 million km2 of land each year, half of which iscultivated with soybean. Forage legumes cover about 30 million km2, thethree dominant genera being Trifolium, Lotus and Medicago. Legumes arealso grown in mixed cropping systems (for example a legume and a cereal),or can be used as green manure. In addition, ligneous legumes are usefulfor restoring degraded soils or establishing a plant cover on nitrogen-poormineral substrates. Compared with the use of nitrogen fertilizers, legume-based biological nitrogen fixation (BNF) is more environmentally friendly;thus, optimizing its potential may contribute to improved soil quality andsoil preservation.
BNF can fix up to 250 kg N/ha, even more for some legumes, and it is aless expensive source of nitrogen compared with nitrogen fertilizers. In cer-tain situations, however, the symbiosis does not function well, due to theabsence, or low numbers, of appropriate rhizobia in soil, or the presence ofnodulating rhizobia that are poor nitrogen fixers. Inoculation of the specificand efficient rhizobial symbiont can greatly improve BNF and consequentlythe yield of the corresponding legume. Soil and climatic conditions (e.g.extreme soil pH, salinity, tillage, temperature stress, drought, availability ofmineral nutrients and chemical residues) can affect the numbers and/or thediversity of rhizobial populations, and the functioning of BNF. For instance,the detrimental effects of heavy metals on indigenous rhizobial populationsare well established.
In this section, methods available to assess the legume–rhizobia symbioticinteraction are presented. Relevant objectives when addressing the variouscomponents of soil quality include the detection (i.e. soil nodulating potential;pp. 233–236) and enumeration (by a MPN approach; pp. 236–240) of nodulat-ing rhizobia indigenous to soil, the assessment of the symbiotic efficacy ofindigenous rhizobial populations (pp. 241–243), and the estimation of theamount of plant nitrogen derived from symbiotic fixation (pp. 243–247).
Detection of Indigenous Rhizobia in Soil and Assessment of SoilNodulating Potential
Introduction
Some legume species are nodulated exclusively by one rhizobial species(e.g. lucerne) or even by a given biovar of one species (e.g. pea, clover).Other legumes are more permissive, as they can be nodulated by strainsbelonging to different species or even genera of rhizobia (e.g. soybean,
Nodulating Symbiotic Bacteria and Soil Quality 233

bean). Conversely, rhizobial strains may exhibit a narrow or wide hostrange (Amarger, 2001). The soil nodulating potential corresponds to theability of soil to support legume nodulation, which is a prerequisite for theexpression of beneficial effects from symbiotic nitrogen fixation. Thus, thesoil nodulating potential can be estimated as the ability to nodulate a givenlegume, or by the occurrence of nodulating strains from a given rhizobialspecies.
Different methods can be chosen to detect (and/or enumerate) rhizobiafrom soil. Plant infection tests have been used extensively, since there is nospecific medium for direct counting of rhizobia in soil. Experimentaldesigns and protocols for plant infection tests vary with the legume stud-ied, and have been described in the literature (Vincent, 1970; Somasegaranand Hoben, 1994). These methods are presented here, particularly in thecase of large-seeded legumes such as soybean or bean, for the detection(and, in the next section, the enumeration) of rhizobial symbionts.
Principle of the methods
When the objective is merely to assess whether or not nodulating rhizobiaare present in soil, the occurrence of nodules on roots of the appropriatelegume is a sufficient criterion. Since certain rhizobial strains can nodulate,but fix little or no nitrogen (i.e. ineffective strains), it may be useful to usescoring systems that integrate nodule repartition, size and/or internalcolour (Dommergues et al., 1999), because these three parameters may beindicative of symbiotic efficacy. For instance, nitrogen fixation is more likelyto occur in big, pink nodules than in small, white nodules. Indeed, suchnodulation scores often correlate well with indices of plant growth such asfoliage dry matter and nitrogen content (Brockwell et al., 1982). When fieldsare grown with legumes, this approach may be implemented directly bysampling the root system of field-grown legumes and scoring the extent ofnodulation. Nodulation scores can be particularly useful to compare nodu-lation of the same legume in neighbouring fields or when farming practicesdiffer, as well as when comparing legume cultivars or characterizing theimpact of plant protection products (Fettell et al., 1997; Moënne-Loccoz etal., 1998). If the legume is not grown in the soil of interest, the assessmentcan be done after sampling the soil and performing plant infection tests,based on the capacity of specific rhizobia to nodulate a given species oflegume: the legume is grown in the soil sampled and the extent of plantnodulation is recorded.
Materials and apparatus
When assessing field-grown legumes:
• Digging equipment such as shovels, etc.• Scalpels (to split the nodules open)
234 A. Hartmann et al.

When assessing soil with plant infection tests:
• Calcinated clay (Chemsorb; CONEX) or perlite• 16 mm diameter clay beads (Argi-16TBF, TBF, France)• 1-l plastic containers• Legume seeds (soybean or bean)• Controlled-environment cabinet (or growth chamber)• Sieve
Chemicals and solutions
When assessing soil with plant infection tests:
• Sterile deionized water• Saturated calcium hypochlorite solution
Procedure and calculation
When assessing field-grown legumes: plants (at least 15 individual plants)need to be sampled when the legumes are expected to be fully nodulated,e.g. shortly before flowering. The root systems and surrounding soil arecarefully dug up (to a depth of at least 20 cm, preferably more). The soil isremoved by shaking, followed, if need be, by dipping in water, and nodula-tion is scored (Table 9.2). The average nodulation score is computed.
When assessing soil by use of plant infection tests: in order to avoidinconsistent results due to the spatial heterogeneity of rhizobial soil popula-tions, assessment needs to be carried out on composite soil samples to beagronomically meaningful. Composite soil samples are obtained by poolingand mixing six to ten soil cores taken at random over the field plot. Allequipment used for sampling must be free of rhizobia, and thus the use ofdisinfected instruments and disposable plastic bags is recommended. Soilsamples are sieved (2–4 mm). They may be used immediately or stored at4°C for up to 1 month, if necessary. The method described hereafter is opti-mized for soybean and bean, but may also be used for other legumes.Plants are grown in soil, or in a mixture of soil and sterile, substrate-like cal-cinated clay or perlite (i.e. siliceous sand expanded at 1200°C). One-litreplastic containers are filled with the following layers (from bottom to top):200 ml of 16 mm diameter Argi-16TBF clay beads, 400 ml of rhizobia-freesubstrate (calcinated clay or perlite), 100 g of soil, 200 ml of rhizobia-freesubstrate. Seeds (soybean or bean) are disinfected for 5 min in a saturatedcalcium hypochlorite solution and rinsed six times with sterile deionizedwater. Four seeds are sown per container. Containers are watered withsterile deionized water. Plants are grown in a controlled-environmentcabinet (16 h light at 240 µE/s, 8 h dark, at 22°C). Nodulation of the plants,which may be achieved even when soil contains low population levels of
Nodulating Symbiotic Bacteria and Soil Quality 235

nodulating rhizobia, is recorded at 1 month, by counting nodules or using ascoring table.
Discussion
The occurrence of indigenous rhizobia in most soils has been extensivelydocumented (Amarger, 1980). For instance, rhizobia nodulating peas andclovers are ubiquitous in most French and Spanish soils. Conversely, rhizo-bia nodulating lucerne are absent in soils with a pH below 6, whereas rhizo-bia nodulating lupin are not found in soil with a pH above 6 (Amarger,1980). Different analyses of the Sinorhizobium meliloti population in agricul-tural soils of Spain indicate that highly competitive strains, genetically simi-lar to the well-studied strain GR4, are often present, noticeably in soils witha high lucerne yield (Villadas et al., 1995; Velázquez et al., 1999). In similarsoils from the same geographical region, but with poor lucerne yield, theGR4-like subpopulation is typically replaced by other, less-effective strains(our unpublished results), which suggests that the presence of competitive,effective strains can be used as a soil quality indicator. The growth of non-native legumes often requires the inoculation of appropriate rhizobial sym-bionts (e.g. for soybean outside Asia), since they are naturally absent fromsoils. These introduced rhizobia are likely to survive and adapt in soil(Revellin et al., 1996).
Enumeration of Indigenous Rhizobia by MPN Plant InfectionCounts
Introduction
The number of indigenous rhizobia can vary to a large extent when com-paring different soils or farming practices. Unfortunately, selective growth
236 A. Hartmann et al.
Table 9.2. Scoring system to assess the extent of nodulation (derived from Brockwell et al.,1982).
Nodule score
Number of presumably effectivea nodules
Crownb Elsewhere
7 > 7 > 96 > 7 5–95 > 7 0–44 1–7 > 93 1–7 5–92 1–7 1–41 1–7 00 0 0
aPresumably effective nodules are identified on the basis of size and internal pigmentation.bThe crown is defined as the top 5 cm of the root system.
media are not available to enumerate rhizobia directly from soil. Therefore,alternative procedures, based on most probable number (MPN) determina-tion, are needed. The MPN is a statistical estimate derived from the numberof nodulated plants obtained following inoculation with aliquots from adilution series of the soil under study.
Principle of the methods
The plant infection count is based on the most probable number (MPN)method. Axenic plantlets are inoculated with diluted soil suspensions,tubes containing nodulated plants are recorded as positive, and rhizobialnumbers are deduced from a statistical table (Fisher and Yates, 1963).
Materials and apparatus
• Erlenmeyer flasks• Rotary shaker• Seeds• Sterile perlite• Gibson glass tubes (220 × 22 mm)• Filter paper strip• Aluminium foil• Growth chamber or a greenhouse
Chemicals and solutions
• Sterile deionized water• Saturated calcium hypochlorite solution• Nitrogen-free plant nutrient solution
Procedure
1. A soil suspension is prepared by transferring 10 g of soil to a sterile flaskcontaining 90 ml of sterile water, and flasks are shaken for 30 min at150 rpm.2. A tenfold dilution series is prepared (ten dilution steps, including the ini-tial soil suspension, are necessary to provide dilutions with and withoutrhizobia). One ml of each dilution is used to inoculate axenic seedlingsgrown in test tubes (four tubes per dilution), prepared as follows:
Nodulating Symbiotic Bacteria and Soil Quality 237

• In the case of soybean or bean, seeds are disinfected for 5 min in a satu-rated calcium hypochlorite solution and rinsed six times with steriledeionized water.
• Seeds are germinated in sterile perlite for 3 days at 28°C.• Axenic seedlings are planted in Gibson tubes (Gibson, 1963) containing
a strip of filter paper as a wick and root support. The tubes are filledwith quarter-strength Jensen nitrogen-free solution (Jensen, 1942) andcapped with aluminium foil, as described by Vincent (1970) (Fig. 9.1).
3. Plants are grown for 4 weeks in a growth chamber (16 h light at240 µE/s, 8 h dark, at 22°C) or a greenhouse. Plants are scored as positive(at least one nodule present) or negative (no nodule). Narrowing the dilu-tion series (four- or twofold dilutions) decreases the confidence limit of theMPN.
Calculation
The MPN of rhizobia can be deduced from the McCrady table (Vincent,1970) (Table 9.3).
Discussion
Depending on the legume considered, numbers of nodulating rhizobiabelow 102–104 (104 for soybean) per g of dry soil can be a limiting factor forthe symbiotic growth of legumes, and inoculation is recommended.However, it needs to be kept in mind that MPN counts are not sufficient toassess whether nodulating rhizobia are effective at fixing nitrogen (seepp. 241–243). One limitation to the use of plant infection counts is that ittakes several weeks to obtain the results, and a growth chamber or green-house is required. In addition, it must be kept in mind that experimentalconditions do not well reflect those under field conditions, and soil, climaticand biotic factors prevailing in the soil environment also influence nodula-tion (as well as the efficiency of symbiotic nitrogen fixation). Moleculartools may also be used to enumerate rhizobia, e.g. by plating soil suspen-sions on semi-selective media and identifying rhizobia by colony hybridiza-tion, but the procedure is tedious (Laguerre et al., 1993; Bromfield et al.,1995; Hartmann et al., 1998a). Species-specific molecular markers (detectedby real-time quantitative PCR) seem promising for direct estimation ofBradyrhizobium japonicum, but they require further calibration.
238 A. Hartmann et al.

Nodulating Symbiotic Bacteria and Soil Quality 239
Fig. 9.1. Most probable number (MPN) plant infection counts of rhizobia nodulating soybeanin Gibson tubes (220 × 22 mm). The tubes are filled with quarter-strength Jensen nitrogen-free solution and capped with aluminium foil. The filter-paper wick can be seen clearly in theleft tube, which does not contain a plant. The right tube contains a soybean seedling.

240 A. Hartmann et al.
Table 9.3. Number of rhizobia estimated by the plant infection count (from Vincent, 1970).Tenfold dilutions, four tubes per dilution step.
Positive tubes Number of dilution steps (s)
s = 1040 > 7 x 10⁸
39 > 7 x 10⁸
38 6.9 x 10⁸
37 3.4 x 10⁸
36 1.8 x 10⁸
35 1.0 x 10⁸
34 5.9 x 10⁷
33 3.1 x 10⁷ s = 832 1.7 x 10⁷ > 7 x 10⁶
31 1.0 x 10⁷ > 7 x 10⁶
30 5.8 x 10⁶ 6.9 x 10⁶
29 3.1 x 10⁶ 3.4 x 10⁶
28 1.7 x 10⁶ 1.8 x 10⁶
27 1.0 x 10⁶ 1.0 x 10⁶
26 5.8 x 10⁵ 5.9 x 10⁵
25 3.1 x 10⁵ 3.1 x 10⁵ s = 624 1.7 x 10⁵ 1.7 x 10⁵ > 7 x 10⁴
23 1.0 x 10⁵ 1.0 x 10⁵ > 7 x 10⁴
22 5.8 x 10⁴ 5.8 x 10⁴ 6.9 x 10⁴
21 3.1 x 10⁴ 3.1 x 10⁴ 3.4 x 10⁴
20 1.7 x 10⁴ 1.7 x 10⁴ 1.8 x 10⁴
19 1.0 x 10⁴ 1.0 x 10⁴ 1.0 x 10⁴
18 5.8 x 10³ 5.8 x 10³ 5.9 x 10³
17 3.1 x 10³ 3.1 x 10³ 3.1 x 10³ s = 416 1.7 x 10³ 1.7 x 10³ 1.7 x 10³ > 7 x 10²
15 1.0 x 10³ 1.0 x 10³ 1.0 x 10³ > 7 x 10²
14 5.8 x 10² 5.8 x 10² 5.8 x 10² 6.9 x 10²
13 3.1 x 10² 3.1 x 10² 3.1 x 10² 3.4 x 10²
12 1.7 x 10² 1.7 x 10² 1.7 x 10² 1.8 x 10²
11 1.0 x 10² 1.0 x 10² 1.0 x 10² 1.0 x 10²
10 5.8 x 101 5.8 x 101 5.8 x 101 5.9 x 101
9 3.1 x 101 3.1 x 101 3.1 x 101 3.1 x 101
8 1.7 x 101 1.7 x 101 1.7 x 101 1.7 x 101
7 1.0 x 101 1.0 x 101 1.0 x 101 1.0 x 101
6 5.8 5.8 5.8 5.85 3.1 3.1 3.1 3.14 1.7 1.7 1.7 1.73 1.0 1.0 1.0 1.02 0.6 0.6 0.6 0.61 < 0.6 < 0.6 < 0.6 < 0.6
The confidence interval at a 0.95 probability is calculated by multiplying and dividing thenumber by 3.8.

Assessment of the Symbiotic Efficacy of Indigenous SoilRhizobial Populations
Introduction
Successful nitrogen fixation is expected to translate into better plant devel-opment, and this may be assessed by analysing plant development and bio-mass. In the method presented on pp. 233–236, the plant may obtainsignificant amounts of combined nitrogen from the soil and effective nitro-gen fixation does not always lead to significantly higher plant biomass,which prevents satisfactory assessment of the symbiotic efficacy of theindigenous rhizobia unless dealing with chemically poor soils. To circum-vent this limitation, assessment can be carried out using a rhizobia-free soil-less system, in which legumes are inoculated with diluted suspensions ofthe soil under study (whole soil inocula technique; Somasegaran andHoben, 1994). Thus, both nodulation and the symbiotic effectiveness of thenodulating population can be characterized, thereby providing a more com-plete estimate of the symbiotic potential of rhizobial populations present inthe soil.
Principle of the method
The method involves extracting indigenous microorganisms from soil andusing the resulting soil suspension directly as an inoculum for legumesgrown in a soil-less system from which the plant cannot take up significantamounts of nitrate and/or ammonium (Fig. 9.2). Plant biomass is assessedand compared with that in the absence of inoculation or in the non-inoculated positive control (inoculation with an efficient strain).
Material and apparatus
• 5-l plastic containers• 16-mm diameter clay beads (Argi-16TBF)• Perlite• Surface-sterilized seeds• Greenhouse• Oven (105°C)• Balance• Basic microbiology equipment
Nodulating Symbiotic Bacteria and Soil Quality 241

Chemicals and solutions
• N-free mineral nutritive solution (per litre: K2HPO4, 0.14 g;MgSO4.7H2O, 0.25 g; CaCl2, 0.28 g; K2SO4, 0.12 g; Sequestrene 138 FeNovartis, 10 mg; H3BO3, 2 mg; MnSO4.H2O, 1.80 mg; ZnSO4.7H2O,0.2 mg; CuSO4.5H2O, 0.08 mg; Na2MoO4.2H2O, 0.25 mg)
• Fresh culture of an efficient rhizobial strain
Procedure
• The N-free soil-less system is prepared as follows (Fig. 9.2). 5-l plasticcontainers are filled with the following layers (from bottom to top): 1 lof 16-mm diameter clay beads (Argi-16TBF), 4 l of rhizobia-free sub-strate (perlite).
• Surface-sterilized seeds (eight in the case of soybean, thinned to fourplants after germination) are sown in each container.
• 10�1 to 10�3 diluted soil suspensions are used as inocula, and, for thepositive control, a fresh culture of an efficient rhizobial strain is pre-pared (Somasegaran and Hoben, 1994) and diluted in sterile water togive an inoculum of 106 cells per seed.
242 A. Hartmann et al.
Fig. 9.2. Efficiency tests for Bradyrhizobium japonicum strains in 5-l soil-less containers. Thetwo containers at the front are non-inoculated controls (pale plants), whereas the containersat the back are inoculated with efficient strains.

• Four containers (i.e. four replicates) are used per treatment (includingthe two controls).
• Plants are watered (e.g. through a hole at the bottom of the containers)with an N-free mineral nutritive solution, taking care to avoid cross-contamination.
• The experiment follows a randomized block design (four Fisher blocks).• Plants are grown for 10 weeks in the greenhouse.• Shoots are harvested, dried at 105°C for 24 h and weighed. Foliage dry
matter production is considered a good indicator of total nitrogenuptake (Brockwell et al., 1982), but results may be complemented byanalysing total foliage nitrogen (Kjeldahl method).
Calculation
Variance analysis is performed to determine strain efficiency by comparisonwith the efficient reference strain and the non-inoculated control.
Discussion
A critical point is to include adequate controls, since diluted soil suspen-sions contain nutrients (including mineral nitrogen) that will not be presentin non-inoculated and reference strain treatments. Variance analysis orother statistical treatment of the data should take this bias into account.This method may also be implemented in soil, but plant biomass determi-nations may be of limited interest under soil conditions where legumes canalso acquire significant amounts of combined nitrogen by direct uptake ofsoil nitrate and/or ammonium. In this case, the amount of plant nitrogenspecifically derived from biological fixation can be estimated using theapproach presented below.
Assessment of Plant Nitrogen Derived from Symbiotic Fixation
Introduction
The isotopic methods based on 15N variation are the most reliable for evalu-ating nitrogen fixation by plants under field conditions. Other methods canbe used in parallel as useful indicators of nitrogen fixation activity in situ,such as acetylene reduction activity by nitrogenase or analysis of the nitro-gen content of xylem sap (Dommergues et al., 1999). The latter indirectmethods will not be discussed hereafter. Isotopic methods are based on theassumptions that the root systems of the N2-fixing legume and the non-fixing reference species have similar architectures and explore the same soilhorizons, and that they assimilate from the same nitrogen pools (Dansoet al., 1993). The occurrence and type (endo- or ectomycorrhizae) of
Nodulating Symbiotic Bacteria and Soil Quality 243

mycorrhizae should also be similar, as they can affect plant δ15N (Högberg,1990), and plants should have a similar phenology. These assumptions arerarely fully valid in most field studies, which highlights the importance ofthe choice of the non-fixing reference plant species. The natural 15N abun-dance and the 15N enrichment methods are presented here.
Principle of the methods
The natural 15N abundance method is based on the isotopic discrimi-nation process occurring in most chemical reactions involved in gaseousloss, such as ammonia volatilization or denitrification. Indeed, the latterprocesses favour a progressive disappearance of the lightest, mainnitrogen isotope (14N), and thus the heaviest one (15N) tends compara-tively to accumulate in soil (Dommergues et al., 1999). Consequently, sincethe 15N/14N ratio of atmospheric N2 is very low and stable, it is expectedthat nitrogen immobilized in N2-fixing legumes will contain a lower pro-portion of 15N compared with that of plants that do not fix nitrogen andtake this element up from soil nitrate and/or ammonium. This means thatthe comparison of the relative proportion of 15N (i.e. δ15N) in N2-fixinglegumes and non-fixing reference plants can be used to estimate theamount of nitrogen derived from the atmosphere by nitrogen fixation (i.e.% Ndfa) in the former.
The 15N enrichment method, also called isotopic dilution method, isbased on the comparison of 15N excess measured in N2-fixing legumes andnon-fixing reference plants grown in soils enriched in 15N through theincorporation of 15N-labelled fertilizers (containing urea, nitrate or ammo-nium) to the soil. Since the N2-fixing legumes will both take up combinednitrogen from soil and fix atmospheric nitrogen, their 15N excess will belower than that of the non-fixing reference plant, which has access to soilnitrogen (enriched in 15N) only.
Materials and apparatus
A highly sensitive mass ratio spectrometer is required for the determinationof natural abundance; 15N measurement can be subcontracted to specializedservice laboratories equipped with the relevant apparatus.
Procedure
The natural 15N abundance method is only applicable when the soil δ15N issuperior or equal to +2 (Unkovich and Pate, 2001), and when spatial vari-ability of soil δ15N (as assessed through standard deviation) is not too high.Indeed, soil δ15N may vary from site to site, according to the successive bio-logical processes that occurred during a given soil history. Therefore, a
244 A. Hartmann et al.

preliminary sampling of leaves on different local species (includinglegumes and non-legumes) is required, followed by δ15N analysis, to deter-mine whether the natural 15N abundance method can be used. If so, a moreextensive sampling is then carried out. For herbaceous species, many exper-imental designs can be chosen, since sampling of plant material is easy toperform on both the N2-fixing legume and the non-fixing species. The entireplant can be harvested and plant parts (leaves, fruits, stem, roots, nodules)analysed to determine dry weight (after drying for 3 days at 60°C), totalnitrogen content and δ15N. δ15Na (the δ15N of the N2-fixing legume whenderiving all its nitrogen from nitrogen fixation) is obtained by growing thelegume (after inoculation with the most efficient rhizobial strain available)in an N-free system, e.g. in greenhouse pots containing an artificial sub-strate such as perlite or vermiculite and watered with an N-free nutrientsolution. Plants (usually up to ten plants per treatment) are collected at 3–12months and oven-dried at 60°C for 3 days. Plant parts are analysed for dryweight, total nitrogen and δ15N assessments, as above. The best strategy isto compare the δ15N of different non-fixing reference plant species and tocalculate the percentage of N derived from biological fixation (%Ndfa)according to each of them. The different %Ndfa obtained are then presentedas different assumptions. The total amount of nitrogen fixed by the legume(Ndfa) is obtained by multiplying %Ndfa with the total N content of theplant (see below for the formula).
In the 15N enrichment method, %Ndfa is calculated from the percentagesof 15N excess in the N2-fixing plant and the non-fixing reference plant (seebelow for the formula). Several protocols have been described for the 15Nenrichment method (Dommergues et al., 1999). The sampling procedureproposed for the natural 15N abundance method can be extrapolated to the15N enrichment method (except for the determination of δ15Na, which is notrequired).
Calculation
In the natural 15N abundance method, δ15N is computed as follows:
δ15N(‰) = 1000 × (%15Nsample – 0.3663)/0.3663
where 0.3663 is the percentage of 15N in the atmosphere; the value is con-stant worldwide (Junk and Svec, 1958; Mariotti, 1983).
Then, %Ndfa in the N2-fixing plant is computed as follows (Amarger etal., 1977; Bardin et al., 1977; Shearer and Kohl, 1986):
%Ndfa = 100 × (δ15Nnf – δ15Nf)/(δ15Nnf –δ15Na)
where: δ15Nnf corresponds to the δ15N of the non-fixing reference plant;δ15Nf to the δ15N of the N2-fixing legume studied; and δ15Na (also known asthe � factor of isotopic discrimination) to the δ15N of the N2-fixing legumewhen deriving all its nitrogen from nitrogen fixation.
Nodulating Symbiotic Bacteria and Soil Quality 245

In the 15N enrichment method, %Ndfa is calculated from the percent-ages of 15N excess in the N2-fixing plant and the non-fixing reference plant,as follows:
%Ndfa = 100 × (1 – Ei/Eo)
where: Ei corresponds to the 15N excess measured in the N2-fixing plant andEo to the 15N excess of the non-fixing reference plant. These values are gen-erally determined using an emission spectrometer.
Discussion
The 15N enrichment method displays several drawbacks. First, a correctestimation is only reached when uptake of soil nitrogen by both the N2-fix-ing legume and the non-fixing reference plant follows the same kinetics,which is not often the case (Danso et al., 1993). Secondly, gaseous loss (as,for example, N2O or NH3) or leaching of the labelled fertilizer can be othersources of error for the final calculation of %Ndfa. Thirdly, it is sometimesdifficult to obtain a homogeneous labelling of the soil (especially withwoody species), whereas the natural abundance method does not requireany handling of soil and is thus less disturbing for the ecosystem. Fourthly,the use of 15N-labelled fertilizer remains costly, making the natural abun-dance method much cheaper. Fifthly, the measurement is performed over ashort period of time, which limits the significance of the results when themethod is performed on perennial legumes. Consequently, the enrichmentmethod is generally used in the framework of short-term field experiments,and thus is more adapted to quantification studies on annual crops. Finally,this remains the only applicable method when the soil δ15N of a given site istoo low.
Conclusion
As nitrogen is a key plant nutrient, its availability is a crucial parameter ofsoil quality. Development and optimization of symbiotic BNF can limit theexpensive, energy-consuming and polluting industrial transformationrequired for production of chemical nitrogen fertilizers. Symbiotic nitrogenfixation performed by rhizobia–legume associations exhibits the highestrate of N fixation, and it is important to detect situations where rhizobialBNF is not optimal and propose solutions to improve it. In particular, inoc-ulation has now been used successfully for years, mainly when the bacterialsymbiont is absent from the soil or poorly efficient. Beside BNF, rhizobia aresoil and rhizosphere bacteria that could have other roles in improving soilquality. For example, many rhizobia produce plant hormones or modifyplant hormonal balance via 1-aminocyclopropane-1-carboxylate deaminaseactivity, and they might have a potential use as plant-growth-promotingrhizobacteria (PGPR) (Sessitsch et al., 2002; Ma et al., 2003). Certain rhizobia
246 A. Hartmann et al.

are involved in phosphate solubilization and thus could influence phospho-rus nutrition of plants (Chabot et al., 1996). The size and diversity of indige-nous rhizobial populations may be affected by soil pollutants, farmingpractices, etc. (McGrath et al., 1995; Morrissey et al., 2002; Chen et al., 2003;Walsh et al., 2003), which highlights the usefulness of these bacteria asbioindicators of soil quality.
Nodulating Symbiotic Bacteria and Soil Quality 247

9.3 Contribution of Arbuscular Mycorrhiza to Soil Qualityand Terrestrial Ecotoxicology
SILVIO GIANINAZZI,1 EMMANUELLE PLUMEY-JACQUOT,1,2 VIVIENNE
GIANINAZZI-PEARSON1 AND CORINNE LEYVAL2
1UMR INRA1088/CNRS 5184/UB PME, CMSE-INRA, 17 rueSully, BP 86510, 21065 Dijon cedex, France; 2LIMOS,Laboratoire des Interactions Microorganismes-Minéraux-Matière Organique dans les Sols, CNRS FRE 2440, 17 rueN.D. des Pauvres, B.P. 5, 54501 Vandoeuvre-les-Nancy cedex,France
Introduction
Although evolution has produced a general state of resistance to ‘non-self ’in plants, more than 95% of plant taxa in fact form compatible root associa-tions, mycorrhizas, with certain soil fungi. These symbiotic associations areno doubt the most frequent examples of susceptibility of plants to fungi.Consequently, the root systems of a very large number of plants, and in par-ticular those of many cultivated plants, whether they are agricultural, horti-cultural or fruit crops, do not exist simply as roots, but as complexmycorrhizal associations (Harley and Harley, 1987).
Mycorrhizas are usually divided into three morphologically distinctgroups, depending on whether or not there is fungal penetration of the rootcells: endomycorrhizas, ectomycorrhizas and ectendomycorrhizas.However, the most widespread plant root symbiosis is represented by(arbuscular) endomycorrhiza (AM) and is formed by more than 80% ofplant families. The fungi involved all belong to the Glomeromycota(Glomus, Acaulospora, Gigaspora, Entrophospora, Sclerocystis, Scutellospora).
An AM association is generally mutualistic, in that the fungi obtain acarbon source from the host, while the latter benefits from enhanced nu-trient uptake through transfer of mineral elements from the soil via the fun-gal hyphae (Smith and Read, 1997). In fact, there is an external network oframifying mycelium of the symbiotic fungus into the soil from mycorrhizalroot systems. This external mycelium supplies the plant with an extensivesupplementary pathway for absorbing mineral nutrients and water fromthe soil, and it can facilitate mobilization by the plant of poorly mobile ele-ments such as phosphate, ammonium, zinc and copper. The distance overwhich the fungal hyphae can translocate these nutrients exceeds the radiusof any depletion zone likely to develop around an actively absorbing root,enabling plants to better exploit soil resources. It has been estimated that
248

mycorrhizal hyphae can explore volumes of soil that are a hundred to athousand times greater than the volume exploited by roots alone(Gianinazzi-Pearson and Smith, 1993). Strong evidence supports the exis-tence of a direct link between the level of AM fungal biodiversity in soil andthat of the plant species above ground (van der Heijden et al., 1998).
Precolonization of roots by AM fungi can also alleviate stress due tometal and organic acid toxicity in soils of low pH (Leyval et al., 1997), andreduce damage by soil-borne pathogens such as nematodes, Fusarium,Pythium or Phytophthora. The mechanism involved in this protection againsta pathogen is complex, but there is strong evidence that AM fungi activateplant defence mechanisms against microbial pathogens (Gianinazzi, 1991;Cordier et al., 1998; Dumas-Gaudot et al., 2000). Furthermore, AM formationstimulates the development in the mycorrhizosphere of microorganismswith antagonistic activity towards soil-borne pathogens (Linderman, 2000).Therefore, the contribution of AM to soil quality and terrestrial ecotoxicol-ogy is of primary importance.
Mycorrhizal Inoculation to Improve Plant Health and Growth
The AM association is the most common type of mycorrhiza in agriculturalsystems. The importance of AM for plant growth and health is now widelydemonstrated. It has become clear that they form an integral part of manycultivated plants and positively influence several aspects of plant physiol-ogy: mineral nutrition, water uptake, hormone production and resistance toroot diseases (Smith and Read, 1997). Plants often grow badly in soils whereAM fungi have been eliminated and their presence appears to be a factordetermining soil fertility. Because of these characteristics, it is consideredthat AM fungi can be used as biological tools for increasing plant produc-tivity in the field without creating problems of environment degradation,and by reducing chemical fertilizer or pesticide input (Gianinazzi andGianinazzi-Pearson, 1988).
Given the effects of AM fungal inoculation on plants, it is generallyaccepted that appropriate management of this symbiosis should permitreduction of agrochemical inputs, and thus provide for sustainable andlow-input plant productivity. Maximum benefits will only be obtained frominoculation with efficient AM fungi and a careful selection of compatiblehost/fungus/soil combinations (Gianinazzi et al., 2002).
AM fungi cannot be grown in pure culture and must therefore be multi-plied on living roots. This requires the use of techniques for inoculum pro-duction that are different from those employed for other mycorrhizal fungi.This, usually considered as a major disadvantage, appears in our experi-ence to be an advantage, since the risk of multiplying AM fungi that havelost their symbiotic properties is very low, because culture collections haveto be maintained on living host plants. On the other hand, producing sym-biotic fungi on living plants raises difficulties because of precautions thathave to be taken in order to obtain ‘clean’ inoculum. It is possible to
Arbuscular Mycorrhiza, Soil Quality and Terrestrial Ecotoxicology 249

produce AM inoculum on either excised roots or whole plants under axenicconditions using disinfected spores as inoculum (Gianinazzi et al., 1989).However, for the moment, only one company is proposing commercialinoculum produced in vitro.
In order to use any of these types of inoculum rationally and success-fully, it is necessary to define a strategy of inoculation, that is, to determinewhether for a given situation it is necessary to inoculate and which fungi touse. We have developed biological tests for this. Without going into detailsabout these, the aim is first to estimate the soil mycorrhizal potential, whichindicates the number of fungal propagules, including spores, roots orhyphae, present in a given soil or substrate, and secondly, to evaluatethe potential effectiveness of indigenous fungi for plant production anddetermine soil receptivity to fungi that are to be introduced into the system.
Information obtained using these biotests for mycorrhizal potential andfungal effectiveness, together with current knowledge about the mycor-rhizal dependency of different plant genera and species, will provide theessential tools for a strategy of inoculation (Gianinazzi et al. 2002). Thecreation of ‘La Banque Européenne des Glomales (BEG)’ under theimpulsion of the EU-COST programme (Dodd et al., 1994), and itsrecent development into the international bank of Glomeromycota(http://www.kent.ac.uk/bio/beg/), will greatly help in this task. AMbiotechnology is feasible for many crop production systems and the recentdevelopment of AM fungal-specific molecular probes provides tools formonitoring these microsymbionts in soil and roots (Van Tuinen et al., 1998;Jacquot et al., 2000).
A perspective for the near future should be the development of inte-grated biotechnologies (plant biotization) in which not only AM fungi, butalso other microorganisms capable of promoting plant growth and/or pro-tection – such as symbiotic or associative bacteria, plant-growth-promotingrhizobacteria (PGPR), pathogen antagonists (Trichoderma, Gliocladium,Bacillus, etc.), or hypovirulent strains of pathogens – will be used in synergy.
Application of Arbuscular Mycorrhiza as Bioindicators of SoilQuality
Introduction
Arbuscular mycorrhizal fungi are abundant soil fungi and are associatedwith many plant species. They are an integral part of the plant (Gianinazziet al., 1982), and many plants are highly dependent on mycorrhizal coloniz-ation for their growth. Not only can they be considered as a powerfulextension of the plant-root system, providing access to a larger soil volumefor nutrient uptake and playing a role in root protection against disease ordrought, but they also affect the transfer of pollutants, such as heavymetals, to plants and can be affected by elevated metal concentrations(Gildon and Tinker, 1983; van der Heijden et al., 1998) before toxicity
250 S. Gianinazzi et al.

symptoms can be seen on plants. Because of this, and because they are adirect link between the soil and plant roots, AM fungi have been proposedas bioindicators of heavy metal toxicity (Leyval et al., 1995), as a supple-ment to chemical extraction procedures commonly used to assess availabil-ity of metals. Toxicity tests have been performed using techniques based onspore germination (Leyval et al., 1995; Weissenhorn and Leyval, 1996;Jacquot-Plumey et al., 2003), and on AM root colonization using MPN(Leyval et al., 1995; Jacquot-Plumey et al., 2002), or using Ri-T-DNA trans-formed roots (Wan et al., 1998) or nested PCR, which allows monitoring ofthe effect of sewage sludges on the diversity of AM fungi in planta and insoil (Jacquot et al., 2000; Jacquot-Plumey et al., 2002). Very recently, thepotential use of proteomics to study changes in protein expression of AMplants under stress conditions has also been investigated (Bestel-Corre,2002). Two bioassays have been developed in collaboration with ADEME(Agence de l’Environnement et de la Maîtrise de l’Energie – Contract num-ber 02750021) at LIMOS-CNRS (Nancy, France) and UMR BBCE-IPM,INRA/University of Burgundy (Dijon, France), based on spore germinationand root colonization, respectively, and have been submitted to theTechnical Committee T95E on Terrestrial Ecotoxicology of the FrenchAssociation of Normalisation (AFNOR) as a bioassay for ecotoxicologicaleffects of chemicals or wastes and for soil quality.
Principle of the method
These bioassays are based on the germination of spores of an AM fungus(Glomus mosseae) sensitive to metals (Weissenhorn et al., 1993), and on colo-nization of roots of Medicago truncatula inoculated with the same fungus.They are complementary since the spore germination assay concerns theAM fungus alone and the initial stage of the symbiotic cycle, while the rootcolonization assay reflects a further stage of the symbiosis when the fungusinteracts with the host plant. Both bioassays are direct contact tests, foracute and chronic toxicity, respectively. Contaminated soils, sewage sludge,wastes or solutions can be tested for their potential toxicity to beneficialmicrobial activity. AM spore germination and root colonization within a testsubstrate containing a substance, or a contaminated soil, are compared to acontrol test substrate alone or a non-contaminated soil comparable to thesoil sample to be tested.
Materials and apparatus
• Nitrocellulose filter membranes (0.45 µm, 47 mm in diameter)• Petri dishes• Filter paper• Seeds of Medicago truncatula Gaertn (line J5)• G. mosseae inoculum (Biorize, Dijon, France)
Arbuscular Mycorrhiza, Soil Quality and Terrestrial Ecotoxicology 251
• Sand (0.5–1 mm particle size)• Growth chamber• Binocular magnifier• Photonic microscope
Chemical and solutions
• Agar water• Mycofert nutrient solution (Biorize, Dijon, France)
Procedure
AM spore germination:
1. Thirty G. mosseae spores (Nicol. & Gerd.) Gerdemann & Trappe (BEG12)(obtained from Biorize, Dijon, France) are placed between two nitrocellu-lose filter membranes (0.45 µm, 47 mm in diameter) with gridlines, heldtogether by a slide frame as described by Weissenhorn et al. (1993).2. This so-called sandwich with spores is placed in a Petri dish containing50 g of test substrate (sand, particle size 0.5–1 mm) mixed with, for example,a chemical compound solution or a contaminated soil to be tested (Fig. 9.3).3. The sandwich is then covered with another 50 g layer of sand/soil.4. Soil and sand are allowed to moisten up to water-holding capacity. A fil-ter paper, lining the bottom of the dish and extending outside the dish intoa water-filled larger dish, moistens the substrate by capillarity when soil orsludges are used. When sand is used, it is moistened by watering.5. The Petri dish is sealed and kept at 24°C in the dark for 2 weeks.6. The spore sandwich is then removed from the soil/sand, stained usingtryptan blue for 1 h (Bestel-Corre, 2002) and carefully rinsed with tap waterbefore opening.7. The number of spores recovered and of germinated spores are recordedat ×32 magnification.8. Six replicates are made for each sample.9. The dose effect can be studied using sample dilution in sand and estima-tion of the mean inhibitory concentration at 50% (MIC50).
Root colonization:
1. Pre-germinated seeds of M. truncatula Gaertn. (line J5) on water-agar(0.7%) are transferred individually into pots, and each plant is inoculatedwith 15 g of a G. mosseae inoculum placed in the planting hole of 200 g of amixture of sand (0.5–1 mm particle size) with the solution, soil or sewagesludge to be tested.2. Plants are cultivated under controlled conditions (photoperiod 16 h,19–22°C, relative humidity 60–70%, light intensity 320 µE/m2/s1), andreceive weekly 10 ml Mycofert nutrient solution.
252 S. Gianinazzi et al.

3. Frequency of root colonization by G. mosseae is estimated after 4 weeksaccording to Trouvelot et al. (1985) and a simplified determination ispresently made based on a + (fungal detection)/– notation.4. Six replicate plants are used for each sample.5. The dose effect can be studied using sample dilution in sand to measurethe mean inhibitory concentration at 50% (MIC50).
Discussion
The spore germination bioassay has been used to compare the toxicity ofdifferent soils (Leyval et al., 1995) and sewage sludges, and to compare thetolerance to cadmium of different AM fungi (Weissenhorn et al., 1993). Thecomparison of composted sewage sludges and other wastes from differentorigins showed a decrease in spore germination with a composted sludgeamended with polycyclic aromatic hydrocarbons (PAH) (B31), with com-bustion ashes (C1) or combusted household refuse (C2), but not when thesludge was unamended or amended with metallic pollutants (B32) (Fig.9.4A). Dilution of these sludges and ashes showed that C1 and C2 weremore toxic to AM spore germination than B31 sludge (Fig. 9.4B).
The root colonization bioassay has been used to compare, ex situ, thetoxicity of different non-composted sewage sludges and to study, in situ, theeffects of three successive sewage sludge amendments (Jacquot et al., 2000,Jacquot-Plumey et al., 2002). Comparison of the sewage sludges showed aslight decrease in root colonization with the addition of B3 sewage sludgeto sand and even more when the sludge was amended with polycyclic aro-matic hydrocarbons (B31) and heavy metals (B32) (Fig. 9.5).
Neither of the bioassays based on AM fungi is specific: a reduction ingermination or in root colonization may be due to different pollutants, andpossibly also to other soil characteristics, such as very low pH, or high P
Arbuscular Mycorrhiza, Soil Quality and Terrestrial Ecotoxicology 253
Slide frame
Filter membranewith gridline
Spores
‘Sandwich’
Soil or test substrate
Fig. 9.3. Arbuscular mycorrhiza (AM) spore germination test for pollutants in soil, sewagesludge or wastes.

content. Therefore, when there is such a reduction, further investigationsshould be performed to identify its origin.
Early in the 1980s, Gildon and Tinker reported the presence of heavy-metal-tolerant AM fungi in polluted soils and their effect on metal uptakeby plants (Gildon and Tinker, 1983). Since then, the presence of AM fungi inheavy-metal-polluted sites, and the contribution of AM fungi to the transferof heavy metals and radionuclides from soil to plants and to the trans-location from root to shoots, has been addressed in many studies. Theyhave concerned different metallic trace elements, such as Cd, Zn and Ni,and radionuclides such as Cs (Leyval and Joner, 2001). Results showed thatheavy-metal-tolerant AM fungi may reduce metal transfer to plants andprotect them against heavy metal toxicity (Leyval et al., 1997). However,results are not always consistent, probably due to different metal concentra-tions, fungi and availability in soils (Leyval and Joner, 2001; Leyval et al.,2002; Rivera-Becerril et al., 2002). They also cannot be generalized and maydiffer with plants, with heavy metals/radionuclides and their availability,and possibly, although this has been less investigated, with other microbialcomponents of the soils.
Remediation of heavy metal and radionuclide contaminated soilsincludes immobilization and extraction techniques. Different plants can be
254 S. Gianinazzi et al.
0
20
40
60
80
% G
erm
inat
ion
1/1 1/3 1/10
(B)
0
20
40
60
80
Dilutions
(A)
% G
erm
inat
ion
Treatments
Con
trol (
sand
)
B3
B31
B32 C1
C2
Con
trol (
terr
agre
en)
**
*
C1
C2
B31
Fig. 9.4. Germination (%) of Glomus mosseae spores (A) in different composted sewagesludges and wastes and (B) after dilution of the sludge and wastes in sand using thesandwich bioassay (Fig. 9.3). * indicates significant differences from control (sand orterragreen, chi-squared test, P � 0.05). B3, composted sludge; B31, B3 composted sludgespiked with polycyclic aromatic hydrocarbons (PAH); B32, B3 composted sludge spiked withheavy metals; C1, combustion ash; C2, combusted household refuse.

used for phytoextraction (extraction of metals by plants accumulating highmetal concentrations) and phytostabilization (use of plants to reduce heavymetal availability, erosion and leaching). For phytoextraction, hyperaccu-mulative plants from the Brassicaceae family are often used, but most plantsof this family are reported as non-mycotrophic. However, other plants accu-mulating lower metal concentrations, but producing higher biomass, suchas sunflower and willow, are also receiving attention and these are mycor-rhizal. There has been much work done, and much progress made, in thefield of AM fungi in soil remediation and restoration. AM inoculum pro-duction on a commercial scale is available and is no longer a limit toapplied studies (Von Alten et al., 2002). Field studies and field applicationsof AM fungi have been reported and are currently running, but they con-cern mainly revegetation studies, horticultural and agricultural applica-tions. There is still a lack of demonstration and of in situ projects using AMfungi in polluted sites. However, preliminary field trials have indicated thatdual inoculation with a selected AM fungus and Rhizobium can improve theyield and nodulation of pea genotypes in a metal contaminated site(Borisov et al., unpublished results; EU project INCO-Copernicus IC15-CT98–0116). The persistence of the inoculated fungi, and the relative diver-sity of AM fungi in roots in situ are poorly known and need to beinvestigated further.
Arbuscular mycorrhizal fungi provide a direct link between soil androots and are key components of soil–plant ecosystems. Their presence andbeneficial activity can be affected by soil perturbation and contamination,and can be used as an early sign of soil disfunctioning. Besides improvingsoil fertility and plant productivity, they affect the fate of pollutants such asheavy metals and radionuclides, and therefore bring many advantages tomycorrhizal plants in polluted soils. However, there is still much research
Arbuscular Mycorrhiza, Soil Quality and Terrestrial Ecotoxicology 255
F (
%)
0
25
50
75
100
B31 B32B3Sand
b
b
a
a
Fig. 9.5. Frequency of root colonization (F%) by Glomus mosseae grown in sand and insand mixed with an unamended sewage sludge (B3), or amended with polycyclic aromatichydrocarbons (PAH) (B31) and metallic pollutants (B32). Values in columns headed by thesame letter are not significantly different (P � 0.05).

needed, especially to predict the conditions in which a beneficial effect ofAM fungi can be expected. This requires a better understanding of themechanisms involved in heavy metal tolerance, taking into account notonly AM fungi but also the complexity of the soil–plant–microbe systems.
256 S. Gianinazzi et al.

9.4 Concepts and Methods to Assess the PhytosanitaryQuality of Soils
CLAUDE ALABOUVETTE,1 JOS RAAIJMAKERS,2 WIETSE DE BOER,3 RÉGINA
NOTZ,4 GENEVIÈVE DÉFAGO,4 CHRISTIAN STEINBERG1 AND PHILIPPE
LEMANCEAU1
1UMR 1229 INRA/Université de Bourgogne ‘Microbiologie etGéochimie des Sols’, INRA-CMSE, BP 86510, 21065 Dijoncedex, France; 2Wageningen University, Laboratory ofPhytopathology, Binnenhaven 5, 6709 PG Wageningen, TheNetherlands; 3NIOO-CTE, Department of Plant–MicroorganismsInteractions, PO Box 40, 6666 ZG Heteren, The Netherlands;4Institut für Pflanzenwissenschaften/Phytopathologie, LFW B25,Universitätsstraße 2, ETH Zentrum, CH-8092 Zurich,Switzerland
Concepts
A plant disease results from the intimate interaction between a plant and apathogen, and today there is a great effort of research devoted to the studyof plant–pathogen interactions at the cellular and molecular levels. Theimportance of these direct interactions should not hide the role of environ-mental factors that influence disease severity. These indirect interactions areparticularly important in the case of diseases induced by soilbornepathogens. The existence of soils that suppress diseases provides an exam-ple of biotic and abiotic factors affecting the pathogen, the plant and/or theplant–pathogen interaction. Indeed, in suppressive soils, disease incidenceor severity remains low in spite of the presence of a virulent pathogen, asusceptible host plant and climatic conditions favourable for disease devel-opment.
Soils suppressive to diseases caused by a range of important soilbornepathogens have been described; they include fungal and bacterialpathogens, but also nematodes (Schneider, 1982; Cook and Baker, 1983;Schippers, 1992). These soils control root rot and wilt diseases induced by:Aphanomyces euteiches, Cylindrocladium sp., several formae speciales ofFusarium oxysporum, Gaeumannomyces graminis, Pythium spp., Phytophthoraspp., Rhizoctonia solani, Ralstonia solanacearum, Streptomyces scabies,Thielaviopsis basicola (Chalara elegans) and Verticillium dahliae. This largediversity of pathogens controlled by suppressive soils shows that soil sup-pressiveness is not a rare phenomenon. On the contrary, every soil has some
© CAB International 2006. Microbiological Methods for Assessing Soil Quality(eds J. Bloem et al.) 257

potential of disease suppression, leading to the concept of soil receptivity todiseases.
The receptivity of a soil to soilborne diseases is its capacity to suppressmore or less the saprophytic growth and infectious activity of the patho-genic populations present in the soil. Indeed, the soil is not a neutral milieuwhere pathogenic microorganisms interact freely with the roots of the hostplant. On the contrary, the soil interferes in several ways with the relation-ships between and among microorganisms, pathogens and plants, and itcan modify the interactions among microorganisms themselves. Soil recep-tivity (or soil suppressiveness) is a continuum, going from highly conducivesoils to strongly suppressive soils (Alabouvette et al., 1982; Linderman et al.,1983).
Soil suppressiveness to some diseases can be related to another funda-mental phenomenon affecting the soil microorganisms: microbiostasis. Wellstudied by Lockwood (1977) in the case of fungal spores, fungistasis isdefined as the global effect of the soil that restricts the germination andgrowth of fungi. In general, the germination and saprophytic growth offungi are more restricted in soil than would be expected from their behav-iour in vitro under similar environmental conditions of temperature, mois-ture and pH. Based on this definition, fungistasis only concerns thesaprophytic growth of the fungi, without taking into account their interac-tion with the plant, but in some cases fungistasis has been associated withsoil suppressiveness to diseases.
The concept of soil receptivity to diseases was already evoked in thedefinition of inoculum potential proposed by Garrett (1970) as ‘the energy ofgrowth of a parasite available for infection of a host at the surface of thehost organ to be infected’. One of the most important words in this defini-tion is ‘energy’ of growth. It clearly states that the presence of the inoculum,although necessary, is not sufficient to explain the disease. Among the fac-tors that affect the ‘energy of growth’ from the inoculum, Garrett (1970)pointed to ‘the collective effect of environmental conditions’, and indicatedthat ‘the endogenous nutrients of the inoculum might be augmented byexogenous nutrients from the environment’.
Applied to soilborne pathogens, this concept of inoculum potential ledto that of ‘soil inoculum potential’, which was at the origin of both theoreti-cal and practical studies. Baker (1968) gave a definition of inoculum poten-tial as the product of inoculum density per capacity. Louvet (1973)proposed to define inoculum capacity as the product of innate inoculumenergy and the effects of the environment on this inoculum. Thus, in thisdefinition, the effects of the environment on the inoculum corresponds towhat we have defined above as the soil receptivity to diseases.
At the same time, the soil inoculum potential was defined by Bouhot(1979) as the pathogenic energy present in a soil. This inoculum potentialdepends on three main factors: (i) the inoculum density; (ii) the pathogeniccapacity of this inoculum; and (iii) the soil factors which influence both theinoculum density and capacity. This last factor, again, corresponds to thesoil receptivity as defined above.
258 C. Alabouvette et al.

Thus, whatever the definition, all these authors acknowledge that thesoil plays a major role in influencing the interactions between a susceptiblehost plant and its specific pathogens present in soil. It is therefore veryimportant to take into consideration both the inoculum potential of a natu-rally infested soil and its level of suppressiveness, when elaborating controlstrategies.
Indeed, the traditional approach to control soilborne disease consistedof trying to eradicate the pathogens from the soil. This led to the use of verydangerous biocides, such as methyl bromide, use of which will be totallybanned in the near future. Opposite to that, a new approach consists ofeither enhancing the natural suppressive potential that exists in every soil,or introducing specific biological control agents. In both cases it is necessaryto characterize and, if possible, quantify the soil inoculum potential and thesoil receptivity of the soil to the disease, and also the soil receptivity to thebiological control agents.
To characterize the phytosanitary quality of a soil, it is important todetect the presence or absence of the main pathogens of the crop to be culti-vated. But this knowledge might not be sufficient to predict the risk for thecrop to be severely diseased. Therefore, it is preferable to assess the soilinoculum potential, which will give a better view of the capacity of the soilto provoke the disease. A low inoculum potential may result from a verylow inoculum density in a conducive environment, or a high inoculum den-sity in a suppressive environment. Therefore, it is very interesting to assessthe level of both soil inoculum potential and receptivity, to better estimatethe probability of a healthy crop.
Assessment of soil inoculum potential and receptivity requires bioas-says, and a few of them will be described in this section. Fungistasis, whichis assessed in vitro, may be considered as a bioindicator of the phytosanitaryquality of the soil, a few examples will be described below. Another strat-egy to assess the phytosanitary soil quality, which will not be described indetail in this section, is to quantify specific populations and/or specificgenes shown to be involved in suppressiveness (Weller et al., 2002), forexample, phloroglucinol-producing pseudomonads, shown to be involvedin the take-all decline phenomenon (Raaijmakers and Weller, 1998).
Bioassays for Assessing Soil Suppressiveness to FusariumWilts
Principle of the method
A standardized method has been proposed by Alabouvette et al. (1982). Itinvolves infesting soil samples with increasing concentrations of a patho-genic strain of Fusarium oxysporum, to grow a susceptible plant under well-controlled conditions, and to establish the disease progress curve in relationto inoculum concentrations. This method is usually applied using flax(Linum usitatissinum) and its specific pathogen F. oxysporum f. sp. lini.
Assessment of the Phytosanitary Quality of Soils 259

Materials and apparatus
• Seeds of ‘Opaline’, a highly susceptible cultivar of flax (Linum usitatiss-inum)
• Stock culture of a virulent strain of F. oxysporum f. sp. lini (Foln3)• Vessels to produce fungal inoculum in shake culture• Rotary shaker• Sintered glass funnel (pore size 40–100 µm)• Growth chamber to perform the bioassay• Polystyrene trays (60 × 40 × 5 cm)• Calcinated clay (Chemsorb®, CONEX Damolin GmbH, Peckhauser Str.
11, D. 40822 Mettmann, Germany)
Chemicals and solution
• Liquid malt extract (10 g/l, pH 5.5)• Hydrokani® nutrient solution
Procedure
1. The pathogenic strain of F. oxysporum f. sp. lini (Foln3) is cultivated in liq-uid malt extract (10 g/l, pH 5.5) for 5 days on a rotary shaker (150 rpm) at25°C.2. The whole culture is filtered through a sterile sintered glass funnel (poresize 40–100 µm) and the conidial suspension in the filtrate is adjusted to dif-ferent concentrations in order to infest the soil samples at concentrations of1 × 103, 104, 105 propagules/ml soil. 3. The bioassay is set up in polystyrene trays (60 × 40 × 5 cm). Each tray has12 rows consisting of eight holes of 7 cm diameter. The holes are closed atthe bottom with a plastic grid, topped with a layer of small beads, in orderto maintain the soil in the hole and permit excess water to drain.4. 800 g soil is distributed in two rows of eight holes (i.e. 50 g/hole) and isinfested with 4 ml of inoculum suspension at the concentrations needed toreach 1 × 10³, 104, 105 propagules/ml soil.5. Several seeds of flax cultivar (Opaline) are placed in-between two layersof calcinated clay (Chemsorb®) on the top of the soil, to prevent seeds fromdamping off. Uninoculated rows (4 ml sterile water) serve as a control.6. After emergence, the number of seedlings is reduced to one per hole,making a total of 16 plants per treatment.7. Each treatment is replicated three times.8. The experiment is carried out in a growth chamber, with 17°C night and22°C day temperature for 2 weeks, then with 20°C night and 25°C day tem-perature with a daily 15-h photoperiod of 16,000 lux for the rest of theexperiment.
260 C. Alabouvette et al.

9. The plants are irrigated regularly with nutrient solution (Hydrokani®)and water alternatively, and the number of healthy plants is recorded twicea week from 21 days to 58 days after sowing.
Calculation
Depending on the number of plants used in the bioassay, two procedures ofcalculation might be used.
When a small number of plants per replicate is used, each plant is iden-tified (as it is the case with the flax, for example) and survival data analysisis used (Hill et al., 1990). This permits estimation of the duration of life ofthe population and the comparison of the soil receptivity to Fusarium wilts(Fig. 9.6). This procedure uses a Kaplan Meier estimate to calculate the sur-vival function S(t), which provides the probability that the failure time (typ-ical wilt symptom appearance) is at least t for each plant, t being the timeelapsed since the day of inoculation. A mean survival time (MST) is thenevaluated for each subpopulation of plants (i.e. the set of 16 plants makinga replicate) inoculated with the respective doses of the pathogen, providedthat at least one plant among the 16 of a subpopulation of flax exhibitssymptoms (Tu, 1995). In the example given, the MST of the control with nopathogen could not be evaluated because no mortality occurred during thebioassay.
When large numbers of plant are required for the experimental set-up(as might be the case with the assessment of soil suppressiveness to otherdiseases), or when a disease index is used to evaluate the disease incidence,the area under the disease progress curve (AUDPC) is calculated for eachreplicate by plotting the cumulative value of the disease index (symptomoccurrence, symptom intensity or dead plants, etc.) against time.
Both procedures are applicable to evaluate natural soil suppressivenessto diseases and to evaluate the impact of any treatment on the level of soilsuppressiveness or the pathogenic infectious activity (Höper et al., 1995;Migheli et al., 2000). MST values and AUDPC values are then analysed byanalysis of variance (ANOVA) and tests of multiple comparison of means(as Fisher’s LSD test and Student t-test, for instance, with P = 0.05). Allstatistical analyses are performed using StatView® software issued by SASInstitute Inc. (Cary, North Carolina, USA).
Discussion
Soil suppressiveness to Fusarium wilts, whatever the plant and the corre-sponding forma specialis, can be assessed by this procedure using flax andits specific pathogen, F. oxysporum f. sp. lini (Abadie et al., 1998). But it isalso possible to adapt this procedure to other plant–formae speciales mod-els, such as tomato–F. oxysporum f. sp. lycopersici or melon–F. oxysporum f.
Assessment of the Phytosanitary Quality of Soils 261
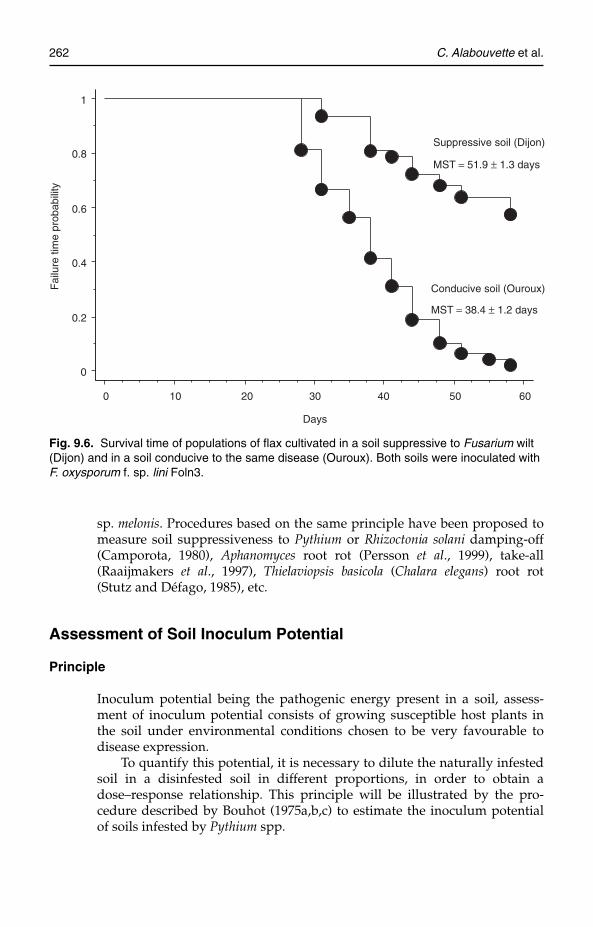
sp. melonis. Procedures based on the same principle have been proposed tomeasure soil suppressiveness to Pythium or Rhizoctonia solani damping-off(Camporota, 1980), Aphanomyces root rot (Persson et al., 1999), take-all(Raaijmakers et al., 1997), Thielaviopsis basicola (Chalara elegans) root rot(Stutz and Défago, 1985), etc.
Assessment of Soil Inoculum Potential
Principle
Inoculum potential being the pathogenic energy present in a soil, assess-ment of inoculum potential consists of growing susceptible host plants inthe soil under environmental conditions chosen to be very favourable todisease expression.
To quantify this potential, it is necessary to dilute the naturally infestedsoil in a disinfested soil in different proportions, in order to obtain adose–response relationship. This principle will be illustrated by the pro-cedure described by Bouhot (1975a,b,c) to estimate the inoculum potentialof soils infested by Pythium spp.
262 C. Alabouvette et al.
Conducive soil (Ouroux)
MST = 38.4 ± 1.2 days
Suppressive soil (Dijon)
MST = 51.9 ± 1.3 days
Days
0
0.2
0.4
0.6
0.8
1
Fai
lure
tim
e pr
obab
ility
0 10 20 30 40 50 60
Fig. 9.6. Survival time of populations of flax cultivated in a soil suppressive to Fusarium wilt(Dijon) and in a soil conducive to the same disease (Ouroux). Both soils were inoculated withF. oxysporum f. sp. lini Foln3.
Materials and apparatus
• Seeds of a variety of cucumber (Cucumis sativus), for example ‘Legénéreux’, highly susceptible to Pythium damping-off but not to otherfungi, such as Phytophthora spp., also responsible for damping-off
• A mortar• A sieve with mesh of 1000 µm• Pots containing 300 ml of soil• Sterile soil• A blender to mix soil and oatmeal• A growth chamber in which to perform the bioassay
Chemicals and solutions
• Oatmeal
Procedure
1. The soil to be analysed is first air-dried, then ground in a mortar andsieved through a mesh of 1000 µm.2. This soil is amended with oatmeal at a rate of 20 g soil/litre.3. The amended soil is diluted into sterile soil to obtain the followingconcentrations: 30%, 10%, 3%, 1%, 0.3% and 0.1% of soil in sterile soil.4. Cucumber plants, cultivar ‘Le généreux’, are produced by sowing tenseeds in steamed, disinfested soil, in 10-cm diameter pots.5. Plants are cultivated at 25°C under only 4000 lux for 15 h/day.6. After 5 days, when the hypocotyls are 3–4 cm long, water is added inorder to reach the water-holding capacity of the soil.7. 60 ml of the infested soil amended with oatmeal is spread on the surfaceof the disinfested soil.8. This soil layer is adjusted to 80% of its water-holding capacity.9. The pots with the cucumber plants are then placed for 24 h at 15°C in thedark, then transferred again to 22°C during the day, 19°C at night, with aphotoperiod of 15 h under 9000 lux.10. Damping-off symptoms appear from the second to the seventh day.
Calculations
A correlation can be calculated between the number of dead plants and theconcentration of the amended soil. From the regression lines it is possible todetermine an inoculum potential unit, defined as the weight of soil neededto provoke the death of 50% of the plants. But, in many cases, the
Assessment of the Phytosanitary Quality of Soils 263

distribution is not normal; it is therefore necessary to utilize different trans-formations before calculating the inoculum potential units.
Discussion
Based on the same principle, other procedures have been proposed toassess the inoculum potential of soil infested by Rhizoctonia solani andAphanomyces euteiches (Camporota, 1982; Williams-Woodward et al., 1998;Reverchon, 2001). It is important to choose the experimental conditions andthe test plant carefully, in order to avoid symptoms produced by otherfungi than that of interest. Depending on the pathogen studied, thedose–response relationship is not always evident; thus, it might be difficultto quantify the soil inoculum potential.
Soil Fungistasis
Introduction
Following the definition given by Lockwood (1977), the terms ‘fungistasis’and ‘mycostasis’ are used to describe the phenomenon that germinationand growth of fungi in most natural soils are more restricted than would beexpected from their behaviour under similar environmental conditions oftemperature, moisture and pH in vitro. Fungistasis affects both plant-patho-genic and saprophytic fungi, but the former are generally more sensitive(Garrett, 1970; De Boer et al., 1998). The high sensitivity of plant-pathogenicfungi to fungistasis can have both positive and negative consequences fordisease development (Lockwood, 1977). A clearly negative aspect of fungis-tasis is that it protects propagules of plant pathogens from germinationunder unfavourable conditions, e.g. the absence of a host plant. On theother hand, continuing exposure to fungistasis results in loss of vitality ofplant-pathogenic propagules. Furthermore, fungistasis limits the distanceover which plant pathogens can reach host roots. In general, the intensity offungistasis for a pathogenic fungal species is found to be positively corre-lated with the receptivity or disease suppressiveness of soils, but lack ofcorrelation has also been reported (Lockwood, 1977; Hornby, 1983; Larkin etal., 1993; Knudsen et al., 1999; Peng et al., 1999).
The intensity of fungistasis is dependent on several factors, such asphysical and chemical soil properties, fungal life-history characteristics, soilmicrobial activity and soil microbial community composition (Schüepp andGreen, 1968; Lockwood, 1977; Hornby, 1983; Toyota et al., 1996; De Boer etal., 1998). The importance of a biological factor is indicated by the relief offungistasis by (partial) sterilization treatments and addition of antibiotics(Lockwood, 1977; Toyota et al., 1996; De Boer et al., 1998, 2003).
The explanation given most often for the microbial cause of fungistasisis that soil microorganisms limit nutrient availability to the germinating
264 C. Alabouvette et al.

spores or invading hyphae (Ho and Ko, 1986; Lockwood, 1988). Fungistasishas also been attributed to the presence of antifungal compounds of micro-biological origin (Romine and Baker, 1973; Liebman and Epstein, 1992; DeBoer et al., 1998, 2003). The distinction between nutrient limitation andantibiosis as main mechanisms for fungistasis is not so easily made, as bothcan be the result of competition for nutrients (Fravel, 1988; Paulitz, 1990).Yet, although the actual mechanism of fungistasis is still open to debate, it isclear that it is a function of activities of soil microorganisms and their inter-actions with fungi. Therefore, fungistasis can be considered as a soil ecosys-tem function.
Principle of the methods
The methods used to quantify fungistasis focus on inhibition of either ger-mination of fungal spores or extension of fungal hyphae. To determine dif-ferences in fungistasis between soils, it is important to use fixed amounts ofsoil (dry weight basis) and identical moisture conditions. In general, soilsamples are wetted to pF 1 (–1 kPa) or 2 (–10 kPa) to establish optimal con-ditions for diffusion of nutrients or toxic compounds. For germination tests,spores are mixed directly into the soil or inoculated on a membrane or gelthat is in contact with the soil (Schüepp and Green, 1968; Wacker andLockwood, 1991; Knudsen et al., 1999). After incubation, the amount of ger-minated spores and/or the length of the germination tubes is determinedmicroscopically. The basic methods have been modified when the aim of thestudy has been to elucidate the mechanism of fungistasis, e.g. to establishthe contribution of toxic solutes or volatiles (Romine and Baker, 1973;Liebman and Epstein, 1992).
Quantification of the effect of soil on hyphal growth has been givenmuch less attention than that on spore germination. The methods used, sofar, report on production of fungal biomass, growth rate or colonizing abil-ity (Hsu and Lockwood, 1971; De Boer et al., 1998).
Almost all studies on soil fungistasis have been done using onemethod, i.e. either spore germination or hyphal extension. For a dune soilisolate of Fusarium oxysporum, both methods were compared during incuba-tion of a dune soil that was subjected to a sterilization + soil inoculum treat-ment (Fig. 9.7; W. de Boer and P. Verheggen, unpublished results). Bothmethods indicated a rather constant level of fungistasis in the untreated soiland a quick (within a few weeks) return to this level in the re-inoculatedsterile soil.
Differences in intensity of fungistasis between soils can remainobscured when undiluted soils are used. To overcome this, dilution series ofsoil in sterilized quartz sand have been used (Wacker and Lockwood, 1991;Knudsen et al., 1999).
Assessment of the Phytosanitary Quality of Soils 265

Materials and apparatus
• Petri dishes (13.5 cm diameter)• Acid-washed sand (or another nutrient-free, soil-like matrix)• Glass wool• Microcentrifuge• Large membrane filters (polycarbonate; pore 0.2 µm; diameter 9 cm)• Small membrane filters (polycarbonate or cellulose ester; pore 0.2 µm;
diameter 2.5 cm)• Glass slides• Binocular microscope• Epifluorescence microscope
Chemicals and solutions
• Calcofluor White M2R (Sigma Aldricht, St Louis, Missouri, USA) stain-ing solution: 2.3 mg/ml in sterile water
• Potato dextrose agar (Oxoid: UNIPATH S.A., 6 rue de Paisy, 69570Dardilly cedex, France)
Procedure for the spore germination test
For the sake of comparison, the procedure for isolation and storage of thespores should be standarized, as it has been shown that their germination
266 C. Alabouvette et al.
125
100
75
50
25
01075321010753210
Incubation time (weeks)
(A) (B)
Ger
min
aed
spor
es (
% o
f con
trol
)
125
100
75
50
25
0
Myc
elia
l ext
ensi
on (
% o
f con
trol
)
*
* * *
* *
Fig. 9.7. (A) Spore germination and (B) mycelial extension of a dune isolate of the fungusFusarium oxysporum in a dune soil that was incubated for 10 weeks after sterilization + soilinoculation (black bars). Results of similarly incubated untreated dune soil (hatched bars) arealso given.* indicates significant differences (two sample t-test) between treated anduntreated soil. Spore germination and mycelial extension were determined as described inthe text.

ability is affected by age, storage conditions, medium composition andstrain characteristics (Garrett, 1970; Mondal and Hyakumachi, 1998). Sincegrowth requirements and sporulation conditions differ among fungalspecies, it is not possible to give one general applicable protocol. Mostoften, fungi are grown for 2–3 weeks on a solid medium such as potato dex-trose agar or oatmeal agar. The spores are isolated by applying a smallamount of sterile water or salt solution and gently rubbing the surface witha bent glass rod. The spore suspension is then filtered through sterile glasswool to remove clumps of spores and mycelial fragments. Further cleaningof spores is done by centrifugation. The density of the spores is determinedmicroscopically and adjusted, if necessary. Spore suspensions are usedimmediately or stored at –80°C in an aqueous solution of glycerol (Liebmanand Epstein, 1992).
As indicated above, several methods can be used for the germinationtest. Here we propose to inoculate the spores on top of a filter, as this iseasiest for subsequent microscopic inspection. The following protocol isgiven as an example:
1. Petri dishes are filled with 90 g moist (–10 kPa) soil, which is spreadevenly to obtain a smooth surface (bulk density mineral soil about1 g/cm3).2. A sterile, water-saturated polycarbonate membrane filter (9 cm diameter)is placed on top of the soil. Two sterile glass slides are put on top of themembrane filter (4 cm apart) to keep it in close contact with the soil. ThePetri dish is sealed with Parafilm and incubated for 48 h at 20°C to allowdiffusion of soil solutes into the membrane filter.3. Small membrane filters containing the spores (added by vacuum filtra-tion) are placed in the area between the slide glasses. The Petri dish issealed again and incubated for 16–48 h (depending on fungal species). 4. Spores are stained by floating the membranes for 2 min in a solution ofCalcofluor White M2R (Sigma) in demineralized water (2.3 mg/ml). Afterdestaining with demineralized water, at least 100 spores/filter are checkedfor germination using an epifluorescence microscope. 5. As control for germination ability, soil is replaced by nutrient-free, acid-washed sand.
Procedure for the hyphal extension test
The method described here tests the ability of fungal hyphae to invade soilsfrom nutrient-rich agar (De Boer et al., 1998, 2003).
1. Petri dishes (8.5 cm diameter) are filled with 50 g moist (–10 kPa) soil,which is spread evenly to obtain a smooth surface (bulk density mineralsoil about 1 g/cm3).2. Potato dextrose agar discs (1 cm diameter; 0.4 cm thick) from the grow-ing margin of the fungal colony are inverted and placed centrally on top ofthe soil in a Petri dish.
Assessment of the Phytosanitary Quality of Soils 267

3. After 3 weeks of incubation at 20°C, the extension of the mycelium isdetermined using a binocular microscope, and the area of hyphal extensionis estimated (Fig. 9.8). Image analysis can be used to obtain a more accurateestimate of the mycelial area.4. The hyphal extension on the soil samples is compared with that on nutri-ent-free, acid-washed beach sand (–10 kPa).
As a modification, the agar disc containing fungal inoculum may beseparated from soil by inert material (e.g. stainless-steel discs) to preventstimulation of growth of (antagonistic) soil microorganisms by agar.
Calculations
For both tests (germinated spores or invaded area) fungistasis is expressedas the percentage of the control (acid-washed sand).
Discussion
A simple estimate of intensity of soil fungistasis is obtained by measuringthe difference between hyphal extension or spore germination on a nutrient-free, soil-like control and on the soil under study. In fact, the nutrient avail-ability in the control should be the same as in the soil, but this is very hard torealize. Therefore, given the fact that most soils are carbon-limited for micro-bial growth, a nutrient-free control seems a reasonable option. In addition,effect of soil sterilization on growth and germination may be determined todifferentiate between biotic and abiotic causes of fungistatis (Dobbs andGash, 1965; De Boer et al., 1998, 2003). Yet, care should be taken that the ster-ilization procedure does not introduce undesired (inhibiting) side-effects.
268 C. Alabouvette et al.
Soil
Agar disc
Hyphae
Marking of hyphal area
Fig. 9.8. Determination of the area of hyphal extension.

For comparison of fungistastic properties of a wide range of soils, itwould be best to use a fixed set of type fungal species/strains. However,from an ecological or phytopathological point of view this has little mean-ing, as subspecies or strains can be adapted to specific climatic and environ-mental conditions. Hence, the specific questions to be answered determinewhat will be the most appropriate fungal strains to use for fungistasismeasurement.
It is important to realize that soil fungistasis is dynamic. It can bedecreased strongly by enhanced carbon availability, e.g. caused by roots.This explains why even highly fungistatic soils do not necessarily preventpathogenic fungi from causing disease. Hence, measurements of fungistasismust be completed by bioassays allowing the assessment of receptivity andinoculum potential.
Assessment of the Phytosanitary Quality of Soils 269

9.5 Free-living Plant-beneficial Microorganisms andSoil Quality
YVAN MOËNNE-LOCCOZ,1 SHERIDAN L. WOO,2 YAACOV OKON,3 RENÉ
BALLY,1 MATTEO LORITO,2 PHILIPPE LEMANCEAU4 AND ANTON HARTMANN5
1UMR CNRS 5557 Ecologie Microbienne, Université ClaudeBernard (Lyon 1), 43 bd du 11 Novembre, 69622 Villeurbannecedex, France; 2Universita degli Studi di Napoli ‘Federico II’,Dip. di Arboricoltura, Botanica e Patologia Vegetale, Sez.Patologia Vegetale, Lab. di Lotta Biologica, Portici (NA), Italy;3Hebrew University of Jerusalem (HUJI), Department of PlantPathology and Microbiology, Faculty of Agricultural, Food andEnvironmental Quality Sciences, Rehovot, Israel; 4UMR 1229INRA/Université de Bourgogne ‘Microbiologie et Géochimiedes Sols’, INRA-CMSE, BP 86510, 21065 Dijon cedex, France;5GSF-National Research Center for Environment and Health,Department of Rhizosphere Biology, Ingolstädter Landstraße 1,85764 Neuherberg/München, Germany
Introduction
Many microorganisms living in the rhizosphere and benefiting from rootexudates can have positive effects on plant growth and health. The relation-ship between these plant-beneficial microorganisms and the plant host cor-responds to a symbiosis or an associative symbiosis (cooperation). The firstcase often involves differentiation of one partner or both, which facilitatesidentification of such symbiotic interactions; in this handbook, symbioticinteractions with the plant are covered in the sections dealing with nodulat-ing, nitrogen-fixing bacteria (Section 9.2) and mycorrhizal fungi (Section9.3). The second case corresponds to microorganisms designated plant-growth-promoting rhizobacteria (PGPR) and plant-growth-promoting fungi(PGPF), and these are the focus of this section.
PGPR and PGPF can exert positive effects on plants by various mecha-nisms, some of them implying a directly positive effect on seed germina-tion, root development, mineral nutrition and/or water utilization (i.e.phytostimulation) (Jacoud et al., 1998, 1999; Dobbelaere et al., 2001). Indirecteffects can also take place, and typically involve suppression of phytopath-ogenic bacteria or fungi, and/or phytoparasitic nematodes (i.e. biologicalcontrol) (Cronin et al., 1997; Walsh et al., 2001; Burdman et al., 2002). In cer-tain cases, the biocontrol effect mediated by indigenous free-living plant-
270

beneficial microorganisms results in the suppression of plant disease(Moënne-Loccoz and Défago, 2004), which is an emerging ecosystemicproperty (see Section 9.4). In most cases, however, the plant-beneficialeffects of indigenous free-living microorganisms remain unnoticed becauseof the absence of visible differentiation (in contrast to root nodules in thenitrogen-fixing symbiosis, for example), and the fact that these effects addup with a multitude of other effects related to variability in space of plantgenotypes, soil composition, farming practices, microclimatic conditionsand the composition of the soil biota. This is particularly true for phytostim-ulatory effects due to indigenous free-living plant-beneficial microorgan-isms, because they do not necessarily lead to differences in plant health.However, the largely unnoticed contribution of indigenous free-livingplant-beneficial microorganisms to plant growth and health is important.Furthermore, since chemical inputs into farming can have deleteriouseffects on environmental health and food product quality, effective PGPRand PGPF inoculants have the potential to be used as a replacement for, orin combination with reduced rates of, chemical fertilizers (phytostimula-tion) and pesticides (biocontrol).
Many taxa of free-living plant-beneficial microorganisms are known,for both bacteria and fungi. Some of them, e.g. fluorescent pseudomonadsand non-pathogenic Fusarium oxysporum, have been discussed in Section9.4, due to their contribution to disease suppressiveness of certain soils. Inthis section, the emphasis will be placed on free-living plant-beneficialmicroorganisms belonging to the bacterial genus Azospirillum and the fun-gal genera Trichoderma and Gliocladium.
Azospirillum (group 1 of the α-proteobacteria) are PGPR found in closeassociation with the roots of plants, particularly Gramineae (Tarrand et al.,1978; Bally et al., 1983), and they mainly colonize the root elongation zone.They exert beneficial effects on plant growth and yield of many crops ofagronomic importance (Okon and Labandera-Gonzalez, 1994), and repre-sent one of the best-characterized PGPR (Okon, 1994). During the earlydays of the investigation on Azospirillum–plant associations, plant growthpromotion was thought to derive from the contribution of biological N2 fix-ation by the bacterial partner. However, further studies demonstrated thatthe positive effects of Azospirillum are due mainly to morphological andphysiological changes of the roots of inoculated plants, which lead to anenhancement of water and mineral uptake, especially when plants grow insuboptimal conditions (Dobbelaere et al., 2001). Indeed, inoculation withAzospirillum increases the density and length of root hairs, as well as theappearance and elongation rates of lateral roots, thus increasing the rootsurface area. These effects are linked to the secretion of plant growth hor-mones such as auxins, gibberellins and cytokinins by the bacterium(Dobbelaere et al., 2001), a property shared with a variety of other plant-beneficial root-colonizing bacteria. In addition to phytostimulation, certainAzospirillum strains display biocontrol properties towards phytopathogenicbacteria (Bashan and de-Bashan, 2002) or parasitic plants (Bouillant et al.,1997; Miché et al., 2000).
Free-living Plant-beneficial Microorganisms 271

Trichoderma and Gliocladium are fast-growing, spore-producing fungi,commonly found in soil throughout the world (Klein and Eveleigh, 1998).They are resistant to many xenobiotic compounds, and can catabolize awide range of natural and synthetic organic compounds (including com-plex polymers), thus having an effect on the nitrogen and carbon cycles(Danielson and Davey, 1973b; Kubicek-Pranz, 1998). Most importantly, bio-control interactions exist with several phytopathogens, such as Rhizoctonia,Pythium, Sclerotinia, Fusarium, Verticillium, Phytophthora, Phomopsis,Gaeumannomyces and Sclerotium (Weindling, 1932; Jeffries and Young, 1994).The biocontrol mechanisms implicated are diverse. First, Trichoderma andGliocladium species are relatively unspecialized, disruptive or necrotrophicmycoparasites, and may also be parasitic towards nematodes. Constitutivesecretion of cell-wall-degrading enzymes (CWDEs), such as chitinases andcellulase, plays an important role (Lorito et al., 1996; Lorito, 1998; Zeilingeret al., 1999). The subsequent release of cell-wall degradation productsenables chemotactical location of the host (Zeilinger et al., 1999). Physicalcontact with the phytopathogen triggers coiling, attachment and host pene-tration by Trichoderma (Inbar and Chet, 1992, 1995). Secondly, Trichodermaand Gliocladium species produce antibiotics, which can affect bacteriaand/or pathogenic fungi (Howell, 1998; Kubicek et al., 2001). Thirdly,Trichoderma and Gliocladium can compete with phytopathogenic species.Although competition is less important than other biocontrol mechanisms,it is a prerequisite for efficient plant colonization (Lo et al., 1996; Harmanand Bjorkman, 1998). Fourthly, Trichoderma and Gliocladium may have directeffects on the plant, e.g. via solubilization of inorganic nutrients or inducedresistance in the plant (Windham et al., 1986; Harman, 2000), resulting inbetter seed germination, enhanced plant growth and development, andincreased yield (Lindsey and Baker, 1967; Windham et al., 1986; Harman2000). The population levels at which one can expect beneficial effects fromthese indigenous biocontrol fungi are not known, and they probablydepend on the phytopathogen, since biocontrol effects are host-dependent.However, there is a link to soil quality, in that environmental conditionsthat stimulate growth and subsequent colonization and sporulation of bio-control fungi (e.g. high nutrient availability) will also reduce pathogen pop-ulations in the soil. Trichoderma and/or Gliocladium are used in manycommercial inoculants worldwide. Websites that can be consulted for infor-mation include http://www.agrobiologicals.com, http://www.oardc.ohio-state.edu/apsbcc/productlist.htm, http://attra.ncat.org/attra-pub/orgfert.html and http://www.epa.gov/pesticides/biopesticides.
In this section, methods available to assess indigenous populations offree-living plant-beneficial microorganisms (Azospirillum, Trichoderma andGliocladium) are described. Since these microorganisms may be present indifferent microbial habitats in the soil ecosystem (from bulk soil to root tis-sues), a strategy to separate the relevant microhabitats/compartments andvalidated in the case of bacteria is presented (pp. 273–274). The resultingsamples can be processed via cultivation-based methods (pp. 274–278 and281–284), which can only recover a minority of individuals (the culturable
272 Y. Moënne-Loccoz et al.

ones), but are needed to obtain strains to be used as inoculants.Alternatively, methods for cultivation-independent analysis of free-livingplant-beneficial bacteria are described (pp. 291–281).
Extraction of Indigenous Free-living Plant-beneficial Bacteriafrom Soil and Roots
Introduction
Desorption of bacteria from soil and roots is important for qualitative andquantitative monitoring, regardless of whether indigenous bacteria or inoc-ulants are considered. A standardized protocol for the separation and differ-entiation of different rhizosphere compartments (e.g. rhizospheresoil/rhizoplane versus root tissues) and the extraction of bacterial cellsadsorbed to the root surface has been described in the case of Medicagosativa cv. Europae (Mogge et al., 2000; Hartmann et al., 2004). The procedurefollowed most recommendations made by Macdonald (1986) and Herronand Wellington (1990) and is presented hereafter. Fluorescent in situhybridization (FISH) in combination with confocal scanning lasermicroscopy (CSLM) is useful to confirm successful desorption of bacteria inroot surface studies (see pp. 279–281).
Principle of the method
The method consists of separating roots from soil by physical means, fol-lowed by the maceration of root tissues to free endophytic microorganisms.Microbial cells are then extracted from the samples.
Materials and apparatus
• Sterile tweezers• Stomacher 80 (Seward Medical, Thetford, UK)• Laboratory glassware (Erlenmeyer flasks, etc.)• Gauze (40 µm mesh size)• 5-µm syringe filter (Sartorius No. 17549, Göttingen, Germany)
Chemicals and solutions
• 0.01 M phosphate buffer (Na2HPO4/KH2PO4, pH 7.4)• 0.1% sodium cholate buffer• Polyethylene glycol 6000 (PEG 6000; Sigma, Deisenhofen, Germany)• Cation exchange polystyrene beads (Chelex 100; Sigma)
Free-living Plant-beneficial Microorganisms 273

Procedure
1. Roots are carefully separated from the soil using sterile tweezers. Allsteps are conducted with sterile solutions on ice.2. Non-rhizosphere soil (bulk soil compartment) and root-attached soil par-ticles collected by shaking the roots (rhizosphere compartment) are eachsuspended in 0.01 M phosphate buffer in a 1:9 (w/v) ratio and dispersed for1 min at highest speed in a Stomacher 80.3. To extract rhizoplane and endophytic bacteria (root compartment), 1 g offresh roots previously cleaned from adhering soil particles (see above) andwashed in phosphate buffer are suspended in 20 ml of 0.1% sodium cholatebuffer (Macdonald, 1986). The suspension is treated in a Stomacher 80 athighest speed for 4 min to disrupt polymers.4. After transfer into an Erlenmeyer flask, 0.5 g of PEG 6000 and 0.4 g ofcation exchange polystyrene beads (Chelex 100) are added and the suspen-sion is stirred for 1 h at 50 rpm and 4°C.5. The Stomacher/stirring procedure is repeated three times, the rootsbeing transferred to fresh 0.1% sodium cholate buffer with PEG 6000 andChelex 100 after each extraction step. The suspensions obtained after eachstep are pooled.6. Root and soil particles are removed by filtration through a gauze (40 µmmesh size) and subsequently a 5-µm syringe filter. The resulting sample isused to study bacteria from the root compartment.
Discussion
The suspensions thus obtained from bulk soil, the rhizosphere and the rootcompartment (i.e. rhizoplane and root tissues) can be used for analysis ofindigenous free-living plant-beneficial bacteria (see below) as well as moni-toring of bacterial inoculants.
Cultivation Approach to Enumerate Indigenous Azospirillum spp.
Introduction
The presence of Azospirillum spp. in the rhizosphere can be shown by enrich-ment and cultivation on semi-solid nitrogen-free media, and this approachwill also target other root-associated nitrogen-fixing bacteria (Döbereiner,1995). Table 9.4 summarizes the different media suitable for the enrichmentof Azospirillum spp. on the basis of different pH requirements and carbonsubstrate preferences. Azospirillum spp. differ in their physiology, as summa-rized in Table 9.5, which can be used to identify the isolates using physiolog-ical criteria. In addition, routine API® and BiologTM test systems are used forconvenient physiological identification purposes. Here, protocols based on16S rDNA hybridization to identify Azospirillum species are presented.
274 Y. Moënne-Loccoz et al.

Free-living Plant-beneficial Microorganisms 275
Table 9.4. Four media used for the isolation and cultivation of Azospirillum spp.
Ingredients (per litre) NFba,b LGIa,b Modified NFb Potato agarc
DL-Malic acid 5 g – 5 g 2.5 gSucrose – 5 g – 2.5 gK2HPO4 0.5 g 0.2 g 0.13 g –KH2PO4 – 0.6 g – –MgSO4.7H2O 0.2 g 0.2 g 0.25 g –NaCl 0.1 g – 1.2 g –CaCl2.2H2O 0.02 g 0.02 g 0.25 g –Na2MoO4.2H2O – 0.002 g – –Na2SO4 – – 2.4 g –NaHCO3 – – 0.22 g –Na2CO3 – – 0.09 g –K2SO4 – – 0.17 g –Minor element solutiond 2 ml – 2 ml 2 mlBromothymol blue solutione 2 ml 2 ml – –Fe-EDTA, 1.64% 4 ml 4 ml 4 ml –pH-value (adjusted with KOH) 6.8 6.0 8.5 6.8Vitamin solutionf 1 ml 1 ml 1 ml 1 mlAgar 1.75 g 1.75 g 1.75 g 15 g
a Ingredients should be added to the medium in the stated order; b Semi-solid medium; c 200 gfresh potatoes are peeled, cooked for 30 min and filtered through cotton before other ingredientsare added; d CuSO4.5H2O, 0.4 g; ZnSO4.7H2O, 0.12 g; H2BO3, 1.4 g; Na2MoO4.2H2O, 1 g;MnSO4.H2O, 1.5 g; H2O, 1000 ml; e 0.5% bromothymol blue in 0.2 N KOH; f Biotin, 10 mg;Pyridoxol/HCl, 20 mg; H2O, 100 ml.
Principle of the methods
Colony hybridization with 16S rDNA-targeted oligonucleotides (Kabir etal., 1994, 1995; Chotte et al., 2002) can be used to identify Azospirillumspecies, and the procedure is usually carried out on nitrogen-fixing isolatesable to fix the dye Congo Red, because this is a typical Azospirillum attribute(Rodriguez Caceres, 1982). Species-specific probes include Al (for A.lipoferum, 5’-CGTCGGATTAGGTAGT-3’), used at a hybridization/washingtemperature of 43°C, and Aba (for both A. brasilense and A. amazonense, 5’-CGTCCGATTAGGTAGT-3’), used at a hybridization/washing temperatureof 51°C (Chotte et al., 2002).
Materials and apparatus
• Sterile membranes (GeneScreen Plus; Nen Life Science Products,Boston, Massachusetts, USA)
• 3MM paper• UV table• Hybridization tubes and oven (65°C)• Hyper film TM-MP (Amersham Labs, Amersham, UK)• Autoradiography set-up

For the alternative hybridization protocol:
• Glass slides• Epifluorescence microscope
Chemicals and solutions
• Tryptone-yeast extract (TY; per litre: tryptone, 5 g; yeast extract, 3 g;CaCl2.H2O, 0.5 g)
• 10% (w/v) sodium dodecyl sulphate (SDS)• Denaturing solution (NaOH 0.5 M and NaCl 1.5 M)• Neutralizing solution (NaCl 1.5 M, Tris 1 M, pH 7.4)• 2× standard saline citrate (SSC; NaCl 0.1 M, sodium citrate 15 mM, pH
7.0)• Pre-hybridization solution (i.e. 16.5 ml sterile distilled water, 3 ml dex-
tran 50%, 1.5 ml SDS 10%, 0.58 g NaCl)
276 Y. Moënne-Loccoz et al.
Table 9.5. Main physiological characteristics of Azospirillum spp.
Carbon utilization test (API)N-Acetylglucosamine -a � � � d � NDD-Glucose d � � d � � �Glycerol �b � � � � � �D-Mannitol � � � � � � �D-Ribose � � � � � d �D-Sorbitol � � � � � � �Sucrose � � NDd � � � �
Acid formation (API 50 anaerobe)From glucose dc � � � � � �From fructose � � � � � � �
MiscellaneousBiotin requirement � � � � � � �Optimum growth temperature 30°C 37°C 28°C 37°C 35°C 33°C 41°COptimum pH for growth 6.0–7.0 5.7–6.8 ND 6.0–7.8 5.7–6.5 5.5–8.5 6.8–8.0Occurrence of pleomorphic � � � � � � �cells
a sign (�) means less than 10% of the investigated strains showed a positive response; b sign (�) means more than 90% of the investigated strains showed a positive response;c d (depends) means between 11% and 89% of the investigated strains showed a positiveresponse; d Not determined.
A. d
oebe
rein
erae
A. l
ipof
erum
A. l
argi
mob
ile
A. b
rasi
lens
e
A. a
maz
onen
se
A. i
rake
nse
A. h
alop
raef
eren
s

• 32P• Denatured herring sperm DNA
For the alternative hybridization protocol:
• Phosphate-buffered saline (PBS; 0.13 M NaCl, 7 mM Na2HPO4 and3 mM NaH2PO4 (pH 7.2))
• Paraformaldehyde• Agarose• Ethanol• FISH hybridization buffer (20 mM Tris-hydrochloride, pH 7.2, 0.01%
SDS and 5 mM EDTA)• NaCl• Formamide• DAPI• Citifluor AF1 (Citifluor Ltd, London, UK)
Procedure
1. The bacteria are grown for 48 h at 28°C on sterile membranes(GeneScreen Plus) previously placed on TY plates. Two membranes areused for each probe.2. The membranes are then treated successively for 6 min in 10% (w/v)SDS, 10 min in denaturing solution, 9 min in neutralizing solution and9 min in 2× standard saline citrate to promote cell lysis.3. The membranes are left drying for 1 h on 3MM paper, followed by a 4-min UV treatment for DNA binding.4. The hybridization procedure consists of moistening the membranes in 2×SSC, rolling and transferring them into hybridization tubes containing pre-hybridization solution.5. Each probe is labelled at the 5’ end with 32P (as described by Sambrook etal., 1989).6. The hybridization tubes are then put for 2 h in an oven (65°C) beforeadding the labelled probe and 600 µl of denatured herring sperm DNA.7. After hybridization for 12 h, the membranes are rinsed at room tempera-ture for 5 min (twice) using 2× SSC, 30 min (twice) using 2× SSC and 1%SDS, and 30 min (three times) using 0.1× SSC.8. The membranes are left to dry for 1 h at room temperature on 3MMpaper sheets and are then packed with Hyper film TM-MP for at least 12 hat –80°C for autoradiography.
An alternative hybridization protocol involves:
1. Fixing bacteria overnight at 4°C in PBS containing 3% paraformalde-hyde.2. Then they are washed in PBS, mixed with 0.3% agarose, dropped on toglass slides and dried at room temperature.
Free-living Plant-beneficial Microorganisms 277

3. These glass slides are immersed successively in 50%, 80% and 96%ethanol for 3 min each and stored at room temperature.4. Oligonucleotide probes (Table 9.6) labelled with Cy3, Cy5 or 5(6)-car-boxyfluorescein-N-hydroxysuccinimide ester (FLUOS) at the 5’ end areused.5. The oligonucleotides are stored in distilled water at a concentration of50 ng/µl (Amann et al., 1990).6. FISH is performed (Wagner et al., 1993) at 46°C for 90 min in FISHhybridization buffer containing 0.9 M NaCl and formamide at the percent-ages shown in Table 9.6.7. Hybridization is followed by a stringent washing step at 48°C for 15 min.8. The washing buffer is removed by rinsing the slides with distilled water.9. Counterstaining with DAPI and mounting in Citifluor AF1 is performedas described previously (Aßmus et al., 1995).10. Observations are made by epifluorescence microscopy.
278 Y. Moënne-Loccoz et al.
Table 9.6. 16S rRNA-targeted oligonucleotide probes for FISH analysis of the Azospirillumcluster (Stoffels et al., 2001).
Probes andcompetitors Sequence (5�–3�) Stringencya Specificity
AZO440a + GTCATCATCGTCGCGTGC 50 Azospirillum spp.AZO440b GTCATCATCGTCGTGTGC 50 Conglomeromonas spp.,
Rhodocista spp.AZOI665 CACCATCCTCTCCGGAAC 50 Azospirillum species clusterb
Abras1420 CCACCTTCGGGTAAAGCCA 40 A. brasilenseAlila1113 ATGGCAACTGACGGTAGG 35 A. lipoferum, A. largimobileAdoeb587 ACTTCCGACTAAACAGGC 30 A. doebereineraeAhalo1115 ATGGTGGCAACTGGCAGCA 45 A. halopraeferensAama1250 CACGAGGTCGCTGCCCAC 50 A. amazonenseAirak985 TCAAGGCATGCAAGGGTT 35 A. irakenseRhodo654 ACCCACCTCTCCGGACCT 65 Rhodocista centenariaSparo84 CGTGCGCCACTAGGGGCG 20 Skermanella parooensisAbras1420C CACCTTCGGGTAAAACCA 40 Competitorc
Alila113C ATGGCAACTGGCGGTAGG 35 CompetitorAhalo1115C ATGATGGCAACTGGCAGTA 45 Competitor
a Amount of formamide (%, v/v) in hybridization buffer; b lipoferum, brasilense,halopraeferens, doebereinerae, and largimobile; c the competitor oligonucleotide (withoutfluorescent label) is used in the FISH analysis to prevent false-positive hybridizations, whichcould be possible in rare cases of indigenous bacteria harbouring very close oligonucleotidesimilarity according to the sequence analysis.

Cultivation-independent Approach to Monitor IndigenousAzospirillum spp. in Extracted Root Compartments or in theRhizosphere
Introduction
Culture-dependent techniques may not always enable recovery of all tar-geted bacteria, even when considering a particular strain belonging to aneasily culturable taxon (Défago et al., 1997; Mascher et al., 2003). Even theefficacy of the PCR-based method may depend on the physiological statusof the cells (Rezzonico et al., 2003). Here, a FISH method enabling detailedlocalization of cells and an in situ approach is presented.
Principle of the methods
Concomitant staining with the general DNA stain DAPI and FISH enablescounting total and hybridizing bacteria in the three compartments outlinedin Fig. 9.9, after collection on polycarbonate filters. The main advantage ofFISH analysis is that the bacteria can also be identified and localizeddirectly in the rhizosphere, provided that they are present in a physiologi-cally active state (i.e. harbouring a high ribosome content).
Materials and apparatus
• 0.2 µm polycarbonate filters• Zeiss Axiophot 2 epifluorescence microscope (Zeiss, Jena, Germany)• Filter sets F31–000, F41–001 and F41–007 (Chroma Tech. Corp.,
Battleboro, Vermont, USA)
Chemicals and solutions
For analysis of cell suspensions:
• Formaldehyde• Ethanol• Citifluor AF1 (Citifluor Ltd, London, UK)• DAPI• Species-specific DNA probes (see Table 9.6)
For analysis in situ:
• PBS (0.13 M NaCl, 7 mM Na2HPO4 and 3 mM NaH2PO4 (pH 7.2))• Formaldehyde• A confocal laser scanning microscope, e.g. microscopes LSM 410 or
LSM 510 (Zeiss, Jena, Germany).
Free-living Plant-beneficial Microorganisms 279

Procedure
Concomitant staining with DAPI and FISH is done as follows.
1. The cell suspensions (for extraction details, see pp. 273–274) are fixedovernight at 4°C with 3% formaldehyde and concentrated on to 0.2 µmpolycarbonate filters (100 µl aliquots).2. Dehydration of cells is performed successively with 50%, 80% and 96%ethanol for 3 min each.3. The slides are mounted with Citifluor AF1 to reduce photobleaching.4. A Zeiss Axiophot 2 epifluorescence microscope equipped with filter setsF31–000, F41–001 and F41–007 can be used for the enumeration of bacteriaon filters.5. Total cell counts (DAPI) and hybridizing bacteria using a set of domain-specific to species-specific probes (see Table 9.6) are determined by evaluat-ing at least ten microscopic fields with 20–100 cells per field.
When FISH is used for in situ assessment, root samples are fixedovernight at 4°C in PBS containing 3% paraformaldehyde, washed in PBSand treated as described above. For in situ identification of Azospirillum onthe root surface, the autofluorescence problem (Hartmann et al., 1998b)
280 Y. Moënne-Loccoz et al.
FISH, immunolabelling,fluorescence monitoring of
tagged bacteria andbacterial activity
Plants
Roots withadhering soil
Root-free soil(Bulk soil compartment)
Shaking,washing
(Ecto)rhizosphere soil(Rhizosphere compartment)
Roots: Rhizoplane and root tissues(Root compartment)
In situ studies (ISS)Cultivation-based methods and CLPP;DNA extraction, PCR amplification ofphylogenetic marker regions/DGGE,
PLFA-biomarker studies
Fixation Extraction
ISS ESS
ISS ESS
Ex situ studies (ESS)
Fig. 9.9. Strategy to separate different microhabitats/compartments in soil–plant systems fordetailed analysis of indigenous free-living plant-beneficial microorganisms and monitoring ofmicrobial inoculants by in situ studies (ISS) and ex situ studies (ESS).

makes it necessary to use a confocal laser scanning microscope, such as theinverted Zeiss microscopes LSM 410 or LSM 510, which are equipped withlasers (Ar-ion UV; Ar-ion visible; HeNe) supplying excitation wavelengthsat 365 nm, 488 nm, 543 nm and 633 nm. Usually, a general cell DNA stain-ing with DAPI is combined with FISH using probes specific for the domainbacteria, group-specific probes (Amann et al., 1995), and genus- or species-specific probes.
Calculation
For in situ assessment, sequentially recorded images are assigned to therespective fluorescence colour and then merged to obtain a true colour dis-play. All image combining and processing is performed with the standardsoftware provided by Zeiss.
Discussion
These analyses may be completed as follows. When cell suspensions areused, PCR amplification of the 16S rDNA from the samples and subsequentelectrophoretic fingerprinting of the amplification products or clone bankanalysis can be performed (Weidner et al., 1996; Muyzer and Smalla, 1998).Structural and functional microbial diversity aspects can also be assessedusing community-level fatty acid analysis (Zelles, 1997; White andRingelberg, 1998) and physiological profiling (Garland et al., 1997).
When the assessment is performed in situ, other specific oligonucleotideprobes available for a number of root-associated and symbiotic bacteria(Kirchhof et al., 1997; Ludwig et al., 1998; Hartmann et al., 2000) can also beused, which enables extension of the characterization of rhizosphere bacte-ria to other root-associated bacteria of interest.
Cultivation Approach to Monitoring Indigenous Trichoderma andGliocladium Species
Introduction
A range of different methods have been assessed for monitoring ofTrichoderma and Gliocladium species, including direct PCR (Lieckfeldt et al.,1998) and methods based on the use of fluorogenic substrates (Miller et al.,1998) and specific monoclonal antibodies (Thornton et al., 2002). Hereafter,only cultivation methods will be presented. Trichoderma and Gliocladiumspecies are ubiquitous in soil, and they can be readily isolated due to theirrapid growth and profuse sporulation. Samples may be obtained from agri-cultural soils growing the crop of interest for a biocontrol application, orfrom soils naturally suppressive to the target pathogen. Particular soilmicrohabitats can be targeted (see pp. 273–274).
Free-living Plant-beneficial Microorganisms 281
Principle of the methods
The fungi are isolated by homogenizing soil in water, diluting the soil sus-pension and plating on to solid media containing various compounds toselectively suppress growth of bacteria, oomycetes, mucorales and otherfungi. Many different media have been formulated for selective isolation ofTrichoderma and Gliocladium (Davet, 1979; Elad et al., 1981; Johnson et al.,1987; Park et al., 1992; Askew and Laing, 1993), and examples of commonlyused media are provided below. Identification of fungal colonies is per-formed by microscopic analysis of key morphological properties.
Materials and apparatus
• Analytical balance• Magnetic stirrer and stir bars• pH meter• Blender• Autoclave• 50°C water bath• Vortexer• Laminar flow hood• Bunsen burner• Incubator or growth chamber with a constant temperature of 25°C and
light• 180°C oven• Light microscope• Glassware: Erlenmeyer flasks (1 l) with autoclavable lids or aluminium
foil, beakers (250 ml), 10–15 ml tubes in rack, graduated cylinder (1l)• Parafilm• Pipettes (P10, P200, P1000) and sterile disposable tips• Petri plates (90 mm) and plate spreader• Spatulas• Microscope slides and coverslips
Chemicals and solutions
Petri plates are prepared in advance:
• Trichoderma Selective Medium (TSM; Elad and Chet, 1983) is preparedfrom a 1 l solution containing 200 mg MgSO4.7H2O, 900 mg KH2PO4,150 mg KCl, 1 g NH4NO3, 3 g glucose, 20 g agar. Autoclave and cool to50°C, then add 250 mg chloramphenicol, 300 mg fenaminosulf, 200 mgpentachloronitrobenzene, 200 mg Rose Bengal, 20 mg Captan (50% wet-table powder).
282 Y. Moënne-Loccoz et al.

• Modified Trichoderma Selective Medium (Smith et al., 1990) is preparedfrom a 1 l solution containing 260 mg KNO3, 260 mg MgSO4.7H2O,120 mg KH2PO4, 50 mg citric acid, 1 g Ca(NO3)2, 1 g CaCl2.2H2O, 2 gsucrose, 20 g agar, Igepal CA-630 (pH adjusted to 4.5). Autoclave andcool to 50°C, then add 50 mg chlortetracycline, 40 mg Captan (50% wet-table powder), 2.5 mg Vinclozolin.
• Selective Basal Medium (Papavizas and Lumsden, 1982) is prepared bymixing 200 ml V-8, 800 ml water, 1 g glucose, 20 g agar. Autoclave andcool to 50°C, then add 500 µg sodium propionate, 100 µg neomycin sul-phate, 100 µg Bacitran, 100 µg penicillin G, 100 µg chloroneb, 25 µgchlortetracycline, 20 µg nystatin, 2 ml alkylaryl polyether alcohol.
Procedure
1. Soil (10 g) is added to 100 ml distilled water and homogenized for 1 min.2. A dilution series (0, 10�1, 10�2, 10�3) is prepared by transferring 1 ml ofthe soil suspension into 9 ml distilled water and vortexing well before eachpipetting. If the medium contains Igepal CA-630, the dilution series can bereduced by one.3. Add 100 µl of each dilution per plate, spread the sample evenly over thesurface with a sterile spreader and cover the plates (three plates per dilution).4. The plates are incubated 5–7 days with light, at 25°C. In addition, partic-ular temperature or pH conditions or the presence of chemical pesticidesmay be used as additional selective criteria for obtaining potential inoculantfor, for example, post-harvest applications (Johnson et al., 1987; Widden andHsu, 1987; Faull, 1988).5. Sporulating fungal colonies are isolated from the plates and identified.Identification of fungal isolates is confirmed microscopically by morphol-ogy examination using taxonomic keys such as those of Gams and Bissett(1998).6. The Trichoderma or Gliocladium isolates can be purified. They are main-tained on potato dextrose, oatmeal or cornmeal agar at 25°C or as a sporesuspension prepared in 20% glycerol for storage at –20°C.
Calculation
Colony-forming units (CFU) are computed and expressed per g of soil.
Discussion
The CFUs obtained from direct soil plating are more likely indicative of thenumber of dormant spores than the amount of active mycelial biomassin the soil. In general, Trichoderma and Gliocladium species are relatively
Free-living Plant-beneficial Microorganisms 283

adaptable to diverse ecological habitats. However, the distribution ofdiverse species and isolates depends upon varying abiotic environmentalfactors, such as temperature, moisture availability and nutrients, as well asdifferent biotic factors, such as crop type and the presence of other micro-organisms (Hjeljord and Tronsmo, 1998). Trichoderma spp. were found tocomprise up to 3% and 1.5% of the total quantity of fungal propagulesobtained from a range of forest and pasture soils, respectively (Brewer et al.,1971; Danielson and Davey, 1973a).
Conclusion
Populations of free-living plant-beneficial microorganisms are naturally pre-sent in soil ecosystems, colonizing plant roots and benefiting the plant.Therefore, they make a very significant contribution to soil quality, even ifthis contribution is often difficult to quantify. The only case where the effectsof indigenous free-living plant-beneficial microorganisms can be ‘visualized’corresponds to disease-suppressive soils, but even then these soils are not soeasy to identify and therefore most of them remain unnoticed. Free-livingplant-beneficial microorganisms can be found in a wide range of bacterialand fungal taxa, and their effect on the plant can involve many differentmodes of action. Indigenous free-living plant-beneficial microorganisms canbe monitored in the soil ecosystem, and this has been illustrated in the case ofthe PGPR Azospirillum, and the PGPF Trichoderma and Gliocladium. Althoughculture-independent methods such as FISH are available to detect certainfree-living plant-beneficial microorganisms, much remains to be done todevelop these approaches (e.g. PCR methods) for detection and quantifica-tion of a wider range of free-living plant-beneficial bacteria and fungi.
Normative references for Chapter 9
Results from a nationally organized evaluation of the bioassays in severallaboratories has led to an experimental national standardization of the ger-mination bioassay in France (XP X 31–205–1).
References for Chapter 9
284 Y. Moënne-Loccoz et al.
Abadie, C., Edel, V. and Alabouvette, C.(1998) Soil suppressiveness to fusariumwilt: influence of a cover-plant on densityand diversity of Fusarium populations.Soil Biology and Biochemistry 30, 643–649.
Alabouvette, C., Couteaudier, Y. and Louvet,J. (1982) Comparaison de la réceptivité dedifférents sols et substrats de culture auxfusarioses vasculaires. Agronomie 2, 1–6.
Amann, R.I., Binder, B.J., Olson, R.J.,Chisholm, S.W., Devereux, R. and Stahl,D.A. (1990) Combination of 16S rRNA-targeted oligonucleotide probes with flowcytometry for analyzing mixed microbialpopulations. Applied and EnvironmentalMicrobiology 56, 1919–1925.
Amann, R.I., Ludwig, W. and Schleifer, K.-H.(1995) Phylogenetic identification and in

situ detection of individual microbial cellswithout cultivation. FEMS MicrobiologyReviews 59, 43–169.
Amarger, N. (1980) Aspect microbiologiquede la culture des légumineuses. LeSélectionneur Français 28, 61–66.
Amarger, N. (2001) Rhizobia in the field.Advances in Agronomy 73, 109–168.
Amarger, N., Mariotti, A. and Mariotti, F.(1977) Essai d’estimation du taux d’azotefixé symbiotiquement chez le lupin par letraçage isotopique naturel (15N). Comptes-Rendus de l’Académie des Sciences série D284, 2179–2182.
Askew, D.J. and Laing, M.D. (1993) Anadapted selective medium for the quanti-tative isolation of Trichoderma species.Plant Pathology 42, 686–690.
Aßmus, B., Hutzler, P., Kirchhof, G., Amann,R.I., Lawrence, J.R. and Hartmann, A.(1995) In situ localization of Azospirillumbrasilense in the rhizosphere of wheat withfluorescently labeled, rRNA-targetedoligonucleotide probes and scanning con-focal laser microscopy. Applied andEnvironmental Microbiology 61, 1013–1019.
Bais, H.P., Park, S.-W., Weir, T.L., Callaway,R.M. and Vivanco, J.M. (2004) How plantscommunicate using the undergroundinformation superhighway. Trends in PlantScience 9, 26–32.
Baker, R. (1968) Mechanisms of biologicalcontrol of soilborne pathogens. AnnualReview of Phytopathology 6, 263–294.
Bally, R., Thomas-Bauzon, D., Heulin, T.,Balandreau, J., Richard, C. and de Ley, J.(1983) Determination of the most frequentN2-fixing bacteria in the rice rhizosphere.Canadian Journal of Microbiology 29,881–887.
Bardin, R., Domenach, A.M. and Chalamet,A. (1977) Rapports isotopiques naturelsde l’azote. II. Application à la mesure dela fixation symbiotique de l’azote in situ.Revue d’Ecologie et de Biologie des Sols 14,395–402.
Bashan, Y. and de-Bashan, L.E. (2002)Protection of tomato seedlings againstinfection by Pseudomonas syringae pv.tomato by using the plant growth-pro-moting bacterium Azospirillum brasilense.
Applied and Environmental Microbiology 68,2637–2643.
Bestel-Corre, G. (2002) La protéomique: unoutil d’étude des interactions dans la rhi-zosphère-Identification de protéinesreliées à la mycorhization et à la nodula-tion et évaluation de l’impact de bouesd’épuration sur les symbioses. Doctoralthesis, University of Burgundy, France.
Bouhot, D. (1975a) Recherches sur l’écologiedes champignons parasites dans le sol. V.Une technique sélective d’estimation dupotentiel infectieux des sols, terreaux etsubstrats infestés par Pythium sp. Etudesqualitatives. Annales de Phytopathologie 7,9–18.
Bouhot, D. (1975b) Recherches sur l’écologiedes champignons parasites dans le sol.VII. Quantification de la technique d’esti-mation du potentiel infectieux des sols,terreaux et substrats infestés par Pythiumsp. Annales de Phytopathologie 7, 147–154.
Bouhot, D. (1975c) Technique sélective etquantitative d’estimation du potentielinfectieux des sols, terreaux et substratsinfestés par Pythium sp. Mode d’emploi.Annales de Phytopathologie 7, 155–158.
Bouhot, D. (1979) Estimation of inoculumdensity and inoculum potential: tech-niques and their values for disease pre-diction. In: Schippers, B. and Gams, W.(eds) Soil-borne Plant Pathogens. AcademicPress, London, pp. 21–34.
Bouillant, M.L., Miché, L., Ouedraogo, O.,Alexandre, G., Jacoud, C., Sallé, G. andBally, R. (1997) Inhibition of Striga seedgermination associated with sorghumgrowth promotion by soil bacteria.Comptes-Rendus de l’Académie des Sciences320, 159–162.
Brewer, D., Calder, F.W., MacIntyre, T.M. andTaylor, A. (1971) Ovine ill-thrift in NovaScotia: I. The possible regulation of therumen flora in sheep by the fungal floraof permanent pasture. Journal ofAgriculture Science 76, 465–477.
Brockwell, J., Diatloff, A., Roughley, R.J. andDate, R.A. (1982) Selection of rhizobia forinoculants. In: Vincent, J.M. (ed.) NitrogenFixation in Legumes. Academic Press,Sydney, pp. 173–191.
Plant–Microbe Interactions and Soil Quality 285

Bromfield, E.S.P., Barran, L.R. andWheatcroft, R. (1995) Relative geneticstructure of a population of Rhizobiummeliloti isolated directly from soil andfrom nodules of lucerne (Medicago sativa)and sweet clover (Melilotus alba).Molecular Ecology 4, 183–188.
Burdman, S., Kadouri, D., Jurkevitch, E. andOkon, Y. (2002) Bacterial phytostimulatorsin the rhizosphere: from research to appli-cation. In: Bitton, G. (ed.) Encyclopedia ofEnvironmental Microbiology: SoilMicrobiology (Volume 1). John Wiley &Sons, New York, pp. 343–354.
Camporota, P. (1980) Recherches sur l’écolo-gie des champignons parasites dans lesols. XV.-Choix d’une plante piège et car-actérisation de souches de Rhizoctoniasolani pour la mesure du potentiel infec-tieux des sols et substrats. Annales dePhytopathologie 12, 31–44.
Camporota, P. (1982) Recherches sur l’écolo-gie des champignons parasites dans le sol.XVII: Mesure du potentiel infectieux desols et substrats infestés par Rhizoctoniasolani Kühn, agent de fontes de semis.Agronomie 2, 437–442.
Chabot, R., Antoun, H. and Cescas, M.P.(1996) Growth promotion of maize andlettuce by phosphate-solubilizingRhizobium leguminosarum biovar phaseoli.Plant and Soil 184, 311–321.
Chen, Y.X., He, Y.F., Yang, Y., Yu, Y.L., Zheng,S.J., Tian, G.M., Luo, Y.M. and Wong,M.H. (2003) Effect of cadmium on nodula-tion and N2-fixation of soybean in conta-minated soils. Chemosphere 50, 781–787.
Chotte, J.-L., Schwartzmann, A., Bally, R. andJocteur Monrozier, L. (2002) Changes inbacterial communities and Azospirillumdiversity in soil fractions of a tropical soilunder 3 or 19 years of natural fallow. SoilBiology and Biochemistry 34, 1083–1092.
Clays-Josserand, A., Lemanceau, P.,Philippot, L. and Lensi, R. (1995)Influence of two plant species (flax andtomato) on the distribution of nitrogendissimilative abilities within fluorescentPseudomonas spp. Applied andEnvironmental Microbiology 61, 1745–1749.
Cook, R. and Baker, K.F. (1983) The Nature
and Practice of Biological Control of PlantPathogens. APS, St Paul, Minnesota.
Cordier, C., Pozo, M.J., Barea, J.M.,Gianinazzi, S. and Gianinazzi-Pearson, V.(1998) Cell defense responses associatedwith localized and systemic resistance toPhytophthora parasitica induced in tomatoby an arbuscular mycorrhizal fungus.Molecular Plant Microbe Interactions 11,1017–1028.
Cronin, D., Moënne-Loccoz, Y., Dunne, C.and O’Gara, F. (1997) Inhibition of egghatch of the potato cyst nematodeGlobodera rostochiensis by chitinase-pro-ducing bacteria. European Journal of PlantPathology 103, 433–440.
Curl, E.A. and Truelove, B. (1986) TheRhizosphere. Advanced series in agricul-tural sciences, vol. 15. Springer-Verlag,Berlin.
Danielson, R.M. and Davey, C.B. (1973a) Theabundance of Trichoderma propagules anddistribution of species in forest soils. SoilBiology and Biochemistry 5, 485–494.
Danielson, R.M. and Davey, C.B. (1973b)Carbon and nitrogen nutrition ofTrichoderma. Soil Biology and Biochemistry5, 505–515.
Danso, S.K.A., Hardarson, G. and Zapata, F.(1993) Misconceptions and practical prob-lems in the use of 15N soil enrichmenttechniques for estimating N fixation. Plantand Soil 152, 25–52.
Davet, P. (1979) Technique pour l’analyse depopulations de Trichoderma et deGliocladium virens dans le sol. Annales dePhytopathologie 11, 529–534.
De Boer, W., Klein Gunnewiek, P.J.A. andWoldendorp, J.W. (1998) Suppression ofhyphal growth of soil-borne fungi bydune soils from vigorous and decliningstands of Ammophila arenaria. NewPhytologist 138, 107–116.
De Boer, W., Verheggen, P., KleinGunnewiek, P.J.A., Kowalchuk, G.A. andvan Veen, J.A. (2003) Microbial commu-nity composition affects soil fungistasis.Applied and Environmental Microbiology 69,835–844.
Défago, G., Keel, C. and Moënne-Loccoz, Y.(1997) Fate of released Pseudomonas bacte-
286 Plant–Microbe Interactions and Soil Quality

ria in the soil profile: implications for theuse of genetically-modified microbialinoculants. In: Zelikoff, J.T., Lynch, J.M.and Shepers, J. (eds) EcoToxicology:Responses, Biomarkers and Risk Assessment.SOS Publications, Fair Haven, NewJersey, pp. 403–418.
Dobbelaere, S., Croonenborghs, A., Thys, A.,Ptacek, D., Vanderleyden, J., Dutto, P.,Labandera-Gonzalez, C., Caballero-Mellado, J., Aguirre, J.F., Kapulnik, Y.,Brener, S., Burdman, S., Kadouri, D.,Sarig, S. and Okon, Y. (2001) Responses ofagronomically important crops to inocula-tion with Azospirillum. Australian Journalof Plant Physiology 28, 871–879.
Dobbs, C.G. and Gash, M.J. (1965) Microbialand residual mycostasis in soils. Nature(London) 207, 1354–1356.
Döbereiner, J. (1995) Isolation and identifica-tion of aerobic nitrogen-fixing bacteriafrom soil and plants. In: Alef, K. andNannipieri, P. (eds) Methods in Applied SoilMicrobiology and Biochemistry. AcademicPress, London, pp. 134–141.
Dodd, J.C., Gianinazzi-Pearson, V.,Rosendahl, S. and Walker, C. (1994)European Bank of Glomales – an essentialtool for efficient international and inter-disciplinary collaboration. In: Gianinazzi,S. and Schüepp, H. (eds) Impact ofArbuscular Mycorrhizas on SustainableAgriculture and Natural Exosystems.Birkhäuser Verlag, Basel, Switzerland,pp. 41–45.
Dommergues, Y.R., Duhoux, E. and Diem,H.G. (1999) In: Ganry, F. (ed.) Les ArbresFixateurs d’Azote. CaractéristiquesFondamentales et Rôle dans l’Aménagementdes Ecosystèmes Méditerranéens et Tropicaux.CIRAD/Editions Espaces 34/FAO/IRD,Montpellier, France, pp. 163–165.
Duffy, B., Schouten, A. and Raaijmakers, J.M.(2003) Pathogen self-defense: mechanismsto counteract microbial antagonism.Annual Review of Phytopathology 41,501–538.
Dumas-Gaudot, E., Gollotte, A., Cordier, C.,Gianinazzi, S. and Gianinazzi-Pearson V.(2000) Modulation of host defense sys-tems. In: Kapulnik, Y. and Douds, D.D. Jr
(eds) Arbuscular Mycorrhizas: Physiologyand Function. Kluwer Academic,Dordrecht, The Netherlands, pp. 173–200.
Edel, V., Steinberg, C., Gautheron, N. andAlabouvette, C. (1997) Populations ofnonpathogenic Fusarium oxysporum asso-ciated with roots of four plant speciescompared to soilborne populations.Phytopathology 87, 693–697.
Elad, Y. and Chet, I. (1983) Improved selec-tive media for isolation of Trichodermaspp. or Fusarium spp. Phytoparasitica 11,55–58.
Elad, Y., Chet, I. and Henis, Y. (1981) A selec-tive medium for improving quantitativeisolation of Trichoderma spp. from soil.Phytoparasitica 9, 59–68.
Faull, J.L. (1988) Competitive antagonism ofsoil-borne plant pathogens. In: Burge,M.N. (ed.) Fungi in Biological ControlSystems. Manchester University Press,Manchester, UK, pp. 125–140.
Fettell, N.A., O’Connor, G.E., Carpenter, D.J.,Evans, J., Bamforth, I., Oti-Boateng, C.,Hebb, D.M. and Brockwell, J. (1997)Nodulation studies on legumes exotic toAustralia: the influence of soil popula-tions and inocula of Rhizobium legumi-nosarum bv. viciae on nodulation andnitrogen fixation by field peas. AppliedSoil Ecology 5, 197–210.
Fisher, R.A. and Yates, F. (1963) StatisticalTables for Biological, Agricultural andMedical Research, 6th edn. Oliver andBoyd, Edinburgh, UK.
Fravel, D.R. (1988) Role of antibiosis in thebiocontrol of plant diseases. AnnualReview of Phytopathology 26, 75–91.
Frey, P., Frey-Klett, P., Garbaye, J., Berge, O.and Heulin, T. (1997) Metabolic and geno-typic fingerprinting of fluorescentpseudomonads associated with theDouglas Fir–Laccaria bicolor mycorrhizos-phere. Applied and EnvironmentalMicrobiology 63, 1852–1860.
Gams, W. and Bissett, J. (1998) Morphologyand identification of Trichoderma. In:Kubicek, C.P. and Harman, G.E. (eds)Trichoderma and Gliocladium: BasicBiology, Taxonomy and Genetics (Volume 1).Taylor & Francis, London, pp. 3–34.
Plant–Microbe Interactions and Soil Quality 287

Garland, J.L., Cook, K.L., Loader, C.A. andHungate, B.A. (1997) The influence ofmicrobial community structure and func-tion on community-level physiologicalprofiles. In: Insam, H. and Rangger, A.(eds) Microbial Communities: Functionalversus Structural Approaches. Springer,New York, pp. 171–183.
Garrett, S.D. (1970) Pathogenic Root-InfectingFungi. Cambridge University Press,Cambridge, UK.
Gianinazzi, S. (1991) Vesicular-arbuscularendomycorrhizas: cellular, biochemicaland genetic aspects. Agriculture,Ecosystems and Environment 35, 105–119.
Gianinazzi, S. and Gianinazzi-Pearson, V.(1988) Mycorrhizae: a plant’s healthinsurance. Chimica Oggi, pp. 56–58.
Gianinazzi, S., Gianinazzi-Pearson, V. andTrouvelot, A. (1982) Mycorrhizae, an inte-gral part of plants: biology and perspec-tives for their use. Les colloques de l’INRA,no. 13.
Gianinazzi, S., Gianinazzi-Pearson, V. andTrouvelot, A. (1989) Potentialities andprocedures for the use of endomycor-rhizas with special emphasis on highvalue crops. In: Whipps, J.M. andLumsden, R.D. (eds) Biotechnology of Fungifor Improving Plant Growth, vol. 3.Cambridge University Press, Cambridge,UK, pp. 41–54.
Gianinazzi, S., Schüepp, H., Barea, J.M. andHaselwandter, K. (2002) MycorrhizalTechnology in Agriculture: From Genes toBioproducts. Birkhäuser Verlag, Basel,Switzerland.
Gianinazzi-Pearson, V. and Smith, S.E. (1993)Physiology of mycorrhizal mycelia. In:Ingram, D.S., Williams, P.H. andTommerup, I.C. (eds) Advances in PlantPathology. Academic Press, London,pp. 55–82.
Gibson, A.H. (1963) Physical environmentand symbiotic nitrogen fixation. I. Theeffect of root temperature on recentlynodulated Trifolium subterraneum L.plants. Australian Journal of BiologicalSciences 16, 28–42.
Gildon, A. and Tinker, P.B. (1983) Interactionsof vesicular-arbuscular mycorrhizal infec-
tion and heavy metal in plants: I: Theeffect of heavy metals on the develop-ment of vesicular arbuscular mycorrhizas.New Phytolologist 95, 247–261.
Harley, J.L. and Harley, E.L. (1987) A checklist of mycorrhiza in the British Flora. NewPhytologist 105, 1–102.
Harman, G.E. (2000) Myths and dogmas ofbiocontrol – changes in perceptionsderived from research on Trichodermaharzianum T-22. Plant Disease 84, 377–393.
Harman, G.E. and Bjorkman, T. (1998)Potential and existing uses of Trichodermaand Gliocladium for plant disease controland plant growth enhancement. In:Harman, G.E. and Kubicek, C.P. (eds)Trichoderma and Gliocladium: Enzymes,Biological Control and CommercialApplications (Volume 2). Taylor & Francis,London, pp. 229–265.
Hartmann, A., Giraud, J.J. and Catroux, G.(1998a) Genotypic diversity ofSinorhizobium (formerly Rhizobium)meliloti strains isolated directly from a soiland from nodules of lucerne (Medicagosativa) grown in the same soil. FEMSMicrobiology Ecology 25, 107–116.
Hartmann, A., Lawrence, J.R., Aßmus, B. andSchloter, M. (1998b) Detection of microbesby laser confocal microscopy. In:Akkermans, A.D.L., van Elsas, J.D. and deBruijn, F.J. (eds) Molecular MicrobialEcology Manual. Kluwer AcademicPublishers, Dordrecht, The Netherlands,pp. 1–34.
Hartmann, A., Stoffels, M., Eckert, B.,Kirchhof, G. and Schloter, M. (2000)Analysis of the presence and diversity ofdiazotrophic endophytes. In: Triplett,E.W. (ed.) Prokaryotic Nitrogen Fixation: AModel System for Analysis of a BiologicalProcess. Horizon Scientific Press,Wymondham, UK, pp. 727–736.
Hartmann, A., Pukall, R., Rothballer, M.,Gantner, S., Metz, S., Schloter, M. andMogge, B. (2004) Microbial communityanalysis in the rhizosphere by in situ andex situ application of molecular probing,biomarker and cultivation techniques. In:Varma, A., Abbott, L., Werner, D. andHampp, R. (eds) Plant Surface
288 Plant–Microbe Interactions and Soil Quality

Microbiology. Springer-Verlag, Berlin,pp. 449–469.
Hellriegel, H. and Wilfarth, H. (1888)Untersuchungen über die Stickstoff-nahrungder Gramineen und Leguminosen. Beilageheftzu der Zeitschrift des Vereins für dieRübenzucker-Industrie des DeutschenReiches, Buchdruckerei der “Post”. Kayssler& Co., Berlin.
Herron, P.R. and Wellington, E.M.H. (1990)New method for the extraction of strepto-mycete spores from soil and applicationto the study of lysogeny in sterileamended and nonsterile soil. Applied andEnvironmental Microbiology 56, 1406–1412.
Hill, C., Com-Nougué, C., Kramar, A.,Moreau, T., O’Quigley, J., Senoussi, R. andChastang, C. (1990) Analyse Statistique desDonnées de Survie. Edited by M.-S.INSERM. Flammarion, Paris.
Hiltner, L. (1904) Über neuere erfahrungenund problem auf dem gebeit der boden-bakteriologie und unter besondererberucksichtigung der grundungung undbrache. Arbeit und Deutsche LandwirschaftGesellschaft 98, 59–78.
Hirsch, A.M., Bauer, W.D., Bird, D.M.,Cullimore, J., Tyler, B. and Yodder, J.I.(2003) Molecular signals and receptors:controlling rhizosphere interactionsbetween plants and other organisms.Ecology 84, 858–868.
Hjeljord, L. and Tronsmo, A. (1998)Trichoderma and Gliocladium in biologicalcontrol: an overview. In: Harman, G.E.and Kubicek, C.P. (eds) Trichoderma andGliocladium: Enzymes, Biological Controland Commercial Applications (Volume 2).Taylor & Francis, London, pp. 131–151.
Ho, W.C. and Ko, W.H. (1986) Microbiostasisby nutrient deficiency shown in naturaland synthetic soils. Journal of GeneralMicrobiology 132, 2807–2815.
Högberg, P. (1990) 15N natural abundance asa possible marker of the ectomycorrhizalhabit of trees in mixed African wood-lands. New Phytologist 115, 483–486.
Höper, H., Steinberg, C. and Alabouvette, C.(1995) Involvement of clay type and pHin the mechanisms of soil suppressivenessto fusarium wilt of flax. Soil Biology andBiochemistry 27, 955–967.
Hornby, D. (1983) Suppressive soils. AnnualReview of Phytopathology 21, 65–85.
Howell, C.R. (1998) The role of antibiosis inbiocontrol. In: Harman, G.E. and Kubicek,C.P. (eds) Trichoderma and Gliocladium:Enzymes, Biological Control and CommercialApplications (Volume 2). Taylor & Francis,London, pp. 173–183.
Hsu, S.C. and Lockwood, J.L. (1971)Responses of fungal hyphae to soilfungistasis. Phytopathology 61, 1355–1362.
Inbar, J. and Chet, I. (1992) Biomimics of fun-gal cell–cell recognition by use of lectin-coated nylon fibers. Journal of Bacteriology174, 1055–1059.
Inbar, J. and Chet, I. (1995) The role of recog-nition in the induction of specific chiti-nases during mycoparasitism byTrichoderma harzianum. Microbiology 141,2823–2829.
Jacoud, C., Faure, D., Wadoux, P. and Bally,R. (1998) Development of a strain-specificprobe to follow inoculated Azospirillumlipoferum CRT1 under field conditions andenhancement of maize root developmentby inoculation. FEMS Microbiology Ecology27, 43–51.
Jacoud, C., Job, D., Wadoux, P. and Bally, R.(1999) Initiation of root growth stimula-tion by Azospirillum lipoferum CRT1 dur-ing maize seed germination. CanadianJournal of Microbiology 45, 339–342.
Jacquot, E., van Tuinen, D., Gianinazzi, S.and Gianinazzi-Pearson, V. (2000)Monitoring species of arbuscular mycor-rhizal fungi in planta and in soil by nestedPCR: application to the study of theimpact of sewage sludge. Plant and Soil226, 179–188.
Jacquot-Plumey, E., van Tuinen, D.,Chatagnier, O., Gianinazzi, S. andGianinazzi-Pearson, V. (2002) Molecularmonitoring of arbuscular mycorrhizalfungi in sewage sludge treated field plots.Environmental Microbiology 3, 525–531.
Jacquot-Plumey, E., Caussanel, J.P.,Gianinazzi, S., van Tuinen, D. andGianinazzi-Pearson, V. (2003) Heavy met-als in sewage sludges contribute to theiradverse effects on the arbuscular mycor-rhizal fungus Glomus mosseae. FoliaGeobotanica 38, 167–176.
Plant–Microbe Interactions and Soil Quality 289

Jeffries, P. and Young, T.W.K. (1994)Interfungal Parasitic Relationships. CABInternational, Wallingford, UK.
Jensen, H.L. (1942) Nitrogen fixation in legu-minous plants. I. General characters ofroot nodule bacteria isolated from speciesof Medicago and Trifolium in Australia.Proceedings of the Linnean Society of NewSouth Wales 66, 98–108.
Johnson, L.F., Bernard, E.C. and Peiyuan, Q.(1987) Isolation of Trichoderma spp. at lowtemperatures from Tennessee and Alaska(USA) soils. Plant Disease 71, 137–140.
Junk, G. and Svec, H.J. (1958) The absoluteabundance of the nitrogen isotopes in theatmosphere and compressed gas fromvarious sources. Geochimica etCosmochimica Acta 14, 234–243.
Kabir, M.M., Chotte, J.L., Rahman, M., Bally,R. and Jocteur Monrozier, L. (1994)Distribution of soil fractions and locationof soil bacteria in a vertisol under cultiva-tion and perennial grass. Plant and Soil163, 243–255.
Kabir, M.M., Faure, D., Haurat, J., Jacoud, C.,Normand, P., Wadoux, P. and Bally, R.(1995) Oligonucleotide probes based on16S rRNA sequences for the identificationof four Azospirillum species. CanadianJournal of Microbiology 41, 1081–1087.
Kirchhof, G., Schloter, M., Aßmus, B. andHartmann, A. (1997) Molecular microbialecology approaches applied to dia-zotrophs associated with non-legumes.Soil Biology and Biochemistry 29, 853–862.
Klein, D. and Eveleigh, D.E. (1998) Ecologyof Trichoderma. In: Kubicek, C.P. andHarman, G.E. (eds) Trichoderma andGliocladium: Basic Biology, Taxonomy andGenetics (Volume 1). Taylor & Francis,London, pp. 57–74.
Knudsen, I.M.B., Debisz, K., Hockenhull, J.,Jensen, D.F. and Elmholt, S. (1999)Suppressiveness of organically and con-ventionally managed soils towards brownfoot rot of barley. Applied Soil Ecology 12,61–72.
Kubicek, C.P., Mach, R.L., Peterbauer, C.K.and Lorito, M. (2001) Trichoderma: fromgenes to biocontrol. Journal of PlantPathology 83, 11–23.
Kubicek-Pranz, E.M. (1998) Nutrition, cellu-lar structure and basic metabolic path-ways in Trichoderma and Gliocladium. In:Kubicek, C.P. and Harman, G.E. (eds)Trichoderma and Gliocladium: BasicBiology, Taxonomy and Genetics (Volume 1).Taylor & Francis, London, pp. 95–119.
Laguerre, G., Bardin, M. and Amarger, N.(1993) Isolation from soil of symbiotic andnonsymbiotic Rhizobium leguminosarum byDNA hybridization. Canadian Journal ofMicrobiology 39, 1142–1149.
Larkin, R.P., Hopkins, D.L. and Martin, F.N.(1993) Ecology of Fusarium oxysporum f.sp. niveum in soils suppressive and con-ducive to Fusarium wilt of watermelon.Phytopathology 83, 1105–1116.
Lemanceau, P., Samson, R. and Alabouvette,C. (1988) Recherches sur la résistance dessols aux maladies. XV. Comparaison despopulations de Pseudomonas fluorescentsdans un sol résistant et un sol sensibleaux fusarioses vasculaires. Agronomie 8,243–249.
Lemanceau, P., Corberand, T., Gardan, L.,Latour, X., Laguerre, G., Boeufgras, J.-M.and Alabouvette, C. (1995) Effect of twoplant species, flax (Linum usitatissinum L.)and tomato (Lycopersicon esculentum Mill.),on the diversity of soilborne populationsof fluorescent pseudomonads. Applied andEnvironmental Microbiology 61, 1004–1012.
Leyval, C. and Joner, E. (2001) Bioavailabilityof heavy metals in the mycorrhizosphere.In: Gobran, G.R., Wenzel, W.W. andLombi, E. (eds) Trace Elements in theRhizosphere. CRC Press, Boca Raton,Florida, pp. 165–185.
Leyval, C., Singh, B.R. and Joner, E. (1995)Occurrence and infectivity of arbuscular-mycorrhizal fungi in some Norwegiansoils influenced by heavy metals and soilproperties. Water Air Soil Pollution 84,203–216.
Leyval, C., Turnau, H. and Haselwandter, K.(1997) Effect of heavy metal pollution onmycorrhizal colonization and function:physiological, ecological and appliedaspects. Mycorrhiza 7, 139–153.
Leyval, C., Joner, E.J., del Val, C. andHaselwandter, K. (2002) Potential of
290 Plant–Microbe Interactions and Soil Quality

arbuscular mycorrhizal fungi for bioreme-diation. In: Gianinazzi, S., Barea, J.M.,Schuepp, H. and Haselwandter, K. (eds)Mycorrhizal Technology in Agriculture: FromGenes to Bioproducts. Birkhäuser Verlag,Basel, Switzerland, pp. 175–186.
Liebman, J.A. and Epstein, L. (1992) Activityof fungistatic compounds from soil.Phytopathology 82, 147–153.
Lieckfeldt, E., Kuhls, K. andMuthumeenakshi, S. (1998) Moleculartaxonomy of Trichoderma and Gliocladiumand their teleomorphs. In: Kubicek C.P.and Harman, G.E. (eds) Trichoderma andGliocladium: Basic Biology, Taxonomy andGenetics (Volume 1). Taylor & Francis,London, pp. 35–56.
Linderman, R.G. (2000) Effects of mycor-rhizas on plant tolerance to diseases –mycorrhiza–disease interactions. In:Kapulnik, Y. and Douds, D.D. Jr (eds)Arbuscular Mycorrhizas: Physiology andFunction. Kluwer Academic, Dordrecht,The Netherlands, pp. 345–365.
Linderman, R.G., Moore, L.W., Baker, K.F.and Cooksey, D.A. (1983) Strategies fordetecting and characterizing systems.Plant Disease 67, 1058–1064.
Lindsey, D.L. and Baker, R. (1967) Effect ofcertain fungi on dwarf tomatoes grownunder gnotobiotic conditions.Phytopathology 57, 1262–1263.
Lo, C.T., Nelson, E.B. and Harman, G.E.(1996) Biological control of turfgrass dis-eases with a rhizosphere competent strainof Trichoderma harzianum. Plant Disease 80,736–741.
Lockwood, J.L. (1977) Fungistasis in soils.Biological Reviews 52, 1–43.
Lockwood, J.L. (1988) Evolution of conceptsassociated with soilborne plant pathogens.Annual Review of Phytopathology 26, 93–121.
Lorito, M. (1998) Chitinolytic enzymes andtheir genes. In: Harman, G.E. andKubicek, C.P. (eds) Trichoderma andGliocladium: Enzymes, Biological Controland Commercial Applications (Volume 2).Taylor & Francis, London, pp. 87–115.
Lorito, M., Woo, S.L., D’Ambrosio, M.,Harman, G.E., Hayes, C.K., Kubicek, C.P.
and Scala, F. (1996) Synergistic interactionbetween cell wall degrading enzymes andmembrane affecting compounds.Molecular Plant–Microbe Interactions 9,206–213.
Louvet, J. (1973) Les perspectives de luttebiologique contre les champignons para-sites des organes souterrains des plantes.Perspectives de lutte biologique contre leschampignons parasites des plantes cultivées etdes tissus ligneux. Symposium International,Lausanne, pp. 48–56.
Ludwig, W., Amann, R., Martinez-Romero,E., Schönhuber, W., Bauer, S., Neef, A. andSchleifer, K.-H. (1998) rRNA based identi-fication and detection systems for rhizo-bia and other bacteria. Plant and Soil 204,1–19.
Lynch, J.M. and Whipps, J.M. (1990)Substrate flow in the rhizosphere. Plantand Soil 129, 1–10.
Ma, W., Sebestianova, S.B., Sebestian, J.,Burd, G.I., Guinel, F.C. and Glick, B.R.(2003) Prevalence of 1-aminocyclo-propane-1-carboxylate deaminase inRhizobium spp. Antonie van Leeuwenhoek83, 285–291.
Macdonald, R.M. (1986) Sampling soilmicrofloras: dispersion of soil by ionexchange and extraction of specificmicroorganisms from suspension by elu-triation. Soil Biology and Biochemistry 18,399–406.
Mariotti, A. (1983) Atmospheric nitrogen is areliable standard for natural 15N abun-dance measurements. Nature 303,685–687.
Mascher, F., Schnider-Keel, U., Haas, D.,Défago, G. and Moënne-Loccoz, Y. (2003)Persistence and cell culturability of bio-control Pseudomonas fluorescens CHA0under plough pan conditions in soil andinfluence of the anaerobic regulator geneanr. Environmental Microbiology 5, 103–115.
Mavingui, P., Laguerre, G., Berge, O. andHeulin, T. (1992) Genetic and phenotypicdiversity of Bacillus polymyxa in soil andin the wheat rhizosphere. Applied andEnvironmental Microbiology 58, 1894–1903.
Mazzola, M., Cook, R.J., Thomashow, L.S.,Weller, D.M. and Pierson, L.S.D. (1992)
Plant–Microbe Interactions and Soil Quality 291

Contribution of phenazine antibioticbiosynthesis to the ecological competenceof fluorescent pseudomonads in soil habi-tats. Applied and Environmental Micro-biology 58, 2616–2624.
McGrath, S.P., Chaudri, A.M. and Giller, K.E.(1995) Long-term effects of metals insewage sludge on soils, microorganismsand plants. Journal of IndustrialMicrobiology 14, 94–104.
Miché, L., Bouillant, M.-L., Rohr, R. andBally, R. (2000) Physiological and cytolog-ical studies of the inhibitory effect of soilbacteria of the genus Azospirillum onstriga seeds germination. European Journalof Plant Pathology 106, 347–351.
Migheli, Q., Steinberg, C., Davière, J.M.,Olivain, C., Gerlinger, C., Gautheron, N.,Alabouvette, C. and Daboussi, M.J. (2000)Recovery of mutants impaired in patho-genicity after transposition of impala inFusarium oxysporum f. sp. melonis.Phytopathology 90, 1279–1284.
Miller, M., Palojärvi, A., Rangger, A., Reeslev,M. and Kjoller, A. (1998) The use of fluo-rogenic substrates to measure fungalpresence and activity in soil. Applied andEnvironmental Microbiology 64, 613–617.
Moënne-Loccoz, Y. and Défago, G. (2004)Life as a biocontrol pseudomonad. In:Ramos, J.L. (ed.) Pseudomonas: Genomics,Life Style and Molecular Architecture(Volume 1). Kluwer Academic/PlenumPublishers, New York, pp. 457–476.
Moënne-Loccoz, Y., Powell, J., Higgins, P.,McCarthy, J. and O’Gara, F. (1998) Aninvestigation of the impact of biocontrolPseudomonas fluorescens F113 on thegrowth of sugarbeet and the performanceof subsequent clover–Rhizobium symbio-sis. Applied Soil Ecology 7, 225–237.
Mogge, B., Lebhuhn, M., Schloter, M.,Stoffels, M., Pukall, R., Stackebrandt, E.,Wieland, G., Backhaus, H. and Hartmann,A. (2000) Erfassung des mikrobiellenPopulationsgradienten vom Boden zurRhizoplane von Luzerne (Medicago sativa).In: Hartmann, A. (ed.) BiologischeSicherheit: Biomonitor und MolekulareMikrobenökologie. Projektträger BEO,Jülich, Germany, pp. 217–224.
Mondal, S.N. and Hyakumachi, M. (1998)Carbon loss and germinability, viability,and virulence of chlamydospores ofFusarium solani f. sp. phaseoli after expo-sure to soil at different pH levels, temper-atures, and matric potentials.Phytopathology 88, 148–155.
Morrissey, J.P., Walsh, U.F., O’Donnell, A.,Moënne-Loccoz, Y. and O’Gara, F. (2002)Exploitation of genetically modified inoc-ulants for industrial ecology applications.Antonie van Leeuwenhoek 81, 599–606.
Moulin, L., Munive, A., Dreyfus, B. andBoivin-Masson, C. (2001) Nodulation oflegumes by members of the �-subclass ofProteobacteria. Nature 411, 948–950.
Muyzer, G. and Smalla, K. (1998) Applicationof denaturing gradient gel electrophoresis(DGGE) and temperature gradient gelelectrophoresis (TGGE) in microbial ecol-ogy. Antonie van Leuwenhook 73, 127–141.
Nguyen, C. (2003) Rhizodeposition oforganic C by plants: mechanisms andcontrols. Agronomie 23, 375–396.
Okon, Y. (ed.) (1994) Azospirillum/PlantAssociations. CRC Press, Boca Raton,Florida.
Okon, Y. and Labandera-Gonzalez, C.A.(1994) Agronomic applications ofAzospirillum: an evaluation of 20 yearsworld-wide field inoculation. Soil Biologyand Biochemistry 26, 1591–1601.
Papavizas, G.C. and Lumsden, R.D. (1982)Improved medium for isolation ofTrichoderma spp. from soil. Plant Disease66, 1019–1020.
Park, Y.-H., Stack, J.P. and Kenerly, C.M.(1992) Selective isolation and enumera-tion of Gliocladium virens and G. roseumfrom soil. Plant Disease 76, 230–235.
Paulitz, T.C. (1990) Biochemical and ecologi-cal aspects of competition in biologicalcontrol. In: Baker, R. and Dunn, P.E. (eds)New Directions in Biological Control:Alternatives for Suppressing AgriculturalPests and Diseases. Alan R. Liss, New York,pp. 713–724.
Peng, H.X., Sivasithamparam, K. and Turner,D.W. (1999) Chlamydospore germinationand Fusarium wilt of banana plantlets insuppressive and conducive soils are
292 Plant–Microbe Interactions and Soil Quality

affected by physical and chemical factors.Soil Biology and Biochemistry 31, 1363–1374.
Persson, L., Larsson Wikström, M. andGerhardson, B. (1999) Assessment of soilsuppressiveness to Aphanomyces root rotof pea. Plant Disease 83, 1108–1112.
Peters, N.K. (1986) A plant flavone, luteolin,induces expression of Rhizobium melilotigenes. Science 233, 977–980.
Raaijmakers, J.M. and Weller, D.M. (1998)Natural protection by 2,4-d iace ty lphlorogluc inol -producingPseudomonas spp. in take-all decline soils.Molecular Plant–Microbe Interactions 11,144–152.
Raaijmakers, J.M., Weller, D.M. andThomashow, L.S. (1997) Frequency ofantibiotic producing Pseudomonas spp. innatural environments. Applied andEnvironmental Microbiology 63, 881–887.
Revellin, C., Pinochet, X., Beauclair, P. andCatroux, G. (1996) Influence of soil prop-erties and soya bean cropping history onthe Bradyrhizobium japonicum populationin some French soils. European Journal ofSoil Science 47, 505–510.
Reverchon, S. (2001) Un diagnostic adaptéaux champignons du sol. Phytoma – Ladéfense des Végétaux 542, 20–23.
Rezzonico, F., Moënne-Loccoz, Y. andDéfago, G. (2003) Effect of stress on theability of a phlA-based quantitative com-petitive PCR assay to monitor biocontrolstrain Pseudomonas fluorescens CHA0.Applied and Environmental Microbiology 69,686–690.
Rivera-Becerril, F., Calantzis, C., Turnau, K.,Caussanel, J.P., Belimov, A.A.,Gianinazzi, S., Strasser, R.J. andGianinazzi-Pearson, V. (2002) Cadmiumaccumulation and buffering of cadmium-induced stress by arbuscular mycorrhizain three Pisum sativum L. genotypes.Journal of Experimental Botany 53, 1–9.
Rodriguez Caceres, E.A. (1982) Improvedmedium for isolation of Azospirillum spp.Applied and Environmental Microbiology 44,990–991.
Romine, M. and Baker, R. (1973) Soil fungis-tasis: evidence for an inhibitory factor.Phytopathology 63, 756–759.
Rovira, A.D. (1965) Interactions betweenplant roots and soil microorganisms.Annual Review of Microbiology 19, 241–266.
Sambrook, J., Fritsch, E.F. and Maniatis, T.(1989) Molecular Cloning: A LaboratoryManual. Cold Spring Harbor LaboratoryPress, Cold Spring Harbor, New York.
Schippers, B. (1992) Prospects for manage-ment of natural suppressiveness to con-trol soilborne pathogens. In: Tjamos, E.C.,Papavizas, G.C. and Cook, R.J. (eds)Biological Control of Plant Diseases. PlenumPress, New York, pp. 21–34.
Schneider, R.W. (1982) Suppressive Soils andPlant Disease. American PhytopathologicalSociety, St Paul, Minnesota, p. 96.
Schüepp, H. and Green, R.J. Jr (1968) Indirectassay methods to investigate soil fungis-tasis with special consideration of soil pH.Phytopathologische Zeitschrift 61, 1–28.
Sessitsch, A., Howieson, J.G., Perret, X.,Antoun, H. and Martínez-Romero, E.(2002) Advances in Rhizobium research.Critical Reviews in Plant Sciences 21,323–378.
Shearer, G. and Kohl, D.H. (1986) N2-fixationin field settings: estimations based on nat-ural 15N abundance. Australian Journal ofPlant Physiology 13, 669–756.
Smith, S.E. and Read, D.J. (1997) MycorrhizalSymbiosis. Academic Press, London, 605pp.
Smith, V.L., Wilcox, W.F. and Harman, G.E.(1990) Potential for biological control ofPhytophthora root and crown rots of appleby Trichoderma and Gliocladium spp.Phytopathology 80, 880–885.
Somasegaran, P.H. and Hoben, J. (1994)Handbook for Rhizobia: Methods inLegume–Rhizobium Technology. Springer,New York.
Stock, J.B., Ninfa, A.J. and Stock, A.M. (1989)Protein phosphorylation and regulationof adaptive responses in bacteria.Microbiological Reviews 53, 450–490.
Stoffels, M., Castellanos, T. and Hartmann, A.(2001) Design and application of new 16SrRNA-targeted oligonucleotide probes forthe Azospirillum–Skermanella–Rhodocistacluster. Systematic and Applied Microbiology24, 83–97.
Plant–Microbe Interactions and Soil Quality 293

Stutz, E.W. and Défago, G. (1985) Effect ofparent materials derived from differentgeological strata on suppressiveness ofsoils to black root rot of tobacco. In:Parker, C.A., Rovira, A.D., More, K.J. andWong, P.T.W. (eds) Ecology andManagement of Soilborne Plant Pathogens.APS, St Paul, Minnesota, pp. 215–217.
Sy, A., Giraud, E., Jourand, P., Garcia, N.,Willems, A., de Lajudie, P., Prin, Y., Neyra,M., Gillis, M., Boivin-Masson, C. andDreyfus, B. (2001) MethylotrophicMethylobacterium bacteria nodulate and fixnitrogen in symbiosis with legumes.Journal of Bacteriology 183, 214–220.
Tarrand, J.J., Krieg, N.R. and Dobereiner, J.(1978) A taxonomic study of the Spirillumlipoferum group, with descriptions of anew genus, Azospirillum gen. nov. andtwo species, Azospirillum lipoferum(Beijerinck) comb. nov. and Azospirillumbrasilense sp. nov. Canadian Journal ofMicrobiology 24, 967–980.
Thornton, C.R., Pitt, D., Wakley, G.E. andTalbot, N.J. (2002) Production of a mono-clonal antibody specific to the genusTrichoderma and closely related fungi, andits use to detect Trichoderma spp. in natu-rally infested composts. Microbiology 148,1263–1279.
Tilman, D. (1998) The greening of the greenrevolution. Nature 396, 211–212.
Toyota, K., Ritz, K. and Young, I.M. (1996)Microbiological factors affecting thecolonisation of soil aggregates byFusarium oxysporum f. sp. raphani. SoilBiology and Biochemistry 28, 1513–1521.
Trouvelot, A., Kough, J.L. and Gianinazzi-Pearson, V. (1985) Mesure du taux demycorhization VA d’un système radicu-laire. Recherche de méthodes d’estima-tion ayant une signification fonctionnelle.In: Physiological and Genetical Aspects ofMycorrhizae. Proceedings of the 1stEuropean Symposium on Mycorrhizae,INRA, Paris, pp. 217–221.
Tu, X.M. (1995) Nonparametric estimation ofsurvival distribution with censored initi-ating time, and censored and truncatedterminating time: application to transfu-sion data for acquired immune deficiency
syndrome. Applied Statistics 44, 3–16.Unkovich, M. and Pate, J.S. (2001) Assessing
N2 fixation in annual legumes using 15Nnatural abundance. In: Unkovich, M.,Pate, J., NcNeill, A. and Gibbs, D.J. (eds)Stable Isotope Techniques in the Study ofBiological Processes and Functioning ofEcosystems. Kluwer Academic, Dordrecht,The Netherlands, pp. 103–118.
van der Heijden, M.G.A., Klironomos, J.N.,Ursic, M., Moutoglis, P., Streitwolfengel, R.,Boller, T., Wiemken, A. and Sanders, I.R.(1998) Mycorrhizal fungal diversity deter-mines plant biodiversity, ecosystem vari-ability and productivity. Nature 396, 69–72.
van Tuinen, D., Jacquot, E., Zhao, B.,Gollotte, A. and Gianinazzi-Pearson, V.(1998) Characterization of root coloniza-tion profiles by a microcosm communityof arbuscular mycorrhizal fungi using 25SrDNA-targeted nested PCR. MolecularEcology 7, 879–887.
Velázquez, E., Mateos, P.F., Velasco, N.,Santos, F., Burgos, P.A., Villadas, P.J., Toro,N. and Martínez-Molina, E. (1999)Symbiotic characteristics and selection ofautochthonous strains of Sinorhizobiummeliloti populations in different soils. SoilBiology and Biochemistry 31, 1039–1047.
Villadas, P.J., Velázquez, E., Martínez-Molina,E. and Toro, N. (1995) Identification ofnodule-dominant Rhizobium melilotistrains carrying pRmeGR4b-type plasmidwithin indigenous soil populations byPCR using primers derived from specificDNA sequences. FEMS MicrobiologyEcology 17, 161–168.
Vincent, J.M. (1970) A Manual for the PracticalStudy of Root Nodule Bacteria. I.B.P.Handbook No. 15. Blackwell ScientificPublications, Oxford, UK.
Von Alten, H., Blal, B., Dodd, J.C., Feldmann,F. and Vosatka, M. (2002) Quality controlof arbuscular mycorrhizal fungi inoculumin Europe. In: Gianinazzi, S., Barea, J.M.,Schuepp, H. and Haselwandter, K. (eds)Mycorrhizal Technology in Agriculture: FromGenes to Bioproducts. Birkhäuser Verlag,Basel, Switzerland, pp. 281–296.
Wacker, T.L. and Lockwood, J.L. (1991) Acomparison of two assay methods for
294 Plant–Microbe Interactions and Soil Quality

assessing fungistasis in soils. Soil Biologyand Biochemistry 23, 411–414.
Wagner, M., Amann, R., Lemmer, H. andSchleifer, K.-H. (1993) Probing activatedsludge with oligonucleotides specific forproteobacteria: inadequacy of culture-dependent methods for describing micro-bial community structure. Applied andEnvironmental Microbiology 59, 1520–1525.
Walsh, U.F., Morrissey, J.P. and O’Gara, F.(2001) Pseudomonas for biocontrol of phy-topathogens: from functional genomics tocommercial exploitation. Current Opinionin Biotechnology 12, 289–295.
Walsh, U.F., Moënne-Loccoz, Y., Tichy, H.-V.,Gardner, A., Corkery, D.M., Lorkhe, S.and O’Gara, F. (2003) Residual impact ofthe biocontrol inoculant Pseudomonas fluo-rescens F113 on the resident population ofrhizobia nodulating a red clover rotationcrop. Microbial Ecology 45, 145–155.
Wan, M.T., Rahe, J.E. and Watts, R.G. (1998)A new technique for determining the sub-lethal toxicity of pesticides to the vesicu-lar-arbuscular mycorrhizal fungus Glomusintraradices. Environmental ToxicologicalChemistry 17, 1421–1428.
Wardle, D.A. (1992) A comparative assess-ment of factors which influence microbialbiomass carbon and nitrogen levels insoil. Biological Reviews 67, 321–342.
Weidner, S., Arnold, W. and Pühler, A. (1996)Diversity of uncultured microorganismsassociated with the seagrass Halophila stip-ulacea estimated from restriction fragmentlength polymorphism analysis of PCR-amplified 16S rRNA genes. Applied andEnvironmental Microbiology 62, 766–771.
Weindling, R. (1932) Trichoderma lignorum asa parasite of other fungi. Phytopathology22, 837–845.
Weissenhorn, I. and Leyval, C. (1996) Sporegermination of arbuscular-mycorrhizal(AM) fungi in soils differing in heavymetal content and other physicochemicalproperties. European Journal of Soil Biology32, 165–172.
Weissenhorn, I., Leyval, C. and Berthelin, J.(1993) Cd-tolerant arbuscular mycorrhizal(AM) fungi from heavy-metal pollutedsoils. Plant and Soil 157, 247–256.
Weller, D.M., Raaijmakers, J.M., Mc-Spadden-Gardener, B.B. and Thomashow,L.S. (2002) Microbial populations respon-sible for specific soil suppressiveness toplant pathogens. Annual Review ofPhytopathology 40, 309–348.
White, D.C. and Ringelberg, D.B. (1998)Signature lipid biomarker analysis. In:Burlage, R.S., Atlas, R., Stahl, D., Geesey,G. and Sayler, G. (eds) Techniques inMicrobial Ecology. Oxford UniversityPress, New York, pp. 255–272.
Whitehead, N.A., Barnard, A.M.L., Slater, H.,Simpson, N.J.L. and Salmond, G.P.C.(2001) Quorum-sensing in Gram-negativebacteria. FEMS Microbiology Review 25,365–404.
Widden, P. and Hsu, D. (1987) Competitionbetween Trichoderma species: effects oftemperature and litter type. Soil Biologyand Biochemistry 19, 89–94.
Williams-Woodward, J.L., Pfleger, F.L.,Allmaras, R.R. and Fritz, V.A. (1998)Aphanomyces euteiches inoculum potential:a rolled-towel bioassay suitable for fine-textured soils. Plant Disease 82, 386–390.
Windham, M.T., Elad, Y. and Baker, R. (1986)A mechanism for increased plant growthinduced by Trichoderma spp.Phytopathology 76, 518–521.
Young, J.M., Kuykendall, L.D., Martinez-Romero, E., Kerr, A. and Sawada, H.(2001) A revision of Rhizobium Frank 1889,with an amended description of thegenus, and the inclusion of all species ofAgrobacterium Conn 1942 andAllorhizobium undicola de Lajudie et al.1998 as new combinations: Rhizobiumradiobacter, R. rhizogenes, R. rubi, R. undi-cola and R. vitis. International Journal ofSystematic and Evolutionary Microbiology51, 89–103.
Zeilinger, S., Galhaup, C., Payer, K., Woo,S.L., Mach, R.L., Fekete, C., Lorito, M. andKubicek, C.P. (1999) Chitinase geneexpression during mycoparasitic interac-tion of Trichoderma harzianum with its host.Fungal Genetics and Biology 26, 131–140.
Zelles, L. (1997) Phospholipid fatty acid pro-files in selected members of soil microbialcommunities. Chemosphere 35, 275–294.
Plant–Microbe Interactions and Soil Quality 295

10 Census of MicrobiologicalMethods for Soil Quality
OLIVER DILLY
Lehrstuhl für Bodenökologie, Technische Universität München, D-85764Neuherberg and Ökologie-Zentrum, Universität Kiel, Schauenburgerstraße112, D-24118 Kiel, Germany; Present address: Lehrstuhl für Bodenschutzund Rekultivierung, Brandenburgische Technische Universität, Postfach101344, D-03013 Cottbus, Germany
Introduction
An extensive spectrum of soil microbiological methods has been developedto investigate and evaluate soil quality. Classical soil microbiological meth-ods referring to activity rates and biomass content can be separated frommodern methods related to molecular techniques and isotope determina-tions. Several textbooks containing methods of the two groups have beenpublished. These textbooks frequently contain an enormous set of methodsselected by authors or editors without clearly indicating the field of applica-tion, or they apply more specifically to modern techniques that are stillunder development for routine analyses. This handbook aims to give aselection of methods for soil quality determination. Some informationshould also be given to rank the use of the methods. Therefore, a question-naire was developed in order to evaluate the use of these methods. In addi-tion, the database should provide information to enable location of researchpartners and laboratory expertise; thus, the questionnaire was not anony-mous. Scientists involved in COST Action 831, and also other laboratoriesworking in this area, were encouraged to complete the questionnaire.
Method
The questionnaire was developed to be completed via the Internet and wasconnected to a database. The database expertise was provided byhttp://www.kaufraum.de. The Internet address of the questionnaire waslocated at http://www.soiltechnology.de (accessed 26 October 2004) and wasavailable for more than 1 year; evaluation was carried out at the end of 2003.
©CAB International 2006. Microbiological Methods for Assessing Soil Quality296 (eds J. Bloem et al.)

The questionnaire asked for information on country, city, laboratory,scientist, postal address, phone, fax and e-mail address. Using a radio button,it was possible to select 1 of 18 methods dealing with biomass, communitystructure and activity, carried out either in the laboratory or in the field. Foreach method, one form was to be filled in. Whether the methods were used asroutine analysis, in monitoring programmes or for research only was to benoted. In addition, information was collected about application of the methodwith reference to: (i) soil use; (ii) soil type according ISSS/ISRIC/FAO (1998);(iii) soil texture; (iv) data use; (v) specific comments; and (vi) references. Insome categories, ‘unspecified’ could be selected. The field ‘unspecified’referred either to broad variability or to vague knowledge.
Results
This homepage was initiated by, and announced at, meetings or via e-mailto those on the distribution lists of COST Action 831, so it was visitedmainly by scientists actively involved in this Action. Only a few people notactively involved in COST Action 831 found the homepage and filled in thequestionnaire.
Overall, 159 questionnaires were completed by 32 laboratories in 14countries. The highest number of questionnaires were returned fromGermany, followed by Austria and Italy (Table 10.1). Most methods refer tobacterial community structure, unspecified activity measures and microbialbiomass estimated by fumigation–extraction (Table 10.2). The methods wereused mainly for research; approximately 50% were also used for monitoringand one-third for routine analysis (Table 10.2).
The soils studied were mainly under agricultural land use. One-thirdwere industrial or urban soils. Eighteen different soil types were studiedwith the techniques. However, most of the scientists did not specify soiltype when completing the questionnaire. In contrast, soil texture was speci-fied in more detail, showing that the contributors were dealing mainly withloamy or sandy soil samples and, to a lesser extent, clay soils.
Conclusions
Although the database represents only an initial picture of European labo-ratories dealing with microbiological methods for evaluating soil quality, itis clear that several methods for bacterial community structure, a variety ofactivity methods, and microbial biomass estimated by fumigation–extrac-tion are mainly used. Furthermore, agricultural soils and soils with loamytexture were investigated most frequently and information on soil units wasgenerally not given.
The questionnaire was not completed by all scientists involved in COSTAction 831 over the 12 months that it was available, most likely due to thefact that these scientists did not visit the website or found the procedure
Census of Microbiological Methods for Soil Quality 297

difficult and time consuming, e.g. each method needed to be reported in aseparate questionnaire. In contrast, some laboratories offered a broad spec-trum of methods, because they found the information useful.
Perspectives
To obtain more completed questionnaires for a more representative census,we hope that readers of this book will communicate the Internet addressfurther to their scientific communities, or to societies dealing in this field,such as soil science societies, societies in the field of microbiology andprivate laboratories.
To enhance the acceptance of, and interest in, completing the question-naire, some incentives may be provided, e.g. raffle of books or laboratorytools. Interest may also be encouraged when the webpage is officially sup-ported by national authorities and the European Commission. The ability torefer to personal homepages, or to obtain information about specific con-tributing scientists, may further stimulate interest.
On the technical side, the actual display of graphics with statistics ofmethods used for the respective purposes of monitoring, research or routineanalysis may be of interest. The simultaneous selection of several methodswith the respective information would make the repeated filing of the datarelated to one laboratory unnecessary. Finally, a button for the submissionof comments for improving the questionnaire may be included.
Regarding the content of the questionnaire, some questions related tosoil–plant interactions, such as microorganisms and plants (in Latin), shouldbe considered in the questionnaire, since these aspects are included in thisbook. Furthermore, the following categories may be included.
298 O. Dilly
Country Amount
Germany 36Austria 27Italy 18United Kingdom 17Switzerland 12The Netherlands 9Spain 9Sweden 9Slovenia 8Denmark 6Belgium 2Norway 2France 2Hungary 2
Table 10.1. Number of questionnaires returned from the countries involved in COST Action831.

Census of M
icrobiological Methods for S
oil Quality
299
Table 10.2. Results of the questionnaire on methods used to study soil quality involved in COST Action 831.
Method Soil Use Soil typea Soil texture Use for
Microbial community structure: Bacteria 21 Agricultural 133 Not specified 77 Loam 119 Research 140Microbial activity: Others 18 Forest 79 Cambisol 35 Sand 96 Monitoring 74Microbial biomass: Fumigation–extraction 18 Grassland 73 Luvisol 25 Clay 77 Routine analysis 43Microbial activity: Basal respiration 16 Urban/industrial 53 Histosol 24 Silt 59Microbial biomass: Substrate-inducedrespiration 15 Not specified 20 Podzol 22 Others 53
Microbial activity: N mineralization 13 Gleysol 21Molecular tools: Bacteria 12 Fluvisol 19Microbial biomass: ATP 10 Anthrosol 16Microbial biomass: Fungi 6 Regosol 11Microbial activity: C mineralization 5 Acrisol 9Molecular tools: Others 5 Arenosol 9Field experiments: Others 4 Leptosol 9Microbial biomass: Bacteria 4 Andosol 8Microbial community structure: Fungi 3 Umbrisol 8Microbial biomass: Others 3 Chernozem 7Field experiments: Litter bag 2 Ferralsol 7Field experiments: in situ C mineralization 2 Phaeozem 2Field experiments: in situ N mineralization 2 Vertisol 1
Durisol 1
a According to ISSS/ISRIC/FAO (1998).

Soils under extreme environmental factors:
• soils under cold or high temperature; • soils under limited or excess of water;• soil polluted with heavy metals;• soil polluted with organic compounds;• salty soils;• soil with extreme soil pH value;
and information may be included on soil pH value, for example:
• highly acidic soil;• acid soil;• neutral soil;• alkaline soil.
To get more insight into the use of the respective methods, it would beinteresting to know how many samples per year are analysed with eachtechnique.
References
ISSS/ISRIC/FAO (1998) World Reference Base for Soil Resources. World Soil Resources, Report84. FAO, Rome.
300 O. Dilly

Index
301
accessibility: of indicators 17acetylene inhibition method (AIM)
advantages and disadvantages 155–156calculation 154–155equipment and reagents 153principle 152–153procedure 153–154
acridine orange 94, 98–99activity, microbial 7–8
decomposition experiments 115effects of fertilization 35grasslands vs. horticultural farms 38measured by means of soil respiration
see respiration N mineralization see mineralization,
nitrogen nitrification and denitrification see
denitrification; nitrification overview of methods used 30–31
field vs. laboratory methods114–115
see also enzymes, activity of;growth, bacterial
agricultureeffects of agricultural practices on soil
quality indicators 40–44, 66–68grasslands vs. horticultural farms
35–37(tab), 38microbial community structure and
function 55–59agrochemicals
effects on microbial communitystructure 55–56, 184, 186
see also fertilization
AMOEBA method: for data presentation38–40
arbuscular mycorrhiza see mycorrhiza,arbuscular
ATP (adenosine triphosphate)as index of microbial biomass 9, 75
Azospirillum spp.cultivation-based monitoring
equipment and reagents 275–277media 275(tab)oligonucleotide probes for FISH
278(tab)principles 274–275procedure 277–278
cultivation-independent monitoring279–281
extraction from soil and roots 273–274positive effects on soil 271
bacterianodulating symbiotic see rhizobia plant-growth promoting see rhizobacteria,
plant-growth promoting basal respiration 30
definition 117importance of measurement 122–123substrate-responsive biomass method
calculations 124–125justification for method 126materials and procedure 123–124normative references 171

basal respiration continuedtitration method
calculations 122equipment and reagents 121normative references 170–171principles 120procedure 121–122
biological nitrogen fixation see rhizobiaBiologTM see CLPP methodbiomass and number, microbial 7
as ‘early warning’ system 54ATP as index 9, 75cell counts see counting: microbial cells chloroform-fumigation extraction see
chloroform-fumigationextraction (CFE)
combined indicator with carbonmineralization 54
effects of contamination 34,106–107(fig), 146–147(fig)
effects of crops 55, 67–68effects of fertilization 35effects of sample storage 28–29(fig)effects of tillage systems 67fatty acid analyses 75methods standardization 76methods: overview 30nucleic acid analyses 75–76relation with substrate-induced
respiration 85(fig), 87(fig)substrate-induced respiration see
substrate-induced respiration(SIR) method
biomass, overalleffects of agricultural practices 24–25,
35, 38, 41effects of soil types 41
biovolume, bacterial 101–102
Canada 20carbon
biomass: organic ratio 4mineralization see mineralization,
carbonrhizodeposition of fixed carbon 228–229soil organic carbon pools 53–54
categories: of soil quality evaluationmethods 6–7, 12(tab)
census: of methodsmethodology and results 296–297
methods used and soils tested 297,299(tab)
number of responses 298(tab)suggested enhancements to
questionnaire 298, 300chloroform-fumigation extraction (CFE) 30,
74–75biomass C by dichromate oxidation
78–80biomass C by UV-persulphate oxidation
80–81biomass ninhydrin vs. biomass C 83fumigation–extraction procedure 78materials and reagents 78ninhydrin-reactive nitrogen
determination 81–83principle 77relation with substrate-induced
respiration 85(fig)chromium 34CLPP method 11, 31
BiologTM system 213, 216(fig)calculation and data management
217–220data analysis 221different substrates in BiologTM plates
33(fig)dilution, inoculation and incubation
215–217equipment and reagents 214–215outline of profile construction 219(fig)principle 213–214sampling, storage and extraction 214standardization 221
colonization: of roots by mycorrhiza251–253, 255(fig)
communities, microbial see diversity andcommunity structure, microbial
community fingerprinting see fingerprinting,community
community-level physiological profile seeCLPP method
copper 34, 146–147(fig)COST Action 831 (EU) 3–4, 64counting: microbial cells
biomass 102–103biovolume 101–102chemicals and solutions 97–98counting and calculations 100–105direct cell counts 74, 96drawbacks of plate counts 73–74
302 Index

errorsmaximum error estimation 105–106sources and propagation
103–104(tab)examination of slides 100filters 96microscopy 96–97preparation of soil suspension 98–99results: example 106–107(fig)sample collection, preparation and
storage 95–96staining procedures 99–100stains used 93–95statistical considerations 103–106
counting: soil organisms 30–31crops: effects on microbial community
structure 55, 67–68Czech Republic 32
DAPI (4’,6-diamidino-2-phenylindole-dihydrochloride) 94, 96–99, 280–281
data: presentation methods 38–40decomposition: as measure of microbial
activity 115definitions 17–18, 24, 51, 117–118dehydrogenases 159, 161–163
normative references 171denaturing gradient gel electrophoresis
(DGGE) 32(fig), 192–194, 200–201,202(tab), 203
denitrificationacetylene inhibition method 152–156consequences of nitrifying
microorganisms 151–152description 150–151isotope methods 156–157vs. nitrification 151
Denmark 28DGGE see denaturing gradient gel
electrophoresis (DGGE)diazosymbionts see rhizobiadichromate: oxidation by 78–80differential fluorescent stain (DFS) 95, 98, 100diseases, plant: effects of soil see fungistasis,
soil; soil inoculum potential;suppressiveness, soil
diversity and community structure,microbial 8
effects of agricultural practices 35–36,42(fig), 43
agricultural chemicals 55–56, 184,186
crops 55precision farming vs. conventional
management 56–57transition to organic farming 58–59
effects of contamination 34methods
advantages of non-culturetechniques 55, 183–184
CLPP method see CLPP method community fingerprinting see
fingerprinting, community obstacles to measurement and
research needs 44–45overview 31–34, 185(tab)phospholipid fatty analyses see
phospholipid fatty acidanalyses
prokaryotic species: estimated number184, 212
DNAas biomass indicator 76bacterial profiles 31
effects of agricultural practices35–36, 40–41
effects of contamination 32(fig), 34effects of storage 29
fingerprinting see fingerprinting,community
DTAF (5-(4.6-dichlorotriazin-2-yl)aminofluorescein 94, 98, 100
Dutch Soil Quality Networkimpediments and research needs 44–45parameters measured 33–34results
contaminated and experimentalreference sites 34–36
data presentation 38–40first year pilot study 36–38five-year cycle 40–44
sampling methodology 26–30Soil Quality Index 39–40structure and activity 26
EcoBiolog® system 58–59ecosystems, health of 24ecotoxicology: risk assessment 92electrophoresis, denaturing gradient gel see
denaturing gradient gelelectrophoresis (DGGE)
Index 303

enumeration see countingEnvironmental Protection Agency (EPA,
USA) 18environmental quality 18enzymes, activity of 31, 158–159
commonly assayed hydrolases 160(tab)dehydrogenase activity 159, 161–163effect of precision farming 57fluorescein diacetate hydrolysis 163–166interpretation of assay data 169–170normative references 171phosphomonoesterase activity 166–169
European CommissionCOST actions 3–4, 64environmental measures 50–51
farming, organic 35, 58–59farming, precision 56–57fatty acids, phospholipid see phospholipid
fatty acid analysesfertilization
effects of different practices 35–36see also agrochemicals
fingerprinting, communitycalculation 201–202denaturing gradient gel electrophoresis
(DGGE) 32(fig), 192–194,200–201, 202(tab), 203
fingerprinting techniques: overview188–189
limitations 212nucleic acid extraction
DNA method 190, 195–197DNA/RNA method 191, 197–198equipment and reagents 192–193limitations of methodology 202types of methods 187–188
PCR amplification 191–193, 198–200,202–203
Finland 28fixation, biological nitrogen see rhizobiaflax: in soil suppressiveness assay 259–262fluorescein diacetate, hydrolysis of 163–166fluorescence in situ hybridization (FISH): for
Azospirillum spp. 277–278, 280–281food webs, soil 25, 36, 38fungi see also mycorrhiza, arbuscular
assessment of soil inoculum potential262–264
assessment of soil suppressiveness toFusarium wilts 259–262
effect of precision farming on diversity57
fungal to bacterial ratio 44plant-growth promoting species
cultivation-based monitoring282–284
effects 270–272separation and extraction 280(fig),
282fungistasis, soil 264–268Fusarium oxysporum
soil suppressiveness assay 259–262spore germination and mycelial
extension 266(fig)
GELCOMPAR program 201–202genetically modified plants 68–69Germany 28–29, 31germination:
of mycorrhizal spores as measure of soiltoxicity 251–254(fig)
spore germination test of soil fungistasis266–267
Gliocladium spp.cultivation-based monitoring 281–284positive effects on soil 272
Glomus mossease: use in bioassays 251–253grasslands 35–37(tab), 38
AMOEBA presentation of indicatorvalues 39(fig)
greenhouse gases 58growth, bacterial 30–31
assessment by thymidine and leucineincorporation
calculation and conversion factors146–147
comparison with other procedures147–149
equipment and procedure 143–145overview and principle 142–143
effects of contamination 106–107(fig),146–147(fig)
effects of sample storage 28–29(fig)grasslands vs. horticultural farms 38
health: as criterion for soil quality 18heavy metals 106–107(fig)
mycorrhizal assay 250–254Heinemeyer soil biomass analyser 86–90
304 Index

hybridization: methodology: for Azospirillumspp. 277–278, 280–281
hydrolases 160(tab)hyphal extension test 267–268
indexes, soil quality 17–18, 39–40, 64–65indicators and parameters, soil quality
criteria 4–5, 15–18, 53, 69definitions 17–18importance of biological parameters
20–21minimum data set 66(fig)regulatory agency proposals 18–21relationships between parameters 9–12suitability depends on land type and
use 53infection counts, plant (for enumeration of
rhizobia) 236–240inoculation, mycorrhizal 249–250inoculum potential, soil see soil inoculum
potentialISO Technical Committee 19(tab), 123isotopes
for assessment of plant nitrogen fromsymbiotic fixation 243–246
in denitrification research 156–157isotopic dilution technique 129
Italy 28–29, 66–68
leucine, incorporation of see under growth,bacterial
liming 35Linum usitatissinum: in soil suppressiveness
assay 259–262litterbags: in decomposition experiments 115
markers, molecular 75–76McCrady table 240(tab)measurability 16Medicago truncatula: use in bioassays 251–253metals, heavy 106–107(fig)mineralization, carbon 36
combined with biomass 54effects of storage 28–29(fig)limitations of estimation by means of
soil respiration 118see also respiration
mineralization, nitrogen 31–33, 36description 127–128
disadvantages of field method 114effects of fertilization 35, 41–42(fig)effects of sample storage 28–29effects of soil types 41–42(fig)gross mineralization: isotopic dilution
technique 129net mineralization measurements 128potential mineralization activity
anaerobic N mineralization method132–133
long-term aerobic N mineralizationmethod 133–135
short-term vs. long-term procedures130–132
MPN plant infection counts 236–240mycorrhiza, arbuscular
characteristics 248–249germination in sewage sludge and
waste 254(fig)in soil remediation and plant protection
249, 254–255in tests of heavy metal contamination
250–254mycorrhizal inoculation 249–250tolerance to heavy metals 254
Netherlands, The see Dutch Soil QualityNetwork
New Zealand 20–21(tab), 32nickel: effects on bacterial DNA profiles 34nitrification 31
consequences of nitrifyingmicroorganisms 151
gross nitrification 136–137net nitrification 137nitrification potential
calculations 140–141chlorate inhibition method 141equipment and reagents 138–139optimum initial ammonia
concentration 141principle 137–138procedure 139–140
normative references 171vs. denitrification 151
nitrogenbiological nitrogen fixation see rhizobia mineralization see mineralization,
nitrogen ninhydrin-reactive: determination 81–83
Index 305

nitrous oxide: determination see acetyleneinhibition method (AIM)
nodulation scores 234, 236(tab)nucleic acids see fingerprinting, community
OECD 16–18, 64operativeness 17organic farming 35, 58–59organic matter, soil 53–54oxidation
dichromate 78–80UV-persulphate 80–81
parameters, soil quality see indicators andparameters, soil quality
pathogens, plant: effects of soil seefungistasis, soil; soil inoculumpotential; suppressiveness, soil
PCR amplification 191–193, 198–200,202–203
persulphate: in UV oxidation reaction 80–81PGPF see fungi, plant-growth promoting
speciesPGPR see rhizobacteria, plant-growth
promotingphospholipid fatty acid analyses 31, 75
advantages and applications 204–205calculation and statistical analysis
210–211equipment and reagents 207–208fatty acid nomenclature 210gas chromatography 209–210internal standards 209limitations 212lipid extraction and fractionation
flow diagram 206(fig)methodology 208–209
methanolysis 209other methodologies 211principle of the methods 205
phosphomonoesterases 166–169plant infection counts (for enumeration of
rhizobia) 236–240plants: interactions with microbes see
mycorrhiza, arbuscular;rhizobacteria, plant-growthpromoting; rhizobia; rhizosphere
PLFA analyses see phospholipid fatty acidanalyses
pollution 106–107(fig)precision farming 56–57productivity, soil 18
quality, soildefinitions 18, 24, 51phytosanitary quality see fungistasis,
soil; soil inoculum potential;suppressiveness, soil
relevance, political 16reliability 17remediation: of soil 254–255representativeness 16–17respiration
basal see basal respiration definition 117–118effects of contamination 146–147(fig)field vs. laboratory methods 118–119static vs. dynamic methods 119–120(tab)substrate-induced see substrate-induced
respiration (SIR) method see also mineralization, carbon
rhizobacteria, plant-growth promotingAzospirillum
cultivation-based monitoring274–278
cultivation-independent monitoring279–281
effects 270–271separation and extraction 273–274,
280(fig)rhizobia (nodulating bacteria)
detection of rhizobia and assessment ofnodulating potential
equipment and materials 234–235principles 233–234procedure and calculation 235–236
enumeration by MPN plant infectioncounts 236–240
occurrence in different soils 236other roles in improving soil quality
246–247symbiosis with legumes (biological
nitrogen fixation)assessment of plant nitrogen from
symbiotic fixation 243–246assessment of symbiotic efficacy
241–243importance 233known interactions 232(tab)
306 Index

rhizosphere 9 effects on soil quality 230microbial adaptation to environmental
changes 229–230rhizodeposition of fixed carbon 228–229see also mycorrhiza, arbuscular;
rhizobacteria, plant-growthpromoting; rhizobia
risk assessment, ecotoxicological 92RNA see fingerprinting, communityRodale Institute 18root colonization bioassay 251–253, 255(fig)
samplingdepth 27for analysis of respiration 88, 119for CLPP method 214for enzyme assays 162for phospholipid fatty analyses 208need for replicates 26–27sample storage 28–30timing 27use of sieving 27
signalling: microbial and plant 229–230SINDI (Soil Indicators scheme New Zealand)
20–21(tab)Sixth Environmental Action Programme (6th
EAP, EU) 50–51soil inoculum potential 258–259, 262–264soil organic matter (SOM): living vs. non-
living 53–54Soil Quality Index: Dutch Soil Quality
Network 39–40Soil Science Society of America (SSSA)
20(tab)soil: effect of type on quality indicators 40–44spore germination bioassays 251–253,
266–267stains: for microbial counting 93–95, 99–100
see under counting: microbial cellsstress: time dependence 4substrate-induced respiration (SIR) method
9, 11, 30disadvantages and limits 92
materials and equipment 86–88overview 84–85principle 85–86procedure and calculation 88–90relation with microbial biomass 85(fig),
87(fig)sources of variability 91(tab)technical advantages 90use in ecotoxicological risk assessment
92use in soil quality monitoring 91
suppressiveness, soilconcept 257–259Fusarium bioassay 259–262
sustainability, agricultural 51–52, 59–60Sweden 27–30Switzerland 28–29, 32, 35symbiosis see mycorrhiza, arbuscular;
rhizobia
temperature: for sample storage 28–29terminology 17–18The Netherlands see Dutch Soil Quality
Networkthymidine, incorporation of see under
growth, bacterialtillage: effects on soil quality 67toxicity: mycorrhizal assay 251–254Trichoderma spp.
cultivation-based monitoring 281–284positive effects on soil 272
ultraviolet light: oxidation by 80–81United Kingdom 28–29, 32United States 18, 20(tab)
validity 16variation 38
zinc: effects on bacterial DNA profiles 34
Index 307