Embed Size (px)
Citation preview
Regionalism and Tribal Insecurity in India
Sacha Kapoor Arvind Magesan ∗
March 21, 2021
Abstract
Observers have long been ambivalent about democratic representation by partieswith a regionalist orientation. We estimate the causal effect of regionalist party repre-sentation on political violence in India and find regionalist parties who win power causelocal violence, but not through increased conflict with the Center. Rather, successfulregionalists tend to favor local ethnic majorities, causing heightened uncertainty forlocal minority groups. In particular, we show that the increased violence is explainedentirely by electoral constituencies with significant tribal populations but no man-dated political representation for tribes, and that regionalist parties further decreaselocal tribal persons’ reported consumption of television and radio, cultural goods, andwages. Our results imply representation by local majorities further relegates localtribal minorities to the margins of society, and that they in turn respond with orga-nized political violence.
JEL: D74, H19, H77, P48
Keywords: Regionalism, Political Violence, Civil Conflict, Elections, Tribal Popula-tions.
∗Kapoor: Erasmus University Rotterdam, Erasmus School of Economics H09-22, Burgemeester Oudlaan50, 3062 PA Rotterdam, The Netherlands, [email protected]. Magesan: University of Calgary, Departmentof Economics, 2500 University Way NW, Calgary AB, T2N1N4, Canada, [email protected]. Wethank Nathan Canen, Benjamin Crost, Benoit Crutzen, Robert Dur, Kai Gehring, Laura Hering, VincentRebeyrol, Otto Swank, Eik Swee, Andrea Szabo, Scott Taylor, Aashay Tripathi, Gergely Ujhelyi, seminaraudiences at the CDESG 2019 in Banff, The NEUDC 2020 conference, the University of Calgary, Universityof Houston, and Erasmus University Rotterdam for helpful comments. Safoura Moeeni, Aashay Tripathi andMiguel Olivo-Villabrille provided outstanding research assistance. Funding from SSHRC through IG grant435-2019-0437 is gratefully acknowledged.
Regionalism is contentious as an organizing political principle. On one hand, it has
produced political parties in democracies throughout the developed and developing world
that are the primary vehicle for recognition and representation of minority groups.1 On
the other hand, it is often the basis for violent conflict between central governments and
peripheral insurgent groups. The ambivalence towards regionalism is due in part to un-
certainty about the role regionalist parties themselves play in intrastate political violence.
While Brancati (2006) argues that regionalist parties can increase the salience of ethnic and
regional identities, mobilize citizens for conflict, and promote legislation favoring supporters
disproportionately over other local groups, Alonso and Ruiz-Rufino (2007) show that rep-
resentation of ethnic minorities in Eastern Europe and the former Soviet Union can reduce
conflict when representatives carry policy influence. In a similar vein, Wimmer, Cederman,
and Min (2009) and Cederman, Wimmer, and Min (2010) show that armed rebellion is more
likely when ethnic groups are excluded from access to decision making.
We help resolve the uncertainty about the role of regionalist parties by providing the
first causal evidence on the effect of regionalist representation on political violence. We
show that regionalist parties that win power cause local violence, but not through increased
conflict with the central government. Rather, the election of regionalist parties, who tend
to represent and favor local ethnic majority groups, raises local minority insecurity which in
turn precipitates violent conflict between local majority and minority groups.
Our setting is subnational (state) elections in India, where, in the period of our sample,
80 regionalist parties that represent a rich set of regions and ethnicities compete against
India’s two dominant national parties. Other countries usually have one or two significant
regionalist parties to complement a small number of national parties. In this way, India
offers the best option for identifying general regional party effects while reaping the benefits
of within country micro-data. In addition, India’s 28 states regularly elect Members of the
1Examples include: Sinn Fein (Northern Ireland), The Scottish National Party (Scotland), and PlaidCymru (Wales) in the uk; the Parti Quebecois in Canada; the Basque National Party in Spain; the PolisarioFront in Sub-Saharan Africa; indigenous parties in Latin America; the snld in Myanmar; Kurdish partiesin Iraq and Turkey; Tamil parties in India and Sri Lanka.
1

Legislative Assembly (mla’s) to represent parliamentary constituencies, our primary unit of
analysis, and in total we observe elections in more than 4000 electoral constituencies over
many years. The large number of elections and the structure of Indian electoral institutions
facilitates a causal interpretations of the effects of regionalist parties on violence, as well as
an understanding of the underlying mechanisms.
Our baseline identification strategy is based on a close elections regression discontinuity
(rd) design that compares political violence in constituencies where regionalist party repre-
sentatives won or lost the election. We find the election of a regionalist party representative
increases the occurrence of violence and death by 7.2 percentage points and the number of
violent events and deaths by 10 and 13 percent respectively. Exploiting the structure of
political administration in India, we use a complementary instrumental variables (iv) strat-
egy to show further that the effects of regionalist representatives on violence are local in
nature. The effects are limited to the constituency they represent and do not spill over into
constituencies won by national parties.
The constituency level effect is driven largely by cases where the regionalist candidate’s
party governs the state (as opposed to being a member of the opposition). In these cases,
regionalist party representatives increase the occurrence of violence and death by 10 percent-
age points and the number of events and deaths by 15 and 23% respectively. By contrast,
a regionalist party representative has no effect on local violence when either of India’s two
dominant national parties control state government.
India’s states have wide ranging political and economic decision making authority. As
such, the estimates suggest that when regionalist parties control resources and key institu-
tions (including police and security forces), local representatives from the regionalist party
cause local violence. Social scientists have long argued that the pacifying capacity of formal
representation by these types of parties depends on whether local electoral success trans-
lates into meaningful authority (Lijphart 2004; Gurr 1993). One of the important insights
in Wimmer, Cederman, and Min (2009) and Cederman, Wimmer, and Min (2010) is that
2
meaningful executive power reduces intrastate conflict by pacifying the demands of minori-
ties within the state, while nominal authority has no such capacity to reduce conflict. Our
results stand in contradiction to this line of reasoning, as they suggest that meaningful exec-
utive authority increases political violence. Accordingly, we further explore the mechanism
underlying our results.
Why does more political power for regionalist parties lead to more political violence at
the constituency level? Indian mlas are generally viewed as “fixers”, who play a role in
mediating local disputes over land and resources (Asher and Novosad 2017) among other
things. Moreover, regionalist representatives who belong to the governing party wield sig-
nificant authority over the distribution of resources locally. As Indian regionalist parties
tend to organize around the identity of local ethnic majorities, regionalist representatives
favor the local ethnic majority supporters at the expense of local minorities. Despite being
a significant fraction of the Indian population (104 million out of 1.2 billion according to the
2011 census) tribal populations are a marginalized minority wherever they exist in India.
They share a modern history of dispossession, land alienation, and competition for land and
resources with non-tribals. In response, tribes have mobilized for violence against the In-
dian state and local paramilitary groups.2 We hypothesize that the increased violence that
attends the election of regional candidates is a result of heightened tension between local
majorities and tribes.
To test this hypothesis, we leverage the constitutional reservation of seats for members
of a Scheduled Tribe (st) together with local st population information to categorize con-
stituencies on the basis of st representation. We show that the violence that follows region-
alist representation is generated in constituencies where st are formally under-represented -
where there is a large st population but no mandated tribal representation. We then show
using direct evidence from the first national survey of st-persons in India that increased
2Two prominent examples are in India’s Northeast, where Bodo and Dimasa tribes (among others) havemounted insurgency against the state in pursuit of greater self determination and autonomy and the Naxaliteconflict in central India, which relies heavily on the participation of aggrieved tribes, and is considered bymany to be a tribal movement in practice (Roy 2011). We provide a case study in section 8.1.
3
representation by regionalist parties reduces st household consumption of media (television,
radio and newspapers) and cultural goods (attendance at cinemas or theatres). It decreases
the earnings of st persons in local labor markets. We conclude that regionalist representa-
tion further relegates st persons to the margins of society, and that the violence caused by
the local election of a regionalist candidate is a result of heightened tribal insecurity.
2 Related Literature
The number of political parties contesting elections in India has grown rapidly since In-
dependence in 1947. A major part of this growth involves parties who concentrate their
attention on a particular geographic region.3 As Ziegfeld (2016) notes, the existence of these
parties in India is usually attributed to the combination two factors. The first is regional
cleavages, where national minority ethnic groups are territorially concentrated and politi-
cal parties can have success by appealing to the demands and historical grievances of these
groups. These parties are constrained to operate regionally because their appeals to voters
will be less effective where the national minority is rare. The second explanation for their
existence is decentralization of fiscal and political power to state and more local govern-
ments. The prospect of additional fiscal and political control strengthens incentives to run
regionally without having to compete nationwide. The combination of concentrated ethnic
populations and decentralized power is a powerful explanation for the rise of regional parties
at the state level in particular.
The scholarship on the consequences of regional political parties grew out of a large
number of case studies and raw statistical evidence (Banerjee 1984; Bhatnagar and Kumar
1988; Gassah 1992, e.g.).4 Significant advances were made in (Brancati 2006) and Brancati
3Prominent examples in India include the Dravida Munnetra Kazhagam, the Asom Gana Parishad, AkaliDal, The National Conference of Jammu and Kashmir, and Telugu Desam who run candidates exclusivelyin Tamil Nadu, Assam, Punjab, Jammu & Kashmir and Andhra Pradesh, respectively.
4Some political scientists reference regional parties Brancati (2008). Others reference regionalist parties(Massetti and Schakel 2016). We view regional parties as parties whose support is limited geographically,whether by design or not. Support for regionalist parties is limited geographically by design. We use
4
(2008), whose systematic analysis of cross-national data supported the ideas that regional
political parties are a consequence of political decentralization (Chhibber and Kollman 1999),
even after conditioning on regional cleavages, and that these parties moderate the effects of
decentralization on conflict among minority groups, between minority and majority groups,
and between minority groups and the government. The Brancati (2006, 2008) analyses
highlight the complexity of the relationship between regional parties and political violence
from the perspective of separating cause from effect. Regional parties can be interpreted as
both a cause and consequence of political violence. Regional parties and political violence
both correlate with unobservables, such as the history of violence and overall inclusiveness of
institutions. A primary contribution of our paper, therefore, is in providing the first causal
evidence on the violent effects of regional parties. In doing so, we contribute to a growing
literature on causal identification of the sources of intrastate violent conflict, i.e. (Miguel,
Satyanath, and Sergenti 2004; Dube and Naidu 2015; Dube and Vargas 2013; Nunn and Qian
2014; Magesan and Swee 2018), and (Blattman and Miguel 2010) for a review.5
Our study contributes to a new literature that empirically identifies the role of regional
identity as a determinant of the distribution of political power and economic resources.
Hodler and Raschky (2014) show that politicians elected at the national level dispropor-
tionately divert resources to their sub-national region of origin. They show that regional
favoritism is also more common in poorer countries with linguistic heterogeneity, which is
the case in India, and suggests that the ability to politically organize around local ethnicity
is an important factor. In subsequent work, Luca et al. (2018) show that electoral concerns
are a key driver of regional favoritism, and that ethnic favoritism is more likely when ethnic
parties are politically important. We contribute here by providing causal evidence about the
role of political parties with regional and ethnic orientation in generating conflict.
regionalist throughout the manuscript except when referencing papers that use regional party. We elaborateon why we use regionalist when we discuss the definition and measurement in Sections ?? and 4.2.
5Though the violence in these papers is sometimes framed as “civil war,” many of the civil wars of thelast few decades are characterized by long and protracted asymmetric conflict between a state and one orseveral small groups, similar to the secessionist violence in India.
5

As a result, we contribute to an emerging literature on the causal effects of political
parties on political violence. Nellis, Weaver, and Rosenzweig (2016) and Nellis and Siddiqui
(2018) estimate the effects of party identity and party ideology on communal violence. Nellis,
Weaver, and Rosenzweig (2016) use data from India to show that greater district level seat
share for the Indian National Congress (inc) party in state assembly elections decreases
Hindu-Muslim riots substantially. While we find a related result - that local representatives
from a regionalist party do not cause violence when a major National party controls the state
- the violence that responds to regional representation in our setting is not inter-communal
in nature. It is violence involving state forces and armed insurgents.
We advance this literature in several ways in addition to focusing on the effects of re-
gionalist parties rather than other party types. Unlike other articles, we identify effects at
the level of the electoral constituency in addition to the aggregate district level (groups of
constituencies) as other researchers were constrained to do by their data. Electoral con-
stituency effects enables clean identification of the effect of the representatives themselves
on violence. Electoral constituency effects let us delve cleanly into mechanisms because we
can, for example, examine whether the effects differ depending on ethnic compositions of
constituencies. Like other articles, we also identify effects at the level of the administrative
district. This allows for inferences concerning the effects of regionalist representation on
violence in neighbouring constituencies represented by other parties. These district level
estimates, together with the constituency level estimates, help us investigate how the effect
on violence differs depending on regionalist influence over central executive decisions.
We contribute to a political economics literature which studies the coexistence of po-
litical violence and democratic electoral politics. Wilkinson (2004) identifies circumstances
where politicians are led to either curb or incite violence, arguing that constituency-level
electoral incentives in India induces local representatives to incite Hindu-Muslim violence,
as ethnic parties leverage incite violence to solidify perceptions that they are the party of
their coethnics. Acemoglu, Robinson, and Santos (2013) use a model to show incumbent
6
governments with re-election concerns would forgo the state’s usual monopoly on violence
in exchange for pre-election support from paramilitary groups. Chacon (2018) shows theo-
retically that subnational decentralization can increase violent insurgency because of higher
rents to subnational government capture, and that the effect is more pronounced when the
subnational government has weaker state capacity. These mechanisms are likely important
in our setting, as many of India’s regional parties have a natural tendency to sympathize
or maintain ties with rebels while participating in conventional politics, with both having
origins in the same political movement.6 This increases the chances of the quid pro quo that
Acemoglu et al. (2013) identify. The mechanism in (Chacon 2018) likely manifests in our
setting as well, as regionalist parties have limited capacity to control violence relative to big
national parties.
Our results for st-reserved constituencies and open constituencies with large st pop-
ulations delivers new insights for a literature on quotas and reservation for disadvantaged
groups in India. Pande (2003) famously examined whether mandated political reservation in-
creases transfers to the historically disadvantaged groups (members of Scheduled Castes and
Tribes). While Pande (2003) found improved outcomes for disadvantaged groups, Jensenius
(2015) has recently exploited India’s quota system to show that having an Scheduled Caste
(sc) state level representative does not improve outcomes for sc persons. The fact that the
effect on violence comes entirely from open constituencies with large st populations suggests
that seat reservation for the tribal community significantly weakens the link between party
identity and political violence.
Our results complement a literature that examines the effects of the forced imposition of
institutional and governance structures on ethnic groups with different backgrounds. (Dippel
2014), (Michalopoulos and Papaioannou 2013), and (Gennaioli and Rainer 2007) and study
the effects on economic performance. The regionalism, violence, and tribal isolationism we
observe can be viewed as a manifestation of the forced imposition of such structures.
6The transition from violent political movement to legitimate political party is complex and not alwayssuccessful. See Acosta (2001) for further discussion.
7

3 Context
3.1. State Political Systems. State governments have jurisdiction over a range of issues
with local significance, including public health, internal security (through state police), ed-
ucation at all levels (concurrent with federal government) and public works, among others.
State governments also have tax collecting powers, and receive income from a (vat) sales
tax.
States are partitioned into administrative districts. Administrative districts are politi-
cally significant units, as the state government appoints several officials at this level (i.e.,
District Magistrate and Superintendent of the Police, to administer law and order, tax col-
lection and revenues, arbitration of land acquisition, etc.).
Administrative districts are further partitioned into partitioned into single-member State
Assembly constituencies. Each constituency elects a representative to the State Assembly
via first-past-the-post voting rule.
India has 4120 seats in state (or union territory) assemblies, 146 on average for the 28
states, and 66 on average for the union territories. More than 1100 of these seats are reserved,
570 for sc, and 532 for st. The reservations are determined by sc and st population in the
state - the number of reserved seats in a state is in proportion to the population of sc and
st in the state. Reserved seats are in turn allocated to constituencies with the largest sc
and st populations.
The Election Commission of India classifies parties on the basis of their electoral success
across India. A party is officially recognized as a “State party” in India if the party:
(a) has been active for at least 5 years and won no less than 1/25 of State’s seats in lower
house of national parliament (Lok Sabha) or 1/13 of lower house seats in state assembly.
(b) obtained 6% of popular vote in state in last national or state election.
A party who meets either criteria in more than 3 states is officially recognized as a “National
8
Party”. The remaining parties are labelled “Registered Unrecognized” or “Independent.”
The designations bestow certain privileges to political parties relating to campaign spending
and exclusive rights to a political symbol in national and state elections.
3.2. Regionalist Parties in India. Conceptually, we define a party as a regionalist party
if it makes appeals on issues that disproportionately affect voters in a particular geograph-
ical region. Regionalist parties in India typically share two features that distinguish them
from large National parties like the inc. First, the “politics of recognition” is key to their
existence and success (Chhibber and Verma 2018). Regionalist parties serve to highlight
ethnic identities and differences between groups. Second, regionalist parties often advocate
for greater regional autonomy. Greater recognition of the local majority ethnic group and
autonomy for the associated region likely benefits local ethnic majorities disproportionately
in terms of resource shares. These two features characterize several well known parties in
India: Dravidian parties (dmk and aiadmk) in Tamil Nadu who advocate primarily for
otherwise backward castes and classes (obc) that have a higher social rank than st/sc
persons; Telugu Desam Party (tdp) in Andhra Pradesh, who advocate primarily for obc;
Shiromani Akali Dal (sad) in Punjab who advocate for Sikhs who are the religious majority
in the state; National Conference (nc) in Jammu & Kashmir who advocate for Muslims, also
the religious majority in the state; Asom Gana Parishad (agp) who advocate for the mid-
dle class Axamiya, Hindus whose native tongue is Assamese, commonly labelled as “ethnic
Assamese”.
While national parties like the inc can in principle campaign to increase the resource share
for the local ethnic majority, their party ideology constrains them to emphasize “Indian”
identity over local identities. The “catch-all nature of the Congress” (Chhibber and Verma
2018) has prevented it from competing on this margin with new regionalist parties that enter
to represent local majority interests. From its founding, the inc or Congress approach has
been explicit about uplifting constitutionally protected (local) minorities at the fringes of
9
society,7 and has placed less emphasis on the large socio-economically advantaged “middle
class,” to which the local majority often belongs.
National parties like the inc are further constrained by the federal structure in India.
In our context, for example, if the national party were to favor the local majority over st
populations in one state, st populations in other states will surely take notice because, as
we note later, they are perhaps the most united minority in India (Hoeber Rudolph and
Rudolph 1980). Thus, even though state boundaries are drawn across ethnolinguistic lines,
there is enough commonality across states to make national party behavior in one state
detrimental to their prospects in another state.
Why then would a regional majority person ever vote for a national party candidate if
regionalist parties funnel more resources to their supporters and national parties are con-
strained to allocate resources equally? In other words, why would they vote for a national
party who will allocate them a smaller (though more equitable) share of resources? First,
ethnic majority voters are not a monolith with identical political preferences. There are
certainly members of the local ethnic majority who support the inc’s secularist-national
ideological project, which includes the idea of a single Indian identity above all. Second,
some regionalist voters may find it in their economic interest to align with the inc. While
regionalist parties likely increase the resource share of their coethnics when elected over na-
tional parties, they may or may not increase the resource level. National parties may have
a greater propensity for increasing resources available for everyone, including the plurality
or majority population specifically advocated for by regionalist parties. For similar reasons,
some regionalist party coethnics may in fact prefer a local representative who is aligned with
the center (c.f. (Asher and Novosad 2017)).
3.3. Case Study of Assam. While the discussion above characterizes regionalist parties in
many states, the Indian state of Assam provides a useful frame of reference for these features
7See https://www.culturalsurvival.org/publications/cultural-survival-quarterly/tribal-
leadership-vs-congress-i-india for example.
10
and our study more generally. Assam has residents from a multitude of ethnic groups,
the largest of which being: the Axamiya; the Muslims of Assamese origin; Mongoloid tribal
groups; Bengali speaking immigrants from other Indian states and Bangladesh. The Axamiya
and tribal groups both view themselves as the rightful Sons of the Soil in Assam. Large scale
immigration and demographic change and in turn land, resource, and food scarcity over the
last century has caused economic and cultural insecurity of both groups (Mukherjee 2006)
and provided seeds for “Sons of the Soil” violence (Weiner 1978).
The insecurity precipitated the Assam Movement, or “Assam Agitation,” a long-standing
and large-scale nativist movement against immigrants. In the early years of the movement
the middle class Axamiya and the tribes, in particular the Bodos, were united by their anxiety
towards immigrants. The movement gained momentum through the 1970s and early 1980s
until the de facto leader, the All Assam Students Union (aasu), which largely represented
the Axamiya, agreed to the Assam Accord with the central government in 1985. In exchange
for calling off the agitation, the center promised to help identify “illegal migrants” and either
delete them from the electoral record or expel them from Assam altogether.
Violence often flared up between the Axamiya and the tribes in the years preceding
the Accord (Goswami 2014). Tribal leaders complained to the central government about
Assamese chauvinism, language-based discrimination, and a fear that their cultures were
being erased by Assamese assimilation (Dutta 2012). Tellingly, as Dutta (2012) notes, tribal
leaders expressed their “fears of what would happen to the tribals once the leaders of the
movement (the AASU) come to power in the state”. With the signing of the Assam Accord,
the agitation formally ended and the movement was transitioned to a regionalist party, the
agp (Asom Gana Parishad), and the fears of tribal leaders were slowly realized.
In 1987, the All-Bodo Students Union (absu) formed to press for secession from Assam
and creation of a separate state called “Bodoland.” The Bodo people perceived their land,
culture, and even language as under threat from immigration and efforts by ethnic Assamese
to “Assamize” Assam via the agp (George 1994). At the same time, a perceived inability
11
of the political establishment to deliver on the Accord’s promises led to the formation of the
United Liberation Front of Asom (ulfa), an outlawed secessionist organization seeking an
independent Assam through violent struggle.
A new but familiar dynamic emerged, where the agp was the oppressor and the Bodos
the oppressed. The agp had the legitimacy and the capacity to use violence as a means of
repressing tribal revolt whether using state power, or by using the ulfa as a proxy. In the
1990s the Bodos began to respond with violence on a much larger scale, as militant groups
such as the Bodo Liberation Tigers (blt) and the National Democratic Front of Bodoland
(ndfb) became active in Assam. These groups have been accused of ethnic cleansing of
non-tribal communities on multiple occasions (Goswami 2014).
3.4. Why Tribes? sc persons are a primary minority in several cases where a regionalist
party emerges to represent the local majority. This was the case in both Andhra Pradesh and
Tamil Nadu for example, where the dmk and tdp emerged to represent otherwise backward
castes and classes (obc), whose social rank was above sc populations. Yet we observe no
increased violence in associated constituencies whether sc persons are under-represented.
Why might regionalist parties increase violence in constituencies where st rather than sc
persons are under-represented?
To address this question, it is useful to consider additional background on the st/sc
designation.8 In 1946 a committee was organized to draft a constitution for an independent
India. The committee consisted of representatives of various identities from across what
would become India. A primary discussion point related to which identities should receive
constitutionally scheduled privilege. sc privilege was justified via their economic and social
backwardness. st privilege was justified via their economic and social backwardness, their
geographic isolation, and their distinct languages/cultures.
In these regards, regionalist party success poses an existential threat to st populations
in a way that is not true for sc populations and other minorities in India. Regionalist
8See (Ambagudia 2011) for an extensive discussion.
12
parties can do things like establish “language laws” that disproportionately harm isolated
groups who are relatively unfamiliar with the language (most minority groups speak the
majority language for their immediate surroundings). Regionalist parties can then further
alienate and isolate st populations. All this can manifest in decreased consumption by st
populations of goods that disproportionately reflect the views of mainstream society, such
as media and cultural goods.
This is consistent with traditional patterns of political support among st populations.
While st/sc populations are both thought to value their community identity more than
the Hindu majority, and while both have traditionally supported the Congress party (which
later became inc), the support for Congress was relatively stronger among st populations.
Further to this point, the various tribes were more unified than the various castes in their
support for Congress (Hoeber Rudolph and Rudolph 1980). A change from a national to a
regionalist party in these cases should then have a more pronounced affect on st populations.
4 Data and Descriptive Statistics
4.1. Data. Our analysis relies primarily on three data sets: 1. elections data from the Elec-
tion Commission of India; 2. violence data from the Uppsala Conflict Data Program (ucdp)
Georeferenced Event Dataset (ged) (Sundberg and Melander 2013; Croicu and Sundberg
2017); 3. tribal microdata from the 44th Round of India’s National Sample Survey (nss).
The elections data includes information on the party identity and party type (national,
state, unrecognized, independent) of all candidates contesting a state assembly constituency,
as well as their respective vote shares. It covers all state assembly elections that have taken
place since elections were first held in India in 1951.
To our knowledge, the ucdp is the most comprehensive database on political violence
in India, compiling information for 1989 onwards from a range of sources. Primary sources
include army and police on the ground, while secondary sources include media outlets such as
13
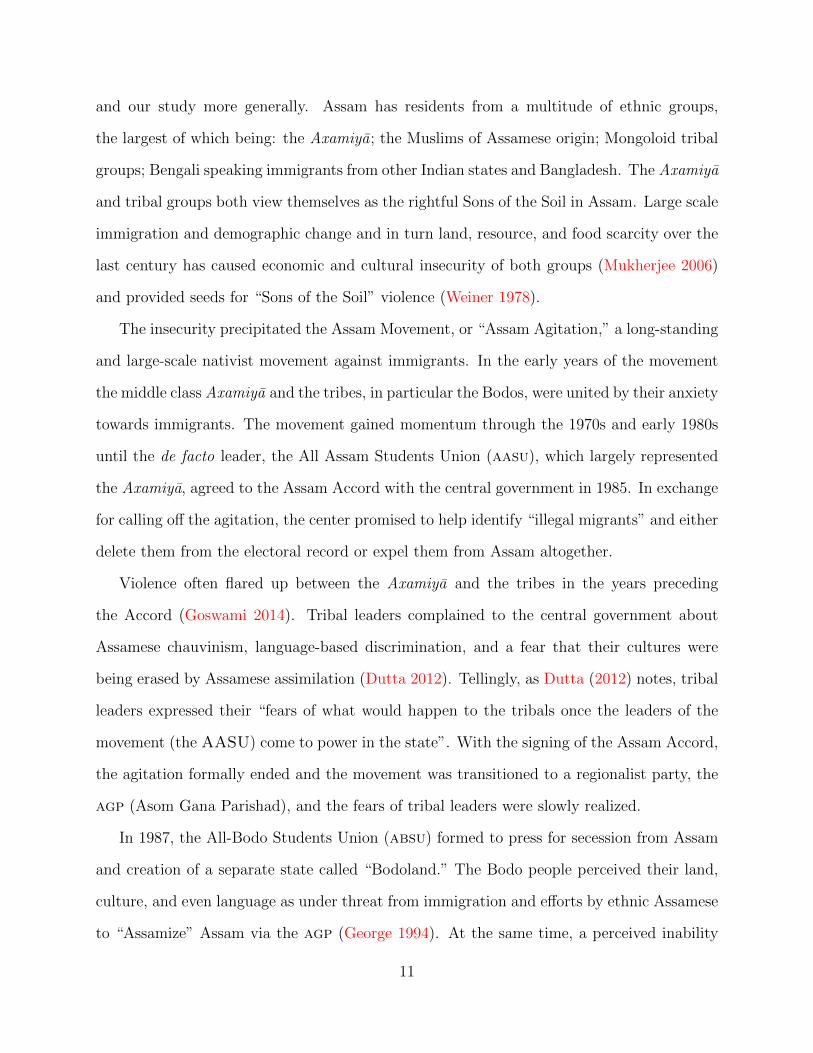
Figure 1: Word cloud of description of violent events in UCDP’s data on India.
the Associated Press and the bbc as well as more local media, and other violence databases
such as the South Asian Terrorism Portal (satp). The ucdp data includes the source, the
precise date and location (latitude and longtitude) of the violence, whether it is one- or
two-sided, as well as the number of casualties, which provides a measure of the severity. It
also includes information on who was involved, state armed actors such as the state police
or military, non-state armed actors including radical arms of secessionist movements, or
civilians. Figure 1 presents a word cloud generated from the brief descriptions of violent
events in the UCDP data.9 The word cloud clearly confirms the political nature of the
violence we observe in the data.
Our baseline dataset merges the elections and political violence datasets. Our baseline
9These descriptions, which are included for some but not all events, are typically created from NGOreports and newspaper headlines for the articles that comprise the secondary source for much of the UCDPdata.
14

estimation sample runs from 1988 to 2012. It covers 144 statewide elections across 30 states,
an average of 4.8 per state.
The 44th Round was the first ever enquiry by the nss into living conditions of tribal
populations. The sampling design specifically targets populations recognized by Article
342 of the Constitution of India as a Scheduled Tribe (st) of their respective State (or
Union Territory). Our analysis focuses on Schedules 29.1 (Level of Living of Tribals) and
29.2 (Economic Activity of the Tribals), which possess detailed household and individual
information on the living conditions and activities of households and individuals. We briefly
discuss the design here, focusing on the rural area design because the urban design was similar
and because the urban sample is less than 10 percent of the 31000 households surveyed.
Each state is partitioned administrative districts or subdistricts on the basis of st pop-
ulation. Districts or subdistricts with large st populations are allocated to one stratum.
Small st-population districts or subdistricts are allocated to another. Two types of random
samples were generated, a general sample that selected villages on the basis of state rural
population and a special sample that selected villages on the basis of the st population. The
selected villages were further partitioned into hamlets, where hamlets were selected either
at random or by their st-population depending on whether the village population was dis-
tributed uniformly or not. st-households were then identified and then selected at random
for participation. There were four subrounds of interviews that took place between July
1988 and June 1989.
4.2. Regionalist Party Measurement. Our definition of a regionalist party in Section 3.2
is impractical from an analytical standpoint, as it would involve locating and interpreting
thousands of party platforms over many election years and in several languages. Further to
this point, there is a great deal of subjectivity relating to what constitutes a regional issue.
With this in mind, we define a regionalist party more specifically as one that satisfies:
RP1. Official recognition as a State party by the Election Commission of India;
15
RP2. Electoral support for party is highly concentrated geographically.
RP1 rules out National parties, independent candidates, and small unrecognized parties
that run for idiosyncratic reasons.10 (RP2) is to restrict our set of regionalist parties to
ones “that compete and win votes in only one region of the country” (Brancati 2006).
To operationalize this definition, we follow Ziegfeld (2016) in constructing a measure of
geographic vote concentration at the level of the party (RP2). Our concentration measure is
effectively a Herfindahl Index of how concentrated a party’s total vote is across India’s states,
adjusted for differences in state population. The formal description of our concentration
measure is in Online Appendix Section OA.1.
Figures 3(a) and 3(b) plot concentration distributions for State and National Parties in
our sample. Support for National parties is spread across many states. Support for several
State parties is also spread across many states, suggesting that these parties are not truly
regionalist in nature. One prominent example of this is the Bahujan Samaj Party (bsp), an
ethnic party which appeals to sc as well as st persons and Other Backwards Castes across
India, and which had State party status for many years, but has National status currently.
To keep truly regionalist parties in our set, our definition only includes State parties with
concentration greater than 0.5.
Our definition allows regionalist parties to obtain votes in more than one state. We allow
for this possibility because several regionalist parties transcend state boundaries. This is
the case in the Northeast for example. India’s eight Northeast states were all part of one,
“Assam”, until the 1970s. While the division into several smaller states was meant to ease
tensions, some ethnic groups straddle the new borders, and regionalist parties run in multiple
states in this area.11
10In many ways RP1 by itself is a useful starting point for categorizing a party as regional. In OnlineAppendix Table OA7, we check the robustness of our main results to using RP1 alone for defining aregionalist party. However, we do not use this as our main definition because many State parties havenational ambition and run on positions with broader appeal, but have simply failed to win enough seats orobtain enough of the popular vote.
11This method of dividing Indian states is notable in comparison to the partitioning during the “Scramble
16

17Figure 2: Regionalist Party Success and Political Violence.
(a) Concentration for State Parties
(b) Concentration for National Parties
1 We use Figures (a) and (b) to identify political parties that accord with our regionalistparty definition (formal recognition as a State party by the Election Commission ofIndia + geographically concentrated support).
2 Figures (a) and (b) plot herfindal indexes for formally recognized State and Nationalparties respectively. Index measures geographic concentration of a party’s total voteacross India’s states after adjusting for population differences across states.
3 An index of 1 indicates that the party’s total vote is concentrated in one state. Anindex of 0 indicates that it is spread across all states.
4 A regionalist party in our data has an index above 0.5.
18
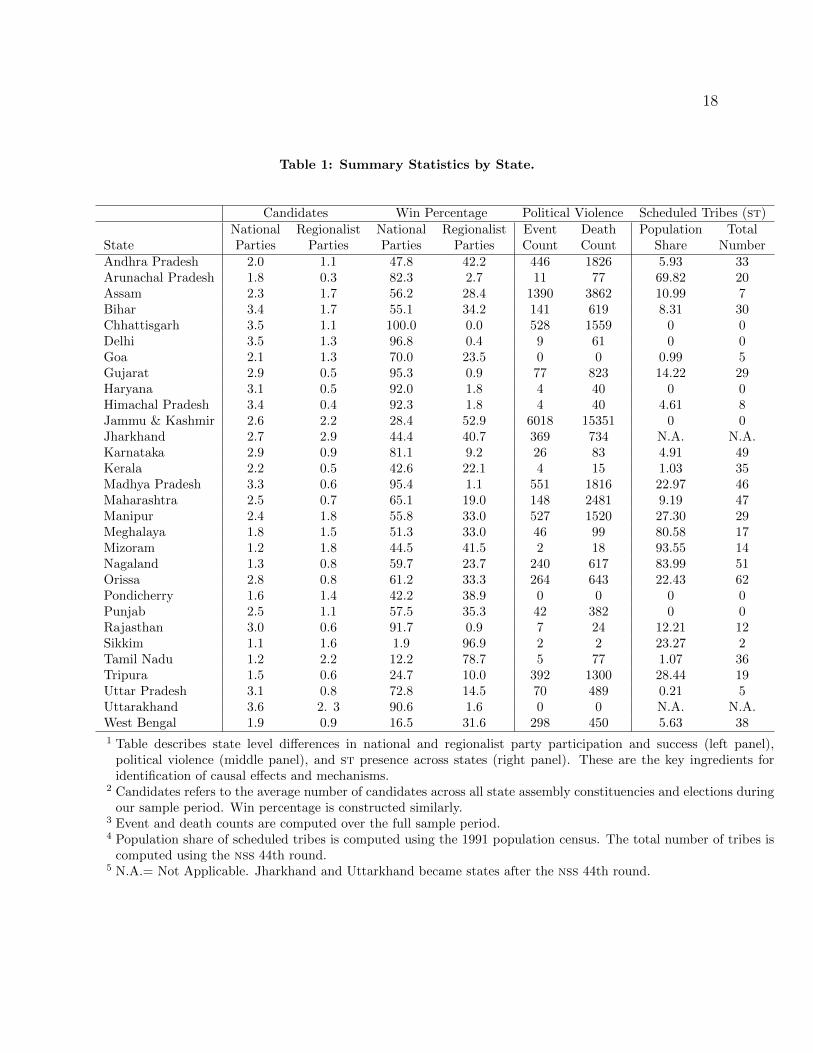
Table 1: Summary Statistics by State.
Candidates Win Percentage Political Violence Scheduled Tribes (st)National Regionalist National Regionalist Event Death Population Total
State Parties Parties Parties Parties Count Count Share NumberAndhra Pradesh 2.0 1.1 47.8 42.2 446 1826 5.93 33Arunachal Pradesh 1.8 0.3 82.3 2.7 11 77 69.82 20Assam 2.3 1.7 56.2 28.4 1390 3862 10.99 7Bihar 3.4 1.7 55.1 34.2 141 619 8.31 30Chhattisgarh 3.5 1.1 100.0 0.0 528 1559 0 0Delhi 3.5 1.3 96.8 0.4 9 61 0 0Goa 2.1 1.3 70.0 23.5 0 0 0.99 5Gujarat 2.9 0.5 95.3 0.9 77 823 14.22 29Haryana 3.1 0.5 92.0 1.8 4 40 0 0Himachal Pradesh 3.4 0.4 92.3 1.8 4 40 4.61 8Jammu & Kashmir 2.6 2.2 28.4 52.9 6018 15351 0 0Jharkhand 2.7 2.9 44.4 40.7 369 734 N.A. N.A.Karnataka 2.9 0.9 81.1 9.2 26 83 4.91 49Kerala 2.2 0.5 42.6 22.1 4 15 1.03 35Madhya Pradesh 3.3 0.6 95.4 1.1 551 1816 22.97 46Maharashtra 2.5 0.7 65.1 19.0 148 2481 9.19 47Manipur 2.4 1.8 55.8 33.0 527 1520 27.30 29Meghalaya 1.8 1.5 51.3 33.0 46 99 80.58 17Mizoram 1.2 1.8 44.5 41.5 2 18 93.55 14Nagaland 1.3 0.8 59.7 23.7 240 617 83.99 51Orissa 2.8 0.8 61.2 33.3 264 643 22.43 62Pondicherry 1.6 1.4 42.2 38.9 0 0 0 0Punjab 2.5 1.1 57.5 35.3 42 382 0 0Rajasthan 3.0 0.6 91.7 0.9 7 24 12.21 12Sikkim 1.1 1.6 1.9 96.9 2 2 23.27 2Tamil Nadu 1.2 2.2 12.2 78.7 5 77 1.07 36Tripura 1.5 0.6 24.7 10.0 392 1300 28.44 19Uttar Pradesh 3.1 0.8 72.8 14.5 70 489 0.21 5Uttarakhand 3.6 2. 3 90.6 1.6 0 0 N.A. N.A.West Bengal 1.9 0.9 16.5 31.6 298 450 5.63 381 Table describes state level differences in national and regionalist party participation and success (left panel),
political violence (middle panel), and st presence across states (right panel). These are the key ingredients foridentification of causal effects and mechanisms.
2 Candidates refers to the average number of candidates across all state assembly constituencies and elections duringour sample period. Win percentage is constructed similarly.
3 Event and death counts are computed over the full sample period.4 Population share of scheduled tribes is computed using the 1991 population census. The total number of tribes is
computed using the nss 44th round.5 N.A.= Not Applicable. Jharkhand and Uttarkhand became states after the nss 44th round.
4.3. Descriptive Statistics A state-by-state summary of the various data sets is provided
in Table 1. The leftmost columns shows significant across-state variation in national and
regionalist party entry and success across states. Many states have at least one regionalist
party candidate contesting each constituency. Regionalists win seats a non-negligible frac-
tion of the time. The middle columns show significant across-state variation in the number
of events and deaths due to political violence, as most states experience some political vio-
lence, and a few experience large amounts of violence. The rightmost columns show there
are hundreds of unique tribes spread across India. Many of the states with a large st popu-
lation share are located in the Northeast: Arunachal Pradesh, Assam, Manipur, Meghalaya,
Mizoram, Nagaland, Sikkim, and Tripura. Several other states have large absolute numbers
of st persons even though their population share seems moderate to small. These states
form what is known as the tribal belt of India: Andhra Pradesh, Chhattisgarh, Gujarat,
Jharkhand, Madhya Pradesh, Maharashtra, Orissa, Rajasthan, and West Bengal.
st-persons have struggled to adjust to the trends of economic development, conservation
practices, and interstate and international migration that have characterized India’s post-
independence period. The trends have created insecurity over the land and resources that
have provided the tribes with their livelihoods for thousands of years. As they have become
more insecure economically, they have begun to participate in militant political movements.
In some cases the tribals join existing violent movements that were not inherently tribal to
begin with, i.e., Naxalites in Central and Eastern states (the ideology and politics of the
Naxals fits with the grievances of the tribal communities) and in other cases they start their
own, i.e., Bodos and Dimasa in Northeast India. The demands of these groups range from a
more equal share in resource wealth/even distribution of land, to secessionism.
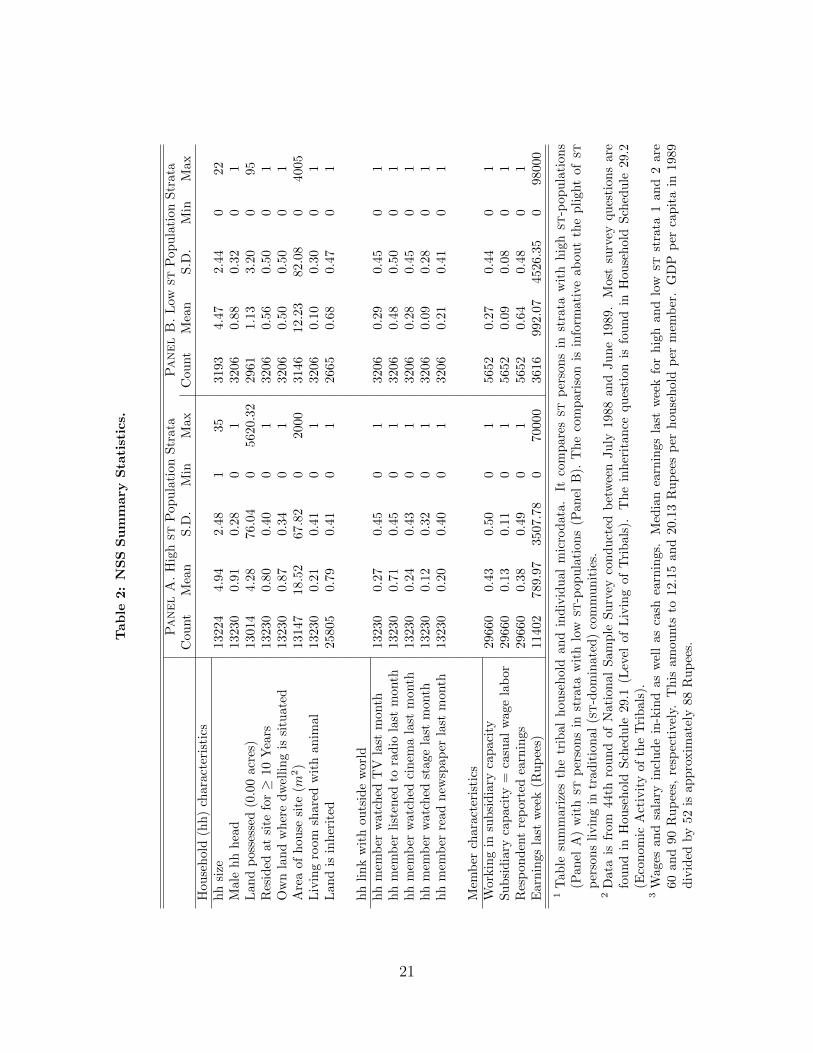
Table 2 uses the nss survey to give perspective on their plight. Panel A reports statistics
for st persons in strata with high st-populations. Panel B does the same for st persons in
for Africa,” which left many ethnic groups on different sides of border lines in Africa. Michalopoulos andPapaioannou (2016) show that political violence today is more likely in the homelands of these split groupsin Africa.
19

strata with low st-populations.
The household characteristics in Panel A show 4.94 persons possess a 4.28 acre plot and
live in a 18.52 square meter house. 20 percent of households share this space with livestock.
The land is inherited 79 percent of the time. 80 percent of households have lived at the
same spot for at least 10 years. The statistics paint a picture of a community living in close
quarters with significant attachment to their land.
Panel A also shows that in 27 percent of households a household member watched tele-
vision in the last month, 24 percent went to the cinema, 12 percent went to theatre, and 20
percent read the newspaper. 71 percent listened to the radio in the last month.
43 percent of households report working in some sort of subsidiary capacity over the last
365 days. 13 percent of respondents who reported working in a subsidiary capacity said that
they were a causal wage laborer. Average cash and in-kind wages and salary last week among
respondents was 790 Rupees, or approximately 160 per capita. The earnings distribution
is highly skewed. The median cash and in-kind wages and salary last week was 70 Rupees.
The top household took home 70000 Rupees last week.
Panel B shows st populations outside st-heavy strata possess 3 fewer acres and live in a
house with approximately 6 fewer square meters. They are 37 percentage points less likely to
own the land and 24 percentages points less likely to live at the same spot for more than 10
years. They are far less reliant on radio for information. They earn more than 200 Rupees
more than their counterparts who live in st-heavy strata.
In Online Appendix Table OA1 we consider a different benchmark for evaluating the
socio-economic status of st persons. Using 1991 population census and forest data cover
from SHRUG, we compare villages with high st and sc populations. Most of the st/sc
village differences are intuitive. For example, st villages have more people, less educated
populations, fewer paved roads entering the village, and more forest cover.12
12While st villages have lower education levels on average, they have greater literacy rates than their sccounterparts. This is perhaps because they have greater literacy in their tribal language.
20
Tab
le2:
NS
SS
um
mary
Sta
tist
ics.
PanelA.
Hig
hst
Pop
ula
tion
Str
ata
PanelB.
Low
stP
op
ula
tion
Str
ata
Cou
nt
Mea
nS
.D.
Min
Max
Cou
nt
Mea
nS
.D.
Min
Max
Hou
seh
old
(hh
)ch
arac
teri
stic
sh
hsi
ze13224
4.9
42.4
81
35
3193
4.4
72.4
40
22
Mal
eh
hh
ead
13230
0.9
10.2
80
13206
0.8
80.3
20
1L
and
pos
sess
ed(0
.00
acre
s)13014
4.2
876.0
40
5620.3
22961
1.1
33.2
00
95
Res
ided
atsi
tefo
r≥
10Y
ears
13230
0.8
00.4
00
13206
0.5
60.5
00
1O
wn
lan
dw
her
ed
wel
lin
gis
situ
ated
13230
0.8
70.3
40
13206
0.5
00.5
00
1A
rea
ofh
ouse
site
(m2)
13147
18.5
267.8
20
2000
3146
12.2
382.0
80
4005
Liv
ing
room
shar
edw
ith
anim
al13230
0.2
10.4
10
13206
0.1
00.3
00
1L
and
isin
her
ited
25805
0.7
90.4
10
12665
0.6
80.4
70
1
hh
lin
kw
ith
outs
ide
wor
ldh
hm
emb
erw
atch
edT
Vla
stm
onth
13230
0.2
70.4
50
13206
0.2
90.4
50
1h
hm
emb
erli
sten
edto
rad
iola
stm
onth
13230
0.7
10.4
50
13206
0.4
80.5
00
1h
hm
emb
erw
atch
edci
nem
ala
stm
onth
13230
0.2
40.4
30
13206
0.2
80.4
50
1h
hm
emb
erw
atch
edst
age
last
mon
th13230
0.1
20.3
20
13206
0.0
90.2
80
1h
hm
emb
erre
adn
ewsp
aper
last
mon
th13230
0.2
00.4
00
13206
0.2
10.4
10
1
Mem
ber
char
acte
rist
ics
Wor
kin
gin
sub
sid
iary
cap
acit
y29660
0.4
30.5
00
15652
0.2
70.4
40
1S
ub
sid
iary
cap
acit
y=
casu
alw
age
lab
or
29660
0.1
30.1
10
15652
0.0
90.0
80
1R
esp
ond
ent
rep
orte
dea
rnin
gs29660
0.3
80.4
90
15652
0.6
40.4
80
1E
arn
ings
last
wee
k(R
up
ees)
11402
789.9
73507.7
80
70000
3616
992.0
74526.3
50
98000
1T
able
sum
mar
izes
the
trib
alh
ouse
hold
an
din
div
idu
al
mic
rod
ata
.It
com
pare
sst
per
son
sin
stra
taw
ith
hig
hst
-pop
ula
tion
s(P
anel
A)
wit
hst
per
son
sin
stra
taw
ith
low
st-p
op
ula
tion
s(P
an
elB
).T
he
com
pari
son
isin
form
ati
veab
ou
tth
ep
light
ofst
per
son
sli
vin
gin
trad
itio
nal
(st
-dom
inate
d)
com
mu
nit
ies.
2D
ata
isfr
om44
thro
un
dof
Nat
ion
al
Sam
ple
Su
rvey
con
du
cted
bet
wee
nJuly
1988
an
dJu
ne
1989.
Most
surv
eyqu
esti
on
sare
fou
nd
inH
ouse
hol
dS
ched
ule
29.1
(Lev
elof
Liv
ing
of
Tri
bals
).T
he
inh
erit
an
cequ
esti
on
isfo
un
din
Hou
seh
old
Sch
edu
le29.2
(Eco
nom
icA
ctiv
ity
ofth
eT
rib
als)
.3
Wag
esan
dsa
lary
incl
ud
ein
-kin
das
wel
las
cash
earn
ings.
Med
ian
earn
ings
last
wee
kfo
rh
igh
an
dlo
wst
stra
ta1
an
d2
are
60an
d90
Ru
pee
s,re
spec
tive
ly.
Th
isam
ou
nts
to12.1
5an
d20.1
3R
up
ees
per
hou
seh
old
per
mem
ber
.G
DP
per
cap
ita
in1989
div
ided
by
52is
app
roxim
atel
y88
Ru
pee
s.
21
5 Baseline Analysis
Let ∆sj denote the difference between the vote shares of the most successful regionalist
and non-regionalist party candidates in state assembly constituency j. Let Rj be a binary
variable that equals 1 when the constituency was won by a regionalist, ∆sj > 0, and equals
0 when the constituency was won by a non-regionalist, ∆sj < 0. Let Vj(Rj) denote violence
in constituency j under regime Rj. Our interest is in the treatment effect at the cutoff
E[Vj(1)− Vj(0)|∆sj = 0]
where E is the expectation operator. We assume E[Vj(1)|∆sj = 0] and E[Vj(0)|∆sj = 0] are
continuous at 0 (Hahn, Todd, and Van der Klaauw 2001).
Continuity implies the treatment effect is identified by
limx→+0
E[Vj|∆sj = x]− limx→−0
E[Vj|∆sj = x]
where x is a realization of ∆sj, Vj is the observed level of violence, and + and − indicate
whether x approaches 0 from above or below. Continuity will hold if political elites have
imprecise control over the constituency winner (Cattaneo, Idrobo, and Titiunik 2019a; Lee
1998), that is, when a close win by a regionalist party candidate can be attributed to idiosyn-
cratic factors unrelated to future political violence. While the assumption is plausible given
India’s reputation for being a relatively well-functioning democracy and how difficult it is to
control elections precisely, we will examine the assumption later via tests for discontinuities
in the constituency density and observable imbalance around the threshold of 0.
We exploit variation across constituencies, states s, and elections e (years).13 We estimate
Vjse = α + βRjse + f−(∆sjse − 0) + f+(∆sjse − 0)Rjse + εjse
13Election years are specific to the state, as states have elections at different times.
22
via weighted least squares with a triangular kernel, where β measures the effect of electing a
regional rather than a non-regional party representative on political violence, f−(·) and f+(·)
are linear polynomials that differ to the left and right of cutoff. εjse is a random variable that
reflects unobserved differences in violence. We use bandwidths that are optimal relative to
the mean square error (MSE) criterion (Cattaneo, Idrobo, and Titiunik 2019a). For inference
we use bandwidths that are clustered at the level of the constituency.
Our baseline analysis considers four different violence measures: (i) binary indicator of
whether a violent event occurred in constituency j between election e and e+1; (ii) logarithm
of the total number of events occurring during this time; (iii) binary indicator of whether a
death occurred; (iv) logarithm of the total number of deaths. We use logarithms for the total
number of events and deaths to deal with the large spread and outliers in these variables
across constituencies. We add 1 to all observations before taking logs.
In Figure 3 we preview our baseline result. The outcome is binary, whether an incident
of political violence occurred in the constituency. The x-axis plots the difference between
the vote share of the highest ranked regionalist party and the highest ranked non-regionalist
party. There is a sharp increase in the incidence of violence when the difference in share
crosses the 0 threshold. In the Online Appendix we show that the sharp increase presents
itself when we use the larger mse-optimal bandwidth from our baseline specification (Figure
OA2) as well as when we use a second-order polynomial with the polynomial-adjusted mse-
optimal bandwidth (Figure OA3).
The online appendix also depicts the violence-margin gradient over the full support for
the vote margin distribution (Figure OA4). The figure shows that violence is generally
decreasing in the vote margin as one moves away from the cutoff in either direction. A
negative violence-margin gradient is unsurprising because we expect more violence in tight
elections and less violence whenever a regionalist or non-regionalist party won by a significant
margin, for example because large margins reduce uncertainty about the electoral support for
the winner and their appetite for consolidating their ethnic base via ethnic violence in turn.
23
The figure also shows that violence peaks a bit left of the cutoff. A leftward peak would
be consistent with an increased (relative) propensity of regionalist supporters to engage
in violence in constituencies where their most preferred regionalist candidate loses. Their
increased propensity for violence following a defeat leads to a leftward peak and ultimately
to the negative slopes that are local to the cutoff in many of our rd plots (Figures OA2 and
OA3 below and Figure 3).
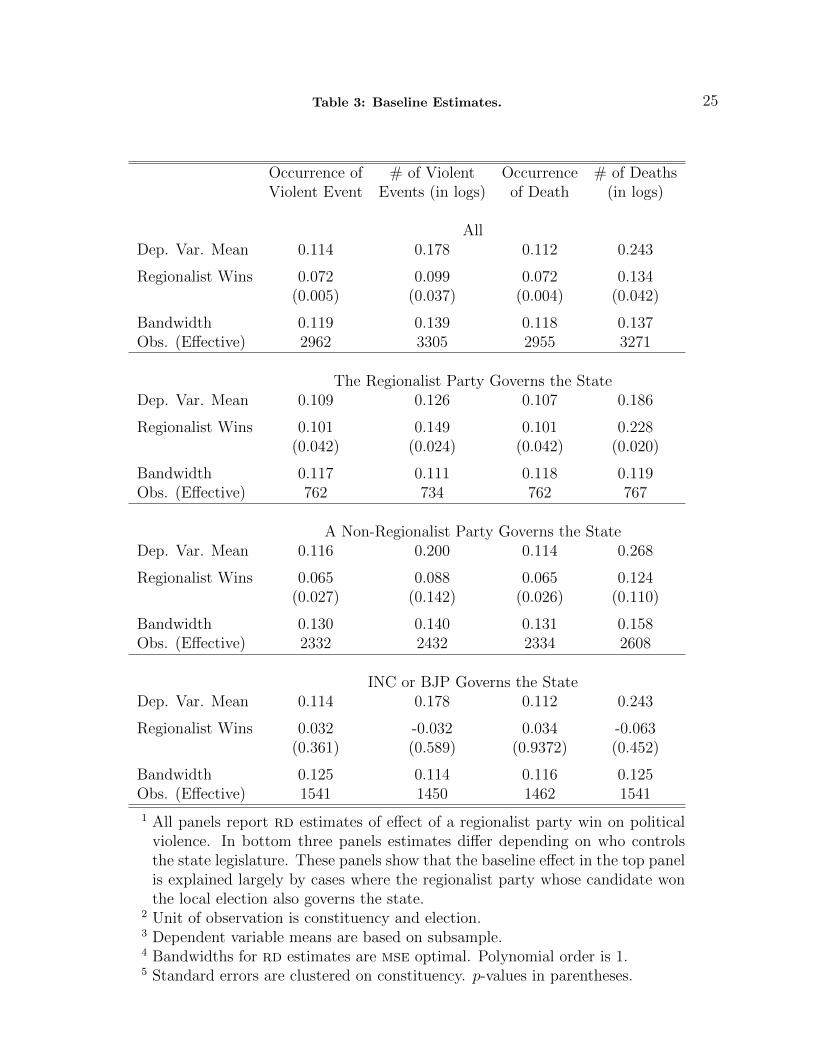
5.1. Baseline Estimates. Our baseline estimates are found in the top panel of Table 3.
Electing a regionalist party representative increases the occurrence of a violent event by 7.2
percentage points and the number of violent events by almost 10 percent. It increases the
occurrence of a death by 7.2 percentage points and the number of deaths dues to politi-
cal violence by 13.4 percent. The estimates are significant statistically and substantively,
explaining well over half of the dependent variable means in the latter case.
In the bottom three panels of Table 3 we let the estimates differ depending on who con-
trols the state legislature.14 The second panel shows that when the regionalist party controls
the state government, the election of one of their representatives increases the occurrence of
a violent event and death in the constituency by 10 percentage points and the number of
events and deaths in the constituency by 15 and 23 percent respectively. The estimates are
all statistically significant at the 5% level. The third panel shows smaller effects when a non-
regionalist party governs the state, with the estimates in Columns 2 and 4 being statistically
insignificant. The fourth panel shows even smaller effects when the state is governed by a
major National party like the inc or bjp, with all four estimates being statistically insignif-
icant at conventional significance levels. The bottom three panels show therefore that the
main effect in the top panel is largely explained by cases where the regionalist party whose
candidate won the local election also governs the state.
The bottom three panels of Table 3 are informative about which areas of India and
which political parties generate our baseline estimates. During our sample period, a region-
14The associated rd plots for the 4 panels can be found in Figure OA5 of the online appendix.
24
25Table 3: Baseline Estimates.
Occurrence of # of Violent Occurrence # of DeathsViolent Event Events (in logs) of Death (in logs)
AllDep. Var. Mean 0.114 0.178 0.112 0.243
Regionalist Wins 0.072 0.099 0.072 0.134(0.005) (0.037) (0.004) (0.042)
Bandwidth 0.119 0.139 0.118 0.137Obs. (Effective) 2962 3305 2955 3271
The Regionalist Party Governs the StateDep. Var. Mean 0.109 0.126 0.107 0.186
Regionalist Wins 0.101 0.149 0.101 0.228(0.042) (0.024) (0.042) (0.020)
Bandwidth 0.117 0.111 0.118 0.119Obs. (Effective) 762 734 762 767
A Non-Regionalist Party Governs the StateDep. Var. Mean 0.116 0.200 0.114 0.268
Regionalist Wins 0.065 0.088 0.065 0.124(0.027) (0.142) (0.026) (0.110)
Bandwidth 0.130 0.140 0.131 0.158Obs. (Effective) 2332 2432 2334 2608
INC or BJP Governs the StateDep. Var. Mean 0.114 0.178 0.112 0.243
Regionalist Wins 0.032 -0.032 0.034 -0.063(0.361) (0.589) (0.9372) (0.452)
Bandwidth 0.125 0.114 0.116 0.125Obs. (Effective) 1541 1450 1462 1541
1 All panels report rd estimates of effect of a regionalist party win on politicalviolence. In bottom three panels estimates differ depending on who controlsthe state legislature. These panels show that the baseline effect in the top panelis explained largely by cases where the regionalist party whose candidate wonthe local election also governs the state.
2 Unit of observation is constituency and election.3 Dependent variable means are based on subsample.4 Bandwidths for rd estimates are mse optimal. Polynomial order is 1.5 Standard errors are clustered on constituency. p-values in parentheses.
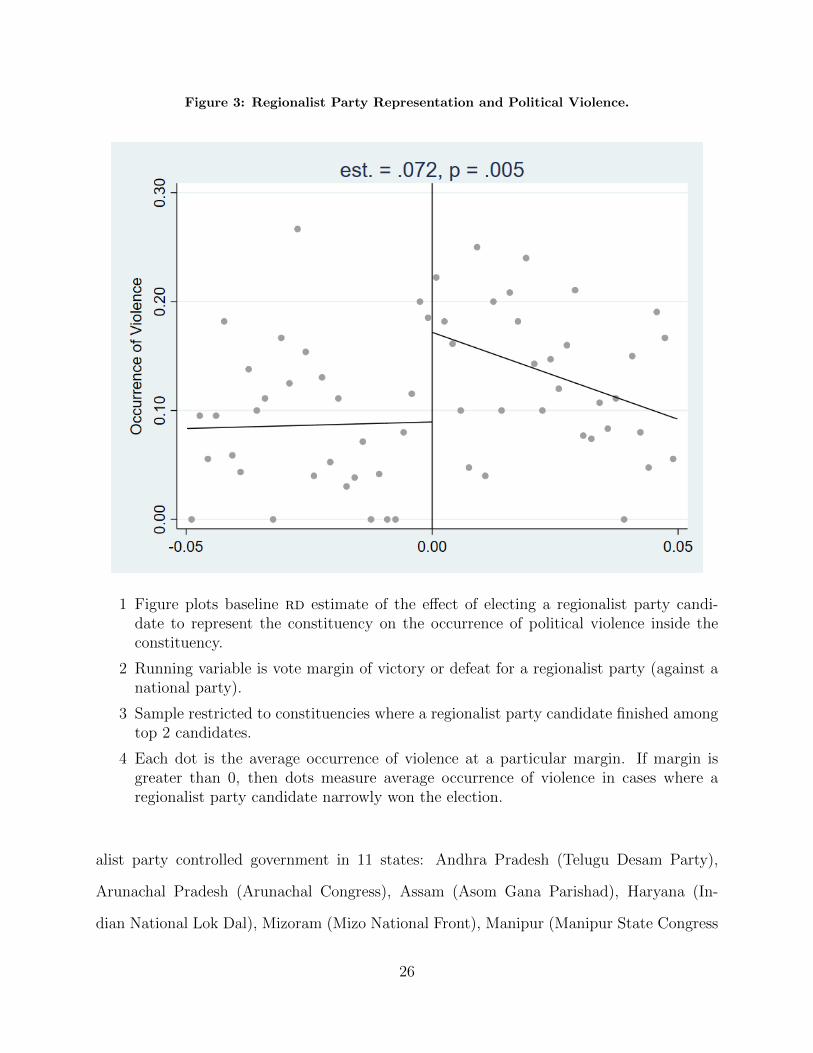
Figure 3: Regionalist Party Representation and Political Violence.
1 Figure plots baseline rd estimate of the effect of electing a regionalist party candi-date to represent the constituency on the occurrence of political violence inside theconstituency.
2 Running variable is vote margin of victory or defeat for a regionalist party (against anational party).
3 Sample restricted to constituencies where a regionalist party candidate finished amongtop 2 candidates.
4 Each dot is the average occurrence of violence at a particular margin. If margin isgreater than 0, then dots measure average occurrence of violence in cases where aregionalist party candidate narrowly won the election.
alist party controlled government in 11 states: Andhra Pradesh (Telugu Desam Party),
Arunachal Pradesh (Arunachal Congress), Assam (Asom Gana Parishad), Haryana (In-
dian National Lok Dal), Mizoram (Mizo National Front), Manipur (Manipur State Congress
26
Party), Nagaland (Naga People’s Front), Orissa (Biju Janata Dal), Punjab (Shiromani Akali
Dal), Sikkim (Sikkim Democratic Front and Sikkim Sangram Parishad), and Tamil Nadu
(admk and dmk). Of these states, political violence is relatively uncommon in Haryana
and Tamil Nadu (an event occurs in about 1% of cases) and relatively common in Andhra
Pradesh, Assam, Manipur, Nagaland, and Orissa (an event occurs in over 10% of cases).
The distribution of political violence across states suggests that our baseline estimates can
be further isolated to the latter group of states and their regionalist parties. Note that the
latter group consists of states with a significant tribal population.
As is the case in all rd studies which exploit close elections, our effects are “local” in
the sense that they are identified from variation generated by relatively competitive elec-
tions only. We can not make causal claims about, for example, landslide wins by regional
parties. Our estimates are also local in the sense that they are obtained from the subset of
constituencies where a regionalist candidate was one (and only one) of the top two in terms
of vote share. While this is the nature of the rd design (studies that examine the effect of
electing a female politician relative to a male one for example, also have this feature), more
than 25% of the constituencies in our baseline sample have a regionalist and non regionalist
candidate in the top two. Moreover the presence (or absence) of a regionalist party is a
permanent feature at the state level in most cases. States that have a large local ethnno-
linguistic majority, i.e., Assam, Andhra Pradesh, Tamil Nadu, Punjab, and the states of
India’s Northeast also tend to have successful regionalist parties that widely contest, and
states that do not, i.e., Uttar Pradesh, Madhya Pradesh, Bihar, do not. Then the sample
restrictions effectively amounts to selecting states that tend to have a permanent (over the
horizon of our sample) regionalist party presence, which are the units of interest for this type
of study in any case.
The estimates align with the idea that when regionalist parties, who tend to organize
around the identity of local ethnic majorities, control resources and key institutions in the
state (including police and security forces), electing a regionalist candidate can cause a
27
significant increase in violence in the constituency of the candidate. We investigate this
possibility further in the next section.
In Online Appendix Section OA.3 we borrow elements of the framework developed by
Bueno de Mesquita (2013) to show that our findings can be generated by a simple rational
agent model. In the model, a regionalist political party competes with a national party,
which is constrained to treat all groups equally, in local elections. Given the choices of
the parties, citizen members of the local minority ethnic group (tribes) choose to mobilize
for political violence or to participate in the political system. Then, given the decisions of
parties and citizens, insurgent elites mount insurgent violence or not. The model generates
our baseline results, that regionalist party wins result in insurgent violence, and that the
effect is larger in constituencies with large local minority populations.
5.2. Falsification. Guided by Cattaneo et al. (2019b), we conduct a battery of falsifica-
tion tests for the rd design, searching in particular for evidence of manipulation around
the threshold. A standard concern when exploiting close-elections in an rd setting is that
parties or candidates can manipulate the side of the threshold on which the candidate falls
in a close-election. Recent work by Crot et al. (Forthcoming) shows that incumbent mayors
in Philippines were substantially more likely to win close elections than challengers, and that
the electoral fraud that underlies this outcome is an important reason for the post-election
violence that is observed in the data. While India’s electoral commission is a trusted indepen-
dent institution, it is possible that incumbents or challengers manipulate outcomes by buying
votes with money and goods or strong arming voters before they enter the voting booth.
This is a concern for identification if regionalist and national parties differ systematically in
their ability to manipulate elections.
If this were the case, we would observe a discontinuity in the density of the running
variable around the threshold. If regionalist parties could systematically manipulate close-
election outcomes, for example, we would observe a sharp increase in mass just to the right
of the threshold. Figure 4 uses local polynomial techniques (Cattaneo et al. 2017; McCrary
28

Figure 4: Discontinuity in Density Test.
1 Figure illustrates identification test for our rd design. Discontinuity-in-density teststatistic and p-value are 0.0343 and 0.9727 respectively. We cannot reject null hypoth-esis that density is continuous at cutoff.
2 Running variable is vote margin of victory or defeat for a regionalist party (against anational party).
3 Sample restricted to constituencies where a regionalist party candidate finished amongtop 2 candidates.
4 Density uses a first-order polynomal for density estimation and a second-order poly-nomial for bias-correction estimate (see CJM (2017)).
2008) to explicitly test for this type of discontinuity.
Online Appendix Figures OA6, OA7, and OA8 depict the effects of regionalist represen-
tation on various predetermined covariates. Figure OA6 depicts the effect on lagged violence.
29
Figure OA7 does the same but for voter turnout, the number of candidates, as well as lagged
polarization and fractionalization measures that use lagged vote shares and that is inspired
by Montalvo and Reynal-Querol (2005), Reynal-Querol (2002), Esteban and Ray (1994), and
Esteban and Ray (1999). Figure OA8 depicts the effect for the vote share of the regionalist
party. Most tests support the null hypothesis of no manipulation around the threshold. We
do observe some weak imbalance in one variable, the lagged occurrence of violence. This is
perhaps not surprising as this variable is highly persistent and has less over time and within
constituency variation than the others. Nonetheless, the discontinuity raises concerns about
reverse causality, namely the possibility that political leaders were using violence to mobi-
lize co-ethnics and consolidate support in the period leading up to an election (Wilkinson
2004). We acknowledge the possibility of some link between pre-election violence, electoral
outcomes, and post-election violence. Simply, some constituencies where there were close
regionalist wins and post election violence will have also experienced pre-election violence.
Accordingly, we provide an extensive discussion and a battery of empirical tests in the on-
line appendix which make clear that our results can not be explained away by a reverse
relationship between political violence and electoral outcomes.
5.3. Robustness. We checked robustness of the estimates to variants of our baseline speci-
fication. Figure OA9 and Figure OA10 show estimates for the occurrences of violent events
and death are robust across a wide range of bandwidth choices and polynomial orders of 0,
1, 2.15 The figures also show the number of violent events and deaths are a bit more sensitive
to bandwidth and polynomial choice, most probably because of the significant measurement
error that is typically associated with counts of violence and deaths. Figure OA11 plots the
density for rd estimates at fake cutoffs of -0.130,-0.125,...,0.125,0.130, showing estimates at
the true cutoff are extreme relative to the mean of the estimates at the fake cutoffs. Table
OA6 shows how are baseline estimates change when we include fixed effects for the year,
15We checked polynomial orders of less than or equal 2 at the recommendation of Gelman and Imbens(2018), who argue against the use of higher-order polynomials in rd designs.
30

to adjust for the pooled nature of data, and thus for the possibility that our estimates are
driven by periods of intense violence across India.
One concern with the violence data relates to the effects of regionalist representation on
violence reporting. Figure OA12 uses information on who initially reported the violence to
evaluate whether regionalist party representatives increase or decrease the ratio of the number
of events initially reported by police sources to the number of reports by other sources, such as
the army or other organizations. The reason we consider reports by police sources specifically
is that these forces are the ones most likely to be manipulated by regionalist candidates - as
we noted above, police forces are controlled by the states. The table shows the election of a
regionalist party representative decreases the ratio of police reported violence, but that the
estimates are insignificant statistically. This suggests that our estimates reflect the effects of
regionalist representation on violence rather than their effects on the reporting of violence.
5.4. Spillovers mla’s are not elected in isolation. States are comprised by many constituen-
cies, simultaneously selecting mlas to office to serve concurrent terms. Above, we identified
that on average, constituencies that elect a regionalist party candidate experience more vio-
lence than ones that elect a candidate from a national party. In this section, we exploit the
structure of political administration in India to study how local the regionalist mla’s effect
on violence is, that is, whether violence spills-over from one constituency to another.
The grouping into district allows us to study whether electing more regionalist politicians
causes violence beyond the borders of elected representative.
Formally, we estimate generalized empirical specifications that utilize variation across
districts, states, and elections:
Vdse = α + βRFdse + ηdse
Vdse is a district level measure of violence, either in the district as a whole, or in a subset of
constituencies in the district, i.e., ones not held by regionalist parties. The variable RFdse
31
represents the fraction of constituencies in the district that were won by a regionalist party.
Our interest is in parameter β. As we show in Section OA.4, β is a sum of effects across
the different constituencies in the district, where the effect in each constituency itself can be
decomposed into the direct effect of electing a regionalist in that constituency, and a weighted
average of indirect effects of regionalists in other constituencies. So in the case where Vdse
represents total violence in constituencies in the district where a regionalist candidate was
not elected, β > 0 would tell us that violence spills over from regionalist held constituencies
to others. β < 0 tells us that electing a regionalist candidate displaces violence.
To estimate β causally, we draw on the identification strategy developed in (Clots-
Figueras 2011), 16 who proposes using the fraction of close elections in the district won by
a regionalist candidate, RCFdse, as an instrument for RFdse. RCFdse is powerfully related
to RFdse by construction, and importantly, RCFdse should be exogenous to unobservable
determinants of political violence with the appropriate controls. In our regressions, we allow
for district level controls Xdse, district level fixed effects αd and state-election year effects
αse. That is,
ηdse = XdseΓ + αd + αse + εdse. (1)
Xdse includes the fraction of close elections in the district where a regionalist finished in
the top 2 and one lag of the dependent variable. The close election fraction allows for the
possibility that a higher number of close elections may explain both violence and close elec-
tions won by a regionalist party candidate. The dependent variable lag allows for persistently
violent jurisdictions that may track regionalism in India. District fixed effects allow for un-
observed district differences that may correlate with the fraction of constituencies barely won
by regionalist party representatives and that may correlate with violence, including district
16And subsequently used by Clots-Figueras (2012), Bhalotra et al. (2014), Bhalotra and Clots-Figueras(2014), Nellis et al. (2016), and Nellis and Siddiqui (2018) among others
32

differences attributable simply to the number of constituencies. State-election year fixed
effects allow for state-specific trends that may track violence and close wins by regionalists,
relating to, for example, evolving secessionist sentiment at the state level. Our identification
assumption, then, is that conditional on observables, district effects and state-election ef-
fects, districts that experience more political violence do not have systematically more close
elections where a regionalist candidate won:
cov(RCFdse, εdse) = 0 (2)
Estimates are found in Table 4. Panel A uses the occurrence of violence as the dependent
variable. Panel B uses the number of events. Each panel reports estimates of the effect of
the regionalist party seat fraction on aggregate violence across all constituencies, violence
that took place only in constituencies held by regionalists, and violence that took place only
in constituencies held by other parties or independents. Moving left to right shows how the
primary iv estimate varies with control variables and fixed effects. Online Appendix Table
OA8 shows that the electoral covariates are balanced relative to the instrument. Online
Appendix Table OA9 shows balance with respect to lagged violence once we condition on
the close election seat fraction. Note that the mean and standard deviation of the regionalist
seat fraction are 0.21 and 0.41.
The estimates in the first and second row of each panel confirm our RD results - more
regional candidates in the district cause aggregate political violence in the district and specif-
ically in the constituencies they hold. The estimate in the top row and third column of Panel
A implies that a 5 percentage point increase in the regionalist seat fraction increases violence
by 2.3 percentage points, statistically different from 0 at the 1 percent significance level. The
estimate is substantively significant as well, representing approximately 10.9 percent of the
mean occurrence of 21.1%.
33

34
Table 4: IV Estimates of Aggregate and Spillover Effects.
Panel A.Occurence of Violence
All ConstituenciesRegionalist Seat Fraction 0.615 0.508 0.459
(0.000) (0.004) (0.002)
Regionalist ConstituenciesRegionalist Seat Fraction 0.665 0.644 0.533
(0.000) (0.000) (0.004)
Non-Regionalist ConstituenciesRegionalist Seat Fraction 0.258 -0.217 -0.251
(0.001) (0.195) (0.115)
Panel B.Number of Violent
Events (in logs)
All ConstituenciesRegionalist Seat Fraction 1.111 0.706 0.562
(0.000) (0.021) (0.045)
Regionalist ConstituenciesRegionalist Seat Fraction 0.563 0.549 0.345
(0.000) (0.000) (0.031)
Non-Regionalist ConstituenciesRegionalist Seat Fraction 0.219 -0.352 -0.263
(0.003) (0.030) (0.074)
First Stage Coefficient 1.695 1.191 1.082F -Test of Excluded 388.14 82.63 70.33Instrument (0.000) (0.000) (0.000)Degrees of Freedom F (1, 551) F (1, 539) F (1, 512)Controls N Y YFixed Effects N N YObservations 2705 2153 2111
1 Top row of each panel reports effects of regionalist party rep-resentation on violence across all constituencies in an admin-istrative district. Middle row reports effects on violence inconstituencies held by regionalist party. Bottom row reportseffects on violence in constituencies not held by regionalistparty. Bottom row effects measure spillovers or displacementfrom regionalist party representation.
2 Unit of observation is administrative district, state, and elec-tion.
3 Regionalist Seat Fraction is fraction of district constituenciesheld by a regionalist party. Instrument for regionalist seatfraction is fraction of close elections where a regionalist partywon the seat. Close elections are decided by no more thanthan 2.5 percentage points.
4 Controls include fraction of seats contested where the electionwas close and one lag of the dependent variable.
5 Fixed effects include district and state-election combination.6 p-values in parentheses.
The final column of the third row in each panel shows that a higher regionalist frac-
tion causes less violence in non-regionalist constituencies once controls or fixed effects are
included. While the estimate in the top panel is not signficant at conventional levels, the
estimate in the bottom panel is significant at the 10% level. So there is, if anything, some
weak evidence for displacement of violence into regionalist constituencies, and no spillover
into national constituencies.
In Online Appendix Table OA10 we report the ols counterparts to the iv estimates in
Table 4. The ols and iv estimates have the same signs but different magnitudes. The ols
estimates are less pronounced, sometimes much less so. What confounds the ols estimates?
One natural candidate is lagged violence. In regionalist-held districts, lagged violence may
correlate positively with both contemporaneous violence and regionalist party seat fraction.
In districts not held by regionalist parties, lagged violence may correlate positively with
contemporaneous violence but negatively with regionalist party seat fraction. Both patterns
would fit with the regionalist versus national party differences generally observed in the data.
6 Tribal Insecurity
We hypothesize that violence increases when regionalists gain nominal power because they
heighten insecurity for local minorities and specifically for tribal populations. We present
two pieces of evidence supporting this narrative: rd evidence of regionalist parties increasing
violence specifically in communities with high tribal populations but no mandated represen-
tation, and iv evidence showing regionalist parties further marginalize tribal populations.
6.1. Regionalism and Tribal Insecurity. We study this possibility in Table 5, which
reports point estimates of our baseline regression applied to constituencies: i) reserved for
st-members; ii) unreserved, i.e open for anyone to contest and win; iii) unreserved with
a below-median st population; iv) unreserved with an above median st population. Note
that tribals rarely win seats in unreserved constituencies (less than 0.3 percent from 2004-
35

2015, e.g.), even though they are free to contest these seats. In this sense tribals will be
under-represented in unreserved constituencies with large tribal populations.
Panels A and B show st-reserved constituencies are generally more violent than unre-
served constituencies. A violent event occurs 16.3 percent of the time on average, almost
double that of unreserved constituencies. Despite the propensity for more violence, the ef-
fect of a regionalist representative on violence in st-reserved constituencies is substantively
smaller and imprecisely estimated relative to unreserved constituencies. In fact, the esti-
mates in unreserved constituencies are similar to our baseline full sample results in Table 3.
Panels C and D show these effects are explained entirely by unreserved constituencies with a
large st population, consistent tribal insecurity underlying the additional violence generated
by regionalist parties.
Violence as a result of tribal insecurity could manifest in different ways. The violence
could be targeted towards the state, as groups express their demands with violent attacks
against government forces. Or the violence could target other ethnic groups, as groups resolve
conflicts over land and resources, for example, using violent means. We investigate both
possibilities in Online Appendix Table OA11 Panel A, where we sort violent events on the
basis of combatants: State-insurgent violence between government forces versus insurgents
or communal violence involving multiple insurgent groups or civilians. We show that the
increased violence in unreserved constituencies with large tribal populations is driven by
violence between insurgents and the State.
In Panel B of Online Appendix Table OA11 we study the role of major National parties
(inc and bjp in particular) towards violence in unreserved constituencies with large tribal
populations specifically. Tribals made up 8.2% of the Indian population according to the
2001 census. Major national parties thus have stronger incentives to appease tribals relative
to regionalist parties because tribals are relatively more important for their electoral success,
as they must necessarily cater to broader constituent base.17 Accordingly, we expect greater
17See Nellis et al. (2016) for a similar discussion with respect to Muslim minority voters.
36
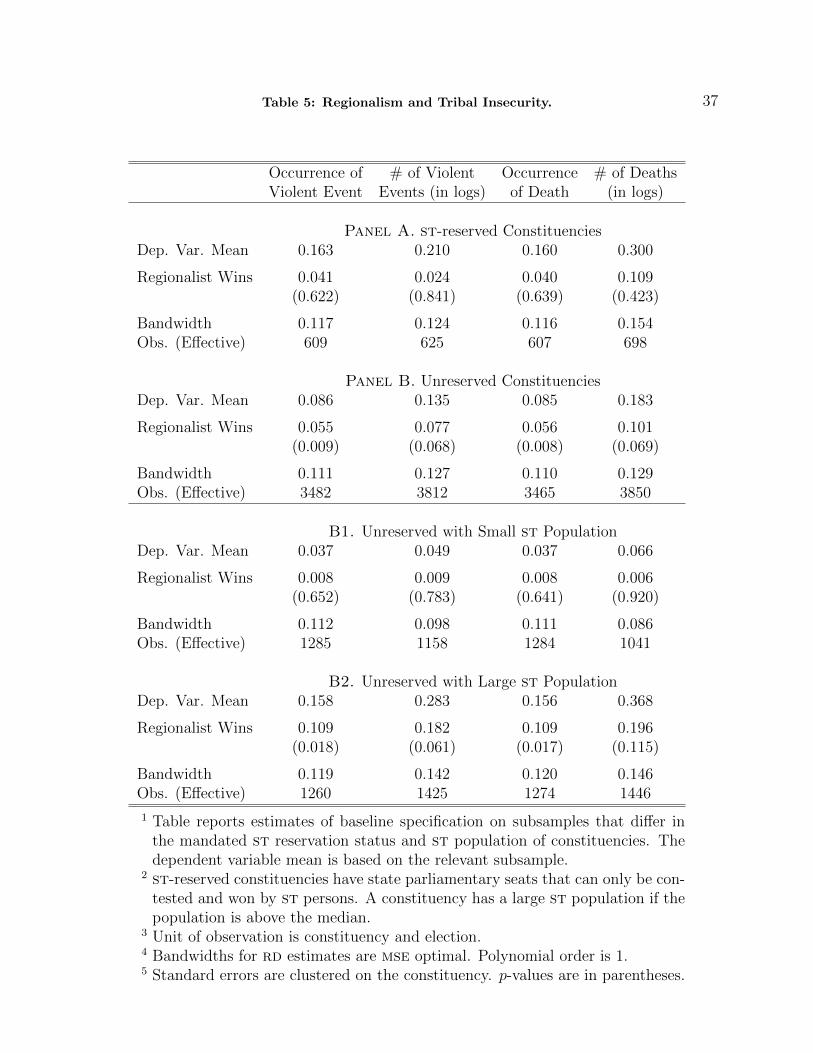
37Table 5: Regionalism and Tribal Insecurity.
Occurrence of # of Violent Occurrence # of DeathsViolent Event Events (in logs) of Death (in logs)
Panel A. st-reserved ConstituenciesDep. Var. Mean 0.163 0.210 0.160 0.300
Regionalist Wins 0.041 0.024 0.040 0.109(0.622) (0.841) (0.639) (0.423)
Bandwidth 0.117 0.124 0.116 0.154Obs. (Effective) 609 625 607 698
Panel B. Unreserved ConstituenciesDep. Var. Mean 0.086 0.135 0.085 0.183
Regionalist Wins 0.055 0.077 0.056 0.101(0.009) (0.068) (0.008) (0.069)
Bandwidth 0.111 0.127 0.110 0.129Obs. (Effective) 3482 3812 3465 3850
B1. Unreserved with Small st PopulationDep. Var. Mean 0.037 0.049 0.037 0.066
Regionalist Wins 0.008 0.009 0.008 0.006(0.652) (0.783) (0.641) (0.920)
Bandwidth 0.112 0.098 0.111 0.086Obs. (Effective) 1285 1158 1284 1041
B2. Unreserved with Large st PopulationDep. Var. Mean 0.158 0.283 0.156 0.368
Regionalist Wins 0.109 0.182 0.109 0.196(0.018) (0.061) (0.017) (0.115)
Bandwidth 0.119 0.142 0.120 0.146Obs. (Effective) 1260 1425 1274 1446
1 Table reports estimates of baseline specification on subsamples that differ inthe mandated st reservation status and st population of constituencies. Thedependent variable mean is based on the relevant subsample.
2 st-reserved constituencies have state parliamentary seats that can only be con-tested and won by st persons. A constituency has a large st population if thepopulation is above the median.
3 Unit of observation is constituency and election.4 Bandwidths for rd estimates are mse optimal. Polynomial order is 1.5 Standard errors are clustered on the constituency. p-values are in parentheses.
protections for tribal security when the state is ruled by a major party from the center.
Further to this point, state governments make important decisions regarding policing and
counterinsurgency, together with the center, and this is easier to do if the state is ruled by a
major party from the center. To study the role of national party rule, as we did above in the
baseline results, we split the sample into two groups, ones where a plurality of seats in the
legislature are held by either the inc or bjp, and ones where a plurality are held by another
party. We see that the effect in Tribe-underrepresented constituencies disappears completely
in states where the inc or bjp hold the most seats in the legislature, consistent with national
parties having greater incentives and means to protect the security of tribal populations. It
is also consistent with the idea that regionalist representation heightens tribal insecurity.
6.2. Regionalism and Tribal Isolation. We investigate the idea that regionalist repre-
sentation heightens tribal isolationism and insecurity further using self-reported outcomes in
the nss. The nss data allows for such an investigation because reported consumption of tv,
radio, etc. can proxy for participation in modern society and because reported wages can
proxy for economic insecurity.
We estimate
yi = βRFD(i) + XiΓ + εi.
where yi is an outcome that measures social, cultural or economic marginalization of tribal
household or individual i. The key explanatory variable is RFD(i), which measures the share
of elections won by a regionalist calculated over all the constituencies in a superdistrict
D(i).18 εi is the idiosyncratic error term. As with the district level data, we instrument
for RFD(i) using the share of elections where a regionalist party barely won or lost. To this
end, we include the fraction of close elections where a regional party was in the top two in
18We aggregate the elections data up to the superdistrict because the nss strips the district from the data,presumably to protect the confidentiality of tribal persons. We contacted the nss offices several times butwere unable to obtain more specific geographic information concerning respondents.
38
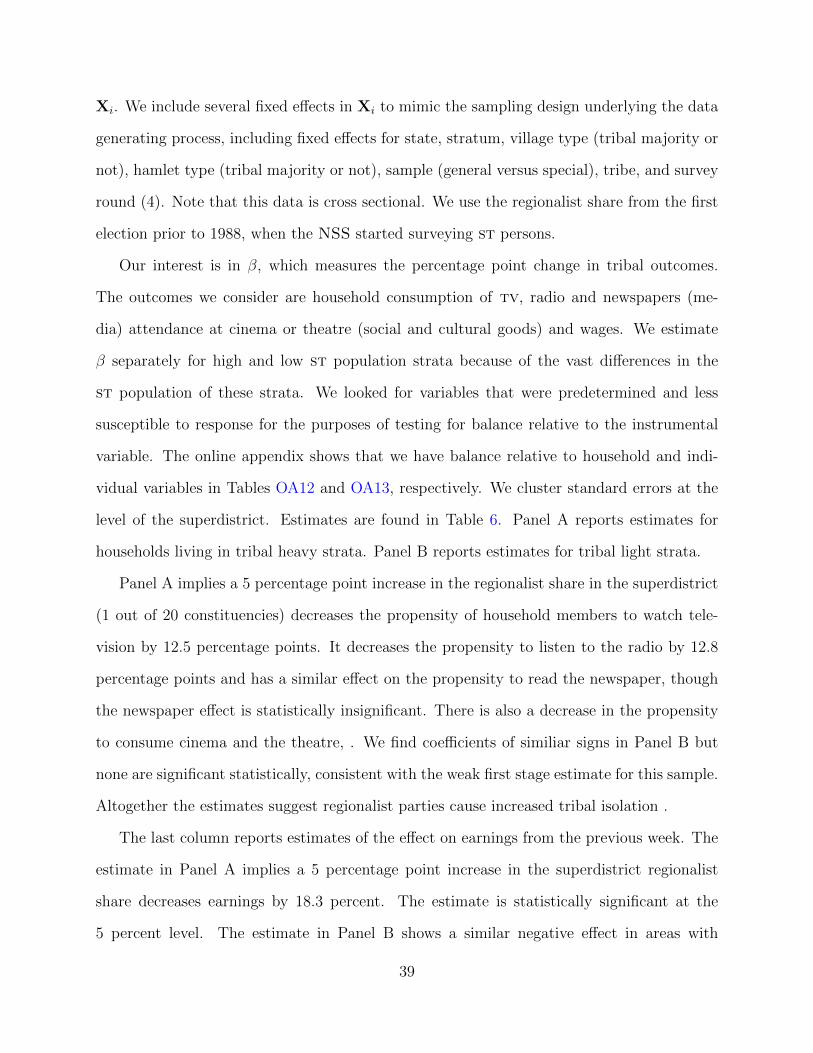
Xi. We include several fixed effects in Xi to mimic the sampling design underlying the data
generating process, including fixed effects for state, stratum, village type (tribal majority or
not), hamlet type (tribal majority or not), sample (general versus special), tribe, and survey
round (4). Note that this data is cross sectional. We use the regionalist share from the first
election prior to 1988, when the NSS started surveying st persons.
Our interest is in β, which measures the percentage point change in tribal outcomes.
The outcomes we consider are household consumption of tv, radio and newspapers (me-
dia) attendance at cinema or theatre (social and cultural goods) and wages. We estimate
β separately for high and low st population strata because of the vast differences in the
st population of these strata. We looked for variables that were predetermined and less
susceptible to response for the purposes of testing for balance relative to the instrumental
variable. The online appendix shows that we have balance relative to household and indi-
vidual variables in Tables OA12 and OA13, respectively. We cluster standard errors at the
level of the superdistrict. Estimates are found in Table 6. Panel A reports estimates for
households living in tribal heavy strata. Panel B reports estimates for tribal light strata.
Panel A implies a 5 percentage point increase in the regionalist share in the superdistrict
(1 out of 20 constituencies) decreases the propensity of household members to watch tele-
vision by 12.5 percentage points. It decreases the propensity to listen to the radio by 12.8
percentage points and has a similar effect on the propensity to read the newspaper, though
the newspaper effect is statistically insignificant. There is also a decrease in the propensity
to consume cinema and the theatre, . We find coefficients of similiar signs in Panel B but
none are significant statistically, consistent with the weak first stage estimate for this sample.
Altogether the estimates suggest regionalist parties cause increased tribal isolation .
The last column reports estimates of the effect on earnings from the previous week. The
estimate in Panel A implies a 5 percentage point increase in the superdistrict regionalist
share decreases earnings by 18.3 percent. The estimate is statistically significant at the
5 percent level. The estimate in Panel B shows a similar negative effect in areas with
39
40
Table 6: Tribal Isolation.
Panel A. High st Population StrataTV Radio Cinema Theatre Newspaper Earnings
(in logs)
Regionalist -2.491 -2.559 -1.918 -2.118 -1.253 -3.663Seat Fraction (0.001) (0.005) (0.001) (0.001) (0.114) (0.015)
F -Statistic for 41.93 0 41.930 41.930 41.930 41.930 34.980Excluded Instrument (0.000) (0.000) (0.000) (0.000) (0.000) (0.000)
Superdistricts 49 49 49 49 49 49Observations 10722 10722 10722 10722 10722 9768
Panel B. Low st Population StrataTV Radio Cinema Theatre Newspaper Earnings
(in logs)
Regionalist -4.680 -6.226 -10.645 -3.939 -3.859 -2.003Seat Fraction (0.718) (0.736) (0.694) (0.750) (0.714) (0.831)
F -Statistic for 0.180 0.180 0.180 0.180 0.180 1.090Excluded Instrument (0.676) (0.676) (0.676) (0.676) (0.676) (0.302)
Superdistricts 56 56 56 56 56 55Observations 2497 2497 2497 2497 2497 2869
1 Table estimates of the effect of regionalist party representation on reported wages,media consumption, and consumption of social/cultural goods in st population.
1 Outcomes taken from 44th round of National Sample Survey (nss) conducted be-tween July 1988 and June 1989. Outcomes are self-reported.
2 Unit of analysis in first four columns is household. Unit of analysis in remainingthree columns is the individual. Panel A reports estimates for st households andindividuals living in st-dominated areas.
3 Regionalist seat fraction in close elections is fraction of superdistrict seats won byregionalist party candidates in elections that were decided by 2.5 percentage points orless and where a regionalist was in the top 2. Regionalist seat fraction is calculatedover groups of districts (which we call a “superdistrict”) because only the groupidentifier is available in the nss data.
4 Controls include the fraction of seats contested in elections with a win margin within2.5 percentage points where a regionalist candidate was one of the top 2 candidatesand one lag of the occurrence of violence. Regressions also include fixed effects forthe state, stratum, village type (tribal majority or not), hamlet type (tribal majorityor not), sample (general versus special), tribe, and survey round (4).
5 Standard errors are clustered on the superdistrict. p-values in parentheses.

smaller st populations but again the estimate is statistically insignificant. The wage effect
in tribal areas is consistent with regionalist parties increasing the economic insecurity of
tribal populations.
Altogether the results in this subsection support the existence of incentives to protest
against regionalist party representation among st persons. If regionalist party representation
decreases wages and consumption of media/social/cultural goods, and st persons anticipate
this, then they will have strong incentives to protest if regionalist party candidates are
elected. The results here are therefore consistent with the increased violence under regional
party representation.
7 Conclusion
We show regionalist representation increases political violence substantially because region-
alist electoral success amplifies tensions between the national minorities the regionalist party
represents and local minority tribal communities. Regionalist representation decreases the
propensity of st-households to consume media and cultural goods, and st-households in a
district with higher regionalist representation also report earning lower wages. This evidence
suggests regionalist representation further marginalizes st-households in Indian society.
Our focus has been on the consequences of representation by regionalists who focus on
the interests of a local majority to the exclusion of their other minority constituents and the
rest of India. We have passed over the origins of regionalism and ultimately explanations
for the supply of regionalist parties. We noted simply that the dominant explanations were
regional cleavages and the devolution of fiscal and political power. There is however a
literature that is emerging to fill the gap. Ziegfeld (2016) shows in the case of India that
the rapid growth in such parties can be explained by a combination of the clientelistic
nature of Indian politics (clientelism makes broad-based national party building costlier)
with institutions (decentralized power, coalition governments) and demographic features
41
(regionally concentrated ethnic populations) that are favorable to regionalism. Recent work
has shown that repressive policies by national governments can engender regionalist attitudes
(Gehring and Dehdari 2019). This and future research into the origins of regionalism should
prove useful for normative questions concerning the optimal design of federations.
Our study gives empirical grounding to theoretical insights from a branch of political
philosophy that focuses on the politics of recognition (Taylor et al. 1994). Regionalist par-
ties facilitate the pursuit of collectivist goals by a well-defined group of local persons, goals
that include the means to enact legislation that ensures the survival of group identity and
economic prosperity of group members. But the pursuit and achievement of these goals can
infringe upon the rights, freedom, and welfare of other persons who belong to the same local-
ity. This is a pattern that seems to repeat itself across ethnolinguistically diverse democracies
around the world.
42
References
Daron Acemoglu, James A. Robinson, and Rafael J. Santos. The monopoly of violence:Evidence from colombia. Journal of the European Economic Association, 11(s1):5–44,2013.
Benjamin Acosta. From bombs to ballots: When militant organizations transition to politicalparties. The Journal of Politics, 76(3):666–683, 2001.
Sonia Alonso and Ruben Ruiz-Rufino. Political representation and ethnic conflict in newdemocracies. European Journal of Political Research, 46(2):237–267, 2007.
Jagannath Ambagudia. Scheduled tribes and the politics of inclusion in india. Asian SocialWork and Policy Review, 5:33–43, 2011.
Sam Asher and Paul Novosad. Politics and local economic growth: Evidence from india.American Economic Journal: Applied Economics, 9(1):229–273, 2017.
Kishalay Banerjee. Regional Political Parties. B.R. Publishing, New Delhi, India, 1984.Sonia Bhalotra and Irma Clots-Figueras. Health and the political agency of women. Amer-
ican Economic Journal: Economic Policy, 6(2):164–97, 2014.Sonia Bhalotra, Irma Clots-Figueras, Guilhem Cassan, and Lakshmi Iyer. Religion, politician
identity and development outcomes: Evidence from india. Journal of Economic Behaviorand Organization, 104:4–17, 2014.
Satyavan Bhatnagar and Pradeep Kumar, editors. Regional Political Parties in India. EssEss Publications, New Delhi, India, 1988.
Christopher Blattman and Edward Miguel. Civil war. Journal of Economic Literature, 48(1):3–57, March 2010.
Dawn Brancati. Decentralization: Fueling the fire or dampening the flames of ethnic conflictand secessionism? International Organization, 60(3):651–685, 2006.
Dawn Brancati. The origins and strengths of regional parties. British Journal of PoliticalScience, 38(1):135–159, 2008.
Ethan Bueno de Mesquita. Rebel tactics. Journal of Political Economy, 121(2):323–357,2013.
Matias D Cattaneo, Michael Jansson, and Xinwei Ma. Simply local polynomial densityestimators. Working Paper, 2017.
Matias D Cattaneo, Nicolas Idrobo, and Rocıo Titiunik. A practical introduction to regres-sion discontinuity designs: Foundations. Cambridge Elements: Quantitative and Compu-tational Methods for Social Science, 2019a.
Matias D Cattaneo, Rocio Titiunik, and Gonzalo Vazquez-Bare. The regression discontinuitydesign. arXiv Preprint, 2019b.
Lars-Erik Cederman, Andreas Wimmer, and Brian Min. Why do ethnic groups rebel? newdata and analysis. World Politics, 62(1):87–119, 2010.
Mario Chacon. In the line of fire: Political violence and decentralization in colombia. SSRN2386667, 2018.
Pradeep Chhibber and Ken Kollman. Party aggregation and the number of parties in indiaand the united states. American Political Science Review, 92(2):329–342, March 1999.
Pradeep K. Chhibber and Rahul Verma. Ideology and Identity. Oxford University Press,Oxford, 2018.
43

Irma Clots-Figueras. Women in politics: Evidence from the indian states. Journal of PublicEconomics, 95(7-8):664–690, 2011.
Irma Clots-Figueras. Are female leaders good for education? evidence from india. AmericanEconomic Journal: Applied Economics, 4(1):212–44, 2012.
Mihai Croicu and Ralph Sundberg. Ucdp ged codebook version 18.1. Department of Peaceand Conflict Research, Uppsala University, 2017.
Benjamin Crot, Joseph H. Felter, Hani Mansour, and Daniel I. Rees. Narrow incumbentvictories and post-election conflict: Evidence from the philippines. World Bank EconomicReview, Forthcoming.
Christian Dippel. Forced coexistence and economic development: Evidence from nativeamerican reservations. Econometrica, 82(6):2131–2165, 2014.
Oeindrila Dube and Suresh Naidu. Bases, bullets, and ballots: The effect of u.s. military aidon political conflict in colombia. The Journal of Politics, 77(1):249–267, 2015.
Oeindrila Dube and Juan F. Vargas. Commodity price shocks and civil conflict: Evidencefrom colombia. Review of Economic Studies, 80(4):1384–1421, 2013.
Nandana Dutta. Questions of Identity in Assam. Sage Publications, New Delhi, 2012.Joan Esteban and Debraj Ray. Conflict and distribution. Journal of Economic Theory, 87
(2):379–415, 1999.Joan-Maria Esteban and Debraj Ray. On the measurement of polarization. Econometrica,
62(4):819–851, 1994.L.S. Gassah. Regional Political Parties in North East India. Omsons Publications, New
Delhi, India, 1992.Kai Gehring and Sirus Dehdari. The origins of common identity: Evidence from alsace-
lorraine. CESifo Working Paper, 181(7949), 2019.Andrew Gelman and Guido Imbens. Why high-order polynomials should not be used in
regression discontinuity designs. Journal of Business & Economic Statistics, 0(0):1–10,2018.
Nicola Gennaioli and Ilia Rainer. The modern impact of precolonial centralization in africa.Journal of Economic Growth, 12(3):185–234, 2007.
Sudhir Jacob George. The bodo movement in assam. Asian Survey, 34(3):878–892, October1994.
Uddipana Goswami. Conflict and Reconciliation: The Politics of Ethnicity in Assam. Rout-ledge, London, 2014.
Ted Robert Gurr. Minorities at Risk: A Global View of Ethnopolitical Conflicts. UnitedStates Institute of Peace, Washington, DC, 1993.
Jinyong Hahn, Petra Todd, and Wilbert Van der Klaauw. Identification and estimationof treatment effects with a regression-discontinuity design. Econometrica, 69(1):201–209,2001.
Roland Hodler and Paul A. Raschky. Regional favoritism. The Quarterly Journal of Eco-nomics, 129(2):995–1033, May 2014.
Susanne Hoeber Rudolph and Lloyd I. Rudolph. The centrist future of indian politics. AsianSurvey, 20(6):575–594, 1980.
Francesca R. Jensenius. Development from representation? a study of quotas for scheduledcastes in india. American Economic Journal: Applied Economics, 7(3):196–220, 2015.
David S. Lee. Randomized experiments from non-random selection in us house elections.44

Journal of Econometrics, 142(2):675–697, 1998.Arend Lijphart. Constitutional design for divided societies. Journal of Democracy, 15(2):
96–109, 2004.Giacomo De Luca, Roland Hodler, Paul A. Raschky, and Michele Valsecchi. Ethnic fa-
voritism: An axiom of politics? Journal of Development Economics, 132:115–129, 2018.Arvind Magesan and Eik Swee. Out of the ashes, into the fire: The consequences of us
weapons sales for political violence. European Economic Review, 107:133–156, 2018.Emanuele Massetti and Arjan H Schakel. Between autonomy and secession: Decentralization
and regionalist party ideological radicalism. Party Politics, 22(1):59–79, 2016.Justin McCrary. Manipulation of the running variable in the regression discontinuity design:
A density test. Journal of Econometrics, 142:698–714, 2008.Stelios Michalopoulos and Elias Papaioannou. Pre-colonial ethnic institutions and contem-
porary african development. Econometrica, 81(1):113–152, 2013.Stelios Michalopoulos and Elias Papaioannou. The long-run effects of the scramble for africa.
American Economic Review, 106(7):1802–48, 2016.Edward Miguel, Shanker Satyanath, and Ernest Sergenti. Economic shocks and civil conflict:
An instrumental variables approach. Journal of Political Economy, 112(4):725–753, 2004.Jose G. Montalvo and Marta Reynal-Querol. Ethnic polarization, potential conflict, and
civil wars. The American Economic Review, 95(3):796–816, 2005.Lt. General J.R. Mukherjee. An Insider’s Experience of Insurgency in India’s North-East.
Anthem Publishing, London, 2006.Gareth Nellis and Niloufer Siddiqui. Secular party rule and religious violence in pakistan.
American Political Science Review, 112(1):49–67, 2018.Gareth Nellis, Michael Weaver, and Steven Rosenzweig. Do parties matter for ethnic vio-
lence? evidence from india. Quarterly Journal of Political Science, 11(3):249–277, 2016.Nathan Nunn and Nancy Qian. Us food aid and civil conflict. The American Economic
Review, 104(6):1630–1666, 2014.Rohini Pande. Can mandated political representation increase policy influence for disadvan-
taged minorities? theory and evidence from india. The American Economic Review, 93(4):1132–1151, 2003.
Marta Reynal-Querol. Ethnicity, political systems, and civil wars. Journal of ConflictResolution, 46(1):29–54, 2002.
Arundhati Roy. Broken Republic. Penguin Books, New Delhi, 2011.Ralph Sundberg and Erik Melander. Introducing the ucdp georeferenced event dataset.
Journal of Peace Research, 50(4):523–532, 2013.Charles Taylor, Amy Gutmann, and Charles Taylor. Multiculturalism: Examining the Poli-
tics of Recognition. Princeton University Press, New Jersey, 1994.Myron Weiner. Sons of the soil: Migration and ethnic conflict in India. Princeton University
Press, Princeton, 1978.Steven J. Wilkinson. Votes and Violence. Cambridge University Press, New York, 2004.Andreas Wimmer, Lars-Erik Cederman, and Brian Min. Ethnic politics and armed conflict:
A configurational analysis of a new global data set. American Sociological Review, 74(2):316–337, 2009.
Adam Ziegfeld. Why Regional Parties? Clientelism, Elites, and the Indian Party System.Cambridge University Press, New York, 2016.
45
Regionalism and Tribal Insecurity in India
Online Appendix(Not for Publication)
Sacha Kapoor Arvind Magesan
March 21, 2021
OA.1 Formal Definition of Regionalist Party
Let Vp,r to be the total vote received by party p in state r during the sample period and
Sp,r = Vp,r∑r′ V
p,r′, be the share of party p’s vote coming from state r. We then measure
geographical concentration using
Cp =∑r
S2p,r,
effectively the Herfindahl-Hirschman Index (hhi) measure of market concentration.
We adapt this measure to account for vast differences in population size across states.
This is important because a single vote in Uttar Pradesh (population over 200 million) has
less value than a single vote in Assam (population around 30 million). To equalize the value
of a vote across states, we divide votes received in a state by the relative electoral size of the
region, θr, where:
θr =∑p
Vp,r/∑p′ ,r′
Vp′ ,r′
That is, total available votes in a region divided by total available votes in the country.
Then, let Vp,r = Vp,rθr
, Sp,r = Vp,r∑r′ V
p,r′, and
Cp =∑r
S2p,r,
which is our adjusted measure of geographical concentration.
1
OA.2 Reverse Causality
One of our balancing tests raises concerns about a potential reverse causality problem. The
test is suggestive of a potential imbalance in the lagged occurrence of violence, with an rd
coefficient that equals 0.052, and a p-value that equals 0.086 (top left rd plot of Figure OA6).
The imbalance raises concerns about whether our estimates can be interpreted differently,
as reflecting efforts by regionalist parties to use violence to sway outcomes in close elections.
In this section, we investigate this possibility further and ultimately argue that it cannot be
the primary force that drives our results.
Our argument is already supported by several results in the main text:
1. our main test for identification showed no evidence of a discontinuity in the density of
constituency-elections around the cutoff.
2. we do not observe imbalance in the occurrence of death.
3. the occurrence of violence is a binary variable, which likely exhibits less variation over
time than the count of violent events. Moreover, we do not observe imbalances in the
number of events or deaths.
In this appendix, we first show that our baseline estimates are qualitatively robust to con-
trolling for a lag of the dependent variable in Table OA8. While the rd coefficients decrease
and the p-values increase when we control for lagged violence, we caution against reading too
much into these results. Including a lagged outcome in a standard regression is problematic
in any case (technically, including the lag of the outcome does introduce an endogeneity
issue), but is even less well understood in the case of regression discontinuity. The sole
takeaway here is that including the lagged outcome as a control does not change eliminate
our baseline results.
2
In Table OA3 we show that regionalist representation increases violence in the 2 years
following an election, which suggests at a minimum that regionalist parties are increasing
violence outside periods when it will probably have the largest effects on election outcomes.
While this is useful, we admit that increased violence in 2 years following election is not
evidence against efforts by regionalist parties to influence the outcome of the next election.
Even if the violence takes place right after an election, it could be part of a broad effort to
influence the outcome of the next election.
To further assuage concerns about reverse causality, we estimate the effect of electing a
regionalist in constituencies that had a regionalist incumbent in the previous election and the
effect in ones that did not.1 If indeed there is a systematic link between pre-election violence,
electoral outcomes, and post election violence, we would expect qualitative differences in the
estimates for these subsamples - previous election outcomes should significantly explain the
relationship between current election outcomes and subsequent violence.
In Table OA4 we present estimates of our baseline effect on the two subsamples. In the
top panel we present the estimate of the effect of electing a regionalist when a regionalist is
the incumbent, and in the bottom panel the estimate of the effect of electing a regionalist
when a non-Regionalist is the incumbent. Qualitatively, the estimates are quite similar. In
the first column we see that the effect of electing a regionalist when the incumbent is also
a regionalist is a 10.4 percentage point increase in the probability a violent event occurs,
while there is an 8.3 percentage point increase in this probability when a non-regionalist is
the incumbent. These estimates are statistically significant at the 5% level. The remaining
estimates are also qualitatively similar, but, perhaps not surprisingly, not precisely estimated
given that the sample size is significantly reduced. We see this as evidence against a strong
role for reverse causality in producing our estimates.
As a further step to establishing that reverse causality is not the primary driver of our
results, we tried to identify what type of election is most likely to exhibit this type of
1We thank an anonymous referee for suggesting this idea.
3
relationship. In terms of pre-election political violence, perhaps the most notorious election
in our sample (and perhaps in all of post-Independence Indian political history) is the 1996
election in Jammu and Kashmir. The previous scheduled election (both to the Lok Sabha
and the state legislative assembly) had not been held due to ongoing insurgency. In fact in
the years leading up the 1996 election, the state had been ruled from the center, and the
state government suspended. Local groups that viewed the elections as illegitimate were
accused of using violence to intimidate voters in the lead up to the election. 2
Given this, we reconsider our main specification and our test for balance in lagged oc-
currence of violence by excluding the 1996 Jammu and Kashmir election. The results are in
Table OA5. In the left column we present the estimate of our baseline effect in this restricted
sample. The estimate, a 6.4 percentage point increase in violence is almost identical to our
baseline effect in the full sample (a 7.2 percentage point increase). In the right column we
present the effect on lagged violence. This estimate is now smaller and far from significant
at any conventional level, with a p-value of 0.146. This suggests that much of the reverse
relationship between political violence and close regionalist wins is explained by the 1996
episode in Jammu and Kashmir. Again, we do not claim is there is no scope for a reverse
relationship, but we do maintain that it does not explain our baseline effect.
2See https://www.hrw.org/reports/1996/India2.htm for example.
4
OA.3 Model
Why do regionalist parties increase violence when their powers are limited? Why does
violence increase most in constituencies where tribes are prevalent but under-represented?
We show that these patterns can be generated via a simple model of rational agents, key
elements of which are borrowed from Bueno de Mesquita (2013).
There are of three types of agents: political parties, citizens, and an insurgent group I.
Political parties can be regionalist (R) or national (N). Citizens can belong to the regional
majority α (e.g., ethnic Assamese) or the regional minority τ (e.g., Bodos/tribes). With
some abuse of notation, τ also measures the mass of the minority population, τ < 1/2. η
measures citizen distaste for violent insurgency, and is uniformly distributed on [η, η]. We
assume η < 0, so that some citizens have a preference for violence.
Agents play the following multi-stage game:
Stage 1: R contests the election or not. N is not strategic in it’s entry decision. If R does not
contest, N wins by default and allocates a resource share of τ to minority citizens and
1− τ to majority citizens. In this scenario, all citizens get equal share. If R contests,
then it proposes sR ∈ [0, 1] for the minority resource share. sR < τ means majority
citizens get more resources per person. This stage captures the idea that while R is
free to choose any feasible division of resources, N is constrained to share resources
equally across groups.
Stage 2: Minority citizens make the decision to participate in (mobilize for) insurgency or par-
ticipate in the political system and vote in elections.
Stage 3: Majority citizens and non-mobilized minorities vote for R or N . The winning policy
s∗ determined.
Stage 4: Insurgent group mounts a violent insurgency aI = 1 or not aI = 0.
Payoffs are as follows:5
Insurgents: The payoff to insurgents is πI = aIλθ + (1 − aI)(s − c). λθ is the minority share
under insurgency, λ is the minority fraction mobilizing for violence, and θ measures
insurgency technology. s is the minority share without insurgency. Insurgent groups
that pay a cost c > 0 to sustaining the movement without violence.3
Citizens: The payoff to minorities from mobilizing is π(1) = aIλθ+(1−aI)s−η, where minority
mobilizers enjoy the share obtained by the insurgents λθ. The payoff to minorities from
not mobilizing is π(0) = aI(δλθ) + (1 − aI)s. Non-mobilizers get a discounted share
of insurgent rents, i.e. 0 < δ < 1. Finally, the (homogenous) citizens in the majority
group receive πα = aI(1−λθ) + (1− aI)s. We assume that citizens vote for the option
that yields the biggest share for their own group.4
Parties: R’s payoff from contesting is πR(1) = aI(1−λθ
)+ (1− aI)
(1− s
)− e, where e reflects
entry costs, such as pre-election violence involving national party operatives. Not
contesting yields πR(0) = aI(1− λθ
)+ (1− aI)
(1− τ
).
The model is solved via backwards induction. In Stage 4 insurgents choose violence if
λ ≥ s−cθ
. Equality defines λ = s−cθ
, which is the smallest mass of citizens that induces violent
insurgency, given the resource share s determined in the election.
In Stage 3 we have two cases, depending on R’s election contesting decision from Stage
1. The first case is trivial. If R stays out, then N wins by default and minorities receive
s = τ . In the second case, R contests. Citizens compare sR with the τ offered by N while
accounting for the possibility that the share of the winning party triggers insurgency. Let
sIR ∈ {sR, λθ} and sIN ∈ {τ, λθ} be the minority shares that prevail when majorities vote for
R or N , respectively. All majorities vote for R if sIR ≤ sIN and for N otherwise. All voting
minorities vote for R if sIR ≥ sIN and for N otherwise.
In Stage 2, a type-η minority mobilizes for insurgency if πη(1) ≥ πη(0). The fraction that
3Sustaining and motivating members of a movement while not being active through violence is difficultand a common issue for rebel groups, who often use violence simply as a recruitment and morale-buildingtool.
4Any voting rule where citizens of a group all vote the same way is (weakly) dominant, as no individualcan deviate and make herself strictly better off.
6

mobilizes will depend on citizens’ conjectures concerning aI . If citizens conjecture aI = 1,
then type-ηs mobilize if η ≤ (1− δ)θλ. 5
The fraction that mobilizes λ∗(1) is the fixed point of λ = τ∫ (1−δ)θλη
dU(η), i.e. λ∗(1) =
−τηη−η−(1−δ)τθ . One equilibrium of the sub-game is then λ∗(1), aI = 1. This is an equilibrium
if λ∗(1) ≥ λ. If citizens conjecture aI = 0, then type-ηs mobilize if η ≤ 0. The fraction that
mobilizes is λ∗(0) =−τηη−η . A second equilibrium of the subgame is then λ∗(0), aI = 0. This
is an equilibrium if λ∗(0) < λ. Note that λ∗(0) < λ∗(1) is always the case given parameter
signs.
λ∗(0) = s(0)−cθ
and λ∗(1) = s(1)−cθ
define thresholds s(0) and s(1) for the resource share
that makes the insurgents indifferent between mounting an insurgency or not, given the
fraction of citizens that mobilize for insurgency. We assume indifferent insurgents opt for
no violence. For values of s less than s(0), the insurgent group mobilizes (aI = 1) even if
λ = λ∗(0), and so λ∗(0) can not be equilibrium mobilization. For values of s ∈ [s(0), s(1)],
we have two equilibria in the subgame, (λ = λ∗(0), aI = 0) and (λ = λ∗(1), aI = 1), and
for values of s with s > s(1), there is only one equilibrium, (λ = λ∗(0), aI = 0). All this is
depicted graphically in Figure OA1 in the appendix.
We make two additional assumptions before folding back the game to the first stage
and fully characterizing the SPNE. We assume first that s(1) < τ (A1). This assumption
implies that the share offered by the National party guarantees no insurgency.6 Second,
we assume that, for any sR ∈ [s(0), s(1)), citizens and insurgents coordinate on insurgency
(A2). Under A2 the three regions of sR reduce to two relevant regions from the perspective
of the regionalist party: insurgency if sR < s(1) and no insurgency if sR ≥ s(1).
In Stage 1, if R stays out, N wins by default and by A1 there is no insurgency. The
5There is a positive mass that mobilizes since η < 0 and (1− δ)θλ > 0.6Simple algebra reveals that:
s(1) = θ[ −τηη − η − (1− δ)τθ
]+ c (3)
So η sufficiently large guarantees the assumption holds.
7
payoff to R is 1− τ . If R contests, R will not choose any sR ≥ τ because staying out would
be better given the entry cost e > 0. It will instead choose sR < τ . R wins because this is the
preferred policy of the majority. Since R’s payoff is decreasing in sR for any sR ≥ s(1), the
highest payoff for R when it chooses a share that does not incite insurgency is 1− s(1)− e.
R’s payoff from inciting insurgency is 1 − λ∗(1)θ − e. So the regionalist party that enters
chooses an sR that incites insurgency if 1− λ∗(1)θ− e > 1− s(1)− e, which always holds as
long as c > 0, and given the definition of s(1).
We can now fully state the equilibrium. If 1− τ > 1− λ∗(1)θ − e or
e > τ +τθη
η − η − τθ(1− δ)
then R stays out and N wins. There is no violence. Otherwise, R enters, chooses any
sR ∈ [0, s(1)), thus triggering insurgency.
The equilibrium is consistent with our baseline results. First, it predicts that regionalist
parties cause violence. In the model there is violence if and only if the regionalist party wins
the election. For this to happen, the cost of entry e can not be too large. This gives a logic by
which the state may want to ban or restrict regionalist parties via increases in e. Second, as
we show in the appendix, violence is more likely the larger is τ . Larger minority populations
mean a smaller share to the majority in any case, and a larger return to insurgency (through
a higher value of λ∗(1)). This matches our other baseline result, that constituencies with
large under-represented tribal populations are more likely to experience violence when a
regionalist candidate is elected. Developing a model that predicts our key results for tribal
isolation requires more machinery than we have space for here.
We illustrate how the equilibrium changes with τ , the size of the minority population.
In equilibrium we have regionalist party entrance and political violence if and only if
1− τ < 1− λ∗(1)θ − e (4)
8
Clearly the left side of this expression is decreasing in τ - a large minority population incen-
tivizes the regional party to enter because the share to the majority group under national
party rule decreases in τ . However, λ∗(1) is increasing in τ , so that the right side is also
decreasing in τ . The larger the minority population, the larger the mobilized force for vio-
lence, which decreases the share to the majority group conditional on the regionalist party’s
entry. A large minority population is not good for the share of the pie that goes to the
majority regardless of the party in power, and whether there is violence. Re-writing, there
is regionalist party entry and violence if and only if:
τ > λ∗(1)θ + e (5)
By inspection, as τ approaches 0 the condition can not be satisfied, while it can be for larger
values of τ . We have that:
∂λ∗(1)
∂τ=
(F − η)(η − η)((η − η)− (1− δ)τθ
)2 (6)
so λ∗(1) is strictly increasing in τ . Moreover, λ∗(1) is strictly concave in τ if τ >η−η
(1−δ)θ and
convex otherwise. So in principal there can be changes back and forth between whether the
regional party chooses to enter or not (and whether there is violence or not) as τ increases.
But by the strict concavity in τ , there is an τ ∗ such that for all τ ≥ τ ∗, the regionalist party
enters and there is violence.
9

10
Figure OA1: Multiple s
s0 s(1) τ
s−cθ
λ∗(1)
λ∗(0)
s(0)
a∗I = 1
a∗I = 0
a∗I ∈ {0, 1}
OA.4 Spillover Derivation
In this section we show formally how the iv strategy developed in (Clots-Figueras 2011)
identifies spillovers. For simplicity, suppress the election subscript e. Let Sd denote the
number of seats in district d. Let
RFd =1
Sd
Sd∑j=1
Rj
denote the seat share of regionalist parties in district d, where RFd ∈ {rf0, rf1, rf2, ..., rfSd},
and rfk = k/Sd. Our interest is
Vd = α + βRFd + εd
where Vd encapsulates various district level measures of violence, such as total violent events
in the district as a whole, in constituencies held by regional parties, and in constituencies
that are held by other types of parties. Causal identification of β rests on there being no
covariance between the regionalist party seat share and unobserved district level factors:
Cov(RFd, εd) = 0.
Let Cj equal 1 if a regionalist party finished in the top two in a close election and 0
otherwise. The regional party seat share can then be written as
RFd =
Sd∑j=1
CjRj
Sd︸ ︷︷ ︸RCFd
+
Sd∑j=1
(1− Cj)Rj
Sd︸ ︷︷ ︸RDFd
where RCFd is the regionalist seat share in close elections with a regionalist in the top 2
and RDFd is the share in all other cases. RFd exhibits a high correlation with RCFd and
is non-decreasing in RCFd by construction. Since close election victories by regional parties
11
are also plausibly exogenous to unobserved determinants of violence
Cov(RCFd, εd) = 0,
RCFd provides us with a candidate instrument for RFd.
For the purposes of illustration, we assume Cov(RFd, RCFd)/V ar(RCFd) ≈ 1 where
V ar(RCFd) 6= 0. In this case the iv estimand can be approximated by the reduced form
βIV ≈Cov(Vd, RCFd)
V ar(RCFd).
Let P denote probabilities and pj = P(Cj = 1, Rj = 1). If 0 < pj < 1 and CjRj is statistically
independent of CkRk, and districts are identical Sd = S, the iv estimand equals
∑Sj=1
∑Sk=1 pk
(E[Vj|Ck = 1, Rk = 1]− E[Vj]
)(∑S
j=1 pj(1− pj))/S
.
The numerator equals
S∑j=1
[pj
(E[Vj|Cj = 1, Rj = 1]− E[Vj]
)︸ ︷︷ ︸
Excess Violence in j if Regional PartyRepresentative won j in a close election
+S∑k 6=j
pk
(E[Vj|Ck = 1, Rk = 1]− E[Vj]
)︸ ︷︷ ︸
Excess Violence in j if Regional PartyRepresentative won k in a close election
].
The first term in the square brackets is the pj-weighted excess violence in the home con-
stituency of the regionalist who barely won seat j. The second term is pk-weighted linear
combination of the excess violence in j attributable to regionalist party representatives who
barely won seats in all k 6= j. Thus the iv estimand cumulates the excess violence that
originates internally and externally across all constituencies in the district.
Our discontinuity estimates suggest that the first term is positive. The second term can
be positive or negative. For example, the broken window theory predicts that increased
violence in k can increase violence in j because it lowers the perceived cost of violence
12
in j. Alternatively, the increased violence in k may have displaced violence that would
have otherwise taken place in j. The displacement translates into less violence in j. A
positive second term generates an iv estimand that exceeds the excess violence that originates
internally. A negative second generates an iv estimand that falls short of this internal effect.
13
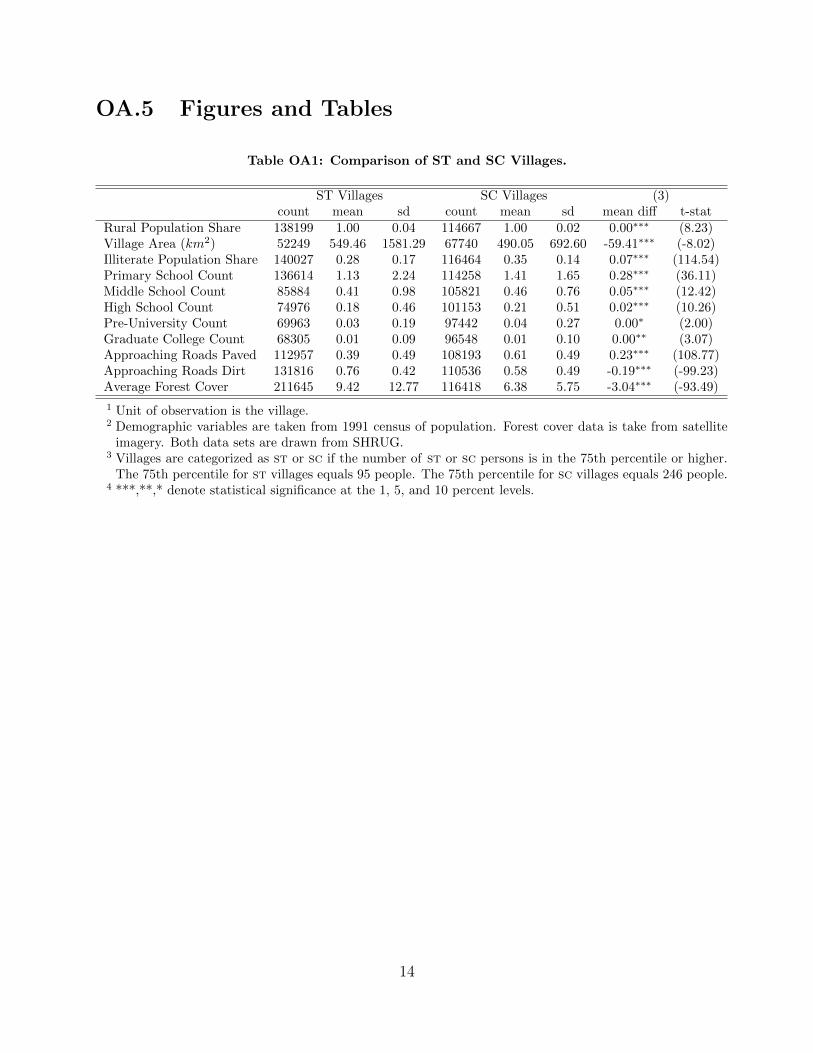
OA.5 Figures and Tables
Table OA1: Comparison of ST and SC Villages.
ST Villages SC Villages (3)count mean sd count mean sd mean diff t-stat
Rural Population Share 138199 1.00 0.04 114667 1.00 0.02 0.00∗∗∗ (8.23)Village Area (km2) 52249 549.46 1581.29 67740 490.05 692.60 -59.41∗∗∗ (-8.02)Illiterate Population Share 140027 0.28 0.17 116464 0.35 0.14 0.07∗∗∗ (114.54)Primary School Count 136614 1.13 2.24 114258 1.41 1.65 0.28∗∗∗ (36.11)Middle School Count 85884 0.41 0.98 105821 0.46 0.76 0.05∗∗∗ (12.42)High School Count 74976 0.18 0.46 101153 0.21 0.51 0.02∗∗∗ (10.26)Pre-University Count 69963 0.03 0.19 97442 0.04 0.27 0.00∗ (2.00)Graduate College Count 68305 0.01 0.09 96548 0.01 0.10 0.00∗∗ (3.07)Approaching Roads Paved 112957 0.39 0.49 108193 0.61 0.49 0.23∗∗∗ (108.77)Approaching Roads Dirt 131816 0.76 0.42 110536 0.58 0.49 -0.19∗∗∗ (-99.23)Average Forest Cover 211645 9.42 12.77 116418 6.38 5.75 -3.04∗∗∗ (-93.49)
1 Unit of observation is the village.2 Demographic variables are taken from 1991 census of population. Forest cover data is take from satellite
imagery. Both data sets are drawn from SHRUG.3 Villages are categorized as st or sc if the number of st or sc persons is in the 75th percentile or higher.
The 75th percentile for st villages equals 95 people. The 75th percentile for sc villages equals 246 people.4 ***,**,* denote statistical significance at the 1, 5, and 10 percent levels.
14
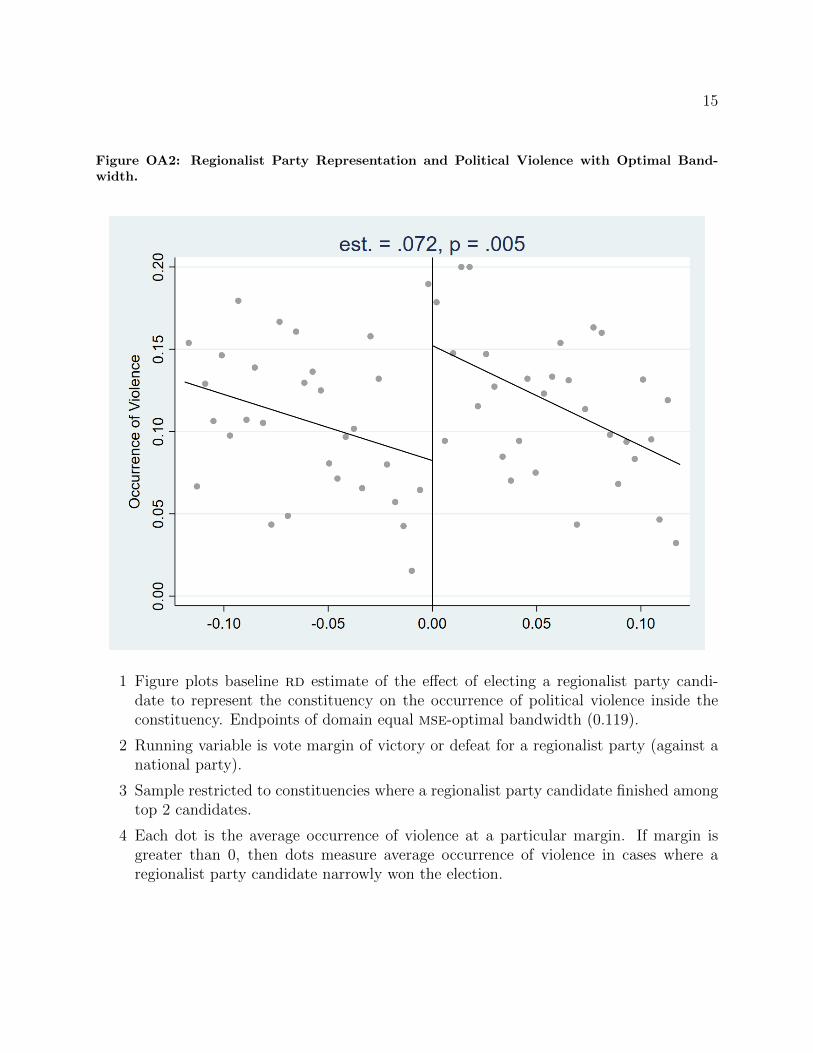
15
Figure OA2: Regionalist Party Representation and Political Violence with Optimal Band-width.
1 Figure plots baseline rd estimate of the effect of electing a regionalist party candi-date to represent the constituency on the occurrence of political violence inside theconstituency. Endpoints of domain equal mse-optimal bandwidth (0.119).
2 Running variable is vote margin of victory or defeat for a regionalist party (against anational party).
3 Sample restricted to constituencies where a regionalist party candidate finished amongtop 2 candidates.
4 Each dot is the average occurrence of violence at a particular margin. If margin isgreater than 0, then dots measure average occurrence of violence in cases where aregionalist party candidate narrowly won the election.

16
Figure OA3: Regionalist Party Representation and Political Violence with a Second-orderPolynomial in the Running Variable.
1 Figure plots baseline rd estimate of the effect of electing a regionalist party candi-date to represent the constituency on the occurrence of political violence inside theconstituency. Estimates based on a second-order polynomial in the running variable.
2 Running variable is vote margin of victory or defeat for a regionalist party (against anational party).
3 Sample restricted to constituencies where a regionalist party candidate finished amongtop 2 candidates.
4 Each dot is the average occurrence of violence at a particular margin. If margin isgreater than 0, then dots measure average occurrence of violence in cases where aregionalist party candidate narrowly won the election.
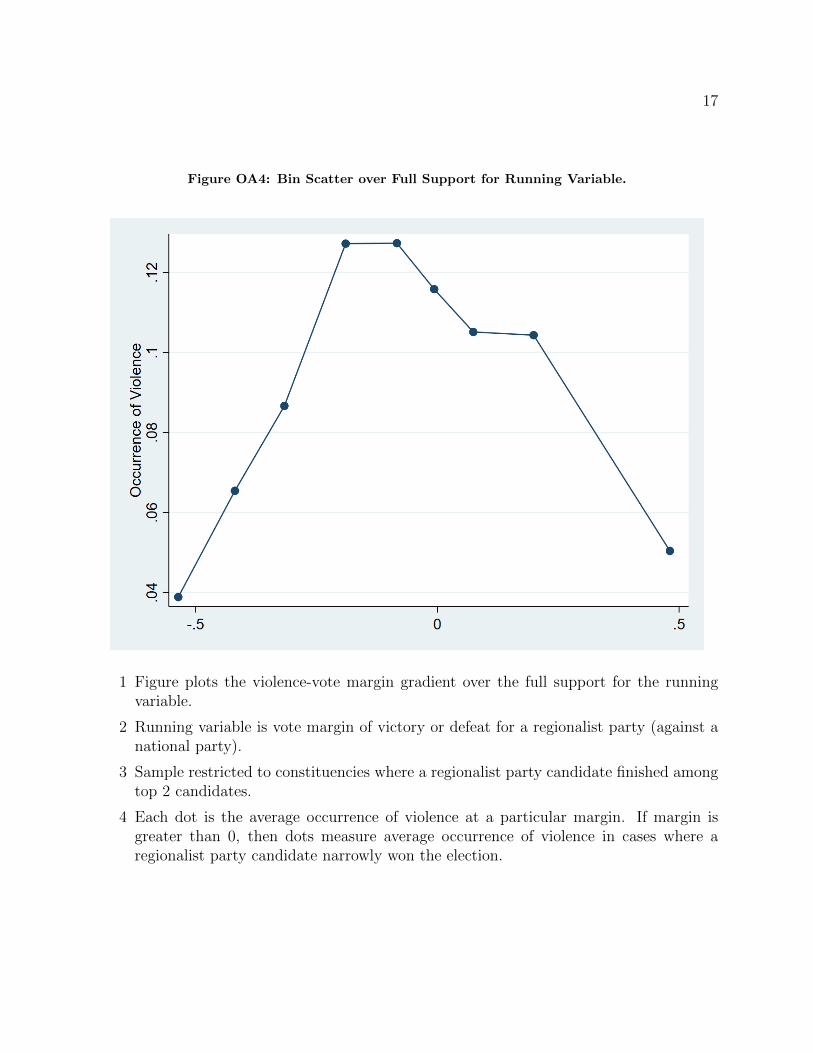
17
Figure OA4: Bin Scatter over Full Support for Running Variable.
1 Figure plots the violence-vote margin gradient over the full support for the runningvariable.
2 Running variable is vote margin of victory or defeat for a regionalist party (against anational party).
3 Sample restricted to constituencies where a regionalist party candidate finished amongtop 2 candidates.
4 Each dot is the average occurrence of violence at a particular margin. If margin isgreater than 0, then dots measure average occurrence of violence in cases where aregionalist party candidate narrowly won the election.

18
Figure OA5: Regionalist Parties and Political Violence by Party that Controls the State.
1 rd plots corresponding to baseline estimates in Table 3. Figure suggests that the rdestimate for the full sample (top left figure) can be explained largely by cases wherethe regionalist party controlled the state government, less so by cases where a non-regionalist controlled the state government, and not at all by cases where the stategovernment was controlled by the inc/bjp.
2 Running variable is vote margin of victory or defeat for a regionalist party (against anational party).
3 Sample restricted to constituencies where a regionalist party candidate finished amongtop 2 candidates.
4 Each dot is the average occurrence of violence at a particular margin. If margin isgreater than 0, then dots measure average occurrence of violence in cases where aregionalist party candidate narrowly won the election.
5 rd estimate and p-value for mse-optimal bandwidth listed under subfigure title.
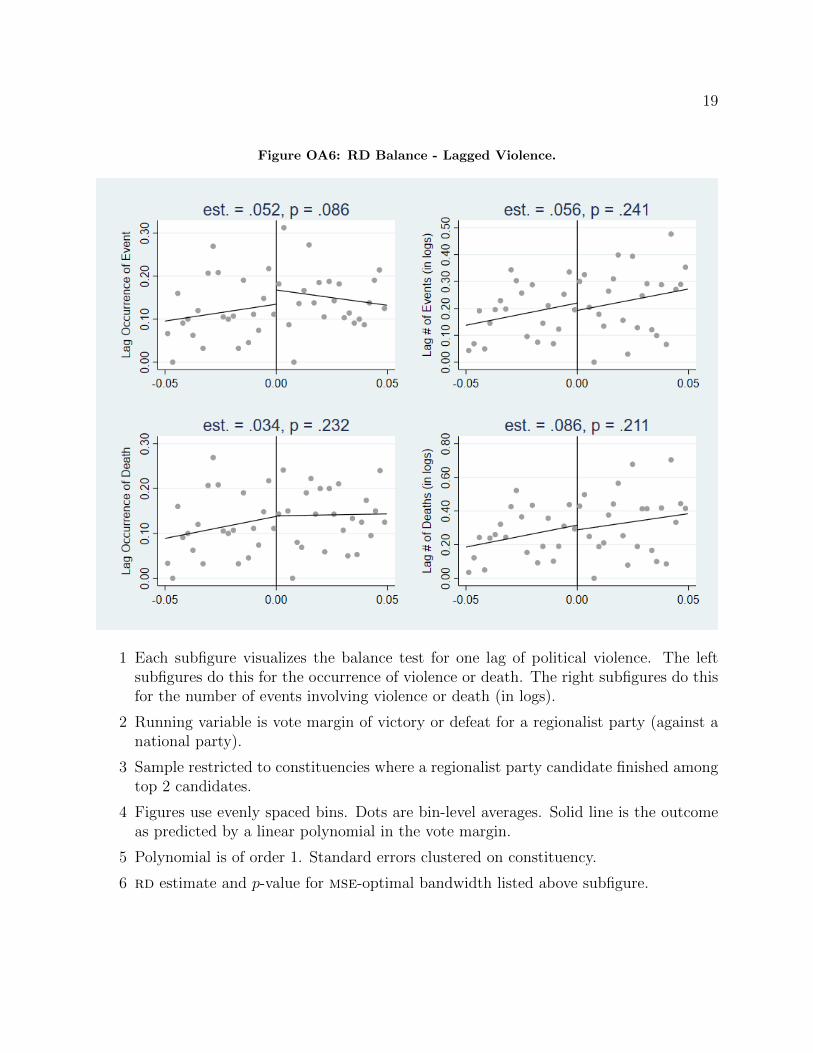
19
Figure OA6: RD Balance - Lagged Violence.
1 Each subfigure visualizes the balance test for one lag of political violence. The leftsubfigures do this for the occurrence of violence or death. The right subfigures do thisfor the number of events involving violence or death (in logs).
2 Running variable is vote margin of victory or defeat for a regionalist party (against anational party).
3 Sample restricted to constituencies where a regionalist party candidate finished amongtop 2 candidates.
4 Figures use evenly spaced bins. Dots are bin-level averages. Solid line is the outcomeas predicted by a linear polynomial in the vote margin.
5 Polynomial is of order 1. Standard errors clustered on constituency.
6 rd estimate and p-value for mse-optimal bandwidth listed above subfigure.
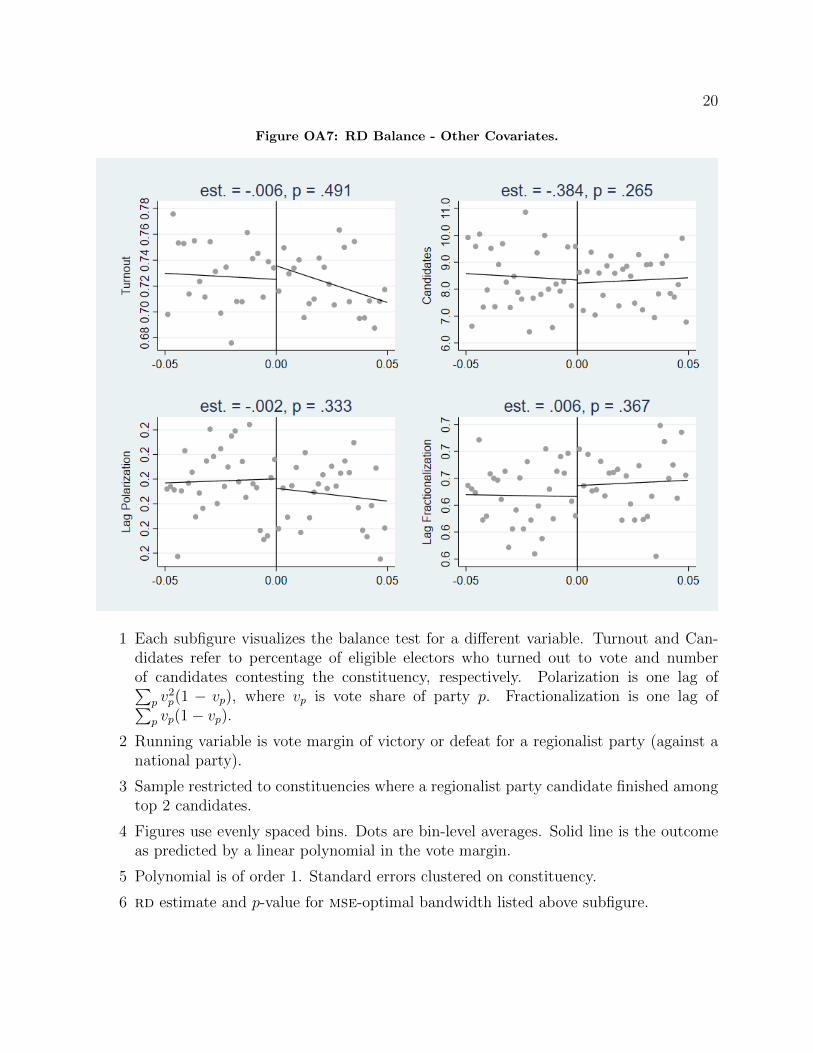
20
Figure OA7: RD Balance - Other Covariates.
1 Each subfigure visualizes the balance test for a different variable. Turnout and Can-didates refer to percentage of eligible electors who turned out to vote and numberof candidates contesting the constituency, respectively. Polarization is one lag of∑
p v2p(1 − vp), where vp is vote share of party p. Fractionalization is one lag of∑
p vp(1− vp).2 Running variable is vote margin of victory or defeat for a regionalist party (against a
national party).
3 Sample restricted to constituencies where a regionalist party candidate finished amongtop 2 candidates.
4 Figures use evenly spaced bins. Dots are bin-level averages. Solid line is the outcomeas predicted by a linear polynomial in the vote margin.
5 Polynomial is of order 1. Standard errors clustered on constituency.
6 rd estimate and p-value for mse-optimal bandwidth listed above subfigure.
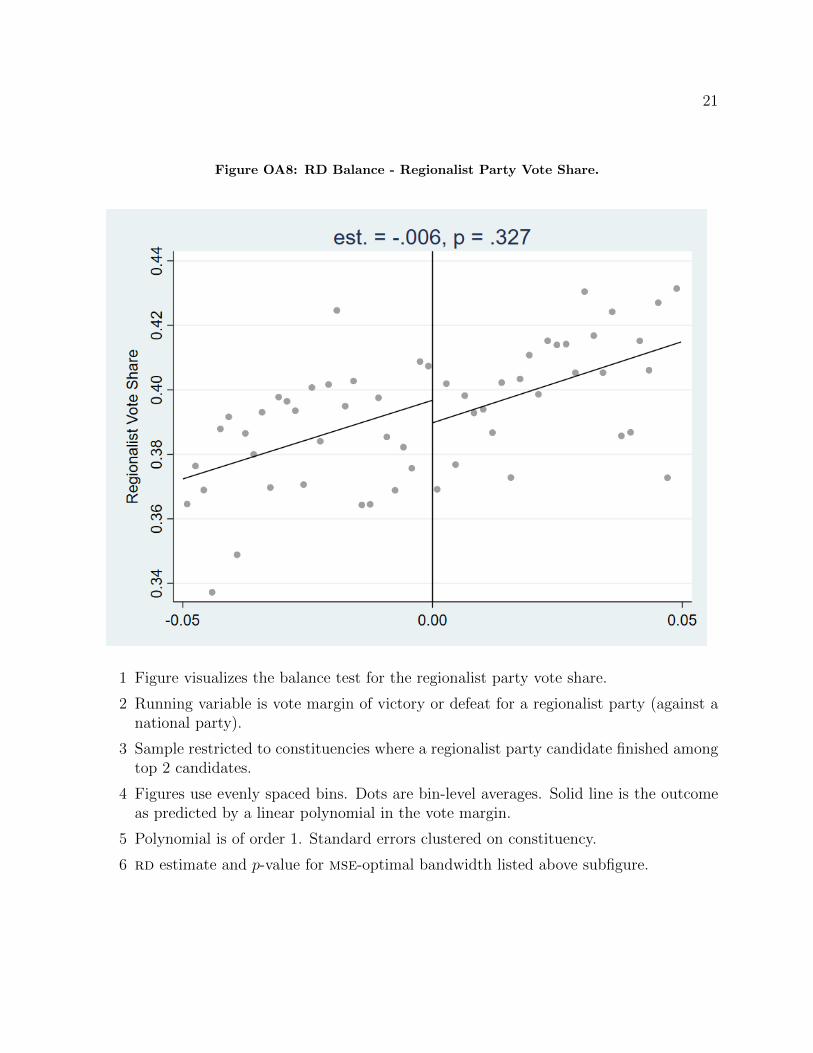
21
Figure OA8: RD Balance - Regionalist Party Vote Share.
1 Figure visualizes the balance test for the regionalist party vote share.
2 Running variable is vote margin of victory or defeat for a regionalist party (against anational party).
3 Sample restricted to constituencies where a regionalist party candidate finished amongtop 2 candidates.
4 Figures use evenly spaced bins. Dots are bin-level averages. Solid line is the outcomeas predicted by a linear polynomial in the vote margin.
5 Polynomial is of order 1. Standard errors clustered on constituency.
6 rd estimate and p-value for mse-optimal bandwidth listed above subfigure.
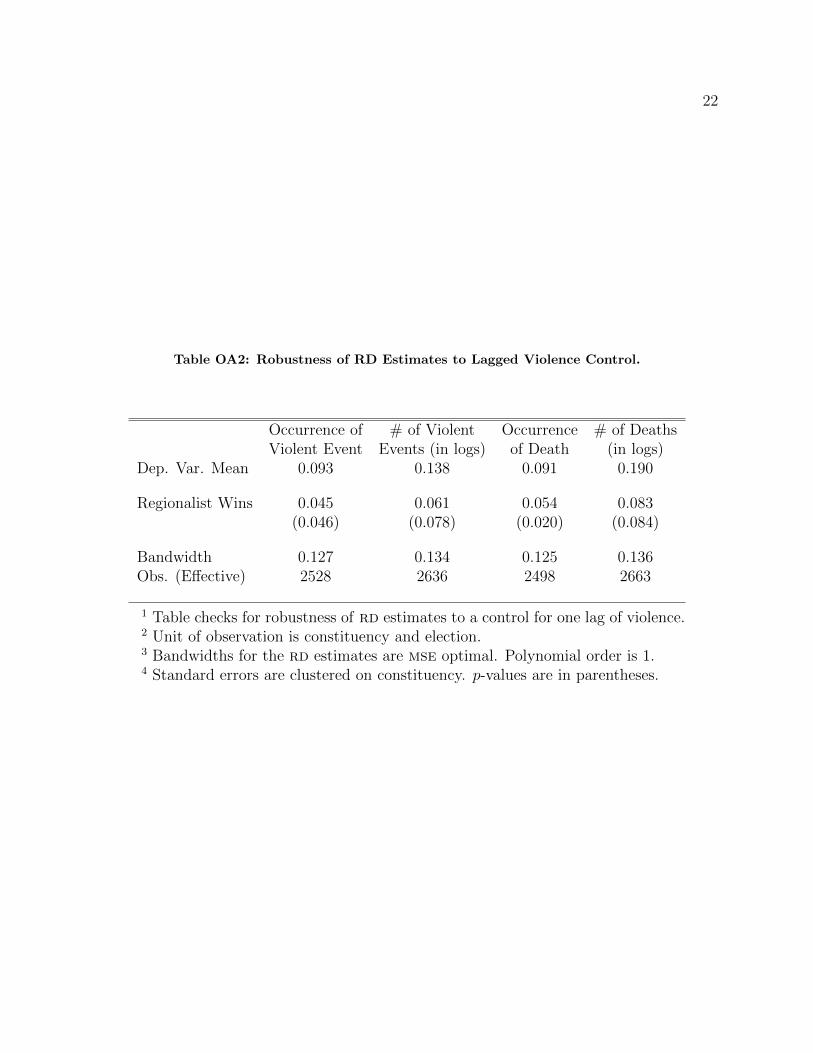
22
Table OA2: Robustness of RD Estimates to Lagged Violence Control.
Occurrence of # of Violent Occurrence # of DeathsViolent Event Events (in logs) of Death (in logs)
Dep. Var. Mean 0.093 0.138 0.091 0.190
Regionalist Wins 0.045 0.061 0.054 0.083(0.046) (0.078) (0.020) (0.084)
Bandwidth 0.127 0.134 0.125 0.136Obs. (Effective) 2528 2636 2498 2663
1 Table checks for robustness of rd estimates to a control for one lag of violence.2 Unit of observation is constituency and election.3 Bandwidths for the rd estimates are mse optimal. Polynomial order is 1.4 Standard errors are clustered on constituency. p-values are in parentheses.

Table OA3: RD Estimates - First 2 Years After Election.
Occurrence of # of Violent Occurrence # of DeathsViolent Event Events (in logs) of Death (in logs)
Dep. Var. Mean 0.096 0.145 0.094 0.198
Regionalist Wins 0.046 0.099 0.072 0.134(0.027) (0.037) (0.005) (0.042)
Bandwidth 0.127 0.139 0.118 0.137Obs. (Effective) 3107 3305 2955 3271
1 Table reports estimates of baseline specification for political violence in the twoyears following the election. It shows that the increased violence takes placewell ahead of the lead up to the next election.
2 Unit of observation is constituency and election.3 Dependent variable mean is based on subsample.4 Bandwidths for the rd estimates are mse optimal. Polynomial order is 1.5 Standard errors are clustered on constituency. p-values are in parentheses.
23

Table OA4: Regionalist vs Non-Regionalist Incumbent
Occurrence of # of Violent Occurrence # of DeathsViolent Event Events (in logs) of Death (in logs)
Regionalist IncumbentDep. Var. Mean 0.104 0.175 0.102 0.231
Regionalist Wins 0.104 0.104 0.105 0.170(0.011) (0.202) (0.011) (0.134)
Bandwidth 0.129 0.099 0.127 0.107Obs. (Effective) 987 804 976 865
Non-Regionalist IncumbentDep. Var. Mean 0.113 0.184 0.126 0.259
Regionalist Wins 0.083 0.129 0.084 0.160(0.060) (0.100) (0.061) (0.155)
Bandwidth 0.113 0.141 0.109 0.127Obs. (Effective) 914 1044 894 980
1 Table compares estimate in subsample where regionalist is incumbent (top panel)with estimate in subsample where non-regionalist is incumbent.
2 The unit of observation is the constituency and election.3 Dependent variable means are based on the subsample.4 Bandwidths for rd estimates are mse optimal. Polynomial order is 1.5 Standard errors are clustered at the level of constituency. p-values are in paren-
theses.
24
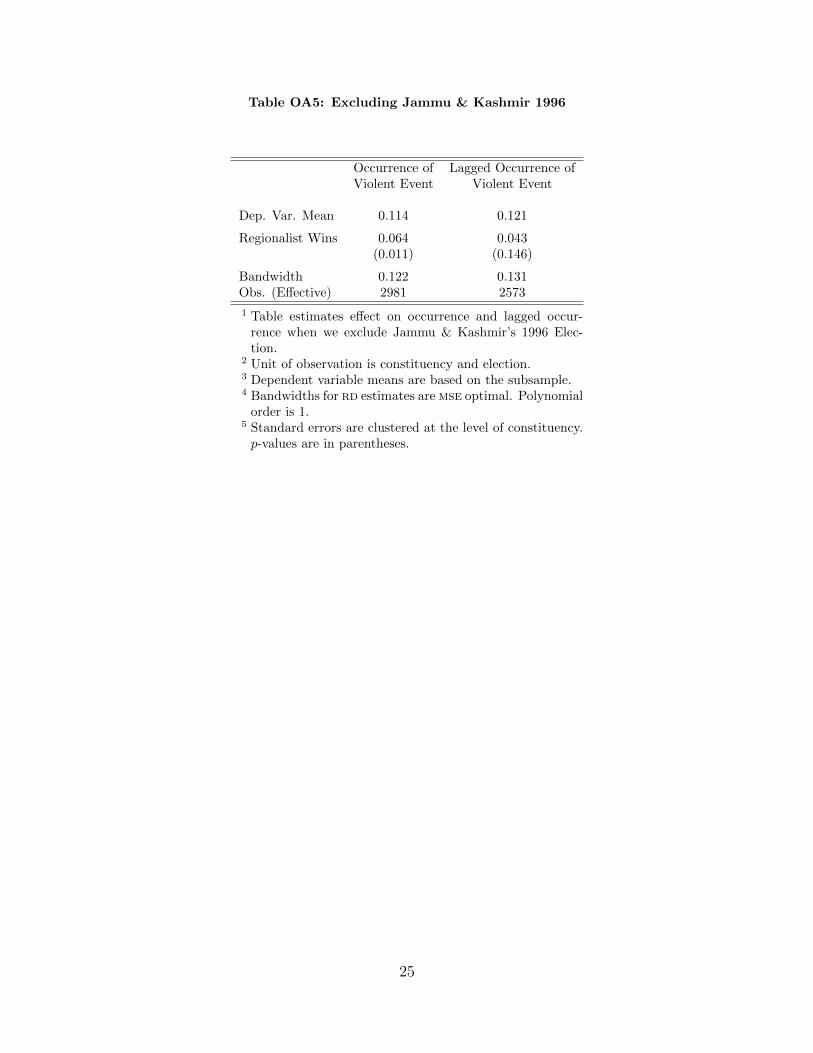
Table OA5: Excluding Jammu & Kashmir 1996
Occurrence of Lagged Occurrence ofViolent Event Violent Event
Dep. Var. Mean 0.114 0.121
Regionalist Wins 0.064 0.043(0.011) (0.146)
Bandwidth 0.122 0.131Obs. (Effective) 2981 2573
1 Table estimates effect on occurrence and lagged occur-rence when we exclude Jammu & Kashmir’s 1996 Elec-tion.
2 Unit of observation is constituency and election.3 Dependent variable means are based on the subsample.4 Bandwidths for rd estimates are mse optimal. Polynomial
order is 1.5 Standard errors are clustered at the level of constituency.p-values are in parentheses.
25

26
Figure OA9: Robustness to Bandwidth Choice.
1 Figure visualizes the robustness of the baseline estimates to bandwidth choice.
2 Grey dots are defined by the point estimate and bandwidth combination. Vertical lineswith bars at the endpoints depict 95 percent confidence intervals.
3 Polynomial is of order 1.
4 Standard errors clustered on constituency.
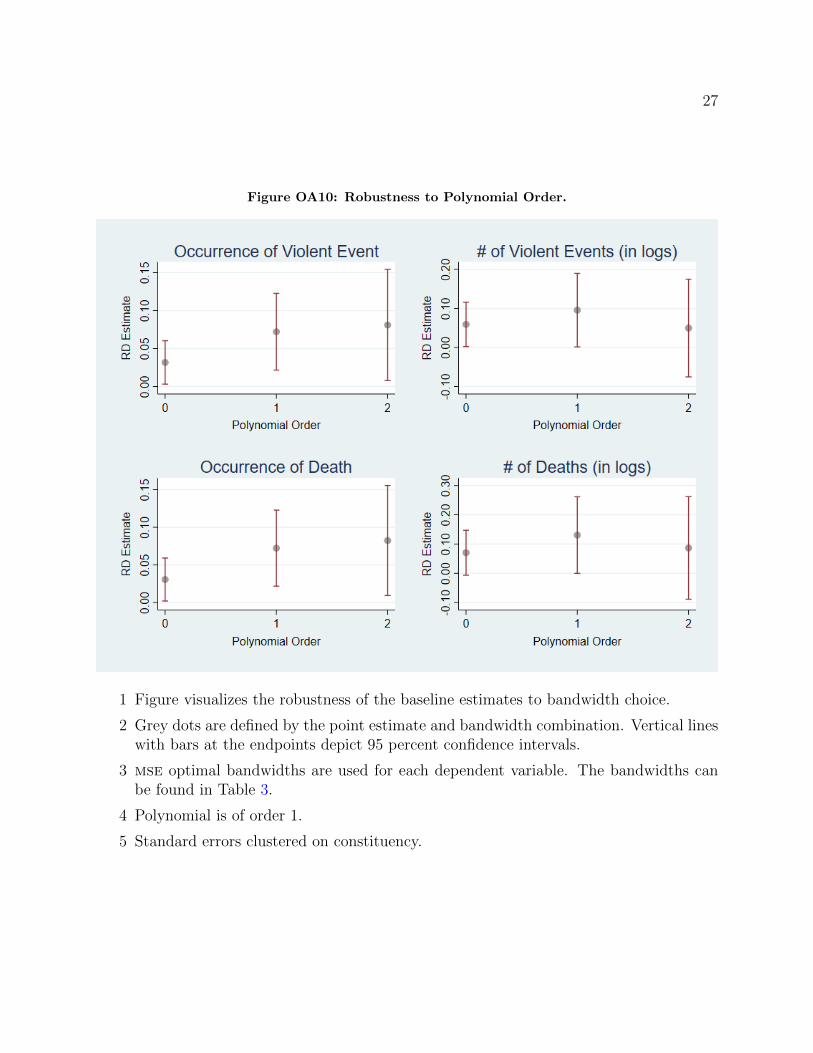
27
Figure OA10: Robustness to Polynomial Order.
1 Figure visualizes the robustness of the baseline estimates to bandwidth choice.
2 Grey dots are defined by the point estimate and bandwidth combination. Vertical lineswith bars at the endpoints depict 95 percent confidence intervals.
3 mse optimal bandwidths are used for each dependent variable. The bandwidths canbe found in Table 3.
4 Polynomial is of order 1.
5 Standard errors clustered on constituency.
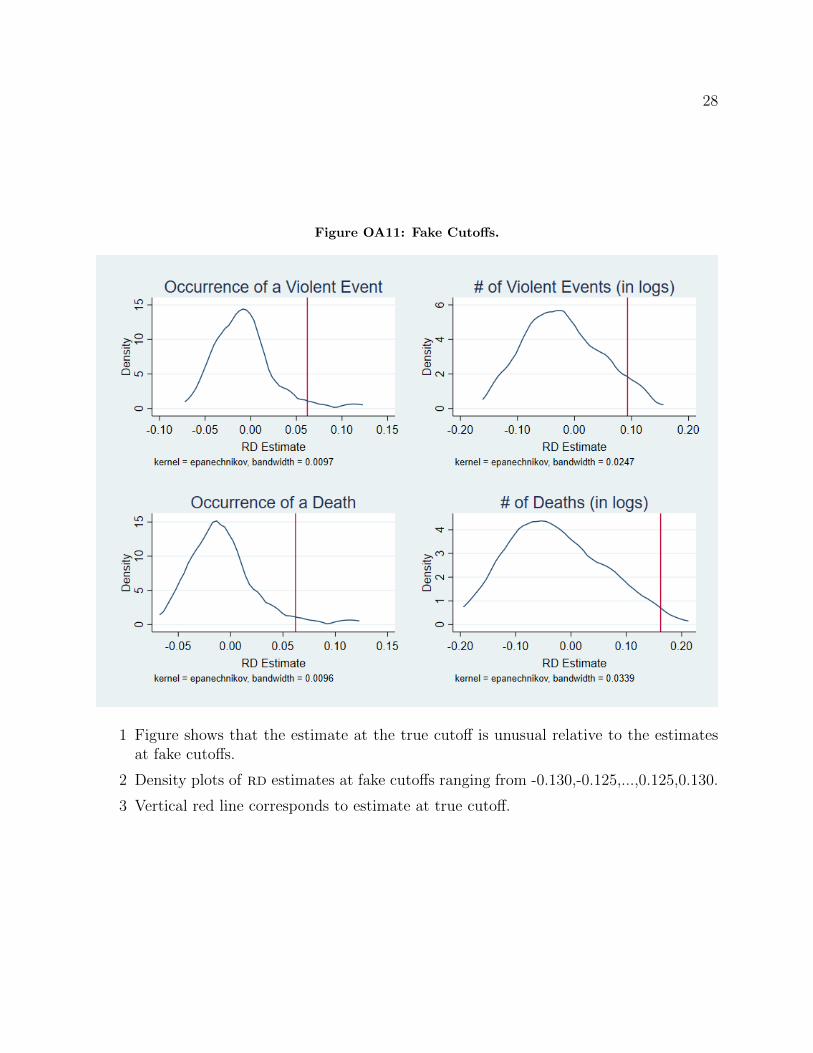
28
Figure OA11: Fake Cutoffs.
1 Figure shows that the estimate at the true cutoff is unusual relative to the estimatesat fake cutoffs.
2 Density plots of rd estimates at fake cutoffs ranging from -0.130,-0.125,...,0.125,0.130.
3 Vertical red line corresponds to estimate at true cutoff.
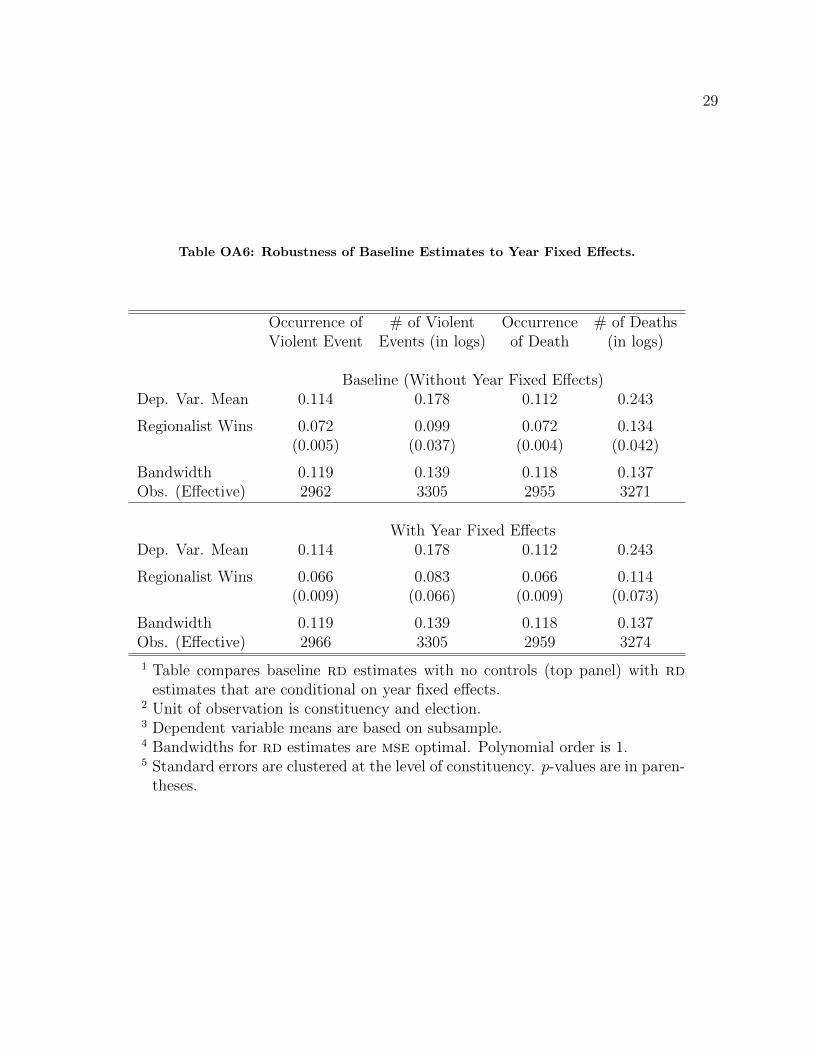
29
Table OA6: Robustness of Baseline Estimates to Year Fixed Effects.
Occurrence of # of Violent Occurrence # of DeathsViolent Event Events (in logs) of Death (in logs)
Baseline (Without Year Fixed Effects)Dep. Var. Mean 0.114 0.178 0.112 0.243
Regionalist Wins 0.072 0.099 0.072 0.134(0.005) (0.037) (0.004) (0.042)
Bandwidth 0.119 0.139 0.118 0.137Obs. (Effective) 2962 3305 2955 3271
With Year Fixed EffectsDep. Var. Mean 0.114 0.178 0.112 0.243
Regionalist Wins 0.066 0.083 0.066 0.114(0.009) (0.066) (0.009) (0.073)
Bandwidth 0.119 0.139 0.118 0.137Obs. (Effective) 2966 3305 2959 3274
1 Table compares baseline rd estimates with no controls (top panel) with rdestimates that are conditional on year fixed effects.
2 Unit of observation is constituency and election.3 Dependent variable means are based on subsample.4 Bandwidths for rd estimates are mse optimal. Polynomial order is 1.5 Standard errors are clustered at the level of constituency. p-values are in paren-
theses.
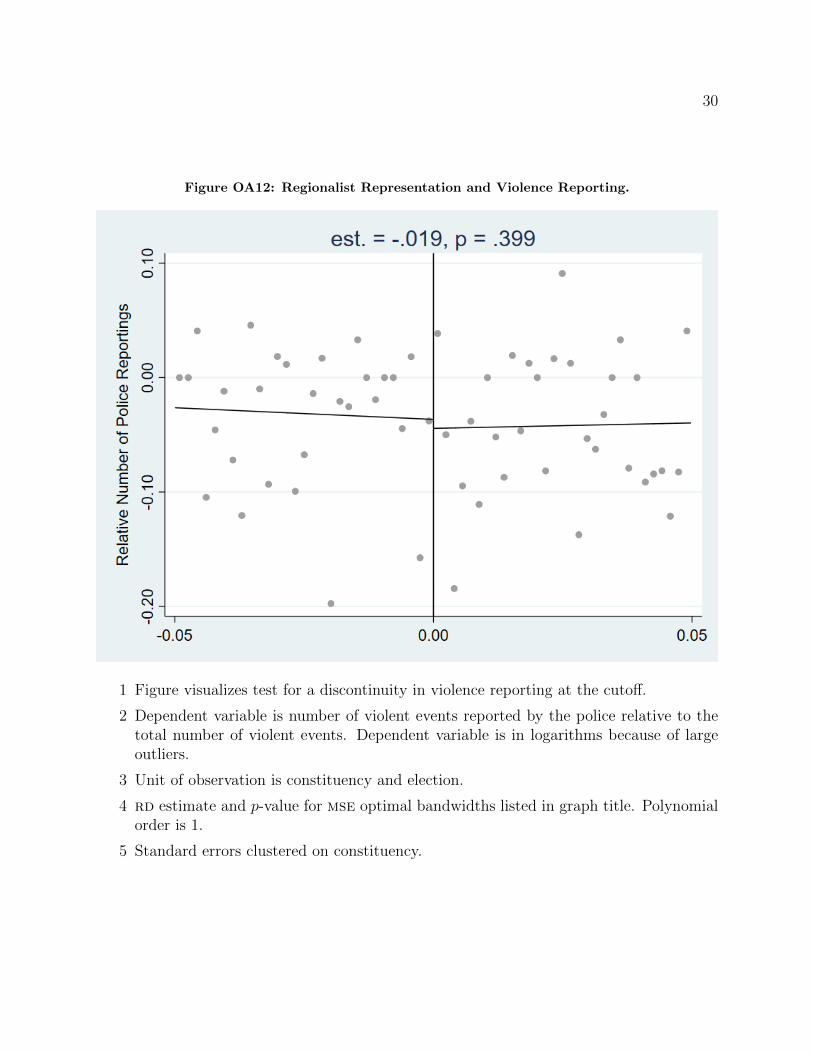
30
Figure OA12: Regionalist Representation and Violence Reporting.
1 Figure visualizes test for a discontinuity in violence reporting at the cutoff.
2 Dependent variable is number of violent events reported by the police relative to thetotal number of violent events. Dependent variable is in logarithms because of largeoutliers.
3 Unit of observation is constituency and election.
4 rd estimate and p-value for mse optimal bandwidths listed in graph title. Polynomialorder is 1.
5 Standard errors clustered on constituency.
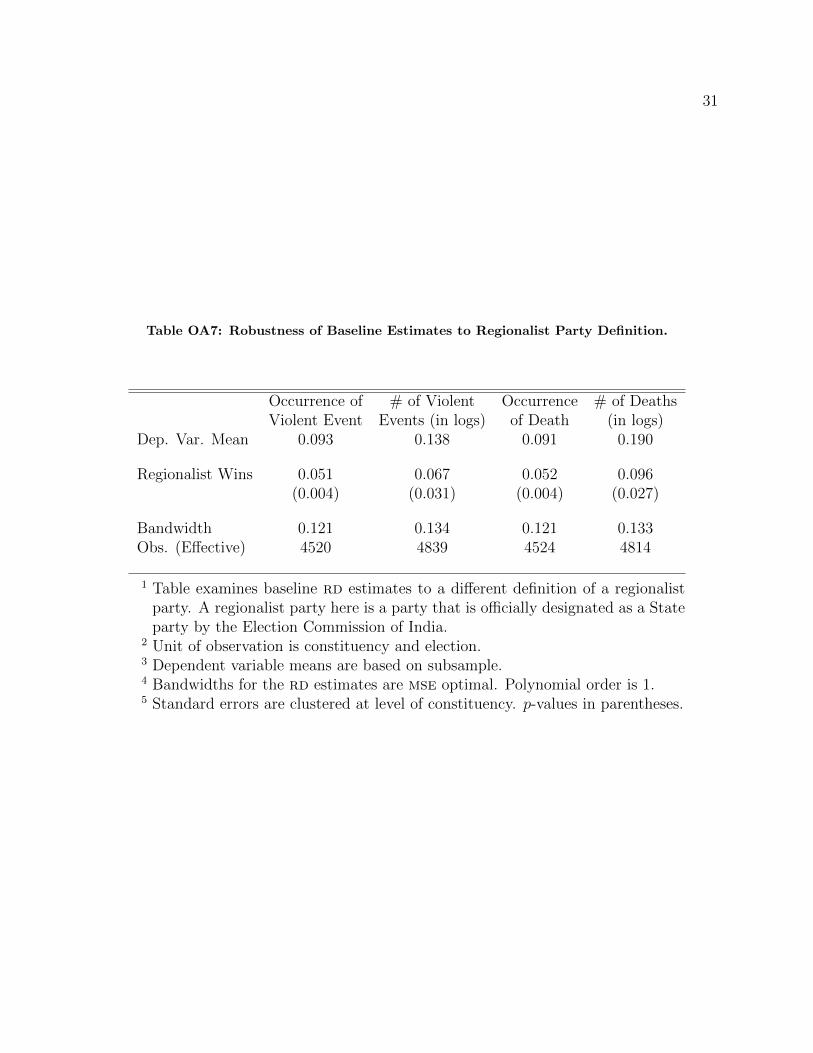
31
Table OA7: Robustness of Baseline Estimates to Regionalist Party Definition.
Occurrence of # of Violent Occurrence # of DeathsViolent Event Events (in logs) of Death (in logs)
Dep. Var. Mean 0.093 0.138 0.091 0.190
Regionalist Wins 0.051 0.067 0.052 0.096(0.004) (0.031) (0.004) (0.027)
Bandwidth 0.121 0.134 0.121 0.133Obs. (Effective) 4520 4839 4524 4814
1 Table examines baseline rd estimates to a different definition of a regionalistparty. A regionalist party here is a party that is officially designated as a Stateparty by the Election Commission of India.
2 Unit of observation is constituency and election.3 Dependent variable means are based on subsample.4 Bandwidths for the rd estimates are mse optimal. Polynomial order is 1.5 Standard errors are clustered at level of constituency. p-values in parentheses.
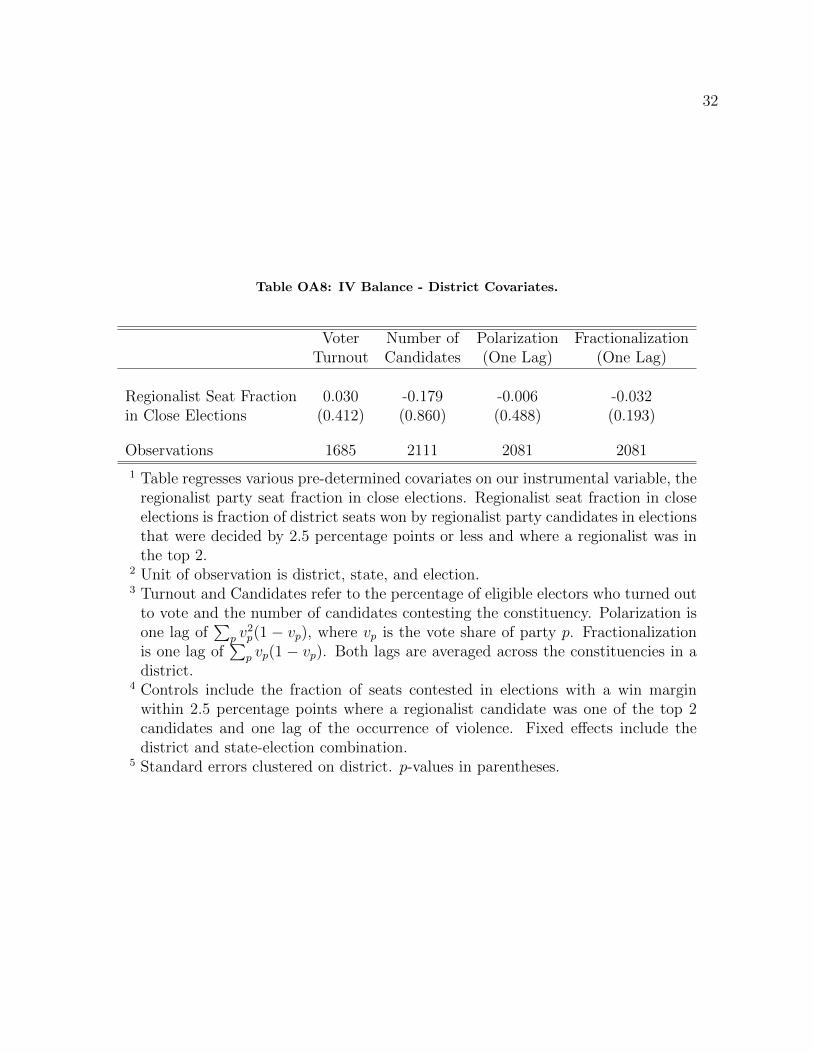
32
Table OA8: IV Balance - District Covariates.
Voter Number of Polarization FractionalizationTurnout Candidates (One Lag) (One Lag)
Regionalist Seat Fraction 0.030 -0.179 -0.006 -0.032in Close Elections (0.412) (0.860) (0.488) (0.193)
Observations 1685 2111 2081 2081
1 Table regresses various pre-determined covariates on our instrumental variable, theregionalist party seat fraction in close elections. Regionalist seat fraction in closeelections is fraction of district seats won by regionalist party candidates in electionsthat were decided by 2.5 percentage points or less and where a regionalist was inthe top 2.
2 Unit of observation is district, state, and election.3 Turnout and Candidates refer to the percentage of eligible electors who turned out
to vote and the number of candidates contesting the constituency. Polarization isone lag of
∑p v
2p(1 − vp), where vp is the vote share of party p. Fractionalization
is one lag of∑
p vp(1 − vp). Both lags are averaged across the constituencies in adistrict.
4 Controls include the fraction of seats contested in elections with a win marginwithin 2.5 percentage points where a regionalist candidate was one of the top 2candidates and one lag of the occurrence of violence. Fixed effects include thedistrict and state-election combination.
5 Standard errors clustered on district. p-values in parentheses.
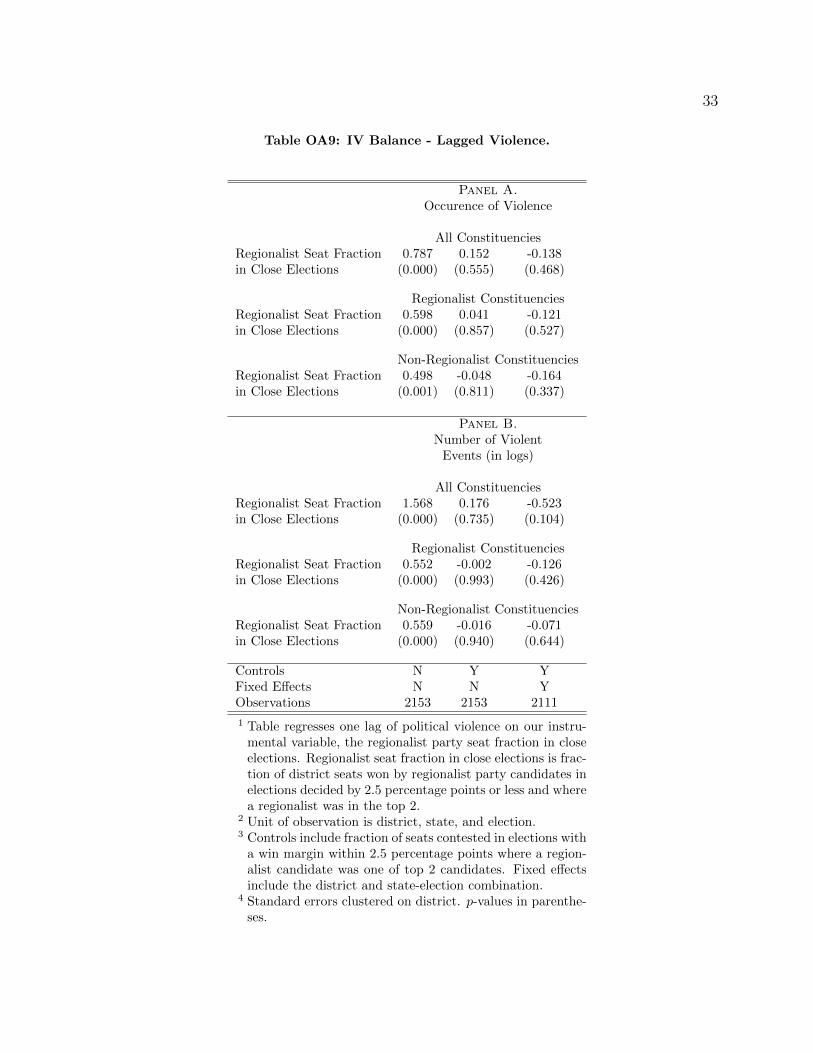
33
Table OA9: IV Balance - Lagged Violence.
Panel A.Occurence of Violence
All ConstituenciesRegionalist Seat Fraction 0.787 0.152 -0.138in Close Elections (0.000) (0.555) (0.468)
Regionalist ConstituenciesRegionalist Seat Fraction 0.598 0.041 -0.121in Close Elections (0.000) (0.857) (0.527)
Non-Regionalist ConstituenciesRegionalist Seat Fraction 0.498 -0.048 -0.164in Close Elections (0.001) (0.811) (0.337)
Panel B.Number of Violent
Events (in logs)
All ConstituenciesRegionalist Seat Fraction 1.568 0.176 -0.523in Close Elections (0.000) (0.735) (0.104)
Regionalist ConstituenciesRegionalist Seat Fraction 0.552 -0.002 -0.126in Close Elections (0.000) (0.993) (0.426)
Non-Regionalist ConstituenciesRegionalist Seat Fraction 0.559 -0.016 -0.071in Close Elections (0.000) (0.940) (0.644)
Controls N Y YFixed Effects N N YObservations 2153 2153 2111
1 Table regresses one lag of political violence on our instru-mental variable, the regionalist party seat fraction in closeelections. Regionalist seat fraction in close elections is frac-tion of district seats won by regionalist party candidates inelections decided by 2.5 percentage points or less and wherea regionalist was in the top 2.
2 Unit of observation is district, state, and election.3 Controls include fraction of seats contested in elections with
a win margin within 2.5 percentage points where a region-alist candidate was one of top 2 candidates. Fixed effectsinclude the district and state-election combination.
4 Standard errors clustered on district. p-values in parenthe-ses.
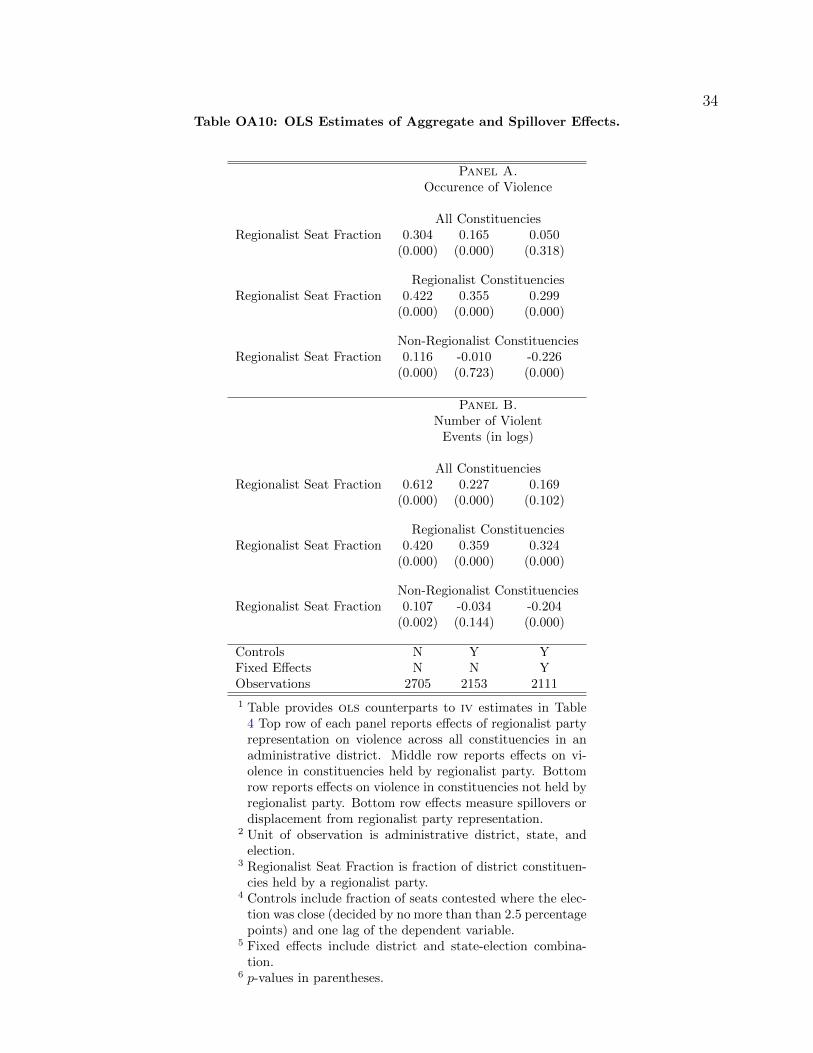
34
Table OA10: OLS Estimates of Aggregate and Spillover Effects.
Panel A.Occurence of Violence
All ConstituenciesRegionalist Seat Fraction 0.304 0.165 0.050
(0.000) (0.000) (0.318)
Regionalist ConstituenciesRegionalist Seat Fraction 0.422 0.355 0.299
(0.000) (0.000) (0.000)
Non-Regionalist ConstituenciesRegionalist Seat Fraction 0.116 -0.010 -0.226
(0.000) (0.723) (0.000)
Panel B.Number of Violent
Events (in logs)
All ConstituenciesRegionalist Seat Fraction 0.612 0.227 0.169
(0.000) (0.000) (0.102)
Regionalist ConstituenciesRegionalist Seat Fraction 0.420 0.359 0.324
(0.000) (0.000) (0.000)
Non-Regionalist ConstituenciesRegionalist Seat Fraction 0.107 -0.034 -0.204
(0.002) (0.144) (0.000)
Controls N Y YFixed Effects N N YObservations 2705 2153 2111
1 Table provides ols counterparts to iv estimates in Table4 Top row of each panel reports effects of regionalist partyrepresentation on violence across all constituencies in anadministrative district. Middle row reports effects on vi-olence in constituencies held by regionalist party. Bottomrow reports effects on violence in constituencies not held byregionalist party. Bottom row effects measure spillovers ordisplacement from regionalist party representation.
2 Unit of observation is administrative district, state, andelection.
3 Regionalist Seat Fraction is fraction of district constituen-cies held by a regionalist party.
4 Controls include fraction of seats contested where the elec-tion was close (decided by no more than than 2.5 percentagepoints) and one lag of the dependent variable.
5 Fixed effects include district and state-election combina-tion.
6 p-values in parentheses.
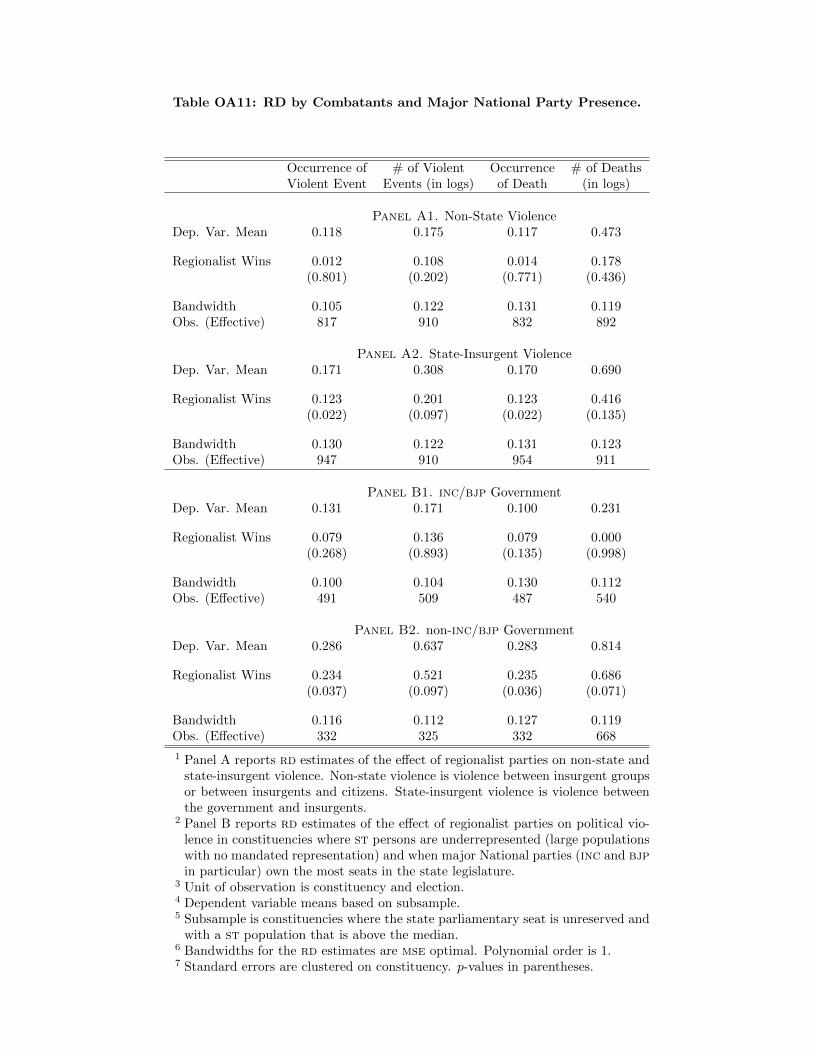
Table OA11: RD by Combatants and Major National Party Presence.
Occurrence of # of Violent Occurrence # of DeathsViolent Event Events (in logs) of Death (in logs)
Panel A1. Non-State ViolenceDep. Var. Mean 0.118 0.175 0.117 0.473
Regionalist Wins 0.012 0.108 0.014 0.178(0.801) (0.202) (0.771) (0.436)
Bandwidth 0.105 0.122 0.131 0.119Obs. (Effective) 817 910 832 892
Panel A2. State-Insurgent ViolenceDep. Var. Mean 0.171 0.308 0.170 0.690
Regionalist Wins 0.123 0.201 0.123 0.416(0.022) (0.097) (0.022) (0.135)
Bandwidth 0.130 0.122 0.131 0.123Obs. (Effective) 947 910 954 911
Panel B1. inc/bjp GovernmentDep. Var. Mean 0.131 0.171 0.100 0.231
Regionalist Wins 0.079 0.136 0.079 0.000(0.268) (0.893) (0.135) (0.998)
Bandwidth 0.100 0.104 0.130 0.112Obs. (Effective) 491 509 487 540
Panel B2. non-inc/bjp GovernmentDep. Var. Mean 0.286 0.637 0.283 0.814
Regionalist Wins 0.234 0.521 0.235 0.686(0.037) (0.097) (0.036) (0.071)
Bandwidth 0.116 0.112 0.127 0.119Obs. (Effective) 332 325 332 668
1 Panel A reports rd estimates of the effect of regionalist parties on non-state andstate-insurgent violence. Non-state violence is violence between insurgent groupsor between insurgents and citizens. State-insurgent violence is violence betweenthe government and insurgents.
2 Panel B reports rd estimates of the effect of regionalist parties on political vio-lence in constituencies where st persons are underrepresented (large populationswith no mandated representation) and when major National parties (inc and bjpin particular) own the most seats in the state legislature.
3 Unit of observation is constituency and election.4 Dependent variable means based on subsample.5 Subsample is constituencies where the state parliamentary seat is unreserved and
with a st population that is above the median.6 Bandwidths for the rd estimates are mse optimal. Polynomial order is 1.7 Standard errors are clustered on constituency. p-values in parentheses.

36
Table OA12: IV Balance - NSS Households.
High st Population StrataHousehold Land Possessed
Head is Male (log acres)
Regionalist Seat Fraction 4.945 -4.539in Close Elections (0.302) (0.664)
Observations 10722 10540R2 0.086 0.311
Low st Population StrataHousehold Land Possessed
Head is Male (log acres)
Regionalist Seat Fraction 1.161 7.388in Close Elections (0.500) (0.567)
Observations 2497 2312R2 0.161 0.294
1 Table regresses various pre-determined covariates on ourinstrumental variable, the regionalist party seat fraction inclose elections. Regionalist seat fraction in close electionsis fraction of superdistrict seats won by regionalist partycandidates in elections that were decided by 2.5 percentagepoints or less and where a regionalist was in the top 2.
2 Unit of observation is st-household.3 Controls include the fraction of seats contested in elections
with a win margin within 2.5 percentage points where aregionalist candidate was one of the top 2 candidates andone lag of the occurrence of violence. Regressions alsoinclude fixed effects for the state, stratum, village type(tribal majority or not), hamlet type (tribal majority ornot), sample (general versus special), tribe, and surveyround (4).
4 Standard errors are clustered on superdistrict. p-values inparentheses.
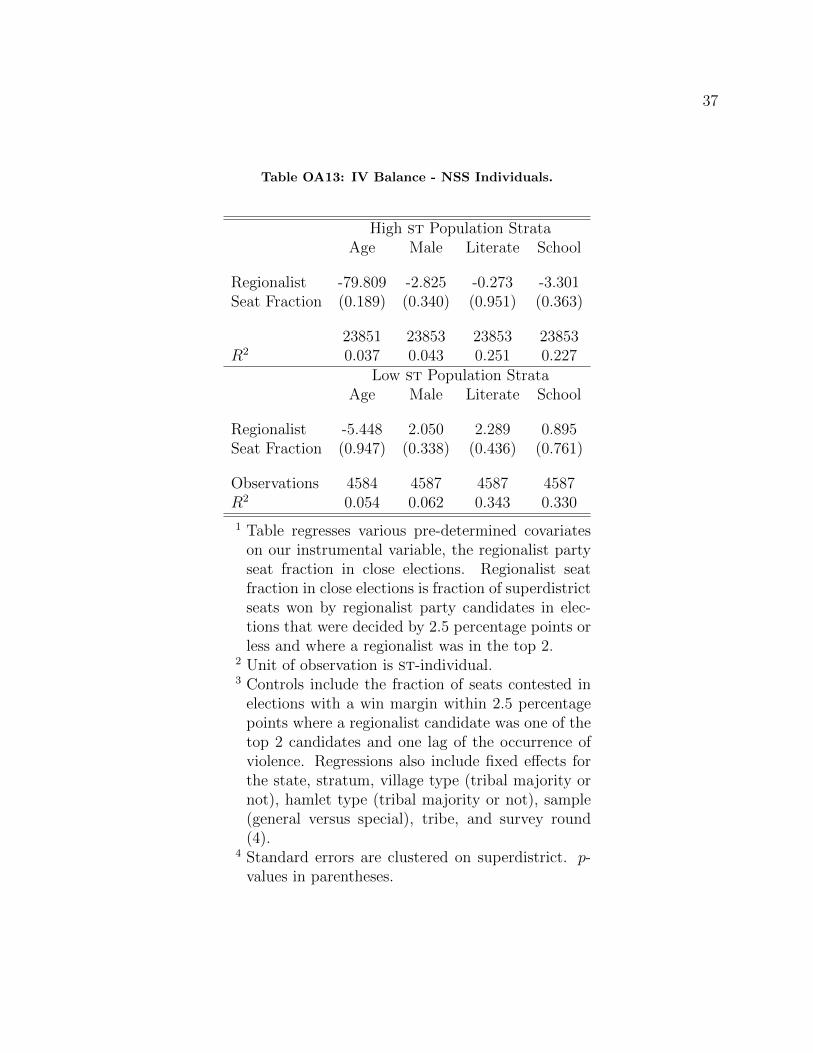
37
Table OA13: IV Balance - NSS Individuals.
High st Population StrataAge Male Literate School
Regionalist -79.809 -2.825 -0.273 -3.301Seat Fraction (0.189) (0.340) (0.951) (0.363)
23851 23853 23853 23853R2 0.037 0.043 0.251 0.227
Low st Population StrataAge Male Literate School
Regionalist -5.448 2.050 2.289 0.895Seat Fraction (0.947) (0.338) (0.436) (0.761)
Observations 4584 4587 4587 4587R2 0.054 0.062 0.343 0.330
1 Table regresses various pre-determined covariateson our instrumental variable, the regionalist partyseat fraction in close elections. Regionalist seatfraction in close elections is fraction of superdistrictseats won by regionalist party candidates in elec-tions that were decided by 2.5 percentage points orless and where a regionalist was in the top 2.
2 Unit of observation is st-individual.3 Controls include the fraction of seats contested in
elections with a win margin within 2.5 percentagepoints where a regionalist candidate was one of thetop 2 candidates and one lag of the occurrence ofviolence. Regressions also include fixed effects forthe state, stratum, village type (tribal majority ornot), hamlet type (tribal majority or not), sample(general versus special), tribe, and survey round(4).
4 Standard errors are clustered on superdistrict. p-values in parentheses.

38