Embed Size (px)
Citation preview

Regional variation in histopathologic featuresof tumor specimens from treatment-naiveglioblastoma correlates with anatomic andphysiologic MR Imaging
Ramon F. Barajas Jr, Joanna J. Phillips, Rupa Parvataneni, Annette Molinaro,Emma Essock-Burns, Gabriela Bourne, Andrew T. Parsa, Manish K. Aghi,Michael W. McDermott, Mitchel S. Berger, Soonmee Cha,Susan M. Chang, and Sarah J. Nelson
Department of Radiology and Biomedical Imaging (R.F.B., R.P., E.E.-B., G.B., S.C., S.J.N.); Department of
Pathology (J.J.P.); Department of Neurological Surgery, University of California, San Francisco, California
(A.M., A.T.P., M.K.A., M.W.M., M.S.B., S.C., S.M.C.)
Histopathologic evaluation of glioblastoma multiforme(GBM) at initial diagnosis is typically performed ontissue obtained from regions of contrast enhancement(CE) as depicted on gadolinium-enhanced, T1-weightedimages. The non-enhancing (NE) portion of the lesion,which contains both reactive edema and infiltrativetumor, is only partially removed due to concerns aboutdamaging functioning brain. The purpose of this studywas to evaluate histopathologic and physiologic MRIfeatures of image-guided tissue specimens from CE andNE regions to investigate correlations between imagingand histopathologic parameters. One hundred nineteentissue specimens (93 CE and 26 NE regions) were ac-quired from 51 patients with newly diagnosed GBMby utilizing stereotactic image-guided sampling.Variables of anatomic, diffusion-weighted imaging(DWI), and dynamic susceptibility–weighted, contrast-enhanced perfusion imaging (DSC) from each tissuesample location were obtained and compared withhistopathologic features such as tumor score, celldensity, proliferation, architectural disruption, hypoxia,and microvascular hyperplasia. Tissue samples from CEregions had increased tumor score, cellular density,proliferation, and architectural disruption comparedwith NE regions. DSC variables such as relative cerebral
blood volume, peak height, and recovery factor weresignificantly higher, and the percentage of signal intensityrecovery was significantly lower in the CE compared withthe NE regions. DWI variables were correlated withhistopathologic features of GBM within NE regions.Image-guided tissue acquisition and assessment of residualtumor from treatment-naive GBM should be guided byDSC in CE regions and by DWI in NE regions.
Keywords: dynamic susceptibility contrast-enhancedimaging, diffusion-weighted imaging, glioblastoma,image-guided tissue acquisition, magnetic resonanceimaging.
Glioblastoma multiforme (GBM) is the mostcommon and aggressive primary brain tumor inadults and demonstrates heterogeneous imaging
characteristics, histologic features, and clinical outcomes.Despite significant advances in targeted surgical resectionand conformal radiation therapy, GBM remains a uni-formly deadly disease with a dismal prognosis of lessthan 10% 2-year overall survival.1–6 The presence of infil-trative tumor makes it difficult to define tumor margins, asregions with malignant features are intermingled withinfunctioning brain that cannot be removed without severedetriment to the patient. Although it may be possible toachieve a gross total resection of the contrast-enhanced(CE) component of the lesion, there is often a substantialnon-enhancing (NE) tumor component that is left behindand eventually becomes the site of focal recurrence.
The current standard for diagnosis and evaluation ofprognosis for GBM remains histopathologic analysis of
Corresponding Author: Sarah J. Nelson, PhD, University of California,
San Francisco, Department of Radiology and Biomedical Imaging,
Mission Bay, Byers Hall, Room BH-303, MC 2532, 1700 4th Street,
San Francisco, CA 94158-2330 ([email protected]).
Received February 13, 2012; accepted April 18, 2012.
Neuro-Oncology 14(7):942–954, 2012.doi:10.1093/neuonc/nos128 NEURO-ONCOLOGY
# The Author(s) 2012. Published by Oxford University Press on behalf of the Society for Neuro-Oncology.All rights reserved. For permissions, please e-mail: [email protected] from https://academic.oup.com/neuro-oncology/article-abstract/14/7/942/1091877
by gueston 30 March 2018
tumor specimens. The World Health Organization II di-agnostic criteria of GBM are based upon the presence ofmicrovascular hyperplasia, cellular proliferation,nuclear atypia, architectural disruption, and necro-sis.3–6 Tissue samples are typically obtained from theCE component of the tumor.5–7 There is rarely an exam-ination of heterogeneity throughout the entirety of thelesion or an attempt to make direct correlationsbetween imaging and histopathologic features. The in-troduction of MRI sequences that provide tissuecontrast based upon physiologic parameters, such asdiffusion-weighted imaging (DWI) and T2* dynamicsusceptibility–weighted, contrast-enhanced perfusionimaging (DSC), holds significant promise for identifyingcharacteristics of GBM that are representative of biolog-ic behavior.7–25 However, there remains the need to un-derstand the relationship of these physiologic imagingmeasures with standard anatomic imaging parametersand histopathologic characteristics so they can collec-tively be utilized to assess tumor burden.7–10
DWI-derived apparent diffusion coefficient (ADC) andfractional anisotropy (FA) values are increasingly utilizedin the evaluation of patients with brain tumors, as thesequantitative measures can be obtained in less than 5 min.ADC and FA values have been previously associated withincreased cell density and disruption of normal tissue archi-tecture.26–29 Recent studies investigating tissue samplesfrompatientswithprimaryCNS lymphomahave suggestedthat there is an inverse correlationbetweenADCvalues andcell density,28,29 but similar studies involving specimensfrom GBM have yielded varied results.29–32
DSC MRI has been widely used to investigate varia-tions in cerebral blood volume (CBV), peak height(PH), recovery factor (RF), and percentage of signal in-tensity recovery (PSR).8–15 Prior investigations haveshown that DSC provides quantitative parameters thatreflect hemodynamic characteristics of normal andtumor microvasculature within the brain and have dem-onstrated its clinical utility as a companion to anatomicMRI differentiating GBM from single brain metasta-sis,8–18 predicting glioma grade,18–21 and distinguishingrecurrent brain tumors from radiation necrosis.33–36
The purpose of the current study was to determinewhether the differential distribution of histologic fea-tures between tissue specimens that were obtainedfrom CE and NE regions of tumor in patients withtreatment-naive GBM is associated with specific ana-tomic and physiologic MRI parameters. This investiga-tion utilized image-guided tumor specimens frompatients undergoing initial surgical resection in conjunc-tion with a battery of histopathologic tests in order tomake direct correlations between their biologic featuresand the corresponding in vivo MRI parameters.
Methods
Patient Population
A total of 51 adult patients (35 men, 16 women; mean age64.5 y, range 33–85) with newly diagnosed GBM were
prospectively enrolled into our study from July 2007 toJune 2010. The study was in compliance with theUniversity of California San Francisco Health InsurancePortability and Accountability Act, our institutionalreview board and Committee on Human Research, andthe ethical human-subject standards of the WorldMedical Association Declaration of Helsinki: Research.Written informed consent was obtained from all patients.
Preoperative Imaging Protocol
Forty-six patients underwent preoperative anatomic andphysiologic MRI using a 3T MR scanner (GE MedicalSystems), and 5 patients were imaged on a 1.5T SignaHorizon scanner (GE Medical Systems). Similar MRI pro-tocol was utilized: 3 plane localizer (8.5 ms repetition time[TR]/1.6 ms echo time [TE]), sagittal T1-weighted spinecho (600 ms/17 ms TR/TE), axial 3D T2-weighted fastspin echo (FSE) (3000 ms/102 ms TR/TE), axial fluid-attenuated inversion recovery (FLAIR; 10 000 ms/148 ms/2200 ms TR/TE/inversion time), axial DWI(echo-planar; 10 000 ms/99 ms TR/TE; 3 mm/0 mmslice thickness/interslice gap; 256 × 256 matrix size;24 cm field of view; 6 gradient directions, b ¼ 0 and1000 s/mm2), and contrast-enhanced 3D spoiledgradient-recalled acquisition in the steady state (SPGR)T1-weighted (34 ms/8 ms TR/TE; 1.5 mm/0 mm, slicethickness/interslice gap) and T1-weighted postcontrastspin echo images (600 ms/17 ms TR/TE). In selectedcases, data from 3D H-1 MR spectroscopic imaging(MRSI) were acquired for evaluation of tumor metabolismand contributed to the site selection for obtaining tissuesamples that were likely to represent tumor, based uponthe choline to N-acetyl aspartate index (CNI) being .2SEs above normal.11,37,38
Axial DSC was performed utilizing a series of T2*gradient-echo echo-planar images (flip angle ¼ 358 or608; 54–56/1250–1500 ms TE/TR; 128 × 128 matrixsize; 26 × 26 cm field of view; 8–12 slices, 3–4 mmslice thickness) acquired immediately before, during,and after (total of 60–80 time points) intravenousadministration of 0.1 mmol/kg gadopentetate dimeglu-mine (Gd-DTPA; Magnevist, Bayer HealthCarePharmaceuticals) with an MR-compatible power injector(Medrad, Spectris Solaris) at a rate of 4–5 mL/s througha 20-gauge angiocatheter, followed by 20 mL of continu-ous saline flush. The first 10 echo-planar imaging acquisi-tions were performed before the injection of Gd-DTPA toestablish a precontrast baseline. The region selected forDSC coverage included the entire tumor volume as deter-mined by T2-weighted FLAIR and FSE images. A TE of54 ms and flip angle of 358 were selected to maximizethe effect of susceptibility changes while minimizing T1effect during the first pass of the contrast agent.
Physiologic MRI Processing
MR imaging data were transferred to a commerciallyavailable Linux workstation were data from postcon-trast T1-weighted images in 3D SPGR images,
Barajas et al.: GBM MRI guided tissue specimen correlation
NEURO-ONCOLOGY † J U L Y 2 0 1 2 943
Downloaded from https://academic.oup.com/neuro-oncology/article-abstract/14/7/942/1091877by gueston 30 March 2018

T2-FLAIR images, DSC, DWI, and, where available,H-1 MRSI. At the workstation, these sequences wereprocessed and co-registered as described previously.39
The accuracy of co-registration was manually verifiedby visual inspection.
DSC and DWI analysis was performed using softwaredeveloped by our group.13,39,40 The T2* dynamic signalintensity time curves acquired during the first pass of thegadolinium bolus were converted into dynamic DR2*curves and resampled to match the spatial resolution ofthe anatomic imaging series. PH was defined as themaximum DR2* value of the first-pass curve. PSR wascalculated as the difference between the PH value andthe average values of the final 5 time points in thedynamic DR2* series divided by the PH value. CBV andRF maps were calculated on a voxel-by-voxel basis utiliz-ing a modified gamma-variate function that takes intoaccount leakage of the contrast agent.13,39,40 DWI wasused for the production of ADC and FA maps on an au-tomated voxel-by-voxel basis. Several of the physiologicMRI parameters were normalized by dividing the estimat-ed values in normal-appearing white matter from the con-tralateral hemisphere before comparison with thehistologic data (rCBV, rPH, rADC, rFA).
Preoperative Tumor Tissue Site Selectionand MRI Analysis
Anatomic and physiologic MRI was used to guide theprospective selection of tissue sampling sites within theT2 FLAIR and FSE hyperintense portion of the tumor.Tissue sampling sites were preoperatively plannedand marked on the anatomic images that were usedby the surgical navigation workstation (Brainlab,VectorVision Navigation System; Medtronic, StealthStation). Criteria used to plan sites were based uponresults from previous studies as having either rPH . 3,ADC , 1200, or, when MRSI data were available,CNI . 2.13,18,31,32,37,38,41,42 The tissue targets weremarked on the anatomic images to be used bythe surgeon for intraoperative sample localization.Requested tissue sampling sites were obtained morethan 85% of the time with at least one requested tissuesampling site for all patients being sampled; however,it was not always possible to match all the requestedtissue targets, so the actual locations of the acquiredtissue sample were saved on the surgical navigationalsystem as both screenshots and as a list of image coordi-nate values. The tissue coordinates were subsequentlyused to define spherical regions of interest (ROIs) of5 mm diameter and to record corresponding values ofanatomic and physiologic MRI parameters. Accurateco-registration of intraoperatively generated screenshots that defined the tumor specimen site and the corre-sponding ROI were reviewed by a neuroradiologist whowas blinded to other patient data. The median intensityvalues for each of the relevant imaging parameterswithin the sample ROIs were determined for the subse-quent imaging analysis using automated software devel-oped in our research group.
Intraoperative Tissue Collection and HistopathologicTumor Analysis
After removal from the brain, tissue specimens weredivided in half, with one half snap frozen in liquid nitro-gen for potential future studies and the other half imme-diately placed in zinc-formalin for 4–6 h, dehydrated ina series of graded alcohols, and infiltrated with low-temperature paraffin for histologic analysis. Sectionsfrom the tissue specimens were stained with hematoxylinand eosin (H&E) or immunostained using an automatedimmunohistochemical (IHC) tissue staining process(Ventana Medical Systems Benchmark XT). Digitalimages were captured with an Olympus BX41TF micro-scope and an Olympus DP70 digital microscope camera.
For each tissue specimen, the presence of tumor cellswas scored based upon review of H&E-stained sectionsby a neuropathologist as 0 ¼ no tumor present, 1 ¼ in-filtrating tumor margin, 2 ¼ infiltrating cellular tumor,and 3 ¼ highly cellular infiltrating tumor involving.75% of the tissue. Tumor cells were identified basedupon morphologic features, including cytologic atypia,enlarged nuclear to cytoplasmic volume ratio, andhyperchromasia. The cumulative extent of necrosis wasscored as 0 ¼ no necrosis, 1 ¼ focal necrosis involving,50% of the tissue area, and 2 ¼ extensive necrosis in-volving ≥50% of the tissue area.
The degree of microvascular hyperplasia, hypoxia,and architectural disruption was qualitatively measuredusing IHC stained sections for factor VIII, carbonic an-hydrase (CA)–9, and SMI-31, respectively, using anordinal scale of immunoreactivity. For factor VIII stain-ing, the presence of specific microvascular elements wasscored as 0 ¼ delicate microvasculature only, 1 ¼ simplehyperplastic structures identified (hyperplastic capillar-ies with definitive lumen), and 2 ¼ complex microvascu-lar hyperplasia (circumferential multilayered andglomeruloid-type vessels). The contribution of eachtype of microvascular element to the overall vascularitywas scored as 0 ¼ not present, 1 ¼ present but not pre-dominant, and 2 ¼ predominant.
The degree of hypoxia, as denoted by percentageof CA-9 positivity of tissue, was scored as 0 ¼ nopositive staining, 1 ¼ ,10%, 2 ¼ ≥10% but ,25%,and 3 ¼ ≥25%. The CA-9 gene has a hypoxia-responsive element in its promoter, and its expressionat the protein level is commonly used as a marker forhypoxia. To assess the degree of architectural disrup-tion, we performed an IHC analysis with SMI-31, an an-tibody against a phosphorylated neurofilament epitopein thick and thin axons, and scored the samples basedon the extent of SMI-31 staining as 0 ¼ no disruptionof the normal architecture, 1 ¼ minimal disruption,2 ¼ mild disruption, and 3 ¼ severe disruption withno residual SMI-31 immunostaining.
The total number of cells and the total number ofKi-67 stained cells was quantified in 3–5 separatefields at 20× magnification to assess total cell numberand standardized proliferation index. A minimum of400 nuclei were counted per sample. An attending neu-ropathologist with greater than 10 years experience
Barajas et al.: GBM MRI guided tissue specimen correlation
944 NEURO-ONCOLOGY † J U L Y 2 0 1 2
Downloaded from https://academic.oup.com/neuro-oncology/article-abstract/14/7/942/1091877by gueston 30 March 2018

who was blinded to the results of MRI performed allquantitative and qualitative histopathologic assess-ments. All of the tissue specimens were of sufficientsize and IHC staining quality to be included for analysis.
Statistical Analysis
There were 3 components to the analysis: (1) assessmentof intratumor variation for each histopathologic andMRI variable, (2) assessment of whether MRI parame-ters (perfusion, diffusion, and anatomic) were predictiveof GBM histopathology, and (3) evaluation of associa-tions within histopathology features and in vivo MRIparameters.
Association of Histopathology Characteristics and MRIVariation within Tumor Specimen Regions.—Mixedeffects modeling was performed to estimate the coeffi-cient of intratumor variation (as measured in CE vsNE regions) for each histopathologic and MRI variablein the subset of patients who had tumor specimensfrom both regions. For each continuous variable, theinitial model included a fixed effect for each tissue speci-men site and a random effect for each patient. Thismodel can be written as:
yijk = bj + bi + 1ijk; i = 1, . . . ,51; j = 1, 2;
k = 1, . . . , ki,
where yijk is the histopathologic or imaging value of theith subject in the jth tumor specimen region for the kthbiopsy; bj is the tumor specimen–specific intercept;and 1 is the residual. This model assumes that bi �N(0,sb
2) and 1ijk � N(0,s2). The assumptions of normal-ity for the random effects were verified with quantile-quantile plots. For some histologic and MRI variables,plots of residuals against fitted values demonstrated het-eroscedasticity within tumor specimen regions. In thosecases, the model was adjusted to account for unequalvariances within tumor specimen regions. Interactionsbetween the fixed and random effects were also investi-gated. Models were pairwise compared and the coeffi-cient/P value for the best model is reported. R and theNonlinear Mixed Effects package were used for thecontinuous-value outcome mixed effect models.
To compare the ordinal histopathology variablesbetween CE and NE tumor specimen regions, we em-ployed a proportional odds logistic regression modelwith repeated measures to model the probability of ob-serving a lower versus a higher response. This model iswritten as:
logit[P(Yijk ≤ k|Xi,Zi)] = ak + x′ijb+ Z′
ijb+ z′ijbi;
i = 1, . . . , 35; k = 1, . . . , c − 1,
where c is the total number of levels of the ordinal vari-able, Wi and Zi are the design matrices for the fixedeffects and for the random effects, respectively; xij andzij are rows corresponding to the jth biopsy region; and
b and bi are the vectors of the fixed and random parame-ters, respectively. The intercepts are fixed and categorydependent. The odds ratio and P value for each variableis reported. The mixed effect models of ordinal-valuedoutcomes were analyzed with Proc Genmod in SAS v.9.2.
Predictive Ability of MRI Parameters by TumorSpecimen Region.—The primary analysis focused onwhether anatomic, diffusion, or perfusion parameters(rT1C, rFSE, rFLAIR, rFA, rADC, rCBV, rPH, PSR, orRF) were predictive of malignant glioma histopathologyas assessed in each region by tumor cellularity (H&E),proliferation (Ki-67), overall cell density (H&E), necro-sis (H&E), microvascular hyperplasia (factor VIII),hypoxia (CA-9), architectural disruption (SMI-31), ormicrovascular morphology (delicate, simple, complex;factor VIII). Univariate mixed effects linear models fitas described above were used with each histopathologyfeature as the outcomes, and the imaging parameterwas used as a fixed predictor adjusting for the patienteffect. For models involving continuous outcomes, thecoefficients were reported if they were statistically signif-icant at P ≤ .05 and if the within-tumor residual variancedecreased at least 5% compared with the unconditionalmeans model. Each association was also assessed by ran-domly selecting one sample per patient and calculating aKendall’s tau correlation coefficient (t). This samplingprocess was repeated 100 times. A strong correlationwas identified if the corresponding P value for t was sig-nificant at P ≤ .05 in 70% of the 100 samples. Themedian t and P value are reported where a correlationdid not exist linearly. Imaging parameters statisticallysignificant at P ≤ .15 were modeled pairwise withand without interaction. These models were comparedwith the univariate model to confirm whether theadditive effect strengthened the model.
Associations among Histopathology Scores and MRI byTumor Specimen Region.—Exploratory associationswere estimated within histopathology features andwithin in vivo MRI parameters stratified by tissuesample regions. Univariate mixed effects linear modelswere fit as described above. Only associations of the fol-lowing MRI variables are summarized: rT1c, rFSE,rFLAIR, rCBV, rADC, and rFA. Hypoxia, necrosis,and complex vessel scores were excluded from analysesinvolving NE regions because there were a relativelysmall number of nonzero values.
Results
A total of 119 image-guided tissue specimens were ob-tained from regions of suspected tumor during surgicalresection of 51 patients who were assessed as havingnewly diagnosed GBM. Ninety-three tissue specimenswere obtained from CE regions and 26 from NEregions. The analysis of DSC data was limited to patients(N ¼ 35) imaged with a flip angle of 358 to minimize T1signal intensity effects during the first pass of the con-trast agent (N tissue samples ¼ 72).
Barajas et al.: GBM MRI guided tissue specimen correlation
NEURO-ONCOLOGY † J U L Y 2 0 1 2 945
Downloaded from https://academic.oup.com/neuro-oncology/article-abstract/14/7/942/1091877by gueston 30 March 2018

Differential Distribution of Histopathologic Featureswithin CE and NE Regions
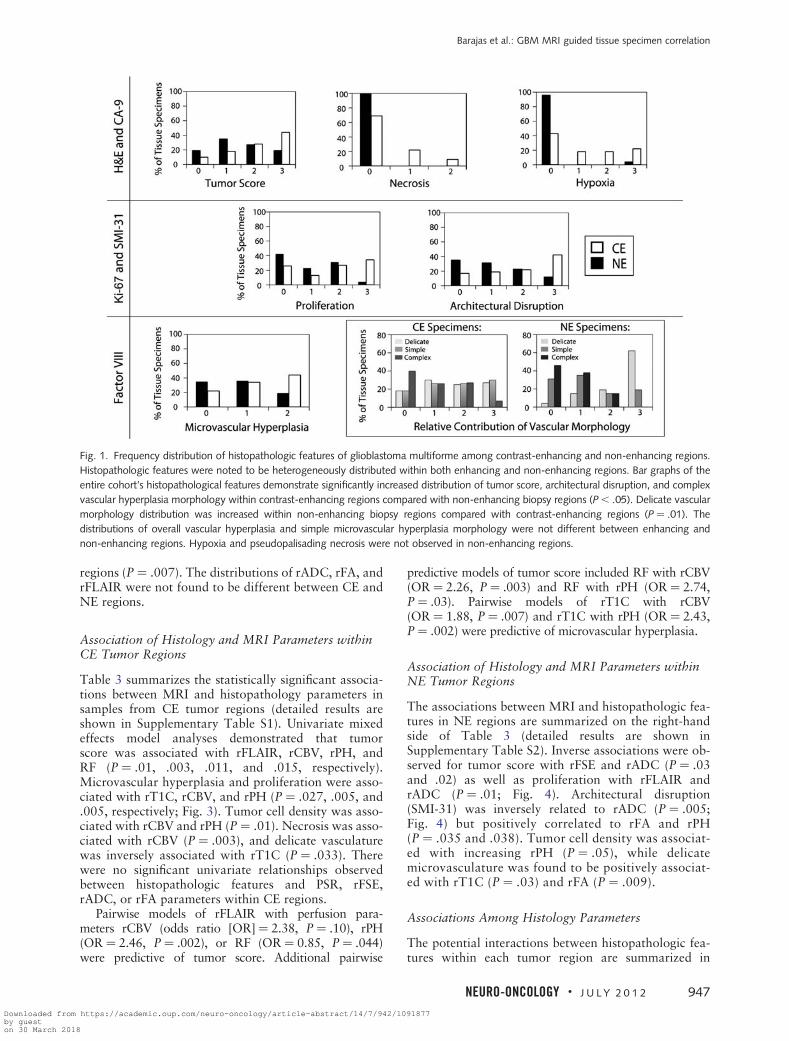
Summary statistics for regional histopathology featuresobtained from this cohort are presented in Table 1 andFig. 1. Tumor was found in 81% of NE tissue specimensand 90% of CE tissue specimens. Considering that thesurgeon was not always able to sample the requested loca-tion, the high tumor identification rate indicated that theimaging criteria used for tumor targeting were highly ef-fective. Tissue specimens obtained from CE regions hadsignificantly increased tumor score (P ¼ .04) and architec-tural disruption as demonstrated by SMI-31 (P ¼ .05)compared with NE regions. Proliferation and tumor celldensity were also found to be elevated within CE regions(proliferation mean 15.8% vs 4.6%, P ¼ .04; tumor celldensity mean 268 vs 146, P ¼ .007). The relative
contribution of delicate vascular morphology was higherin NE tumor tissue regions (P ¼ .01). As is shown inFig. 1, there were relatively few samples from NEregions with complex microvascular hyperplasia,hypoxia, and necrosis (19%, 4%, and 0%, respectively).
Differential Distribution of MRI Parameters within CEand NE Regions
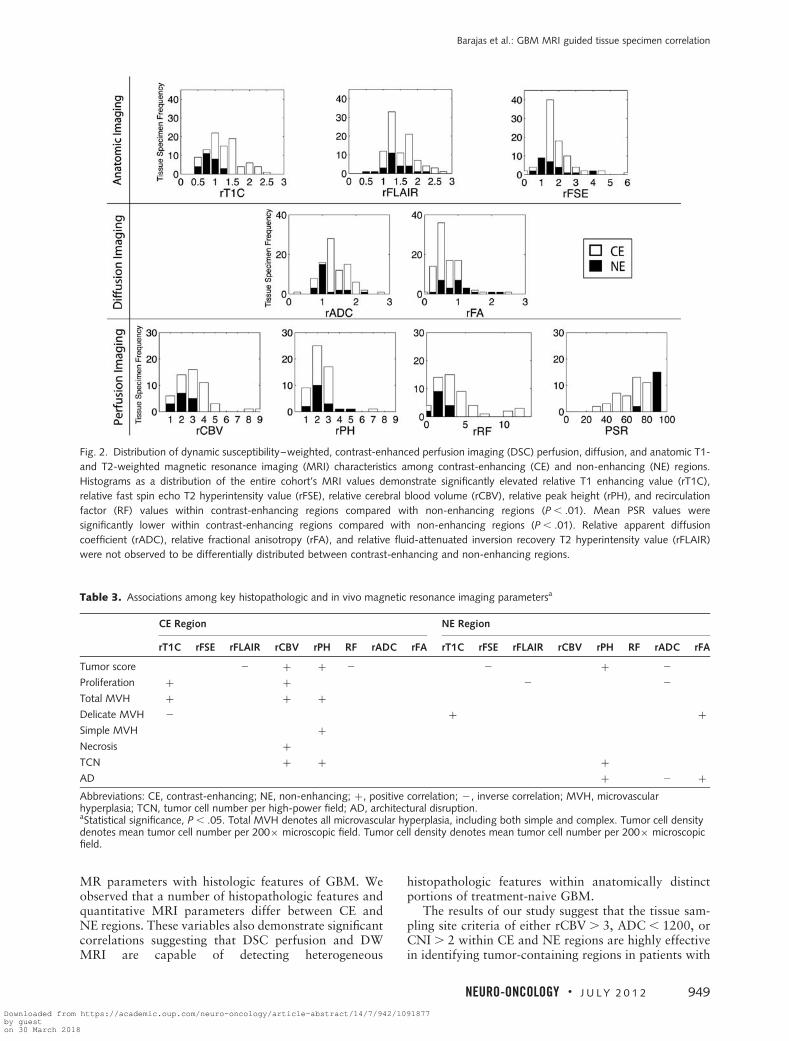
Summary statistics for regional anatomic and physiolog-ic MRI values obtained from this cohort are summarizedin Table 2 and Fig. 2. Compared with NE regions, tissuespecimens obtained from CE regions demonstrated sig-nificantly higher levels of rT1C, rFSE, rCBV, rPH, andRF (P , .01). As expected, PSR was found to be signifi-cantly lower within CE regions compared with NE
Table 1. Regional histopathological summary statistics and differential regional expressiona
Categorical Features
Histologic Value Tissue Region Pt # TS # Frequency Distribution (%) Random Effect Model Analysis
0 1 2 3 # Pairs Odds Ratio 95%Confidence
Interval
P Value
Tumor score NE 20 26 19 35 27 19 16 2.6 1.1 6.6 .04CE 47 90 10 18 28 44
Necrosis NE 20 26 100 0 0 NA 17 NA NA NA NACE 48 92 69 22 9 NA
Hypoxia NE 20 26 96 0 0 4 16 NA NA NA NACE 47 89 45 17 18 22
AD NE 20 26 35 31 23 12 16 2.8 1 7.7 .05CE 46 88 17 19 22 42
Total MVH NE 20 26 35 46 19 NA 16 2.5 1 6.2 .06CE 47 89 22 44 34 NA
Delicate MVH NE 20 26 4 15 19 62 16 0.3 0.1 0.8 .01CE 47 89 18 3 25 27
Simple MVH NE 20 26 31 35 15 19 16 2 0.8 5.2 .15CE 47 89 18 26 26 30
Complex MVH NE 20 26 81 11 8 0 16 NA NA NA NACE 47 89 60 16 10 14
Continuous Features
Histologic Value Tissue Region Pt # TS # Min Median Max SD # Pairs B 95%Confidence
Interval
P Value
Proliferation NE 20 26 0.0 4.6 26.7 7.3 16 5.9 0.2 11.6 .043CE 47 89 0.0 15.8 59.2 13.9
Tumor cell number NE 20 26 66.5 145.5 474 88.7 17 103 30.6 175.1 .007CE 48 91 43.0 267.8 921 165.9
Abbreviations: Pt #, number of patients; TS #, number of tissue samples; NA, not applicable; AD, architectural disruption; MVH,microvascular hyperplasia; SD, standard deviation; B, b coefficient.aRegional summary statistics of histopathologic values obtained from contrast-enhancing (CE) and non-enhancing (NE) regions arepresented. The estimated difference in effect between the 2 regions (NE as baseline) is summarized by the odds ratio/P value from arandom effects model. Tumor score: 0 ¼ no tumor present; 1 ¼ infiltrating tumor margin; 2 ¼ infiltrating cellular tumor; 3 ¼ highlycellular infiltrating tumor involving .75% of the tissue. Necrosis: 0 ¼ no necrosis; 1 ¼ focal necrosis involving ,50% of the tissue area;2 ¼ extensive necrosis involving ≥50% of the tissue area. Hypoxia ¼ 0, no positive staining; 1 ¼ ,10% of the tissue; 2 ¼ ≥10% of thetissue but ,25%; 3 ¼ ≥25% of the tissue is CA-9 positive. AD: 0 ¼ no disruption of the normal architecture; 1 ¼ minimal disruption;2 ¼ mild disruption; 3 ¼ severe disruption with no residual SMI-31 immunostaining. Total MVH: 0 ¼ delicate microvasculature only; 1 ¼simple hyperplastic structures identified (hyperplastic capillaries with definitive lumen); 2 ¼ complex microvascular hyperplasia(circumferential multilayered and glomeruloid-type vessels). Relative contribution of each vascular morphology (delicate, simple, complex)to total vascularity within the sample: 0 ¼ no contribution; 1 ¼ minimal; 2 ¼ prevalent; 3 ¼ predominant. Proliferation is based on totalnumber of Ki-67-positive cells relative to total number of cells in 3–5 separate fields at 20× magnification. Tumor cell number: total cellsper field at 200× magnification.
Barajas et al.: GBM MRI guided tissue specimen correlation
946 NEURO-ONCOLOGY † J U L Y 2 0 1 2
Downloaded from https://academic.oup.com/neuro-oncology/article-abstract/14/7/942/1091877by gueston 30 March 2018
regions (P ¼ .007). The distributions of rADC, rFA, andrFLAIR were not found to be different between CE andNE regions.
Association of Histology and MRI Parameters withinCE Tumor Regions
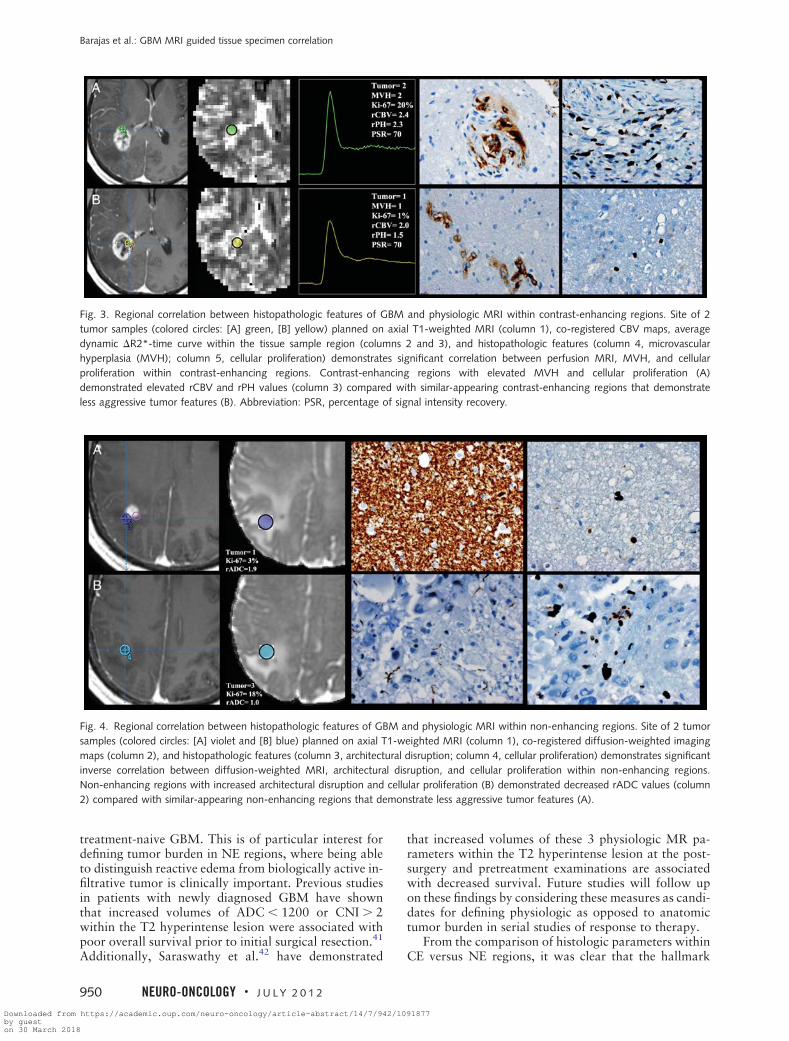
Table 3 summarizes the statistically significant associa-tions between MRI and histopathology parameters insamples from CE tumor regions (detailed results areshown in Supplementary Table S1). Univariate mixedeffects model analyses demonstrated that tumorscore was associated with rFLAIR, rCBV, rPH, andRF (P ¼ .01, .003, .011, and .015, respectively).Microvascular hyperplasia and proliferation were asso-ciated with rT1C, rCBV, and rPH (P ¼ .027, .005, and.005, respectively; Fig. 3). Tumor cell density was asso-ciated with rCBV and rPH (P ¼ .01). Necrosis was asso-ciated with rCBV (P ¼ .003), and delicate vasculaturewas inversely associated with rT1C (P ¼ .033). Therewere no significant univariate relationships observedbetween histopathologic features and PSR, rFSE,rADC, or rFA parameters within CE regions.
Pairwise models of rFLAIR with perfusion para-meters rCBV (odds ratio [OR]¼ 2.38, P¼ .10), rPH(OR ¼ 2.46, P¼ .002), or RF (OR¼ 0.85, P¼ .044)were predictive of tumor score. Additional pairwise
predictive models of tumor score included RF with rCBV(OR¼ 2.26, P¼ .003) and RF with rPH (OR¼ 2.74,P¼ .03). Pairwise models of rT1C with rCBV(OR¼ 1.88, P¼ .007) and rT1C with rPH (OR¼ 2.43,P¼ .002) were predictive of microvascular hyperplasia.
Association of Histology and MRI Parameters withinNE Tumor Regions
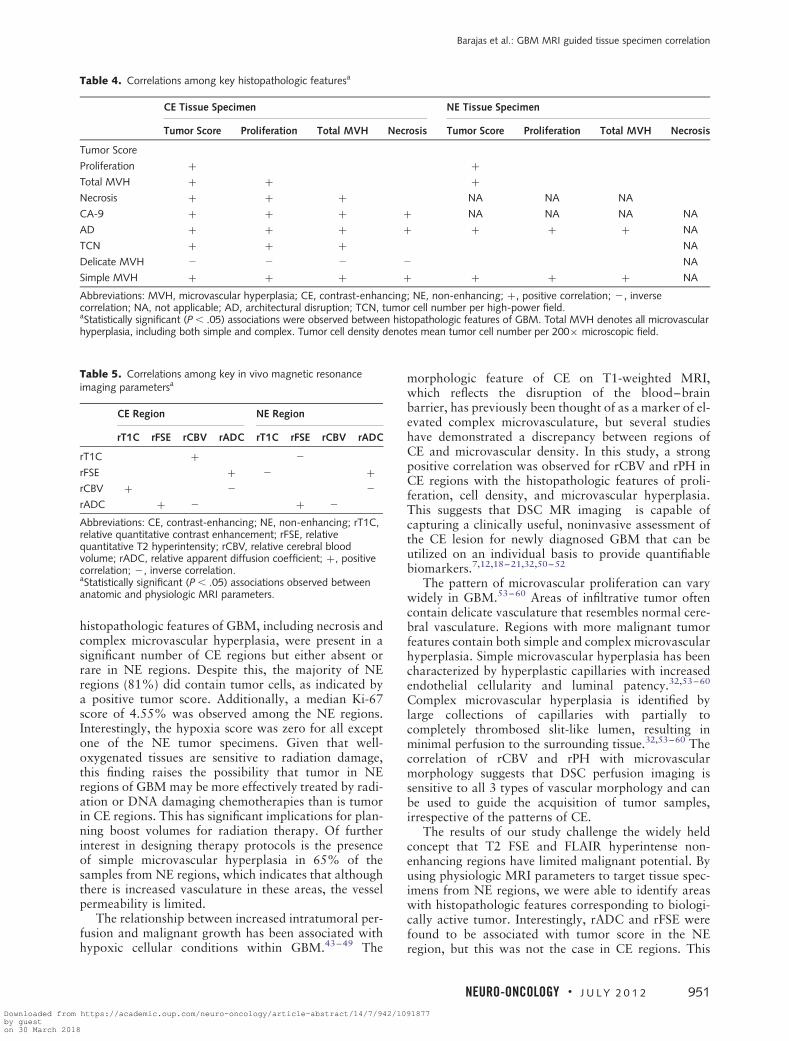
The associations between MRI and histopathologic fea-tures in NE regions are summarized on the right-handside of Table 3 (detailed results are shown inSupplementary Table S2). Inverse associations were ob-served for tumor score with rFSE and rADC (P ¼ .03and .02) as well as proliferation with rFLAIR andrADC (P ¼ .01; Fig. 4). Architectural disruption(SMI-31) was inversely related to rADC (P ¼ .005;Fig. 4) but positively correlated to rFA and rPH(P ¼ .035 and .038). Tumor cell density was associat-ed with increasing rPH (P ¼ .05), while delicatemicrovasculature was found to be positively associat-ed with rT1C (P ¼ .03) and rFA (P ¼ .009).
Associations Among Histology Parameters
The potential interactions between histopathologic fea-tures within each tumor region are summarized in
Fig. 1. Frequency distribution of histopathologic features of glioblastoma multiforme among contrast-enhancing and non-enhancing regions.
Histopathologic features were noted to be heterogeneously distributed within both enhancing and non-enhancing regions. Bar graphs of the
entire cohort’s histopathological features demonstrate significantly increased distribution of tumor score, architectural disruption, and complex
vascular hyperplasia morphology within contrast-enhancing regions compared with non-enhancing biopsy regions (P , .05). Delicate vascular
morphology distribution was increased within non-enhancing biopsy regions compared with contrast-enhancing regions (P ¼ .01). The
distributions of overall vascular hyperplasia and simple microvascular hyperplasia morphology were not different between enhancing and
non-enhancing regions. Hypoxia and pseudopalisading necrosis were not observed in non-enhancing regions.
Barajas et al.: GBM MRI guided tissue specimen correlation
NEURO-ONCOLOGY † J U L Y 2 0 1 2 947
Downloaded from https://academic.oup.com/neuro-oncology/article-abstract/14/7/942/1091877by gueston 30 March 2018

Table 4 (details shown in Supplementary Table S3). Noassessment was made for complex microvascular mor-phology because the number of samples with positivescores was relatively small (41% for CE and 20% forNE regions). Within CE tissue specimens, all histopath-ologic features, except for delicate vasculature, werepositively associated with tumor score, proliferation,and total microvascular hyperplasia. Delicate microvas-cular morphology was inversely associated with tumorscore, proliferation, total microvascular hyperplasia,and necrosis within CE tissue specimens. Additionally,CE tissue specimens demonstrated positive associationsamong hypoxia, architectural disruption, simplex mi-crovascular morphology, and necrosis.
Relationships among proliferation, microvascular hy-perplasia, architectural disruption, and simplex vascula-ture scores were similar in NE tissue specimens—however, low numbers of positive scores for necrosisand hypoxia (0% and 4%, respectively) precluded eval-uation of these features. NE tissue specimens lacked asignificant association of delicate microvascular mor-phology with other histopathologic features and fortumor cell density with proliferation or microvascularhyperplasia.
Associations Among MRI Parameters
Associations among MRI parameters are summarized inTable 5 (details are shown in Supplementary Table S4).rFSE and rFLAIR were associated within CE and NEregions. rT1C was inversely associated with rFSE andrFLAIR only within NE regions. rCBV was positively as-sociated with rPH and inversely associated with rADC inCE and NE regions. rCBV was associated with rT1Conly in CE regions. rADC was positively associatedwith rFSE and inversely associated rFA in CE and NEregions. Similar parameters from the same imaging mo-dality, such as rCBV and rPH, were positively related,and PSR was inversely related with RF for CE and NEregions.
Discussion
In this study we prospectively collected tissue specimensfrom CE and NE regions in patients with untreatedGBM utilizing MRI-guided neurosurgical techniques toevaluate their physiologic MRI and histopathologiccharacteristics and to assess the correlation of in vivo
Table 2. Regional anatomic and physiologic magnetic resonance imaging values: summary statistics and differential regional expressionbased on contrast enhancement or non-enhancement
MRI Value Tissue Region Summary Statistics Mixed Effects Model
Pt # TS # Min Median Max Std Pair # B 95%ConfidenceInterval
P Value
Anatomic
rT1C NE 20 26 0.60 0.92 1.42 0.21 17 0.4 0.2 0.7 .004CE 48 93 0.55 1.29 2.61 0.46
rFSE NE 20 26 0.94 1.57 4.36 0.92 17 0.7 0.2 1.3 .007CE 48 93 0.38 1.94 6.34 0.92
rFLAIR NE 20 26 0.71 1.42 2.35 0.37 17 0.1 20.1 0.3 .569CE 48 93 0.83 1.50 2.94 0.41
DSC
rCBV NE 11 15 0.47 1.64 2.77 0.70 7 0.9 0.4 1.4 .003CE 29 52 0.45 2.29 8.61 1.50
rPH NE 12 17 0.49 1.48 4.06 0.86 8 0.6 0 1.1 .046CE 30 53 0.27 1.67 6.74 1.08
PSR NE 12 17 77.5 94.5 99.5 5.9 8 219.6 231.9 27.4 .007CE 30 53 34.5 78.5 96.5 16.9
RF NE 11 15 0.89 2.65 3.75 0.85 7 2.6 1.2 4 .002CE 29 52 0.37 3.60 13.15 3.01
DWI
rADC NE 19 24 0.86 1.09 2.34 0.37 16 0.2 20.1 0.5 .156CE 47 90 0.35 1.43 3.69 0.48
rFA NE 19 24 0.37 1.03 2.37 0.50 16 20.2 20.4 0.1 .224CE 47 90 0.21 0.68 2.50 0.36
Abbreviations: CE, contrast-enhanced; NE, non-enhanced; MRI, magnetic resonance imaging; DWI, diffusion-weighted imaging; DSC,dynamic susceptibility–weighted, contrast-enhanced perfusion imaging; Std, standard deviation; rFLAIR, relative fluid-attenuatedinversion recovery, T2 hyperintensity value; rT1C, relative T1 enhancing value; rFSE, relative fast spin echo T2 hyperintensity value; rCBV,relative cerebral blood volume; rPH, relative peak height; PSR, percentage of signal intensity receovery; RF, recirculation factor; rADC,relative apparent diffusion coefficient; rFA, relative fractional anisotropy; Min, minimum value within region of interest; Pt #, number ofpatients; TS #, number of tissue samples; Max, maximum value within region of interest. The estimated difference in effect between the 2regions (NE as baseline) is summarized by the coefficient/P value from mixed effects models. Relative values indicated by the prefix rindicates tumor value divided by contralateral white matter value.
Barajas et al.: GBM MRI guided tissue specimen correlation
948 NEURO-ONCOLOGY † J U L Y 2 0 1 2
Downloaded from https://academic.oup.com/neuro-oncology/article-abstract/14/7/942/1091877by gueston 30 March 2018
MR parameters with histologic features of GBM. Weobserved that a number of histopathologic features andquantitative MRI parameters differ between CE andNE regions. These variables also demonstrate significantcorrelations suggesting that DSC perfusion and DWMRI are capable of detecting heterogeneous
histopathologic features within anatomically distinctportions of treatment-naive GBM.
The results of our study suggest that the tissue sam-pling site criteria of either rCBV . 3, ADC , 1200, orCNI . 2 within CE and NE regions are highly effectivein identifying tumor-containing regions in patients with
Fig. 2. Distribution of dynamic susceptibility–weighted, contrast-enhanced perfusion imaging (DSC) perfusion, diffusion, and anatomic T1-
and T2-weighted magnetic resonance imaging (MRI) characteristics among contrast-enhancing (CE) and non-enhancing (NE) regions.
Histograms as a distribution of the entire cohort’s MRI values demonstrate significantly elevated relative T1 enhancing value (rT1C),
relative fast spin echo T2 hyperintensity value (rFSE), relative cerebral blood volume (rCBV), relative peak height (rPH), and recirculation
factor (RF) values within contrast-enhancing regions compared with non-enhancing regions (P , .01). Mean PSR values were
significantly lower within contrast-enhancing regions compared with non-enhancing regions (P , .01). Relative apparent diffusion
coefficient (rADC), relative fractional anisotropy (rFA), and relative fluid-attenuated inversion recovery T2 hyperintensity value (rFLAIR)
were not observed to be differentially distributed between contrast-enhancing and non-enhancing regions.
Table 3. Associations among key histopathologic and in vivo magnetic resonance imaging parametersa
CE Region NE Region
rT1C rFSE rFLAIR rCBV rPH RF rADC rFA rT1C rFSE rFLAIR rCBV rPH RF rADC rFA
Tumor score 2 + + 2 2 + 2
Proliferation + + 2 2
Total MVH + + +Delicate MVH 2 + +Simple MVH +Necrosis +TCN + + +AD + 2 +Abbreviations: CE, contrast-enhancing; NE, non-enhancing; +, positive correlation; 2, inverse correlation; MVH, microvascularhyperplasia; TCN, tumor cell number per high-power field; AD, architectural disruption.aStatistical significance, P , .05. Total MVH denotes all microvascular hyperplasia, including both simple and complex. Tumor cell densitydenotes mean tumor cell number per 200× microscopic field. Tumor cell density denotes mean tumor cell number per 200× microscopicfield.
Barajas et al.: GBM MRI guided tissue specimen correlation
NEURO-ONCOLOGY † J U L Y 2 0 1 2 949
Downloaded from https://academic.oup.com/neuro-oncology/article-abstract/14/7/942/1091877by gueston 30 March 2018
treatment-naive GBM. This is of particular interest fordefining tumor burden in NE regions, where being ableto distinguish reactive edema from biologically active in-filtrative tumor is clinically important. Previous studiesin patients with newly diagnosed GBM have shownthat increased volumes of ADC , 1200 or CNI . 2within the T2 hyperintense lesion were associated withpoor overall survival prior to initial surgical resection.41
Additionally, Saraswathy et al.42 have demonstrated
that increased volumes of these 3 physiologic MR pa-rameters within the T2 hyperintense lesion at the post-surgery and pretreatment examinations are associatedwith decreased survival. Future studies will follow upon these findings by considering these measures as candi-dates for defining physiologic as opposed to anatomictumor burden in serial studies of response to therapy.
From the comparison of histologic parameters withinCE versus NE regions, it was clear that the hallmark
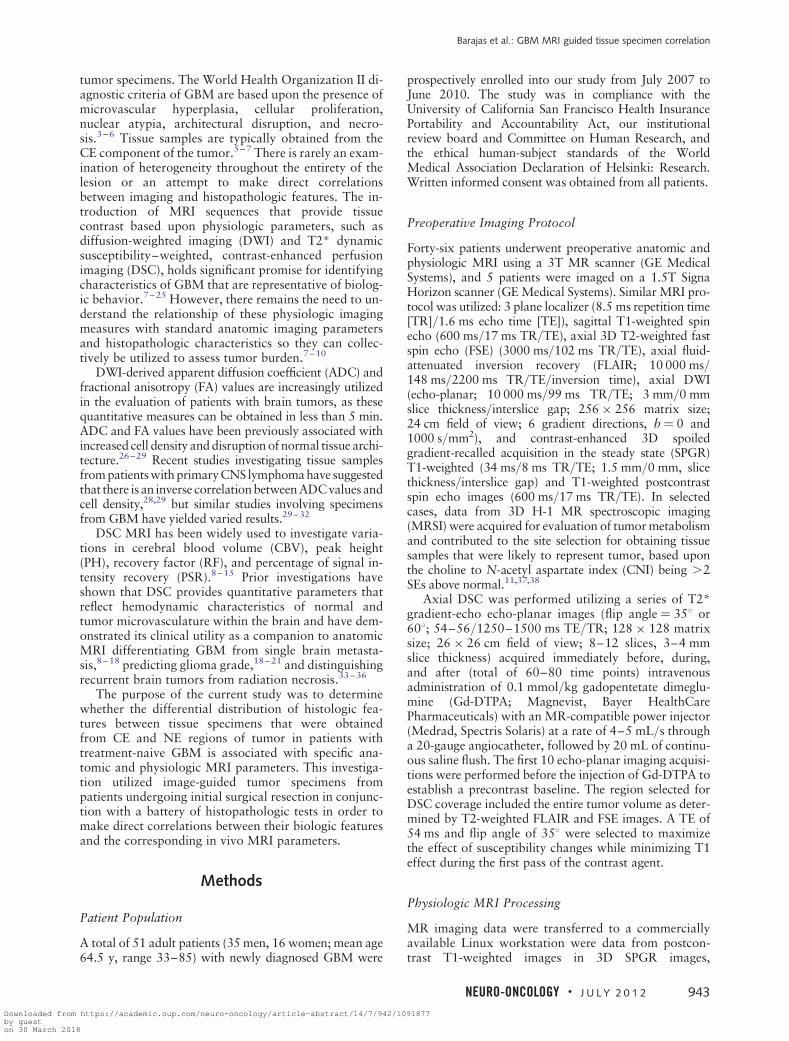
Fig. 3. Regional correlation between histopathologic features of GBM and physiologic MRI within contrast-enhancing regions. Site of 2
tumor samples (colored circles: [A] green, [B] yellow) planned on axial T1-weighted MRI (column 1), co-registered CBV maps, average
dynamic DR2*-time curve within the tissue sample region (columns 2 and 3), and histopathologic features (column 4, microvascular
hyperplasia (MVH); column 5, cellular proliferation) demonstrates significant correlation between perfusion MRI, MVH, and cellular
proliferation within contrast-enhancing regions. Contrast-enhancing regions with elevated MVH and cellular proliferation (A)
demonstrated elevated rCBV and rPH values (column 3) compared with similar-appearing contrast-enhancing regions that demonstrate
less aggressive tumor features (B). Abbreviation: PSR, percentage of signal intensity recovery.
Fig. 4. Regional correlation between histopathologic features of GBM and physiologic MRI within non-enhancing regions. Site of 2 tumor
samples (colored circles: [A] violet and [B] blue) planned on axial T1-weighted MRI (column 1), co-registered diffusion-weighted imaging
maps (column 2), and histopathologic features (column 3, architectural disruption; column 4, cellular proliferation) demonstrates significant
inverse correlation between diffusion-weighted MRI, architectural disruption, and cellular proliferation within non-enhancing regions.
Non-enhancing regions with increased architectural disruption and cellular proliferation (B) demonstrated decreased rADC values (column
2) compared with similar-appearing non-enhancing regions that demonstrate less aggressive tumor features (A).
Barajas et al.: GBM MRI guided tissue specimen correlation
950 NEURO-ONCOLOGY † J U L Y 2 0 1 2
Downloaded from https://academic.oup.com/neuro-oncology/article-abstract/14/7/942/1091877by gueston 30 March 2018
histopathologic features of GBM, including necrosis andcomplex microvascular hyperplasia, were present in asignificant number of CE regions but either absent orrare in NE regions. Despite this, the majority of NEregions (81%) did contain tumor cells, as indicated bya positive tumor score. Additionally, a median Ki-67score of 4.55% was observed among the NE regions.Interestingly, the hypoxia score was zero for all exceptone of the NE tumor specimens. Given that well-oxygenated tissues are sensitive to radiation damage,this finding raises the possibility that tumor in NEregions of GBM may be more effectively treated by radi-ation or DNA damaging chemotherapies than is tumorin CE regions. This has significant implications for plan-ning boost volumes for radiation therapy. Of furtherinterest in designing therapy protocols is the presenceof simple microvascular hyperplasia in 65% of thesamples from NE regions, which indicates that althoughthere is increased vasculature in these areas, the vesselpermeability is limited.
The relationship between increased intratumoral per-fusion and malignant growth has been associated withhypoxic cellular conditions within GBM.43–49 The
morphologic feature of CE on T1-weighted MRI,which reflects the disruption of the blood–brainbarrier, has previously been thought of as a marker of el-evated complex microvasculature, but several studieshave demonstrated a discrepancy between regions ofCE and microvascular density. In this study, a strongpositive correlation was observed for rCBV and rPH inCE regions with the histopathologic features of proli-feration, cell density, and microvascular hyperplasia.This suggests that DSC MR imaging is capable ofcapturing a clinically useful, noninvasive assessment ofthe CE lesion for newly diagnosed GBM that can beutilized on an individual basis to provide quantifiablebiomarkers.7,12,18–21,32,50–52
The pattern of microvascular proliferation can varywidely in GBM.53–60 Areas of infiltrative tumor oftencontain delicate vasculature that resembles normal cere-bral vasculature. Regions with more malignant tumorfeatures contain both simple and complex microvascularhyperplasia. Simple microvascular hyperplasia has beencharacterized by hyperplastic capillaries with increasedendothelial cellularity and luminal patency.32,53–60
Complex microvascular hyperplasia is identified bylarge collections of capillaries with partially tocompletely thrombosed slit-like lumen, resulting inminimal perfusion to the surrounding tissue.32,53–60 Thecorrelation of rCBV and rPH with microvascularmorphology suggests that DSC perfusion imaging issensitive to all 3 types of vascular morphology and canbe used to guide the acquisition of tumor samples,irrespective of the patterns of CE.
The results of our study challenge the widely heldconcept that T2 FSE and FLAIR hyperintense non-enhancing regions have limited malignant potential. Byusing physiologic MRI parameters to target tissue spec-imens from NE regions, we were able to identify areaswith histopathologic features corresponding to biologi-cally active tumor. Interestingly, rADC and rFSE werefound to be associated with tumor score in the NEregion, but this was not the case in CE regions. This
Table 4. Correlations among key histopathologic featuresa
CE Tissue Specimen NE Tissue Specimen
Tumor Score Proliferation Total MVH Necrosis Tumor Score Proliferation Total MVH Necrosis
Tumor Score
Proliferation + +Total MVH + + +Necrosis + + + NA NA NA
CA-9 + + + + NA NA NA NA
AD + + + + + + + NA
TCN + + + NA
Delicate MVH 2 2 2 2 NA
Simple MVH + + + + + + + NA
Abbreviations: MVH, microvascular hyperplasia; CE, contrast-enhancing; NE, non-enhancing; +, positive correlation; 2, inversecorrelation; NA, not applicable; AD, architectural disruption; TCN, tumor cell number per high-power field.aStatistically significant (P , .05) associations were observed between histopathologic features of GBM. Total MVH denotes all microvascularhyperplasia, including both simple and complex. Tumor cell density denotes mean tumor cell number per 200× microscopic field.
Table 5. Correlations among key in vivo magnetic resonanceimaging parametersa
CE Region NE Region
rT1C rFSE rCBV rADC rT1C rFSE rCBV rADC
rT1C + 2
rFSE + 2 +rCBV + 2 2
rADC + 2 + 2
Abbreviations: CE, contrast-enhancing; NE, non-enhancing; rT1C,relative quantitative contrast enhancement; rFSE, relativequantitative T2 hyperintensity; rCBV, relative cerebral bloodvolume; rADC, relative apparent diffusion coefficient; +, positivecorrelation; 2, inverse correlation.aStatistically significant (P , .05) associations observed betweenanatomic and physiologic MRI parameters.
Barajas et al.: GBM MRI guided tissue specimen correlation
NEURO-ONCOLOGY † J U L Y 2 0 1 2 951
Downloaded from https://academic.oup.com/neuro-oncology/article-abstract/14/7/942/1091877by gueston 30 March 2018
was thought to be due to partial volume averaging oftumor and necrosis within voxels that correspond tothe CE region, which makes the image intensitieshigher than would have otherwise been observed.Previous investigations have also yielded mixed results.Sadeghi et al.,18 in their investigation of untreatedGBM, reported an inverse correlation of rADC with mi-crovascular density but no inverse correlation betweenrADC and tumor cell density in their examination of33 tumor tissue specimens. On the other hand, severalother groups have reported finding an inverse correlationbetween rADC and cell density.29–32 These conflictingfindings are likely due to the differences in samplingstrategies for obtaining tissue samples, as well as thecomplex interactions of water diffusivity within the het-erogeneous cellular environment of GBM.
Our study was specifically designed to look at regionswithin the enhancing and non-enhancing lesions withphysiologic imaging parameters suggestive of tumor.Given that it was not always possible to exactly targetthe areas requested, as well as the differences in scaleof the image resolution versus the amount of tissue eval-uated using histology, the fact that 90% of the enhanc-ing samples and 81% of the non-enhancing sampleshad a positive tumor score is encouraging. To determinewhether the imaging data can accurately define lesionboundaries would require a sampling strategy that alsotargeted regions of non-enhancing tumor with physio-logic parameters unlikely to correspond to tumor—however, this may not be practical from the patient’sperspective given the risk of taking tissue from regionsof normal brain.
One limitation of this study is that the potentialexists for misregistration between biopsy sites andMRI uploaded to the neuronavigational device theatri-cally when significant amounts of brain shift occur.Such a mismatch could lead to inaccuracy in DSC andDWI measurements—however, several steps were uti-lized to negate any possible brain shift that may haveoccurred following dural opening. We sought to mini-mize significant amounts of brain shift by (a) perform-ing accurate intraoperative neuronavigational systemregistration to the patient’s facial anatomy, (b) avoidingsubstantial loss of cerebrospinal fluid, (c) watching forintraoperative brain swelling, (d) testing registration ac-curacy against visible cortical landmarks immediatelyprior to biopsy sampling, and (e) using standardizedROIs of sufficient size to compensate for any minimalshift in brain location. We believe that any minimalamount of brain shift that may have occurred prior tobiopsy sampling did not result in significant samplingerror or adversely affect the results of this study.
Further prospective studies may consider implementingthe use of closed brain biopsies to negate this potentiallimitation.
Our investigation suggests that the heterogeneousdistribution of histopathologic features within GBMcan be reliably identified by physiologic MRI. The asso-ciations of imaging and histologic parameters observedindicate that these physiologic imaging variables arelikely to be of interest for defining residual postsurgicaltumor burden and may need to be considered in ex-panding the definition of the Revised Assessment inNeuro-Oncology criteria for assessing response totherapy.61
Conclusion
We have demonstrated that histopathologic featuresof GBM are differentially expressed between contrast-enhancing and non-enhancing components of thetumor. In contrast-enhancing regions, DSC perfusionMRI variables can be used to identify tissue specimenswith higher tumor proliferation, necrosis, and vascularhyperplasia. In the non-enhancing component of thelesion, DWI variables are able to improve the detectionof infiltrating tumor, which may lack some of the char-acteristic histopathologic features of GBM and maytherefore respond differently to radiation or othertypes of therapy when compared to enhancing tissues.
Supplementary Material
Supplementary material is available at Neuro-OncologyJournal online (http://neuro-oncology.oxfordjournals.org/).
Acknowledgments
The first author thanks Alvin Au, King Chiu, CynthiaCowdrey, and Bethany Barajas for their tissue processingassistance and helpful comments regarding thismanuscript.
Conflict of interest statement. None declared.
Funding
National Institutes of Health [P01 CA11816-01A2].
References
1. Greenlee RT, Murray T, Bolden S. Cancer statistics 2000. CA Cancer J
Clin. 2000;50:7–33.
2. Eby NL, Grufferman S. Increasing incidence of primary brain lymphoma
in the US. Cancer. 1998;62:2461–2465.
3. Fulling KH, Garcia DM. Anaplastic astrocytoma of the adult
cerebrum. Prognostic value of histologic features. Cancer.
1985;55:928–931.
Barajas et al.: GBM MRI guided tissue specimen correlation
952 NEURO-ONCOLOGY † J U L Y 2 0 1 2
Downloaded from https://academic.oup.com/neuro-oncology/article-abstract/14/7/942/1091877by gueston 30 March 2018
4. Gilles FH, Brown WD, Leviton A. Limitations of the World Health
Organization classification of childhood supratentorial astrocytic
tumors. Cancer. 2000;88:1477–1483.
5. Prayson RA, Agamanolis DP, Cohen ML, et al. Interobserver reproduc-
ibility among neuropathologists and surgical pathologists in fibrillary
astrocytoma grading. J Neurol Sci. 2000;175(1):33–39.
6. Coons SW, Johnson PC, Scheithauer BW, Yates AJ, Pearl DK.
Improving diagnostic accuracy and interobserver concordance in the
classification and grading of primary gliomas. Cancer.
1997;79:1381–1393.
7. Law M, Oh S, Johnson G, et al. Perfusion magnetic resonance imaging
predict patient outcome as an adjunct to histopathology. Neurosurgery.
2006;58:1099–1107.
8. Jackson A, Kassner A, Annesley-Williams D. Abnormalities in the recir-
culation phase of contrast agent bolus passage in cerebral gliomas:
comparison with relative blood volume and tumor grade. Am J
Neuroradiol. 2002;23:7–14.
9. Cha S. Update on brain tumor imaging: from anatomy to physiology.
Am J Neuroradiol. 2006;27:475–487.
10. Lev MH, Rosen BR. Clinical applications of intracranial perfusion MR
imaging. Neuroimaging Clin N Am. 1999;9:309–331.
11. Henry RG, Vigneron DB, Fischbein NJ, et al. Comparison of relative ce-
rebral blood volume and proton spectroscopy in patients with treated
gliomas. Am J Neuroradiol. 2000;21:357–366.
12. Sugahara T, Korogi Y, Kochi M, et al. Correlation of MRI-determined ce-
rebral blood volume maps with histologic and angiographic determination
of vascularity of gliomas. Am J Roentgenol. 1998;171:1479–1486.
13. Lupo JM, Cha S, Chang SM, Nelson SJ. Dynamic susceptibility-
weighted perfusion imaging of high-grade gliomas: characterization
of spatial heterogeneity. Am J Neuroradiol. 2005;26:1446–1454.
14. Cha S, Lu S, Johnson G, Knopp EA. Dynamic susceptibility
contrast MRI: correlation of signal intensity changes with cerebral
blood volume measurements. J Magn Reson Imaging.
2000;11:114–119.
15. Cha S, Lupo JM, Chen MH, et al. Differentiation of glioblastoma multi-
forme and single brain metastasis by peak height and percentage of
signal intensity recovery derived from dynamic susceptibility-weighted
contrast-enhanced perfusion MR imaging. Am J Neuroradiol.
2007;28:1078–1084.
16. Barajas R, Chang J, Sneed P, Segal M, McDermott M, Cha S.
Distinguishing recurrent brain metastasis from radiation necrosis follow-
ing gamma knife radiosurgery using dynamic susceptibility weighted
contrast-enhanced perfusion MR imaging. Am J Neuroradiol.
2009;30:367–372.
17. Barajas R, Chang J, Segal M, et al. Distinguishing recurrent glioblastoma
multiforme from radiation necrosis following external beam radiothera-
py using dynamic susceptibility weighted contrast-enhanced perfusion
MRI. Radiology. 2009;253:486–496.
18. Sadeghi N, D’Haene N, Decaestecker C, et al. Apparent diffusion coef-
ficient and cerebral blood volume in brain gliomas: relation to tumor cell
density and tumor microvessel density based on stereotactic biopsies.
Am J Neuroradiol. 2008;29:476–482.
19. Aronen HJ, Gazit IE, Louis DN, et al. Cerebral blood volume maps of
gliomas: comparison with tumor grade and histologic findings.
Radiology. 1994;191:41–51.
20. Cha S, Johnson G, Wadghiri YZ, et al. Dynamic, contrast-enhanced per-
fusion MRI in mouse gliomas: correlation with histopathology. Magn
Reson Med. 2003;49:848–855.
21. Maia AC Jr, Malheiros SM, da Rocha AJ, et al. MR cerebral blood
volume maps correlated with vascular endothelial growth factor expres-
sion and tumor grade in nonenhancing gliomas. Am J Neuroradiol.
2005;26:777–783.
22. Rowley HA, Grant PE, Roberts TP. Diffusion MRI: theory and applica-
tions. Neuroimaging Clin N Am. 1999;9:343–361.
23. Le Bihan D, Turner R, Douek P, Patronas N. Diffusion MRI: clinical ap-
plications. Am J Roentgenol. 1992;159:591–599.
24. Kotsenas AL, Roth TC, Manness WK, Faerber EN. Abnormal diffusion-
weighted MRI in medulloblastoma: does it reflect small cell histology?
Pediatr Radiol. 1999;29:524–526.
25. Kitis O, Altay H, Calli C, Yunten N, Akalin T, Yurtseven T. Minimum ap-
parent diffusion coefficients in the evaluation of brain tumors. Eur J
Radiol. 2005;55:393–400.
26. Le Bihan D, Breton E, Lallemand D, Grenier P, Cabanis E, Laval-Jeantet
M. MRI of intravoxel incoherent motions: application to diffusion and
perfusion in neurologic disorders. Radiology. 1986;161:401–407.
27. Guo AC, Cummings TJ, Dash RC, Provenzale JM. Lymphomas and
high-grade astrocytomas: comparison of water diffusibility and histo-
logic characteristics. Radiology. 2002;224:177–183.
28. Barajas RF Jr, Rubenstein JL, Chang JS, Hwang J, Cha S.
Diffusion-weighted MRI derived apparent diffusion coefficient is predic-
tive of clinical outcome in primary central nervous system lymphoma.
AJNR. 2010;31:60–66.
29. Stadnik TW, Chaskis C, Michotte A, et al. Diffusion-weighted MRI of
intracerebral masses: comparison with conventional MRI and histologic
findings. Am J Neuroradiol. 2001;22:969–976.
30. Sugahara T, Korogi Y, Kochi M, et al. Usefulness of diffusion-weighted
MRI with echo-planar technique in the evaluation of cellularity in
gliomas. J Magn Reson Imaging. 1999;9:53–60.
31. Gupta RK, Cloughesy TF, Sinha U, et al. Relationships between choline
magnetic resonance spectroscopy, apparent diffusion coefficient and
quantitative histopathology in human glioma. J Neurooncol.
2000;50:215–226.
32. Barajas RF Jr, Hodgson JG, Chang JS, et al. Glioblastoma multiforme re-
gional genetic and cellular expression patterns: influence on anatomic
and physiologic MRI. Radiology. 2010;254(2):564–576.
33. Cha S, Johnson G, Yuz M, et al. The role of contrast-enhanced perfu-
sion MRI in differentiating between recurrent tumor and radiation
necrosis. Proceedings: Radiological Society of North America.
1999;213:188.
34. Cha S, Knopp EA, Johnson G, et al. Dynamic contrast-enhanced
T2*-weighted MRI of recurrent malignant gliomas treated with thalid-
omide and carboplatin. Am J Neuroradiol. 2000;21:881–890.
35. Cha S, Pierce S, Knopp EA, et al. Dynamic contrast-enhanced
T2*-weighted MRI of tumefactive demyelinating lesions. Am J
Neuroradiol. 2001;22:1109–1116.
36. Sorensen AG, Buonanno FS, Gonzalez RG, et al. Hyperacute stroke:
Evaluation with combined multisection diffusion-weighted and
hemodynamically weighted echo-planar MRI. Radiology.
1996;199:391–401.
37. McKnight TR, Smith KJ, Chu PW, et al. Choline metabolism, prolifera-
tion, and angiogenesis in nonenhancing grades 2 and 3 astrocytoma. J
Magn Reson Imaging. 2011;33(4):808–816.
38. Khayal IS, Vandenberg SR, Smith KJ, et al. MRI apparent diffusion
coefficient reflects histopathologic subtype, axonal disruption, and
tumor fraction in diffuse-type grade II gliomas. Neuro Oncol.
2011;13(11):1192–1201.
Barajas et al.: GBM MRI guided tissue specimen correlation
NEURO-ONCOLOGY † J U L Y 2 0 1 2 953
Downloaded from https://academic.oup.com/neuro-oncology/article-abstract/14/7/942/1091877by gueston 30 March 2018

39. Lee MC, Cha S, Chang SM, Nelson SJ. Dynamic susceptibility contrast
perfusion imaging of radiation effects in normal-appearing brain tissue:
changes in the first-pass and recirculation phases. J Magn Reson
Imaging. 2005;21(6):683–693.
40. Hartkens T, Rueckert D, Schnabel JA, Hawkes DJ, Hill DLG. VTK CISG
Registration Toolkit: An open source software package for affine and
non-rigid registration of single- and multimodal 3D images [abstract].
BVM; 2002; Leipzig, Germany: Springer-Verlag, 2002:185.
41. Crawford FW, Khayal IS, McGue C, et al. Relationship of pre-surgery
metabolic and physiological MRI parameters to survival for patients
with untreated GBM. J Neurooncol. 2009;91(3):337–351.
42. Saraswathy S, Crawford FW, Lamborn KR, et al. Evaluation of MR
markers that predict survival in patients with newly diagnosed GBM
prior to adjuvant therapy. J Neurooncol. 2009;91(1):69–81.
43. Kleihues P, Soylemezoglu F, Schauble B, Scheithauer BW, Burger PC.
Histopathology, classification, and grading of gliomas. Glia.
1995;15(3):211–221.
44. Preusser M, Haberler C, Hainfellner JA. Malignant glioma: neuropathol-
ogy and neurobiology. Wien Med Wochenschr. 2006;156(11–
12):332–337.
45. Tate M, Aghi M. Biology of angiogenesis and invasion in glioma.
Neurotherapeutics. 2009;6:447–457.
46. Wong M, Prawira A, Kaye A, Hovens C. Tumour angiogenesis: Its
mechanism and therapeutic implications in malignant gliomas. J Clin
Neurosci. 2009;16:1119–1130.
47. Louis DN, Ohgaki H, Wiestler OD, Cavenee WK. World Health
Organization classification of tumors: pathology and genetics of
tumors of the nervous system. 4th ed. Lyon: IARC Press; 2007.
48. Knopp EA, Cha S, Johnson G, et al. Glial neoplasms:
dynamic contrast-enhanced T2-weighted MRI. Radiology.
1999;211:791–798.
49. Brem S, Cotran R, Folkman J. Tumor angiogenesis: a quantitative
method for histologic grading. J Natl Cancer Inst. 1972;48:
347–356.
50. Batra A, Tripathi RP, Singh AK. Perfusion magnetic resonance imaging
and magnetic resonance spectroscopy of cerebral gliomas showing im-
perceptible contrast enhancement on conventional magnetic resonance
imaging. Australas Radiol. 2004;48:324–332.
51. Ginsberg LE, Fuller GN, Hashmi M, et al. The significance of lack of
MR contrast enhancement of supratentorial brain tumors in
adults: histopathological evaluation of a series. Surg Neurol.
1998;49:436–440.
52. Law M, Yang S, Wang H, et al. Glioma grading: sensitivity, specificity,
and predictive values of perfusion MRI and proton MR spectroscopic
imaging compared with conventional MRI. Am J Neuroradiol.
2003;24(10):1989–1998.
53. Miyagami M, Katayama Y. Angiogenesis of glioma: evaluation of ultra-
structural characteristics of microvessels and tubular bodies (Weibel–
Palade) in endothelial cells and immunohistochemical findings with
VEGF and p53 protein. Med Mol Morphol. 2005;38:36–42.
54. Deane BR, Lantos PL. The vasculature of experimental brain tumours.
Part 1. A sequential light and electron microscope study of angiogene-
sis. J Neurol Sci. 1981;49:55–66.
55. Deane BR, Lantos PL. The vasculature of experimental brain tumours.
Part 2. A quantitative assessment of morphological abnormalities. J
Neurol Sci. 1981;49:67–77.
56. Rojiani AM, Dorovini-Zis K. Glomeruloid vascular structures in glioblas-
toma multiforme: an immunohistochemical and ultrastructural study. J
Neurosurg. 1996;85(6):1078–1084.
57. Izycka-Swieszewska E. Immunomorphological analysis of the vascular
stroma in glioblastoma. Neurol Neurochir Pol. 2003;37(1):59–71.
58. Wesseling P, Vandersteenhoven JJ, Downey BT, Ruiter DJ, Burger PC.
Cellular components of microvascular proliferation in human glial and
metastatic brain neoplasms. A light microscopic and immunohistochem-
ical study of formalin-fixed, routinely processed material. Acta
Neuropathol. 1993;85(5):508–514.
59. Jain R, Gutierrez J, Narang J, et al., In vivo correlation of tumor blood
volume and permeability with histological and molecular angiogenic
markers in gliomas. Am J Neuroradiology. 2011;32:388–394.
60. Jain R, Narang J, Gutierrez J, et al., Correlation of immuno-histological
and perfusion vascular parameters with contrast enhancement using
image-guided biopsy specimens in gliomas. Acad Radiol.
2011;18(8):955–962.
61. Wen PY, Macdonald DR, Reardon DA, et al. Updated response assess-
ment criteria for high-grade gliomas: response assessment in neuro-
oncology working group. J Clin Oncol. 2010;28(11):1963–1972.
Barajas et al.: GBM MRI guided tissue specimen correlation
954 NEURO-ONCOLOGY † J U L Y 2 0 1 2
Downloaded from https://academic.oup.com/neuro-oncology/article-abstract/14/7/942/1091877by gueston 30 March 2018