Embed Size (px)
Citation preview

Accepted Manuscript
Refrigerant-based measurement method of heat pump seasonal performances
C.T. Tran, P. Rivière, D. Marchio, C. Arzano-Daurelle
PII: S0140-7007(12)00068-0
DOI: 10.1016/j.ijrefrig.2012.03.010
Reference: JIJR 2225
To appear in: International Journal of Refrigeration
Received Date: 23 June 2011
Revised Date: 1 February 2012
Accepted Date: 9 March 2012
Please cite this article as: Tran, C.T., Rivière, P., Marchio, D., Arzano-Daurelle, C., Refrigerant-basedmeasurement method of heat pump seasonal performances, International Journal of Refrigeration(2012), doi: 10.1016/j.ijrefrig.2012.03.010
This is a PDF file of an unedited manuscript that has been accepted for publication. As a service toour customers we are providing this early version of the manuscript. The manuscript will undergocopyediting, typesetting, and review of the resulting proof before it is published in its final form. Pleasenote that during the production process errors may be discovered which could affect the content, and alllegal disclaimers that apply to the journal pertain.

MANUSCRIP
T
ACCEPTED
ACCEPTED MANUSCRIPT - 1 -
REFRIGERANT-BASED MEASUREMENT METHOD OF HEAT PUMP
SEASONAL PERFORMANCES
C. T. Tran1, PhD student, Centre of Energy and Processes, MINES ParisTech, Paris, France
P. Rivière, Assistant Professor, Centre of Energy and Processes, MINES ParisTech, Paris, France
D. Marchio, Professor, Centre of Energy and Processes, MINES ParisTech, Paris, France
C. Arzano-Daurelle, Research Engineer, ENERBAT, Electricity of France R&D, Moret/Loing, France
Abstract
There is no reliable measurement method of air-to-air heat pump seasonal performances. In
this paper, we test a method based on intrusive measurements on the refrigerant side. The
method proposed uses two Coriolis mass flow meters for the measurement of the refrigerant
flow rate and of the vapor quality at the indoor heat exchanger outlet. The method is
validated by testing an air-to-water heat pump in laboratory conditions and by using the water
enthalpy method as a reference. Results confirm that the refrigerant density measurement
with a Coriolis flow meter can help to predict the refrigerant vapor quality with satisfactory
accuracy if the quality is not too high. The method is also reliable in dynamic conditions
(including for defrosting periods). It will then be used as a reference to check the accuracy of
different in situ measurement methods for air-to-air heat pumps.
Keywords : heat pump, performance, measurement, experimentation, refrigerant
1 Tel: (0033) 160737415 ; email : [email protected]

MANUSCRIP
T
ACCEPTED
ACCEPTED MANUSCRIPT - 2 -
Nomenclature
Cg oil mass concentration Subscrips
cp specific heat capacity J kg-1 °C -1 a air
D tube diameter mm com compressor
f rotation speed Hz con condenser
G mass flux (per surface
unit) kg m-2 s-1 eva evaporator
h specific enthalpy J kg-1 ex exhaust side
m& mass flow rate kg s-1 liq saturated liquid
P electric power W m refrigerant-oil mixture
p pressure bar oil oil
q volume flow rate m3 s-1 r refrigerant
Q& power W sat saturation state
S Premoli factor su supply side
T temperature °C vap saturated vapor
U internal energy J w water
x refrigerant vapor
quality
α void fraction Abbreviations
σ standard deviation HP heat pump
surface tension N m-1 HSPF heating seasonal
performance factor
µ dynamic viscosity kg m-1 s-1 POE polyol-ester
ρ density kg m-3
ε relative difference

MANUSCRIP
T
ACCEPTED
ACCEPTED MANUSCRIPT - 3 -
1 INTRODUCTION
1.1 Context
The heat pump is one of the solutions promoted in order to reduce energy consumption and
GHG emissions of heating systems in buildings. In this context, the use of residential heat
pumps (HPs) for heating has been rapidly spreading in Europe because of their theoretically
high efficiency. Reliable laboratory data of residential HP performances tested in standard
conditions (EN-14511, 2008) are available. But the situation may differ in the field due to the
installation quality, the design of the heating system, the climatic conditions, and so on. For
instance, (Ichikawa et al., 2007) in situ results on an air-to-air HP exhibit a very low heating
seasonal performance factor (HSPF), mainly due to the large oversizing of the HP compared
to the heating requirements.
For water-to-water or air-to-water HPs, the heating energy delivered is commonly measured
in the field by measuring the energy supplied to the water circuit (water temperature and
water flow rate measures). However, for air-to-air HPs there is almost no in situ HSPF
measurement. This is due to the difficulty of measuring the air flow rate and the air enthalpy
in the field over a long time period. We present a short literature review of the methods used
in existing residential HP tests and see to what extent they could be used for in situ
measurements.
1.2 Literature review
Measurement methods for HSPF of air-to-air HP in real life conditions are classified here in
two categories: external and internal methods. In the former, the heating capacity
measurement is based on those of the air flow rate and of the air enthalpy. In the latter, it is
based on the measurements of the refrigerant fluid flow and properties.

MANUSCRIP
T
ACCEPTED
ACCEPTED MANUSCRIPT - 4 -
An external method tested in the field is shown in (Ichikawa et al., 2007). During the tests,
the air flow rate and direction are fixed. On indoor air unit, multi point measurement of air
temperature, humidity and velocity is performed at the outlet and the inlet. Velocity
measurement is used to determine the ratios of velocity at each point to velocity at center
point, also called the ratio velocity distribution. The air velocities are then corrected, by
maintaining the ratio velocity distribution so that the air flow rate obtained from velocities
integration matches the value given by the manufacturer. By combining measured
temperatures and humidity ratios, the heating energy calculation is then performed. Another
example of an external method test is presented in (Riviere et al., 2010). A preparation
phase before the test is intended to determine the ratio velocity distribution at the inlet side of
the indoor unit through a multi point measurement. During tests, the multi point measurement
system is removed and the ratio velocity measurement is assumed to be constant. Air
velocity is measured at only one point and velocities of all other points are revealed thanks to
the ratio distribution. The air flow rate variations can then be computed from measurements.
Heating energy is computed thanks to the inlet and outlet temperature measurement (and
humidity ratios for the cooling mode). The main limitation of both methods is the unknown
accuracy. It is thought to be low, as the heating capacity is proportional to the air flow which
is determined via the air velocity measurement, while the time evolution of the velocity
distribution is not measured.
An internal method tested in the laboratory is presented in (Teodorese et al, 2007). The
refrigerant flow rate is measured by a Coriolis flow meter installed at the exhaust side of the
condenser (in heating mode). The refrigerant enthalpies are computed from the
measurement of the temperatures and pressures at the supply and exhaust of the
condenser. Two air-to-air HPs were tested in the laboratory in steady-state conditions. In
comparison with the calorimeter method, the internal method gives relatively good accuracy.
The maximal relative difference between these two methods is about 6.8 % in heating mode.

MANUSCRIP
T
ACCEPTED
ACCEPTED MANUSCRIPT - 5 -
Measurement uncertainties of both methods are not shown. The main drawback of this
method is the difficult installation of the flow meter in situ.
It is also possible to use the compressor to determine the refrigerant flow rate by using the
energy balance of the compressor. The compressor heat loss factor η is assumed to be
constant and known. The refrigerant flow rate can then be computed as:
( )1
, , , ,
comr
r com ex r com su
Pm
h h
η−=
−&
where P is the electric power, h is the specific enthalpy, subscripts r, com, ex, and su refer to
refrigerant, compressor, exhaust side and supply side respectively. The enthalpies are
determined via measurements of pressure and temperature.
(Fahlén, 2004) provides examples using this "internal" method. 110 tests on 13 water-to-
water or air-to-water HPs were tested either in the laboratory or in situ. Accuracy is better
than ±15 % compared with the enthalpy measurements on the water side. The main
advantage of this method is to eliminate the need for a flow meter. But the drawbacks are
that (1) accuracy is low, especially in dynamic conditions, due to the unmeasured factor η;
(2) the method cannot be used for HP with a gas injection compressor; (3) the difficulty of the
installation of the pressure sensor in situ for residential HPs which usually do not have
pressure plugs at both high and low pressure sides.
This literature review shows that there is no fully satisfying in situ measurement method for
the HSPF of residential HP. On the one hand, external methods may be used for the HSPF
test in the field over a long time period but their accuracy has been unknown. On the other
hand, internal methods using a refrigerant flow meter provide acceptable accuracy in steady
state conditions but it is difficult to apply these methods in the field and, in addition, their
accuracy in dynamic conditions is unknown.

MANUSCRIP
T
ACCEPTED
ACCEPTED MANUSCRIPT - 6 -
1.3 Objectives
This article aims to propose a reference testing method which can be used in future works to
assess the accuracy of both internal and external existing methods.
To that purpose, we introduce an alternative internal method. It takes into account the fact
that the refrigerant might still be biphasic at the outlet of the condenser, as this unexpected
state probably occurs in dynamic conditions or/and with improper refrigerant charge
condition. In the field, the latter condition has been commonly observed; (Mowris et al., 2004)
findings show that about 72 percent of the split air conditioners in the field has an improper
refrigerant charge (i.e. more than 110 % or less than 90 % of the manufacturer-
recommended charge).
As there is no alternative method to compare with for the dynamic testing of air-to-air heat
pumps, this method is validated in the laboratory by tests conducted on an air-to-water HP in
heating mode using the water enthalpy method as a reference. Tests are performed in
steady state and in dynamic operating conditions.
Below, we will first present the measurement method, then the test bench designed to
validate this method, and finally the test results obtained beforehand to discuss the results.
2 DESCRIPTION OF THE INTERNAL MEASUREMENT METHOD
The main difficulty of the HSPF measurement is to measure the heat exchange in the
condenser (the heating power). Both refrigerant enthalpy change and refrigerant flow rate are
necessary to determine the heat exchange.

MANUSCRIP
T
ACCEPTED
ACCEPTED MANUSCRIPT - 7 -
2.1 Refrigerant Mass Flow Rate
The flow rate can be measured at the condenser exhaust (liquid line) or at the condenser
supply (compressor discharge line). In the liquid line, the refrigerant may be biphasic.
Measurement of biphasic fluid flow rate is difficult because another thermodynamic property
is necessary: the vapor quality. This is why we measure the refrigerant flow in the
compressor discharge line where the refrigerant is always in the gas phase. This measure
can be performed with a Coriolis or with an ultrasonic flow meter.
2.2 Enthalpy Changes
Refrigerant pressures and temperatures are measured at condenser supply and exhaust.
Whenever the refrigerant is in biphasic conditions at the condenser outlet, the refrigerant
vapor quality must be measured in order to determine the refrigerant enthalpy change in the
condenser.
Two measurement methods in the liquid line can be considered. The first one is based on the
density measurement with the Coriolis flow meter. Combining this measure with the
tabulated densities of the liquid and gas saturated phases enables the refrigerant vapor
quality to be assessed using a void fraction correlation. The other solution is based on the
measurement of the refrigerant velocity with an ultrasonic flow meter. Two technologies can
be considered: a transit-time ultrasonic flow meter, which measures the velocity of the liquid
phase, and a Doppler ultrasonic flow meter, which measures the velocity of the gas bubbles.
In both cases, a combination of the measured velocity and of the refrigerant flow rate
(measured by a gas flow meter at the compressor exhaust) allows the refrigerant quality to
be determined via the mixture density and a void fraction correlation.
The measurement with the Coriolis solution is inevitably intrusive while the ultrasonic
technologies allow either intrusive measurement (in-line type) or non-intrusive measurement
(clamp-on type). The main drawbacks of these measurements are that: (1) the flow meters

MANUSCRIP
T
ACCEPTED
ACCEPTED MANUSCRIPT - 8 -
do not operate correctly on biphasic refrigerant of high vapor quality; (2) the accuracy for
biphasic refrigerant is not guaranteed by manufacturers.
The following part introduces a test bench to validate the internal measurement method.
3 EXPERIMENTS
3.1 Experimental Apparatus and Individual Uncertainties
The internal method presented above was tested in the laboratory on an air-to-water inverter
split HP in heating mode. A simplified plan of the test bench is shown in Figure 1. The
uncertainties of measured variables are shown in Table 1.
Figure 1. Flow chart of the test bench

MANUSCRIP
T
ACCEPTED
ACCEPTED MANUSCRIPT - 9 -
Table 1. Instrument uncertainty of measured variables
Variable Uncertainty
(compared to measured value)
Refrigerant flow rate 0.2 %
Refrigerant density 0.2 %
Pressure 0.25 %
Refrigerant temperature 0.8 K
Pipe diameter 0.1 mm
Water volume flow rate 1.2 %
Water temperature 0.05 K
Air temperature 0.1 K
Data acquisition system 0.1 %
The outdoor unit was installed in a climatic chamber. The indoor unit was installed in another
room and connected to a water loop. The water loop is fitted with a water temperature
controller and a water tank, which enables the control of the water temperature at the inlet of
the heat pump condenser.
Two Coriolis flowmeters were installed between the indoor and outdoor units. The first one in
the discharge line measures the refrigerant mass flow rate. The other one in the liquid line
measures the refrigerant density. The uncertainty of density measurement is 0.2 % of the
measured value for the liquid phase and is unknown for the biphasic phase. In the following,
the 0.2 % value is used for biphasic condition in the uncertainty calculation.
The refrigerant pressures (P in Figure 1) at the condenser supply and exhaust are measured
at indoor and outdoor units’ connections. The refrigerant temperatures (T in Figure 1) are
measured by contact PT100 thermometers positioned at condenser’s inlet and outlet and at

MANUSCRIP
T
ACCEPTED
ACCEPTED MANUSCRIPT - 10 -
evaporator’s inlet. Their instrument accuracy is 0.05 K. However, a measurement uncertainty
of 0.8 K is used because of the difference between contact and intrusive measurements
(LNE, 2004).
On the water side, the water volume flow rate and condenser supply and exhaust water
temperatures are measured to give a reference value.
The compressor rotation speed is measured via the electric frequency measurement (F in
Figure 1) at the compressor electric input. Finally, a measurement of the exterior room
temperature is performed with two PT100 thermometers located at the center of the two
outdoor unit fans on the outdoor unit inlet side.
The uncertainty of 0.1 % introduced by the data acquisition system is included when
computing the uncertainty. The measurement variables are recorded with a sampling rate of
10 seconds. The pipe diameter in the liquid line is needed for the refrigerant heating power
calculation; the uncertainty of the pipe diameter is assumed to be 0.1 mm.
3.2 Calculation Method
3.2.1 Oil concentration
There is little experimental data regarding oil concentration in the refrigerant for heat pump
cycles in real conditions. (Zehnder, 2004) describes experiments conducted on a residential
HP with the R407C and R134a refrigerant fluids and a synthetic oil of Polyol-ester (POE)
type. Using a Fourier transform infrared spectrometry, oil mass concentrations in the liquid
line were observed in a range of 0.2 % to 0.4 %. (Youbi-Idrissi et al., 2003) show tests
performed on a large capacity refrigeration system with the refrigerant R407C and a POE oil.
The oil mass concentration was measured with two different methods. First, a sample of
refrigerant and oil were extracted in a container. The refrigerant was evaporated, and then
the oil was weighed. The average oil concentration was 1.7 %. Second, a density flowmeter

MANUSCRIP
T
ACCEPTED
ACCEPTED MANUSCRIPT - 11 -
was placed in the liquid line to measure the density of circulating fluid (refrigerant + oil). By
combining with the densities of pure refrigerant and oil, the calculated average oil
concentration was 3 %. The uncertainty of this second method is about 50 %. The tests
presented in (Teodorese et al., 2007) assume that the circulating oil fraction is 2 % for a
residential split air conditioner.
According to these results, in this paper, we assume an oil mass concentration of 2 %. The
tested HP uses the R410A refrigerant and POE oil. The density (in kg m-3) and the specific
heat at constant pressure (in J kg-1 °C -1) of the oil are computed as in (Conde, 1996) and
(Liley and Gambill, 1973):
( ) ( ) ( )0 00 6.oil oilT T T Tρ ρ= − −
( ) 1684 3 4,
.oil
Tc Tp
s
+=
where T is the oil temperature in °C ; the oil density at T0 is given by the manufacturer (in our
test ( )0 38 998oil T Cρ = ° = kg m-3) and s is the ratio of the oil density to water density at 15.56
°C.
It should be emphasized that measurement of oil concentration via a density flow meter is
not suitable here as the densities of POE oil and R410A are very close (about 990 kg m-3 at
38 °C and 25 bar for R410A compared to 998 kg m -3 for oil). Measurement uncertainties
would be likely to reach 100 %.
3.2.2 Void fraction correlations
Fluid density measurement of biphasic fluids does not provide direct vapor quality but only
void fraction. Correlations of void fractions are needed to determine vapor quality. More than
sixty void fraction models are to be found in the literature (Woldesemayat and Ghajar, 2007).
Not all these models can be applied to our experiments with R410A fluid condensing in
horizontal pipes. Main void fraction correlations for refrigerants can be found in (Rice, 1987).
The literature comparison with experimental data presented in (Rice, 1987) shows that the

MANUSCRIP
T
ACCEPTED
ACCEPTED MANUSCRIPT - 12 -
best void fraction models for refrigerant fluids in condensers are Hughmark (Hughmark,
1962), Premoli (Premoli et al., 1971), Tandon (Tandon et al., 1985), and Baroczy (Baroczy,
1965) models. The Premoli model provides an approximate average of these models.
Experiments on an R410A air conditioner (Ma et al., 2009) show that the Premoli model, Zivi
model (Zivi, 1964) and Harms model (Harms et al., 2003) give the best results for the
condenser and that the Premoli model, Zivi model and Smith model (Smith, 1969) are the
best models for the evaporator. In our experiments, we measure the refrigerant vapor quality
in the “liquid line” where the refrigerant state is supposed to be either pure liquid and near
liquid biphasic state. So, the Premoli model and the Zivi model are the most appropriate
choices.
In this paper, we use the Premoli model. In the next part, we will show how we used this
model in our study.
3.2.3 Premoli void fraction correlation
The Premoli model allows the void fraction α to be determined from the vapor quality x as
follows:
1/2
1 1 21 2
20.19 0.22 0.51 0.08
1 1 2 1
11
(1 ) 11
1.578Re 0.0273. Re Re
vapPre
liq
f f f f fliq liq
x yy PI S F yF
S x PI yFy
GD G DF PI F We PI We
ρα
ρ
µ σρ− − −
= = = = + − − + +
= = = =
where G is the mass flux (per surface unit), D is the inner pipe diameter, µ is the dynamic
viscosity and σ the surface tension; subscripts liq, vap refer to saturated liquid phase and
saturated gas phase respectively.
MANUSCRIP
T
ACCEPTED
ACCEPTED MANUSCRIPT - 13 -
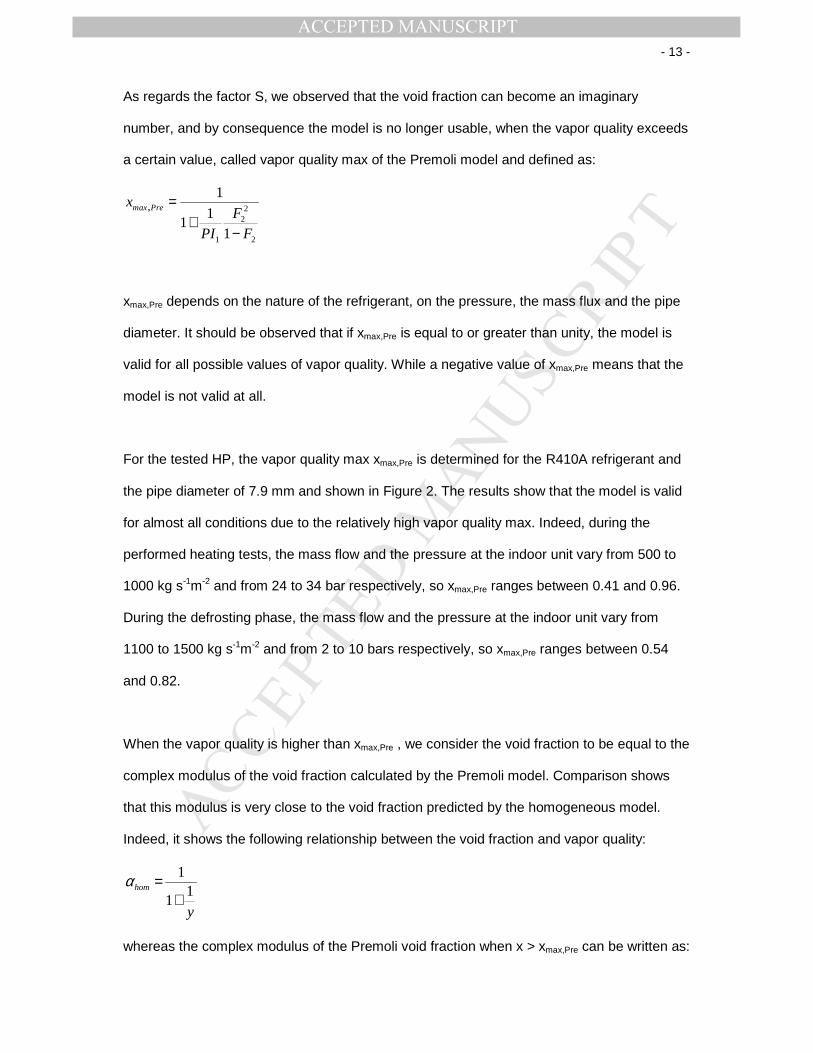
As regards the factor S, we observed that the void fraction can become an imaginary
number, and by consequence the model is no longer usable, when the vapor quality exceeds
a certain value, called vapor quality max of the Premoli model and defined as:
22
1 2
1
11
1
,max PrexF
PI F
=+
−
xmax,Pre depends on the nature of the refrigerant, on the pressure, the mass flux and the pipe
diameter. It should be observed that if xmax,Pre is equal to or greater than unity, the model is
valid for all possible values of vapor quality. While a negative value of xmax,Pre means that the
model is not valid at all.
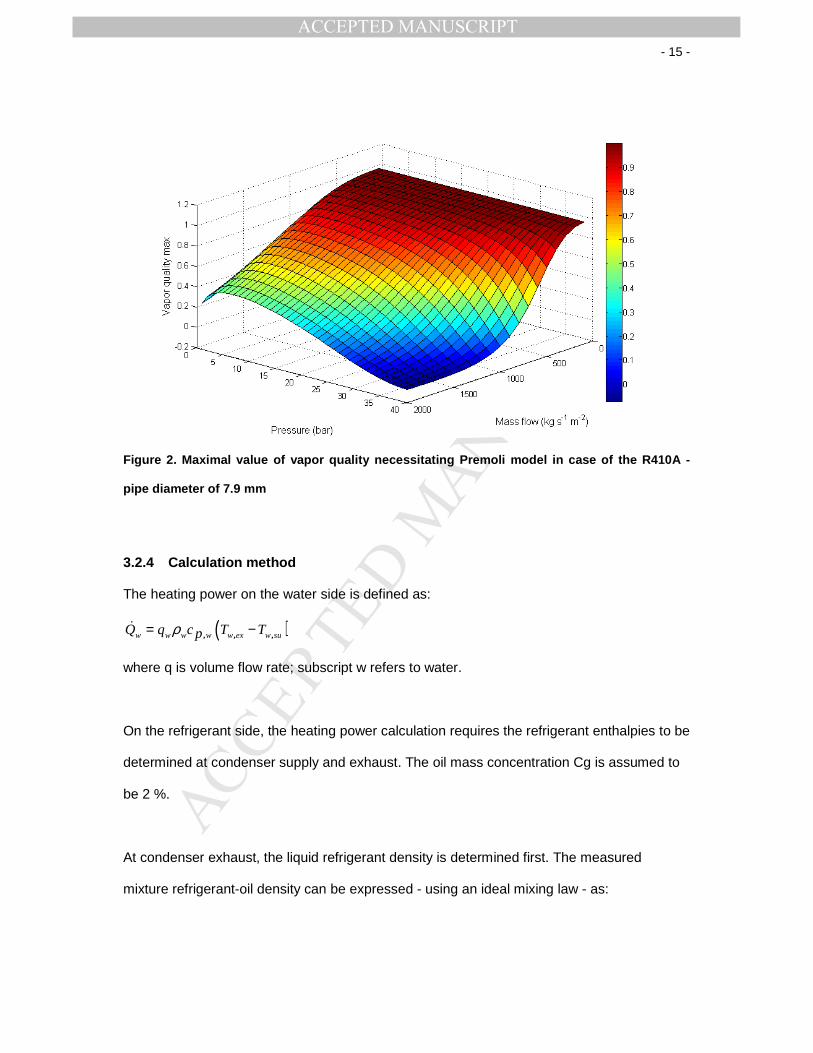
For the tested HP, the vapor quality max xmax,Pre is determined for the R410A refrigerant and
the pipe diameter of 7.9 mm and shown in Figure 2. The results show that the model is valid
for almost all conditions due to the relatively high vapor quality max. Indeed, during the
performed heating tests, the mass flow and the pressure at the indoor unit vary from 500 to
1000 kg s-1m-2 and from 24 to 34 bar respectively, so xmax,Pre ranges between 0.41 and 0.96.
During the defrosting phase, the mass flow and the pressure at the indoor unit vary from
1100 to 1500 kg s-1m-2 and from 2 to 10 bars respectively, so xmax,Pre ranges between 0.54
and 0.82.
When the vapor quality is higher than xmax,Pre , we consider the void fraction to be equal to the
complex modulus of the void fraction calculated by the Premoli model. Comparison shows
that this modulus is very close to the void fraction predicted by the homogeneous model.
Indeed, it shows the following relationship between the void fraction and vapor quality:
11
1hom
y
α =+
whereas the complex modulus of the Premoli void fraction when x > xmax,Pre can be written as:

MANUSCRIP
T
ACCEPTED
ACCEPTED MANUSCRIPT - 14 -
12 2
12
22
11
1 11 1Pre
F yyF
y yFAwith A
y y
α
−
− + = = − + +
Factor A is very close to the unity. A numerical calculation was carried out with the mass flow
and the pressure ranging from 100 to 2000 kg s-1m-2 and from 1 to 40 bar respectively giving
values of A between 0.99 and 1.
To summarize, in order to determine the void fraction from the vapor quality, we use the
following formula for the full scale of the vapor quality:
1
1S
y
α =+
(Eq. 1)
It’s worth noticing that xmax,Pre falls rapidly when the mass flow rate increases. Hence, the
Premoli model should not be used for high flow to diameter HP designs.
MANUSCRIP
T
ACCEPTED
ACCEPTED MANUSCRIPT - 15 -
Figure 2. Maximal value of vapor quality necessitating Premoli model in case of the R410A -
pipe diameter of 7.9 mm
3.2.4 Calculation method
The heating power on the water side is defined as:
( ), , ,w w w w w ex w suQ q c T Tpρ= −&
where q is volume flow rate; subscript w refers to water.
On the refrigerant side, the heating power calculation requires the refrigerant enthalpies to be
determined at condenser supply and exhaust. The oil mass concentration Cg is assumed to
be 2 %.
At condenser exhaust, the liquid refrigerant density is determined first. The measured
mixture refrigerant-oil density can be expressed - using an ideal mixing law - as:

MANUSCRIP
T
ACCEPTED
ACCEPTED MANUSCRIPT - 16 -
1 1
m oil r
Cg Cg
ρ ρ ρ−= +
where subscript r, oil, m refer to refrigerant, oil and mixture oil-refrigerant respectively.
Solving this expression leads to the following equation:
(1 ) .mr
oil
oil m
Cg
Cg
ρ ρρ ρ
ρ −=−
Then, it has to be checked whether the refrigerant is biphasic. To this purpose, the
refrigerant density is preferred to the temperature as the temperature glide of the R410A
refrigerant is about 0.1 °C while the density of th e biphasic R410A refrigerant varies by about
a factor of ten (from 100 and 1000 kg m-3) when quality varies from one to zero.
There are three possible scenarios for the computation of the refrigerant enthalpy at
condenser exhaust:
• If the refrigerant density is greater than the saturated liquid phase
density, , ( )r r liq pρ ρ> (where p is the pressure), the refrigerant is liquid. The
refrigerant vapor quality x is null. If the measured temperature is lower than the
saturated liquid phase temperature , ( )r r liqT T p< , the refrigerant enthalpy is
computed from temperature and pressure ( , )rh h T p= . If it is not, we assume
enthalpy to be the saturated liquid phase enthalpy , ( )r r liqh h p= .
• If the refrigerant density is smaller than the saturated gas phase density,
, ( )r r vap pρ ρ< , the refrigerant is in the gas phase. The refrigerant vapor quality x is
unity. If the measured temperature is higher than the saturated gas phase
temperature , ( )r r vapT T p> , refrigerant enthalpy is computed from temperature and

MANUSCRIP
T
ACCEPTED
ACCEPTED MANUSCRIPT - 17 -
pressure. If it is not, we assume enthalpy is the saturated gas phase
enthalpy , ( )r r vaph h p= .
• If the refrigerant density lies between the saturated liquid and vapor phase densities,
, ,( ) ( )r vap r r liqp pρ ρ ρ≤ ≤ , the refrigerant is biphasic. The void fraction can be
calculated from densities as follows:
,
, ,
r liq r
r liq r vap
ρ ρρ ρ
α =−
−
(Eq. 1) describes the relationship between the void fraction α and the vapor quality x.
Hence, the vapor quality is the solution to the following equations:
1
,
, ,
1
(1 )1
r liq r
r liq r vap
xy
S x PIy
ρ ρρ ρ
= =−− +
−
The refrigerant enthalpy at condenser exhaust is then computed as follows:
( ), ,. ( ) 1- ( )r r vap r liqh x h p x h p= +
At condenser supply, the refrigerant enthalpy is computed from temperature and pressure
because the fluid is still in the gas phase. Finally, heating power is computed from refrigerant
and oil enthalpy differences as follows:
( ) ( ) ( ), , , ,1m m r su r ex oil su oil exQ m Cg h h Cg h h = − − + − & &
The fluid thermodynamic properties are calculated with Refprop8 (NIST, 2009). The
calculation method for the heating power on the refrigerant side is summarized in Figure 3.

MANUSCRIP
T
ACCEPTED
ACCEPTED MANUSCRIPT - 18 -
Figure 3. Calculation flow chart for the refrigerant heating power
3.2.5 Uncertainty
The uncertainty of heating power is determined with the uncertainty propagation formula:
2
2
iY Xi i
Y
X
δσ σδ
=
∑
where σ is the standard deviation, Xi are measured variables, Y is the calculated variable
(heating power in our case).
Because the Premoli model does not provide analytical solutions and the fact that we use
Refprop8 to calculate numerically fluid thermodynamic properties, partial derivatives cannot
MANUSCRIP
T
ACCEPTED
ACCEPTED MANUSCRIPT - 19 -
be determined analytically. Instead, they are calculated with a numerical differentiation
formula as follows:
1 11
i i n i nn
i i
Y a a d a Y a a aYa a
X d
δδ
+ −= ( , ..., , ..., ) ( , ..., , ..., )( , ..., )
where small number di are chosen as shown in Table 2. Calculations with smaller values
than those do not provide any significant difference.
Table 2. Values of d for different measured variables
Variable Value of di Unit
Temperature 0.001 °C
Pressure 0.001 bar
Volume flow rate 0.001 m3/h
Mass flow rate 0.001 kg/h
Density 0.001 kg/m3
Pipe diameter 10-5 m
3.2.6 Energy balance on the condenser
The energy balance on the condenser is expressed, by discarding the kinetic energy terms
and heat exchanges between the condenser and the environment due to their small values
compared to other terms, as follows:
( ) ( ), , , , , , , ,con
m su m su m ex m ex w su w su w ex w ex
m w
dUm h m h m h m h
dt
Q Q
= − + −
= −
& & & &
& &
where conU is the internal energy of the condenser (including the quantities of water and
refrigerant it contains).

MANUSCRIP
T
ACCEPTED
ACCEPTED MANUSCRIPT - 20 -
In steady state conditions, the derivative is null. So, the heating power on the refrigerant side
should be equal to the one on the water side m wQ Q=& & . We define the average relative
difference between the heating powers measured on both sides as:
1m
w
Q dt
Q dtε = −∫∫
&
&
where the integrals are taken over a period of time.
In unsteady conditions, integrating the energy balance equation between 2 time steps t0 and t
gives:
[ ] ( )0
0
tt
con m wtt
U Q Q dt= −∫ & & (Eq. 2)
Hence, the accumulation of heating powers differences represents the change in the
condenser internal energy.
If the integration interval t-t0 is sufficiently large so that the internal energy changes are
negligible compared to the heating powers, we have:
0 0
t t
m w
t t
Q dt Q dt=∫ ∫& & (Eq. 3)
Hence, instantaneous values of the heating powers may not be equal but their integrals do.
4 RESULTS AND DISCUSION
The tests were divided into two categories: steady-state and dynamic conditions.
4.1 Steady-state Tests
Thanks to the technical information provided by the manufacturer of the heat pump, the
compressor rotation speed can be fixed. The inlet water temperature of the heat pump is
kept around 40 °C, and the heat pump is tested for different rotation speeds and different

MANUSCRIP
T
ACCEPTED
ACCEPTED MANUSCRIPT - 21 -
ambient temperatures, in steady state conditions. Steady state conditions are defined as
follows:
• The test acquisition period should be longer than 20 minutes.
• The standard deviations of the ambient air and of the inlet water temperature are less
than 0.1 K.
• The standard deviation of compressor rotation speed is less than 0.1 Hz.
• The standard deviations of heating powers (water and refrigerant sides) are less than
95 W (around 1 % of the standard rated heating power of the heat pump).
As shown in Figure 4, the heat pump usually stabilizes with biphasic state at condenser
exhaust especially during the tests with heating power values lower than under standard
rated conditions. It seems that the lower the delivered heating power, the greater the
refrigerant vapor quality becomes. The latter was observed as high as 50 %.
As the test is in steady state conditions, the heating power on refrigerant side should be
equal to the one on water side. Figure 5 compares heating power measured on both sides.
Values on the refrigerant side lie between the measured power on the water side more or
less the ± 2σ error which represent confidence intervals of 95 %. In particular, the relative
differences for tests with null quality at condenser exhaust are less than 1 %. The
uncertainties in percentage of the water heating power depend on operative conditions. In
our tests, they vary from 1.9 % to 5.0 %. High uncertainties correspond to the low heating
power tests because of small differences between inlet and outlet water temperatures. In
order to reduce uncertainty, the water flow rate was decreased in some tests with respect to
the water temperature limits of the heat pump.
The uncertainties in percentage of the refrigerant heating powers are between 0.4 % and 1.1
%. It should be noted that the uncertainty calculation for refrigerant side does not take into

MANUSCRIP
T
ACCEPTED
ACCEPTED MANUSCRIPT - 22 -
account the assumption of 2 % mass oil concentration and the uncertainty of the void fraction
model.
Figure 4. Refrigerant vapor quality at condenser exhaust and heating power on water side
Figure 5. Validation of the refrigerant enthalpy method in steady state conditions

MANUSCRIP
T
ACCEPTED
ACCEPTED MANUSCRIPT - 23 -
4.2 Dynamic Test
The heat pump operates in “normal mode” where the system controller sets the compressor
rotation speed. Both the inlet water temperature and the ambient air temperature were
varied.
Figure 6. Time evolution of dry temperature at the exterior room, water temperatures at indoor
unit supply/exhaust and water volume flow rate
As shown in Figure 6, the outdoor temperature varies between -10 °C and 15 °C. The water
volume flow rate is maintained constant at about 1120 l h-1. The inlet temperature varies
between 20 °C and 45 °C. The outlet temperature var ies between 25 °C and 60 °C.

MANUSCRIP
T
ACCEPTED
ACCEPTED MANUSCRIPT - 24 -
Figure 7. Time evolution of refrigerant mass flow rate at condenser inlet, compressor rotation
speed, refrigerant density and refrigerant vapor quality at the condenser outlet
Figure 7 shows the time evolution of the refrigerant mass flow rate at condenser inlet, the
compressor rotation speed, the refrigerant density and vapor quality at the condenser outlet.
Periods with null flow rate correspond to compressor stops. ”Negative” flow rates correspond
to inversion cycles - defrosting mode. During defrosting periods, the refrigerant density varies
according to the inversion of the cycle. There are 4 defrosting periods in the test. The
compressor is always stopped for several minutes after an inversion cycle.
The behavior is different from “fixed compressor speed mode”, where the refrigerant at the
condenser outlet is usually in liquid phase. The reason why could not be clearly clarified, but
it implies that the heat pump control is different in these two operation modes. Biphasic
refrigerant occurs during all defrosting periods and for a short period of time afterwards. This
phenomenon can also happen temporarily in the heating phase with refrigerant vapor
qualities of up to 10 %.
It is demonstrated in part 4.3 that the internal energy change [ ]0
t
con tU is negligible compared
to the heating power integrations on the water side and on the refrigerant side for a test over
one frosting-defrosting period. Because there are 4 defrosting periods during the test, the
heating power integrations should theoretically be equal (Eq. 3). Experimental results show
that the average relative difference between heating powers is 1.8 %.
Biphasic conditions represent about 17 % of the total time period of the test. Therefore,
measurement of the refrigerant vapor quality helps to measure more accurately the
refrigerant heating capacity. Indeed, by not taking into account this measure and assuming
that refrigerant vapor quality is null, the average relative difference between heating powers
increases to 2.5 %.

MANUSCRIP
T
ACCEPTED
ACCEPTED MANUSCRIPT - 25 -
4.3 Defrosting Period
Figure 8. Time evolution of compressor rotation speed, outlet water temperature Tw,ex,
refrigerant saturation temperature at condenser Tr,sat,con (calculated from measured pressure),
refrigerant temperature at evaporator supply Tr,eva,su, accumulation term, heating power on
water side, refrigerant oil mixture flow rate and refrigerant vapor quality in the defrosting
period
This part describes the results obtained between the 495th and 525th minutes when a
defrosting period occurs, based on Figure 8. In this period, and for this heat pump, 3 phases
can be distinguished:
• Inversion cycle: the 4-way-valve position change happens at point 2 while the compressor continues to run. A negative refrigerant flow rate is observed (Figure 8c). In the internal heat exchanger, the pressure falls sharply. As shown on Figure 8a the refrigerant saturation temperature Tr,sat,con, calculated from measured pressure, decreases from 40 °C to -20 °C. Then it increases because of the heat exchange with water. At the external heat exchanger, the refrigerant temperature Tr,eva,su , measured at the evaporator inlet, raises rapidly from -14
MANUSCRIP
T
ACCEPTED
ACCEPTED MANUSCRIPT - 26 -
°C to about 7 °C, then remains relatively stable at this step for about 1 minute. Afterward, it increases and when it reaches about 40 °C the compr essor stops (point 3). The temperature step seems to correspond to the time the frost on external heat exchanger melts. For other defrosting periods, the step is also observed around 10 °C. The step duration should qualitatively represent the quantity of frost on the heat exchanger surface. It can also be noticed that Tr,eva,su seems to be used to control the compressor. In the 4 observed defrosting cycles the compressor stops when Tr,eva,su reaches a temperature between 33 to 42 °C. The inversion cycle lasts about 2 minutes.
• Compressor stop: the refrigerant flow rate tends to become null and the refrigerant temperatures in both heat exchangers immediately get to a medium value due to the pressure equilibrium. So, the expansion valve should be opened during the compressor stop. This phase lasts about 1 minute.
• Transitory phase: the compressor restarts (point 4). After a short period of time, the valve position change occurs ; it is proved by the second negative flow rate period (Figure 8c). Afterwards the compressor rotation speed increases slowly to the level observed before the defrosting period. The transitory phase lasts about 9 minutes, between points 2 and 5, time at which the refrigerant vapor quality reaches zero.
It is noted that there are two periods with negative water heating power wQ& < 0 (Figure 8b)
with a total heat quantity of -1263 kJ, equivalent to the energy produced by the HP at
standard rated condition during about 2 minutes. This quantity has to be taken into account
in the calculation of seasonal performances as a negative term. It is due to the fact that the
water pump is kept on during defrosting which is useful to prevent the indoor exchanger to
freeze.
In dynamic conditions, the change in condenser internal energy [ ]0
t
con tU should theoretically
be equal to the accumulation of heating powers differences ( )0
t
m w
t
Q Q dt−∫ & & (Eq. 2). Figure 8b
shows the accumulation term (with t0 = 495 minutes). Before the defrosting period (points 1-
2), it increases gradually due to a difference of 2.6 % between measured values of heating
powers. Because all variables are practically constant, this difference is essentially related to
measurement accuracies. So, without any change in internal energy (i.e. in steady state), the
accumulation term must follow the blue dashed line. We notice that during the defrosting
period it is no longer the case; the difference represents[ ]0
t
con tU which is the sum of the 3
following terms:

MANUSCRIP
T
ACCEPTED
ACCEPTED MANUSCRIPT - 27 -
• the refrigerant internal energy, which is qualitatively an increasing function of refrigerant saturation temperature Tr,sat,con.
• the water internal energy, which is dependent on the inlet water temperature and on Tr,sat,con.
• the metal internal energy, which is a function of its average temperature, varying with both temperatures of refrigerant and water inside the heat exchanger.
As shown on Figure 8a, the temperatures at internal exchanger in both water and refrigerant
side decrease importantly. So, the internal energy change during the defrosting period
should represent the maximum change in any operating conditions. On Figure 8b, the
difference between the accumulation term and the dashed line reaches a maximum value of
584 kJ when the compressor stops (point 3). It should be noted that 584 kJ is close to the
quantity of heat produced by the HP at standard rated condition during about 1 minute.
Hence the internal energy change is really negligible for a test over one complete heating
cycle with a frosting-defrosting period (on this testing sequence, typically about 2 to 3 hours).
It is remarkable that at the moment the internal energy change reaches zero, determined
when the water temperature Tw,ex and refrigerant saturation temperature Tr,sat,con come back
to their levels before the defrosting period, the accumulation term effectively joins back the
blue dashed line (point 6). In other words the integral of heating power on the refrigerant side
is equal to the one on the water side over the defrosting period, if we except measurement
uncertainties.
Therefore, the refrigerant enthalpy method is validated in dynamic conditions, including
defrosting phases. Although the test was not carried out in real conditions, it covers almost
all climatic conditions. This internal method should provide an accurate reference for field
performance measurements of heat pumps.
5 CONCLUSION AND PERSPECTIVE
The present study proposes a method to measure the heating power of heat pumps. This
method is based on the measurement of the mass flow rate, temperatures and pressures of
MANUSCRIP
T
ACCEPTED
ACCEPTED MANUSCRIPT - 28 -
the refrigerant at the condenser. A measurement of the refrigerant density is used to
determine the refrigerant vapor quality at the condenser exhaust. This method was tested on
a residential air-to-water HP and was compared with a water enthalpy method.
The refrigerant enthalpy method is validated in steady state conditions by setting the HP at
the “fixed compressor speed mode”. The refrigerant at the condenser exhaust can be
permanently in biphasic state with the vapor quality ranging from 0 % to 50 %. All measured
refrigerant heating powers lie within the ±2σ confidence intervals of water heating powers
which have uncertainties varying from 1.9 % to 5.0 %. In particular, the relative differences
for all tests with null quality are less than 1.0 %.
The refrigerant enthalpy method is also accurate in dynamic conditions (including for
defrosting phases) when the heat pump is reset to the “normal mode”. The phenomenon of
biphasic refrigerant at the condenser exhaust is observed mainly during the defrosting phase
with only occasional short periods during the standard heating periods. On a long duration
test, the relative difference with the water enthalpy method has been measured to be of 1.8
% on average. On a defrosting period, there are big differences between heating powers
which represent changes in condenser internal energy. However, the integral of heating
power on the refrigerant side is equal to the one on the water side over the defrosting period.
The maximum change in condenser internal energy is equivalent to a quantity of heat
produced by the heat pump working at standard rated conditions during about 1 minute. It is
worth noting that while performing the experiments, the periods of time with the biphasic
refrigerant phenomenon were observed with a non-negligible frequency (17 %).
The method accuracy depends not only on the measurement uncertainty but also on the void
fraction correlation used and the assumption on the oil concentration. There is no unique
choice which is good for every types of heat pump. It is recommended for each heat pump to
select the proper correlation and oil concentration level.

MANUSCRIP
T
ACCEPTED
ACCEPTED MANUSCRIPT - 29 -
The drawback of the refrigerant method for in situ measurements is the difficult installation of
the intrusive flow meters. Replacing them with external ultrasonic flow meters may be a
solution to apply this method in situ.
The internal method is fully applicable for air-to-air heat pumps. In a further study, it will be
used as a reference to check the air enthalpy methods proposed for in situ measurement of
the HSPF of air-to-air heat pumps.
References
Baroczy, C. J. (1965). Correlation of liquid fraction in two-phase flow with application to liquid metals.
Chemical Engineering Progress 61 , 179–191.
Conde, M. (1996). Estimation of thermophysical properties of lubricating oils and their solutions with
refrigerants: an appraisal of existing methods. Applied Thermal Engineering , Vol.16, 51-61.
EN-14511. (2008). Air conditioners, liquid chilling packages and heat pumps with electrically driven
compressors for space heating and cooling - Part 2: Test conditions.
Fahlén, P. (2004). Methods for commissionning and performance checking of heat pumps and
refrigeration equipment. Gothenburg: Chalmers University of Technology.
Harms, T., Li, D., Groll, E., & Braun, J. (2003). A void fraction model for annular flow in horizontal
tubes. International Journal of Heat and Mass Transfer 46 , 4051-4057.
Hughmark, G. A. (1962). Holdup in gas-liquid flow. Chemical Engineering Progress 58 , 62-65.
Ichikawa, T., Anna, W., & Satoshi, Y. (2007). Study on Running Performance of a Split-type Air
conditioning System Installed on a University Campus in Subruban Tokyo. Climat 2007 WellBeing
Indoors Congress.
Liley, P., & Gambill, W. (1973). Physical and chemical data. In Chemical Engineering Handbook, 5th
edition (pp. 226-250). New York: McGraw-Hill.
LNE. (2004). Guide d'utilisation des capteurs de température de surface. Projet AQCEN, Ministère de
l'Economie des Finances et de l'Industrie. Laboratoire national de métrologie et d'essais.
Ma, X., Ding, G., Zhang, P., Han, W., Kasahara, S., & Yamaguchi, T. (2009). Experimental validation of
void fraction models for R410A air conditioners. International journal of refrigeration 32 , 780-790.

MANUSCRIP
T
ACCEPTED
ACCEPTED MANUSCRIPT - 30 -
Mowris, R., Blankenship, A., & Jones, E. (2004). Field measurements of air conditioners with without
TXVs. Proceedings of the 2004 ACEEE Summer Study on Energy Efficiency in Buildings. Washington,
DC, USA: American Council for an Energy - Efficient Economy.
NIST. (2009). Reference Fluid Thermodynamic and Transport Properties Database-Version 8.0.
Premoli, A., Francesco, D. D., & Prina, A. (1971). A dimensional correlation for evaluating two-phase
mixture density. La Termotecnica 25 , 17-26.
Rice, C. (1987). The effect of void fraction correlation and heat flux assumption on refrigerant charge
inventory predictions. ASHRAE Transactions , Vol.93, Pt.1, No.3035, pp.341-367.
Riviere, P., Coevoet, M., Tran, C. T., & Nordman, R. (2010). SEPEMO (Heat Pump Seasonal
Performance Monitoring) Project, D4.1. guideline for air to air heat pump field measurements.
Contract for the European Communities. Contract No.: IEE/08/776/SI2.529222.
Smith, S. (1969). Void fractions in two-phase flow. A correlation based upon an equal velocity head
model. Proceedings of The Institution of Mechanical Engineers 184, (pp. 647-664).
Tandon, T. N., Varma, H. K., & Gupta, C. P. (1985). A void fraction model for annular two-phase flow.
International Journal of Heat and Mass Transfer 28 , 191–198.
Teodorese, V., Detroux, L., & Lebrun, J. (2007). Testing of a room air conditioner - High class RAC test
results-Medium class RAC test results. Liège: Université de Liège.
Woldesemayat, M. A., & Ghajar, A. J. (2007). Comparison of void fraction correlations for different
flow patterns in horizontal and upward inclined pipes. International Journal of Multiphase Flow 33 ,
347–370.
Youbi-Idrissi, M., Bonjour, J., Terrier, M., Meunier, F., & Marvillet, C. (2003). In-situ measurements of
enthalpy change on an evaporator working with r407c: effect of oil presence. Eurotherm 72th, (pp.
104-109). Valence.
Zehnder, M. (2004). Efficient air-water heat pumps for high temperature lift residential heating
including oil migration aspects. PhD thesis. Lausanne: Ecole Polytechnique Fédérale de Lausanne.
Zivi, S. (1964). Estimation of steady-state steam void-fraction by means of the principle of minimum
entropy production. Journal of Heat Transfer 86 , 247-252.