Embed Size (px)
Citation preview
Design & Engineering Services
Modeling Variable Refrigerant Flow Heat Pumps
in Commercial Buildings
HT.10.SCE.251 Report
Prepared by:
Design & Engineering Services
Customer Service Business Unit
Southern California Edison
December 2012
Modeling Variable Refrigerant Flow Heat Pumps in Commercial Buildings HT.10.SCE.251
Southern California Edison
Design & Engineering Services December 2012
Acknowledgements
Southern California Edison’s Design & Engineering Services (DES) group is responsible for
this project. It was developed as part of Southern California Edison’s HVAC Technologies
and System Diagnostics (HTSDA) Program under internal project number HT.10.SCE.251.
Bach Tsan conducted this technology evaluation with overall guidance and management
from Jerine Ahmed. For more information on this project, contact [email protected].
Disclaimer
This report was prepared by Southern California Edison (SCE) and funded by California
utility customers under the auspices of the California Public Utilities Commission.
Reproduction or distribution of the whole or any part of the contents of this document
without the express written permission of SCE is prohibited. This work was performed with
reasonable care and in accordance with professional standards. However, neither SCE nor
any entity performing the work pursuant to SCE’s authority make any warranty or
representation, expressed or implied, with regard to this report, the merchantability or
fitness for a particular purpose of the results of the work, or any analyses, or conclusions
contained in this report. The results reflected in the work are generally representative of
operating conditions; however, the results in any other situation may vary depending upon
particular operating conditions..
Modeling Variable Refrigerant Flow Heat Pumps in Commercial Buildings HT.10.SCE.251
Southern California Edison Page ii Design & Engineering Services December 2012
EXECUTIVE SUMMARY Southern California Edison (SCE) needs an accurate, nonproprietary and reliable way of
estimating Variable Refrigerant Flow with Heat Recovery (VRF-HR) system energy use to
determine savings for energy efficiency. This is accomplished by quantifying and verifying
the energy use of traditional HVAC systems and a similar effort regarding VRF systems.
Currently building energy simulation modeling tools do not accurately model VRF-HR
system energy use. This performance data will enable modeling of VRF-HR system energy
use by simulation tool developers for use in utility programs. The laboratory tests section
details the process in which data was collected to assist software developers.
The variable refrigerant flow (VRF) heat pump air conditioner (AC) is a heating, ventilation,
and air-conditioning (HVAC) system model in the United States Department of Energy’s
(DOE) building energy simulation program. The performance of a VRF AC system is based
on multiple performance characteristics. Full-load performance data defines the variations of
capacity and power when outdoor or indoor conditions change. Part-load performance
identifies how the capacity and power change when the heat pump condenser’s variable
compressor changes speed. The performance of a VRF AC system may also change when
the total indoor terminal unit capacity is greater than the total outdoor unit capacity. The
ratio of indoor terminal unit to outdoor condenser unit capacity is referred to as the
combination ratio (CR). These performance aspects will be described in detail throughout
this paper.
There have been well validated and robust vapor compression system models. These
advanced vapor compression system modeling tools can be linked with complex component
models, e.g. phase-by-phase heat exchanger models or segment-by-segment heat
exchanger models. But most of these system simulation models are limited to single-stage
vapor compression configurations, with a single condenser and evaporator pair. VRF system
modeling can be challenging, since there are many variables to handle; for example,
compressor speed and different indoor air dry and wet bulb temperatures in individual
zones, etc. Since the indoor units are in parallel configuration, and they impact each other
by connecting to the same compressor and outdoor heat exchanger, a simultaneous solver
like is necessary for system solving. Integrating complex heat exchanger models leads to
more difficulties, since they will add many more equations, which are usually not amenable
for simultaneous solving. Due to these complexities, open publications and research results
for VRF system modeling using complex component models are still limited. In this project,
the project team have enhanced the existing modeling capability to handle VRF multi-split
systems, using advanced heat exchanger models, so as to simulate VRF space cooling,
space heating, and simultaneous space cooling and heating modes ,also known as VRF-HR.
Manufactures’ performance data for capacity and power are used to create full-load and
part-load performance curves for cooling and heating operating modes. When performance
variations for full-load capacity or power cannot be modeled using a single performance
curve, the data set is divided into lower and upper temperature regions and dual
performance curves are used. Objects may also be created to substitute when performance
curves do not provide the required accuracy. These performance curves or tables are then
used as input data for the variable refrigerant flow heat pump model. The techniques
described in this paper can be used to create performance curves for any software
development model.
Modeling Variable Refrigerant Flow Heat Pumps in Commercial Buildings HT.10.SCE.251
Southern California Edison Page iii Design & Engineering Services December 2012
In addition to the manufactures performance data, model validation was carried out utilizing
VRF-HR performance mapping from a laboratory test project and field monitoring of a test
building.
The observed savings in the validation models are shown in the area of cooling savings, due
to low fan energy and minimized duct losses. The simulations compared the baseline HVAC
systems to VRF-HR systems, with parametric analysis of three building types and in eight
climate zones in SCE service territory.
The findings from the project represent a path towards the development of a computer
algorithm, which could later be incorporated into various software platforms. The data
collected presented difficulties stemming from the vast differences among input parameters
of software platforms. There were limitations in some software to adequately address
simultaneous heating and cooling.
The continued development of software and modeling algorithms are beneficial to the
advancement of the opportunities for accurate simulation of VRF-HR systems. This future
work will help fine tune the computer model in part-load operation, model assumption when
switching between cooling and heating in heat recovery mode, defrost operating modes,
and validations with detailed field monitored data. The following are considerations for
advancement of accurate simulation software:
Further collaboration between utilities, software developers, VRF manufacturers,
and other stakeholders to continue to develop the testing parameters and share
data
Continued Field tests are needed to provide additional performance metrics,
including compressor speed and refrigerant temperatures.
Results should be made public so that other researchers, software coders and
end users could benefit from the control algorithms. Test standards could be
developed to enhance the validity and usefulness future test results.
ASHRAE has recently created a VRF technical track and this projects results feeds
directly into that type of program, and will likely spawn future research.
Continued engagement of the U.S. Department of Energy (DOE) to implement a
computer model for a VRF-HR heat pump in the DOE’s EnergyPlusTM whole
building energy simulation software (EnergyPlus 2012)
Modeling Variable Refrigerant Flow Heat Pumps in Commercial Buildings HT.10.SCE.251
Southern California Edison Page iv
Design & Engineering Services December 2012
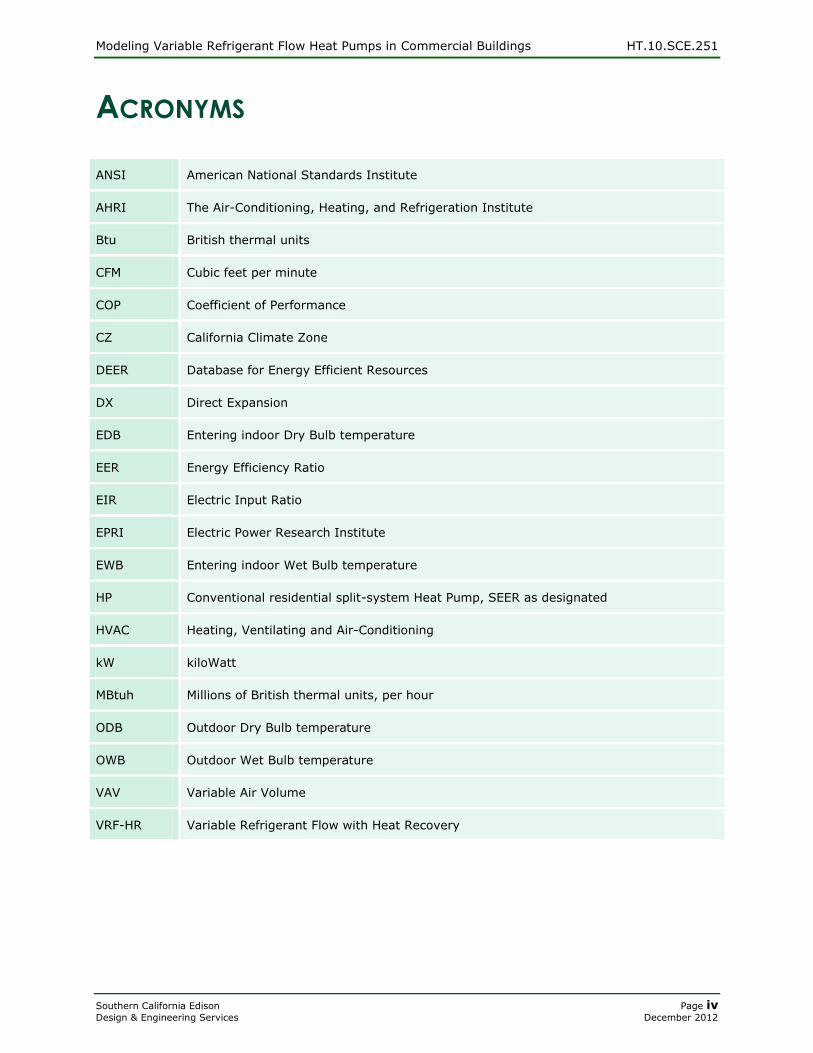
ACRONYMS
ANSI American National Standards Institute
AHRI The Air-Conditioning, Heating, and Refrigeration Institute
Btu British thermal units
CFM Cubic feet per minute
COP Coefficient of Performance
CZ California Climate Zone
DEER Database for Energy Efficient Resources
DX Direct Expansion
EDB Entering indoor Dry Bulb temperature
EER Energy Efficiency Ratio
EIR Electric Input Ratio
EPRI Electric Power Research Institute
EWB Entering indoor Wet Bulb temperature
HP Conventional residential split-system Heat Pump, SEER as designated
HVAC Heating, Ventilating and Air-Conditioning
kW kiloWatt
MBtuh Millions of British thermal units, per hour
ODB Outdoor Dry Bulb temperature
OWB Outdoor Wet Bulb temperature
VAV Variable Air Volume
VRF-HR Variable Refrigerant Flow with Heat Recovery
Modeling Variable Refrigerant Flow Heat Pumps in Commercial Buildings HT.10.SCE.251
Southern California Edison Page v
Design & Engineering Services December 2012
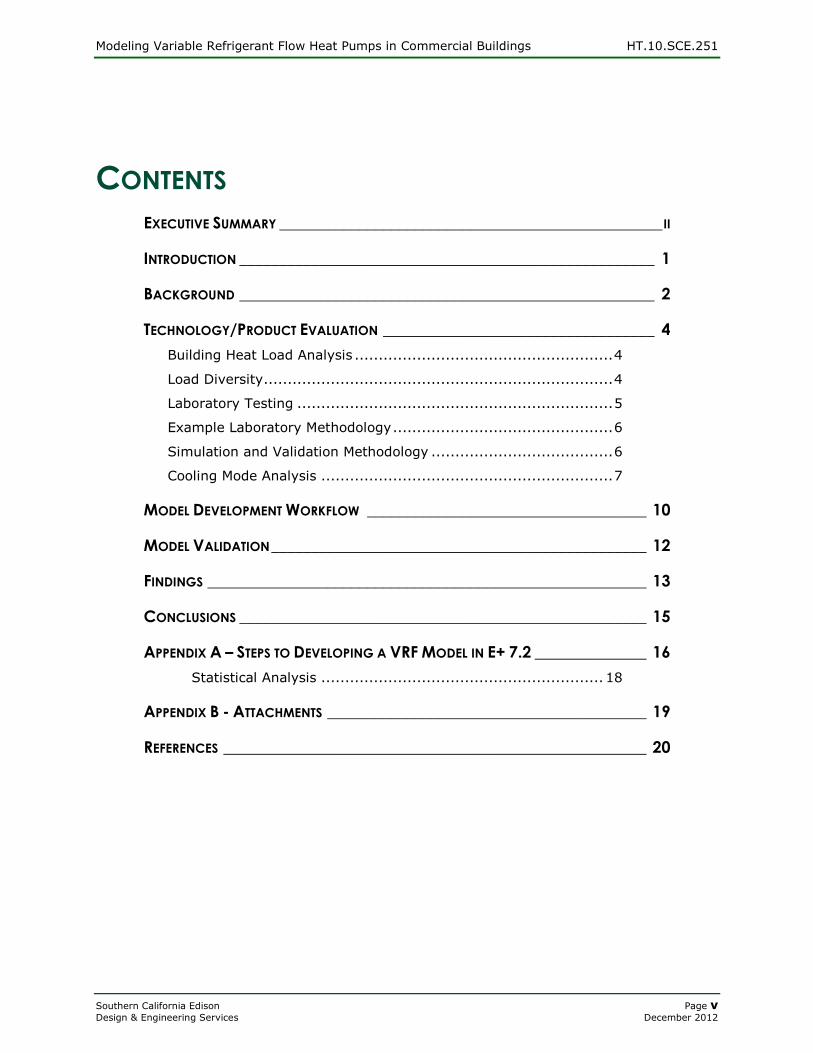
CONTENTS
EXECUTIVE SUMMARY ________________________________________________ II
INTRODUCTION ____________________________________________________ 1
BACKGROUND ____________________________________________________ 2
TECHNOLOGY/PRODUCT EVALUATION __________________________________ 4
Building Heat Load Analysis ...................................................... 4
Load Diversity ......................................................................... 4
Laboratory Testing .................................................................. 5
Example Laboratory Methodology .............................................. 6
Simulation and Validation Methodology ...................................... 6
Cooling Mode Analysis ............................................................. 7
MODEL DEVELOPMENT WORKFLOW ___________________________________ 10
MODEL VALIDATION _______________________________________________ 12
FINDINGS _______________________________________________________ 13
CONCLUSIONS ___________________________________________________ 15
APPENDIX A – STEPS TO DEVELOPING A VRF MODEL IN E+ 7.2 ______________ 16
Statistical Analysis ........................................................... 18
APPENDIX B - ATTACHMENTS ________________________________________ 19
REFERENCES _____________________________________________________ 20
Modeling Variable Refrigerant Flow Heat Pumps in Commercial Buildings HT.10.SCE.251
Southern California Edison Page vi Design & Engineering Services December 2012
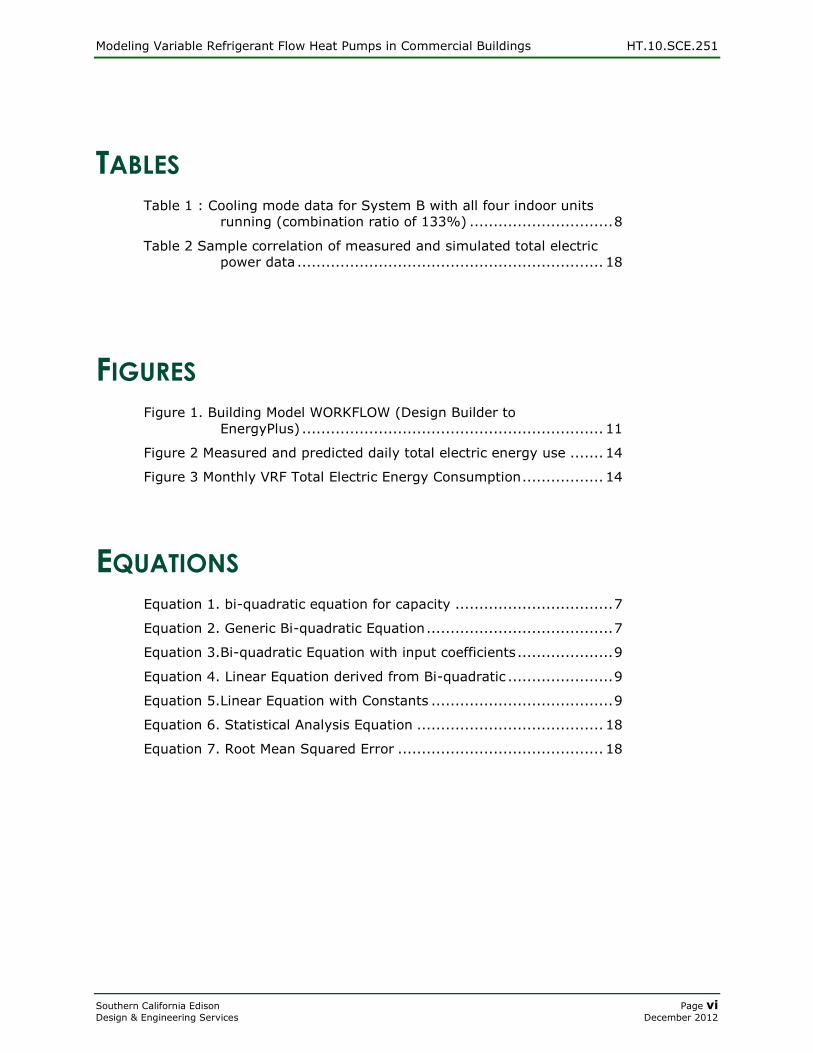
TABLES Table 1 : Cooling mode data for System B with all four indoor units
running (combination ratio of 133%) .............................. 8
Table 2 Sample correlation of measured and simulated total electric
power data ................................................................ 18
FIGURES Figure 1. Building Model WORKFLOW (Design Builder to
EnergyPlus) ............................................................... 11
Figure 2 Measured and predicted daily total electric energy use ....... 14
Figure 3 Monthly VRF Total Electric Energy Consumption ................. 14
EQUATIONS Equation 1. bi-quadratic equation for capacity ................................. 7
Equation 2. Generic Bi-quadratic Equation ....................................... 7
Equation 3. Bi-quadratic Equation with input coefficients .................... 9
Equation 4. Linear Equation derived from Bi-quadratic ...................... 9
Equation 5. Linear Equation with Constants ...................................... 9
Equation 6. Statistical Analysis Equation ....................................... 18
Equation 7. Root Mean Squared Error ........................................... 18
Modeling Tool Development for VRF-HR Systems HT.10.SCE.251
Southern California Edison Page 1
Design & Engineering December 2012
INTRODUCTION Variable Refrigerant Flow (VRF) systems are multi-zone units that circulate refrigerant from
an outdoor compressor to multiple indoor fan coil units. Different combinations of indoor
ductless and ducted units can be used for these systems depending on the application and
layout of the building. VRFs incorporate inverter driven compressors and fans that modulate
the flow of refrigerant in the system in response to the actual cooling and heating demand.
Thus, they provide significantly better part load performance over conventional packaged
and split-systems, while maintaining more precise temperature control. VRF with Heat
Recovery technology is a subset of VRF systems that allows individual indoor units to heat
or cool as required, while the compressor load benefits from the internal heat recovery. A
heat-recovery system operates by managing the refrigerant through a gas flow device, can
simultaneously heat and cool, depending on the requirements of each building zone. Heat-
recovery systems increase VRF efficiency via energy transfer from one zone to meet the
needs of another, when operating in simultaneous heating and cooling mode.
VRF systems are modular in design. The compressors range in size from 6 tons up to 30
tons and more capacity can be added as needed for the application by increasing the
number of outdoor units. Unlike traditional packaged multi-zone air conditioners that must
condition all zones and must reheat the supply air to accommodate different temperature
set points, VRFs control each zone by modulating the amount of refrigerant that is delivered
to each fan coil unit within the zone. Refrigerant delivery is being modulated to deliver
varying amounts of refrigerant to zones with a lower demand and other zones can be
completely turned off during times of little to no cooling or heating demand. The inverter-
controlled compressor responds to the lower demand by reducing its speed and results in an
effective reduction in capacity during part-load conditions.
VRF modeling capabilities in non-proprietary building and energy simulation tools has been
lagging (Geotzler, 2007). There have been attempts to develop a VRF heat-pump-system
computer model and incorporate it into an unofficial version of the EnergyPlus engine
(Zhou et al., 2007, 2008; Li and Wu, 2010; and, Li et al., 2010). A VRF heat-pump
computer model was implemented in DOE’s EnergyPlusTM whole building energy simulation
software, and first released in V7.0 in December 2011 (U.S. Department of Energy, 2011).
The heat recovery version was first released in V7.2 in October 2012 (U.S. Department of
Energy, 2012).
Modeling Tool Development for VRF-HR Systems HT.10.SCE.251
Southern California Edison Page 2
Design & Engineering December 2012
BACKGROUND As variable refrigerant flow (VRF) systems gain acceptance, building owners are increasingly
interested in identifying the energy savings potential of these system types. In addition,
electric utility companies must project the impact that these heating, ventilating and air
conditioning (HVAC) system types will have on their peak demand and energy use forecast.
The impact that new HVAC system types have on electric energy use is estimated through
simulation models and verified through field demonstrations where a conventional HVAC
system is replaced by a VRF system and energy use is monitored over an extended period
of time. Results from typical field demonstrations may take on the order of one year or
more, therefore, efforts to simulate these system types accurately using computer modeling
are rapidly evolving.
Field testing all possible system combinations and building arrangements is a challenging
and expensive task, therefore complementary approach to field testing are to model HVAC
system performance with energy modeling software and when appropriate, to use results of
prescribed equipment rating or performance testing as a metric for calculating relative
building energy use profiles.
Over the course of the last several years, a VRF rating standard was developed and resulted
in the ANSI/AHRI standard 1230: Performance Rating of Variable Refrigerant Flow (VRF)
Multi-Split Air-Conditioning and Heat Pump Equipment. This standard identifies the
methodology for determining standard cooling, heating and simultaneous cooling and
heating operational efficiency. The intent of the standard is to allow comparison of VRF
equipment performance, within the VRF equipment class, and with that of unitary
equipment at similar operating conditions. This rating standard is intended as an equipment
comparison mechanism and is not designed to predict building energy use, which is
dependent on the equipment operation, the building operation and the interaction of the
equipment with the building. With that in mind, rating standards do offer a method for
predicting relative building energy use between two similar equipment types installed in
identical building environments.
Many utility programs base incentive amounts and calculated energy savings on the
marginal difference between rated efficiencies within particular classes of HVAC equipment,
such as packaged rooftop air conditioners & heat pumps. The idea being that if all other
things remain unchanged: building envelop, occupancy, etc., but a piece of equipment is
changed to a more efficient system, then the relative difference in rated efficiency of the
equipment will reasonably translate to energy savings for the building.
Comparison of VRF to traditional unitary equipment in this similar manner would represent a
partial change in approach since two different classes of HVAC equipment would be
compared. The crafters of the 1230 Rating Standard attempted to address this by making
the testing conditions and methodology as similar to the unitary standards (ANSI/AHRI
210/240 and 340/360) as possible by allowing for VRF systems to be operated at
manufacturer-determined fixed operating conditions (compressor & fan speeds and
expansion valve openings). One is then left with a rating standard which tests equipment at
fixed operation, while the same equipment in the field may vary its operation in accordance
with changing load. This creates questions as to the direct applicability of the rating test as
an accurate representation of actual field performance relative to other fixed-speed unitary
equipment. It is currently considered difficult, at best, to use rating performance as a proper
Modeling Tool Development for VRF-HR Systems HT.10.SCE.251
Southern California Edison Page 3
Design & Engineering December 2012
metric for judging building energy performance with VRF systems. Although this remains an
active area of research since having that method (in a reliable form) could greatly simplify
the incentivizing and program process. In the meantime, near-term efforts are focused on
building modeling to predict energy savings potential.
Software models like EnergyPlus, Energy Pro and eQuest are used for design and system
selection of HVAC and building systems. Such tools simulate the performance of the building
envelope and systems within the building, and enable users to compare different types of
potential HVAC systems, to size systems, simulate noise levels, estimate electric load
profiles, calculate likely operating costs, and predict system functionality. These modeling
tools can likewise be used for energy efficiency programs to evaluate potential energy and
power savings for a proposed HVAC system upgrade.
Inclusion of VRF systems in available modeling tools has been evolving. EnergyPro, Energy
Plus and Trane Trace included VRF heat pump systems, and some designers developed
post-processing methods to simulate VRF heat recovery systems. VRF manufacturers often
provide some type of modeled performance comparison in their marketing materials and/or
on their websites in support of the technology.
Though modeling of VRF systems has been performed, there are publications showing
models that have been evaluated against actual performance data. A series of articles
produced from work done at the University of Maryland’s Center for Environmental Energy
Engineering from 2006 through 2009 provides some comparisons. The 2009 paper in
Energy and Buildings entitled “Simulation Comparison of VAV and VRF Air Conditioning
Systems in an Existing Building for the Cooling Season” provides a starting point. This paper
showed a modeled savings of 27-58% with VRF compared with variable air volume (VAV),
depending on installation configuration and climate. A similar paper by Liu & Hong, 2010 in
Energy & Buildings compares VRF (using EnergyPro) to a comparable ground source heat
pump (using eQuest) and concludes that the ground source heat pump generally
outperforms an air source VRF, though comments from the Liu & Hong paper indicate that
insufficient model validating data is available for the VRF component. There remains
significant debate in the greater industry as to the proper approach for modeling VRF
systems, including questions such as to how to account for ventilation air, and how to
approach simultaneous heating and cooling.
Much of the effort to bring VRF modeling into existing building energy software packages
has been motivated by the California Code of Regulations (CCR)and Title 24 (the section
defining energy efficiency standards for residential and non-residential buildings). The CCR
and Title 24 require documenting the energy efficiency value of technologies. Most notably,
EnergyPro, developed by the company EnergySoft, is accepted as a compliance standard
with California’s Title 24 EnergyPro. It is the most widely used simulation software by VRF
manufacturers and likely the one used most by designers and energy practitioners of VRF
systems. eQuest and Trane Trace were also used by design community representatives.
Energy Plus is gaining acceptance in the modeling community and has recently had a VRF-
HR module added to it, with inclusion of data provided from this effort.
Modeling Tool Development for VRF-HR Systems HT.10.SCE.251
Southern California Edison Page 4
Design & Engineering December 2012
TECHNOLOGY/PRODUCT EVALUATION Building modeling for air conditioning and heating loads can be divided into two key parts: a
building heat load analysis, and a building energy use analysis. The heat load analysis
determines the size of heating and cooling equipment needed and the energy analysis
predicts energy use and compares alternative HVAC systems.
BUILDING HEAT LOAD ANALYSIS The size of heating and cooling equipment can be calculated based on factors
including building shape, orientation, wall/roof components, windows (fenestration),
insulation, lighting, occupancy and usage scheduling. The building is divided into
‘zones’ which are basically the area of the floor plan served by a single indoor unit. A
single thermostat controls each zone temperature. Calculations are performed to
determine 1) the maximum overall building heating/cooling load (sometimes termed
‘block load’), and 2) the individual maximum heating/cooling load for the individual
zones (‘zone’ loads).
The program uses local weather data in conjunction with physical building
parameters to generate the heating/cooling load profile for a typical year. Programs
analyze the HVAC system loads on an hourly basis (i.e., 24 hours/day x 365 days =
8,760 hrs/year), and generate the overall peak demand for the heating/cooling
system along with individual zone load sizing data.
LOAD DIVERSITY Zone loads are the calculated heating and cooling requirements of a finite space. The
block loads are the sum of the zone loads at a specific time. The sum-of-the-zone
loads typically exceed the block load. Sometimes, these amounts can differ by as
much as 150%. This disparity is referred to as ‘load diversity’ and is caused by
different zone loads peaking at different times during the day. An example may be
that an east exposure could experience its maximum cooling demand in the morning,
while a west exposure may need heating in the morning. Conversely, a west
exposure will usually experience peak cooling conditions in the afternoon, while an
east zone may require heating due to being shaded in the afternoon.
The block load is used to determine the maximum size of the heating and cooling
plant. The individual zone loads are used to size the indoor unit(s) needed to serve
the individual spaces within the building.
VRF modules in energy simulation software were originally built around manufacturer
provided performance data. There are two general approaches to equipment and/or
building energy modeling: empirical and component (or physics-based). Currently all
publically available VRF models are empirical, meaning that system performance is
calculated as a function of pre-measured system operation. Conversely, component
based modeling calculates system performance from the fundamental physics of the
thermodynamic processes. The component technique has potential to be more
accurate and more flexible, but it is developmentally more difficult and requires
significant computing resources. Efforts in component-based modeling are in the
Modeling Tool Development for VRF-HR Systems HT.10.SCE.251
Southern California Edison Page 5
Design & Engineering December 2012
research stages with institutions like Oak Ridge National Laboratory and Purdue
University leading.
The existing empirical models have been questioned to a degree because data used
to map VRF performance has largely come from manufacturers without any
independent verification. In addition, the highly flexible and scalable nature of VRF
makes it difficult to have a full data set that covers all possible operating
environments. Systems range from 6 – 30+ tons with ~4-100 indoor units per
system and can operate in cooling, heating or mixed modes. This flexibility and
scalability is a strong attribute for application of VRF to a variety of building types,
but it complicates accurate modeling.
Electric Power Research Institute (EPRI), in conjunction with Southern California
Edison, Bonneville Power Administration and the Florida Solar Energy Center (FSEC),
has embarked on an effort to provide independently measured performance
information on VRF systems through a combination of laboratory testing and field-
testing to building energy model developers. This data is used to accomplish several
ends:
1) to inform the model developers about actual system operation in modes or
operating regimes that may not be covered by available manufacturer data;
2) to provide independent data for VRF system performance that directly compare
with manufacturer provided data;
3) to use field data from multiple sites for model testing and adjustment, and
4) to run simulations on a set of typical buildings, with and without accompanying
field data
LABORATORY TESTING VRF-HR systems are inverter-driven heating, HVAC systems, similar to residential
ductless heat pumps. However, VRF-HR systems are typically larger, installed in
commercial buildings, include more indoor units per outdoor unit and are capable of
simultaneous heating and cooling. Building simulation models are used to estimate
VRF-HR system energy use, but until 2012, models have not been based on
independently tested performance data. Laboratory testing in 2011 & 2012 created
VRF-HR performance data sets for inclusion in and to inform software modules for
the following four types of VRF-HR systems:
System A: 2-pipe, heat-recovery system
System B: 3-pipe, distributed, heat-recovery system,
System C: 3-pipe, distributed, heat-recovery system, with ducted indoor units
System D: 3-pipe, distributed, heat-recovery, with non-ducted indoor units.
These VRF-HR data sets were provided to EnergyPlus, eQuest and EnergyPro
modelers for use in developing their commercially available building simulation
products. Data sets were also provided to Oak Ridge National Laboratory (ORNL) and
Purdue University, who are separately pursuing component-based models of
variable-speed, multi-zone heat pumps, with the eventual goal of component based
VRF-HR models. (The data sets were provided to ORNL and Purdue as a courtesy and
it is not a specific objective of this project to develop component-based models.)
Modeling Tool Development for VRF-HR Systems HT.10.SCE.251
Southern California Edison Page 6
Design & Engineering December 2012
EXAMPLE LABORATORY METHODOLOGY Laboratory data collected for two VRF-HR systems (VRF-HR), tested in EPRI’s
Thermal Environmental Lab, was analyzed for developing parametric relationships
between observed outputs and controlled input parameters. The controlled input
parameters in cooling mode are the outdoor dry bulb temperature (OD-DBT) and the
return air wet bulb temperature (RA-WBT). In heating mode, the controlled input
parameters are outdoor wet bulb temperature (OD-WBT) and the return air-dry bulb
temperature (RA-DBT). The output parameters in heating and cooling mode are the
capacity of the system, power draw, supply air temperatures, energy efficiency ratio
((EER), in cooling mode) and coefficient of performance ((COP) in heating mode).
This document provides parametric equations that can be used to calculate any of
the observed output (capacity, power, EER / COP and supply air temperature) given
the input conditions for the systems tested.
SIMULATION AND VALIDATION METHODOLOGY Performance curves of the VRF system simulation model were generated using the
catalog data of the System A model installed at the EPRI test. These performance
curves along with lab-measured rated conditions lab measured values were used to
model the VRF system in EnergyPlus. The EnergyPlus building input file was created
using the building design and detailed drawings of the EPRI test building. The VRF
system installed at EPRI had four terminal units that served one thermal zone each.
Infiltration rate levels were based on the DOE EnergyPlus reference buildings. The
initial reference infiltration rates were also adjusted to match the facility operating
conditions. Other required building input parameters, such as occupancy, lighting,
plug loads, and thermostat set-points, were specified based on the DOE reference
building model inputs and the EPRI test facility conditions. A custom weather file was
created using the actual measured outdoor dry-bulb temperature, relative humidity,
and TMY3 weather data of Knoxville, TN. This was done to increase the accuracy of
the simulation results by using real outdoor condition data. Since there were no
measured solar irradiance, wind speed, and wind direction data, local TMY3 data was
used to create customized weather.
After the EnergyPlus model input was created, detailed simulations were run, and
EnergyPlus outputs were compared against field measured data. The measured data
comparison includes the total daily electric energy consumption of indoor and
outdoor units. The predicted (simulated) total electric power includes the VRF heat
pump, terminal unit fan power, and terminal unit parasitic electric power. The
predicted VRF heat pump electric power includes electricity used by the compressor,
crankcase heater, and the condenser fan. The predicted parasitic electric power
includes electricity used by the zone terminal unit’s controls, or other associated
devices. The simulation results comparison with the field measured data is presented
in the following section.
Modeling Tool Development for VRF-HR Systems HT.10.SCE.251
Southern California Edison Page 7
Design & Engineering December 2012
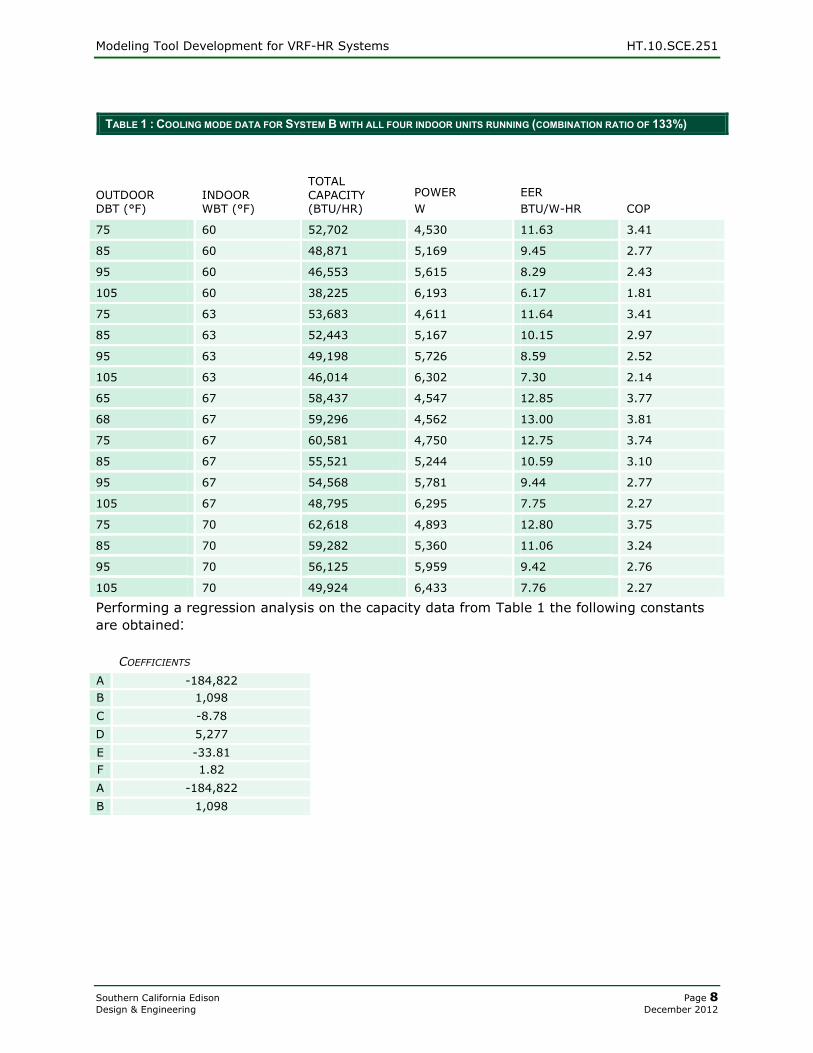
COOLING MODE ANALYSIS Based on the controlled input parameters, laboratory testing of the two VRF-HR
systems (System A and System B) was performed to collect a data set. The data set
consisted of controlled input parameters and observed output. For example, Table 1
shows the cooling mode data from System B. The controlled parameters in this data
set are the OD-DBT and the RA-WBT. The observed output is the measured capacity,
power and EER. To develop the parametric equations a bi-quadratic curve is
considered. A linear curve can also be fitted if the data regression line fits the
observed data with higher accuracy than a more involved bi-quadratic. Due to the
number of constants involved, a cubic curve is not investigated, and most energy
modeling software does not use such a curve.
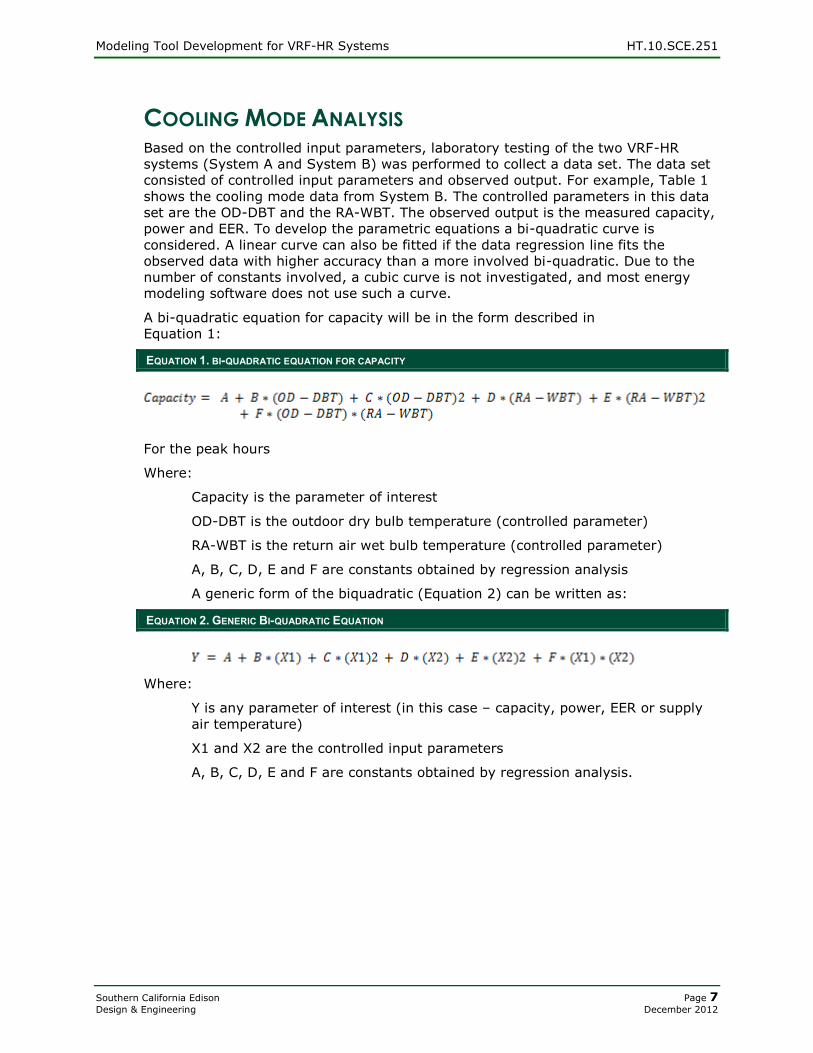
A bi-quadratic equation for capacity will be in the form described in
Equation 1:
EQUATION 1. BI-QUADRATIC EQUATION FOR CAPACITY
For the peak hours
Where:
Capacity is the parameter of interest
OD-DBT is the outdoor dry bulb temperature (controlled parameter)
RA-WBT is the return air wet bulb temperature (controlled parameter)
A, B, C, D, E and F are constants obtained by regression analysis
A generic form of the biquadratic (Equation 2) can be written as:
EQUATION 2. GENERIC BI-QUADRATIC EQUATION
Where:
Y is any parameter of interest (in this case – capacity, power, EER or supply
air temperature)
X1 and X2 are the controlled input parameters
A, B, C, D, E and F are constants obtained by regression analysis.
Modeling Tool Development for VRF-HR Systems HT.10.SCE.251
Southern California Edison Page 8
Design & Engineering December 2012
TABLE 1 : COOLING MODE DATA FOR SYSTEM B WITH ALL FOUR INDOOR UNITS RUNNING (COMBINATION RATIO OF 133%)
Performing a regression analysis on the capacity data from Table 1 the following constants
are obtained: COEFFICIENTS
A -184,822
B 1,098
C -8.78
D 5,277
E -33.81
F 1.82
A -184,822
B 1,098
OUTDOOR DBT (°F)
INDOOR WBT (°F)
TOTAL
CAPACITY (BTU/HR)
POWER
W
EER
BTU/W-HR COP
75 60 52,702 4,530 11.63 3.41
85 60 48,871 5,169 9.45 2.77
95 60 46,553 5,615 8.29 2.43
105 60 38,225 6,193 6.17 1.81
75 63 53,683 4,611 11.64 3.41
85 63 52,443 5,167 10.15 2.97
95 63 49,198 5,726 8.59 2.52
105 63 46,014 6,302 7.30 2.14
65 67 58,437 4,547 12.85 3.77
68 67 59,296 4,562 13.00 3.81
75 67 60,581 4,750 12.75 3.74
85 67 55,521 5,244 10.59 3.10
95 67 54,568 5,781 9.44 2.77
105 67 48,795 6,295 7.75 2.27
75 70 62,618 4,893 12.80 3.75
85 70 59,282 5,360 11.06 3.24
95 70 56,125 5,959 9.42 2.76
105 70 49,924 6,433 7.76 2.27
Modeling Tool Development for VRF-HR Systems HT.10.SCE.251
Southern California Edison Page 9
Design & Engineering December 2012
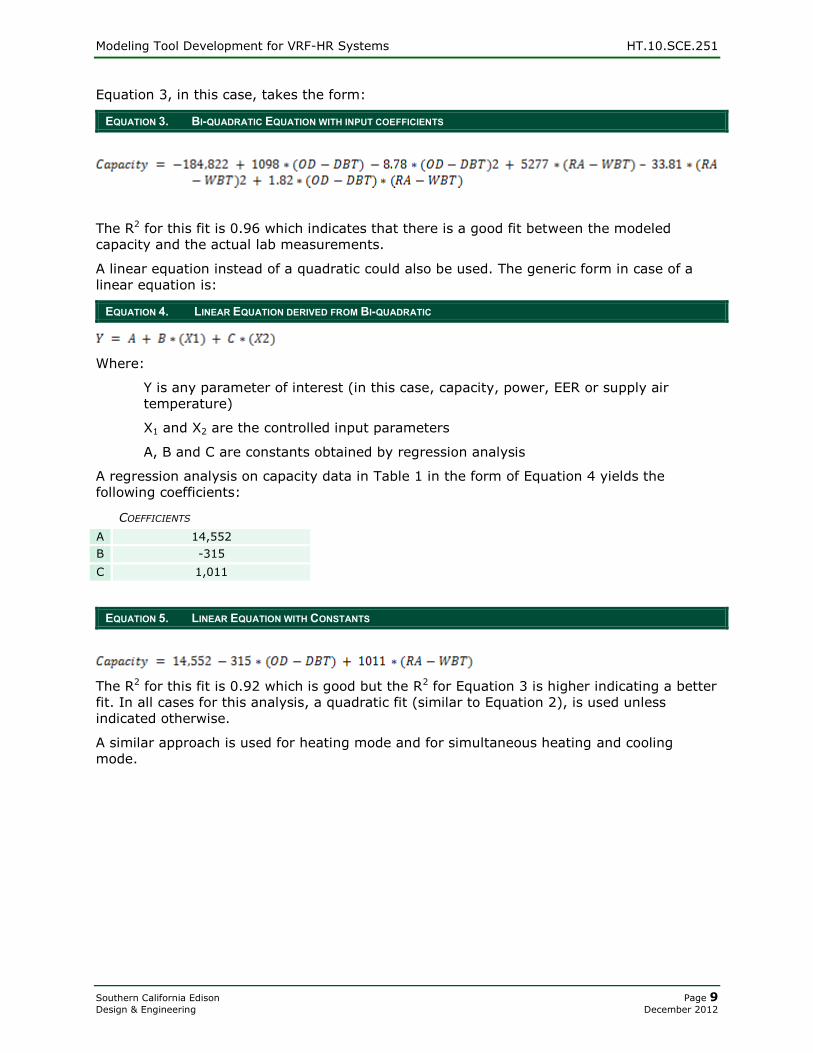
Equation 3, in this case, takes the form:
EQUATION 3. BI-QUADRATIC EQUATION WITH INPUT COEFFICIENTS
The R2 for this fit is 0.96 which indicates that there is a good fit between the modeled
capacity and the actual lab measurements.
A linear equation instead of a quadratic could also be used. The generic form in case of a
linear equation is:
EQUATION 4. LINEAR EQUATION DERIVED FROM BI-QUADRATIC
Where:
Y is any parameter of interest (in this case, capacity, power, EER or supply air
temperature)
X1 and X2 are the controlled input parameters
A, B and C are constants obtained by regression analysis
A regression analysis on capacity data in Table 1 in the form of Equation 4 yields the
following coefficients:
COEFFICIENTS
A 14,552
B -315
C 1,011
EQUATION 5. LINEAR EQUATION WITH CONSTANTS
The R2 for this fit is 0.92 which is good but the R2 for Equation 3 is higher indicating a better
fit. In all cases for this analysis, a quadratic fit (similar to Equation 2), is used unless
indicated otherwise.
A similar approach is used for heating mode and for simultaneous heating and cooling
mode.
Modeling Tool Development for VRF-HR Systems HT.10.SCE.251
Southern California Edison Page 10
Design & Engineering December 2012
MODEL DEVELOPMENT WORKFLOW
Step 1. Building Model Geometry: Most advanced thermal energy modeling software can
be utilized to make informed decisions about building materials and systems to provide the
most sustainable and cost effective building possible. The model provides input to (1) the
building’s architectural systems, (2) glazing systems and glazing quantities, (3) placement
and orientation of building, (4) insulation values, (5) wall, roof, and floor systems, and (6)
shading devices to achieve a high performance building that minimizes life cycle cost
through architectural systems. The building geometry process involves creating Computer
Aided Design (CAD) fidelity drawings, importing the CAD geometry to the energy modeling
software, and defining energy-related parameters (envelope, glazing, HVAC systems;
activity).
Step 2. Zoning of Model: Proper zoning of the model is critical to evaluating the
performance of a VRF system. VRF systems are most efficient when simultaneous heating
and cooling loads occur. The model zoning must the necessary fidelity to capture the unique
operating conditions where simultaneous heating and cooling occurs. For design studies,
this zoning can be varied to determine optimal VRF zones. For existing building, the zoning
must accurately capture the actual building-zoning configuration.
Step 3. Benchmark Comparison: At this stage, ASHRAE 90.1 values, Energy Star, and
loads analysis are used as benchmarks against which to compare the model. If the model
does not compare favorably to normed values, then the engineer returns to Step 1 and
rebuilds the geometry. If the model is satisfactory, the engineer continues to Step 4.
Step 4. Mechanical Equipment Model: Here the modeler minimizes initial and life cycle
costs through proper sizing of heating and cooling systems. Load calculations are
accomplished through the following optional software: Energy10, Trane Air Conditioning
Economics (TRACE), Hourly Analysis Program (HAP), EnergyPro, EQuest, or EnergyPlus.
Configure the VRF target zones for easy conversion to VRF systems.
Step 5: Analyze full Model Performance: Now the full model’s performance is
measured against published standards. Baseline performance is used for comparison to VRF
equipped model.
Steps 6-9. Modify the Baseline Model to Incorporate VRF Systems: (See the
attachments located in the appendix for detailed steps of the conversion of the baseline
model to the VRF-enabled model.)
Step 6. Export the EnergyPlus Input Data File (.idf): If necessary, translate the .idf file to
EnergyPlus v7.2 format (short term).
Step 6a. Import .idf into EnergyPlus v7.2. Test for conformance.
Step 7. Build VRF system models and systems using EnergyPlus data (EnergyPlus has
developed specialized performance curves for VRF systems). For initial development, edit
VRF-targeted zones directly from baseline to VRF enabled systems. Build and test the new
.idf file.
Step 7. Advanced: After initial development/testing completed, develop an EnergyPlus
macro file (.imf) to modify baseline systems to VRFs and generate new model.
Modeling Tool Development for VRF-HR Systems HT.10.SCE.251
Southern California Edison Page 11
Design & Engineering December 2012
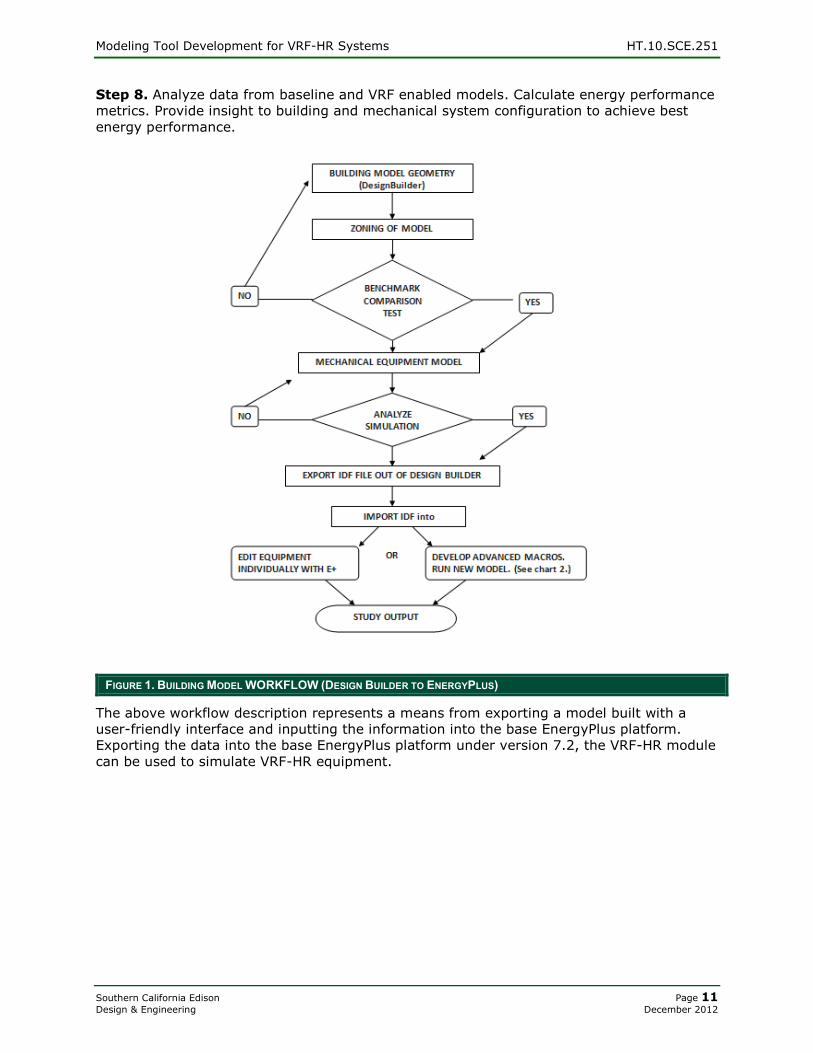
Step 8. Analyze data from baseline and VRF enabled models. Calculate energy performance
metrics. Provide insight to building and mechanical system configuration to achieve best
energy performance.
FIGURE 1. BUILDING MODEL WORKFLOW (DESIGN BUILDER TO ENERGYPLUS)
The above workflow description represents a means from exporting a model built with a
user-friendly interface and inputting the information into the base EnergyPlus platform.
Exporting the data into the base EnergyPlus platform under version 7.2, the VRF-HR module
can be used to simulate VRF-HR equipment.
Modeling Tool Development for VRF-HR Systems HT.10.SCE.251
Southern California Edison Page 12
Design & Engineering December 2012
MODEL VALIDATION The information gathered during the field demonstrations are compared to computer
simulations to identify whether a VRF computer model can accurately simulate electrical
energy use and peak demand. The information gathered from the field demonstration for a
particular building type and location is used to identify key parameters for the VRF
computer model. Investigating differences in energy use between the actual field
demonstration and the computer model will improve the computer model inputs and
assumptions. The computer simulation can then be applied to predict VRF performance in
other climate regions to replace the long and costly field monitoring approach. Computer
modeling also allows simulation of the air-distribution system for conventional HVAC system
types and compares the energy savings expected when using ductless VRF systems.
EPRI has contracted to Florida Solar Energy Center (FSEC) to use the new Energy Plus VRF-
HR module to model building and VRF system energy use in several example buildings. This
effort wasincluded in the analysis and modeling of one of the laboratory systems. The unit
used in the laboratory test was then installed to provide air conditioning service to an EPRI
building. The detail of the algorithm development is described in the appendix attachment 2
in a report titled “Evolution of the EnergyPlus VRF Computer Model”.
Modeling Tool Development for VRF-HR Systems HT.10.SCE.251
Southern California Edison Page 13
Design & Engineering December 2012
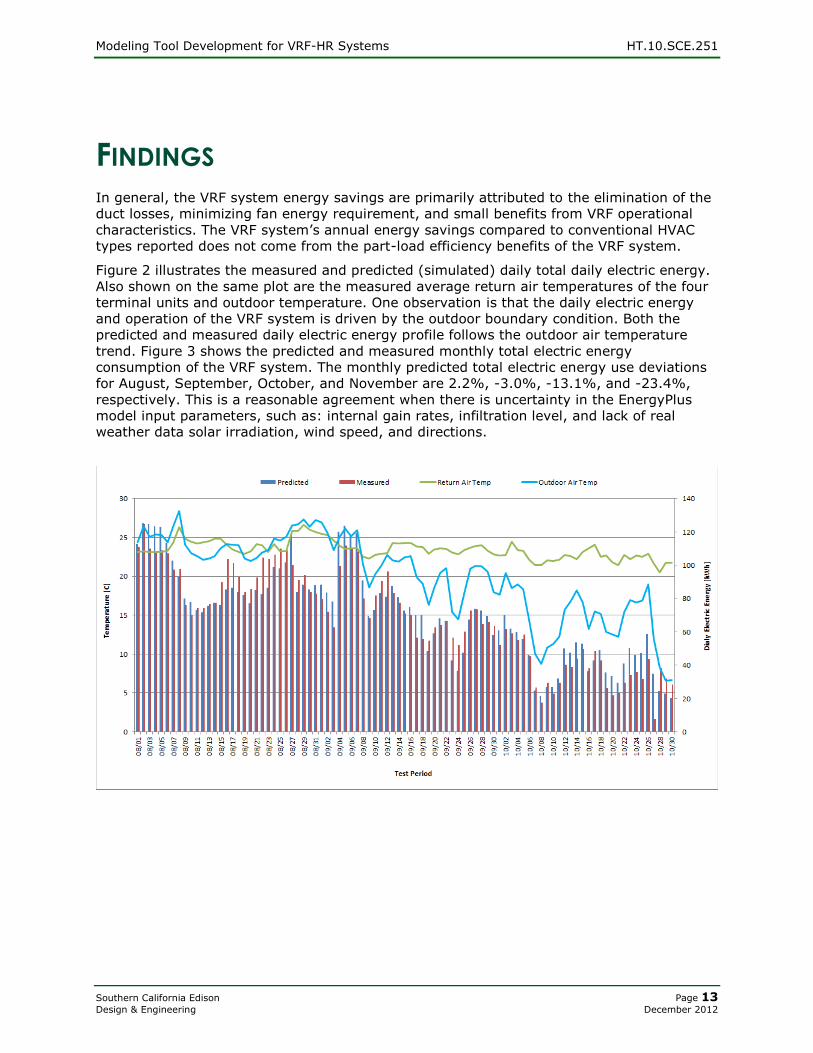
FINDINGS In general, the VRF system energy savings are primarily attributed to the elimination of the
duct losses, minimizing fan energy requirement, and small benefits from VRF operational
characteristics. The VRF system’s annual energy savings compared to conventional HVAC
types reported does not come from the part-load efficiency benefits of the VRF system.
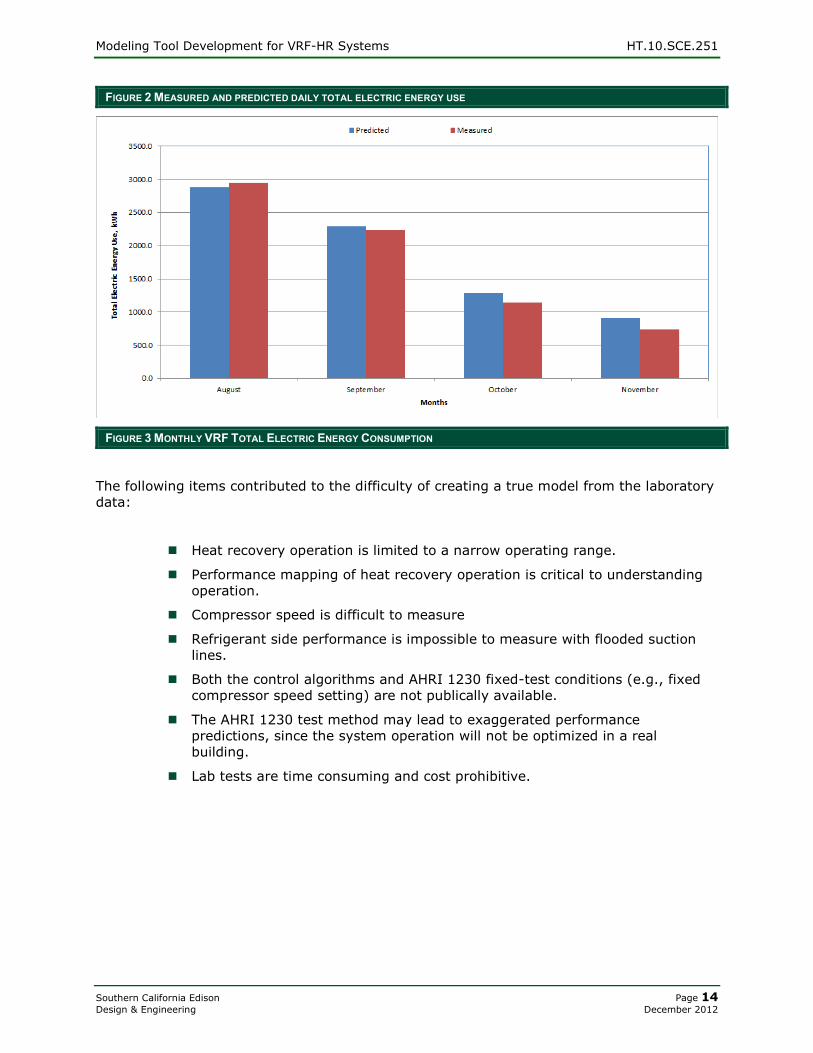
Figure 2 illustrates the measured and predicted (simulated) daily total daily electric energy.
Also shown on the same plot are the measured average return air temperatures of the four
terminal units and outdoor temperature. One observation is that the daily electric energy
and operation of the VRF system is driven by the outdoor boundary condition. Both the
predicted and measured daily electric energy profile follows the outdoor air temperature
trend. Figure 3 shows the predicted and measured monthly total electric energy
consumption of the VRF system. The monthly predicted total electric energy use deviations
for August, September, October, and November are 2.2%, -3.0%, -13.1%, and -23.4%,
respectively. This is a reasonable agreement when there is uncertainty in the EnergyPlus
model input parameters, such as: internal gain rates, infiltration level, and lack of real
weather data solar irradiation, wind speed, and directions.
Modeling Tool Development for VRF-HR Systems HT.10.SCE.251
Southern California Edison Page 14
Design & Engineering December 2012
FIGURE 2 MEASURED AND PREDICTED DAILY TOTAL ELECTRIC ENERGY USE
FIGURE 3 MONTHLY VRF TOTAL ELECTRIC ENERGY CONSUMPTION
The following items contributed to the difficulty of creating a true model from the laboratory
data:
Heat recovery operation is limited to a narrow operating range.
Performance mapping of heat recovery operation is critical to understanding
operation.
Compressor speed is difficult to measure
Refrigerant side performance is impossible to measure with flooded suction
lines.
Both the control algorithms and AHRI 1230 fixed-test conditions (e.g., fixed
compressor speed setting) are not publically available.
The AHRI 1230 test method may lead to exaggerated performance
predictions, since the system operation will not be optimized in a real
building.
Lab tests are time consuming and cost prohibitive.
Modeling Tool Development for VRF-HR Systems HT.10.SCE.251
Southern California Edison Page 15
Design & Engineering December 2012
CONCLUSIONS Further research work is required to extensively validate the computer model with full
monitoring of the model input and output parameters in a more controlled environment or
building. This future work will help fine tune the computer model in part-load operation,
model assumption when switching between cooling and heating in heat recovery mode,
defrost operating modes, and validations with detailed field monitored data. The following
activities are recommended for future work:
Further collaboration between utilities, software developers, VRF manufacturers, and
other stakeholders to continue to develop the testing parameters and share data
A continuation of laboratory and field tests is needed to provide additional
performance metrics, including compressor speed and refrigerant temperatures.
Conducting a field validation study with detailed monitored model input parameters,
such as indoor conditions, various internal loads, building constructions, and actual
weather data, is essential to characterize the computer model prediction accuracy
and fine tune model assumptions. This study would provide VRF modeling guidance
and establish a reasonable energy saving benchmark for the VRF system compared
to conventional HVAC systems.
• Continued laboratory tests are required to evaluate and understand the operation of
the equipment in heat recovery mode during the partial cooling and heating
operations.
The defrost operation needs to be studied in detail including formation that can lead
to a model development for incorporation into the VRF computer model. Based on
such experimental studies capacity and power correction correlation for defrost
operation mode can be formulated.
Modeling Tool Development for VRF-HR Systems HT.10.SCE.251
Southern California Edison Page 16
Design & Engineering December 2012
APPENDIX A – STEPS TO DEVELOPING A VRF
MODEL IN E+ 7.2
1. Build the VRF model data
a. Select and define E+ input data for the VRF Heat Pump model. E+ provides
some data for these curves. Each VRF must be separately specified
(performance parameters can be the same)
i. Performance curves
1. Cooling capacity ratio = f(Low temperature curve): CoolCapFT
2. Cooling capacity ration boundary = f(temperature):
CoolCapFTBoundary
3. Cooling capacity ratio = f(high temperature curve):
CoolCapFTHi
4. Cooling energy Input ratio = f(Low temperature curve): EIRFT
5. Cooling energy Input ratio boundary = f(temperature):
EIRFTBoundary
6. Cooling energy Input ratio = f(high temperature curve):
EIRFTHi
7. Cooling energy Input ratio = f(Low part-load ratio): EIRLoPLR
8. Cooling energy Input ratio = f(Hi part-load ratio): EIRHiPLR
9. Cooling combination ration correction factor
10. Cooling part-load fraction correlation
11. Heating capacity ratio = f(Low temperature curve): HeatCapFT
12. Heating capacity ration boundary = f(temperature):
HeatCapFTBoundary
13. Heating capacity ratio = f(high temperature curve):
HeatCapFTHi
14. Heating energy Input ratio = f(Low temperature curve): EIRFT
15. Heating energy Input ratio boundary = f(temperature):
EIRFTBoundary
16. Heating energy Input ratio = f(high temperature curve):
EIRFTHi
17. Heating energy Input ratio = f(Low part-load ratio): EIRLoPLR
18. Heating energy Input ratio = f(Hi part-load ratio): EIRHiPLR
19. Heating combination ration correction factor
20. Heating part-load fraction correlation
ii. Piping curves
1. Piping correction factor for length in cooling mode
2. Piping correction factor for height in cooling mode
3. Piping correction factor for length in heating mode
4. Piping correction factor for height in heating mode
iii. Design values
1. Rated cooling capacity
2. Rated cooling COP
3. Minimum/Maximum outdoor temperature for cooling
4. Rated heating capacity
5. Rated heating COP
Modeling Tool Development for VRF-HR Systems HT.10.SCE.251
Southern California Edison Page 17
Design & Engineering December 2012
6. Minimum/Maximum outdoor temperature for heating
iv. Piping
1. Length
2. Height
v. Compressor
1. Number
2. Capacity ratio
3. Design parameters
vi. Condenser
1. Type
2. Design parameters based on type (air/water)
3. Input/output nodes
vii. Miscellaneous inputs
1. Defrost strategy/control
2. Build the DX VRF heating/Cooling coil models. Coil models must be specified for each
zone to be served by a VRF (coil parameters can be the same, but must specify for
each zone)
a. Rated cooling capacity
b. Cooling capacity ratio = f(temperature): VRFCoolCapFT
c. Cooling capacity ratio = f(flow fraction): VRFCoolCapFFF
d. Rated heating capacity
e. Heating capacity ratio = f(temperature): VRFHeatCapFT
f. Heating capacity ratio = f(flow fraction): VRFHeatCapFFF
3. For each targeted VRF zone
a. Identify the baseline zones from .idf file
b. Modify zone from PTAC to HVAC:TerminalUnit:VariableRefridgerantFlow
i. Modify inlet/outlet nodes to match targeted VRF
ii. Designate supply air parameters, fan outdoor air mixer
iii. Designate DX Variable Refrigerant Heating/Cooling coils
iv. Designate supply fans
v. Designate outdoor air mixers
vi. Repeat for all zones for single VFF
c. Repeat for all VRFs
4. Miscellaneous
a. VRF operation schedules
Modeling Tool Development for VRF-HR Systems HT.10.SCE.251
Southern California Edison Page 18
Design & Engineering December 2012
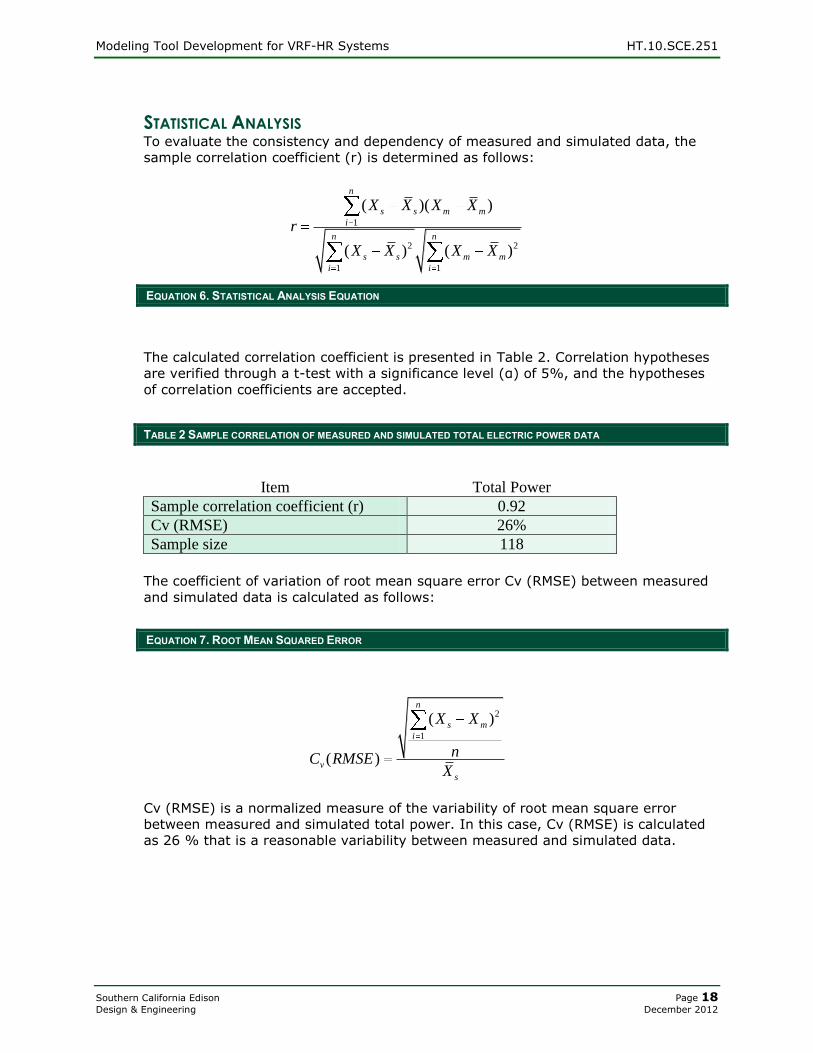
STATISTICAL ANALYSIS To evaluate the consistency and dependency of measured and simulated data, the
sample correlation coefficient (r) is determined as follows:
1
2 2
1 1
( )( )
( ) ( )
n
s s m m
i
n n
s s m m
i i
X X X X
r
X X X X
EQUATION 6. STATISTICAL ANALYSIS EQUATION
The calculated correlation coefficient is presented in Table 2. Correlation hypotheses
are verified through a t-test with a significance level (α) of 5%, and the hypotheses
of correlation coefficients are accepted.
TABLE 2 SAMPLE CORRELATION OF MEASURED AND SIMULATED TOTAL ELECTRIC POWER DATA
Item Total Power
Sample correlation coefficient (r) 0.92
Cv (RMSE) 26%
Sample size 118
The coefficient of variation of root mean square error Cv (RMSE) between measured
and simulated data is calculated as follows:
EQUATION 7. ROOT MEAN SQUARED ERROR
2
1
( )
( )
n
s m
i
v
s
X X
nC RMSEX
Cv (RMSE) is a normalized measure of the variability of root mean square error
between measured and simulated total power. In this case, Cv (RMSE) is calculated
as 26 % that is a reasonable variability between measured and simulated data.
Modeling Tool Development for VRF-HR Systems HT.10.SCE.251
Southern California Edison Page 19
Design & Engineering December 2012
APPENDIX B - ATTACHMENTS
Project Models:
1.
2. Evolution of the EnergyPlus VRF Computer Model Report
VRFComputerModelDevelopmentReport.pdf
Modeling Tool Development for VRF-HR Systems HT.10.SCE.251
Southern California Edison Page 20
Design & Engineering December 2012
REFERENCES
1. ANSI/ARI Standard 540, 2004, “Positive Displacement Refrigerant Compressors and
Compressor Units”, Air-Conditioning and Refrigeration Institute, Arlington, VA
2. ASHRAE/IESNA Standard 90.1-2007 : http://www.ashrae.org
3. 2004 ASHRAE Handbook HVAC Systems and Equipment, American Society of
Heating, Refrigeration and Air-Conditioning Engineers, Inch-Pound Edition. Copyright
2004 by the American Society of Heating, Refrigeration and Air-Conditioning
Engineers, Inc.
4. ASHRAE. (2009). 2009 ASHRAE Handbook – Fundamentals. Atlanta: American
Society of Heating, Refrigerating and Air-Conditioning Engineers, Inc.
5. ASHRAE. (2009). 2009 ASHRAE Handbook – Fundamentals. Atlanta: American
Society of Heating, Refrigerating and Air-Conditioning Engineers, Inc.
6. EnergyPlus 7.2, 2012, http://apps1.eere.energy.gov/buildings/energyplus/
7. EnergySoft. (2008). Application for Adoption of Variable Refrigerant Flow Systems
under the Title 24-2005 Nonresidential ACM Procedures (2008), submitted to
California Energy Commission.
8. Evolution of the EnergyPlus VRF Computer Model, FSEC-CR-1938-12, Bereket A.
Nigusse, 2012.
9. Goetzler, W., “Variable Refrigerant Flow Systems”, ASHRAE Journal, 2007, April, pp.
24-31, 2007.
10. Hirsh, J.J & Associates (2009) DOE-2.2 Building Energy Use and Cost Analysis
Program, Volume 2. Lawrence Berkeley National Laboratory LBL Publication #,
Berkeley, Ca.
11. Liu, X.B., Hong, T.Z., 2010, Comparison of energy efficiency between variable
refrigerant flow systems and ground source heat pump systems, Energy and
Buildings, vol. 42, no. 5: pp. 584-589.
12. Tolga N. Aynur, Yunho Hwang., Reinhard Rademacher, 2009. “Simulation
comparison of VAV and VRF air conditioning systems in an existing building for the
cooling season”