Embed Size (px)
Citation preview

WP-2006-011
Reforms in Indian Agro-processing and Agriculture Sectors in the Context of Unilateral and Multilateral
Trade Agreements
A. Ganesh-Kumar, Manoj Panda and Mary E. Burfisher
Indira Gandhi Institute of Development Research, Mumbai December 2006

2
Reforms in Indian Agro-processing and Agriculture
Sectors in the Context of Unilateral and Multilateral
Trade Agreements
A. Ganesh-Kumara, Manoj Pandaa and Mary E. Burfisherb
a Indira Gandhi Institute of Development Research (IGIDR)
General Arun Kumar Vaidya Marg Goregaon (E), Mumbai- 400065, INDIA
b Economic Research Services, United States Department of Agriculture Washington D. C., U.S.A.
Email (corresponding author): [email protected]
Abstract
In this paper, we explore the potential impacts of trade and investment-related policy reforms on India’s agro-processing sector. We consider the direct effects of policy reforms within the processing sector, and the indirect effects on agro-processing of policy reforms in the primary agriculture sector, in the Indian economy as a whole, and in a multilateral framework. Towards this, we develop a 22-sector, 16-region version of the GTAP computable general equilibrium (CGE), global model for our analysis.
We find that trade and investment-related reforms in agro-processing together can help the sector to grow. Policy reforms that stimulate investment and help to improve productivity will be crucial in offsetting the contractionary pressures of trade reform alone on the production of processed agricultural products. We also find that indirect effects on agro-processing from India’s policy reforms in other sectors are more important than reforms in agro-processing itself. Our findings argue for an economy-wide perspective when targeting reform or development of the agro-processing sector in India.
Compared to trade reform, comprehensive domestic reforms in the agro-processing and agriculture sectors relating to investment are critical for achieving growth in agro-processing. However, while the impacts of trade reform per se seem to be small, trade reform - by ushering in a higher degree of competition - could itself be a stimulus for investment and productivity gains in India.
At present, unilateral reforms, especially those that improve productivity in agro-processing and in primary agriculture, are more important to agro-processing than multilateral trade reforms. Nevertheless, our findings also suggest the importance of pursuing a domestic reform agenda within a multilateral trading strategy that can accommodate the expected economic growth of India and its future role in global markets, with general equilibrium effects on agro-processing
Key words: Agriculture, Agro-processing, Trade agreements, CGE models

3
Reforms in Indian Agro-processing and Agriculture
Sectors in the context of Unilateral and Multilateral Trade
Agreements
A. Ganesh-Kumar, Manoj Panda and Mary E. Burfisher
1. Motivation
Agro-processing industries have a potentially important role in the economic
development of developing countries - directly as a source of income and employment and
indirectly for their backward linkages with agriculture. The latter is especially critical for the
commercialization of agriculture in developing countries, which is widely recognized as
important for adoption of modern farming technologies, improving agricultural productivity
and incomes, and eventually for rural poverty reduction.
The agro-processing industry in India has traditionally been confined mainly to a select
few commodities such as sugar, edible oils, tea, coffee and spices. In recent times, this sector
has been expanding and diversifying into new commodities such as fruits, vegetables, meat
(poultry), dairy products, etc. Nevertheless, the sector remains by and large small compared
to the availability of raw products and also in relation to the demand for processed food
products, especially in urban areas. For example, in the case of edible oils, domestic
production meets only about half of domestic demand and consequently India is one of the
largest importers of edible oils in the world.

4
In the past, the agro-processing sector was highly protected in India.1 On the trade front,
there were high levels of tariff and non-tariff barriers. In recent years, the non-tariff barriers
have been removed, but moderate levels of applied tariffs continue to prevail. On the
production side also, the sector had been largely reserved for small-scale firms that prevented
entry of large scale manufacturing units and also the expansion of existing firms (Birthal et
al. 2005). Further, severe restrictions were also imposed until recently on the entry of foreign
firms into this sector (as in most other sectors of the economy). These restrictions have
prevented the sector from benefiting from technological progress and scale economies and
from becoming internationally competitive. Besides, the agro-processing sector has also been
subject to numerous restrictions with regard to inter-state movement of some agro-based
goods, differential inter-state tax structure, marketing restrictions, etc. that have discouraged
investment in large scale, integrated, agro-processing enterprises. As a result, the growth of
the agro-processing sector in India has not achieved its full potential.2
In this paper, we explore the direct and indirect impacts of trade and investment-related
policy reforms on India’s agro-processing sector. We first consider the direct effects of trade
and investment-related reforms within the processing sector. Investment-related reforms refer
to a broad set of policy and regulatory reforms that can help to stimulate investment and
productivity gains. We then consider a series of policy reforms with potentially important
indirect impacts on agro-processing. We analyze the effects of trade and investment-related
reforms in the primary agricultural sector, which can help to lower the costs of inputs to agro-
processing. We also analyze economy-wide trade policy reform, which may help to stimulate
economic activity, with positive income effects on the demand for agro-processed products.
1 See for example Srinivasan (2004) for a discussion on the edible oils sector. 2 Chand and Jha (2001) also mention the high growth potential for agro-processed products.

5
Finally, we analyze the effects of a multilateral elimination of tariffs and agricultural support,
which may help to “level the playing field” for the development of India’s agro-processing
industry.
We develop a 22-sector, 16-region version of the GTAP computable general equilibrium
(CGE) model for our analysis.3 The general equilibrium model allows us to simulate the
impacts of policy reform on the agro-processing sector while taking into account its linkages
to other sectors in India and to the global economy through intermediate demand, final
demand, factor competition, and trade. We allow full domestic factor mobility so that our
results reflect long-term, equilibrium outcomes after the full adjustment of the Indian
economy to each policy shock.
2. Background
2.1 Recent trends in the agro-processing sector in India
In 2000-1, the agro-processing sector accounted for about 13% of manufacturing GDP
and about 2% of total GDP in India (Table 1). Its share in total economic activities has
remained almost the same for more than a decade. About 55% of food processing is
undertaken by factories registered under the Factories Act4 in India and the rest by the
unregistered or informal sector.
If we look at a more disaggregated picture, output of sectors like meat and fishery
products, fruits and vegetables products, animal feed, cocoa and confectionary products, and
3 The model has a 2001 base year, and data are from GTAP database version 6.5, November 2004. See appendix for a listing of sectors and regions in the version of the CGE model developed for this paper. The standard GTAP model is documented in Hertel, ed. (1997).
4 Production units that employ 10 or more workers with power and 20 or more workers without power need to register
under the Factory Act. These units form the registered sector and the database for them are more reliable. The unregistered manufacturing sector operates informally and the data are collected through sample surveys of the production units.

6
soft drinks has grown at a fast rate by 12-17% per annum during 1989-90 and 1997-98, while
sectors like edible (vegetable) oils, dairy products, grain milling, bakery products, sugar and
wine have grown at a slow rate varying between 2.5% to 8% (Table 2). Investment in meat
and fishery products, fruits and vegetables, confectionary and soft drinks have grown by
more than 20% per year.
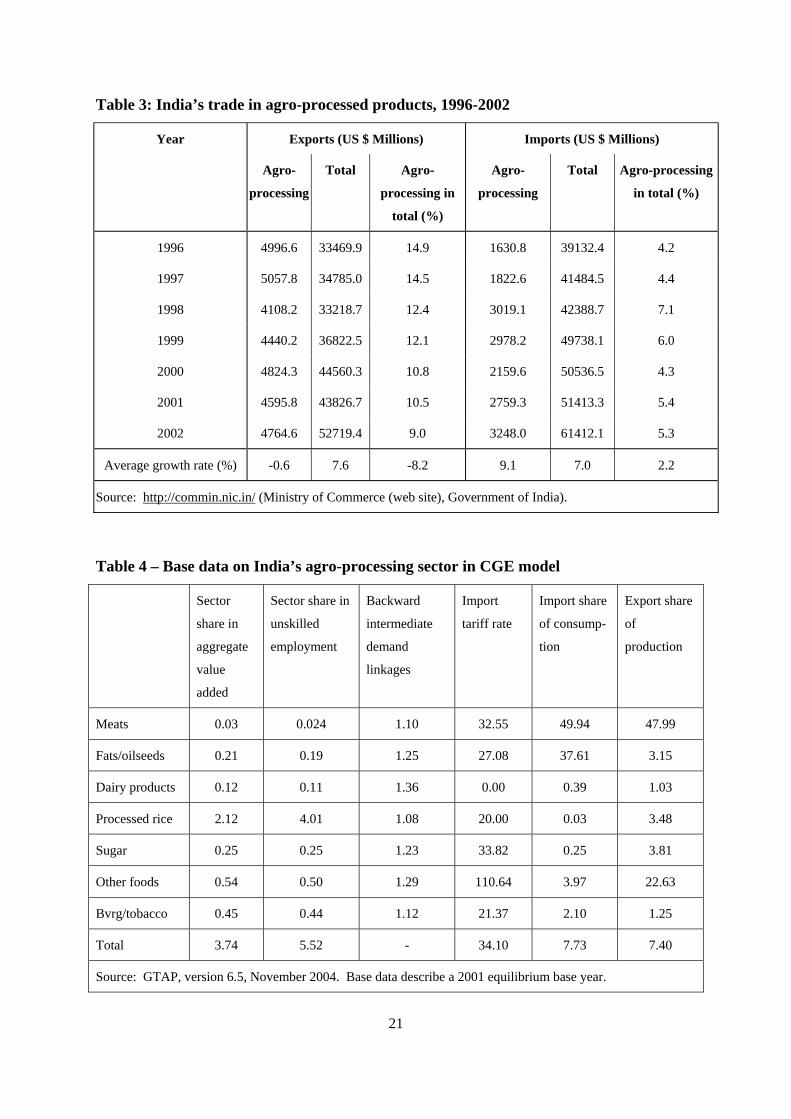
Agro-processing exports of India have fluctuated at about US$5 billion per year and, in
fact, their value fell slightly during 1996 and 2002, even as total exports of India moved up
from US$33 billion to 52 billion in the same period (Table 4). As a result, the share of agro-
processing in total exports earnings has fallen from about 15% to 9%. Processed imports, on
the other hand, nearly doubled from $1.6 billion in 1996 to $3.2 billion in 2002, accounting
for a 5% share in total imports in 2002.
So far as composition of the imports of agro-processed products is concerned, during the
period 1996 to 2002, it is dominated by two items: vegetable oils and fats account for 41-60%
and fruits and vegetables (fresh and frozen) another 17-39%. The export basket of processed
products, on the other hand, is somewhat diversified. Four items account for about 63% to
73% of agro-processing exports: fishery products 22% to 30%, prepared animal feeds, food
wastes and residues 7% to 20%, fruits and vegetables 13% to 21% and coffee, tea mate 10%
to 21%.
2.2 The Indian agro-processing sector in the GTAP database
The GTAP database describes the agro-processing sector in India in 2001, within a global
database that balances incomes, expenditures, production and trade across 87 countries or
regions of the world and 57 sectors. The characteristics of the Indian agro-processing
described in these data drive the results of our analysis of policy reforms (Table 4). Most
notable is the relatively small role currently held by the agro-processing sector in the Indian

7
economy: it accounts for about 4 percent of aggregate value added (factor incomes) in India.
However, agro-processing is relatively intensive in its use of unskilled labor, accounting for
almost 6 percent of India’s total unskilled employment.
The potential role of agro-processing in stimulating primary agriculture through the
demand for intermediate inputs is confirmed in the GTAP data. We calculate the backward
linkages of each sector in the economy, finding that food processing sectors’ backward links
all exceed one, the economy-wide average level.5 Agro-processing is relatively intensive in
its use of intermediate inputs compared to value added, and relatively intensive in its use of
inputs that are domestically produced, rather than imported. However, the small share of
agro-processing in the Indian economy limits it current role as a driver of growth in the
industries that supply its inputs.
Agro-processing sectors have an unweighted, average tariff of 35 percent. There is at
present relatively little trade in most processed products: imports account for about 8 percent
of consumption and exports account for about 7 percent of production. An important
exception is edible oils, for which imports account for 38 percent of consumption, and
exports account for 3 percent of production.
3. Model scenarios
We first consider policy reforms with direct impacts on India’s agro-processing sector. In
scenario one, we eliminate all tariffs on imports of agro-processed products (Table 5). In
scenario two, we describe a broader reform agenda that in addition eliminates regulations and
policies that have impeded investment, productivity growth and technological change in the
5 Following Hewings (1989), we calculate the backward linkage for sector j as (R.j/n)r*, where R = the Leontief inverse matrix = (I-D^A)-1, I is an identity matrix, , D^ is a diagonal matrix of domestic share in firm demands for each sector, R.j is the row sum of R, n = number of sectors, and r* is the average value of all elements of R.
8
sector. We describe this scenario as an investment reform, which we proxy with a 25-percent
increase in total factor productivity (TFP) in all agro-processing sectors. This TFP growth is
assumed to be achieved over the long-run (about 10 years), after prices and quantities have
fully adjusted to the policy shocks. 6We next explore policy reforms with indirect impacts on
India’s agro-processing sector that operate primarily through intermediate input supply,
competition for workers or capital, final demand, and trade. In scenarios 3 and 4, we consider
a comprehensive reform of both the agro-processing and primary agricultural sectors, which
are linked chiefly through the supply of raw materials to processors and their competition for
unskilled labor. In scenario 3, we eliminate all agricultural tariffs. In scenario 4, we again
proxy a more general set of policy reforms that lead to increased investment and productivity
in the primary sector as a 25-percent increase in primary agriculture’s total factor
productivity. Some of the policy reforms that could help to achieve this outcome include
changes to tenancy laws that restrict investment in land and other agricultural infrastructure,
removal of various restrictions and policy induced distortions in agricultural markets,
reforming the agricultural extension and credit services, institutional arrangements that
govern irrigation and water markets, amongst others.In scenario 5, we simulate economy-
wide policy reform in India, defined as the unilateral removal of tariffs in all sectors. We
expect the indirect effects of this reform on India’s processing industry of economy-wide
reforms to stem mainly from the broad stimulus it could provide to economic growth and
therefore to consumer demand for food products, as well as from increased competition by
manufactures for the unskilled workers on which the agro-processing sector is dependent.
6 To place this assumption of a long-run, 25-percent TFP gain into perspective, consider that Virmani (2004) estimated the average rate of total factor productivity in agriculture during 1992-93 through 2003-04 at 2.1 percent annually, and that of manufactures, including agro-processing, at 2.8 percent annually. Martin and Mitra (1999) examined total factor productivity in agriculture and manufacturing in a large sample of countries over the period 1967-92. They estimated India’s TFP growth in agriculture at 1.9 percent annually, and -.2 percent in manufactures. India’s annual TFP growth rate in this period was slightly above the average of developing countries for agriculture (1.8) but below the developing country average for manufactures (.92). India’s annual TFP growth rate was considerably below that of developed countries, estimated at 3.4 for agriculture, and 3.3 for manufactures annually. See also Kumar (2001) in this context.

9
In scenarios 6 though 8, we analyze the effects of multilateral policy reforms on India’s
agro-processing agricultural sector. These scenarios allow us to consider the extent to which
the agro-processing sector has been negatively impacted by the large distortions that
characterize global agricultural markets, particularly for products that compete with the local
supplies of processors’ inputs. In scenario 6, we eliminate all global tariffs. In scenario 7, we
additionally eliminate developed countries’ domestic support to agriculture. In scenario 8, we
add the elimination of domestic agricultural support by developing countries, including India.
4. Trade and Investment Reforms in Agro-Processing
We begin by examining the impact of unilateral trade and investment reforms by India in
the agro-processing sector. The impacts on the agro-processing sector from scenarios (1) and
(2) are reported in Table 6, and for primary agriculture sector in Table 7.7 The impacts are
measured as percentage change in value from the base scenario levels, which are also
reported in the table.
As might be expected, removal of tariff protection in India’s agro-processing sector
(Scenario 1) reduces output (-6 percent) and employment (-2 percent), particularly in the
meats, and in the vegetable oils and fats sectors, in which import competition is already
substantial. The domestic market prices of the agro-processing sector fall by 1.3 percent,
consistent with the Armington specification of imperfect substitutability of imports and
domestic products in the GTAP model.
Imports more than double, and partially displace domestic products in Indian
consumption of processed foods. Although in percentage terms, all agro-processing sectors
show a significant rise in imports, the import basket continues to be dominated by vegetable
7 These two tables also report the results for Scenarios 3 and 4, which are discussed later.

10
oils and fats. Export expansion of 23%, while significant, builds on very low base levels of
exports, and follows from the fall in domestic prices of agro-processing products relative to
international prices.
As output in the agro-processing sectors contract, their demand for agricultural inputs
falls, resulting in a one-half-percent decline in output in primary agriculture, and a four-
percent decline in imported primary agricultural products (Table 7). On the other hand,
exports of primary agriculture rise by nearly 10 percent, driven by the declining prices of
Indian commodities. Employment of unskilled labor in primary agriculture falls by one
percent mainly due to the large decline in output and employment of the oilseeds sub-sector.
Essentially, the elimination of tariffs in agro-processing while maintaining tariffs on the
primary products used as inputs is effective “dis-protection” of processed products. The
negative impacts of this policy on agro-processing are limited by the currently small share of
imports in its intermediate use.
Broader policy reform undertaken in conjunction with trade reform, that will help to
stimulate investment and productivity gains, will be crucial in enabling agro-processing
industries to survive increased import competition. Even when it is assumed to result in a
modest TFP gain of 25% (Scenario 2), India’s food processors could expand output (12%)
despite an 86% increase in imports (Table 6). Export growth of more than 300% in this
scenario is a result of both some displacement due to import growth, as well as the increased
competitiveness of Indian processed food products on world markets. Note that the rise in
imports (exports) in this scenario is less (substantially higher) than that in Scenario 1. This is
largely driven by the significant fall in domestic market prices by about 21% due to
productivity gains. An implication of rising productivity will be a lower demand for unskilled
workers (-13 percent) in India’s agro-processing industries. Demand for agricultural inputs

11
rises, and is met from both domestic production as well as imports. Domestic output of
primary agriculture declines by a lesser extent (-0.2 percent) in this scenario compared to the
previous scenario (-0.5 per cent), while primary imports actually increase by 1.3 percent
compared to a fall of 4 percent in the previous scenario (Table 7).
A notable result of both these scenarios is the decline in employment of unskilled labor in
both agro-processing as well as in primary agriculture. The displaced labor is absorbed in
both manufacturing and services sectors given the full employment assumption in the model.
5. Comprehensive Agricultural Policy Reform
Trade and investment reforms in the agro-processing sector present an opportunity to
pursue a similarly comprehensive approach in the primary agricultural sector. Related
reforms that stimulate investment and productivity gains in primary agriculture can help it
meet the increased intermediate demand for its products. In the next set of scenarios (3 and 4)
we assess the impact of agricultural policy reforms in addition to the reforms in agro-
processing sectors discussed above. Scenario 3 covers only unilateral trade reforms in
agriculture over and above those in Scenario 2 above. In Scenario 4 we allow for a rise in
agricultural total factor productivity by 25% representing the outcome of comprehensive
reforms in agriculture (over and above the agricultural trade reforms introduced in Scenario
3) covering diverse aspects such as with regard to investment in land, irrigation and other
agricultural infrastructure, domestic markets for agriculture, overhaul of agricultural
extension and credit services, etc.
The results for these two scenarios are also reported in Tables 6 and 7 for agro-processing
and agriculture, respectively. In comparison with policy reform in agro-processing, the
addition of tariff elimination in primary agriculture increases import competition, reducing
agricultural output by one-percent and employment 1.6 percent from base levels (Table 7),

12
while imports increase 61 percent. This scenario further stimulates agro-processing output but
the expansion is largely trade-driven.
As in the agro-processing sector, broad policy reform that stimulates investment and
productivity growth in primary agriculture will be crucial in enabling the sector to improve its
competitiveness. Assuming this leads to a 25-percent increase in TFP in primary agriculture,
the sector’s total output will increase by 17 percent and imports will decline by 16 percent.
The productivity rise results in a fall in domestic market price of about 29% over base levels
in primary agriculture as a whole. This improves the competitiveness of Indian agriculture in
international markets dramatically, resulting in an eight-fold increase in agricultural exports.
However, employment of unskilled labor in primary agriculture – which is labor intensive -
will fall significantly as productivity improves, lowering demand for unskilled labor by 10
percent from the base level.
An increase in productivity in primary agriculture will generate greater benefits for the
processing sector than even the direct effects of trade and investment reforms in that sector.
Agro-processing sector output increases by 27% over the base in Scenario 4 as against a rise
of only 12% in Scenario 2. Increased farm-level productivity leads to increased processor
profitability from the cost side, by lowering the cost of intermediate inputs and increasing the
availability of unskilled labor. This cost advantage is seen especially in the case of vegetable
oils and fats, dairy products, and sugar, which experience a significant reduction in domestic
prices and commensurate increases in exports and declines in imports. Besides this cost
advantage, comprehensive agricultural reforms also provide an important stimulus from the
demand side. Rising incomes from agricultural production and lower aggregate food prices
contribute to a 12-percent increase in consumer demand for processed food products. Thus,
coordinated reforms in the primary agricultural sector could be part of a comprehensive
13
approach to stimulating agro-processing through its effects on both lowering agro-processing
production costs and increasing demand for agro-processing output.
6. Economy-wide Trade Reform in India
Elimination of tariffs in the manufacturing and service sectors in India can further
increase the stimulus to agro-processing, compared to a comprehensive agricultural policy
reform. In Scenario 5, we remove all taxes and subsidies on imports and exports of the
manufacturing and services sectors (over and above the comprehensive reforms in agro-
processing and agriculture captured in Scenario 4). Thus, this scenario corresponds to
economy-wide unilateral free trade by India.
Table 8 reports the results for broad sectors.8 The unilateral trade liberalisation by India
in all sectors increases agro-processing output by an additional three percentage points, and
reduces the loss of employment by almost two percentage points, compared to reform of the
agro-processing and agricultural sectors only (Scenario 4).
The demand stimulus for agro-processing provided by unilateral trade reform is not as
great as that from reform of the primary agricultural sector, and in fact is slightly negative.
This result suggests that more than trade reforms per se, it is gains in productivity, especially
in primary agriculture, which is a key macro policy for stimulating aggregate demand in the
Indian economy.
One driver of increased output in agro-processing in this scenario is the increased
availability of unskilled labor, as the demand for workers in the manufacturing sectors falls
following removal of all tariff protection. The small size of the agro-processing sector within
the Indian economy means that it is unlikely to have a significant role in absorbing unskilled
8 This table also reports the results for the multilateral reforms scenarios (6, 7 & 8), which are discussed later.

14
labor displaced by policy reforms. In fact, we find that much of the displaced labor is
absorbed in the services sectors given the full employment assumption in the model. These
sectoral shifts in the demand for unskilled labor suggest the importance of employment
shocks as a social and political concern linked with trade and investment reforms in India.
Welfare measures capture the change in aggregate purchasing power due to policy
reform. Welfare declines slightly in this unilateral scenario compared to the case of agro-
processing and agricultural reforms described in Scenario 4 (Table 9). The main reason is the
terms-of-trade deterioration which is sufficient to negate the substantial allocative efficiency
gains achieved throughout the Indian economy as a result of trade reforms. Domestic trade
and investment reforms stimulate economic activity in India. As As India demands more
imports from, and supplies more exports to, global markets, its terms of trade deteriorate – its
growing demand drives up world prices of its imports and its growing supply drives down the
world prices of its exports. This problem of relatively fast economic growth in India
becomes greater as India moves from agriculture-only reforms to an economy-wide trade
reform. The effects of the terms of trade loss on agro-processing is to lead to further
increases in output as processed imports decline and exports increase, compared to the
agriculture-sector only reforms.
7. Multilateral Trade and Domestic Support Reforms
In this section, we analyse the impacts of multilateral trade reforms on India, focusing the
discussion on the agro-processing and agriculture sectors. Three experiments are carried out
here. In Scenario 6, we allow for full trade liberalisation in all sectors by all countries over
and above those covered in Scenario 5. The next scenario (7) extends Scenario 6 and
incorporates elimination of all domestic agricultural support by the developed countries
(Australia & New Zealand, Rest of East Asia, Canada, USA, European Union). Scenario 8

15
extends Scenario 7 to cover agricultural subsidy support by all countries. The results of these
scenarios for India are reported in Tables 8 and 9.
Compared to unilateral trade and investment reforms, multilateral trade reforms (Scenario
6) are relatively unimportant as a stimulus to the Indian economy, including agro-processing
and agriculture sectors, in terms of output, employment, prices, imports, exports and welfare.
The small gains from multilateral trade reforms for India reflects the currently low share of
trade in production and consumption in India in various sectors including agro-processing.
Low trade shares mean that changes in the relative prices of trade and domestic goods due to
multilateral reform have little weight in determining over-all price levels in India, so that
changing price signals to Indian producers and consumers from global markets are relatively
weak.
One of the main benefits of multilateral reform for India operates through its effect on
improving the terms-of-trade. The adverse terms-of-trade effect on welfare is reduced by
about a third when Indian reforms are part of a multilateral effort (Table 9). Multilateral
reforms that stimulate economic activity in the rest of the world will become increasingly
important to India as its economy expands. Thus, although trade linkages between India and
global markets are still relatively small, multilateral reforms could be viewed as a long-term
strategy for fostering global market conditions that are favorable to rapid economic growth in
India, and which in turn can contribute to increased demand for agro-processed products.
Domestic agricultural reform by developed countries (Scenario 7) presents small
additional stimulus to Indian agro-processing industries, similar to the impact of multilateral
tariff elimination. However, a multilateral domestic agricultural reform (Scenario 8) process
that also includes elimination of India’s own domestic agricultural subsidies would slightly

16
reduce domestic farm output, offsetting any benefits to India agro-processors from expanding
the global agenda beyond tariffs to include domestic reforms in developed countries.
8. Conclusions
The agro-processing sector in India is small relative to the primary agriculture sector; its
role as a driver in agricultural development and employment is therefore not critical at
present. We find that indirect effects on agro-processing from India’s policy reforms in other
sectors are more important than reforms in agro-processing itself. This is especially true of
policy reforms in primary agriculture, which can impact agro-processing through both input
supply and aggregate demand. Our findings argue for an economy-wide perspective when
targeting reform or development of the agro-processing sector in India.
Compared to trade reform, comprehensive domestic reforms in the agro-processing and
agriculture sectors that stimulate investment and increase productivity, are critical for
achieving growth in agro-processing. If these reforms achieve a 25% rise in productivity in
the agro-processing sector, the result is a GDP gain of 2% (over and above that due to agro-
processing trade reforms) and a welfare gain of about 10%. A similar rise in the productivity
of primary agriculture results in a gain in GDP of about 7% and a welfare gain of about 30%.
In contrast, gains from unilateral or multilateral trade liberalisation for both GDP and welfare
are less than one per cent.9 However, while the impacts of trade reform per se seem to be
small, trade reform - by ushering in a higher degree of competition - could itself be a stimulus
for productivity improvements in India.
At present, unilateral reforms, especially those that improve productivity in agro-
processing and in primary agriculture, are more important to agro-processing than
9 Other studies using national CGE model for India also found small GDP impacts. See for example, Subramanian (1993), Parikhh et al. (1995, 1997), Panda and Quizon (1999).
17
multilateral trade reforms. Nevertheless, our findings with regard to terms-of-trade suggest
the importance of pursuing a domestic reform agenda within a multilateral trading strategy
that can accommodate the expected economic growth of India and its future role in global
markets, with general equilibrium effects on agro-processing.
We used a global, computable general equilibrium model to simulate our trade and
investment reform scenarios. Our findings suggest areas for further model development. In
particular, the assumption that workers can costlessly shift among sectors as relative prices
change understates the real economic and social costs associated with the adjustment of
workers and their families to a changing economic environment. The model has a single,
representative household although differences among households in their endowments and
adjustment capacities can be expected to lead to distributional implications from changing
prices and wages, with implications for such policies as social safety nets. Despite these and
other limitations, the model is a powerful tool that supports a rich analysis of the structural
and welfare implications of Indian policy reforms within a global setting.
References
Birthal, P.S., Joshi P.K. and Gulati A. (2005). “High Value Food Commodities and Vertical
Coordination in India: Implications for Smallholders.” International Food Policy
Research Institute (IFPRI), paper presented at the Symposium “Toward High-Value
Agriculture and Vertical Coordination: Implications for Agribusiness and Smallholders”
National Agricultural Science Centre, Pusa, New Delhi, 7 March 2005.
Chand, R., and Jha D. (2001). “Trade Liberalization, Agricultural Prices and Social Welfare.”
in S.S.Acharya and D.P.Chaudhri (eds.) Indian Agricultural Policy at the Crossroads:
Priorities and Agenda, Jaipur and New Delhi: Rawat Publications.
Hertel, Thomas W., editor (1997). Global Trade Analysis: Modeling and Applications.

18
Cambridge: Cambridge University Press.
Hewings, Geoffrey J.D., Manuel Fonseca, Joaquin Guilhoto, and Michael Sonis (1989). "Key
Sectors and Structural Change In the Brazilian Economy: A Comparison of
Alternative Approaches and Their Policy Implications." Journal of Policy Modeling,
Vol. 11, No. 1, pp. 67-90.
Kumar, P. (2001). “Agricultural Performance and Productivity”. in S.S.Acharya and
D.P.Chaudhri (eds.) Indian Agricultural Policy at the Crossroads: Priorities and
Agenda, Jaipur and New Delhi: Rawat Publications.
Martin, Will and Davashish Mitra (1999). “Productivity Growth and Convergence in
Agriculture and Manufacturing.” Trade, Development Research Group, World Bank,
Paper No. 2171. Washington, DC: World Bank.
Panda M. and Quizon J. (1999): “Growth and Distribution Under Trade liberalization in
India”, Indira Gandhi Institute of Development Research, Mumbai. Forthcoming in a
volume edited by A. Guha, A. Lahiri and K. L. Krishna to be published by
NIPFP/Ford Foundation, New Delhi.
Parikh, K.S., Narayana, N.S.S., Panda M. and Ganesh-Kumar A. (1995), “Strategies for
Agricultural Liberalization: Consequences for Growth, Welfare and Distribution”,
Report Submitted to the World Bank, PP-16, Indira Gandhi Institute of Development
Research, Mumbai.
Parikh, K.S., Narayana, N.S.S., Panda M. and Ganesh-Kumar A. (1997), “Agricultural Trade
Liberalization: Growth, Welfare and Large Country Effects”, Agricultural Economics,
17(1).

19
Srinivasan, P.V. (2004). “Managing Price Volatility in an Open Economy Environment: The
Case of Edible Oils and Oilseeds in India.” International Food Policy Research
Institute (IFPRI), MTID Discussion Paper No. 69, Washington, DC: IFPRI.
Subramanian, S. (1993). “Agricultural Trade Liberalisation and India”, Development Centre,
Paris, OECD.
Virmani, Arvind (2004). “Sources of India’s Productivity Growth: Trends in Total Factor
Productivity.” India Council for Research on International Economic Relations
(ICRIER), Working Paper No. 131. New Delhi: ICRIER.
Table 1: Trends in value added in the Indian food agro-processing sector, shares (%)
Year In registered
manufact-
uring
In unregistered
manufact-
uring
In total
manufact-
uring
In total GDP Registered sector in
total food processing
1989-90 12.4 16.0 13.7 2.3 57.8
1990-91 10.4 16.0 12.5 2.1 52.8
1991-92 10.6 16.8 12.8 2.0 53.0
1992-93 10.5 16.2 12.6 2.0 53.0
1993-94 11.4 15.6 12.9 2.1 57.8
1994-95 11.5 16.8 13.2 2.2 57.8
1995-96 10.0 15.8 11.9 2.1 55.6
1996-97 9.1 15.7 11.3 2.1 54.4
1997-98 10.8 15.7 12.5 2.2 56.6
1998-99 10.5 15.9 12.4 2.1 55.1
1999-00 10.2 16.0 12.2 2.0 54.2
2000-01 10.5 16.3 12.5 2.2 54.6
Source: National Accounts Statistics, Central Statistical Organization, Government of India, various issues.

20
Table 2: Growth in the Indian agro-processing sector, 1989-90 to 1997-98
S. No. Industry Output Value added Invest-ment Employees Workers
(Rs. Lakhs) (Rs. Lakhs) (Rs. Lakhs) (No.) (No.)
Annual % growth rate
1 Meat product 17.4 23.0 35.3 4.1 4.8
2 Fishery products 17.0 19.6 21.5 10.7 10.8
3 Fruits & Vegetables products 13.8 14.4 24.7 7.3 7.8
4 Oils and fats 4.2 7.8 3.7 1.3 0.9
5 Dairy products 7.2 7.6 11.2 5.0 5.2
6 Grain milling products 6.5 8.4 5.0 4.5 4.1
7 Starch products 5.6 7.0 1.6 0.9 1.0
8 Animal feeds 15.0 15.5 14.8 10.5 11.0
9 Bakery products 8.0 6.7 13.0 5.0 5.0
10 Sugar 4.1 5.6 -6.2 -0.7 -1.3
11 Cocoa & confectionary products 11.8 3.1 30.0 4.2 4.9
12 Spirits & alcohol 9.5 9.9 2.4 3.1 2.8
13 Wine 2.5 3.9 1.3 -2.5 -2.9
14 Malt products 6.4 6.7 4.9 5.6 6.2
15 Soft drinks 17.1 17.7 22.4 4.9 6.2
Source: Annual Survey of Industries, Central Statistical Organization, Government of India, various issues.
21
Table 3: India’s trade in agro-processed products, 1996-2002
Year Exports (US $ Millions) Imports (US $ Millions)
Agro-
processing
Total Agro-
processing in
total (%)
Agro-
processing
Total Agro-processing
in total (%)
1996 4996.6 33469.9 14.9 1630.8 39132.4 4.2
1997 5057.8 34785.0 14.5 1822.6 41484.5 4.4
1998 4108.2 33218.7 12.4 3019.1 42388.7 7.1
1999 4440.2 36822.5 12.1 2978.2 49738.1 6.0
2000 4824.3 44560.3 10.8 2159.6 50536.5 4.3
2001 4595.8 43826.7 10.5 2759.3 51413.3 5.4
2002 4764.6 52719.4 9.0 3248.0 61412.1 5.3
Average growth rate (%) -0.6 7.6 -8.2 9.1 7.0 2.2
Source: http://commin.nic.in/ (Ministry of Commerce (web site), Government of India).
Table 4 – Base data on India’s agro-processing sector in CGE model
Sector
share in
aggregate
value
added
Sector share in
unskilled
employment
Backward
intermediate
demand
linkages
Import
tariff rate
Import share
of consump-
tion
Export share
of
production
Meats 0.03 0.024 1.10 32.55 49.94 47.99
Fats/oilseeds 0.21 0.19 1.25 27.08 37.61 3.15
Dairy products 0.12 0.11 1.36 0.00 0.39 1.03
Processed rice 2.12 4.01 1.08 20.00 0.03 3.48
Sugar 0.25 0.25 1.23 33.82 0.25 3.81
Other foods 0.54 0.50 1.29 110.64 3.97 22.63
Bvrg/tobacco 0.45 0.44 1.12 21.37 2.10 1.25
Total 3.74 5.52 - 34.10 7.73 7.40
Source: GTAP, version 6.5, November 2004. Base data describe a 2001 equilibrium base year.

22
Table 5: Model scenarios
Scenario no. Scenario description
Agro-processing Policy Reforms
1 Unilateral free trade in agro-processing sectors
2 (1) plus investment reform (25% increase in agro-processing productivity)
Comprehensive Agricultural Policy Reform
3 (2) plus unilateral free trade in agriculture
4 (3) plus comprehensive reform in agriculture (25% increase in agricultural productivity)
Economy-wide Policy Reform
5 (4) plus unilateral free trade in India, all sectors
Multilateral Policy Reforms
6 (5) plus multilateral free trade in all sectors
7 (6) plus developed country removal of domestic agricultural support
8 (7) plus developing country removal of domestic agricultural support

23
Table 6 – Effects of agricultural policy reform on the agro-processing sector
Scenario 1 2 3 4
Base
value
Tariff
elimination in
agro-
processing
(1) plus investment
reform in agro-
processing
(2) plus remove
tariffs in
primary
agriculture
(3) plus investment
reform in primary
agriculture
Levels Percentage change from base value
Output (in millions)
Total agro- processing 50,966 -6.1 11.5 12.6 26.8
Meats 653 -20.7 184.7 194.4 192.8
Vegetable oils / fats 5,272 -53.4 -26.2 -24.6 9.6
Dairy products 4,674 0.0 11.6 12.4 35.0
Processed rice 19,095 0.2 6.4 6.6 10.9
Sugar 5,917 0.0 9.7 10.4 24.9
Other foods 9,962 -1.0 35.5 38.0 62.3
Bvrg/tobacco 5,393 -1.7 3.4 3.5 9.3
Market price index
Total agro- processing 1.0 -1.3 -20.9 -21.4 -26.3
Meats 1.0 -2.8 -21.3 -21.7 -21.8
Vegetable oils / fats 1.0 -3.6 -21.9 -22.6 -32.6
Dairy products 1.0 -1.2 -20.8 -21.7 -31.1
Processed rice 1.0 -0.8 -20.2 -20.5 -22.3
Sugar 1.0 -1.3 -20.7 -21.3 -31.5
Other foods 1.0 -1.2 -21.9 -22.8 -28.8
Bvrg/tobacco 1.0 -1.0 -20.7 -21.0 -20.0
Imports (in millions)
Total agro-processing 3,929 124.4 85.5 83.8 69.9
Meats 343 85.2 73.6 73.3 91.5
Vegetable oils / fats 3,102 130.4 92.7 90.9 72.1
Dairy products 19 181.9 37.0 31.9 -3.6

24
Table 6 – Effects of agricultural policy reform on the agro-processing sector
Scenario 1 2 3 4
Base
value
Tariff
elimination in
agro-
processing
(1) plus investment
reform in agro-
processing
(2) plus remove
tariffs in
primary
agriculture
(3) plus investment
reform in primary
agriculture
Levels Percentage change from base value
Processed rice 6 254.1 106.6 104.3 103.1
Sugar 14 172.0 53.1 50.1 13.5
Other foods 323 88.2 26.2 23.7 13.8
Bvrg/tobacco 122 157.6 104.3 103.9 119.0
Exports (in millions)
Total agro-processing 2,038 23.2 325.2 347.1 779.8
Meats 202 22.6 417.0 435.6 426.2
Vegetable oils / fats 1,541 26.9 348.3 373.0 928.0
Dairy products 15 8.4 383.6 421.1 1065.9
Processed rice 4 3.3 123.7 127.1 138.1
Sugar 10 5.6 143.1 150.8 301.0
Other foods 213 4.6 143.2 153.2 232.9
Bvrg/tobacco 53 2.2 65.6 66.6 61.6
Employment (unskilled, in 1000’s)
Total agro- processing 8,495 -2.0 -12.8 -12.3 -4.9
Meats 38 -20.6 128.8 137.0 138.9
Vegetable oils / fats 295 -53.4 -40.7 -39.3 -10.7
Dairy products 175 0.1 -10.3 -9.5 10.0
Processed rice 6,155 0.2 -14.7 -14.4 -10.3
Sugar 389 0.1 -11.8 -11.2 1.7
Other foods 761 -0.9 8.9 11.1 32.3
Bvrg/tobacco 681 -1.6 -16.9 -16.7 -11.0

25
Table 7 – Effects of agricultural trade and investment policy reform on the primary agriculture
Scenario 1 2 3 4
Base
value
Tariff
elimination in
agro-
processing
(1) investment
reforms in
agro-
processing
(2) plus
eliminate
tariffs in
primary
agriculture
(3) plus
investment
reforms in
primary
agriculture
Levels Percent change relative to base
Output in millions
Total primary agric. 144,064 -0.5 -0.2 -0.9 16.7
Paddy rice 9,599 0.4 -5.6 -5.4 6.7
Wheat 16,128 0.4 1.4 1.8 24.7
Other grains 4,347 0.2 1.5 1.5 7.3
Horticulture 25,958 -0.3 0.5 -2.6 9.3
Oilseeds 18,046 -6.2 -3.8 -3.6 6.8
Cotton/fibers 7,803 0.1 -4.5 -4.2 2.7
Other crops 23,095 0.4 0.3 -0.6 29.1
Cattle 4,099 -1.1 -1.1 -1.7 -7.9
Other animals 9,990 0.5 2.7 3.0 20.2
Milk 22,517 0.6 2.3 2.7 23.9
Wool 2,483 1.8 2.6 -7.0 58.9
Market price index
Total primary agric. 1.0 -2.0 -0.4 -2.1 -29.4
Paddy rice 1.0 -1.9 -2.2 -3.8 -32.0
Wheat 1.0 -1.4 0.3 -0.8 -25.6
Other grains 1.0 -1.8 0.3 -1.3 -30.4
Horticulture 1.0 -2.0 -0.2 -2.6 -29.9
Oilseeds 1.0 -3.6 -1.4 -2.8 -30.4
Cotton/fibers 1.0 -1.8 -1.6 -3.1 -30.7
Other crops 1.0 -1.7 -0.2 -2.0 -26.9

26
Table 7 – Effects of agricultural trade and investment policy reform on the primary agriculture
Scenario 1 2 3 4
Base
value
Tariff
elimination in
agro-
processing
(1) investment
reforms in
agro-
processing
(2) plus
eliminate
tariffs in
primary
agriculture
(3) plus
investment
reforms in
primary
agriculture
Levels Percent change relative to base
Cattle 1.0 -2.0 -1.2 -2.7 -37.2
Other animals 1.0 -1.9 -0.1 -1.7 -30.8
Milk 1.0 -1.9 0.2 -1.4 -29.3
Wool 1.0 -1.6 -0.2 -3.0 -28.9
Imports in millions
Total primary agric. 2,962 -4.0 1.3 61.4 -15.7
Paddy rice 0.5 -9.2 -9.2 569.3 36.9
Wheat 1 -5.9 3.5 1084.7 287.8
Other grains 2 -2.3 2.8 48.8 0.7
Horticulture 1,507 -3.2 1.9 70.9 6.9
Oilseeds 15 -8.7 -1.4 98.8 -4.6
Cotton/fibers 0.1 -4.8 -3.1 12.2 -50.0
Other crops 946 -4.3 0.4 44.2 -35.0
Cattle 2 -4.6 -1.0 45.7 -37.7
Other animals 89 -1.8 3.7 14.0 -12.9
Milk 1 -6.7 1.7 -3.5 -65.4
Wool 398 -6.5 1.0 72.8 -57.5
Exports in millions
Total primary agric. 2182 9.9 0.2 15.6 818.1
Paddy rice 0.4 14.8 14.8 29.0 524.1
Wheat 1 11.8 -4.2 5.1 646.5
Other grains 2 4.6 -1.0 2.9 132.4

27
Table 7 – Effects of agricultural trade and investment policy reform on the primary agriculture
Scenario 1 2 3 4
Base
value
Tariff
elimination in
agro-
processing
(1) investment
reforms in
agro-
processing
(2) plus
eliminate
tariffs in
primary
agriculture
(3) plus
investment
reforms in
primary
agriculture
Levels Percent change relative to base
Horticulture 969 6.3 -0.4 8.0 185.7
Oilseeds 10 19.1 6.5 13.7 338.7
Cotton/fibers 0.1 9.6 7.4 15.7 410.4
Other crops 793 10.3 0.3 11.6 409.1
Cattle 2 7.2 3.7 9.7 396.9
Other animals 78 4.8 -0.1 4.0 130.4
Milk 1 13.3 -1.6 9.5 643.2
Wool 325 20.9 1.2 51.0 3887.3
Employment (unskilled in 1000’s)
Total primary agric. 39,586 -1.0 -0.5 -1.6 -10.5
Paddy rice 3,256 0.0 -6.3 -6.4 -18.7
Wheat 3,415 0.1 1.3 1.3 -3.9
Other grains 1,204 -0.1 1.5 1.1 -18.2
Horticulture 7,544 -0.7 0.4 -3.4 -16.6
Oilseeds 5,131 -7.0 -4.3 -4.5 -18.6
Cotton/fibers 2,423 -0.2 -5.0 -5.1 -22.0
Other crops 6,717 0.1 0.1 -1.2 -0.2
Cattle 0.2 -1.5 -1.4 -2.4 -30.5
Other animals 2,848 0.1 2.8 2.7 -7.6
Milk 6,683 0.3 2.3 2.4 -4.6
Wool 365 1.6 2.7 -8.1 24.9

28
Table 8 – Effects of Economy-wide and Multilateral Reforms on India
Scenario 4 5 6 7 8
Base
value in
millions
Trade and
investment
reforms in
primary and
processed
agriculture
(4) plus
unilateral
tariff elimin.
all sectors
(5)
multilateral
tariff
elimination of
all tariffs
(6) plus
developed
countries
eliminate
domestic agric.
Subsidies
(7) plus
developing
countries
eliminate
domestic agric.
subsidies
Levels Percent change relative to base
Output in millions
Primary agric. 144,064 16.7 17.3 17.2 17.7 16.4
Agro-processing 50,966 26.8 29.9 31.2 31.4 31.2
Manufactures 244,019 -3.0 -5.6 -5.3 -5.6 -5.0
Services 382,670 3.9 4.6 4.6 4.6 4.7
Market prices
Primary agric. 1 -29.4 -30.2 -29.1 -28.4 -27.2
Agro-processing 1 -26.3 -28.1 -27.0 -26.7 -26.6
Manufactures 1 3.69 -2.36 -1.44 -1.27 -1.48
Services 1 5.83 2.93 4.41 4.60 4.28
Imports in millions
Primary agric. 2,962 -15.7 -18.1 -12.8 -12.3 -10.4
Agro-processing 3,929 69.9 63.7 64.4 64.8 65.7
Manufactures 44,869 12.9 84.5 96.0 96.3 95.7
Services 11,811 15.5 10.4 14.1 14.3 13.9
Exports in millions
Primary agric. 2,182 818.1 890.8 952.3 966.3 987.6
Agro-processing 2,038 779.8 911.2 692.9 740.3 726.4
Manufactures 33,532 -22.0 31.2 42.8 41.6 43.8
Services 11,811 -17.4 -9.0 -12.8 -13.2 -12.3

29
Table 8 – Effects of Economy-wide and Multilateral Reforms on India
Scenario 4 5 6 7 8
Base
value in
millions
Trade and
investment
reforms in
primary and
processed
agriculture
(4) plus
unilateral
tariff elimin.
all sectors
(5)
multilateral
tariff
elimination of
all tariffs
(6) plus
developed
countries
eliminate
domestic agric.
Subsidies
(7) plus
developing
countries
eliminate
domestic agric.
subsidies
Levels Percent change relative to base
Employment (unskilled)
Primary agric. 39,586 -10.5 -9.8 -9.8 -9.2 -10.5
Agro-processing 8,495 -4.9 -3.7 -4.6 -4.5 -4.5
Manufactures 22,919 -1.0 -3.8 -3.4 -3.8 -3.0
Services 77,040 6.5 7.3 7.3 7.2 7.7
Table 9 – Welfare and GDP impacts of policy reforms on India (% change from base)
Scenario 1 2 3 4 5 6 7 8
Allocative efficiency 1.1 1.2 1.5 2.2 5.5 6.3 6.3 6.8
Technical change 0.0 10.7 10.7 41.4 42.0 42.1 42.2 41.9
Terms of Trade -0.4 -1.1 -1.3 -2.1 -6.3 -4.6 -4.6 -4.5
Investment/Savings 0.0 0.0 0.0 -0.1 0.0 0.1 0.1 0.1
Total welfare change 0.7 10.8 10.9 41.3 41.2 43.9 44.1 44.3
GDP quantity index 0.2 2.5 2.6 9.3 10.1 10.3 10.3 10.3

30
Appendix table 1: Model classification – Regions
No.
Code Region
description
Comprising
1 ANZ Australia and New
Zealand
Australia; New Zealand; Rest of Oceania.
2 CHN China China.
3 IDN Indonesia Indonesia.
4 MYS Malaysia Malaysia.
5 REAS Rest of East Asia Hong Kong; Japan; Korea; Taiwan; Rest of East Asia.
6 IND India India.
7 ROSA Rest of South Asia Philippines; Singapore; Thailand; Vietnam; Rest of South-East Asia;
Bangladesh; Sri Lanka; Rest of South Asia.
8 CAN Canada Canada.
9 USA United States United States.
10 ARG Argentina Argentina.
11 BRA Brazil Brazil.
12 ROAM Rest of Americas Mexico; Rest of North America; Central America; Rest of FTAA; Rest of
the Caribbean; Colombia; Peru; Venezuela; Rest of Andean Pact; Chile;
Uruguay; Rest of South America.
13 EUR European Union Austria; Belgium; Denmark; Finland; France; Germany; United Kingdom;
Greece; Ireland; Italy; Luxembourg; Netherlands; Portugal; Spain;
Sweden; Switzerland; Rest of European Free Trade Area;
14 CEE Central and Eastern
Europe
Rest of Europe; Albania; Bulgaria; Croatia; Czech Republic; Hungary;
Malta; Poland; Romania; Slovakia; Slovenia; Estonia; Latvia; Lithuania;
Russian Federation; Rest of Former Soviet Union.
15 ME Middle East Cyprus; Turkey; Rest of Middle East.
16 AFRW Africa and Rest of
World
Morocco; Tunisia; Rest of North Africa; Botswana; South Africa; Rest of
South African Customs Union; Malawi; Mozambique; Tanzania; Zambia;
Zimbabwe; Rest of SADC; Madagascar; Uganda; Rest of Sub-Saharan
Africa; Rest of World.

31
Appendix table 2: Model classification – Sectors
No. Code Sector
description
Comprising
1 PDR Paddy rice Paddy rice.
2 WHT Wheat Wheat.
3 GRO Cereal grains nec Cereal grains nec.
4 V_F Vegetables, fruit,
nuts
Vegetables, fruit, nuts.
5 OSD Oil seeds Oil seeds.
6 C_B Sugar cane Sugar cane, sugar beet.
7 OCR Crops nec Plant-based fibers; Crops nec.
8 CTL Cattle, sheep,
goats, horses
Cattle, sheep, goats, horses.
9 OAP Animal products
nec
Animal products nec.
10 RMK Raw milk Raw milk.
11 WOL Other agriculture Wool, silk-worm cocoons.
12 NRES Natural
Resources
Forestry; Coal; Oil; Gas; Minerals nec.
13 FSH Fishing Fishing.
14 CMT Meat cattle,
sheep, goat,
horse
Meat: cattle, sheep, goats, horse; Meat products nec.
15 VOL Vegetable oils
and fats
Vegetable oils and fats.
16 MIL Dairy products Dairy products.
17 PCR Processed rice Processed rice.
18 SGR Sugar Sugar.
19 OFD Food products
nec
Food products nec.
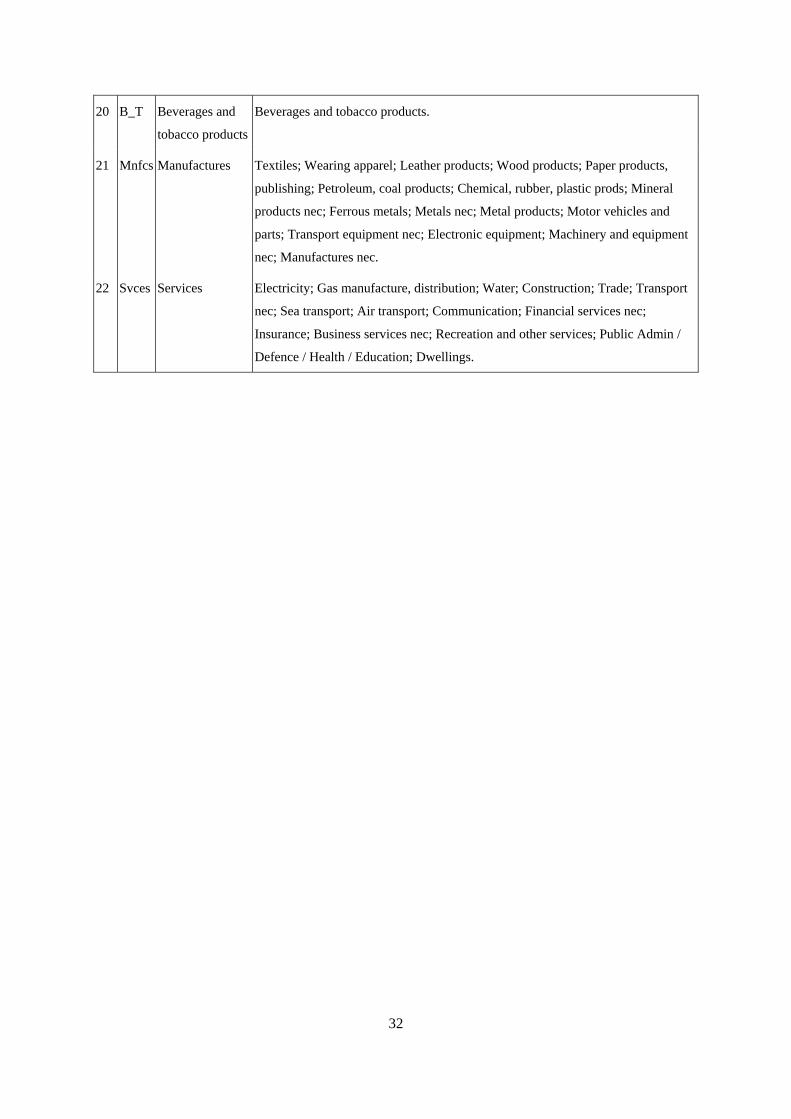
32
20 B_T Beverages and
tobacco products
Beverages and tobacco products.
21 Mnfcs Manufactures Textiles; Wearing apparel; Leather products; Wood products; Paper products,
publishing; Petroleum, coal products; Chemical, rubber, plastic prods; Mineral
products nec; Ferrous metals; Metals nec; Metal products; Motor vehicles and
parts; Transport equipment nec; Electronic equipment; Machinery and equipment
nec; Manufactures nec.
22 Svces Services Electricity; Gas manufacture, distribution; Water; Construction; Trade; Transport
nec; Sea transport; Air transport; Communication; Financial services nec;
Insurance; Business services nec; Recreation and other services; Public Admin /
Defence / Health / Education; Dwellings.