Embed Size (px)
Citation preview

CIGR Handbookof Agricultural Engineering
Volume IV
i

ii

CIGR Handbookof Agricultural Engineering
Volume IVAgro-Processing Engineering
Edited by CIGR–The InternationalCommission of Agricultural Engineering
Volume Editor:F. W. Bakker-Arkema
Michigan State University, USA
Co-Editors:J. DeBaerdemaeker
Katholieke Universiteit Leuven, Belgium
P. AmiranteUniversita di Bari, Italy
M. Ruiz-AltisentUniversidad Politecnica de Madrid, Spain
C. J. StudmanMassey University, New Zealand
Published by the American Society of Agricultural Engineers
iii
Front Matter
Table of Contents
➤
➤
Copyright c© 1999 by the American Society of Agricultural EngineersAll Rights Reserved
LCCN 98-93767 ISBN 1-892769-03-4
This book may not be reproduced in whole or in part by any means (with the exceptionof short quotes for the purpose of review) without the permission of the publisher.
For Information, contact:
Manufactured in the United States of America
The American Society of Agriculture Engineers is not responsible for the statementsand opinions advanced in its meetings or printed in its publications. They represent theviews of the individuals to whom they are credited and are not binding on the society asa whole.
iv
Editors and AuthorsVolume EditorF. W. Bakker-ArkemaDepartment of Agricultural Engineering, Michigan State University, East Lansing,MI, USA 48824
Co-EditorsP. AmiranteIstituto di Meccanica Agraria, Universita di Bari, 70126 Bari, Italy
J. De BaerdemaekerDepartment of Agro-Engineering and –Economics, Katholieke Universiteit Leuven,B-3001 Heverlee, Belgium
M. Ruiz-AltisentLaboratoric Propiedades Fisicas, Departamento de Ingenieria Rural, E.T.S.I.Agronomos, Universidad Politecnica de Madrid, Avenida Complutense s/n,28040 Madrid, Spain
C. J. StudmanCentre for Postharvest and Refrigeration Research, Institute of Technologyand Engineering, Massey University, Palmerston North, New Zealand
AuthorsP. AguadoEscuela de Ingenieros Agronomos, Universidad de Leon, Leon, Spain
F. AyugaUniversidad Politecnica de Madrid, Ciudad Universitaria d/n, 28040 Madrid, Spain
P. A. BerbertDepartment of Agricultural Engineering, University of Vicosa, Vicosa, MG, Brazil
C. W. CaoBeijing Agricultural Engineering University, P.O. Box 50, Beijing, 100083, P. R. China
P. CatalanoDipartimento SAVA, Universita del Molise, 86100 Campobasso, Italy
J. de Sousa e SilvaDepartment of Agricultural Engineering, University of Vicosa, Vicosa, MG, Brazil
G. C. Di RenzoDepartimento Tecnico-Economico, Universita della Basilicata, 85100 Potenza, Italy
E. Garcia-VaqueroUniversidad Politecnica de Madrid, Ciudad Universitaria s/n, 28040 Madrid, Spain
E. W. HewettInstitute of Natural Resources, Massey University, Palmerston North, New Zealand
v
vi Editors and Authors
D. J. HiltonAptek Consultants, 9, Rowbotham Street, Toowoomba, Queensland 4350, Australia
R. E. HinesMFS/YORK/Stormor, PSJ Penthouse, Unit 5B, 3/21 Sukhumvit Road, Soi 6,Bangkok 10110, Thailand
P. JancsokDepartment of Agro-Engineering and –Economics, Katholieke Universiteit Leuven,B-3001 Heverlee, Belgium
A. A. JongebreurIMAG-DLO, Mansholtlaan 12, 6700 AA Wageningen, the Netherlands
J. S. LabiakDepartment of Mechanical Engineering, Michigan State University, East Lansing,MI, USA
Qiang LiuDepartment of Agricultural Engineering, Michigan State University, East Lansing,MI, USA
J. E. MontrossDepartment of Agricultural Engineering, Michigan State University, East Lansing,MI, USA
L. U. OparaCentre for Postharvest and Refrigeration Research, Massey University,Palmerston North, New Zealand
N. ScheerlinckDepartment of Agro-Engineering and –Economics, Katholieke Universiteit Leuven,B-3001 Heverlee, Belgium
J. F. ThompsonDepartment of Biological and Agricultural Engineering, University of California,Davis, CA, USA 95616
P. VerbovenDepartment of Agro-Engineering and –Economics, Katholieke Universiteit Leuven,B-3001 Heverlee, Belgium
Editorial BoardFred W. Bakker-Arkema, Editor of Vol. IVDepartment of Agricultural EngineeringMichigan State UniversityMichigan, USA
El Houssine Bartali, Editor of Vol. II (Part 1)Department of Agricultural EngineeringInstitute of AgronomyHassan II, Rabat, Morocco
Egil BergeDepartment of Agricultural EngineeringUniversity of Norway, Norway
Jan DaelemansNational Institute of Agricultural EngineeringMerelbeke, Belgium
Tetuo HaraDepartment Engenharia AgricolaUniversidade Federal de Vicosa36570-000 Vicosa, MG, Brazil
Donna M. HullAmerican Society of Agricultural EngineersMichigan 49085-9659, USA
A. A. JongebreurIMAG-DLOWageningen, The Netherlands
Osamu Kitani, Editor-in-Chief and Editor of Vol. VDepartment of Bioenvironmental and Agricultural EngineeringNihon UniversityKameino 1866Fujisawa, 252-8510 Japan
Hubert N. van Lier, Editor of Vol. IChairgroup Land Use PlanningLaboratory for Special Analysis, Planning and DesignDepartment of Environmental SciencesAgricultural UniversityWageningen, The Netherlands
vii
viii Editorial Board
A. G. RijkAsian Development BankP.O. Box 7890980 Manila, Philippines
W. SchmidO.R.L. Institute, E.T.H.Z.HongerbergZurich, Switzerland
The late Richard A. SprayAgricultural and Biological Engineering DepartmentClemson UniversityClemson, South Carolina 29634-0357, USA
Bill A. Stout, Editor of Vol. IIIDepartment of Agricultural EngineeringTexas A & M UniversityTexas, USA
Fred W. Wheaton, Editor of Vol. II (Part 2)Agricultural Engineering DepartmentUniversity of MarylandMaryland, USA
Contents
Foreword xvPreface xvii
1 Grains and Grain Quality 11.1 Grain Quality 1
1.1.1 Quality Factors 11.1.2 Grade Standards 6
1.2 Grain Handling 111.2.1 Belt Conveyors 121.2.2 Screw Conveyors 141.2.3 Bucket Elevators 161.2.4 Pneumatic Conveyors 17
1.3 Grain Drying 201.3.1 Fundamentals 201.3.2 Sun Drying 321.3.3 In-store Drying 331.3.4 High-capacity Drying 371.3.5 List of Symbols 44
1.4 Grain Storage 461.4.1 Crib Storage 461.4.2 Bag Storage 461.4.3 Bulk Storage 471.4.4 Grain Pests 54
1.5 Grain Drying and Storage in the Tropics 591.5.1 Deterioration during Storage 601.5.2 Drying Systems 601.5.3 Cacao-Bean Drying 651.5.4 Physical Properties of Cacao Seeds 66
2 Root Crops 692.1 Root Crop Quality and Losses 69
2.1.1 Morphology of Roots, Tubers, and Bulbs 702.1.2 Product Respiration 712.1.3 Water Loss of Stored Products 762.1.4 Heat Transfer of Root Products 802.1.5 Modeling Heat and Moisture Transfer in Forced
Convection Bulk-Product Storage 842.1.6 Natural Convection inside Stores 872.1.7 Quality Standards for Root Crops 89
2.2 Storage of Potatoes 922.2.1 Solanum Tuberosum 922.2.2 History of the Potato 922.2.3 Potato Production 932.2.4 Importance of Product Storage 93
ix
x Contents
2.2.5 Systems for Potato Storage 962.2.6 Phases in the Storage Period 1002.2.7 Physical-Transport Phenomena in Potato Stack 1052.2.8 Process Control 1092.2.9 Equipment in Storage Houses 1092.2.10 Product Handling during Storage 1202.2.11 Product Quality-Inspection Systems 121
2.3 Onion Storage 1252.3.1 Economic Importance of Onions 1252.3.2 Physiology and Quality 1262.3.3 Quality Standards of Bulb Onions 1272.3.4 Harvest and Postharvest Handling 1272.3.5 Packaging 1342.3.6 Bulb-Storage Requirements 1372.3.7 Control of Storage Disorders and Diseases 1412.3.8 Types of Storage Structures 1442.3.9 Design and Operation of Onion Stores 150
2.4 Cassava Storage 1572.4.1 General 1572.4.2 Maturity, Harvesting, and Yield 1602.4.3 Handling, Curing, and Packaging 1612.4.4 Storage Environment Requirements 1622.4.5 Postharvest Treatments 1632.4.6 Storage Disorders and Diseases 1632.4.7 Types of Storage Structures 1652.4.8 Agroprocessing of Cassava Roots 1662.4.9 Nutritional and Engineering Properties 170
2.5 Yam Storage 1822.5.1 General 1822.5.2 Maturity and Harvesting 1862.5.3 Postharvest Handling, Curing, and Packaging 1882.5.4 Storage-Environment Requirements 1892.5.5 Tuber Dormancy in Storage 1912.5.6 Storage Disorders and Diseases 1912.5.7 Types of Storage Structures 1952.5.8 Agroprocessing of Yam 1992.5.9 Nutritional, Physicochemical, and Rheological Properties200
2.6 Storage of Edible Aroids 2142.6.1 General 2142.6.2 Maturity and Harvesting 2192.6.3 Postharvest Handling and Curing 2202.6.4 Storage of Fresh Corms 2222.6.5 Control of Storage Diseases and Disorders 2262.6.6 Agroprocessing and Utilization 227
Contents xi
3 Fruit and Vegetables 2433.1 Fruit and Vegetable Quality 243
3.1.1 Importance of Fruits and Vegetables, andQuality Considerations 243
3.1.2 Meaning of Quality 2433.1.3 Measurement 2493.1.4 Nondestructive Testing Methods and Their Advantages 2613.1.5 Maintenance of Quality 266
3.2 Fruit and Vegetable Storage Requirements 2733.2.1 Fundamentals 2733.2.2 Horticultural Products Are Living Entities 2733.2.3 Deterioration of Fresh Products 2743.2.4 Physiological Factors Involved in Deterioration 2793.2.5 Preharvest Factors Affecting Postharvest Quality 2863.2.6 Harvesting and Its Effect on Postharvest Quality 2873.2.7 New Postharvest Opportunities 287
3.3 Handling Systems and Packaging 2913.3.1 Postharvest Losses 2913.3.2 Postharvest Operations 2913.3.3 Handling Damage 3063.3.4 Packaging 3183.3.5 Reducing Handling Damage in the Postharvest Chain 3293.3.6 Identification of Problem Areas in Handling Systems 331
3.4 Cold-Storage Systems 3393.4.1 Purpose of Storage 3393.4.2 Storage Considerations 3393.4.3 Refrigeration 3453.4.4 Absorption Refrigeration 3503.4.5 Secondary Refrigerants 3513.4.6 Refrigeration Load Calculations 3513.4.7 Alternative Refrigeration Sources 3513.4.8 Storage Building 3533.4.9 Other Options for Small-Scale Cold Rooms 3553.4.10 Controlled-Atmosphere Storage 3563.4.11 Equipment for Atmospheric Modification (MA Storage) 3603.4.12 Monitoring Equipment 3603.4.13 Safety Considerations 3613.4.14 Refrigeration Equipment 361
3.5 Processing of Fruit and Vegetables 3623.5.1 Processing Options 3623.5.2 Blanching and Lye-Solution Treatment 3623.5.3 Canning 3633.5.4 Freezing 3633.5.5 Dehydration and Desiccation 363

xii Contents
3.5.6 Controlled Ripening and Degreening 3643.5.7 Processing into Purees, Pastes, and Edible Leathers 3653.5.8 Processing into Flour 3663.5.9 Juicing and Production of Nectars 3663.5.10 Aseptic Processing and Packaging 3673.5.11 Minimal Processing for Retail and Fast-Food Outlets 3673.5.12 Fermentation into Alcoholic Beverages, Vinegar,
Sauces and Other Products 3693.5.13 Processing into Jams, Pickles, Chutneys, and Sauces 3703.5.14 Oil Production 3703.5.15 Soaking to Remove Toxic and Indigestible Substances 3723.5.16 Irradiation 3723.5.17 Equipment for Physical Processes 3733.5.18 Equipment for Thermal Processes 378
3.6 Fruit and Vegetable Postharvest Systems in the Tropics 3803.6.1 Relevance of Postharvest Engineering for Fruit
and Vegetables in the Tropics 3803.6.2 Crop Losses in the Tropics 3813.6.3 Marketing Issues for Less-Developed Countries 3823.6.4 Engineering Challenges to Postharvest Systems
in the Tropics 3833.6.5 Role of the Agricultural Engineer 3863.6.6 Future Prospects and Challenges 388Appendix 393List of Symbols 403
4 Grapes, Olives, and Coffee 4194.1 Wine Processing 419
4.1.1 Industrial Process 4194.1.2 Process Description 4204.1.3 Process and Winery Design Data 4384.1.4 Design Example 4394.1.5 Winery Description 4404.1.6 Tanks 443
4.2 Olive-Oil Processing 4464.2.1 Olive Composition 4464.2.2 Industrial Process 4474.2.3 Olive-Oil Industries 453
4.3 Coffee Drying 4574.3.1 Natural Coffee 4584.3.2 Washed Coffee 4584.3.3 Pulped Coffee 4584.3.4 Coffee Quality 458
Contents xiii
4.3.5 Coffee-Drying Methods 4594.3.6 Coffee Storage 468
5 Effluent Treatment in Agroprocessing 4755.1 Effluents in Agroprocessing 475
5.1.1 The Problem of Effluents 4755.1.2 Organic-Matter Cycle in Nature and Agriculture,
and Effluent-Treatment Systems 4765.1.3 Composting with Reference to Plant Solutions 4805.1.4 Importance of Agroindustries and Size of the Problem 4825.1.5 Regulations on Effluent Disposal, with Special Reference
to Industrialized Countries 4835.2 Effluents from Wine Processing 483
5.2.1 Technological Cycle of Wine Processingand Characteristics of Effluents 483
5.2.2 Polluting Factors and Reduction of the Pollution Volumeand Effluent Load 486
5.2.3 Treatments for Winery Effluents Purification 4885.2.4 Design Example of Treatment Plant for Winery Effluents497
5.3 Effluents from Olive-Oil Processing 4975.3.1 Extraction Systems and Effluent Composition 4975.3.2 Water Saving and Recycling in Processing 4995.3.3 Reuse for Land Irrigation 5005.3.4 OPE-Treatment Systems 5025.3.5 Comparison of Treatment Systems 512
Index 519

xiv
ForewordThis handbook has been edited and published as a contribution to world agriculture atpresent as well as for the coming century. More than half of the world’s population isengaged in agriculture to meet total world food demand. In developed countries, theeconomic weight of agriculture has been decreasing. However, a global view indicatesthat agriculture is still the largest industry and will remain so in the coming century.
Agriculture is one of the few industries that creates resources continuously fromnature in a sustainable way because it creates organic matter and its derivatives byutilizing solar energy and other material cycles in nature. Continuity or sustainabilityis the very basis for securing global prosperity over many generations—the commonobjective of humankind.
Agricultural engineering has been applying scientific principles for the optimal con-version of natural resources into agricultural land, machinery, structure, processes, andsystems for the benefit of man. Machinery, for example, multiplies the tiny power (about0.07 kW) of a farmer into the 70 kW power of a tractor which makes possible theproduction of food several hundred times more than what a farmen can produce manu-ally. Processing technology reduces food loss and adds much more nutritional values toagricultural products than they originally had.
The role of agricultural engineering is increasing with the dawning of a new century.Agriculture will have to supply not only food, but also other materials such as bio-fuels,organic feedstocks for secondary industries of destruction, and even medical ingredients.Furthermore, new agricultural technology is also expected to helpreduceenvironmentaldestruction.
This handbook is designed to cover the major fields of agricultural engineering suchas soil and water, machinery and its management, farm structures and processing agri-cultural, as well as other emerging fields. Information on technology for rural planningand farming systems, aquaculture, environmental technology for plant and animal pro-duction, energy and biomass engineering is also incorporated in this handbook. Theseemerging technologies will play more and more important roles in the future as bothtraditional and new technologies are used to supply food for an increasing world popula-tion and to manage decreasing fossil resources. Agricultural technologies are especiallyimportant in developing regions of the world where the demand for food and feedstockswill need boosting in parallel with the population growth and the rise of living standards.
It is not easy to cover all of the important topics in agricultural engineering in alimited number of pages. We regretfully had to drop some topics during the planningand editorial processes. There will be other requests from the readers in due course. Wewould like to make a continuous effort to improve the contents of the handbook and, inthe near future, to issue the next edition.
This handbook will be useful to many agricultural engineers and students as well asto those who are working in relevant fields. It is my sincere desire that this handbook willbe used worldwide to promote agricultural production and related industrial activities.
Osamu KitaniEditor-in-Chief
xv

xvi
PrefaceAgro-processing engineering has gained importance in the past decade. Increases in cropproduction have not been matched by technical improvements in post-production prac-tices. Double and triple cropping, and the development of higher-yielding hybrids haveled to significant production gains but the lack of post-harvest storage and processing fa-cilities have resulted in greater post-production losses.Volume IV of the CIGR Handbookof Agricultural Engineeringaddresses this problem by presenting detailed treatises onthe post-harvest technologies of agricultural products, ranging from the drying of grainsto the value-added processing of olives. The Volume is a reference text in which essentialagro-processing technology is assembled in an easily accessible form. It is intended tofill a gap in the presently available AE literature.
TheHandbookwill benefit both practicing engineers who are searching for answers tocritical technical questions, and young students who are acquainting themselves with theprinciples of post-harvest technology. And, it will be useful to manufacturers, technicians,and (hopefully) farmers.
Volume IVis divided into five major sections. Part 1 covers the drying and storageof grains; Part 2 contains the storage of root crops; Part 3 is devoted to the storage andprocessing of fruits and vegetables; Part 4 includes the processing of grapes, olives andcoffee; and, Part 5 concludesVolume IVwith a description of the effluent treatment inseveral agro-processing industries. Each sub-section has a separate list of references. Thisplus an index should facilitate the search for specific information on Agro-processingtopics.
The authors constitute a multi-national blend of academic, government and industrialexperts. They were selected because of their long and broad experience in their fields ofexpertise. Space limitation forced each author to be selective in his/her choice of topicsand depth of coverage; most emphasized the variouspractical engineering aspects oftheir agro-processing subject. Some unevenness among the chapters was unavoidablebecause of the different backgrounds of the authors, and the inequality of the technicaldevelopment among the agro-processing domains. Some agro-processing topics are notcovered in this Volume, e.g. wet-milling and dry-milling of maize, not because they areinconsequential but because of space limitation and handbook-availability of the subjectelsewhere.
The Editors wish to thank Dr. A. A. Jongebreur (IMAG, Wageningen, the Netherlands)for serving as the critical reviewer ofVolume IV.Thanks are also expressed to DonnaHull and her staff (ASAE, St. Joseph, MI, USA) for their support in the final editing ofthe manuscripts.
The Editor and Co-Editors ofVolume IV
xvii

1 Grains and Grain Quality
F. W. Bakker-Arkema, Editor
Grains are among the major commodities for feeding mankind. The cleaning, drying, andstorage of grains are postharvest operations required to maintain their product quality[1]. They are the major subjects discussed in this section.
The termgrains is interpreted broadly and includes the cereal grains (maize, rice,wheat, sorghum, barley, oats, millet), the oil seeds (soybeans, sunflower seed, canola),and the pulses (edible beans). Although a grain species may require a particular posthar-vest operation, the fundamentals of the cleaning, drying, and storage of grains are suf-ficiently similar to warrant a general description of the various postharvest operations.This procedure is followed in this chapter.
1.1 Grain QualityF. W. Bakker-Arkema
Grain quality is an ill defined term because its meaning is interpreted differently byvarious end-users. For the livestock producer, the nutritive value of grain is important. Forthe cereal manufacturer, some physical grain property such as the breakage susceptibilitymay be of significance. And to the seed producer, only the seed viability is of interest.
Regardless of the particular grain-quality criterion, the postharvest operations to whicha grain sample is subjected determine its value.
1.1.1 Quality Factors
The property of a lot of grain that determines its market value may be aphysicalproperty, such as the kernel damage or the bulk density, or anutritive value such as thecrude protein or aflatoxin content. The next subsections cover the main physical andnutritive values of maize, rice, and wheat, principally.
Physical Properties
Moisture ContentThe moisture content of grain can be expressed as a percentage on a wet basis (w.b.)
(Mwb) or a dry basis (d.b.) (Mdb):
Mwb = Ww
Wt(100)
1

2 Grains and Grain Quality
Figure 1.1. Scale for moisture-content basis conversion.
Mdb = Ww
Wdm(100),
whereWw is the weight of water in a sample,Wdm is the weight of dry matter, andWt
is the total weight.The relationship betweenMwb andMdb is (see Fig. 1.1):
Mwb = Mdb
100+ Mdb(100)
Mdb = Mwb
100− Mwb(100).
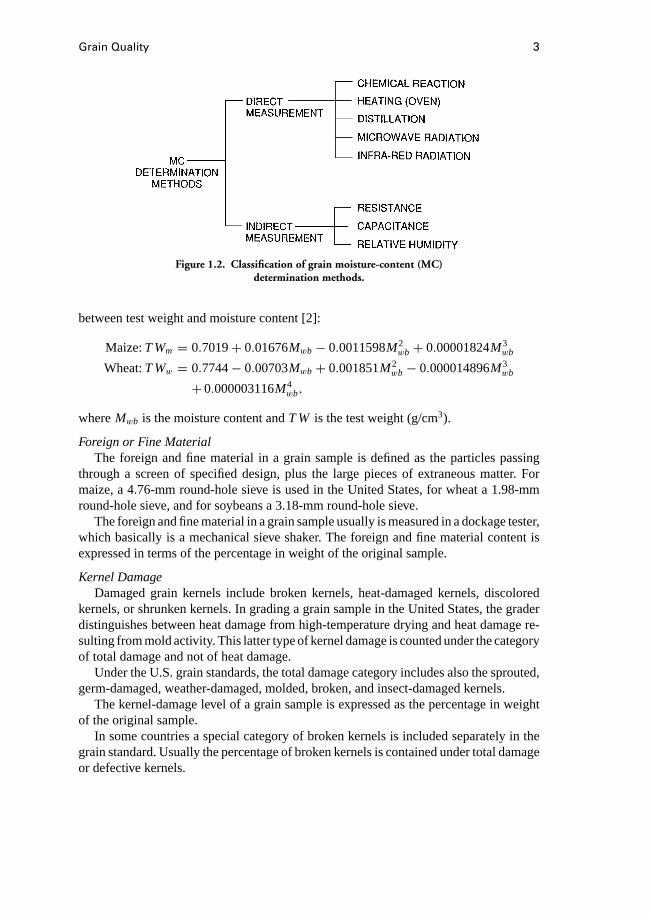
Mwb is usually used in commerce,Mdb in engineering calculations.The methods of determining the moisture content of grains are listed in Fig. 1.2.
Capacitance-type moisture meters are accurate over the range of moisture 12% to 30%(w.b.), if properly calibrated, and are popular for use in commerce.
Bulk DensityThebulk densityof a lot of grain is defined as the weight per unit volume of grain
kernels. It is expressed in grams per cubic centimeter or kilograms per cubic meter. Inthe United States the termtest weightis used and is defined as the weight of 0.0352 m3
(i.e., 1 bushel) of grain.The bulk density is determined by allowing grain to flow freely from a funnel into a
so-called Winshester kettle and weighing the contents.As grain is dried, the bulk density increases due to the shrinkage of the individual grain
kernels. For maize and wheat the following empirical relationships have been established
Grain Quality 3
Figure 1.2. Classification of grain moisture-content (MC)determination methods.
between test weight and moisture content [2]:
Maize:T Wm = 0.7019+ 0.01676Mwb − 0.0011598M2wb + 0.00001824M3
wb
Wheat:T Ww = 0.7744− 0.00703Mwb + 0.001851M2wb − 0.000014896M3
wb
+0.000003116M4wb,
whereMwb is the moisture content andT W is the test weight (g/cm3).
Foreign or Fine MaterialThe foreign and fine material in a grain sample is defined as the particles passing
through a screen of specified design, plus the large pieces of extraneous matter. Formaize, a 4.76-mm round-hole sieve is used in the United States, for wheat a 1.98-mmround-hole sieve, and for soybeans a 3.18-mm round-hole sieve.
The foreign and fine material in a grain sample usually is measured in a dockage tester,which basically is a mechanical sieve shaker. The foreign and fine material content isexpressed in terms of the percentage in weight of the original sample.
Kernel DamageDamaged grain kernels include broken kernels, heat-damaged kernels, discolored
kernels, or shrunken kernels. In grading a grain sample in the United States, the graderdistinguishes between heat damage from high-temperature drying and heat damage re-sulting from mold activity. This latter type of kernel damage is counted under the categoryof total damage and not of heat damage.
Under the U.S. grain standards, the total damage category includes also the sprouted,germ-damaged, weather-damaged, molded, broken, and insect-damaged kernels.
The kernel-damage level of a grain sample is expressed as the percentage in weightof the original sample.
In some countries a special category of broken kernels is included separately in thegrain standard. Usually the percentage of broken kernels is contained under total damageor defective kernels.
4 Grains and Grain Quality
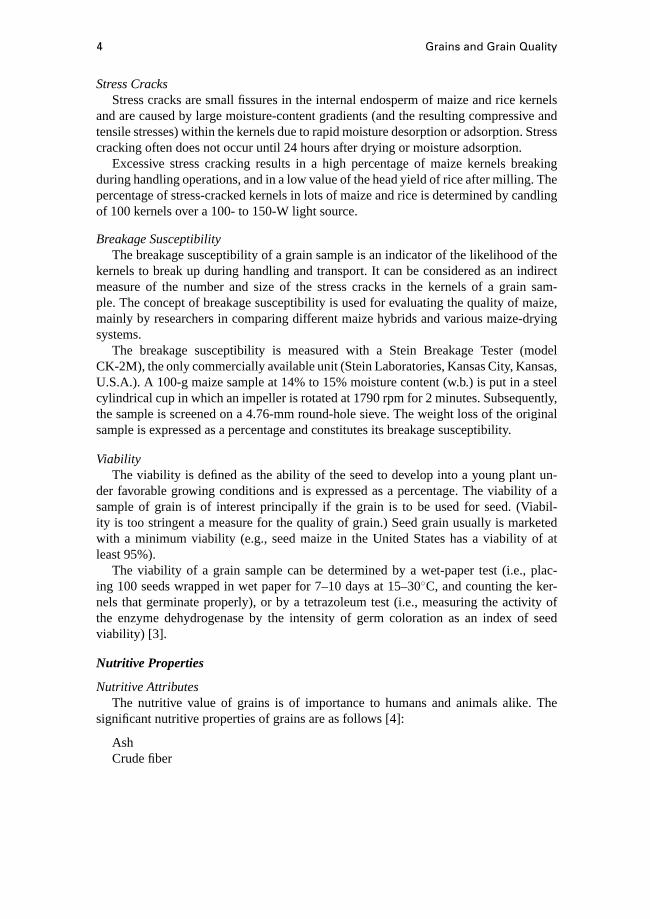
Stress CracksStress cracks are small fissures in the internal endosperm of maize and rice kernels
and are caused by large moisture-content gradients (and the resulting compressive andtensile stresses) within the kernels due to rapid moisture desorption or adsorption. Stresscracking often does not occur until 24 hours after drying or moisture adsorption.
Excessive stress cracking results in a high percentage of maize kernels breakingduring handling operations, and in a low value of the head yield of rice after milling. Thepercentage of stress-cracked kernels in lots of maize and rice is determined by candlingof 100 kernels over a 100- to 150-W light source.
Breakage SusceptibilityThe breakage susceptibility of a grain sample is an indicator of the likelihood of the
kernels to break up during handling and transport. It can be considered as an indirectmeasure of the number and size of the stress cracks in the kernels of a grain sam-ple. The concept of breakage susceptibility is used for evaluating the quality of maize,mainly by researchers in comparing different maize hybrids and various maize-dryingsystems.
The breakage susceptibility is measured with a Stein Breakage Tester (modelCK-2M), the only commercially available unit (Stein Laboratories, Kansas City, Kansas,U.S.A.). A 100-g maize sample at 14% to 15% moisture content (w.b.) is put in a steelcylindrical cup in which an impeller is rotated at 1790 rpm for 2 minutes. Subsequently,the sample is screened on a 4.76-mm round-hole sieve. The weight loss of the originalsample is expressed as a percentage and constitutes its breakage susceptibility.
ViabilityThe viability is defined as the ability of the seed to develop into a young plant un-
der favorable growing conditions and is expressed as a percentage. The viability of asample of grain is of interest principally if the grain is to be used for seed. (Viabil-ity is too stringent a measure for the quality of grain.) Seed grain usually is marketedwith a minimum viability (e.g., seed maize in the United States has a viability of atleast 95%).
The viability of a grain sample can be determined by a wet-paper test (i.e., plac-ing 100 seeds wrapped in wet paper for 7–10 days at 15–30◦C, and counting the ker-nels that germinate properly), or by a tetrazoleum test (i.e., measuring the activity ofthe enzyme dehydrogenase by the intensity of germ coloration as an index of seedviability) [3].
Nutritive Properties
Nutritive AttributesThe nutritive value of grains is of importance to humans and animals alike. The
significant nutritive properties of grains are as follows [4]:
AshCrude fiber
Grain Quality 5
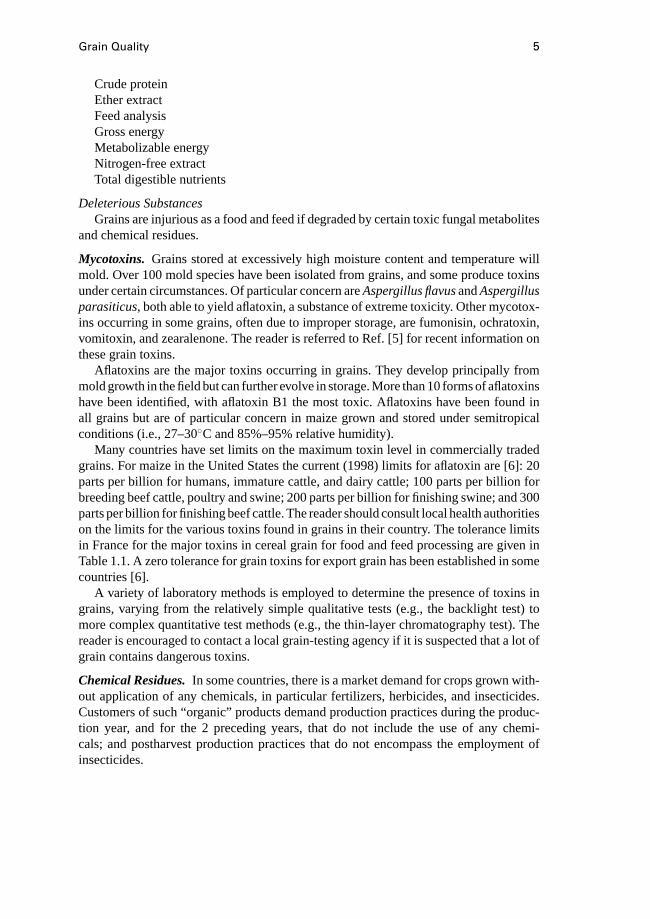
Crude proteinEther extractFeed analysisGross energyMetabolizable energyNitrogen-free extractTotal digestible nutrients
Deleterious SubstancesGrains are injurious as a food and feed if degraded by certain toxic fungal metabolites
and chemical residues.
Mycotoxins. Grains stored at excessively high moisture content and temperature willmold. Over 100 mold species have been isolated from grains, and some produce toxinsunder certain circumstances. Of particular concern areAspergillus flavusandAspergillusparasiticus, both able to yield aflatoxin, a substance of extreme toxicity. Other mycotox-ins occurring in some grains, often due to improper storage, are fumonisin, ochratoxin,vomitoxin, and zearalenone. The reader is referred to Ref. [5] for recent information onthese grain toxins.
Aflatoxins are the major toxins occurring in grains. They develop principally frommold growth in the field but can further evolve in storage. More than 10 forms of aflatoxinshave been identified, with aflatoxin B1 the most toxic. Aflatoxins have been found inall grains but are of particular concern in maize grown and stored under semitropicalconditions (i.e., 27–30◦C and 85%–95% relative humidity).
Many countries have set limits on the maximum toxin level in commercially tradedgrains. For maize in the United States the current (1998) limits for aflatoxin are [6]: 20parts per billion for humans, immature cattle, and dairy cattle; 100 parts per billion forbreeding beef cattle, poultry and swine; 200 parts per billion for finishing swine; and 300parts per billion for finishing beef cattle. The reader should consult local health authoritieson the limits for the various toxins found in grains in their country. The tolerance limitsin France for the major toxins in cereal grain for food and feed processing are given inTable 1.1. A zero tolerance for grain toxins for export grain has been established in somecountries [6].
A variety of laboratory methods is employed to determine the presence of toxins ingrains, varying from the relatively simple qualitative tests (e.g., the backlight test) tomore complex quantitative test methods (e.g., the thin-layer chromatography test). Thereader is encouraged to contact a local grain-testing agency if it is suspected that a lot ofgrain contains dangerous toxins.
Chemical Residues.In some countries, there is a market demand for crops grown with-out application of any chemicals, in particular fertilizers, herbicides, and insecticides.Customers of such “organic” products demand production practices during the produc-tion year, and for the 2 preceding years, that do not include the use of any chemi-cals; and postharvest production practices that do not encompass the employment ofinsecticides.

6 Grains and Grain Quality
Table 1.1. Tolerance limits for the majormycotoxins in cereal grain for food and feed
processing in France in 1996
Mycotoxin Limit
Aflatoxin B1 5 ppb in cereal grain1 ppb in grain for food0.5 ppb in edible oil
Zearalenone 20 ppb in corn for food1 ppb in corn oil300 ppb in pig feed500 ppb for other animal feed
Ochratoxin A 30 ppb in cereal grainFumonisin 5 ppb in food and feed for all
species
Source: [7].
Verifying the nonuse of chemicals during the production and postharvest operationsof a food or feed product requires testing at a specially equipped laboratory and thus isan expensive procedure.
Milling and Processing PropertiesGrains are used as feed for animals, as food for humans, and as feedstock for industrial
processes. As a feed, the nutritive properties have to be healthy. As a food or feedstock,the milling and processing qualities of grains have to be acceptable. The desired attributesdiffer greatly for the various grains, as is shown in Table 1.2. Note that these attributesarein addition tothe factors contained in the grade standard (see Section 1.1.2) for eachgrain.
1.1.2 Grade Standards
Grade standards are used in the trade of grain; they facilitate the marketing of grains.Unfortunately, the grade standards of the various grain species are not universal but
Table 1.2. Grain-quality attributes of importance for the milling,processing, or human consumption of different grains
Maize Rice Soybeans Wheat
Hardness Milling quality Splits HardnessKernel weight Cooking quality Kernel weight Kernel weightFat acidity Kernel color Protein content Gluten contentSoluble protein Eating quality Oil content Fat acidityTurbidity Free fatty acids Flour yieldSedimentation Iodine number Semolina yieldAmylose Phosphatides Ash content
Oxidation value Dough quality
Sources: [1, 8].

Grain Quality 7
Table 1.3. U.S. grade requirements for yellow corn (maize)
Maximum Limits (%)
Damaged Kernels
Heat-Damaged Broken Corn andMinimum Test
Weight per Bushel(lb) Kernels Total Foreign Material
U.S. no. 1 56.0 0.1 3.0 2.0U.S. no. 2 54.0 0.2 5.0 3.0U.S. no. 3 52.0 0.5 7.0 4.0U.S. no. 4 49.0 1.0 10.0 5.0U.S. no. 5 46.0 3.0 15.0 7.0U.S. sample gradea
Source: [1].a U.S. sample-grade is corn that does not meet the requirements for U.S. grade nos. 1, 2,
3, 4, or 5; contains eight or more stones that have an aggregate weight in excess of 0.20%of the sample weight, or two or more pieces of glass; has a musty, sour, or commerciallyobjectionable foreign odor; or is heating or otherwise of distinctly low quality.
Table 1.4. Maximum allowable percentages of gradefactors for dent maize in Argentina
No. 1 No. 2 No. 3 No. 4
Damaged kernels 3.0 5.0 8.0 12.0Broken kernels 2.0 3.0 5.0 5.0Foreign material 1.0 1.5 2.0 2.0
Source: [9].
Table 1.5. Maximum allowable percentages of gradefactors for yellow maize in South Africa
No. 1 No. 2 No. 3
Defective maize kernels 3.0 5.0 8.0Other-colored maize kernels 2.0 3.0 5.0Foreign matter 1.0 1.5 2.0Sum of the above three defects 9.0 20.0 30.0Pink corn 12.0 12.0 12.0
Source: [9].
may vary significantly between countries. This is illustrated for maize in Tables 1.3through 1.5 for the United States, Argentina, and South Africa, respectively. Only theU.S. standard contains a factor for test weight; only South Africa includes a category ofpink maize.
It is noteworthy that the grade standard for maize does not contain a factor for moisturecontent in either of the three countries. However, in the trade the maximum averagemoisture content of a lot usually is specified.
8 Grains and Grain Quality
Tabl
e1.
6.U
.S.g
rade
requ
irem
ents
for
roug
hri
ce
Max
imum
Lim
its
Seed
san
dH
eat-
Dam
aged
Ker
nels
Hea
t-da
mag
edK
erne
lsan
dTo
tal,
Obj
ecti
onab
leR
edR
ice
and
Sing
lyor
Seed
sH
eat-
dam
aged
Dam
aged
Cha
lky
Ker
nels
Com
bine
d(S
ingl
yor
Ker
nels
Ker
nels
,In
Med
ium
-(n
o.pe
rC
ombi
ned)
(no.
per
Sing
lyor
InLo
ng-g
rain
orSh
ort-
grai
nO
ther
Col
orR
equi
rem
ents
Gra
de50
0g)
(no.
per
500
g)50
0g)
Com
bine
d(%
)R
ice
(%)
Ric
e(%
)Ty
pes
(%)
(Min
imum
)
U.S
.no.
14
31
0.5
1.0
2.0
1.0
Shal
lbe
whi
teor
crea
my
U.S
.no.
27
52
1.5
2.0
4.0
2.0
May
besl
ight
lygr
ayU
.S.n
o.3
108
52.
54.
06.
03.
0M
aybe
light
gray
U.S
.no.
427
2215
4.0
6.0
8.0
5.0
May
begr
ayor
slig
htly
rosy
U.S
.no.
537
3225
6.0
10.0
10.0
10.0
May
beda
rkgr
ayor
rosy
U.S
.no.
675
7575
15.0
15.0
15.0
10.0
May
beda
rkgr
ayor
rosy
U.S
.sam
ple
grad
ea
aU
.S.s
ampl
egr
ade
shal
lbe
roug
hri
ceth
atdo
esno
tmee
tthe
requ
irem
ents
fora
nyof
the
grad
esfr
om U
.S.n
o.1
thro
ugh
no.6
,inc
lusi
ve;c
onta
insm
ore
than
14.0
%m
oist
ure
(w.b
.);i
sm
usty
,sou
r,or
heat
ing;
has
any
com
mer
cial
lyob
ject
iona
ble
fore
ign
odor
;or
isot
herw
ise
ofdi
stin
ctly
low
qual
ity.
Sour
ce:
[1].

Grain Quality 9
It should be noted that the physical grain-quality factors of stress cracks and breakagesusceptibility are not part of the grade standards for maize in any of the three countries,notwithstanding their importance to grain marketers.
The U.S. grain-grading standards are offered here as an example of the present (1998)set of standards employed for the marketing of four major grains (i.e., maize, rough rice,soybeans, wheat) in one country. The reader should check with the official marketingagency in a particular country for its latest grain-grading standards. Note that in the U.S.standards the test weight is quoted on a bushel (0.03524-m3) basis in terms of pounds(0.4536 kg).
The factors included in the U.S. grades and grade requirements for maize (corn) are(see Table 1.3) test weight, heat-damaged kernels, total damaged kernels, and brokenkernels and foreign material. There are five grades for maize, plus a sample grade.
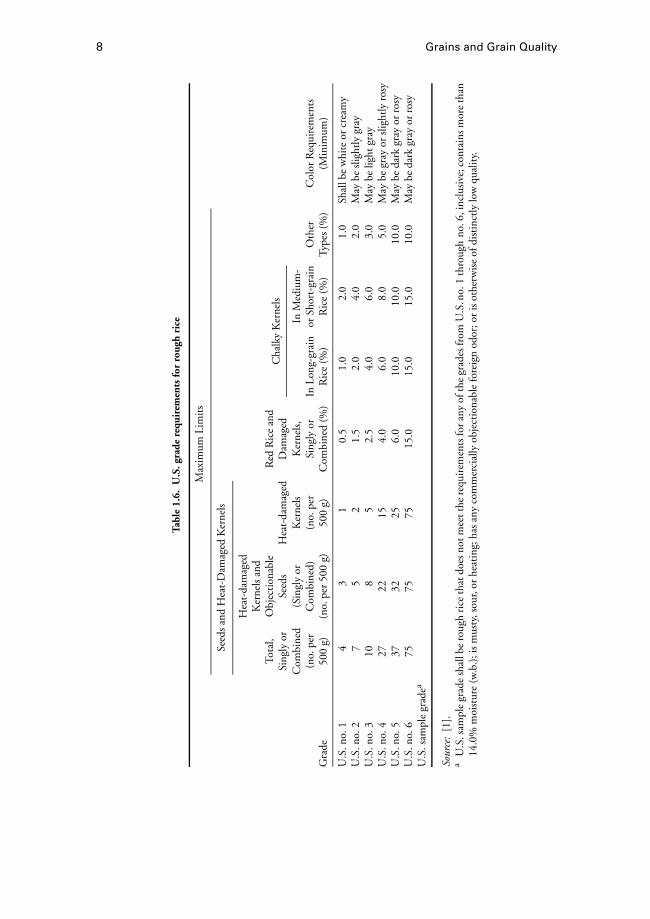
The factors included in the U.S. grades and grade requirements for rough rice are (seeTable 1.6) heat-damaged kernels, heat-damaged and objectionable kernels, the sum ofthese first two, red rice kernels, chalky kernels, and other seeds. The requirement for themaximum limit of chalky kernels differs for long-grain and medium- or short-grain rice.There are six grades for rough rice, plus a sample grade.
The factors included in the U.S. grades and grade requirements for soybeans are (seeTable 1.7) test weight, heat-damaged kernels, total damaged kernels, foreign material,splits, and off-color kernels. There are four grades for soybeans, plus a sample grade.
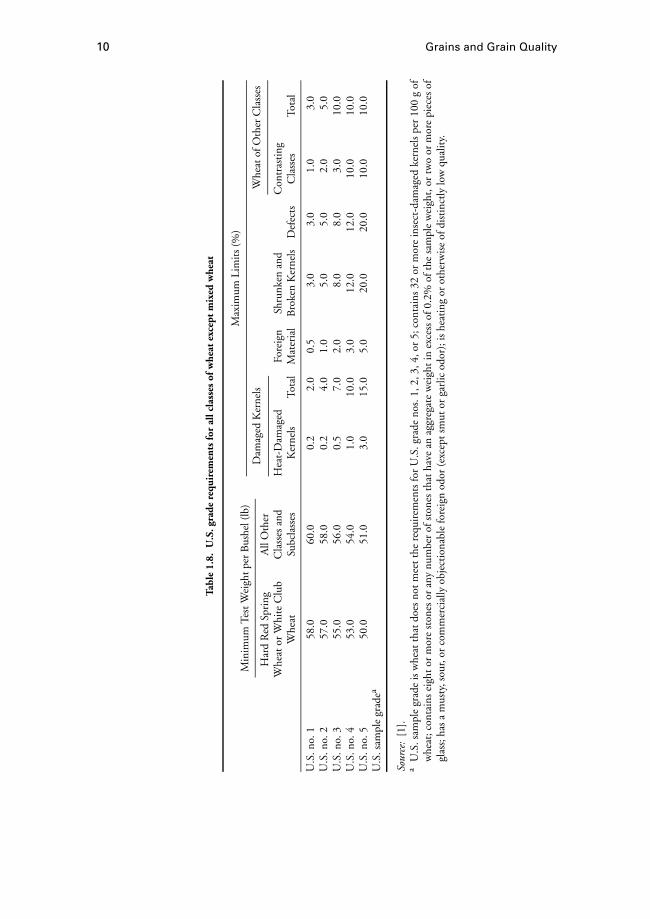
The factors included in the U.S. grades and grade requirements for all classes ofwheat are (see Table 1.8) test weight, heat-damaged kernels, total damaged kernels,foreign material, shrunken and broken kernels, defected kernels, and wheat of otherclasses. Only the test-weight requirement varies among the various classes of wheat.There are five grades for wheats, plus a sample grade.
For the U.S. grades and grade requirements for barley, oats, sorghum and sunflowerseeds, the reader is referred to Ref. [10].
Table 1.7. U.S. grade requirements for soybeans
Maximum Limits (%)
Damaged KernelsMinimum TestWeight perBushel (lb) Heat-damaged Total
ForeignMaterial Splits
Soybeansof OtherColors
U.S. no. 1 56.0 0.2 2.0 1.0 10.0 1.0U.S. no. 2 54.0 0.5 3.0 2.0 20.0 2.0U.S. no. 3 52.0 1.0 5.0 3.0 30.0 5.0U.S. no. 4 49.0 3.0 8.0 5.0 40.0 10.0U.S. sample gradea
Source: [1].a U.S. sample grade is soybeans that do not meet the requirements for U.S. grade nos. 1, 2, 3, or
4; contain eight or more stones that have an aggregate weight in excess of 0.2% of the sampleweight, or two or more pieces of glass; have a musty, sour, or commercially objectionable foreignodor (except garlic odor); or are heating or otherwise of distinctly low quality.
10 Grains and Grain Quality
Tabl
e1.
8.U
.S.g
rade
requ
irem
ents
for
allc
lass
esof
whe
atex
cept
mix
edw
heat
Min
imum
Test
Wei
ghtp
erB
ushe
l(lb
)M
axim
umLi
mit
s(%
)
Dam
aged
Ker
nels
Whe
atof
Oth
erC
lass
esH
ard
Red
Spri
ngA
llO
ther
Whe
ator
Whi
teC
lub
Cla
sses
and
Hea
t-D
amag
edFo
reig
nSh
runk
enan
dC
ontr
asti
ngW
heat
Subc
lass
esK
erne
lsTo
tal
Mat
eria
lB
roke
nK
erne
lsD
efec
tsC
lass
esTo
tal
U.S
.no.
158
.060
.00.
22.
00.
53.
03.
01.
03.
0U
.S.n
o.2
57.0
58.0
0.2
4.0
1.0
5.0
5.0
2.0
5.0
U.S
.no.
355
.056
.00.
57.
02.
08.
08.
03.
010
.0U
.S.n
o.4
53.0
54.0
1.0
10.0
3.0
12.0
12.0
10.0
10.0
U.S
.no.
550
.051
.03.
015
.05.
020
.020
.010
.010
.0U
.S.s
ampl
egr
adea
Sour
ce:
[1].
aU
.S.s
ampl
egr
ade
isw
heat
that
does
not
mee
tth
ere
quir
emen
tsfo
rU
.S.g
rade
nos.
1,2,
3,4,
or5;
cont
ains
32or
mor
ein
sect
-dam
aged
kern
els
per
100
gof
whe
at;c
onta
ins
eigh
tor
mor
est
ones
oran
ynu
mbe
rof
ston
esth
atha
vean
aggr
egat
ew
eigh
tin
exce
ssof
0.2%
ofth
esa
mpl
ew
eigh
t,or
two
orm
ore
piec
esof
glas
s;ha
sa
mus
ty,s
our,
orco
mm
erci
ally
obje
ctio
nabl
efo
reig
nod
or(e
xcep
tsm
utor
garl
icod
or);
ishe
atin
gor
othe
rwis
eof
dist
inct
lylo
wqu
alit
y.

Grain Handling 11
References
1. Brooker, D. B., F. W. Bakker-Arkema, and C. W. Hall. 1992.Drying and Storage ofGrains and Oilseeds. New York: Van Nostrand Reinhold.
2. Nelson, S. O. 1980. Moisture-dependent kernel and bulk density for wheat and corn.Trans. ASAE23:139–143.
3. Copeland, L. O., and M. B. McDonald. 1985.Principles of Seed Science and Tech-nology, 2nd ed. Minneapolis, MN: Burgess.
4. Ensminger, S. 1991.Feeds and Nutrition. San Francisco: Ensminger.5. Pitt, J. I. 1996. What are mycotoxins?Australian Mycotoxin Newsletter7:1–2.6. U. S. Feed and Grain Council. 1997. Mycotoxins in feed.World Grain15:30–31.7. Cahagnier, B., and M. Fremy. 1996. Mycotoxins.Proc. J. Tech. GLCG5:68–70.8. Godon, B., and C. Willm, eds. 1994.Primary Cereal Processing. New York: VCH
Publishers.9. Paulsen, M. R., and L. D. Hill. 1985. Corn quality factor affecting dry milling
performance.J. Agric. Eng. Res.31:225–263.10. Hill, L. D. 1982. Grain standards for corn in exporting countries. InEvaluation of
Issues in Grain Grades and Optimum Moistures. Urbana: University of Illinois.11. USDA, 1988.Grain Grading Procedures. Washington, DC: Federal Grain Inspec-
tion Service.
1.2 Grain HandlingJ. S. Labiak and R. E. Hines
Grain-handling equipment is available for any situation under which grain must betransported from one location to another. The four types most commonly used for com-mercial and farm applications are belt, screw, bucket, and pneumatic conveyors. Grain-flow rate, distance, incline, available space, environment, and economics influence con-veyor design and operating parameters.
The objective of this section is to provide an overview of conveyor designs andoperating characteristics. Power requirement and capacity calculations are different foreach conveyor type and often are based on empirical data. It is suggested to use model-specific, manufacturer-provided information for these calculations, or the proceduresreferenced in this section if manufacturer information is unavailable. Design of conveyorsis covered in detail in the agricultural-engineering literature [1, 2] and in the chemical-engineering literature [3, 4].
The physical characteristics of the material to be handled must be known before theappropriate conveying system can be selected. In particular, the following properties arerelevant for agricultural products: moisture content, average weight per unit volume,angle of repose, and particle size. The physical characteristics of grains and relatedagricultural products are shown in Table 1.9.
In order to use general conveyor-design procedures, the material to be handled firstshould be classified. The U.S. Conveyor Equipment Manufacturers Association distin-guishes among four classes of solids handled by materials-handling systems [8]. Grains
12 Grains and Grain Quality
Table 1.9. Characteristics of agricultural products
Bulk Moisture ContentDensity Range for Handling Angle of(kg/m3) (% w.b.) Repose (degrees) Source
Barley 618 7.9–23.1 29.0–33.8 [5, 6]Maize 721 7.5–23.1 34.0–43.5 [6, 7]Oats 412 10.6–17.3 11.3–33.0 [7]Sorghum 721 6.8–22.1 11.3–23.7 [6]Soybeans 722 7.1–12.2 11.9–28.8 [7]Wheat 772 7.3–19.3 29.6–41.0 [6]
are relatively lightweight, free-flowing, noncorrosive, and nonabrasive and are definedas class I products. Class II solids are moderately free-flowing and are mixed with smalllumps and fines; alfalfa meal and maize grits fall into this class. Class III materials aresimilar in size and flowability to class II solids but are more abrasive and include cement.Class IV products are abrasive and flow poorly; the class includes coal and dry sand.
1.2.1 Belt Conveyors
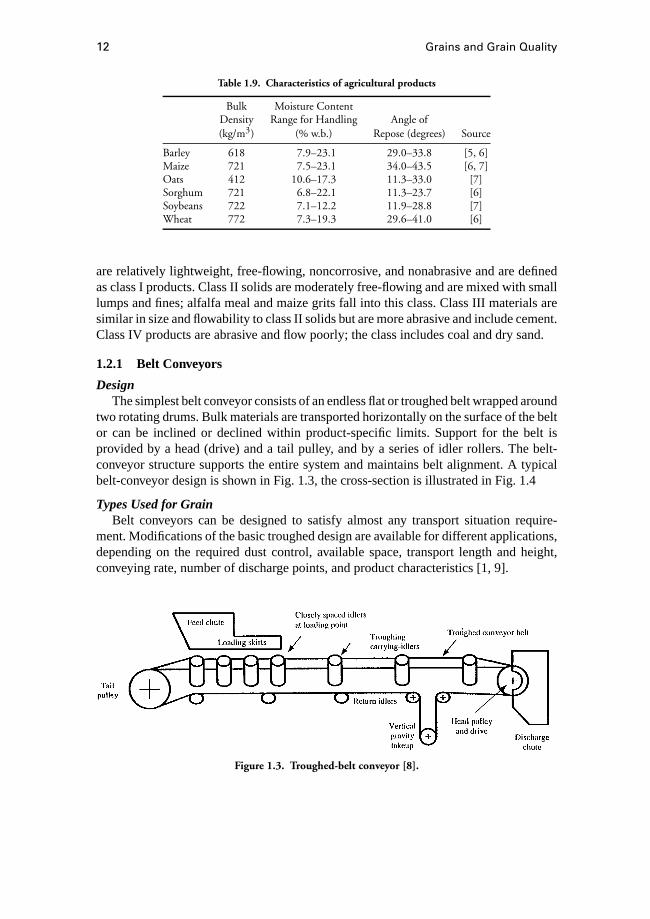
DesignThe simplest belt conveyor consists of an endless flat or troughed belt wrapped around
two rotating drums. Bulk materials are transported horizontally on the surface of the beltor can be inclined or declined within product-specific limits. Support for the belt isprovided by a head (drive) and a tail pulley, and by a series of idler rollers. The belt-conveyor structure supports the entire system and maintains belt alignment. A typicalbelt-conveyor design is shown in Fig. 1.3, the cross-section is illustrated in Fig. 1.4
Types Used for GrainBelt conveyors can be designed to satisfy almost any transport situation require-
ment. Modifications of the basic troughed design are available for different applications,depending on the required dust control, available space, transport length and height,conveying rate, number of discharge points, and product characteristics [1, 9].
Figure 1.3. Troughed-belt conveyor [8].
Grain Handling 13
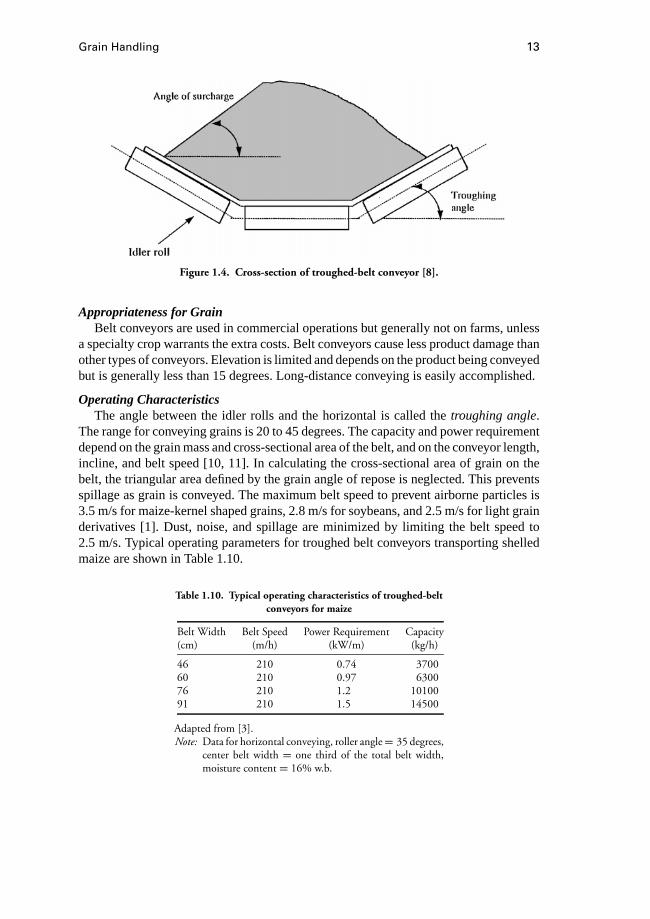
Figure 1.4. Cross-section of troughed-belt conveyor [8].
Appropriateness for GrainBelt conveyors are used in commercial operations but generally not on farms, unless
a specialty crop warrants the extra costs. Belt conveyors cause less product damage thanother types of conveyors. Elevation is limited and depends on the product being conveyedbut is generally less than 15 degrees. Long-distance conveying is easily accomplished.
Operating CharacteristicsThe angle between the idler rolls and the horizontal is called thetroughing angle.
The range for conveying grains is 20 to 45 degrees. The capacity and power requirementdepend on the grain mass and cross-sectional area of the belt, and on the conveyor length,incline, and belt speed [10, 11]. In calculating the cross-sectional area of grain on thebelt, the triangular area defined by the grain angle of repose is neglected. This preventsspillage as grain is conveyed. The maximum belt speed to prevent airborne particles is3.5 m/s for maize-kernel shaped grains, 2.8 m/s for soybeans, and 2.5 m/s for light grainderivatives [1]. Dust, noise, and spillage are minimized by limiting the belt speed to2.5 m/s. Typical operating parameters for troughed belt conveyors transporting shelledmaize are shown in Table 1.10.
Table 1.10. Typical operating characteristics of troughed-beltconveyors for maize
Belt Width Belt Speed Power Requirement Capacity(cm) (m/h) (kW/m) (kg/h)
46 210 0.74 370060 210 0.97 630076 210 1.2 1010091 210 1.5 14500
Adapted from [3].Note: Data for horizontal conveying, roller angle= 35 degrees,
center belt width = one third of the total belt width,moisture content = 16% w.b.
14 Grains and Grain Quality
Figure 1.5. Screw conveyor [12].
1.2.2 Screw Conveyors
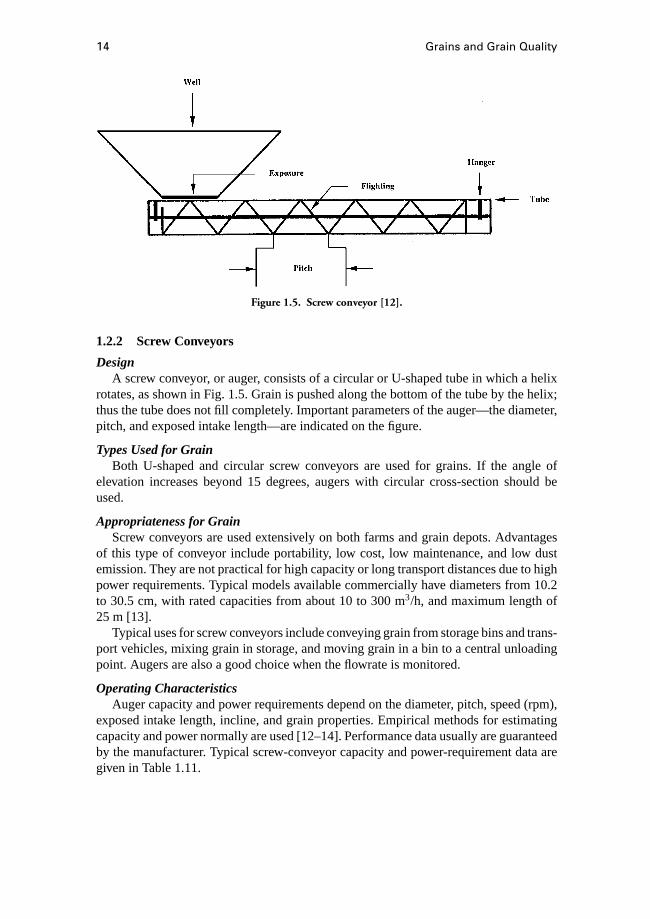
DesignA screw conveyor, or auger, consists of a circular or U-shaped tube in which a helix
rotates, as shown in Fig. 1.5. Grain is pushed along the bottom of the tube by the helix;thus the tube does not fill completely. Important parameters of the auger—the diameter,pitch, and exposed intake length—are indicated on the figure.
Types Used for GrainBoth U-shaped and circular screw conveyors are used for grains. If the angle of
elevation increases beyond 15 degrees, augers with circular cross-section should beused.
Appropriateness for GrainScrew conveyors are used extensively on both farms and grain depots. Advantages
of this type of conveyor include portability, low cost, low maintenance, and low dustemission. They are not practical for high capacity or long transport distances due to highpower requirements. Typical models available commercially have diameters from 10.2to 30.5 cm, with rated capacities from about 10 to 300 m3/h, and maximum length of25 m [13].
Typical uses for screw conveyors include conveying grain from storage bins and trans-port vehicles, mixing grain in storage, and moving grain in a bin to a central unloadingpoint. Augers are also a good choice when the flowrate is monitored.
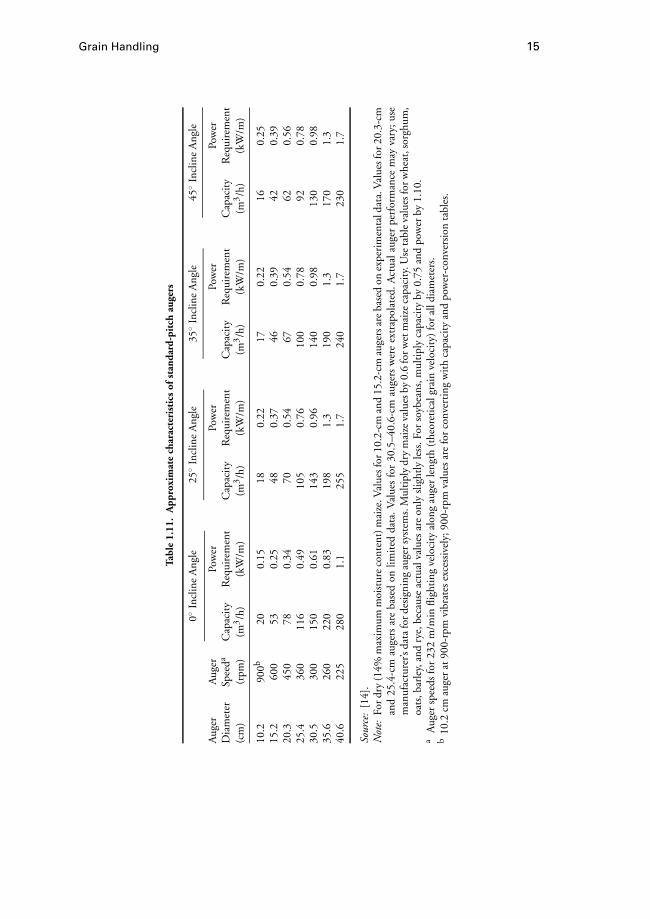
Operating CharacteristicsAuger capacity and power requirements depend on the diameter, pitch, speed (rpm),
exposed intake length, incline, and grain properties. Empirical methods for estimatingcapacity and power normally are used [12–14]. Performance data usually are guaranteedby the manufacturer. Typical screw-conveyor capacity and power-requirement data aregiven in Table 1.11.
Grain Handling 15
Tabl
e1.
11.
App
roxi
mat
ech
arac
teri
stic
sof
stan
dard
-pit
chau
gers
0◦In
clin
eA
ngle
25◦
Incl
ine
Ang
le35
◦In
clin
eA
ngle
45◦
Incl
ine
Ang
le
Aug
erA
uger
Pow
erPo
wer
Pow
erPo
wer
Dia
met
erSp
eeda
Cap
acit
yR
equi
rem
ent
Cap
acit
yR
equi
rem
ent
Cap
acit
yR
equi
rem
ent
Cap
acit
yR
equi
rem
ent
(cm
)(r
pm)
(m3/h
)(k
W/m
)(m
3/h
)(k
W/m
)(m
3/h
)(k
W/m
)(m
3/h
)(k
W/m
)
10.2
900b
200.
1518
0.22
170.
2216
0.25
15.2
600
530.
2548
0.37
460.
3942
0.39
20.3
450
780.
3470
0.54
670.
5462
0.56
25.4
360
116
0.49
105
0.76
100
0.78
920.
7830
.530
015
00.
6114
30.
9614
00.
9813
00.
9835
.626
022
00.
8319
81.
319
01.
317
01.
340
.622
528
01.
125
51.
724
01.
723
01.
7
Sour
ce:
[14]
.N
ote:
Ford
ry(1
4%m
axim
umm
oist
ure
cont
ent)
mai
ze.V
alue
sfor
10.2
-cm
and
15.2
-cm
auge
rsar
eba
sed
onex
peri
men
tald
ata.
Val
uesf
or20
.3-c
man
d25
.4-c
mau
gers
are
base
don
limit
edda
ta.V
alue
sfo
r30
.5–4
0.6-
cmau
gers
wer
eex
trap
olat
ed.A
ctua
laug
erpe
rfor
man
cem
ayva
ry;u
sem
anuf
actu
rer’s
data
ford
esig
ning
auge
rsys
tem
s.M
ulti
ply
dry
mai
zeva
lues
by0.
6fo
rwet
mai
zeca
paci
ty.U
seta
ble
valu
esfo
rwhe
at,s
orgh
um,
oats
,bar
ley,
and
rye,
beca
use
actu
alva
lues
are
only
slig
htly
less
.For
soyb
eans
,mul
tipl
yca
paci
tyby
0.75
and
pow
erby
1.10
.a
Aug
ersp
eeds
for
232
m/m
infli
ghti
ngve
loci
tyal
ong
auge
rle
ngth
(the
oret
ical
grai
nve
loci
ty)
for
alld
iam
eter
s.b
10.2
cmau
ger
at90
0-rp
mvi
brat
esex
cess
ivel
y;90
0-rp
mva
lues
are
for
conv
erti
ngw
ith
capa
city
and
pow
er-c
onve
rsio
nta
bles
.
16 Grains and Grain Quality
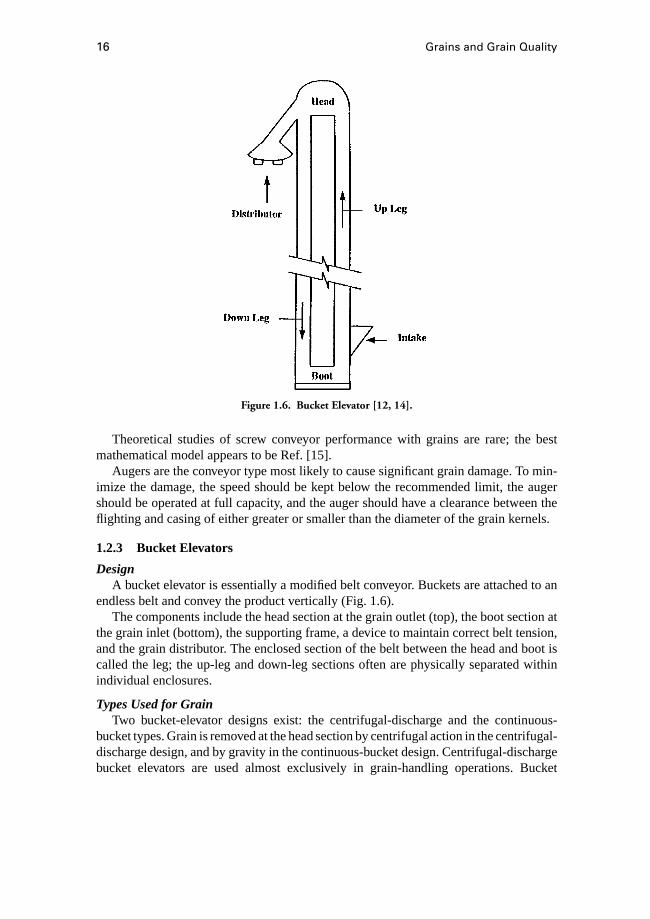
Figure 1.6. Bucket Elevator [12, 14].
Theoretical studies of screw conveyor performance with grains are rare; the bestmathematical model appears to be Ref. [15].
Augers are the conveyor type most likely to cause significant grain damage. To min-imize the damage, the speed should be kept below the recommended limit, the augershould be operated at full capacity, and the auger should have a clearance between theflighting and casing of either greater or smaller than the diameter of the grain kernels.
1.2.3 Bucket Elevators
DesignA bucket elevator is essentially a modified belt conveyor. Buckets are attached to an
endless belt and convey the product vertically (Fig. 1.6).The components include the head section at the grain outlet (top), the boot section at
the grain inlet (bottom), the supporting frame, a device to maintain correct belt tension,and the grain distributor. The enclosed section of the belt between the head and boot iscalled the leg; the up-leg and down-leg sections often are physically separated withinindividual enclosures.
Types Used for GrainTwo bucket-elevator designs exist: the centrifugal-discharge and the continuous-
bucket types. Grain is removed at the head section by centrifugal action in the centrifugal-discharge design, and by gravity in the continuous-bucket design. Centrifugal-dischargebucket elevators are used almost exclusively in grain-handling operations. Bucket

Grain Handling 17
elevators sometimes employ chains instead of belts as the conveying mechanism, but thechain design is not used for grains because a chain cannot operate at the speed requiredfor centrifugal discharge. The elevator intake may be on the up-leg or down-leg side, butthe up-leg side is recommended for high-capacity grain transport.
Appropriateness for GrainBucket elevators are an effective grain conveying system and typically are located
at the central point of a grain-handling system. Once grain is emptied from transportvehicles, it usually is elevated by a bucket elevator and distributed to a system component(e.g., storage or a drying system). Animal feed, meal, and wet and dry grain can beconveyed with bucket elevators at lower power requirements than with other conveyingsystems. Grain damage is less than damage caused by augers; it decreases at slower beltspeeds and full-bucket operation [16]. The initial cost of bucket elevators is greater thanthat of other conveying systems, but increased efficiency and convenience often justifythe cost.
Operating CharacteristicsThe capacity of bucket elevators is a function of the product density, belt speed,
bucket size, and bucket spacing. The power requirement depends on the capacity andproduct-elevating height, as shown in Table 1.12.
When sizing a bucket elevator, the size of the dump pit and the desired grain-unloadingcapacity should be considered [12]. An important operating parameter of centrifugal-discharge bucket elevators is the belt speed. The discharge features are determined bythe belt speed, product characteristics, and the elevator-component size [10]. The beltspeed should be above 80 m/h to achieve the desired discharge characteristics.
1.2.4 Pneumatic Conveyors
DesignA pneumatic conveying system introduces grain into a moving airstream, which
carries the grain to a single location or multiple locations. The main components includethe blower, the transport tubing, and the device to introduce the grain into the tubing at
Table 1.12. Typical bucket elevator data for maize
Capacity Belt Speed Bucket Size Bucket Spacing Power(m3/h) (m/min) (cm) (cm) (kW/m)
35 101 22.9× 12.7 30.5 0.09853 115 22.9× 12.7 22.9 0.14770 101 22.9× 12.7 15.2 0.19688 129 22.9× 12.7 15.2 0.245106 151 22.9× 12.7 15.2 0.294141 151 22.9× 15.2 16.5 0.392
Source: [17].Note: Data for 25.4-cm belt width; power requirements based on over-
all efficiency of 80% of shaft power.
18 Grains and Grain Quality
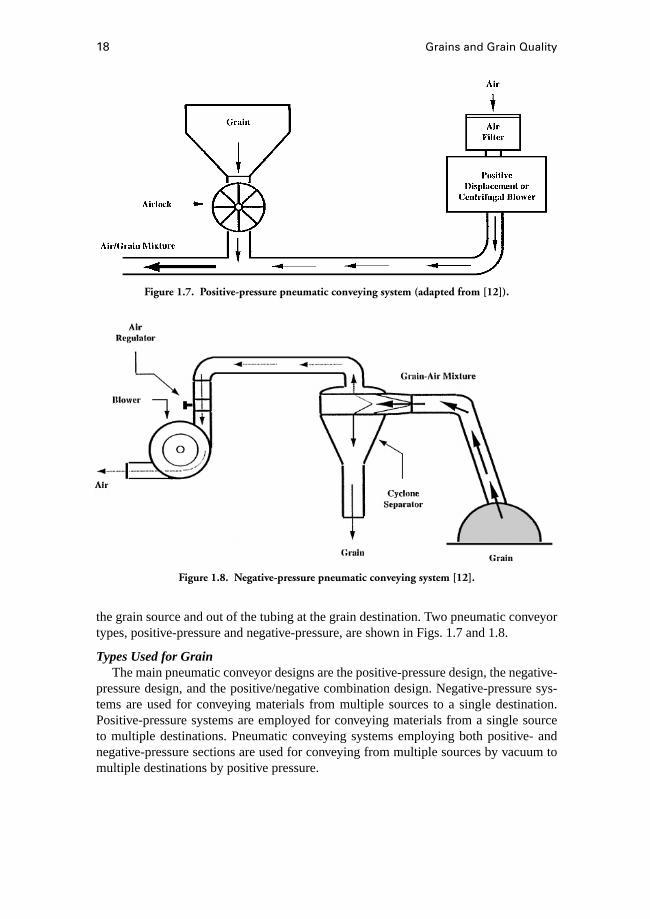
Figure 1.7. Positive-pressure pneumatic conveying system (adapted from [12]).
Figure 1.8. Negative-pressure pneumatic conveying system [12].
the grain source and out of the tubing at the grain destination. Two pneumatic conveyortypes, positive-pressure and negative-pressure, are shown in Figs. 1.7 and 1.8.
Types Used for GrainThe main pneumatic conveyor designs are the positive-pressure design, the negative-
pressure design, and the positive/negative combination design. Negative-pressure sys-tems are used for conveying materials from multiple sources to a single destination.Positive-pressure systems are employed for conveying materials from a single sourceto multiple destinations. Pneumatic conveying systems employing both positive- andnegative-pressure sections are used for conveying from multiple sources by vacuum tomultiple destinations by positive pressure.
Grain Handling 19
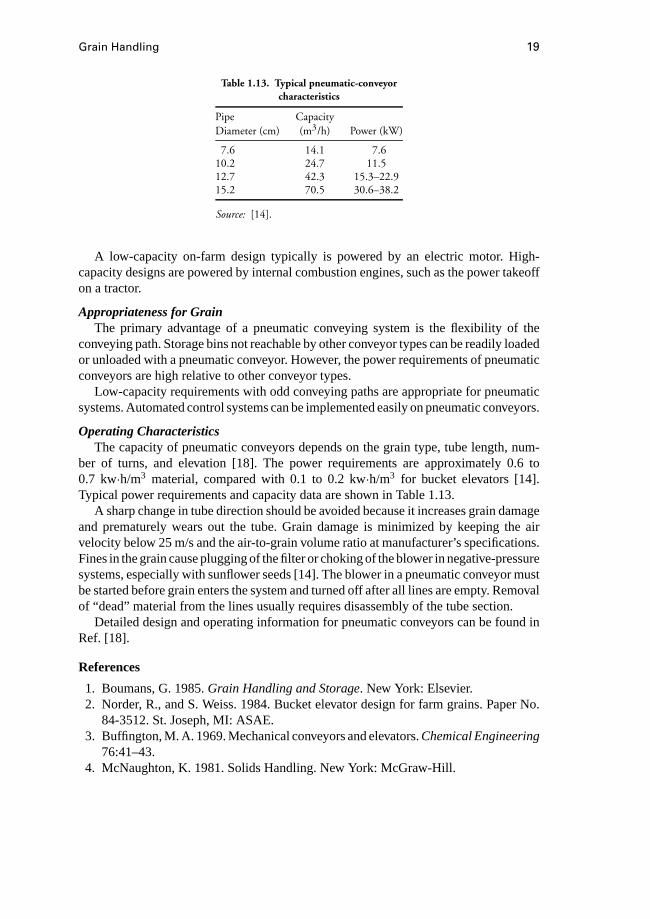
Table 1.13. Typical pneumatic-conveyorcharacteristics
Pipe CapacityDiameter (cm) (m3/h) Power (kW)
7.6 14.1 7.610.2 24.7 11.512.7 42.3 15.3–22.915.2 70.5 30.6–38.2
Source: [14].
A low-capacity on-farm design typically is powered by an electric motor. High-capacity designs are powered by internal combustion engines, such as the power takeoffon a tractor.
Appropriateness for GrainThe primary advantage of a pneumatic conveying system is the flexibility of the
conveying path. Storage bins not reachable by other conveyor types can be readily loadedor unloaded with a pneumatic conveyor. However, the power requirements of pneumaticconveyors are high relative to other conveyor types.
Low-capacity requirements with odd conveying paths are appropriate for pneumaticsystems. Automated control systems can be implemented easily on pneumatic conveyors.
Operating CharacteristicsThe capacity of pneumatic conveyors depends on the grain type, tube length, num-
ber of turns, and elevation [18]. The power requirements are approximately 0.6 to0.7 kw·h/m3 material, compared with 0.1 to 0.2 kw·h/m3 for bucket elevators [14].Typical power requirements and capacity data are shown in Table 1.13.
A sharp change in tube direction should be avoided because it increases grain damageand prematurely wears out the tube. Grain damage is minimized by keeping the airvelocity below 25 m/s and the air-to-grain volume ratio at manufacturer’s specifications.Fines in the grain cause plugging of the filter or choking of the blower in negative-pressuresystems, especially with sunflower seeds [14]. The blower in a pneumatic conveyor mustbe started before grain enters the system and turned off after all lines are empty. Removalof “dead” material from the lines usually requires disassembly of the tube section.
Detailed design and operating information for pneumatic conveyors can be found inRef. [18].
References
1. Boumans, G. 1985.Grain Handling and Storage. New York: Elsevier.2. Norder, R., and S. Weiss. 1984. Bucket elevator design for farm grains. Paper No.
84-3512. St. Joseph, MI: ASAE.3. Buffington, M. A. 1969. Mechanical conveyors and elevators.Chemical Engineering
76:41–43.4. McNaughton, K. 1981. Solids Handling. New York: McGraw-Hill.
20 Grains and Grain Quality
5. USDA. 1985. Table of Weights and Measures in Agricultural Statistics. Washington,DC.
6. Lorenzen, C. 1959. Moisture effect on granular friction of small grain. Paper No.59-416. St. Joseph, MI: ASAE.
7. Brubaker, J. E., and J. Pos. 1965. Determining the static coefficient of friction ofgrains on structural surfaces.Trans. ASAE8:53–55.
8. Colijn, H. 1978. Mechanical conveyors and elevators. Hightstown, NJ:ChemicalEngineering.
9. Hartsuiker, H. 1984. Horizontal conveying options and hydraulic machinery appli-cation. InRetrofitting and Constructing Grain Elevators for Increased Productivityand Safety, ed. R. C. Gordon. Washington, DC: National Grain and Feed Associa-tion.
10. Henderson, S. M., and M. E. Perry. 1976.Agricultural Process Engineering. West-port, CT: AVI.
11. Brook, B. 1971.Mechanics of Bulk Handling. Bath, UK: Butterworth & Co.12. Loewer, O. J., T. C. Bridges, and R. A. Bucklin. 1994.On-farm Drying and Storage
Systems. St. Joseph, MI: ASAE.13. Pierce, R. O., and B. A. McKenzie. 1984. Auger performance data summary for
grain. Paper No. 84-3514. St. Joseph, MI: ASAE.14. Midwest Plan Service. 1987.Grain Drying, Handling, and Storage Handbook
(MWPS-13). Ames, IA: Midwest Plan Service.15. Roberts, A. W., and A. H. Willis. 1962. Performance of grain augers.Proc. Instn.
Mech. Engrs176:165–194.16. Hall, G. E. 1974. Damage during handling of shelled corn and soybeans.Trans.
ASAE17:335–338.17. Brooker D. B., F. W. Bakker-Arkema, and C. W. Hall. 1992.Drying and Storage of
Grains and Oilseeds. New York: Van Nostrand Reinhold.18. Marcus, R. D., L. S. Leung, G. E. Klinzing, and F. Rizk. 1990.Pneumatic Conveying
of Solids. New York: Chapman and Hall.
1.3 Grain DryingQiang Liu, C. W. Cao, and F. W. Bakker-Arkema
1.3.1 Fundamentals
Grain drying is a process of simultaneous heat and moisture transfer. To adequatelyunderstand the operation of drying, the reader has to be acquainted with the basics ofpsychrometrics, equilibrium moisture content, airflow, and drying rate. These are thetopics briefly reviewed in this subsection.
PsychrometricsAir is the medium in which grain is dried. The major physical properties of air that
affect the drying rate of grains are the relative humidity or humidity ratio, the dry-bulbtemperature, the specific volume, and the enthalpy.
Grain Drying 21
The relative humidity(RH) of air is the ratio of the vapor pressure of the watermolecules in the air to the saturated vapor pressure at the same temperature. The relativehumidity usually is expressed as a percentage. A second term expressing the moisturecontent of the air is thehumidity ratio(W), the mass of water vapor per unit mass of dryair (kg/kg).
The dry-bulb temperature(T) of air is the temperature measured with an ordinarythermometer. If the termtemperatureis used without a prefix, dry-bulb temperature isimplied. Another temperature commonly used in grain drying is the wet-bulb temperature(it is measured by covering the bulb of a thermometer with a wet wick). Knowledge of thedry-bulb and wet-bulb temperatures allows rapid determination of the relative humidityof the air on a psychrometric chart (see Fig. 1.9). The temperatures of air are expressedin degrees Centigrade (◦C).
The specific volume(v) of moist air is the volume per unit mass of dry air and isexpressed in cubic meters per kilogram of dry air. The power required by the fan on adrying system is affected by the specific volume of the drying air.
Theenthalpy(h) of moist air is the energy content per unit mass of dry air above acertain reference temperature (usually 0◦C). It is denoted in kilojoules per kilogram ofdry air. Determination of the burner size in a dryer requires knowledge of the enthalpyvalues of the air before and after heating.
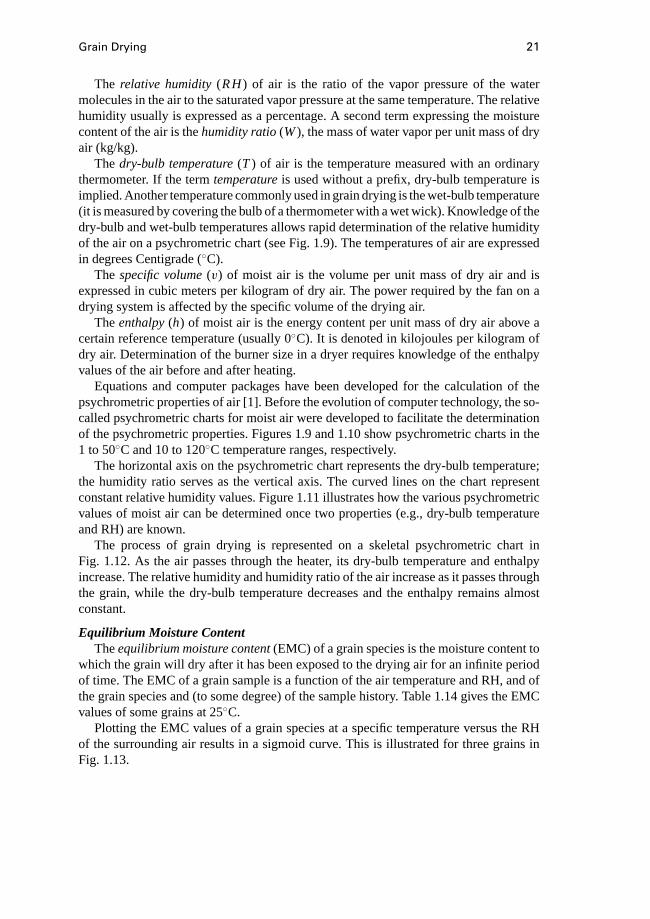
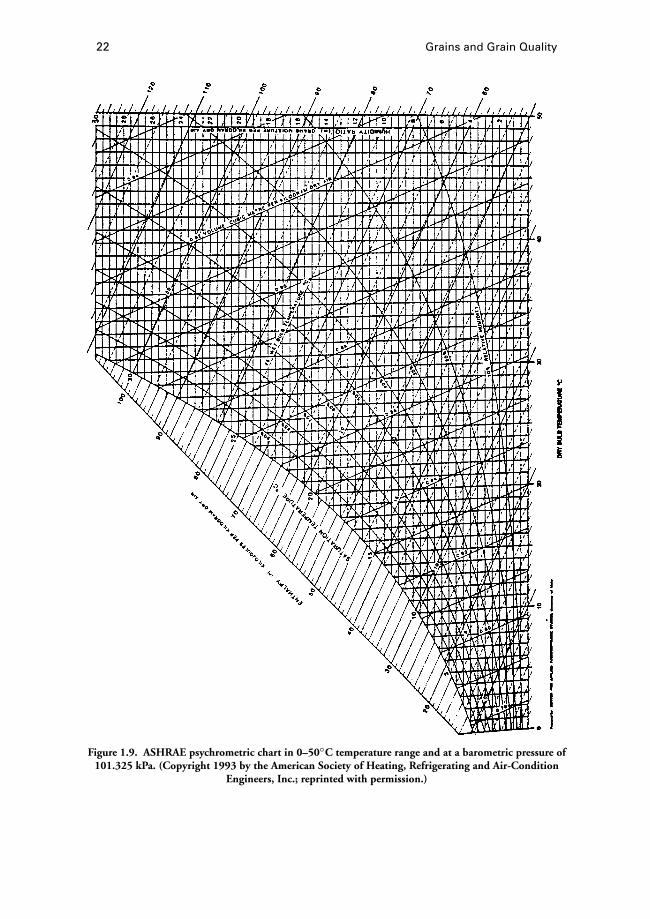
Equations and computer packages have been developed for the calculation of thepsychrometric properties of air [1]. Before the evolution of computer technology, the so-called psychrometric charts for moist air were developed to facilitate the determinationof the psychrometric properties. Figures 1.9 and 1.10 show psychrometric charts in the1 to 50◦C and 10 to 120◦C temperature ranges, respectively.
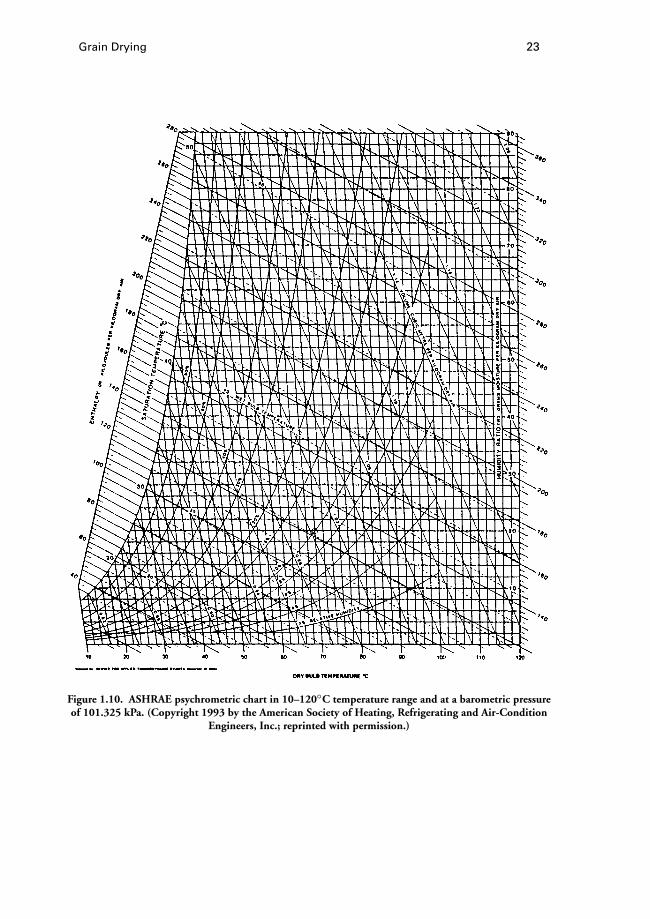
The horizontal axis on the psychrometric chart represents the dry-bulb temperature;the humidity ratio serves as the vertical axis. The curved lines on the chart representconstant relative humidity values. Figure 1.11 illustrates how the various psychrometricvalues of moist air can be determined once two properties (e.g., dry-bulb temperatureand RH) are known.
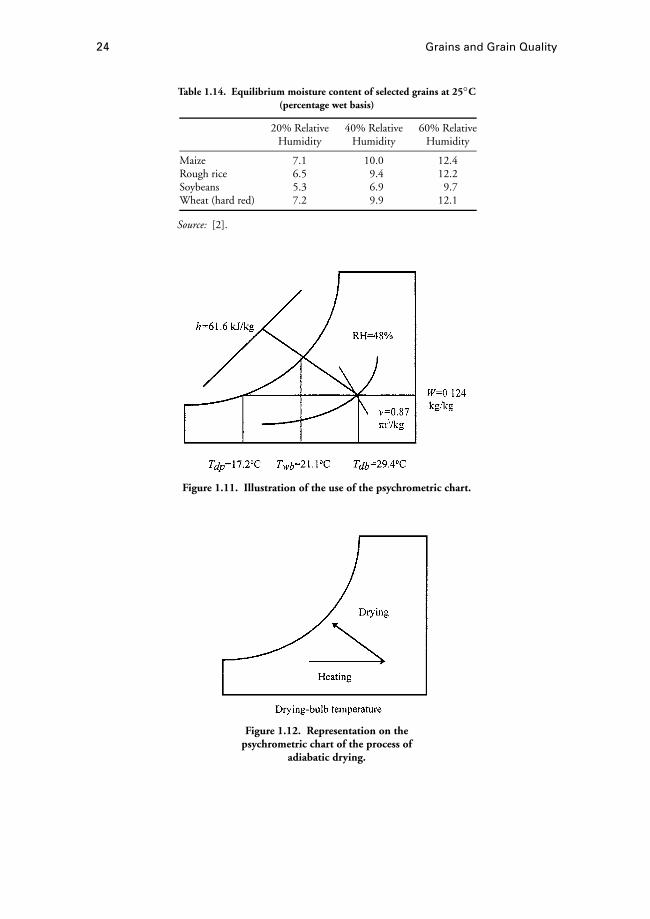
The process of grain drying is represented on a skeletal psychrometric chart inFig. 1.12. As the air passes through the heater, its dry-bulb temperature and enthalpyincrease. The relative humidity and humidity ratio of the air increase as it passes throughthe grain, while the dry-bulb temperature decreases and the enthalpy remains almostconstant.
Equilibrium Moisture ContentTheequilibrium moisture content(EMC) of a grain species is the moisture content to
which the grain will dry after it has been exposed to the drying air for an infinite periodof time. The EMC of a grain sample is a function of the air temperature and RH, and ofthe grain species and (to some degree) of the sample history. Table 1.14 gives the EMCvalues of some grains at 25◦C.
Plotting the EMC values of a grain species at a specific temperature versus the RHof the surrounding air results in a sigmoid curve. This is illustrated for three grains inFig. 1.13.
22 Grains and Grain Quality
Figure 1.9. ASHRAE psychrometric chart in 0–50◦C temperature range and at a barometric pressure of101.325 kPa. (Copyright 1993 by the American Society of Heating, Refrigerating and Air-Condition
Engineers, Inc.; reprinted with permission.)
Grain Drying 23
Figure 1.10. ASHRAE psychrometric chart in 10–120◦C temperature range and at a barometric pressureof 101.325 kPa. (Copyright 1993 by the American Society of Heating, Refrigerating and Air-Condition
Engineers, Inc.; reprinted with permission.)
24 Grains and Grain Quality
Table 1.14. Equilibrium moisture content of selected grains at 25◦C(percentage wet basis)
20% Relative 40% Relative 60% RelativeHumidity Humidity Humidity
Maize 7.1 10.0 12.4Rough rice 6.5 9.4 12.2Soybeans 5.3 6.9 9.7Wheat (hard red) 7.2 9.9 12.1
Source: [2].
Figure 1.11. Illustration of the use of the psychrometric chart.
Figure 1.12. Representation on thepsychrometric chart of the process of
adiabatic drying.

Grain Drying 25
Figure 1.13. Equilibrium moisture-content curves ofhard wheat, maize, and soybeans at 16.7◦C. (Source: [1]).
The relationship between the EMC and the air conditions can be represented by thefollowing empirical EMC equation:
Meq = a− b ln[−(T + c) ln RH], (1.1)
wherea, b, andc are product constants,T is the temperature (◦C), RH is the relativehumidity (decimal), andMeq is the equilibrium moisture constant (decimal dry basis).Table 1.15 contains the product constants in Eq. (1.1) for selected grains.
AirflowAs grain kernels lose moisture during the drying process, the evaporated water is
carried by a flow of air from the grain bed in the form of water vapor. To properlydesign and operate a grain-drying system, the principles of air movement must be under-stood, especially as it relates to static pressure, fan characteristics, and system operatingcondition.
Table 1.15. Product constants for theequilibrium moisture content equation
(Eq. [1.1]) of selected grains
a b c
Maize 0.339 0.059 30.205Rough rice 0.294 0.046 35.703Soybeans 0.416 0.072 100.288Wheat (hard red) 0.356 0.057 50.998
Source: [2].
26 Grains and Grain Quality
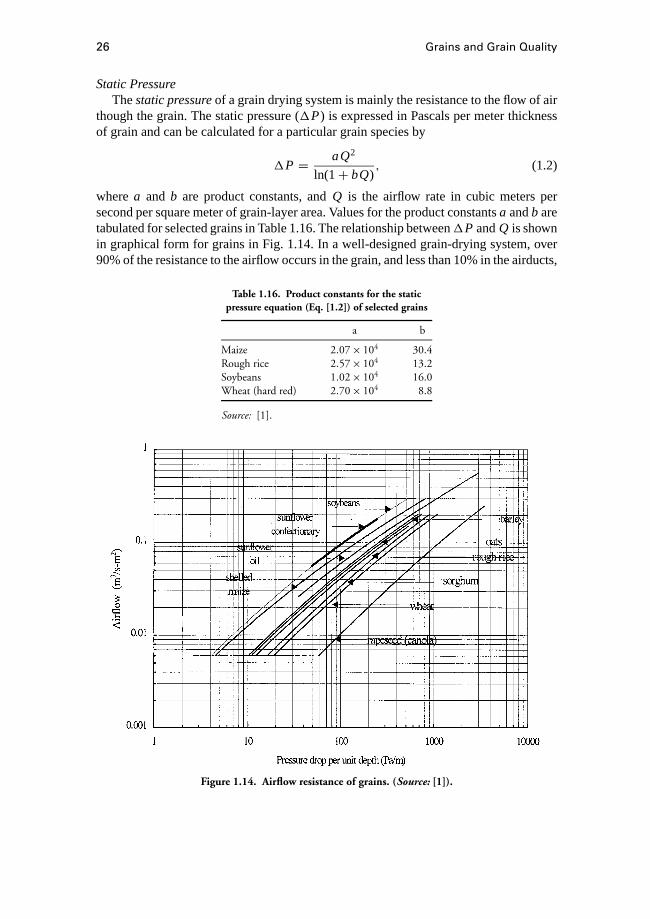
Static PressureThestatic pressureof a grain drying system is mainly the resistance to the flow of air
though the grain. The static pressure (1P) is expressed in Pascals per meter thicknessof grain and can be calculated for a particular grain species by
1P = aQ2
ln(1+ bQ), (1.2)
wherea and b are product constants, andQ is the airflow rate in cubic meters persecond per square meter of grain-layer area. Values for the product constantsa andb aretabulated for selected grains in Table 1.16. The relationship between1P andQ is shownin graphical form for grains in Fig. 1.14. In a well-designed grain-drying system, over90% of the resistance to the airflow occurs in the grain, and less than 10% in the airducts,
Table 1.16. Product constants for the staticpressure equation (Eq. [1.2]) of selected grains
a b
Maize 2.07× 10⁴ 30.4Rough rice 2.57× 10⁴ 13.2Soybeans 1.02× 10⁴ 16.0Wheat (hard red) 2.70× 10⁴ 8.8
Source: [1].
Figure 1.14. Airflow resistance of grains. (Source: [1]).
Grain Drying 27
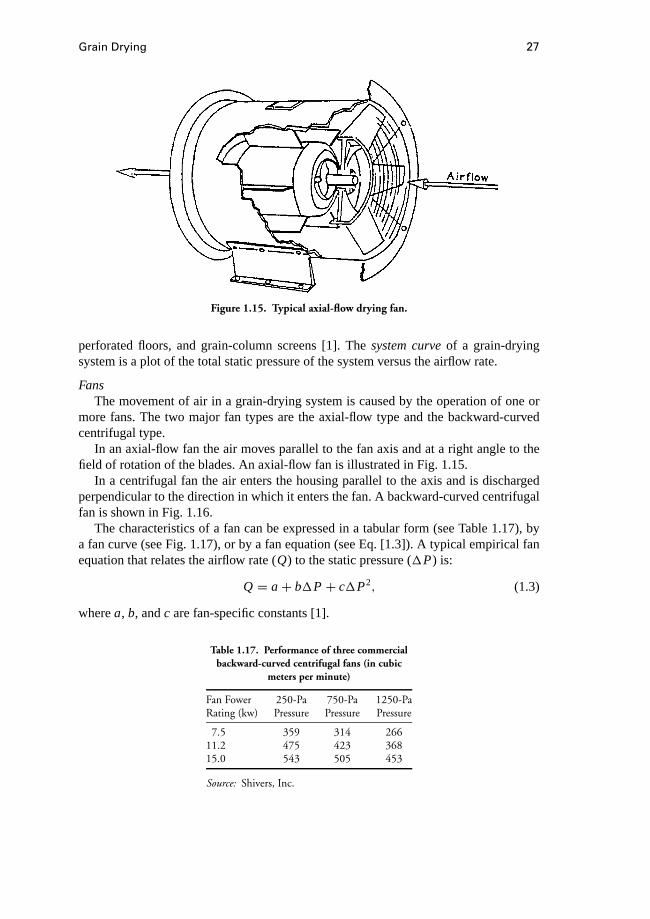
Figure 1.15. Typical axial-flow drying fan.
perforated floors, and grain-column screens [1]. Thesystem curveof a grain-dryingsystem is a plot of the total static pressure of the system versus the airflow rate.
FansThe movement of air in a grain-drying system is caused by the operation of one or
more fans. The two major fan types are the axial-flow type and the backward-curvedcentrifugal type.
In an axial-flow fan the air moves parallel to the fan axis and at a right angle to thefield of rotation of the blades. An axial-flow fan is illustrated in Fig. 1.15.
In a centrifugal fan the air enters the housing parallel to the axis and is dischargedperpendicular to the direction in which it enters the fan. A backward-curved centrifugalfan is shown in Fig. 1.16.
The characteristics of a fan can be expressed in a tabular form (see Table 1.17), bya fan curve (see Fig. 1.17), or by a fan equation (see Eq. [1.3]). A typical empirical fanequation that relates the airflow rate (Q) to the static pressure (1P) is:
Q = a+ b1P + c1P2, (1.3)
wherea, b, andc are fan-specific constants [1].
Table 1.17. Performance of three commercialbackward-curved centrifugal fans (in cubic
meters per minute)
Fan Fower 250-Pa 750-Pa 1250-PaRating (kw) Pressure Pressure Pressure
7.5 359 314 26611.2 475 423 36815.0 543 505 453
Source: Shivers, Inc.

28 Grains and Grain Quality
Figure 1.16. Typical centrifugal drying fan.
Figure 1.17. Operating conditions for an in-binwheat-drying system and a maize-drying system.
Axial-flow fans usually deliver higher airflow rates than centrifugal fans of equalpower at static pressures below 1000 Pa. If a grain system operates at static pressuresabove 1200 Pa, a centrifugal fan delivers the higher airflow rate. An axial-flow fan isnoisier but less expensive than an equivalent centrifugal fan.
System Operating ConditionIf the system curve and the fan curve of a grain-drying system are plotted on the same
graph, theoperating conditionof the fan/drying system is located at the intersection ofthe two curves. This is illustrated in Fig. 1.17 for an in-bin system in which both maize
Grain Drying 29
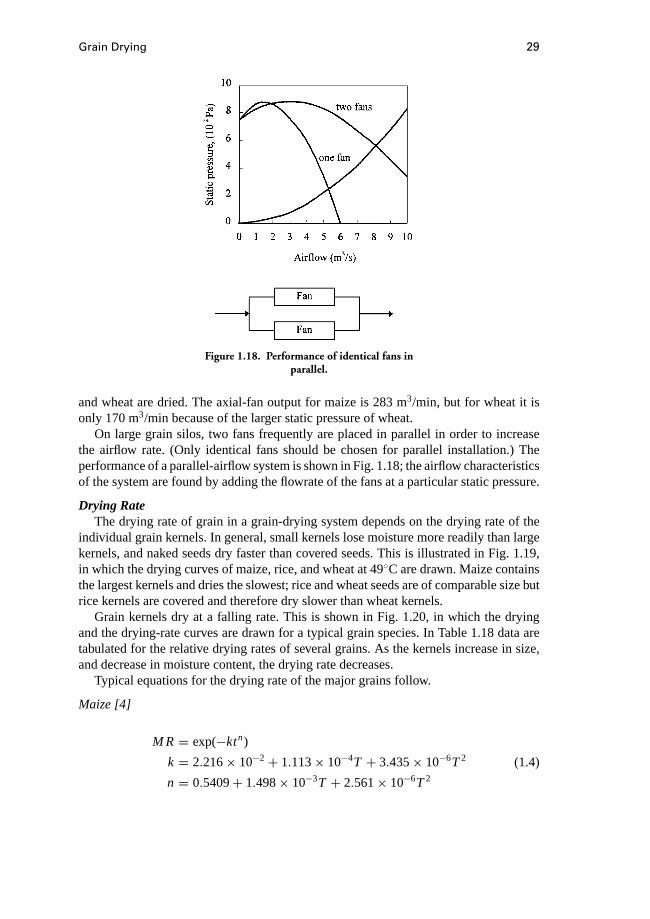
Figure 1.18. Performance of identical fans inparallel.
and wheat are dried. The axial-fan output for maize is 283 m3/min, but for wheat it isonly 170 m3/min because of the larger static pressure of wheat.
On large grain silos, two fans frequently are placed in parallel in order to increasethe airflow rate. (Only identical fans should be chosen for parallel installation.) Theperformance of a parallel-airflow system is shown in Fig. 1.18; the airflow characteristicsof the system are found by adding the flowrate of the fans at a particular static pressure.
Drying RateThe drying rate of grain in a grain-drying system depends on the drying rate of the
individual grain kernels. In general, small kernels lose moisture more readily than largekernels, and naked seeds dry faster than covered seeds. This is illustrated in Fig. 1.19,in which the drying curves of maize, rice, and wheat at 49◦C are drawn. Maize containsthe largest kernels and dries the slowest; rice and wheat seeds are of comparable size butrice kernels are covered and therefore dry slower than wheat kernels.
Grain kernels dry at a falling rate. This is shown in Fig. 1.20, in which the dryingand the drying-rate curves are drawn for a typical grain species. In Table 1.18 data aretabulated for the relative drying rates of several grains. As the kernels increase in size,and decrease in moisture content, the drying rate decreases.
Typical equations for the drying rate of the major grains follow.
Maize [4]
M R = exp(−ktn)
k = 2.216× 10⁻²+ 1.113× 10⁻⁴T + 3.435× 10⁻⁶T2 (1.4)
n = 0.5409+ 1.498× 10⁻³T + 2.561× 10⁻⁶T2

30 Grains and Grain Quality
Table 1.18. Relative drying rates of selected grains
22% w.b. Moisture 18% w.b. Moisture 14% w.b. MoistureContent Content Content
Peas 95 35 15Maize 135 50 15Wheat 210 100a 35Canola — 1150 500
Source: [3].a The drying rate of wheat at 18% moisture content is selected as 100.
Figure 1.19. Comparison of drying rates of dent maize,medium rice, and soft wheat at 49◦C.
Figure 1.20. Grain drying duringfalling-rate period.
Grain Drying 31
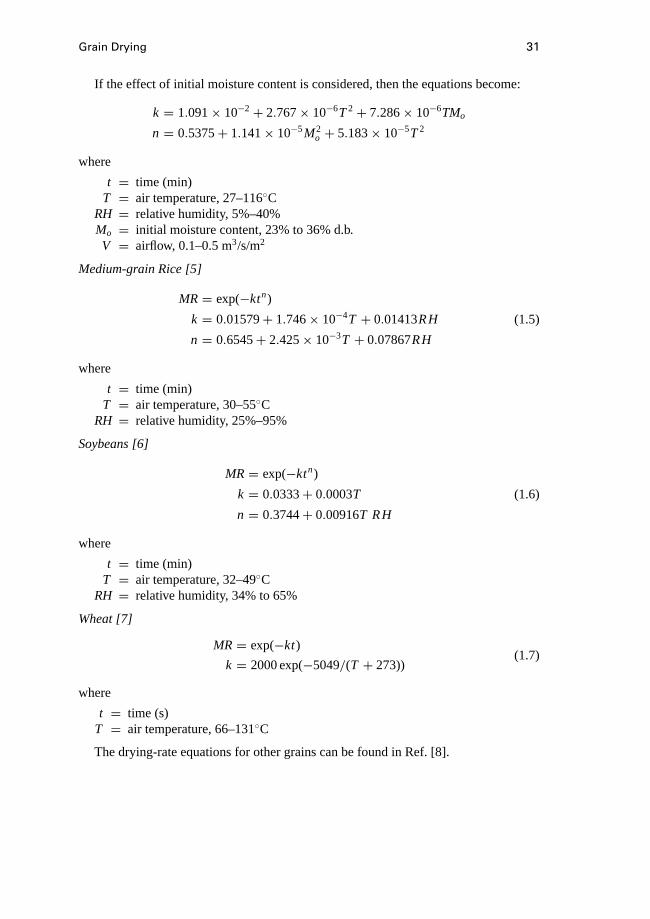
If the effect of initial moisture content is considered, then the equations become:
k = 1.091× 10⁻²+ 2.767× 10⁻⁶T2+ 7.286× 10⁻⁶TMo
n = 0.5375+ 1.141× 10⁻⁵M2o + 5.183× 10⁻⁵T2
where
t = time (min)T = air temperature, 27–116◦C
RH = relative humidity, 5%–40%Mo = initial moisture content, 23% to 36% d.b.V = airflow, 0.1–0.5 m3/s/m2
Medium-grain Rice [5]
MR= exp(−ktn)
k = 0.01579+ 1.746× 10⁻⁴T + 0.01413RH (1.5)
n = 0.6545+ 2.425× 10⁻³T + 0.07867RH
where
t = time (min)T = air temperature, 30–55◦C
RH = relative humidity, 25%–95%
Soybeans [6]
MR= exp(−ktn)
k = 0.0333+ 0.0003T (1.6)
n = 0.3744+ 0.00916T RH
where
t = time (min)T = air temperature, 32–49◦C
RH = relative humidity, 34% to 65%
Wheat [7]
MR= exp(−kt)
k = 2000 exp(−5049/(T + 273))(1.7)
where
t = time (s)T = air temperature, 66–131◦C
The drying-rate equations for other grains can be found in Ref. [8].
32 Grains and Grain Quality
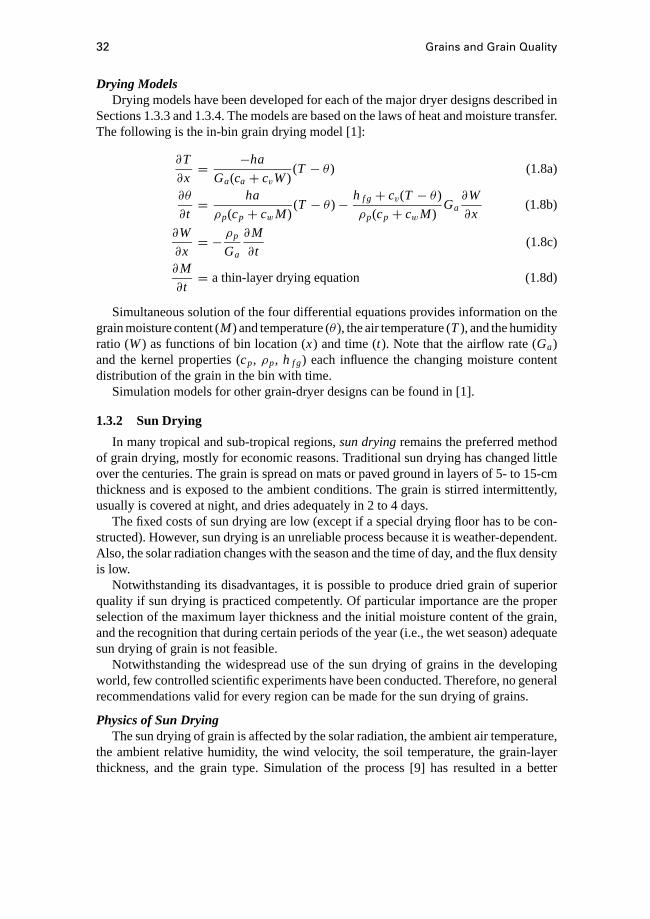
Drying ModelsDrying models have been developed for each of the major dryer designs described in
Sections 1.3.3 and 1.3.4. The models are based on the laws of heat and moisture transfer.The following is the in-bin grain drying model [1]:
∂T
∂x= −ha
Ga(ca + cvW)(T − θ ) (1.8a)
∂θ
∂t= ha
ρp(cp + cwM)(T − θ )− h f g + cv(T − θ )
ρp(cp + cwM)Ga∂W
∂x(1.8b)
∂W
∂x= − ρp
Ga
∂M
∂t(1.8c)
∂M
∂t= a thin-layer drying equation (1.8d)
Simultaneous solution of the four differential equations provides information on thegrain moisture content (M) and temperature (θ ), the air temperature (T), and the humidityratio (W) as functions of bin location (x) and time (t). Note that the airflow rate (Ga)and the kernel properties (cp, ρp, h f g) each influence the changing moisture contentdistribution of the grain in the bin with time.
Simulation models for other grain-dryer designs can be found in [1].
1.3.2 Sun Drying
In many tropical and sub-tropical regions,sun dryingremains the preferred methodof grain drying, mostly for economic reasons. Traditional sun drying has changed littleover the centuries. The grain is spread on mats or paved ground in layers of 5- to 15-cmthickness and is exposed to the ambient conditions. The grain is stirred intermittently,usually is covered at night, and dries adequately in 2 to 4 days.
The fixed costs of sun drying are low (except if a special drying floor has to be con-structed). However, sun drying is an unreliable process because it is weather-dependent.Also, the solar radiation changes with the season and the time of day, and the flux densityis low.
Notwithstanding its disadvantages, it is possible to produce dried grain of superiorquality if sun drying is practiced competently. Of particular importance are the properselection of the maximum layer thickness and the initial moisture content of the grain,and the recognition that during certain periods of the year (i.e., the wet season) adequatesun drying of grain is not feasible.
Notwithstanding the widespread use of the sun drying of grains in the developingworld, few controlled scientific experiments have been conducted. Therefore, no generalrecommendations valid for every region can be made for the sun drying of grains.
Physics of Sun DryingThe sun drying of grain is affected by the solar radiation, the ambient air temperature,
the ambient relative humidity, the wind velocity, the soil temperature, the grain-layerthickness, and the grain type. Simulation of the process [9] has resulted in a better

Grain Drying 33
Figure 1.21. Average moisture content during sun drying ofrice at different initial moisture contents.
Figure 1.22. Rice-grain moisture content during sundrying with grain-bed depths of 5, 8, 10, and 15 cm.
understanding of sun drying, in particular of the effects of initial moisture content,layer thickness, and season on the drying process (see Figs. 1.21–1.23). The specificinformation in the three figures pertains to Jakarta (Indonesia), but the trends are validfor other locations.
1.3.3 In-store Drying
In-store (i.e., in-bin) grain drying commonly is practiced on the farm and usually em-ploys ambient air or slightly heated air as the drying medium. The major in-store dryingmethods are illustrated in Fig. 1.24 [1]. The objective of in-store drying is to decrease themoisture content of the grain at a rate that will prevent product deterioration. Both theminimum drying rate and the maximum final moisture content are locality-dependent;

34 Grains and Grain Quality
Figure 1.23. Moisture content of rice during sundrying in July and March.
that is, in hot and humid regions the drying rate of wet grain has to be higher, and thefinal moisture content lower, than in cold and dry areas.
Ambient/Low-temperature DryingDrying a bin of grain with ambient air is possible if the initial moisture content of
the grain is not excessive, the average daily relative humidity of the ambient air is nottoo high, and the airflow rate is sufficient. The recommended maximum initial moisturecontents of maize and wheat, and the minimum airflow rates, for ambient-air dryingunder midwestern U.S. conditions are listed in Table 1.19. In the tropics, the initialmoistures are lower and the required airflow rates are higher. The reader should obtainthe exact values for a locality from the regional extension service.
In ambient-airlayer drying, a bin is filled in stages; a wet layer is added only after thelower grain layers have been partially dried. Instir drying, one or more vertical stirringaugers slowly move the dried grain from the bottom of the bin to the top, and the topgrain layers to the bottom of the bin. Layer drying and stir drying require lower airflowrates and permit higher initial moisture contents than ambient-air drying.
In periods of zero drying potential during rain or high humidity, the relative humid-ity of the air can be decreased to the desired level (i.e., 60%–70%) by increasing the
Table 1.19. Characteristics ofambient air drying of several grains
in the midwestern United States
Moisture Airflow(% w.b.) (m3/m3·min)
Maize 20 2.4Wheat 18 1.6Wheat 16 0.8
Source: [1].
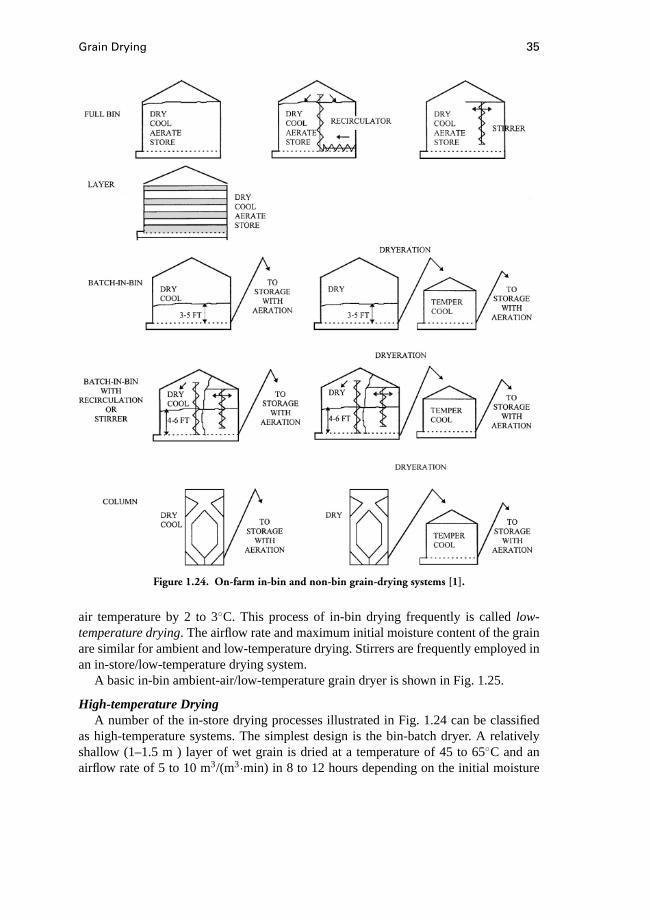
Grain Drying 35
Figure 1.24. On-farm in-bin and non-bin grain-drying systems [1].
air temperature by 2 to 3◦C. This process of in-bin drying frequently is calledlow-temperature drying. The airflow rate and maximum initial moisture content of the grainare similar for ambient and low-temperature drying. Stirrers are frequently employed inan in-store/low-temperature drying system.
A basic in-bin ambient-air/low-temperature grain dryer is shown in Fig. 1.25.
High-temperature DryingA number of the in-store drying processes illustrated in Fig. 1.24 can be classified
as high-temperature systems. The simplest design is the bin-batch dryer. A relativelyshallow (1–1.5 m ) layer of wet grain is dried at a temperature of 45 to 65◦C and anairflow rate of 5 to 10 m3/(m3·min) in 8 to 12 hours depending on the initial moisture

36 Grains and Grain Quality
Figure 1.25. In-bin grain-drying system.
content. A major disadvantage of a bin-batch system is the overdrying of the bottomgrain layers. Cooling of the grain requires 1 to 2 hours.
In the roof bin-batch dryer, the drying floor is elevated in the bin; the grain depthis limited to 0.5 m. The wet grain is partially dried at a relatively high temperature(60–80◦C) and airflow rate (10–15 m3/(m3·min) before being dumped to the bottom ofthe bin, where the final drying and cooling of the grain occurs. The roof bin-batch systemis a versatile system employed mainly for maize.
The in-bin counterflow drying process can operate as a grain-recirculating system, oras a continuous-flow system. Grain is continuously or intermittently loaded into a dryingbin and is intermittently removed in thin layers by a tapered auger located at the bottomof the bin. The partially dried, hot grain is either recirculated to the top of the bin ormoved to a second bin for slow in-bin final drying and cooling. The automatic natureof the process and the capability to produce high-quality grain at fairly high capacitieshave contributed to its commercial success. The airflow rate, bed depth, and drying-air temperature in in-bin counterflow dryers are similar to those in bin-batch systems;however, the in-bin counterflow systems produce dried grain of fairly uniform moisturegradient while bin-batch dryers do not.
Combination drying is a process in which high-temperature in-store or high-capacitydrying is followed by low-temperature, low-capacity in-bin drying and cooling (seeFig. 1.24). Combination drying mainly is used for maize and rice; it is also called, a
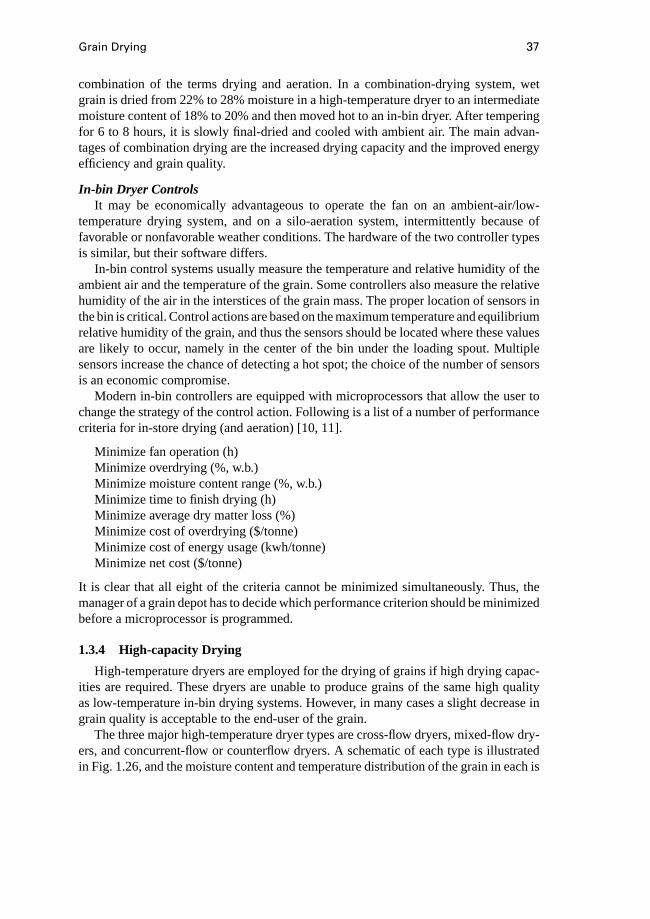
Grain Drying 37
combination of the terms drying and aeration. In a combination-drying system, wetgrain is dried from 22% to 28% moisture in a high-temperature dryer to an intermediatemoisture content of 18% to 20% and then moved hot to an in-bin dryer. After temperingfor 6 to 8 hours, it is slowly final-dried and cooled with ambient air. The main advan-tages of combination drying are the increased drying capacity and the improved energyefficiency and grain quality.
In-bin Dryer ControlsIt may be economically advantageous to operate the fan on an ambient-air/low-
temperature drying system, and on a silo-aeration system, intermittently because offavorable or nonfavorable weather conditions. The hardware of the two controller typesis similar, but their software differs.
In-bin control systems usually measure the temperature and relative humidity of theambient air and the temperature of the grain. Some controllers also measure the relativehumidity of the air in the interstices of the grain mass. The proper location of sensors inthe bin is critical. Control actions are based on the maximum temperature and equilibriumrelative humidity of the grain, and thus the sensors should be located where these valuesare likely to occur, namely in the center of the bin under the loading spout. Multiplesensors increase the chance of detecting a hot spot; the choice of the number of sensorsis an economic compromise.
Modern in-bin controllers are equipped with microprocessors that allow the user tochange the strategy of the control action. Following is a list of a number of performancecriteria for in-store drying (and aeration) [10, 11].
Minimize fan operation (h)Minimize overdrying (%, w.b.)Minimize moisture content range (%, w.b.)Minimize time to finish drying (h)Minimize average dry matter loss (%)Minimize cost of overdrying ($/tonne)Minimize cost of energy usage (kwh/tonne)Minimize net cost ($/tonne)
It is clear that all eight of the criteria cannot be minimized simultaneously. Thus, themanager of a grain depot has to decide which performance criterion should be minimizedbefore a microprocessor is programmed.
1.3.4 High-capacity Drying
High-temperature dryers are employed for the drying of grains if high drying capac-ities are required. These dryers are unable to produce grains of the same high qualityas low-temperature in-bin drying systems. However, in many cases a slight decrease ingrain quality is acceptable to the end-user of the grain.
The three major high-temperature dryer types are cross-flow dryers, mixed-flow dry-ers, and concurrent-flow or counterflow dryers. A schematic of each type is illustratedin Fig. 1.26, and the moisture content and temperature distribution of the grain in each is
38 Grains and Grain Quality
Figure 1.26. Schematics of the four major types ofhigh-temperature grain dryers: cross-flow, counterflow,
concurrent-flow, and mixed-flow.
shown in Fig. 1.27. The air and grain move inperpendiculardirections in crossflow dry-ers, in thesamedirection in concurrent-flow dryers, inoppositedirection in counterflowcoolers, and in acombinationof cross-flow, concurrent-flow, and counterflow directionsin mixed-flow dryers. In theory, the variation in moisture content and temperature, andthus in grain quality, in a sample of dried grain is substantial in cross-flow dryers, lessin mixed-flow dryers, and almost nonexistent in concurrent-flow or counterflow dryers.

Grain Drying 39
Figure 1.27. Moisture and temperature changes duringcross-flow drying (a), concurrent-flow drying (b), counterflow
drying (c), and mixed-flow drying (d).
High-temperature dryers contain a cooling section in which the hot grain after movingthrough the drying section is reduced in temperature to within 3 to 5◦C of the ambienttemperature. Grain remains in the cooling section of a dryer about half as long as in thedrying section.
Cross-flow DryersFigure 1.28 illustrates a cross-flow grain dryer. The wet grain flows by gravity from a
wet holding bin through screened grain columns surrounding the plenum. A heater-fan
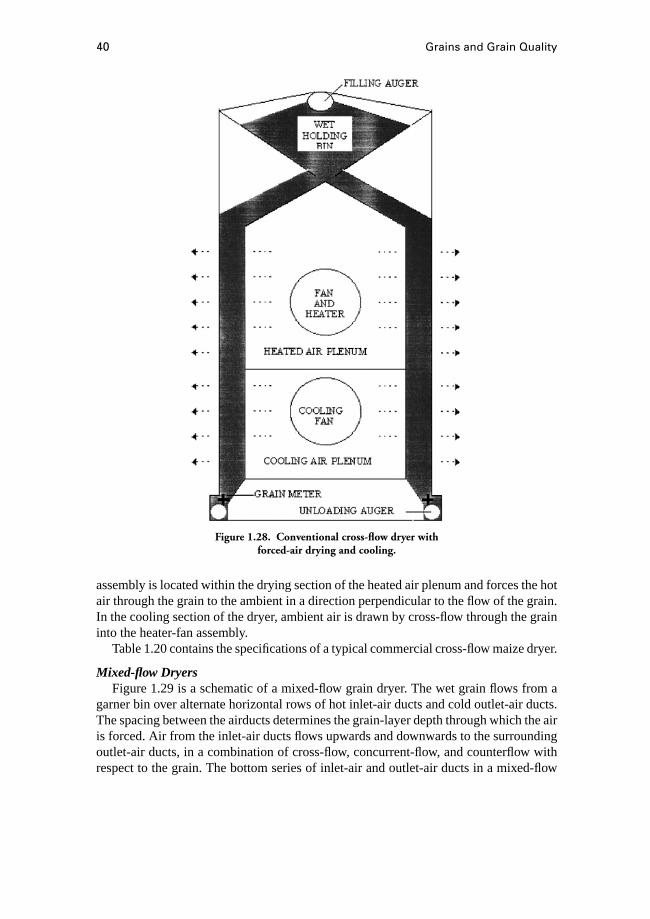
40 Grains and Grain Quality
Figure 1.28. Conventional cross-flow dryer withforced-air drying and cooling.
assembly is located within the drying section of the heated air plenum and forces the hotair through the grain to the ambient in a direction perpendicular to the flow of the grain.In the cooling section of the dryer, ambient air is drawn by cross-flow through the graininto the heater-fan assembly.
Table 1.20 contains the specifications of a typical commercial cross-flow maize dryer.
Mixed-flow DryersFigure 1.29 is a schematic of a mixed-flow grain dryer. The wet grain flows from a
garner bin over alternate horizontal rows of hot inlet-air ducts and cold outlet-air ducts.The spacing between the airducts determines the grain-layer depth through which the airis forced. Air from the inlet-air ducts flows upwards and downwards to the surroundingoutlet-air ducts, in a combination of cross-flow, concurrent-flow, and counterflow withrespect to the grain. The bottom series of inlet-air and outlet-air ducts in a mixed-flow
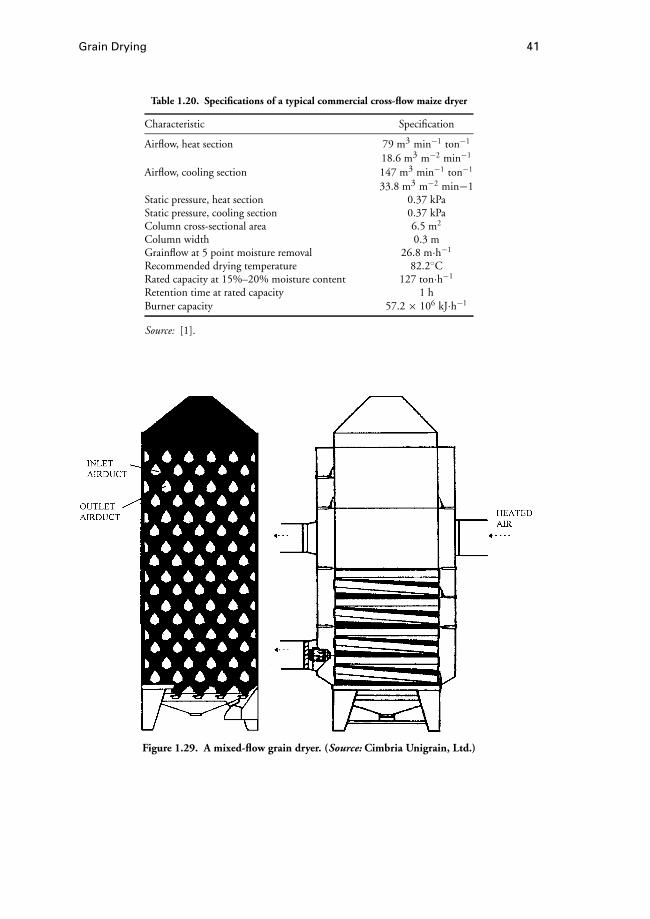
Grain Drying 41
Table 1.20. Specifications of a typical commercial cross-flow maize dryer
Characteristic Specification
Airflow, heat section 79 m3 min−1 ton−1
18.6 m3 m−2 min−1
Airflow, cooling section 147 m3 min−1 ton−1
33.8 m3 m−2 min−1Static pressure, heat section 0.37 kPaStatic pressure, cooling section 0.37 kPaColumn cross-sectional area 6.5 m2
Column width 0.3 mGrainflow at 5 point moisture removal 26.8 m·h−1
Recommended drying temperature 82.2◦CRated capacity at 15%–20% moisture content 127 ton·h−1
Retention time at rated capacity 1 hBurner capacity 57.2 × 10⁶ kJ·h−1
Source: [1].
Figure 1.29. A mixed-flow grain dryer. (Source: Cimbria Unigrain, Ltd.)
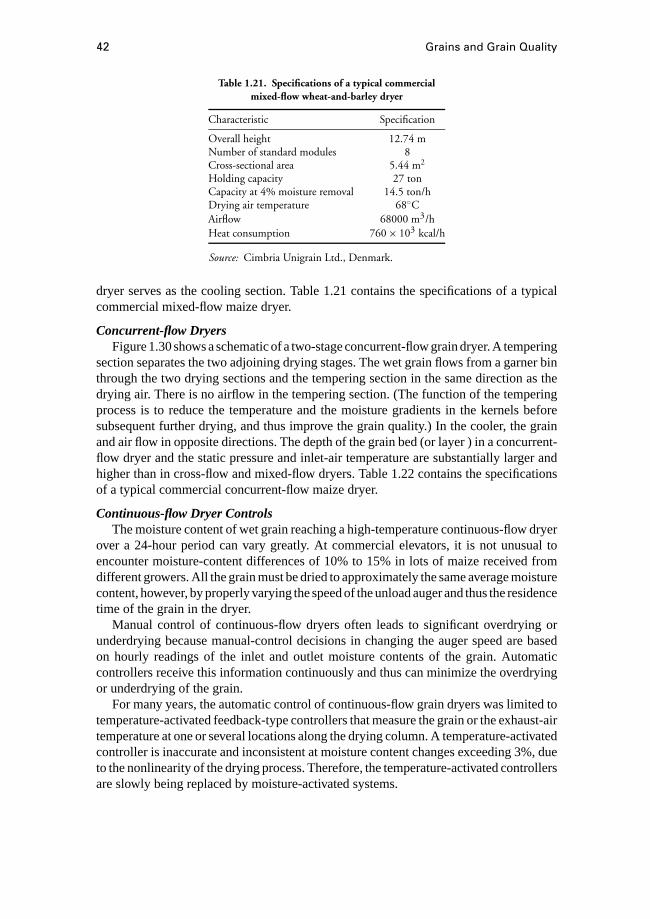
42 Grains and Grain Quality
Table 1.21. Specifications of a typical commercialmixed-flow wheat-and-barley dryer
Characteristic Specification
Overall height 12.74 mNumber of standard modules 8Cross-sectional area 5.44 m2
Holding capacity 27 tonCapacity at 4% moisture removal 14.5 ton/hDrying air temperature 68◦CAirflow 68000 m3/hHeat consumption 760× 103 kcal/h
Source: Cimbria Unigrain Ltd., Denmark.
dryer serves as the cooling section. Table 1.21 contains the specifications of a typicalcommercial mixed-flow maize dryer.
Concurrent-flow DryersFigure 1.30 shows aschematic of a two-stage concurrent-flowgrain dryer.A tempering
section separates the two adjoining drying stages. The wet grain flows from a garner binthrough the two drying sections and the tempering section in the same direction as thedrying air. There is no airflow in the tempering section. (The function of the temperingprocess is to reduce the temperature and the moisture gradients in the kernels beforesubsequent further drying, and thus improve the grain quality.) In the cooler, the grainand air flow in opposite directions. The depth of the grain bed (or layer ) in a concurrent-flow dryer and the static pressure and inlet-air temperature are substantially larger andhigher than in cross-flow and mixed-flow dryers. Table 1.22 contains the specificationsof a typical commercial concurrent-flow maize dryer.
Continuous-flow Dryer ControlsThe moisture content of wet grain reaching a high-temperature continuous-flow dryer
over a 24-hour period can vary greatly. At commercial elevators, it is not unusual toencounter moisture-content differences of 10% to 15% in lots of maize received fromdifferent growers. All the grain must be dried to approximately the same average moisturecontent, however, by properly varying the speed of the unload auger and thus the residencetime of the grain in the dryer.
Manual control of continuous-flow dryers often leads to significant overdrying orunderdrying because manual-control decisions in changing the auger speed are basedon hourly readings of the inlet and outlet moisture contents of the grain. Automaticcontrollers receive this information continuously and thus can minimize the overdryingor underdrying of the grain.
For many years, the automatic control of continuous-flow grain dryers was limited totemperature-activated feedback-type controllers that measure the grain or the exhaust-airtemperature at one or several locations along the drying column. A temperature-activatedcontroller is inaccurate and inconsistent at moisture content changes exceeding 3%, dueto the nonlinearity of the drying process. Therefore, the temperature-activated controllersare slowly being replaced by moisture-activated systems.
Grain Drying 43
Table 1.22. Specifications of a typical commercial three-stageconcurrent-flow maize dryer with counterflow cooler
Characteristic Specification
Bed area 13.38 m2
Capacity at 15%–24% moisture content 45 ton·h−1
Grain-flow velocity 4-7 m·h−1
Inlet moisture content 24% w.b.Depth of each drying stage 0.76 mDepth of each tempering stage 3 mDepth of cooling stage 1.2 mAirflow for each drying stage 570 m3 min−1
Static pressure in drying stage 3.2 kPaAirflow for cooling stage 570 m3 min−1
Static pressure in cooling stage 2.4 kPaDrying air temperaturea 200◦CFuel consumption 3933 kJ·kg−1
Source: [12].a Drying air temperature can be as high as 230–285◦C.
Figure 1.30. Two-stage concurrent-flow dryer with counterflow cooler, tempering section, andrecirculation of the cooling air and part of the drying air [12].
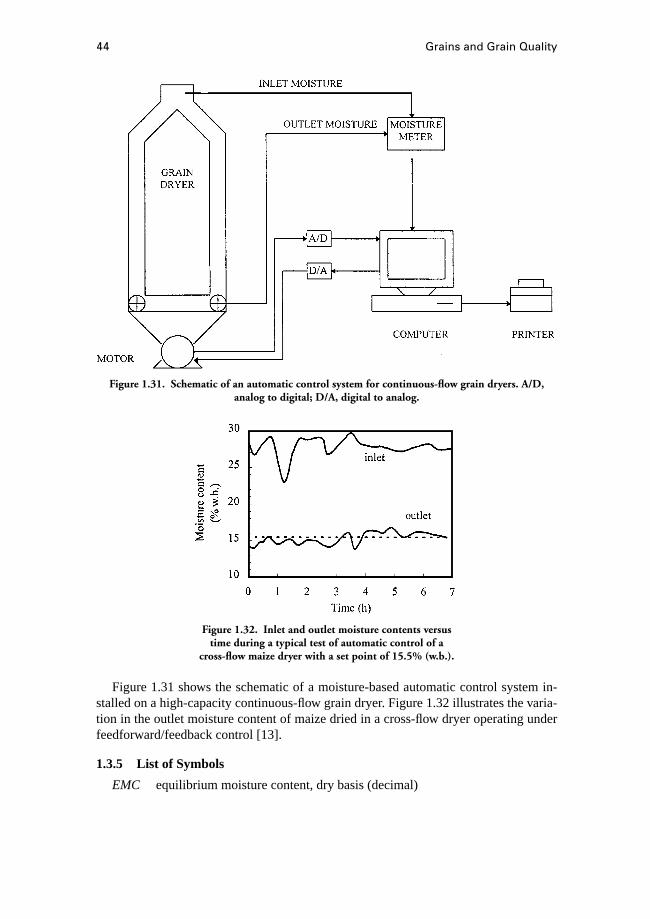
44 Grains and Grain Quality
Figure 1.31. Schematic of an automatic control system for continuous-flow grain dryers. A/D,analog to digital; D/A, digital to analog.
Figure 1.32. Inlet and outlet moisture contents versustime during a typical test of automatic control of a
cross-flow maize dryer with a set point of 15.5% (w.b.).
Figure 1.31 shows the schematic of a moisture-based automatic control system in-stalled on a high-capacity continuous-flow grain dryer. Figure 1.32 illustrates the varia-tion in the outlet moisture content of maize dried in a cross-flow dryer operating underfeedforward/feedback control [13].
1.3.5 List of Symbols
EMC equilibrium moisture content, dry basis (decimal)
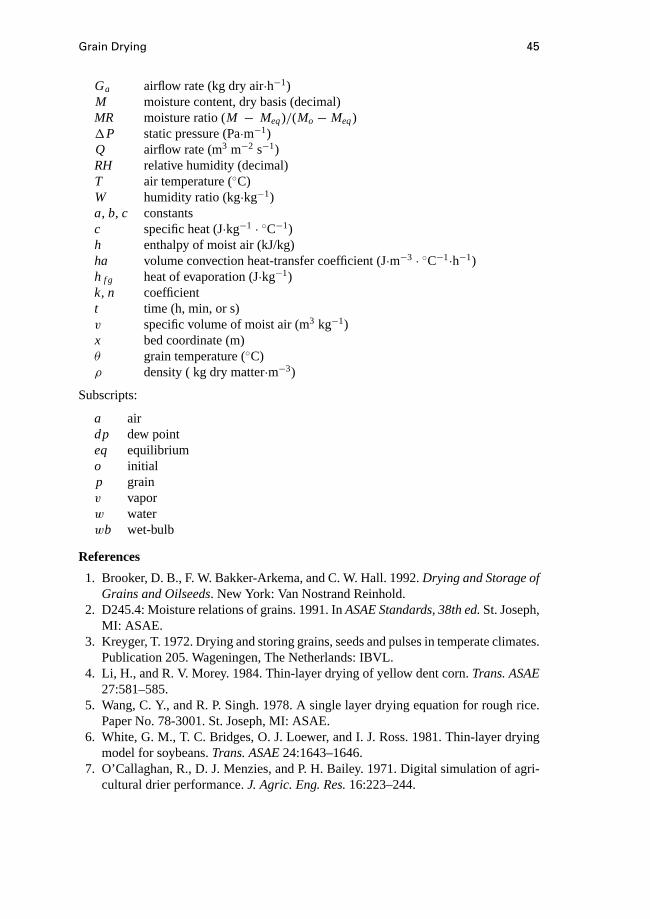
Grain Drying 45
Ga airflow rate (kg dry air·h−1)M moisture content, dry basis (decimal)MR moisture ratio (M − Meq)/(Mo − Meq)1P static pressure (Pa·m−1)Q airflow rate (m3 m−2 s−1)RH relative humidity (decimal)T air temperature (◦C)W humidity ratio (kg·kg−1)a, b, c constantsc specific heat (J·kg−1 · ◦C−1)h enthalpy of moist air (kJ/kg)ha volume convection heat-transfer coefficient (J·m−3 · ◦C−1·h−1)h f g heat of evaporation (J·kg−1)k, n coefficientt time (h, min, or s)v specific volume of moist air (m3 kg−1)x bed coordinate (m)θ grain temperature (◦C)ρ density ( kg dry matter·m−3)
Subscripts:
a airdp dew pointeq equilibriumo initialp grainv vaporw waterwb wet-bulb
References
1. Brooker, D. B., F. W. Bakker-Arkema, and C. W. Hall. 1992.Drying and Storage ofGrains and Oilseeds. New York: Van Nostrand Reinhold.
2. D245.4: Moisture relations of grains. 1991. InASAE Standards, 38th ed.St. Joseph,MI: ASAE.
3. Kreyger, T. 1972. Drying and storing grains, seeds and pulses in temperate climates.Publication 205. Wageningen, The Netherlands: IBVL.
4. Li, H., and R. V. Morey. 1984. Thin-layer drying of yellow dent corn.Trans. ASAE27:581–585.
5. Wang, C. Y., and R. P. Singh. 1978. A single layer drying equation for rough rice.Paper No. 78-3001. St. Joseph, MI: ASAE.
6. White, G. M., T. C. Bridges, O. J. Loewer, and I. J. Ross. 1981. Thin-layer dryingmodel for soybeans.Trans. ASAE24:1643–1646.
7. O’Callaghan, R., D. J. Menzies, and P. H. Bailey. 1971. Digital simulation of agri-cultural drier performance.J. Agric. Eng. Res.16:223–244.
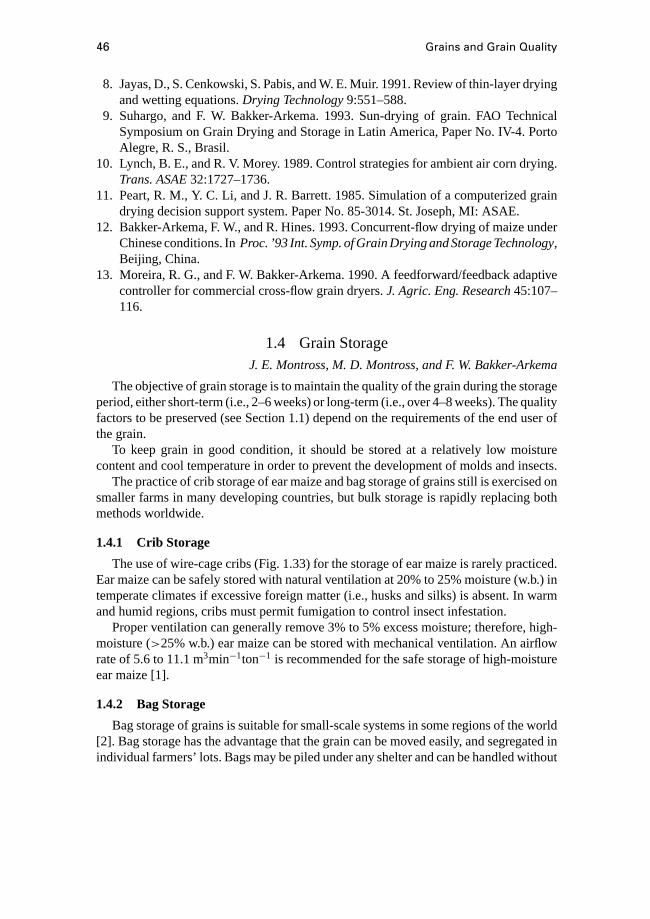
46 Grains and Grain Quality
8. Jayas, D., S. Cenkowski, S. Pabis, and W. E. Muir. 1991. Review of thin-layer dryingand wetting equations.Drying Technology9:551–588.
9. Suhargo, and F. W. Bakker-Arkema. 1993. Sun-drying of grain. FAO TechnicalSymposium on Grain Drying and Storage in Latin America, Paper No. IV-4. PortoAlegre, R. S., Brasil.
10. Lynch, B. E., and R. V. Morey. 1989. Control strategies for ambient air corn drying.Trans. ASAE32:1727–1736.
11. Peart, R. M., Y. C. Li, and J. R. Barrett. 1985. Simulation of a computerized graindrying decision support system. Paper No. 85-3014. St. Joseph, MI: ASAE.
12. Bakker-Arkema, F. W., and R. Hines. 1993. Concurrent-flow drying of maize underChinese conditions. InProc. ’93 Int. Symp. of Grain Drying and Storage Technology,Beijing, China.
13. Moreira, R. G., and F. W. Bakker-Arkema. 1990. A feedforward/feedback adaptivecontroller for commercial cross-flow grain dryers.J. Agric. Eng. Research45:107–116.
1.4 Grain StorageJ. E. Montross, M. D. Montross, and F. W. Bakker-Arkema
The objective of grain storage is to maintain the quality of the grain during the storageperiod, either short-term (i.e., 2–6 weeks) or long-term (i.e., over 4–8 weeks). The qualityfactors to be preserved (see Section 1.1) depend on the requirements of the end user ofthe grain.
To keep grain in good condition, it should be stored at a relatively low moisturecontent and cool temperature in order to prevent the development of molds and insects.
The practice of crib storage of ear maize and bag storage of grains still is exercised onsmaller farms in many developing countries, but bulk storage is rapidly replacing bothmethods worldwide.
1.4.1 Crib Storage
The use of wire-cage cribs (Fig. 1.33) for the storage of ear maize is rarely practiced.Ear maize can be safely stored with natural ventilation at 20% to 25% moisture (w.b.) intemperate climates if excessive foreign matter (i.e., husks and silks) is absent. In warmand humid regions, cribs must permit fumigation to control insect infestation.
Proper ventilation can generally remove 3% to 5% excess moisture; therefore, high-moisture (>25% w.b.) ear maize can be stored with mechanical ventilation. An airflowrate of 5.6 to 11.1 m3min−1ton−1 is recommended for the safe storage of high-moistureear maize [1].
1.4.2 Bag Storage
Bag storage of grains is suitable for small-scale systems in some regions of the world[2]. Bag storage has the advantage that the grain can be moved easily, and segregated inindividual farmers’ lots. Bags may be piled under any shelter and can be handled without

Grain Storage 47
Figure 1.33. Cylindrical wire-cage crib.
Figure 1.34. Typical bag-storage stacking pattern.
special equipment. Bag storage can become overly expensive in locations in which laborcosts are high.
Bags typically made of woven jute, hemp, local grass, or cotton offer no protectionagainst moisture, insects, and rodents. Polypropylene bags are mechanically strongerand are rodent-proof but are expensive and susceptible to deterioration by ultravioletradiation. Jute bags can be stacked up to a height of 6 m in warehouses, polypropylenebags only to 3 m because of slipping.
Dunnage should be used to keep grain bags at least 15 cm off the floor (see Fig. 1.34).Stack size should not exceed 6× 9 m, and a stack should be divided into six blockscontaining 256 bags, with a row of six bags lengthwise adjacent to a row of 10 bagswidthwise.
1.4.3 Bulk Storage
Vertical StorageGrains commonly are stored in vertical structures, in particular in reinforced concrete
silos and in steel bins. An economical layout of the various silos and bins is essential[3]. The foremost advantage of vertical storage is the efficient discharge of the grain
48 Grains and Grain Quality
Table 1.23. Holding capacity of roundbins/silos (in tons per meter of deptha)
Diameter (m) Maize Wheat
4.57 11.8 12.85.49 17.0 18.56.40 23.1 25.17.32 30.3 32.98.23 38.3 41.69.14 47.2 51.3
10.06 57.2 62.110.97 68.0 73.811.89 79.9 86.712.80 92.6 100.514.63 120.9 131.318.29 189.0 205.3
Source: [4].a Does not include space above eave line.
Based on 1.39 m3/ton for maize and 1.28m3/ton for wheat.
by gravity flow. The structural-design requirements of silos and bins are discussed inVolume 2 of the CIGR Handbook.
The approximate holding capacities of round bins and silos with different diametersfor maize and wheat in tons per meter depth is tabulated in Table 1.23. The exact holdingcapacity depends on the bulk density of the grain.
Concrete and metal each have advantages and disadvantages as basic constructionmaterials for grain bins. The main benefits of concrete are long lifetime, limited mainte-nance, large storage volume, low thermal conductivity, and limited water-condensationproblems. Drawbacks of the concrete grain silo are the significantly higher initial costand erection time than those of steel bins of equal storage volume.
Steel bins have gained popularity rather recently. In addition to their advantages overconcrete silos with respect to initial costs and erection time, steel bins are more easilyaccessible through manholes and are more easily fitted with aeration equipment andtemperature-measuring instrumentation.
Concrete silo walls typically have a thickness of 150 mm; the thickness of steelbin walls is characteristically 5 mm. Thus, concrete and steel bins of the same outsidediameter differ in volume; e.g., a 30 m high, 5 m diameter steel bin has a volume whichis 12% greater than a concrete silo of equal dimensions [3].
Steel bins should be galvanized, and the bolts and nuts zinc coated; rust-protectionpaint should be applied when rust spots appear. The outside walls of concrete silosrequire a protective coating occasionally to prevent the damaging effect of environmentalsulfurous air-pollution.
Horizontal StorageHorizontal sheds and warehouses are often employed in addition to bins and silos for
grain storage at large grain depots. It is more costly and labor-intensive to move grain

Grain Storage 49
Figure 1.35. A horizontal grain-storage facility with aeration system inthe ground [3].
into and out of a horizontal storage but the fixed cost per unit volume is significantly lessfor horizontal storage than for vertical storage.
The airflow during the aeration of grain in a shed is less uniform than in a bin, and there-fore the airflow rate has to be higher, i.e. 0.05 m3min−1 ton−1 i.s.o. 0.02 m3min−1ton−1.The maximum height of the grain in horizontal storages depends on the strength of thewalls, but usually does not exceed 6–8 m.
A typical flat bottom warehouse is shown in Fig. 1.35; the aeration system is locatedin the concrete floor [3]. Note the conveying systems for filling the storage.
CA StorageControlled-atmosphere (CA) storage of grains includes commodity-modified CA stor-
age and artificially modified CA storage [5]. In commodity-modified storage, respirationof the grain and the microorganisms reduces the O2 and increases the CO2. The atmo-sphere in an artificially modified storage is changed by injecting N2 or CO2 into thesystem.
Traditional underground pit storage is an example of sealed commodity-modified CAstorage; ideally, the O2 decreases to 0.2% to 0.5% and the CO2 increases to 45% to 50%.In such atmospheres, the toxin development of fungi and growth of insects are inhibited.Pit storage continues to be practiced in some developing countries, in particular in Africa[Dunkel, F., personal communication].
Nitrogen-producing exothermic generators are available commercially for altering theintragranular gas composition in a grain storage. They are employed mainly to preventinsect development during long-term storage of 12% to 14% moisture-content grains.Subjection to pure N2 for a few days kills all forms of insects (i.e., eggs, larvae, adults),but it is difficult to maintain a storage without leakage. Therefore, many N2 storagescontain a gas mixture of 97% to 99% N2 and 0.5% to 4% O2. At the lower N2 levels, thelethal response of insects is negatively affected as the figures in Table 1.24 show. The

50 Grains and Grain Quality
Table 1.24. Days of exposure to low oxygen levels in nitrogenrequired for complete control of adult insects in grain stored at
14–17◦C
Species <1% O2 1–2% O2 2–4% O2
Oryzaephilus surinamensis 10 7 18Sitophilus granarius 12 15 27Tribolium confusum 2 — —
Source: [6].
exact response depends on the insect species, the grain temperature, and the moisturecontent [7].
Another gas employed for the CA storage of grains is CO2 [8, 9].
Chilled StorageTo prevent the invasion of insects to non–CA stored grain, especially in the tropics
and subtropics, the grain is treated with chemicals or lowered in temperature. The useof chemicals is discussed in the next subsection.
A grain chiller is a device that cools ambient air to the desired temperature and relativehumidity before forcing the conditioned air through the stored grain (see Fig. 1.36).The grain chiller is basically a mechanical refrigeration unit equipped with a precisetemperature and humidity controller. Figure 1.37 shows the level of control of the airtemperature and humidity established by a chiller.
Figure 1.36. Grain-chilling process that utilizes a refrigeration system tocontrol the temperature and relative humidity of the air before it enters the
grain silo.
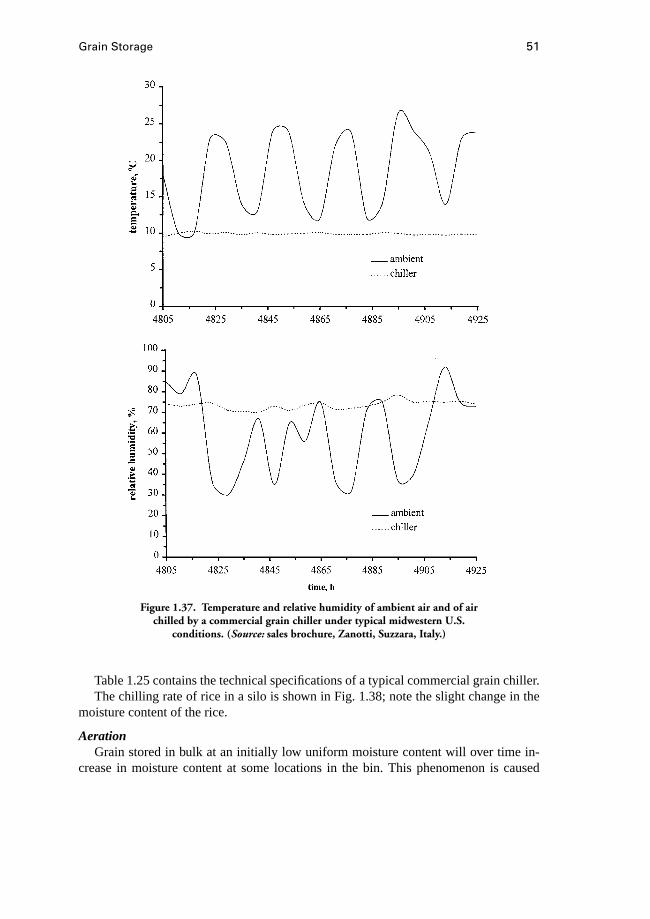
Grain Storage 51
Figure 1.37. Temperature and relative humidity of ambient air and of airchilled by a commercial grain chiller under typical midwestern U.S.
conditions. (Source: sales brochure, Zanotti, Suzzara, Italy.)
Table 1.25 contains the technical specifications of a typical commercial grain chiller.The chilling rate of rice in a silo is shown in Fig. 1.38; note the slight change in the
moisture content of the rice.
AerationGrain stored in bulk at an initially low uniform moisture content will over time in-
crease in moisture content at some locations in the bin. This phenomenon is caused
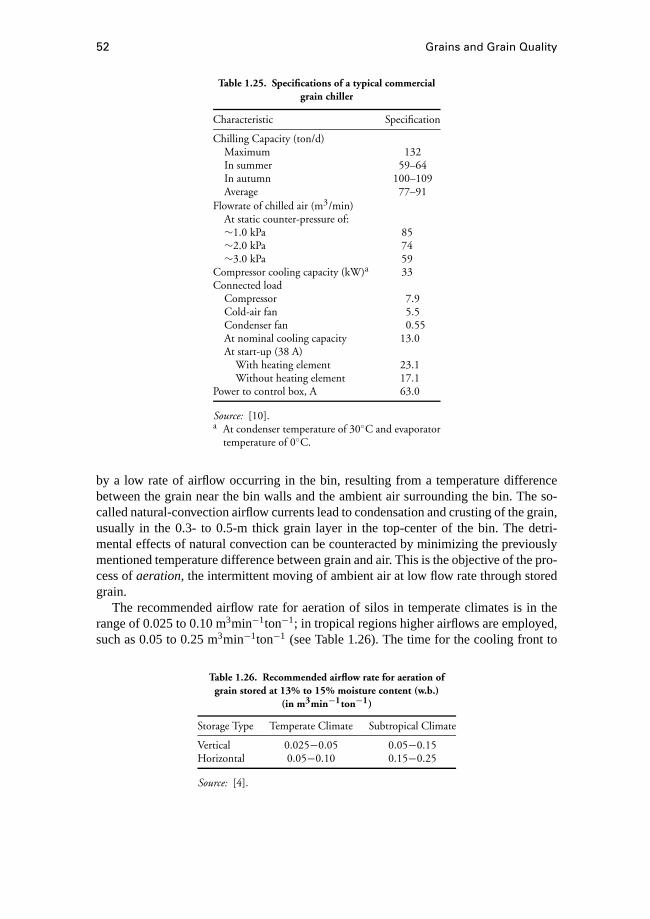
52 Grains and Grain Quality
Table 1.25. Specifications of a typical commercialgrain chiller
Characteristic Specification
Chilling Capacity (ton/d)Maximum 132In summer 59–64In autumn 100–109Average 77–91
Flowrate of chilled air (m3/min)At static counter-pressure of:∼1.0 kPa 85∼2.0 kPa 74∼3.0 kPa 59
Compressor cooling capacity (kW)a 33Connected load
Compressor 7.9Cold-air fan 5.5Condenser fan 0.55At nominal cooling capacity 13.0At start-up (38 A)
With heating element 23.1Without heating element 17.1
Power to control box, A 63.0
Source: [10].a At condenser temperature of 30◦C and evaporator
temperature of 0◦C.
by a low rate of airflow occurring in the bin, resulting from a temperature differencebetween the grain near the bin walls and the ambient air surrounding the bin. The so-called natural-convection airflow currents lead to condensation and crusting of the grain,usually in the 0.3- to 0.5-m thick grain layer in the top-center of the bin. The detri-mental effects of natural convection can be counteracted by minimizing the previouslymentioned temperature difference between grain and air. This is the objective of the pro-cess ofaeration, the intermittent moving of ambient air at low flow rate through storedgrain.
The recommended airflow rate for aeration of silos in temperate climates is in therange of 0.025 to 0.10 m3min−1ton−1; in tropical regions higher airflows are employed,such as 0.05 to 0.25 m3min−1ton−1 (see Table 1.26). The time for the cooling front to
Table 1.26. Recommended airflow rate for aeration ofgrain stored at 13% to 15% moisture content (w.b.)
(in m3min−1ton−1)
Storage Type Temperate Climate Subtropical Climate
Vertical 0.025−0.05 0.05−0.15Horizontal 0.05−0.10 0.15−0.25
Source: [4].
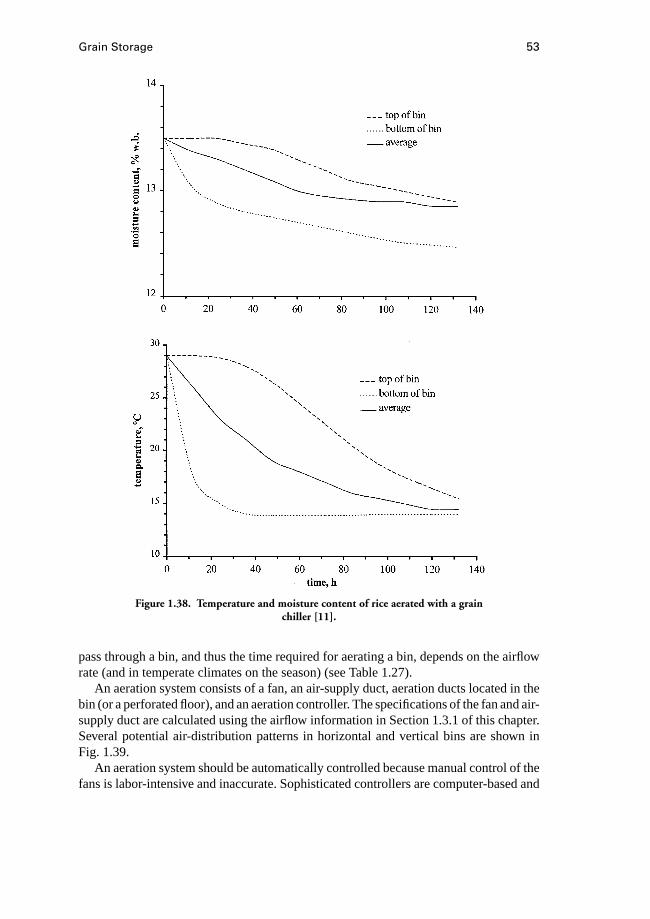
Grain Storage 53
Figure 1.38. Temperature and moisture content of rice aerated with a grainchiller [11].
pass through a bin, and thus the time required for aerating a bin, depends on the airflowrate (and in temperate climates on the season) (see Table 1.27).
An aeration system consists of a fan, an air-supply duct, aeration ducts located in thebin (or a perforated floor), and an aeration controller. The specifications of the fan and air-supply duct are calculated using the airflow information in Section 1.3.1 of this chapter.Several potential air-distribution patterns in horizontal and vertical bins are shown inFig. 1.39.
An aeration system should be automatically controlled because manual control of thefans is labor-intensive and inaccurate. Sophisticated controllers are computer-based and
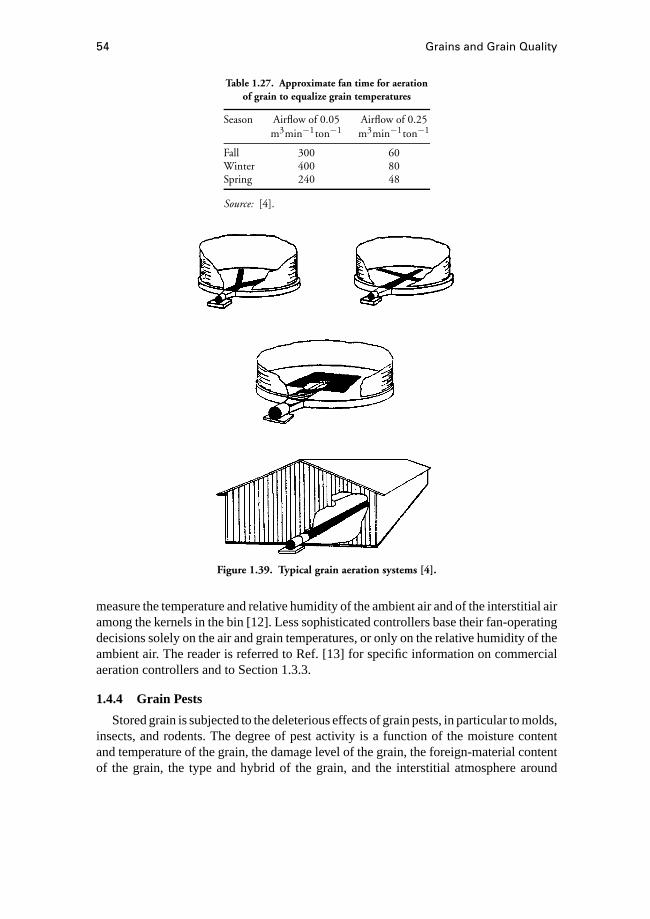
54 Grains and Grain Quality
Table 1.27. Approximate fan time for aerationof grain to equalize grain temperatures
Season Airflow of 0.05 Airflow of 0.25m3min−1ton−1 m3min−1ton−1
Fall 300 60Winter 400 80Spring 240 48
Source: [4].
Figure 1.39. Typical grain aeration systems [4].
measure the temperature and relative humidity of the ambient air and of the interstitial airamong the kernels in the bin [12]. Less sophisticated controllers base their fan-operatingdecisions solely on the air and grain temperatures, or only on the relative humidity of theambient air. The reader is referred to Ref. [13] for specific information on commercialaeration controllers and to Section 1.3.3.
1.4.4 Grain Pests
Stored grain is subjected to the deleterious effects of grain pests, in particular to molds,insects, and rodents. The degree of pest activity is a function of the moisture contentand temperature of the grain, the damage level of the grain, the foreign-material contentof the grain, the type and hybrid of the grain, and the interstitial atmosphere around
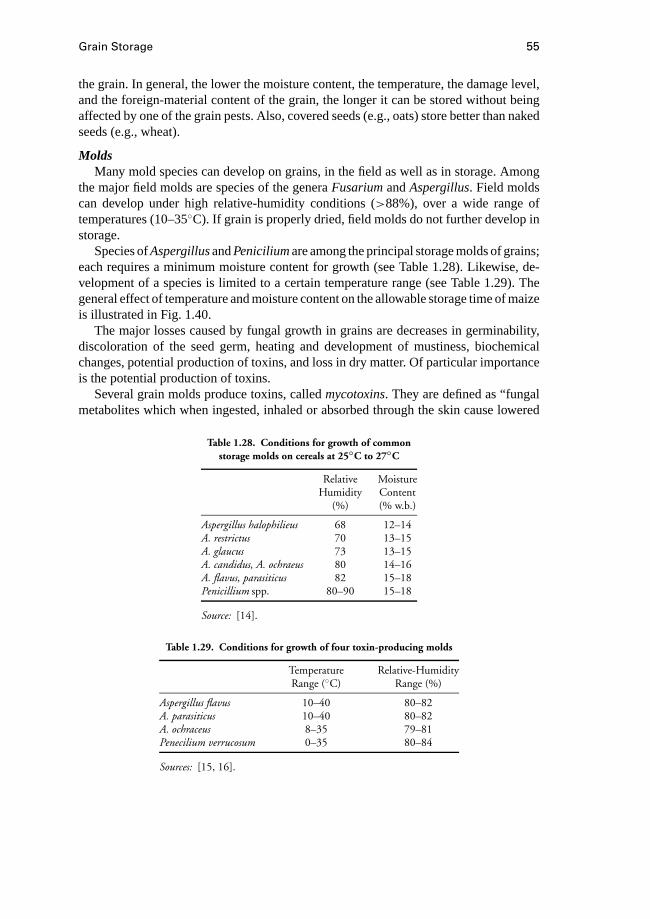
Grain Storage 55
the grain. In general, the lower the moisture content, the temperature, the damage level,and the foreign-material content of the grain, the longer it can be stored without beingaffected by one of the grain pests. Also, covered seeds (e.g., oats) store better than nakedseeds (e.g., wheat).
MoldsMany mold species can develop on grains, in the field as well as in storage. Among
the major field molds are species of the generaFusariumandAspergillus. Field moldscan develop under high relative-humidity conditions (>88%), over a wide range oftemperatures (10–35◦C). If grain is properly dried, field molds do not further develop instorage.
Species ofAspergillusandPeniciliumare among the principal storage molds of grains;each requires a minimum moisture content for growth (see Table 1.28). Likewise, de-velopment of a species is limited to a certain temperature range (see Table 1.29). Thegeneral effect of temperature and moisture content on the allowable storage time of maizeis illustrated in Fig. 1.40.
The major losses caused by fungal growth in grains are decreases in germinability,discoloration of the seed germ, heating and development of mustiness, biochemicalchanges, potential production of toxins, and loss in dry matter. Of particular importanceis the potential production of toxins.
Several grain molds produce toxins, calledmycotoxins. They are defined as “fungalmetabolites which when ingested, inhaled or absorbed through the skin cause lowered
Table 1.28. Conditions for growth of commonstorage molds on cereals at 25◦C to 27◦C
Relative MoistureHumidity Content
(%) (% w.b.)
Aspergillus halophilieus 68 12–14A. restrictus 70 13–15A. glaucus 73 13–15A. candidus, A. ochraeus 80 14–16A. flavus, parasiticus 82 15–18Penicillium spp. 80–90 15–18
Source: [14].
Table 1.29. Conditions for growth of four toxin-producing molds
Temperature Relative-HumidityRange (◦C) Range (%)
Aspergillus flavus 10–40 80–82A. parasiticus 10–40 80–82A. ochraceus 8–35 79–81Penecilium verrucosum 0–35 80–84
Sources: [15, 16].
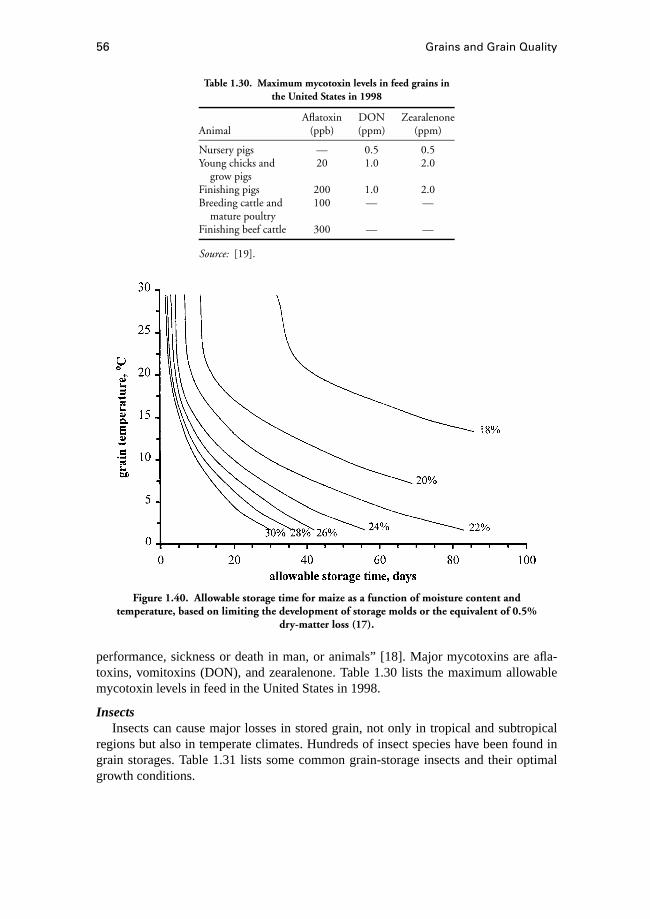
56 Grains and Grain Quality
Table 1.30. Maximum mycotoxin levels in feed grains inthe United States in 1998
Aflatoxin DON ZearalenoneAnimal (ppb) (ppm) (ppm)
Nursery pigs — 0.5 0.5Young chicks and 20 1.0 2.0
grow pigsFinishing pigs 200 1.0 2.0Breeding cattle and 100 — —
mature poultryFinishing beef cattle 300 — —
Source: [19].
Figure 1.40. Allowable storage time for maize as a function of moisture content andtemperature, based on limiting the development of storage molds or the equivalent of 0.5%
dry-matter loss (17).
performance, sickness or death in man, or animals” [18]. Major mycotoxins are afla-toxins, vomitoxins (DON), and zearalenone. Table 1.30 lists the maximum allowablemycotoxin levels in feed in the United States in 1998.
InsectsInsects can cause major losses in stored grain, not only in tropical and subtropical
regions but also in temperate climates. Hundreds of insect species have been found ingrain storages. Table 1.31 lists some common grain-storage insects and their optimalgrowth conditions.
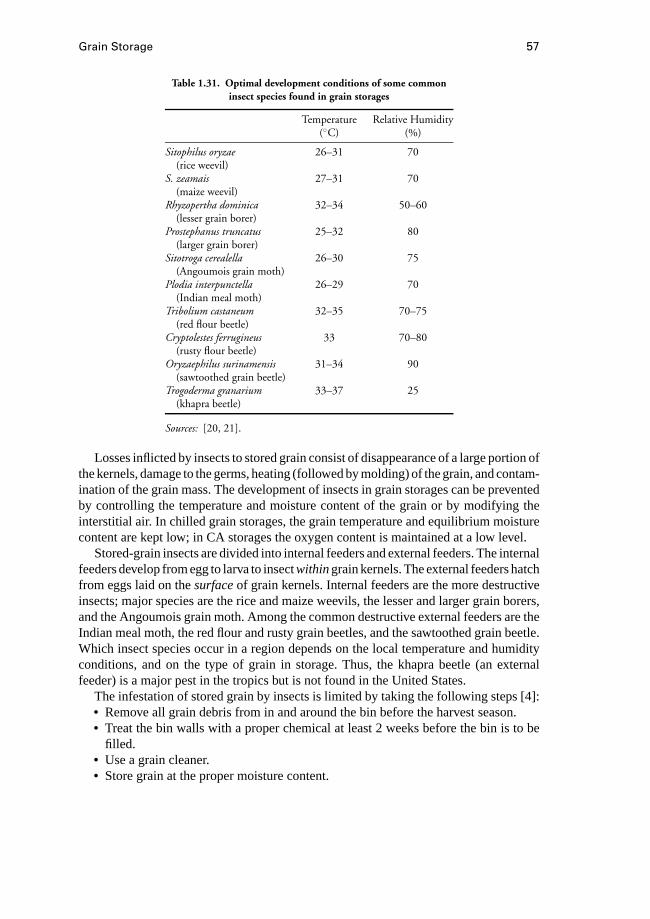
Grain Storage 57
Table 1.31. Optimal development conditions of some commoninsect species found in grain storages
Temperature Relative Humidity(◦C) (%)
Sitophilus oryzae 26–31 70(rice weevil)
S. zeamais 27–31 70(maize weevil)
Rhyzopertha dominica 32–34 50–60(lesser grain borer)
Prostephanus truncatus 25–32 80(larger grain borer)
Sitotroga cerealella 26–30 75(Angoumois grain moth)
Plodia interpunctella 26–29 70(Indian meal moth)
Tribolium castaneum 32–35 70–75(red flour beetle)
Cryptolestes ferrugineus 33 70–80(rusty flour beetle)
Oryzaephilus surinamensis 31–34 90(sawtoothed grain beetle)
Trogoderma granarium 33–37 25(khapra beetle)
Sources: [20, 21].
Losses inflicted by insects to stored grain consist of disappearance of a large portion ofthe kernels, damage to the germs, heating (followed by molding) of the grain, and contam-ination of the grain mass. The development of insects in grain storages can be preventedby controlling the temperature and moisture content of the grain or by modifying theinterstitial air. In chilled grain storages, the grain temperature and equilibrium moisturecontent are kept low; in CA storages the oxygen content is maintained at a low level.
Stored-grain insects are divided into internal feeders and external feeders. The internalfeeders develop from egg to larva to insectwithingrain kernels. The external feeders hatchfrom eggs laid on thesurfaceof grain kernels. Internal feeders are the more destructiveinsects; major species are the rice and maize weevils, the lesser and larger grain borers,and the Angoumois grain moth. Among the common destructive external feeders are theIndian meal moth, the red flour and rusty grain beetles, and the sawtoothed grain beetle.Which insect species occur in a region depends on the local temperature and humidityconditions, and on the type of grain in storage. Thus, the khapra beetle (an externalfeeder) is a major pest in the tropics but is not found in the United States.
The infestation of stored grain by insects is limited by taking the following steps [4]:• Remove all grain debris from in and around the bin before the harvest season.• Treat the bin walls with a proper chemical at least 2 weeks before the bin is to be
filled.• Use a grain cleaner.• Store grain at the proper moisture content.
58 Grains and Grain Quality
• Cool stored grain by aeration or chilling to below 10◦C (if possible).• Monitor the grain temperature and moisture content and the presence of mold and
insects.• Aerate grain if the maximum grain temperature exceeds by 6◦C the average 24-hour
ambient temperature.• Clean and sell or fumigate grain immediately after insects are discovered.Fumigation (i.e., chemical treatment) of stored grain should be implemented by pro-
fessional fumigators [22]. Only a limited number of chemicals still are available com-mercially (e.g., in 1998 in the United States only phosphine).
RodentsRodents are considered a storage pest because they consume and damage grains in the
field and in storage, destroy baggage and storage structures, and transmit diseases that aredangerous to humans (i.e., through urine and droppings mixed with grain). Cleanlinessduring grain harvest and handling reduces the risk of rodents.
Three common rodents found throughout the world are the house mouse (Mus mus-culus), the brown rat (Rattus norvegicus), and the ship rat (Rattus rattus).
Two forms of rodent control are practiced. Poisons are used only if a rapid reductionin rodent population is required. Trapping is implemented if poisons are too dangerousand rodent odors must be avoided. The snap trap (i.e., mouse trap) and the steel animaltrap are commonly employed.
Rodent-proofing of a storage facility is necessary to curtail the development of rodents.The following is recommended for rodent-proofing a storage facility:• Exterior structures should be constructed of gnaw-proof materials.• Openings should be closed or protected with doors, screens, or grates.• Dead space within the interior of the storage structure should be avoided.
References
1. Hall, C. W. 1957.Drying Farm Crops. Ann Arbor, MI: Edward Brothers.2. Lee, K. T., T. Y. Tan, and A. M. Seet. 1977.Investigations into the Problems Involved
in Storing Bulk Quantities of Milled Rice in Bag Stores: Report 1976. Valencia,Spain: Institute of Agriculture and Food Technology.
3. Boumans, G. 1985.Grain Handling and Storage. New York: Elsevier.4. Brooker, D. B., F. W. Bakker-Arkema, and C. W. Hall. 1992.Drying and Storage of
Grains and Oilseeds. New York: Van Nostrand Reinhold.5. Busta, F. F., L. B. Smith, and C. M. Christensen. 1980. Microbiology of controlled
atmosphere storage of grains. InControlled Atmosphere Storage of Grains, ed. J.Shejbal. New York: Elsevier.
6. Muda, A. R. 1988. Sealed storage of milled rice under carbon dioxide. InBulkHandling and Storage of Grain in the Humid Tropics, eds. B. R. Champ, and E.Highley. Canberra, Australia: ACIAR.
7. Bell, C. H., and D. M. Armitage. Alternative storage practices. InStorage of CerealGrains and Their Products, 4th ed., ed. D. B. Sauer. St. Paul, MN: AACC.
Grain Drying and Storage in the Tropics 59
8. Shejbal, J. 1979. Storage of cereal grains in nitrogen atmosphere.Cereal FoodsWorld 24(3):192–194.
9. Banks, H. J., and A. K. Sharp. 1979. Insect control in a small stack of bagged grainin a plastic enclosure.Australian Journal of Animal Husbandry19(2):102–107.
10. Sulzer USA, Inc. 1993.Grain Chilling. Lindau, Germany: Sulzer-Escher-Wyss.11. Maier, D. E. 1992. The chilled aeration and storage of cereal grains. Ph.D. diss.,
Michigan State University, East Lansing, MI.12. Moriera, R. G., and F. W. Bakker-Arkema. 1992. Grain dryer controls.Cereal Chem-
istry 69:390–396.13. Driscol, R. 1996. In-store drying and grain psychrometrics. InGrain Drying in Asia,
eds. B. R. Champ, E. Highley, and G. I. Johnson. Canberra, Australia: ACIAR.14. Christensen, C. M., and H. H. Kaufman. 1969.Grain Storage: The Role of Fungi in
Quality Loss. Minneapolis, MN: University of Minnesota Press.15. Christensen, C. M., and R. A. Meronuck. 1986.Quality Maintenance in Stored
Grains and Seeds. Minneapolis, MN: University of Minnesota Press.16. Pitt, J. I. 1995. Under what conditions are mycotoxins produced?Australian Myco-
toxin Newsletter6(2):1–2.17. Steele, J. L. 1967. Deterioration of damage shelled corn as measured by carbon
dioxide production. Ph.D. diss., Iowa State University, Ames, IA.18. Pitt. J. I. 1996. What are mycotoxins?Australian Mycotoxin Newsletter7(4):1–2.19. United States Department of Agriculture. 1997.Maximum Mycotoxin Levels in US
Feeds. Washington, DC.20. Pedersen, J. R. 1992. Insects: Identification, damage and detection. InStorage of
Cereal Grains and Their Products, ed. D. B. Sauer. St. Paul, MN: AACC.21. Champ, B. R. 1985. Occurrence of resistance to pesticides in grain storage pests.
In Pesticides and Humid Tropical Grain Storage Systems, eds. B. R. Champ, and E.Highley. Canberra, Australia: ACIAR.
22. GASGA. 1996. Risks and consequences of the misuse of pesticides in the treatmentof stored products. Technical Bulletin No. 2. Wageningen, the Netherlands: CTA.
1.5 Grain Drying and Storage in the TropicsJuarez de Sousa e Silva and Pedro Amorim Berbert
Although cereal grains and oilseeds can be produced throughout the year in tropicalregions, productions are normally seasonal and harvest takes place at certain times ofthe year. Because of this fact, it is necessary to store grains for different lengths of timein order to provide consumers with an uniform grain supply.
With some exceptions, including parts of Brazil, Australia, and Argentina, grains suchas beans, corn, and rice historically have been produced by farmers owning small landareas (less than 50 ha) and generally are associated with concepts of low production andyield, low capital investment, and low level of technology use. Value-added grains andoilseeds generally are produced with high levels of technology use. Commercializationand distribution of their products generally are made through well-organized cooperative
60 Grains and Grain Quality
systems. These farmers have easy access to information on stock-market prices, qualitystandards, and up-to-date technologies.
It is not difficult to realize how important is the need for grain preservation in the trop-ics. However, providing a storage technology capable of preserving the quality of cerealgrains in various regions in the tropics is a very complex undertaking. To successfullystore grains in the tropics, it is necessary to understand how the product deteriorates andthe methods generally used to control the deterioration process. Much of the tropical re-gion is characterized by climates that makes it unsafe to store grains. High temperaturesand relative humidities predominate over prolonged periods of time, thus increasing thepotential for deterioration due to insects, birds, molds, and rodents. Even in the best-constructed and best-managed facilities, storing grain in the tropics is a very difficulttask.
Despite the availability of various types of storage facilities, which vary from dis-carded oil drums to modern silos, the ways in which grains are harvested, handled, dried,and stored in developed regions of the tropics do not differ from those used either inthe United States or in Europe. However, high initial moisture contents at harvest andwarm weather throughout the year, which prompts an intense level of biological activ-ity (grain respiration, insect and mold development), require from managers of storedproduct facilities in the tropics frequent supervision of the stored grain and a more care-ful approach to quality aspects as compared with those facilities located in regions oftemperate climates.
1.5.1 Deterioration During Storage
The main objective of storing grain in a proper way is to maintain, throughout thewhole storage period, the biological, chemical, and physical characteristics that the grainpossessed immediately after harvest. One of the most critical physiological factors thatdetermines a successful grain-storage process in the tropics is its moisture content. Ahigh moisture content leads to storage problems because it creates a favorable conditionfor mold and insect growth, an increased grain respiration rate, and germination duringstorage. One of the products of respiration is heat, and reduction of temperature of theharvested crop can help reduce the rate of respiration and thus increase the storagelife of the product. Also, lowering the temperature reduces insect and mold activities,and consequently the rate of spoilage is reduced. Intense insect and mold growth arerecognized as the major problems preventing successful grain storage in the tropics.
1.5.2 Drying Systems
Low-temperature and Sun DryingLow-temperature drying is a process used to dry cereal grains that uses ambient or
slightly heated air and employs bins normally used for grain storage. Thus, the pro-cess is normally referred to asin-bin drying. The drying bin must have some specialcharacteristics—perforated floor (10% to 25% of area perforated), uniform distributionof the drying air—and fan selection must be based on grain initial moisture content, binsize, and allowable drying time. Electric resistance heaters or gas, wood, and oil-burningfurnaces are the most common heat sources.
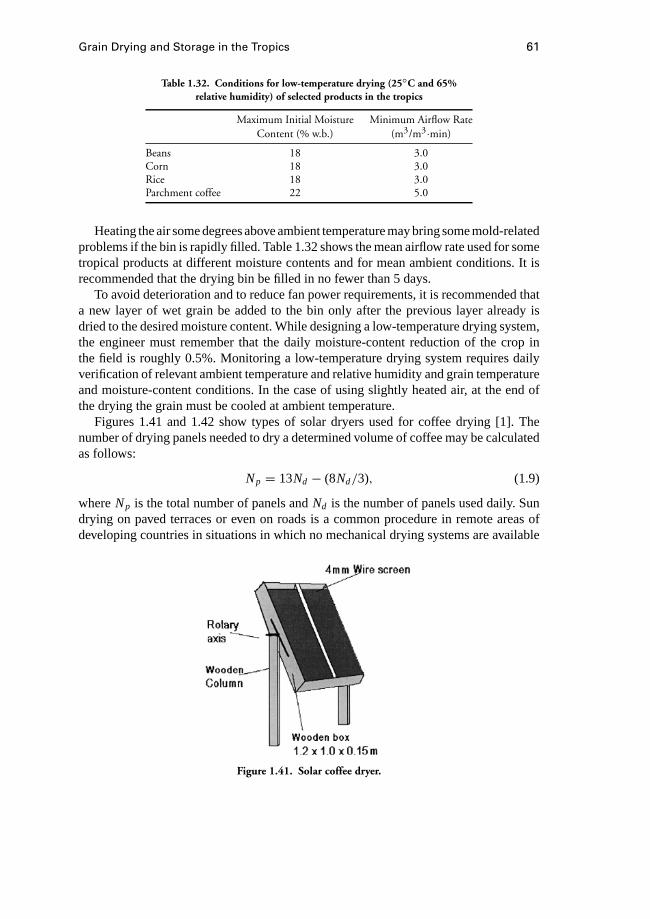
Grain Drying and Storage in the Tropics 61
Table 1.32. Conditions for low-temperature drying (25◦C and 65%relative humidity) of selected products in the tropics
Maximum Initial Moisture Minimum Airflow RateContent (% w.b.) (m3/m3·min)
Beans 18 3.0Corn 18 3.0Rice 18 3.0Parchment coffee 22 5.0
Heating the air some degrees above ambient temperature may bring some mold-relatedproblems if the bin is rapidly filled. Table 1.32 shows the mean airflow rate used for sometropical products at different moisture contents and for mean ambient conditions. It isrecommended that the drying bin be filled in no fewer than 5 days.
To avoid deterioration and to reduce fan power requirements, it is recommended thata new layer of wet grain be added to the bin only after the previous layer already isdried to the desired moisture content. While designing a low-temperature drying system,the engineer must remember that the daily moisture-content reduction of the crop inthe field is roughly 0.5%. Monitoring a low-temperature drying system requires dailyverification of relevant ambient temperature and relative humidity and grain temperatureand moisture-content conditions. In the case of using slightly heated air, at the end ofthe drying the grain must be cooled at ambient temperature.
Figures 1.41 and 1.42 show types of solar dryers used for coffee drying [1]. Thenumber of drying panels needed to dry a determined volume of coffee may be calculatedas follows:
Np = 13Nd − (8Nd/3), (1.9)
whereNp is the total number of panels andNd is the number of panels used daily. Sundrying on paved terraces or even on roads is a common procedure in remote areas ofdeveloping countries in situations in which no mechanical drying systems are available
Figure 1.41. Solar coffee dryer.
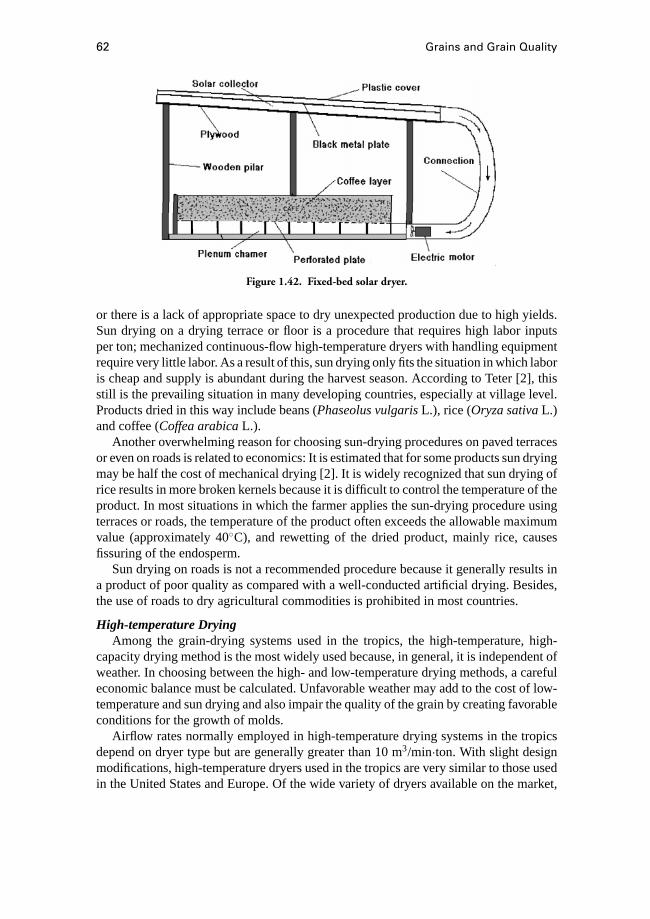
62 Grains and Grain Quality
Figure 1.42. Fixed-bed solar dryer.
or there is a lack of appropriate space to dry unexpected production due to high yields.Sun drying on a drying terrace or floor is a procedure that requires high labor inputsper ton; mechanized continuous-flow high-temperature dryers with handling equipmentrequire very little labor. As a result of this, sun drying only fits the situation in which laboris cheap and supply is abundant during the harvest season. According to Teter [2], thisstill is the prevailing situation in many developing countries, especially at village level.Products dried in this way include beans (Phaseolus vulgarisL.), rice (Oryza sativaL.)and coffee (Coffea arabicaL.).
Another overwhelming reason for choosing sun-drying procedures on paved terracesor even on roads is related to economics: It is estimated that for some products sun dryingmay be half the cost of mechanical drying [2]. It is widely recognized that sun drying ofrice results in more broken kernels because it is difficult to control the temperature of theproduct. In most situations in which the farmer applies the sun-drying procedure usingterraces or roads, the temperature of the product often exceeds the allowable maximumvalue (approximately 40◦C), and rewetting of the dried product, mainly rice, causesfissuring of the endosperm.
Sun drying on roads is not a recommended procedure because it generally results ina product of poor quality as compared with a well-conducted artificial drying. Besides,the use of roads to dry agricultural commodities is prohibited in most countries.
High-temperature DryingAmong the grain-drying systems used in the tropics, the high-temperature, high-
capacity drying method is the most widely used because, in general, it is independent ofweather. In choosing between the high- and low-temperature drying methods, a carefuleconomic balance must be calculated. Unfavorable weather may add to the cost of low-temperature and sun drying and also impair the quality of the grain by creating favorableconditions for the growth of molds.
Airflow rates normally employed in high-temperature drying systems in the tropicsdepend on dryer type but are generally greater than 10 m3/min·ton. With slight designmodifications, high-temperature dryers used in the tropics are very similar to those usedin the United States and Europe. Of the wide variety of dryers available on the market,
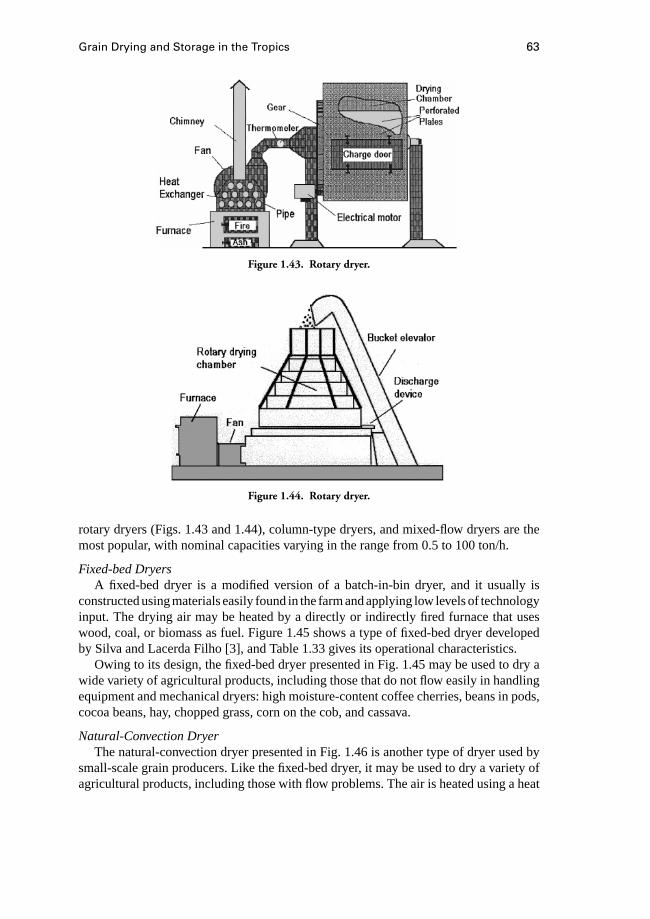
Grain Drying and Storage in the Tropics 63
Figure 1.43. Rotary dryer.
Figure 1.44. Rotary dryer.
rotary dryers (Figs. 1.43 and 1.44), column-type dryers, and mixed-flow dryers are themost popular, with nominal capacities varying in the range from 0.5 to 100 ton/h.
Fixed-bed DryersA fixed-bed dryer is a modified version of a batch-in-bin dryer, and it usually is
constructed using materials easily found in the farm and applying low levels of technologyinput. The drying air may be heated by a directly or indirectly fired furnace that useswood, coal, or biomass as fuel. Figure 1.45 shows a type of fixed-bed dryer developedby Silva and Lacerda Filho [3], and Table 1.33 gives its operational characteristics.
Owing to its design, the fixed-bed dryer presented in Fig. 1.45 may be used to dry awide variety of agricultural products, including those that do not flow easily in handlingequipment and mechanical dryers: high moisture-content coffee cherries, beans in pods,cocoa beans, hay, chopped grass, corn on the cob, and cassava.
Natural-Convection DryerThe natural-convection dryer presented in Fig. 1.46 is another type of dryer used by
small-scale grain producers. Like the fixed-bed dryer, it may be used to dry a variety ofagricultural products, including those with flow problems. The air is heated using a heat
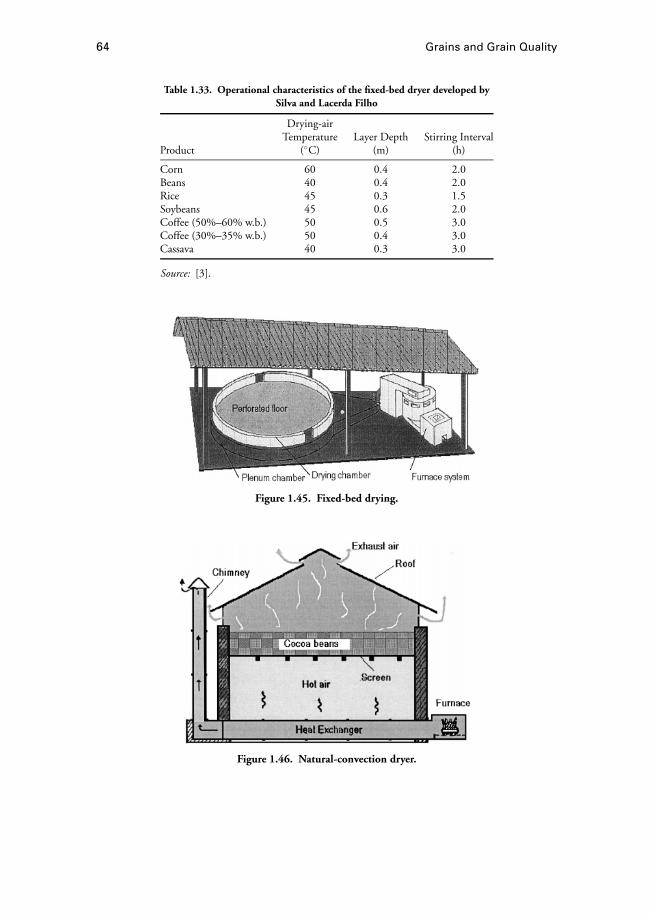
64 Grains and Grain Quality
Table 1.33. Operational characteristics of the fixed-bed dryer developed bySilva and Lacerda Filho
Drying-airTemperature Layer Depth Stirring Interval
Product (◦C) (m) (h)
Corn 60 0.4 2.0Beans 40 0.4 2.0Rice 45 0.3 1.5Soybeans 45 0.6 2.0Coffee (50%–60% w.b.) 50 0.5 3.0Coffee (30%–35% w.b.) 50 0.4 3.0Cassava 40 0.3 3.0
Source: [3].
Figure 1.45. Fixed-bed drying.
Figure 1.46. Natural-convection dryer.
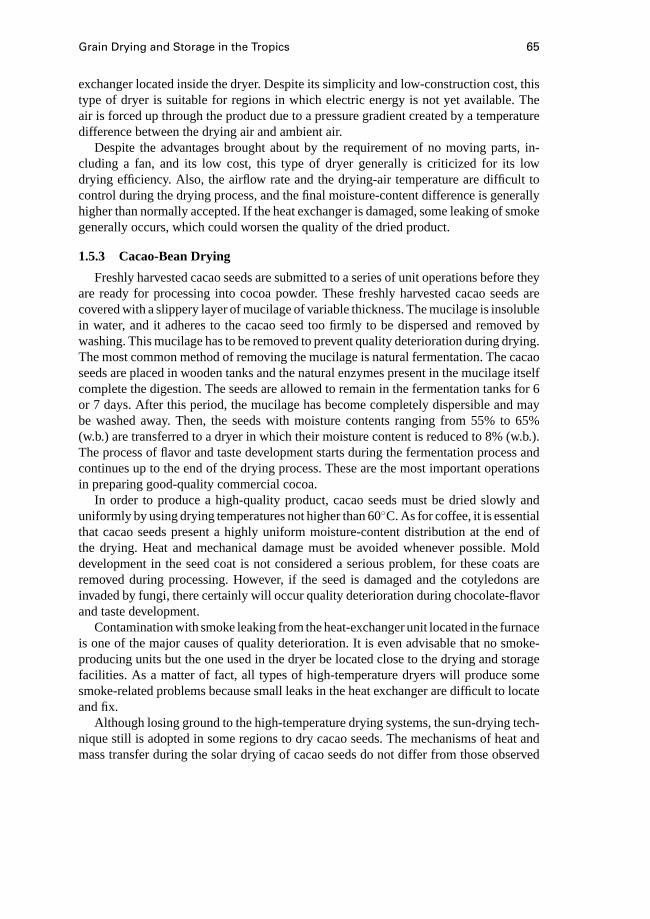
Grain Drying and Storage in the Tropics 65
exchanger located inside the dryer. Despite its simplicity and low-construction cost, thistype of dryer is suitable for regions in which electric energy is not yet available. Theair is forced up through the product due to a pressure gradient created by a temperaturedifference between the drying air and ambient air.
Despite the advantages brought about by the requirement of no moving parts, in-cluding a fan, and its low cost, this type of dryer generally is criticized for its lowdrying efficiency. Also, the airflow rate and the drying-air temperature are difficult tocontrol during the drying process, and the final moisture-content difference is generallyhigher than normally accepted. If the heat exchanger is damaged, some leaking of smokegenerally occurs, which could worsen the quality of the dried product.
1.5.3 Cacao-Bean Drying
Freshly harvested cacao seeds are submitted to a series of unit operations before theyare ready for processing into cocoa powder. These freshly harvested cacao seeds arecovered with a slippery layer of mucilage of variable thickness. The mucilage is insolublein water, and it adheres to the cacao seed too firmly to be dispersed and removed bywashing. This mucilage has to be removed to prevent quality deterioration during drying.The most common method of removing the mucilage is natural fermentation. The cacaoseeds are placed in wooden tanks and the natural enzymes present in the mucilage itselfcomplete the digestion. The seeds are allowed to remain in the fermentation tanks for 6or 7 days. After this period, the mucilage has become completely dispersible and maybe washed away. Then, the seeds with moisture contents ranging from 55% to 65%(w.b.) are transferred to a dryer in which their moisture content is reduced to 8% (w.b.).The process of flavor and taste development starts during the fermentation process andcontinues up to the end of the drying process. These are the most important operationsin preparing good-quality commercial cocoa.
In order to produce a high-quality product, cacao seeds must be dried slowly anduniformly by using drying temperatures not higher than 60◦C. As for coffee, it is essentialthat cacao seeds present a highly uniform moisture-content distribution at the end ofthe drying. Heat and mechanical damage must be avoided whenever possible. Molddevelopment in the seed coat is not considered a serious problem, for these coats areremoved during processing. However, if the seed is damaged and the cotyledons areinvaded by fungi, there certainly will occur quality deterioration during chocolate-flavorand taste development.
Contamination with smoke leaking from the heat-exchanger unit located in the furnaceis one of the major causes of quality deterioration. It is even advisable that no smoke-producing units but the one used in the dryer be located close to the drying and storagefacilities. As a matter of fact, all types of high-temperature dryers will produce somesmoke-related problems because small leaks in the heat exchanger are difficult to locateand fix.
Although losing ground to the high-temperature drying systems, the sun-drying tech-nique still is adopted in some regions to dry cacao seeds. The mechanisms of heat andmass transfer during the solar drying of cacao seeds do not differ from those observed
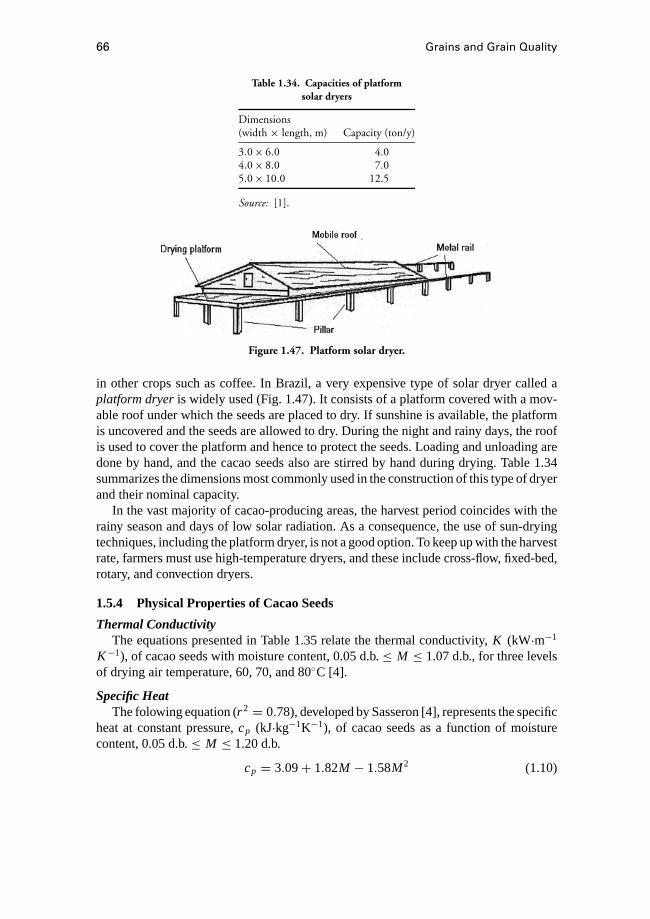
66 Grains and Grain Quality
Table 1.34. Capacities of platformsolar dryers
Dimensions(width × length, m) Capacity (ton/y)
3.0× 6.0 4.04.0× 8.0 7.05.0× 10.0 12.5
Source: [1].
Figure 1.47. Platform solar dryer.
in other crops such as coffee. In Brazil, a very expensive type of solar dryer called aplatform dryeris widely used (Fig. 1.47). It consists of a platform covered with a mov-able roof under which the seeds are placed to dry. If sunshine is available, the platformis uncovered and the seeds are allowed to dry. During the night and rainy days, the roofis used to cover the platform and hence to protect the seeds. Loading and unloading aredone by hand, and the cacao seeds also are stirred by hand during drying. Table 1.34summarizes the dimensions most commonly used in the construction of this type of dryerand their nominal capacity.
In the vast majority of cacao-producing areas, the harvest period coincides with therainy season and days of low solar radiation. As a consequence, the use of sun-dryingtechniques, including the platform dryer, is not a good option. To keep up with the harvestrate, farmers must use high-temperature dryers, and these include cross-flow, fixed-bed,rotary, and convection dryers.
1.5.4 Physical Properties of Cacao Seeds
Thermal ConductivityThe equations presented in Table 1.35 relate the thermal conductivity,K (kW·m−1
K−1), of cacao seeds with moisture content, 0.05 d.b.≤ M ≤ 1.07 d.b., for three levelsof drying air temperature, 60, 70, and 80◦C [4].
Specific HeatThe folowing equation (r 2 = 0.78), developed by Sasseron [4], represents the specific
heat at constant pressure,cp (kJ·kg−1K−1), of cacao seeds as a function of moisturecontent, 0.05 d.b.≤ M ≤ 1.20 d.b.
cp = 3.09+ 1.82M − 1.58M2 (1.10)

Grain Drying and Storage in the Tropics 67
Table 1.35. Thermal conductivity of cacao seeds
Drying-airTemperature (◦C) Equation r 2
60 K = 0.1362+ 0.2554M 0.9670 K = 0.1343+ 0.2561M 0.9780 K = 0.1061+ 0.2878M 0.98
Source: [4].
According to Eq. (1.10), for moisture contents in the range from approximately 0.43to 1.20 d.b., the specific heat of cacao seeds decreases with increasing moisture. Thisfact clearly contradicts the expected physical behaviour and must be acconted for byexperimental errors during measurements.
Bulk DensityThe bulk density,ρ (kg·m−3), of cacao seeds as affected by moisture content, 0.05
d.b.≤ M ≤ 1.07 d.b., may be represented by either of the following equations developedby Sasseron [4], with coefficients of correlation of 0.93 and 0.99, respectively:
ρ = 938.2+ 153.5M (1.11)
ρ = 875.8+ 582.8M − 613.7M2+ 233.0M3 (1.12)
Thermal DiffusivityThe effect of moisture content, 0.05 d.b.≤ M ≤ 1.07 d.b., on the thermal diffusivity,
α (m2s−1), of cacao seeds during drying at 70◦C is given by the following equation [4],with a coefficient of determination of 0.97:
α = 3.67× 10⁻⁵+ 7.70× 10⁻⁵M (1.13)
Thin-layer Drying EquationThe following equation (r 2 = 0.99) describes the drying rate of a thin-layer of cacao
seeds for drying-air temperatures ranging between 60 and 80◦C.
MR= 0.4329 exp[−(0.5036− 0.0141Tabs+ 0.00013T2
abs
)t]
+0.5670 exp[−(−23.9335+ 0.6973Tabs− 0.0046T2
abs
)t], (1.14)
whereTabs is the absolute air temperature (K), andt is time to dry toMR(moisture ratio)with drying air temperatureTabs (h).
References
1. Silva, J. S., and P. C. Corrˆea. 1995. Secagem com energia solar. [Solar drying]. InPre-processamento de produtos agrıcolas[Handling, Drying, and Storage of AgriculturalProducts], ed. J. S. Silva, pp. 145–161. Juiz de Fora, MG, Brazil: DepartamentoEditorial do Instituto Maria.
2. Teter, N. 1987. Paddy drying manual. FAO Agricultural Services Bulletin no. 70.Rome: Food and Agriculture Organization of the United Nations.

68 Grains and Grain Quality
3. Silva, J. S., and A. F. Lacerda Filho, 1984. Constru¸cao de secador para produtosagrıcolas [Design and construction of a fixed bed dryer for agricultural products].Informe tecnico no. 41. Vi¸cosa, MG, Brazil: Conselho de Extens˜ao da UniversidadeFederal de Vi¸cosa.
4. Sasseron, J. L. 1984. Avalia¸cao de propriedades f´ısicas e curvas de secagem, emcamadas finas, de amˆendoas de cacau (Theobroma cacaoL.) [Determination of somephysical properties and a thin-layer drying equation of cacao (Theobroma cacaoL.)seeds]. M.Sc. thesis, Universidade Federal de Vi¸cosa, MG, Brazil.
2 Root Crops
J. De Baerdemaeker, Co-Editor
2.1 Root Crop Quality and LossesJ. De Baerdemaeker, N. Scheerlinck, P. Jancsok, and P. Verboven
Storage of root crops reduces the seasonal character of crop availability for the freshmarket or for the food industry. Most products are harvested during a specific season thatmay last several months, but the consumption of these staple foods can occur all yearround. For example, in the Northern Hemisphere, potatoes are harvested between Mayand October, but by using appropriate storage practices a quality product is available forthe consumer throughout the year.
Similarly, the storage of a crop has economic advantages, as it extends the processingseason and keeps the processing plants running continuously. It also helps food processorsbridge short-term periods of low supply of freshly harvested products. Sometimes theavailability of good storage facilities can reduce the purchase cost, as raw materials canbe purchased at favorable market prices. For the farmers, crop storage may lead to a betteraverage price by avoiding an oversupply on the market during the harvesting season.
It should be noted that storage conditions are important not only while the crop isbeing stored but also during transportation.
A Committee on Postharvest Food Losses in Developing Countries of the U.S.National Academy of Sciences–National Research Council issued a report in 1978 withestimates of food losses. The overall losses for roots and tubers vary between 5% and100%. The main causes of product loss are mechanical injury, physiological losses, andlosses due to diseases. Attacks on stored products by rodents or insects may be importantin some cases but are mostly of minor importance in comparison with damage resultingfrom microorganisms. One can assume that similar causes of loss exist in most countries,but that the extent of loss may vary depending on the conditions and technical expertiseavailable for storage design and management.
In the following pages a general discussion will be given on quality aspects and productproperties for root crops and how they are affected by growing conditions. Causes oflosses and some influencing factors also are given. In the last subsection of this section, ageneral approach to crop storage modeling is given in an effort to combine experimentalevidence and physical phenomena in order to gain insight in storage behavior of crops.Other sections deal with a number of specific root crops. From an understanding of the
69

70 Root Crops
basic interrelationships between crop properties and crop physiology, the causes of cropdeterioration and damage, and the physical aspects of storage can often lead to simplechanges in storage practices that are effective in reducing losses.
2.1.1 Morphology of Roots, Tubers, and Bulbs
A morphological classification of plant parts allows an understanding of the nature ofthe harvested product. When taking into account the development stage of the plant orthe plant part, it can help to predict the storage behavior and the handling requirements,even if no specific product information is available. An illustration of the plant partsused as vegetables is given in Fig. 2.1 [1]. Roots, tubers, and bulbs are the belowgroundstructures of interest in this section. These parts serve as storage organs, containing
Figure 2.1. Plant parts utilized as food are derived from virtually every portion of the plant. Thisdiagram illustrates examples of various parts from a cross-section of plants used as vegetables.
(Source: [2])
Root Crop Quality and Losses 71
products accumulated during photosynthesis. The fleshy roots, tubers, or bulbs often arethe only vegetative organs of a plant that are capable of surviving severe environmentalstresses such as prolonged periods of cold or drought. They can be used as sources ofraw material for human consumption or for processing. During a dormant period, forexample after harvest, the buds of the storage organs use the stored reserves to maintaina low metabolic activity.
RootsThe storage organs of several crops are modified roots that contain mainly starch and
sugar reserves. In carrots, the storage root is formed from the hypocotyl and taproot tissue.Secondary growth results in a central xylem core surrounded by phloem and pericycletissue with a massive development of parenchyma cells containing starch and sugars.
The sweet potato is an adventitious root with an anomalous secondary growth. Thefleshiness is due to a large volume of parenchyma in the primary and secondary xylem.During the secondary growth, the epidermis is replaced by protective tissue called theperiderm.
TubersTubers, for example potatoes, are underground parts that are anatomically the tip of a
stem or rhizome with the appearance of a root. They have visible leaf and branch buds andare characterized by a central vascular cylinder and a thick cortex. The phloem is largerthan the xylem. The rapid volume expansion of potato tubers is due to the proliferationof parenchyma around the pith. The stored reserves are mostly starch with some sugarsand proteins.
BulbsBulbs, such as onions, are underground buds in whichthe stem is reduced to a late
with very short internodes, and the sheating leaf bases are swollen to form a storageorgan. At normal harvest maturity, the aboveground parts of the leaves shrivel, while theswollen leave bases remain alive.
Adequate curing or drying of the neck and the outer leaf bases forms a protectivecoating of dry tissue. During the dormant period, the metabolic activity of these storageorgans is low, and their keeping quality is good. The protective periderm originates fromlayers of tightly arranged cork cells with virtually no space between cells. When mature,these cells are suberized and contain layers of suberin, a fatty acid, and wax in the cellwalls. The tissue of potato tubers or of sweet-potato roots maintains its ability to formepiderm even after harvest, provided that favorable temperature and humidity conditionsexist. Warmth and a high relative humidity during a period of a few days after harvestfavors the formation of periderm and of wound periderm, periderm formed when cropsare damaged during harvest. The ability to heal damaged or cut periderm, by forming anew layer, protects the tissue from excessive water loss or invasion by pathogens.
2.1.2 Product Respiration
Respiration is a central process that occurs in all living cells; it is essential for themaintenance of life in products after harvest. The function of respiration is the release
72 Root Crops
of energy and the formation of carbon skeletons, and it is imperative for synthesisor maintenance reactions after harvest. The respiratory activity does not require lightand occurs in the mitochondria and cytoplasm. The substrates used are oxygen andstored carbon compounds, such as starch. Carbon dioxide, water, and energy are the endproducts. Because these mostly are released into the surrounding atmosphere, the overalleffect is a loss in weight of the stored product. The utilization of the stored energy is aprocess that has an effect on the product quality and is related to the overall metabolicchanges that occur in the stored plant. Therefore, although certain metabolic changesmay occur without a measurable change in respiration rate, the respiration rate remainsa general indicator of the overall metabolic rate.
A simplified representation of the process is:
C6H12O6+ 6O2→ 6CO2+ 6H2O+ 2667 kJ energy
As there is little cell development or growth in stored products, the respiration energy ismainly in the form of heat rather than adenosine triphosphate.
The measurement of the respiration rate can be based on concentration changes in anyof the reactants or products involved in the process. In general, oxygen utilization or car-bon dioxide production is used, because these can be measured with relative ease and ad-equate accuracy. Techniques for measuring the respiration rate are not discussed here [1].
The respiratory activity of plants is strongly affected by a number of crop factors andenvironmental factors. Because the end quality of a stored product is a direct result ofthe respiration activity, it is mandatory to have a proper management and control of thesefactors in order to optimize storage life.
Crop Factors
Species and CultivarsAlthough differences in respiration rate may be expected between species, there may
also exist substantial differences among cultivars, resulting in differences in their storagepotentials [1].
Moisture ContentIn general, metabolic processes slow down with decreasing moisture content. How-
ever, decreasing the moisture content of fleshy products like roots or tubers is not anattractive method to control respiration, because moisture content is closely related toproduct quality.
Surface and Volume PropertiesThe respiration rate of a product is usually proportional to the product mass. How-
ever, gas exchange with the environment occurs at the product surface, and the surface-to-volume ratio can play an important role when considering the appropriate storageconditions. In addition, the gas-diffusion properties of both the fleshy tissue and thesurface tissue are important. They may result in considerable gradients in gas concen-trationsbetween the fleshy tissue and the surrounding tissue [1]. Natural surfaces of theproducts like the epiderm or the dried outer layers of onions tend to increase the diffusiveresistance to the migration of oxygen, carbon dioxide, or water. In a later section, these
Root Crop Quality and Losses 73
diffusion resistances are incorporated in the mathematical models for describing storageprocesses.
Cultural Practices and Stage of Development at Time of HarvestThe product composition in general is affected by these factors and in turn may affect
the respiratory behavior. This explains, in part, differences in final quality that existamong crops harvested at different locations but stored in the same storage room.
WoundingThe respiratory activity of wounded plant tissue increases because of an increase
in the required healing substances such as lignin, suberin, or sometimes also callus.Infection of the wounds by microorganisms also increases the respiration because ofdefense reactions by the cells. In addition to these effects, wounding also alters the gasdiffusion resistance of the product surface.
Environmental Factors
TemperatureThe metabolic rate of a harvested product is strongly influenced by the product tem-
perature. An increased temperature results in increased reaction rates; not all reactionshave the same change in rate with temperature. The change in respiration rate due toa change in temperature represents the overall effect of temperature on the differentchemical reactions of the respiration process. Keeping the product quality throughout astorage period as near as possible to the quality at harvest time requires that the metabolicprocesses be slowed down as much as possible. This is best achieved by storage at lowtemperature, provided that no other adverse effects, such as cell-membrane damage,occur at low temperatures.
Some metabolic processes are exceptions to this overall effect. For example, in pota-toes the respiration rate decreases with temperature, but the formation of sugars increasesdramatically with a decrease in temperature below 10◦C.
Different equations have been proposed to express the temperature dependency of therespiration rate. One such measure is theQ10 value, the ratio of the respiration rate atone temperature (T1) to the rate at a temperature 10◦C higher [1]:
Q10 = rate atT1+ 10◦Crate atT1
(2.1)
For many products theQ10 value for respiration is between 2.0 and 2.5 in the temperaturerange between 2◦C and 25◦C.
Another way to describe the temperature dependency of the respiration rate is usingan Arrhenius-type equation.
This is of the form:
Rate constant= Be−A
RT (2.2)
With R the gas constant,T the absolute temperature, andA andB constants.Based on data from the U.S. Department of Agriculture [2], the carbon dioxide pro-
duction of products can be expressed as a function of temperature, by a least-square
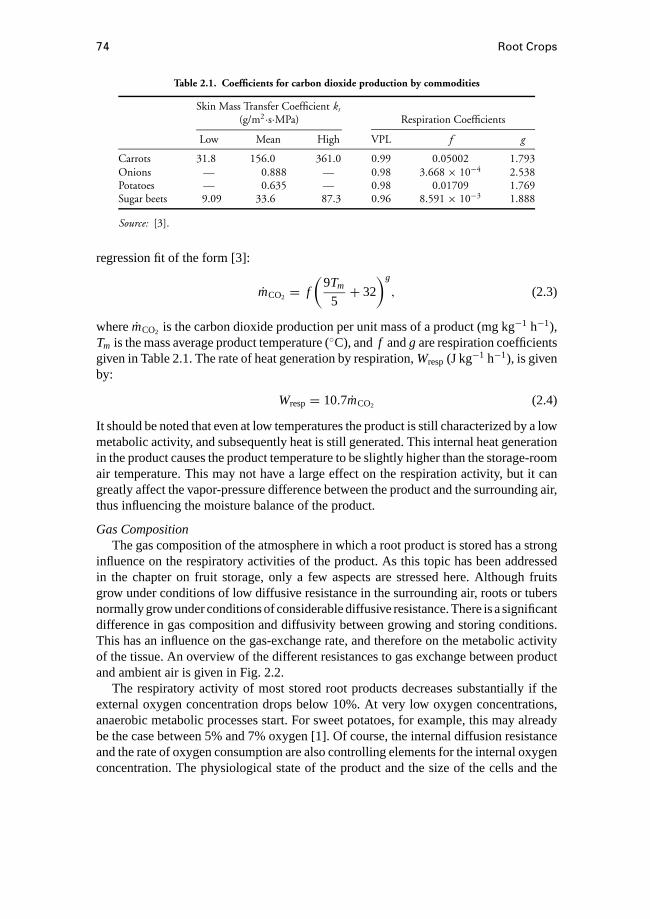
74 Root Crops
Table 2.1. Coefficients for carbon dioxide production by commodities
Skin Mass Transfer Coefficient ks
(g/m2·s·MPa) Respiration Coefficients
Low Mean High VPL f g
Carrots 31.8 156.0 361.0 0.99 0.05002 1.793Onions — 0.888 — 0.98 3.668 × 10⁻⁴ 2.538Potatoes — 0.635 — 0.98 0.01709 1.769Sugar beets 9.09 33.6 87.3 0.96 8.591 × 10⁻³ 1.888
Source: [3].
regression fit of the form [3]:
mCO2 = f
(9Tm
5+ 32
)g
, (2.3)
wheremCO2 is the carbon dioxide production per unit mass of a product (mg kg−1 h−1),Tm is the mass average product temperature (◦C), and f andg are respiration coefficientsgiven in Table 2.1. The rate of heat generation by respiration,Wresp(J kg−1 h−1), is givenby:
Wresp= 10.7mCO2 (2.4)
It should be noted that even at low temperatures the product is still characterized by a lowmetabolic activity, and subsequently heat is still generated. This internal heat generationin the product causes the product temperature to be slightly higher than the storage-roomair temperature. This may not have a large effect on the respiration activity, but it cangreatly affect the vapor-pressure difference between the product and the surrounding air,thus influencing the moisture balance of the product.
Gas CompositionThe gas composition of the atmosphere in which a root product is stored has a strong
influence on the respiratory activities of the product. As this topic has been addressedin the chapter on fruit storage, only a few aspects are stressed here. Although fruitsgrow under conditions of low diffusive resistance in the surrounding air, roots or tubersnormally grow under conditions of considerable diffusive resistance. There is a significantdifference in gas composition and diffusivity between growing and storing conditions.This has an influence on the gas-exchange rate, and therefore on the metabolic activityof the tissue. An overview of the different resistances to gas exchange between productand ambient air is given in Fig. 2.2.
The respiratory activity of most stored root products decreases substantially if theexternal oxygen concentration drops below 10%. At very low oxygen concentrations,anaerobic metabolic processes start. For sweet potatoes, for example, this may alreadybe the case between 5% and 7% oxygen [1]. Of course, the internal diffusion resistanceand the rate of oxygen consumption are also controlling elements for the internal oxygenconcentration. The physiological state of the product and the size of the cells and the
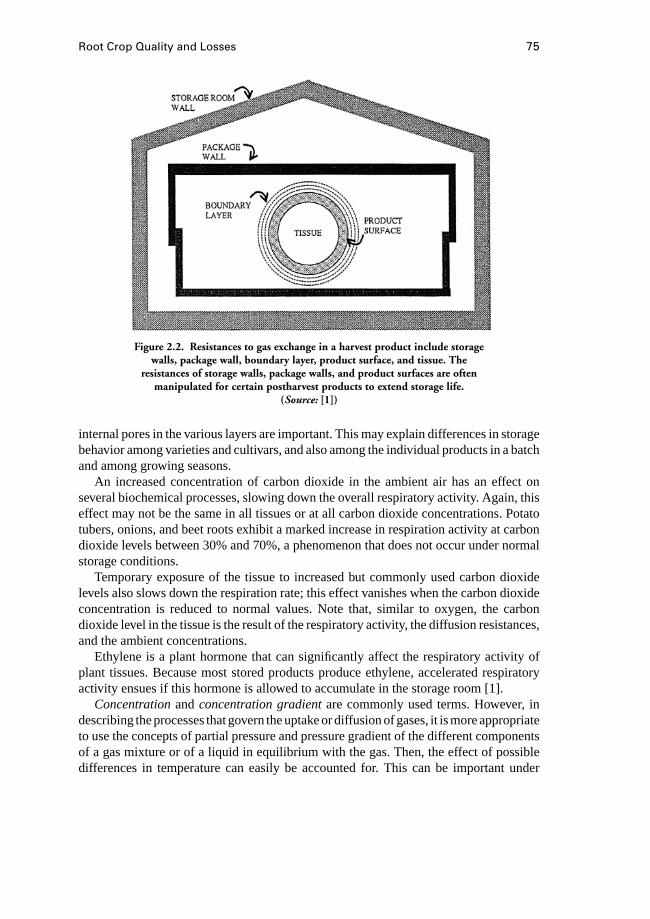
Root Crop Quality and Losses 75
Figure 2.2. Resistances to gas exchange in a harvest product include storagewalls, package wall, boundary layer, product surface, and tissue. The
resistances of storage walls, package walls, and product surfaces are oftenmanipulated for certain postharvest products to extend storage life.
(Source: [1])
internal pores in the various layers are important. This may explain differences in storagebehavior among varieties and cultivars, and also among the individual products in a batchand among growing seasons.
An increased concentration of carbon dioxide in the ambient air has an effect onseveral biochemical processes, slowing down the overall respiratory activity. Again, thiseffect may not be the same in all tissues or at all carbon dioxide concentrations. Potatotubers, onions, and beet roots exhibit a marked increase in respiration activity at carbondioxide levels between 30% and 70%, a phenomenon that does not occur under normalstorage conditions.
Temporary exposure of the tissue to increased but commonly used carbon dioxidelevels also slows down the respiration rate; this effect vanishes when the carbon dioxideconcentration is reduced to normal values. Note that, similar to oxygen, the carbondioxide level in the tissue is the result of the respiratory activity, the diffusion resistances,and the ambient concentrations.
Ethylene is a plant hormone that can significantly affect the respiratory activity ofplant tissues. Because most stored products produce ethylene, accelerated respiratoryactivity ensues if this hormone is allowed to accumulate in the storage room [1].
Concentrationandconcentration gradientare commonly used terms. However, indescribing the processes that govern the uptake or diffusion of gases, it is more appropriateto use the concepts of partial pressure and pressure gradient of the different componentsof a gas mixture or of a liquid in equilibrium with the gas. Then, the effect of possibledifferences in temperature can easily be accounted for. This can be important under
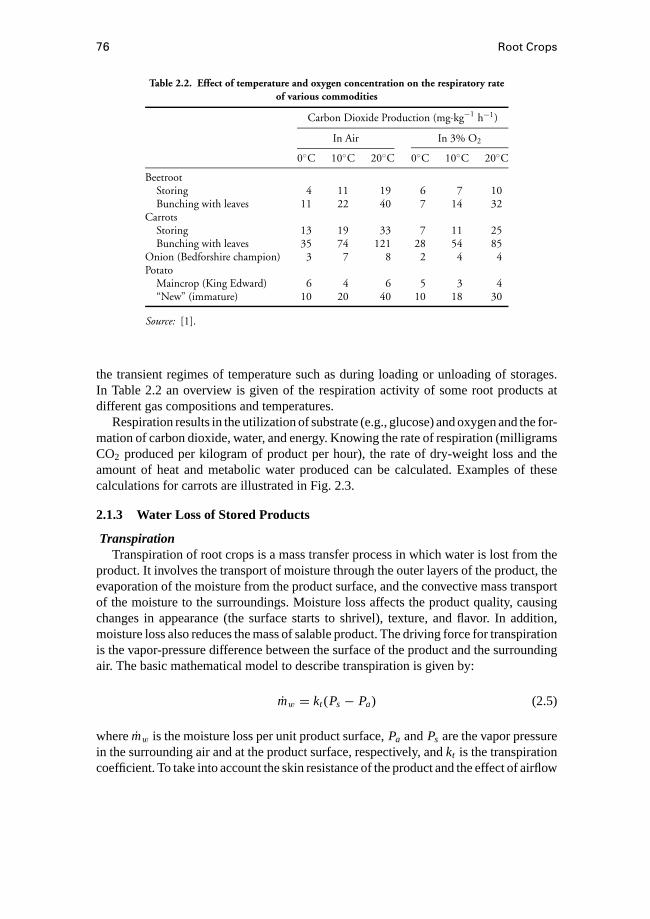
76 Root Crops
Table 2.2. Effect of temperature and oxygen concentration on the respiratory rateof various commodities
Carbon Dioxide Production (mg·kg−1 h−1)
In Air In 3% O2
0◦C 10◦C 20◦C 0◦C 10◦C 20◦C
BeetrootStoring 4 11 19 6 7 10Bunching with leaves 11 22 40 7 14 32
CarrotsStoring 13 19 33 7 11 25Bunching with leaves 35 74 121 28 54 85
Onion (Bedforshire champion) 3 7 8 2 4 4Potato
Maincrop (King Edward) 6 4 6 5 3 4“New” (immature) 10 20 40 10 18 30
Source: [1].
the transient regimes of temperature such as during loading or unloading of storages.In Table 2.2 an overview is given of the respiration activity of some root products atdifferent gas compositions and temperatures.
Respiration results in the utilization of substrate (e.g., glucose) and oxygen and the for-mation of carbon dioxide, water, and energy. Knowing the rate of respiration (milligramsCO2 produced per kilogram of product per hour), the rate of dry-weight loss and theamount of heat and metabolic water produced can be calculated. Examples of thesecalculations for carrots are illustrated in Fig. 2.3.
2.1.3 Water Loss of Stored Products
TranspirationTranspiration of root crops is a mass transfer process in which water is lost from the
product. It involves the transport of moisture through the outer layers of the product, theevaporation of the moisture from the product surface, and the convective mass transportof the moisture to the surroundings. Moisture loss affects the product quality, causingchanges in appearance (the surface starts to shrivel), texture, and flavor. In addition,moisture loss also reduces the mass of salable product. The driving force for transpirationis the vapor-pressure difference between the surface of the product and the surroundingair. The basic mathematical model to describe transpiration is given by:
mw = kt (Ps − Pa) (2.5)
wheremw is the moisture loss per unit product surface,Pa andPs are the vapor pressurein the surrounding air and at the product surface, respectively, andkt is the transpirationcoefficient. To take into account the skin resistance of the product and the effect of airflow
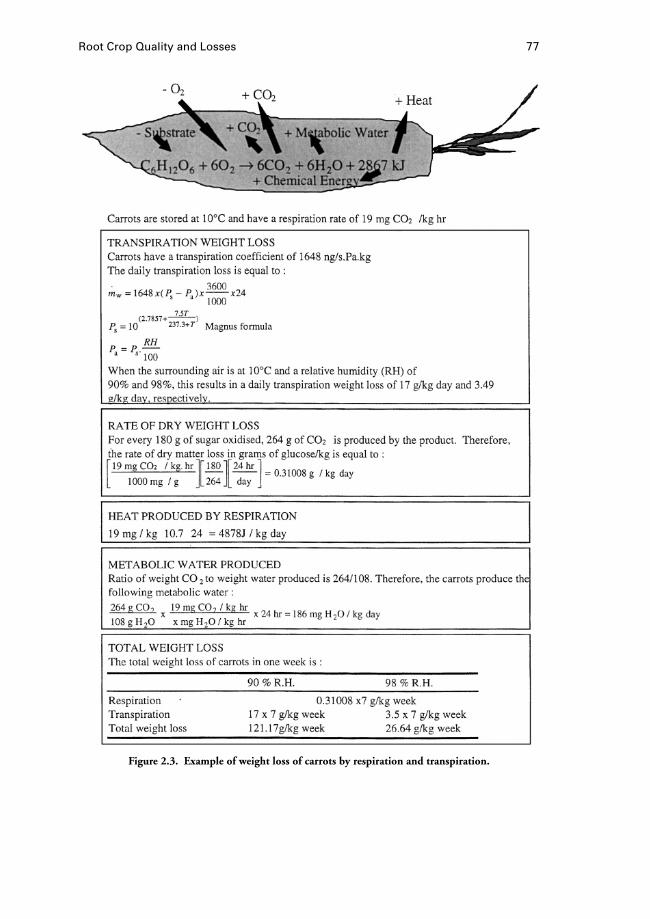
Root Crop Quality and Losses 77
Figure 2.3. Example of weight loss of carrots by respiration and transpiration.
78 Root Crops
rate, the transpiration coefficient is modified as follows [5]:
1
kt= 1
ka+ 1
ks(2.6)
The convective mass transfer at the surface,ka, is a function of the airflow rate. The skinmass-transfer coefficientks accounts for the diffusional resistance of the skin towardsmoisture migration. The skin mass-transfer coefficient is dependent on the product typeand may vary over the surface. Crops with a cuticle have a low skin mass-transfercoefficient except if they have sufficient stomatas. Roots and tubers with a periderm withliving cells have a high mass-transfer coefficient. After suberization, the potato peridermhas layers of cork cells that offer some protection from moisture loss and have a lowermass-transfer coefficient.
The fact that only a fraction of the product surface may be permeable for water vaporsometimes is specified explicitly in the expression for the transpiration coefficient [6]:
1
kt= γ
(1
kext+ 1
kint
)(2.7)
whereγ is the fraction of the surface permeable for water vapor,kext is the externalmass transfer coefficient, andkint is the internal mass transfer coefficient. The latterdepends on the internal (skin-layer) diffusion coefficient for water vapor and also on thevapor-pressure difference inside and outside the product [7].
In model calculations it is convenient to use values ofks that have been obtainedexperimentally [8, 9]. Values for the convective mass transfer coefficient at the surfaceare calculated from the Sherwood-Reynolds-Schmidt correlation [8]:
Sh= 2.0+ 0.552Re0.53Sc0.33 (2.8)
whereRe is the Reynolds number,Sc is the Schmidt number, andSh is the Sherwoodnumber
Sh= ka + d
δ
whereδ is the diffusion coefficient of water vapor in air. Values of skin mass-transfercoefficients are given in Table 2.1.
In storage conditions in which natural convection is significant, the airflow rate iscaused by internal heat generation and by evaporative cooling resulting from transpi-ration. A higher fraction of surface permeable to water results in a higher rate of totalmoisture loss and thus in lower temperature differences and lower air velocities understeady-state conditions [6]. Also, it seems better to have a large porosity of the bulkstored product. This results in a lower maximum temperature, while the total rate ofmoisture loss appears to be only slightly affected.
Water Potential and Internal Water StatusInstead of the use of moisture concentrations to describe the internal water status of
root crops, the concept of water potential often is preferred. The concept is based on the

Root Crop Quality and Losses 79
chemical potential of water and is defined as follows:
ψ = µ− µref
Vw(2.9)
whereψ is the water potential (Pa),µ is the chemical potential of water of the system inquestion (J mol−1),µref is the reference value of the chemical potential of water (J mol−1),andVw is the molal volume of water, given as 0.000018 m3 mol−1.
Equations to determine water potential for air,ψair, and solutions,ψsol, are [10]:
ψair = (RT/Vw) ln(RH/100) (2.10)
and
ψsol = (RT/Vw) ln Nw (2.11)
whereR is the gas constant,T the absolute temperature, RH the relative humidity,Nwthe molal fraction of water of the solution, andVw the constant molal volume of water.
The water potential of a systemψ potentially can be subdivided into a number ofpotentials, including the vapor potentialψv, osmotic potentialψo, turgor potentialψt ,matrix potentialψm, and gravitational potentialψg:
ψ = ψv + ψo + ψt + ψm + ψg (2.12)
For a description of the water status of plants, the osmotic and turgor potential are ofprimary importance; the other factors can largely be neglected. Consider a plant cell andthe interstitial moisture around the cell. Because the water in the cell cytoplasm contains ahigher concentration in solutes than the water outside the cell, the osmotic potential of thecytoplasm is more negative than the osmotic potential outside the cell. This difference inosmotic potential causes moisture to migrate through the semipermeable cell membraneinto the cell.
The process of moisture migration into cells continues until the turgor potential,associated with the turgor pressure created by the rigid cell wall of plant cells, equalsthe osmotic potential. At this point, a hydrostatic equilibrium is reached. Conversely, ifthe transpiration is excessive, water diffuses out of the cells into the interstitial spacesdue to a reversed water potential, and the turgor potential drops. The product loses itsturgidity and firmness.
Transfer of Moisture During TranspirationIf a root, tuber, or bulb is exposed to air, moisture loss to the surroundings may take
place. Although it is tempting to say that the driving force for the transfer of moistureto the air is the gradient in moisture concentration, the correct explanation is that theproduct possesses a higher water potential than the air and that moisture migrates froma high water potential to a low water potential. It is therefore clear that moisture in a rootmigrates towards the surface,where it subsequently evaporates into the surrounding air.The following differential equation can be used to describe the migration of moisture inroot crops [10]:
∂M
∂t= ∇km∇ψ. (2.13)
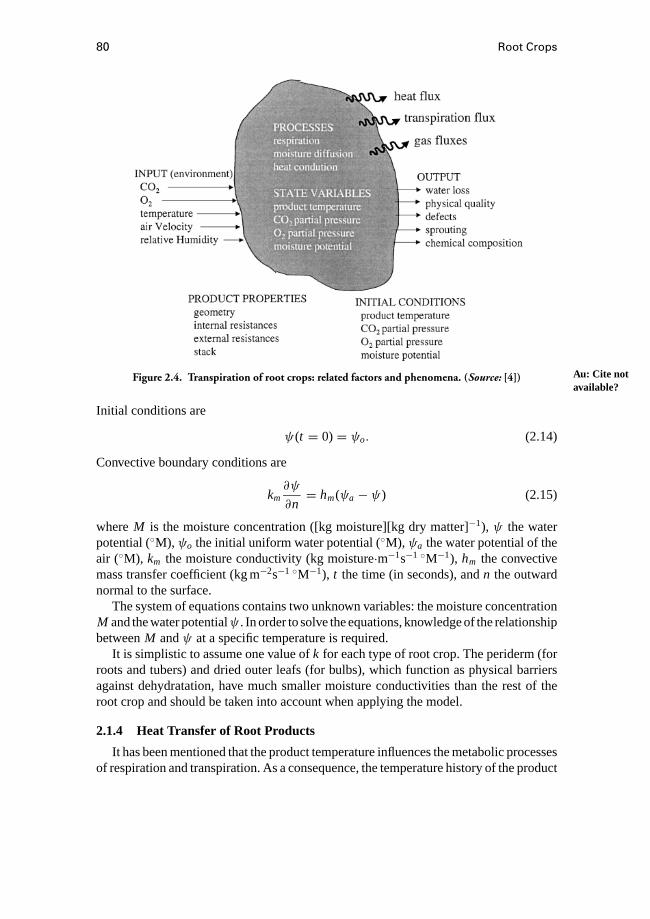
80 Root Crops
Figure 2.4. Transpiration of root crops: related factors and phenomena. (Source: [4]) Au: Cite notavailable?
Initial conditions are
ψ(t = 0)= ψo. (2.14)
Convective boundary conditions are
km∂ψ
∂n= hm(ψa − ψ) (2.15)
whereM is the moisture concentration ([kg moisture][kg dry matter]−1), ψ the waterpotential (◦M), ψo the initial uniform water potential (◦M), ψa the water potential of theair (◦M), km the moisture conductivity (kg moisture·m−1s−1 ◦M−1), hm the convectivemass transfer coefficient (kg m−2s−1 ◦M−1), t the time (in seconds), andn the outwardnormal to the surface.
The system of equations contains two unknown variables: the moisture concentrationM and the water potentialψ . In order to solve the equations, knowledge of the relationshipbetweenM andψ at a specific temperature is required.
It is simplistic to assume one value ofk for each type of root crop. The periderm (forroots and tubers) and dried outer leafs (for bulbs), which function as physical barriersagainst dehydratation, have much smaller moisture conductivities than the rest of theroot crop and should be taken into account when applying the model.
2.1.4 Heat Transfer of Root Products
It has been mentioned that the product temperature influences the metabolic processesof respiration and transpiration. As a consequence, the temperature history of the product
Root Crop Quality and Losses 81
affects the quality of the product after storage. One of the most important steps afterharvest is the removal of heat stored in the product. Indeed, at harvest time the productis at a temperature at which the respiration rate is high and the quality degrades rapidly.Although one could consider modeling the simultaneous heat and mass transfer insidethe product, it may be more adequate to uncouple these two phenomena and addressheat transfer separately. Heat transfer inside the product can be described by the Fourierequation, a partial-differential equation involving the change in heat content as a functionof temperature and heat generation [27]:
ρpcp∂Tp
∂t= ∇(kp∇Tp)+ qresp (2.16)
Tp(x, y, z, t) = Tp,ini (x, y, z) at t = t0 (2.17)
whereρp is the product density (kg m−3), cp the specific heat capacity, (J kg−1 ◦C−1),kp the thermal conductivity (W m−1 ◦C−1), Tp the temperature (◦C), Tp,ini the initialtemperature (◦C), t time (s),t0 initial time (s),x, y, andz Cartesian coordinates (m), andqresp the volumetric specific respiration rate (W m−3). Also:
qresp= ρpQresp
3600(2.18)
whereQresp is the specific respiration rate (J hr−1kg−1).In order to obtain the temperature distribution inside the root product as a function of
time, the boundary conditions describing the energy transfer at the product surface0s
should be specified.The different terms in the boundary conditions can be heat transfer by radiation (qrad),
either absorbed or released to the surroundings:
qrad= εσ(T4
s − T4w
)(2.19)
whereε is the emissivity,σ the Stefan-Boltzmann constant (W m−2 ◦C−4), Ts the surfacetemperature (◦C), andTw the surrounding temperature; heat lost or gained by convection:
qconv= h(Ts − Ta) (2.20)
whereh is the surface heat transfer coefficient (W m−2 ◦C−1), Ts the surface temperature(◦C), andTa the ambient (air) temperature.
Heat lost or gained as latent heat of evaporation or condensation:
qevap= mw(cmTs − cvTa − h f g) (2.21)
wheremw is the moisture loss per unit surface (kg s−1m−2), hf g the latent heat of va-porization of water (J kg−1), cm the specific heat capacity of the moisture in the product(J kg−1 ◦C−1), Ts the surface temperature (◦C), cv the specific heat capacity of the vaporin the air (J kg−1 ◦C−1), andTa the ambient (air) temperature (◦C); or heat lost or gainedby conduction to other units or to the side walls of the container or of the storage room:
qcond= −kcont∂Tcont
∂n
∣∣∣∣at contact point
(2.22)
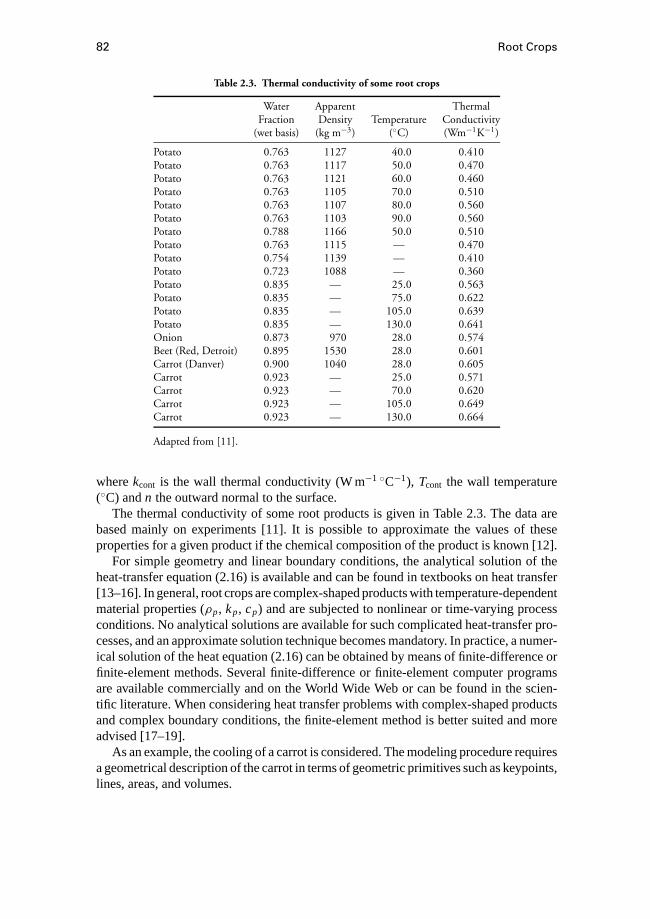
82 Root Crops
Table 2.3. Thermal conductivity of some root crops
Water Apparent ThermalFraction Density Temperature Conductivity
(wet basis) (kg m−3) (◦C) (Wm−1K−1)
Potato 0.763 1127 40.0 0.410Potato 0.763 1117 50.0 0.470Potato 0.763 1121 60.0 0.460Potato 0.763 1105 70.0 0.510Potato 0.763 1107 80.0 0.560Potato 0.763 1103 90.0 0.560Potato 0.788 1166 50.0 0.510Potato 0.763 1115 — 0.470Potato 0.754 1139 — 0.410Potato 0.723 1088 — 0.360Potato 0.835 — 25.0 0.563Potato 0.835 — 75.0 0.622Potato 0.835 — 105.0 0.639Potato 0.835 — 130.0 0.641Onion 0.873 970 28.0 0.574Beet (Red, Detroit) 0.895 1530 28.0 0.601Carrot (Danver) 0.900 1040 28.0 0.605Carrot 0.923 — 25.0 0.571Carrot 0.923 — 70.0 0.620Carrot 0.923 — 105.0 0.649Carrot 0.923 — 130.0 0.664
Adapted from [11].
wherekcont is the wall thermal conductivity (W m−1 ◦C−1), Tcont the wall temperature(◦C) andn the outward normal to the surface.
The thermal conductivity of some root products is given in Table 2.3. The data arebased mainly on experiments [11]. It is possible to approximate the values of theseproperties for a given product if the chemical composition of the product is known [12].
For simple geometry and linear boundary conditions, the analytical solution of theheat-transfer equation (2.16) is available and can be found in textbooks on heat transfer[13–16]. In general, root crops are complex-shaped products with temperature-dependentmaterial properties (ρp, kp, cp) and are subjected to nonlinear or time-varying processconditions. No analytical solutions are available for such complicated heat-transfer pro-cesses, and an approximate solution technique becomes mandatory. In practice, a numer-ical solution of the heat equation (2.16) can be obtained by means of finite-difference orfinite-element methods. Several finite-difference or finite-element computer programsare available commercially and on the World Wide Web or can be found in the scien-tific literature. When considering heat transfer problems with complex-shaped productsand complex boundary conditions, the finite-element method is better suited and moreadvised [17–19].
As an example, the cooling of a carrot is considered. The modeling procedure requiresa geometrical description of the carrot in terms of geometric primitives such as keypoints,lines, areas, and volumes.
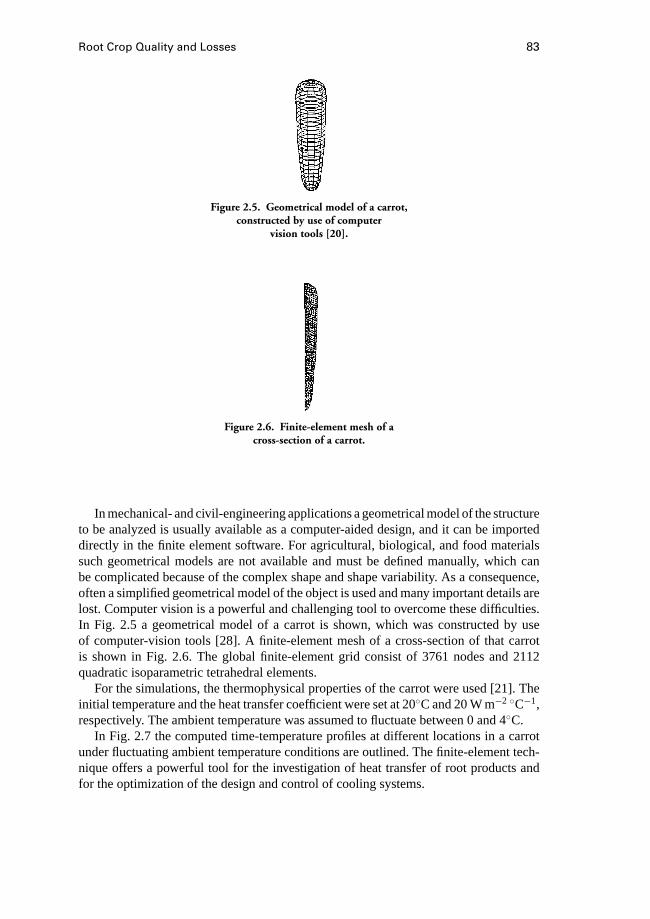
Root Crop Quality and Losses 83
Figure 2.5. Geometrical model of a carrot,constructed by use of computer
vision tools [20].
Figure 2.6. Finite-element mesh of across-section of a carrot.
In mechanical- and civil-engineering applications a geometrical model of the structureto be analyzed is usually available as a computer-aided design, and it can be importeddirectly in the finite element software. For agricultural, biological, and food materialssuch geometrical models are not available and must be defined manually, which canbe complicated because of the complex shape and shape variability. As a consequence,often a simplified geometrical model of the object is used and many important details arelost. Computer vision is a powerful and challenging tool to overcome these difficulties.In Fig. 2.5 a geometrical model of a carrot is shown, which was constructed by useof computer-vision tools [28]. A finite-element mesh of a cross-section of that carrotis shown in Fig. 2.6. The global finite-element grid consist of 3761 nodes and 2112quadratic isoparametric tetrahedral elements.
For the simulations, the thermophysical properties of the carrot were used [21]. Theinitial temperature and the heat transfer coefficient were set at 20◦C and 20 W m−2 ◦C−1,respectively. The ambient temperature was assumed to fluctuate between 0 and 4◦C.
In Fig. 2.7 the computed time-temperature profiles at different locations in a carrotunder fluctuating ambient temperature conditions are outlined. The finite-element tech-nique offers a powerful tool for the investigation of heat transfer of root products andfor the optimization of the design and control of cooling systems.

84 Root Crops
Figure 2.7. Time-temperature profiles for the cooling of a carrot at differentlocations. A, ambient temperature; B, coldest points; C, warmest point.
2.1.5 Modeling Heat and Moisture Transfer in Forced ConvectionBulk-Product Storage
In the previous paragraphs considerable attention was given to heat and mass trans-fer within individual root particles and to the relation of heat and mass transfer withmetabolic processes. In this subsection, the bulk product in a container or in a storageroom is considered. Therefore, the airflow and the heat and mass exchange betweenthe products and the surrounding air must be taken into account. The modeling helpsto understand the effects of storage size and shape or dimensions of containers on thetemperature and moisture distribution (and product quality) at different locations in thestore. A one-dimensional approach is given here in the hope that this will encouragethe reader to further explore the modeling process to improve the understanding of theinteraction between physical and physiological processes occurring during product stor-age. It will become clear that the model development is based on the heat and masstransfer equations derived in previous paragraphs for individual roots or tubers.
Several approaches have been published for modeling the cooling in bulk stored prod-ucts in order to forecast the temperature and moisture evolution in the stack and the indi-vidual products. These models have some similarity with the models developed for graindrying, but some important differences exist. The most extensive model representation[22] involves a two-phase model with internal temperature gradients for the solid phase,that is, for the product. Evaporative heat losses at the surface and internal heat generation
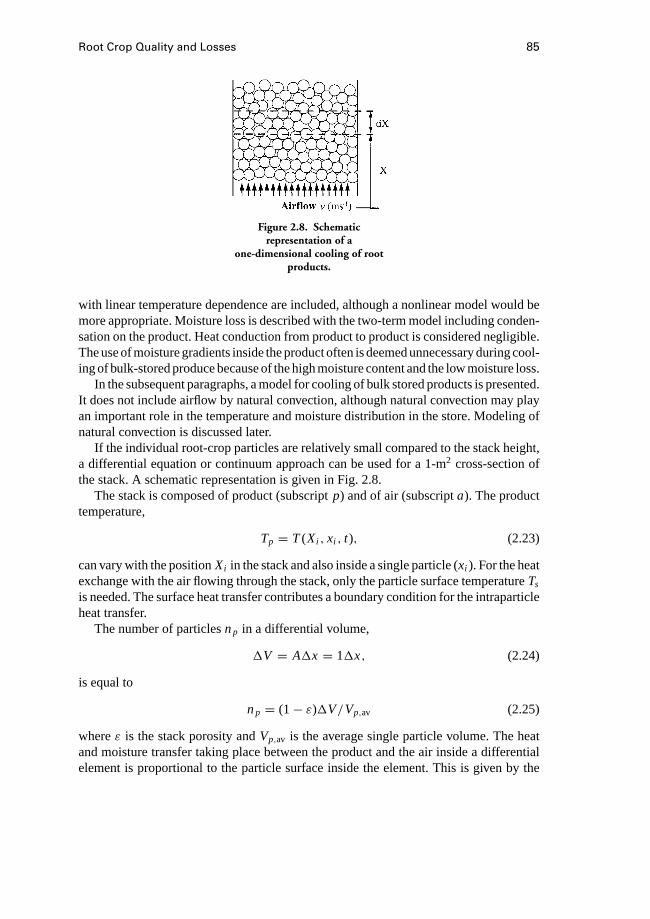
Root Crop Quality and Losses 85
Figure 2.8. Schematicrepresentation of a
one-dimensional cooling of rootproducts.
with linear temperature dependence are included, although a nonlinear model would bemore appropriate. Moisture loss is described with the two-term model including conden-sation on the product. Heat conduction from product to product is considered negligible.The use of moisture gradients inside the product often is deemed unnecessary during cool-ing of bulk-stored produce because of the high moisture content and the low moisture loss.
In the subsequent paragraphs, a model for cooling of bulk stored products is presented.It does not include airflow by natural convection, although natural convection may playan important role in the temperature and moisture distribution in the store. Modeling ofnatural convection is discussed later.
If the individual root-crop particles are relatively small compared to the stack height,a differential equation or continuum approach can be used for a 1-m2 cross-section ofthe stack. A schematic representation is given in Fig. 2.8.
The stack is composed of product (subscriptp) and of air (subscripta). The producttemperature,
Tp = T(Xi , xi , t), (2.23)
can vary with the positionXi in the stack and also inside a single particle (xi ). For the heatexchange with the air flowing through the stack, only the particle surface temperatureTs
is needed. The surface heat transfer contributes a boundary condition for the intraparticleheat transfer.
The number of particlesnp in a differential volume,
1V = A1x = 11x, (2.24)
is equal to
np = (1− ε)1V/Vp,av (2.25)
whereε is the stack porosity andVp,av is the average single particle volume. The heatand moisture transfer taking place between the product and the air inside a differentialelement is proportional to the particle surface inside the element. This is given by the
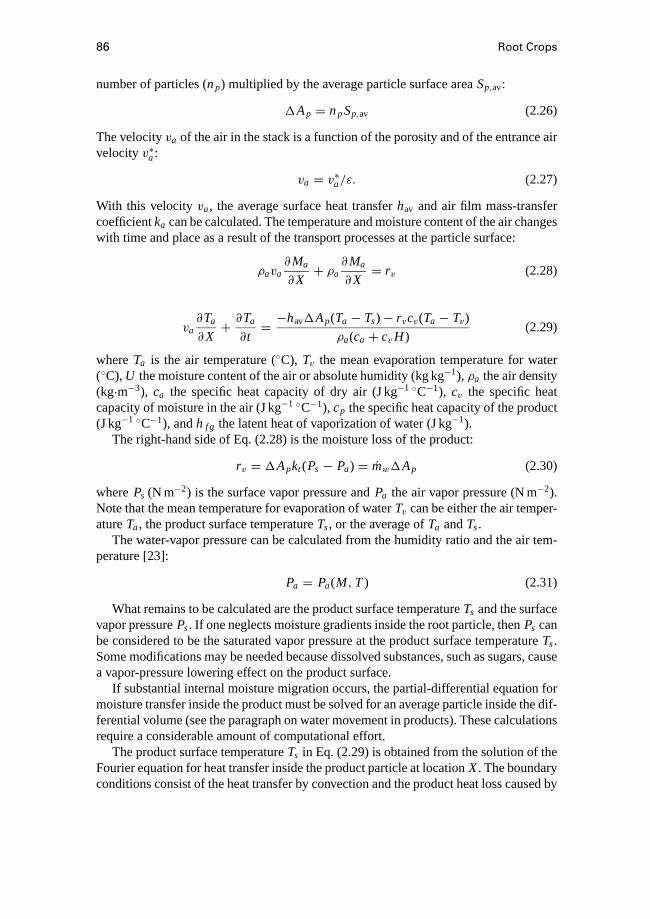
86 Root Crops
number of particles (np) multiplied by the average particle surface areaSp,av:
1Ap = npSp,av (2.26)
The velocityva of the air in the stack is a function of the porosity and of the entrance airvelocityv∗a:
va = v∗a/ε. (2.27)
With this velocityva, the average surface heat transferhav and air film mass-transfercoefficientka can be calculated. The temperature and moisture content of the air changeswith time and place as a result of the transport processes at the particle surface:
ρava∂Ma
∂X+ ρa
∂Ma
∂X= rv (2.28)
va∂Ta
∂X+ ∂Ta
∂t= −hav1Ap(Ta − Ts)− rvcv(Ta − Tv)
ρa(ca + cvH )(2.29)
whereTa is the air temperature (◦C), Tv the mean evaporation temperature for water(◦C),U the moisture content of the air or absolute humidity (kg kg−1), ρa the air density(kg·m−3), ca the specific heat capacity of dry air (J kg−1 ◦C−1), cv the specific heatcapacity of moisture in the air (J kg−1 ◦C−1), cp the specific heat capacity of the product(J kg−1 ◦C−1), andh f g the latent heat of vaporization of water (J kg−1).
The right-hand side of Eq. (2.28) is the moisture loss of the product:
rv = 1Apkt (Ps − Pa) = mw1Ap (2.30)
wherePs (N m−2) is the surface vapor pressure andPa the air vapor pressure (N m−2).Note that the mean temperature for evaporation of waterTv can be either the air temper-atureTa, the product surface temperatureTs, or the average ofTa andTs.
The water-vapor pressure can be calculated from the humidity ratio and the air tem-perature [23]:
Pa = Pa(M, T) (2.31)
What remains to be calculated are the product surface temperatureTs and the surfacevapor pressurePs. If one neglects moisture gradients inside the root particle, thenPs canbe considered to be the saturated vapor pressure at the product surface temperatureTs.Some modifications may be needed because dissolved substances, such as sugars, causea vapor-pressure lowering effect on the product surface.
If substantial internal moisture migration occurs, the partial-differential equation formoisture transfer inside the product must be solved for an average particle inside the dif-ferential volume (see the paragraph on water movement in products). These calculationsrequire a considerable amount of computational effort.
The product surface temperatureTs in Eq. (2.29) is obtained from the solution of theFourier equation for heat transfer inside the product particle at locationX. The boundaryconditions consist of the heat transfer by convection and the product heat loss caused by
Root Crop Quality and Losses 87
evaporation:
−k∂T
∂x
∣∣∣∣s
= h(Ts − Ta)+ mw(cmTs − cvTa − h f g) (2.32)
whereTs is the product surface temperature. At the top of the stack it may be requiredto include the radiation boundary conditions. Note that the heat-transfer calculationinside a particle requires considerable computational effort, as it must be executed ateach location for each time step. In addition, the internal particle temperature must berecorded for each location. The changing air temperatureTa means that the boundaryconditions are dependent on time and place. Nevertheless, this additional effort providesa more realistic product time–temperature history.
From the metabolic processes, an assessment can be made of the product qualitychange during storage. The quality evolution may vary considerably with the location inthe stack.
2.1.6 Natural Convection inside Stores
Heat produced by the product and heat losses through the sidewalls or the top of thestack induce temperature differences in the air. This gives rise to natural convection.Differences between water-vapor concentrations in the air inside and outside the stackor even within the stack itself cause density differences in the air, resulting in naturalconvection.
Natural convection in closed moist porous media causes heat and moisture transferand sometimes leads to local areas of condensation, resulting in product spoilage. Naturalconvection is difficult to control, because the outside temperature can vary from one wallto another and also changes with time.
Modeling natural convection inside stores containing agricultural products has re-ceived some attention [6, 24]. The computational complexity is a major hindrance.Recently, some progress has been made in computational fluid dynamics, and improvedmodeling can be expected for heat and mass transfers by natural convection inside storesof agricultural products.
A simplified approach is to derive a model for the “superficial” natural-convectionvelocity of the airvNC in the stack (this is not known a priori). The equation can thenbe coupled to a system of equations as described above. The velocity must be obtainedfrom information regarding the effect of the density changes resulting from heating ormoisture changes in the bulk. In a one-dimensional quasistatic analysis, the followingrelation is obtained [6]:
vNC = − κµ
(dP
dX+ ρg
). (2.33)
Equation (2.33) results from the linear conservation equation of momentum, in whichthe inertia term is neglected due to the small velocity. The viscous term is replaced bythe Darcy approximation.
Assuming a linear variation of the density with temperature and water-vapor concen-trationC, and given that the pressure drop over the bulk is caused by the weight of the

88 Root Crops
Figure 2.9. Simple one-dimensional natural-convectionanalysis with pervious top and bottom.
air only (Fig. 2.9), the natural-convection velocity becomes
vNC = κ
µρ0g(βT (T − T0)− βC(C − C0)) (2.34)
where the index 0 refers to the reference conditions, such as the outside air.The permeabilityκ, resulting from Darcy’s law, can be obtained from a model of
the pressure drop in a porous medium or packed bed. It is constant for very low fluidvelocities. A velocity-dependent permeability has been proposed by several authors[25, 26]. The following modified Ergun equation produces good results:
κ = ε3d2p
K (1− ε)(150[1− ε] + 1.75Re)(2.35)
wheredp is the mean particle diameter andRe the Reynolds number. To obtain thevelocity, the expression can be evaluated using the average temperature and concentrationdistributions in the system. In the next time step, the velocity can be used to calculatethe new temperature and concentration distribution. The previously mentioned formulalimit the analysis to the simple case of unidirectional, convective transport, restrictingthe applicability of the model in real cases. It can be applied to two-dimensional cases,when the diffusion occurs radially only [6], making it possible to evaluate the effectof heat losses through the walls. A vector notation of the expression in Eq. (2.34) andthe full-energy equation can be used to model the three-dimensional natural convectionflow [6]:
EvNC = − κµ
(∇P − ρ0Eg(1− βT (T − T0)− βC(C − C0))) (2.36)

Root Crop Quality and Losses 89
The coupled set of equations can be solved to obtain the velocity, the temperature, andthe moisture concentration at each location in the store for each time step. The numericalsolution consumes much computer time. However, internal currents in the stack can becalculated so that more complex conditions can be investigated.
Recent advances in the development of flexible and user-friendly fluid-dynamicssoftware packages and the increasing power of computers have opened the gate forfuture developments in this area. Powerful solution algorithms in combination with high-order finite-volume or finite-element discretization schemes are provided for the accuratenumerical solution of the system of fluid-flow, energy, and mass-transport equations.When the full system of conservation equations (for forced as well as natural convection)can be applied to the entire store and its immediate surroundings, the restriction tosimplified geometries and boundary conditions is no longer a hurdle, and an improvedunderstanding of transport processes and consequent quality changes in the bulk storageof root crops becomes possible.
2.1.7 Quality Standards for Root Crops
Transport processes and physiological changes affect the quality of the root crop.Furthermore, mechanical impacts may injure the crop. Also, diseases can considerablyreduce the value of a stored crop. The chemical and physiological mechanisms of thequality changes are beyond the scope of this section. Quality is described fromthe viewpoint of the consumer, and the standards for quality control are a result ofthe increased competition on the international market for agricultural products.
The quality of root-crop products is generally evaluated similarly to other fruit andvegetables. Thus, external properties such as appearance, shape, and size are consid-ered primarily, while only limited specifications are given concerning internal quality.Government standards specify minimal requirements (e.g., in the European Union, seeTable 2.4) and give a classification to distinguish tolerable defects (e.g., onion classifi-cation in Belgium, Table 2.5).
It is clear that some of these requirements are rather arbitrary and subject to differentinterpretations. Therefore, international regulations are continuously being amendedto obtain a more uniform interpretation of the standards. Furthermore, traders and
Table 2.4. General minimum qualityrequirements for root crops
Product without damageFree of spoilage symptomsNo parasitesFree of foreign materialHealthyNo strange smell or tasteNo excessive moisture on the outsideProduct condition and package can guarantee
product quality up to destination point
Source: [27].

90 Root Crops
Table 2.5. Classification of onions
Class IOnions of good qualityColor and shape are characteristic for the varietyFirmNot sproutedWithout hollow stemFree of thickenings due to abnormal growthFree of root remainders
Class IIAs class I, but with the following tolerable defects:
Sufficiently firmTraces of frictionSmall indications of decaySmall healed bruises that are not detrimental
for the shelf lifeSmall healed cracksAberrant shape and colorStarting sprout
Class IIIAs class II, but with the following tolerable defects:
Root remaindersBeginning of sprout for up to 20% of onions
in a package unitBruises not detrimental for the shelf life
Source: [28].
distributors have a tendency to use more stringent quality requirements to distinguishwithin the official classes of specific products.
References
1. Kays, S. J. 1991.Postharvest Physiology of Perishable Plant Products. New York:Van Nostrand Reinhold.
2. U.S. Department of Agriculture. 1986. The commercial storage of fruits, vegetables,and florist and nursery stocks. Agricultural Handbook Number 66. Washington, DC:Author.
3. Becker, R. B., and B. A. Fricke. 1996. Simulation of moisture loss and heat loadsin refrigerated storage of fruits and vegetables. InRefrigeration Science and Tech-nology Proceedings. October 2–4, 1996, Lexington, KT.
4. ASHRAE. 1993.1993 ASHRAE Handbook: Fundamentals. Atlanta: ASHRAE.5. Fockens, F. H., and H. F. T. Meffert. 1972. Biophysical properties of horticultural
products as related to loss of moisture during cooling down.Journal of the Scienceof Food and Agriculture23:285–298.
6. Beukema, K. J. 1980. Heat and mass transfer during cooling and storage ofagricultural products as influenced by natural convection. Ph.D. diss., Land-bouwhogeschool, Wageningen, The Netherlands.
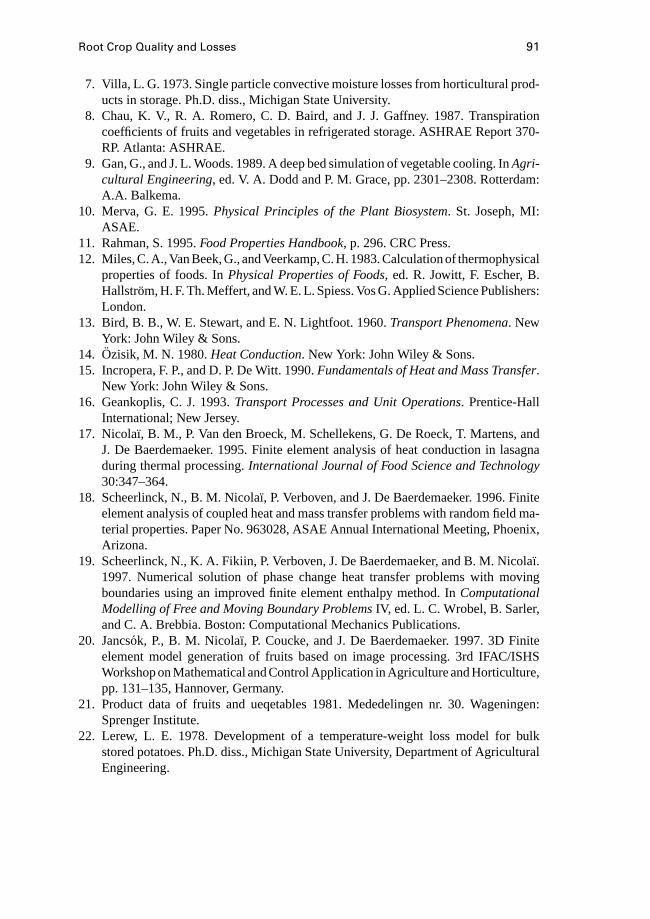
Root Crop Quality and Losses 91
7. Villa, L. G. 1973. Single particle convective moisture losses from horticultural prod-ucts in storage. Ph.D. diss., Michigan State University.
8. Chau, K. V., R. A. Romero, C. D. Baird, and J. J. Gaffney. 1987. Transpirationcoefficients of fruits and vegetables in refrigerated storage. ASHRAE Report 370-RP. Atlanta: ASHRAE.
9. Gan, G., and J. L. Woods. 1989. A deep bed simulation of vegetable cooling. InAgri-cultural Engineering, ed. V. A. Dodd and P. M. Grace, pp. 2301–2308. Rotterdam:A.A. Balkema.
10. Merva, G. E. 1995.Physical Principles of the Plant Biosystem. St. Joseph, MI:ASAE.
11. Rahman, S. 1995.Food Properties Handbook, p. 296. CRC Press.12. Miles, C. A., Van Beek, G., and Veerkamp, C. H. 1983. Calculation of thermophysical
properties of foods. InPhysical Properties of Foods, ed. R. Jowitt, F. Escher, B.Hallstrom, H. F. Th. Meffert, and W. E. L. Spiess. Vos G. Applied Science Publishers:London.
13. Bird, B. B., W. E. Stewart, and E. N. Lightfoot. 1960.Transport Phenomena. NewYork: John Wiley & Sons.
14. Ozisik, M. N. 1980.Heat Conduction. New York: John Wiley & Sons.15. Incropera, F. P., and D. P. De Witt. 1990.Fundamentals of Heat and Mass Transfer.
New York: John Wiley & Sons.16. Geankoplis, C. J. 1993.Transport Processes and Unit Operations. Prentice-Hall
International; New Jersey.17. Nicolaı, B. M., P. Van den Broeck, M. Schellekens, G. De Roeck, T. Martens, and
J. De Baerdemaeker. 1995. Finite element analysis of heat conduction in lasagnaduring thermal processing.International Journal of Food Science and Technology30:347–364.
18. Scheerlinck, N., B. M. Nicola¨ı, P. Verboven, and J. De Baerdemaeker. 1996. Finiteelement analysis of coupled heat and mass transfer problems with random field ma-terial properties. Paper No. 963028, ASAE Annual International Meeting, Phoenix,Arizona.
19. Scheerlinck, N., K. A. Fikiin, P. Verboven, J. De Baerdemaeker, and B. M. Nicola¨ı.1997. Numerical solution of phase change heat transfer problems with movingboundaries using an improved finite element enthalpy method. InComputationalModelling of Free and Moving Boundary ProblemsIV, ed. L. C. Wrobel, B. Sarler,and C. A. Brebbia. Boston: Computational Mechanics Publications.
20. Jancs´ok, P., B. M. Nicola¨ı, P. Coucke, and J. De Baerdemaeker. 1997. 3D Finiteelement model generation of fruits based on image processing. 3rd IFAC/ISHSWorkshop on Mathematical and Control Application in Agriculture and Horticulture,pp. 131–135, Hannover, Germany.
21. Product data of fruits and ueqetables 1981. Mededelingen nr. 30. Wageningen:Sprenger Institute.
22. Lerew, L. E. 1978. Development of a temperature-weight loss model for bulkstored potatoes. Ph.D. diss., Michigan State University, Department of AgriculturalEngineering.

92 Root Crops
23. Brooker, D. B. 1965. Non-linear airflow patterns in grain drying systems. Researchbulletin 892, University of Missouri-Columbia, Agricultural Experiment Station.
24. Messaho, D. 1990. Mathematical modeling of associated transport phenomenain hygroscopic porous media: Application to grain storage. Ph.D. diss., InstitutAgronomique et Veterinaire Hassan II, Rabat, Morocco.
25. Bakker Arkema, F. W., R. J. Patterson, and W. G. Bickert. 1969. Static pressure: Airflow relationships in packed beds of granular biological materials such as cherrypits.Trans. ASAE12:134–136, 140.
26. Patterson, R. J., F. W. Bakker Arkema, and W. G. Bickert. 1971. Static pressure: Airflow relationships in packed beds of granular biological materials such as grain II.Trans. ASAE14:172–174, 178.
27. Commission Regulation (EEC) No 2251/92 of 29 July 1992 on Quality Inspectionof Fresh Fruit and Vegetables. 1992.Official Journal of the European Commissionno. L219/9 (amended by Commission Regulation No. 785/93 of 31 March 1993).
28. Common quality norms for Fruits and Vegetables. 1976. Ceuterick, Leuven, Bel-gium: Ministerie van Landbouw, Bestuur der Economische Diensten, Dienst Teelt-producten.
2.2 Storage of PotatoesA. van’t Ooster
2.2.1 Solanum tuberosum[1]
The common potato (Solanum tuberosum) is one of around 150 tuber-bearing speciesof the genusSolanum(family Solanaceae). The potato, considered by most botanists anative of the Peruvian–Bolivian Andes, is one of the world’s main food crops, differingfrom others in that the edible part of the plant is a tuber.
Underground the stems extend into structures calledstolons. The ends of the stolonsmay enlarge greatly to form a few to more than 20 tubers, of variable shape and size,usually ranging in weight up to 300 g but occasionally to more than 1.5 kg per tuber.The tubers bear spirally arranged buds (eyes) in the axils of aborted leaves, of whichscars remain. These buds may remain dormant after the tuber is fully grown, even underconditions favorable to development, for up to 10 weeks or more. They grow into plantsidentical to the plant that bore the tubers. Vegetative propagation of desired geneticalcharacteristics is thus possible, and this method is always used commercially because ofthe great variation that results when plants are grown from true seed.
2.2.2 History of the Potato [1]
The potatoes cultivated in South America as early as 1800 years ago probably con-sisted of a mixture of varieties; in the same area today, as many as 60 varieties may bedistinguished in a single village market. Encountered by the invading Spaniards, potatoeswere introduced into Europe during the second half of the 16th century. By the end of the17th century the newcomer was a major crop in Ireland, and by the end of the 18th it wasa major crop in continental Europe, particularly Germany, and in the west of England.
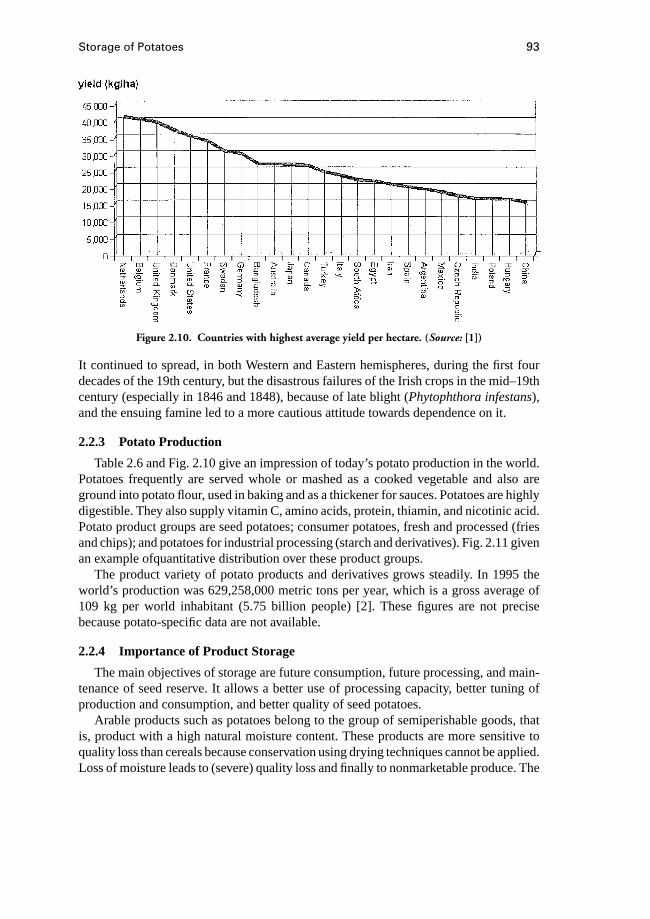
Storage of Potatoes 93
Figure 2.10. Countries with highest average yield per hectare. (Source: [1])
It continued to spread, in both Western and Eastern hemispheres, during the first fourdecades of the 19th century, but the disastrous failures of the Irish crops in the mid–19thcentury (especially in 1846 and 1848), because of late blight (Phytophthora infestans),and the ensuing famine led to a more cautious attitude towards dependence on it.
2.2.3 Potato Production
Table 2.6 and Fig. 2.10 give an impression of today’s potato production in the world.Potatoes frequently are served whole or mashed as a cooked vegetable and also areground into potato flour, used in baking and as a thickener for sauces. Potatoes are highlydigestible. They also supply vitamin C, amino acids, protein, thiamin, and nicotinic acid.Potato product groups are seed potatoes; consumer potatoes, fresh and processed (friesand chips); and potatoes for industrial processing (starch and derivatives). Fig. 2.11 givenan example ofquantitative distribution over these product groups.
The product variety of potato products and derivatives grows steadily. In 1995 theworld’s production was 629,258,000 metric tons per year, which is a gross average of109 kg per world inhabitant (5.75 billion people) [2]. These figures are not precisebecause potato-specific data are not available.
2.2.4 Importance of Product Storage
The main objectives of storage are future consumption, future processing, and main-tenance of seed reserve. It allows a better use of processing capacity, better tuning ofproduction and consumption, and better quality of seed potatoes.
Arable products such as potatoes belong to the group of semiperishable goods, thatis, product with a high natural moisture content. These products are more sensitive toquality loss than cereals because conservation using drying techniques cannot be applied.Loss of moisture leads to (severe) quality loss and finally to nonmarketable produce. The

94 Root Crops
Table 2.6. Production level of roots and tubers (potatoes and cassava)in countries with a national production over one
million metric tons per year
Country Production (×1000 metric ton) Yield (kg/ha)
Angola 1943 4396Argentina 2410 19,195Australia 1154 26,784Bangladesh 1864 26,795Belarus 8570 11,427Belgium 2100 40,385Benin 2447 9211Bolivia 1004 5580Brazil 29,009 12,963Burundi 1326 6395Cameroon 2080 5794Canada 3774 26,273China 152,813 15,342Colombia 5164 12,926Cote d’Ivoire 4761 5792Czech Republic 1330 17,082Denmark 1480 37,000Egypt 1734 21,603Ethiopia 2018 3679France 5754 33,717Germany 10,382 30,010Ghana 10,382 11,339Hungary 1151 16,262India 26,300 16,386Indonesia 18,603 11,790Iran 3200 20,644Italy 2076 23,281Japan 5157 26,651Kazakstan 1950 9142Kenya 1685 8101Korea, North 2050 12,059Lithuania 1594 13,279Madagascar 3375 6874Mexico 1252 18,312Mozambique 4310 4304Netherlands 7363 41,002Nigeria 56,006 10,613Pakistan 1497 14,471Papua New Guinea 1267 7073Paraguay 2708 14,442Peru 3369 9292Philippines 22,820 6784Poland 24,891 16,351Portugal 1477 14,937Romania 3020 12,080
(cont.)
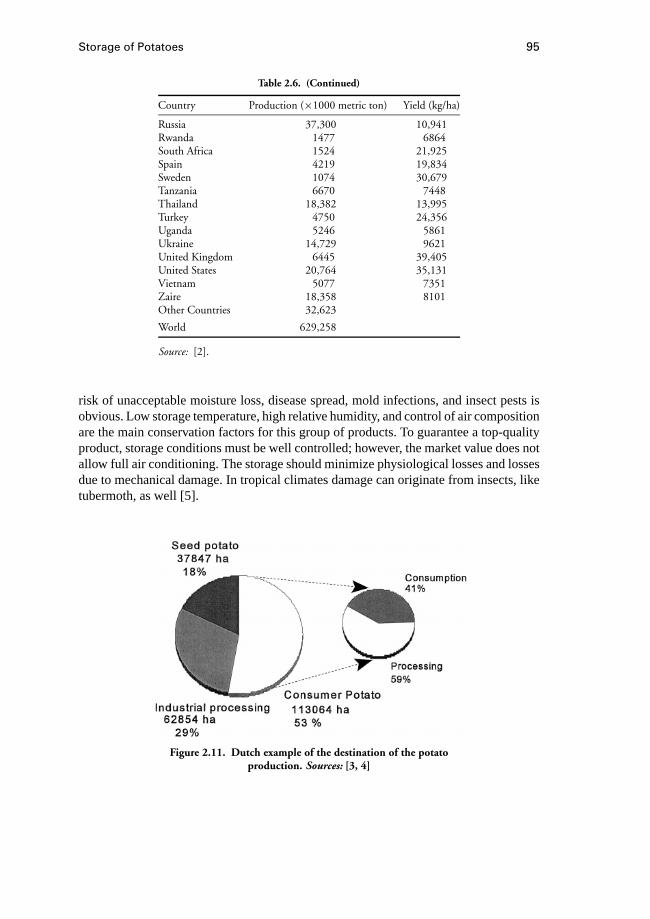
Storage of Potatoes 95
Table 2.6. (Continued)
Country Production (×1000 metric ton) Yield (kg/ha)
Russia 37,300 10,941Rwanda 1477 6864South Africa 1524 21,925Spain 4219 19,834Sweden 1074 30,679Tanzania 6670 7448Thailand 18,382 13,995Turkey 4750 24,356Uganda 5246 5861Ukraine 14,729 9621United Kingdom 6445 39,405United States 20,764 35,131Vietnam 5077 7351Zaire 18,358 8101Other Countries 32,623
World 629,258
Source: [2].
risk of unacceptable moisture loss, disease spread, mold infections, and insect pests isobvious. Low storage temperature, high relative humidity, and control of air compositionare the main conservation factors for this group of products. To guarantee a top-qualityproduct, storage conditions must be well controlled; however, the market value does notallow full air conditioning. The storage should minimize physiological losses and lossesdue to mechanical damage. In tropical climates damage can originate from insects, liketubermoth, as well [5].
Figure 2.11. Dutch example of the destination of the potatoproduction. Sources: [3, 4]
96 Root Crops
Figure 2.12. Overview of storage systems for potatoes.
2.2.5 Systems for Potato Storage
Systems used for potato storage all over the world are characterized in Fig. 2.12.We distinguish underground storage (extended harvest), storage without buildings inclamps, and storage in buildings [6]. Clamps predominantly are ventilated naturally.For storage in buildings mechanical ventilation prevails. Only the group storage inspecial-purpose stores with a mechanical ventilation system is discussed in more de-tail here.
We distinguish among bulk storage, storage in crates, and storage in sacks. Storescan be mechanically ventilated or naturally ventilated. Bulk storage can be vertically orhorizontally ventilated (Fig. 2.13). Horizontal ventilation sometimes is applied to storepotatoes for industrial processing. It is an underpressure system.
The aeration system is less complicated and cheaper, because an air-distribution sys-tem can be omitted. Although total airflow, for equal storage capacity, is the same forhorizontally and vertically ventilated bulk stores, both airflow in the bulk, that is, the
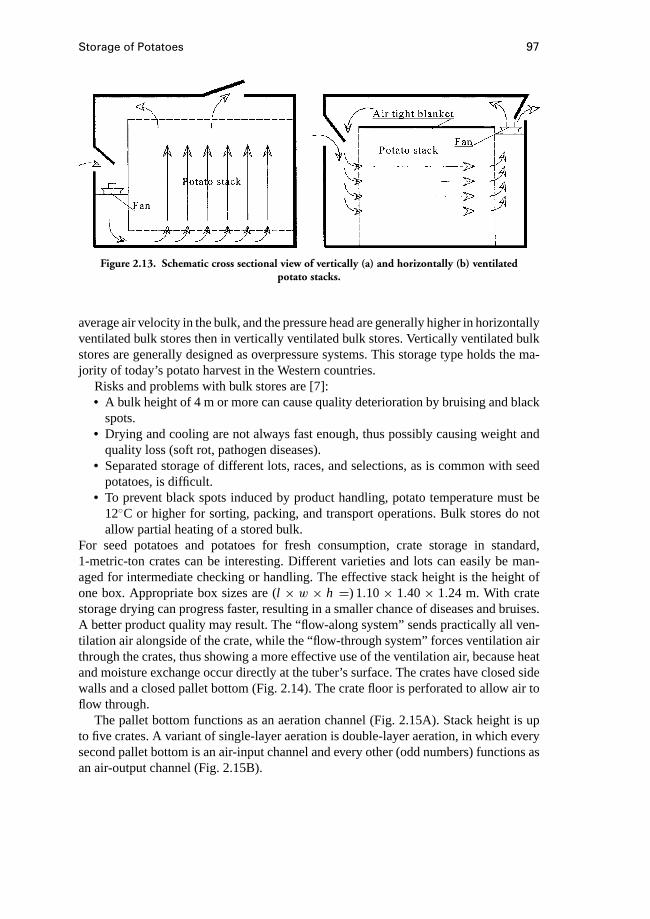
Storage of Potatoes 97
Figure 2.13. Schematic cross sectional view of vertically (a) and horizontally (b) ventilatedpotato stacks.
average air velocity in the bulk, and the pressure head are generally higher in horizontallyventilated bulk stores then in vertically ventilated bulk stores. Vertically ventilated bulkstores are generally designed as overpressure systems. This storage type holds the ma-jority of today’s potato harvest in the Western countries.
Risks and problems with bulk stores are [7]:• A bulk height of 4 m ormore can cause quality deterioration by bruising and black
spots.• Drying and cooling are not always fast enough, thus possibly causing weight and
quality loss (soft rot, pathogen diseases).• Separated storage of different lots, races, and selections, as is common with seed
potatoes, is difficult.• To prevent black spots induced by product handling, potato temperature must be
12◦C or higher for sorting, packing, and transport operations. Bulk stores do notallow partial heating of a stored bulk.
For seed potatoes and potatoes for fresh consumption, crate storage in standard,1-metric-ton crates can be interesting. Different varieties and lots can easily be man-aged for intermediate checking or handling. The effective stack height is the height ofone box. Appropriate box sizes are (l × w × h =) 1.10× 1.40× 1.24 m. With cratestorage drying can progress faster, resulting in a smaller chance of diseases and bruises.A better product quality may result. The “flow-along system” sends practically all ven-tilation air alongside of the crate, while the “flow-through system” forces ventilation airthrough the crates, thus showing a more effective use of the ventilation air, because heatand moisture exchange occur directly at the tuber’s surface. The crates have closed sidewalls and a closed pallet bottom (Fig. 2.14). The crate floor is perforated to allow air toflow through.
The pallet bottom functions as an aeration channel (Fig. 2.15A). Stack height is upto five crates. A variant of single-layer aeration is double-layer aeration, in which everysecond pallet bottom is an air-input channel and every other (odd numbers) functions asan air-output channel (Fig. 2.15B).
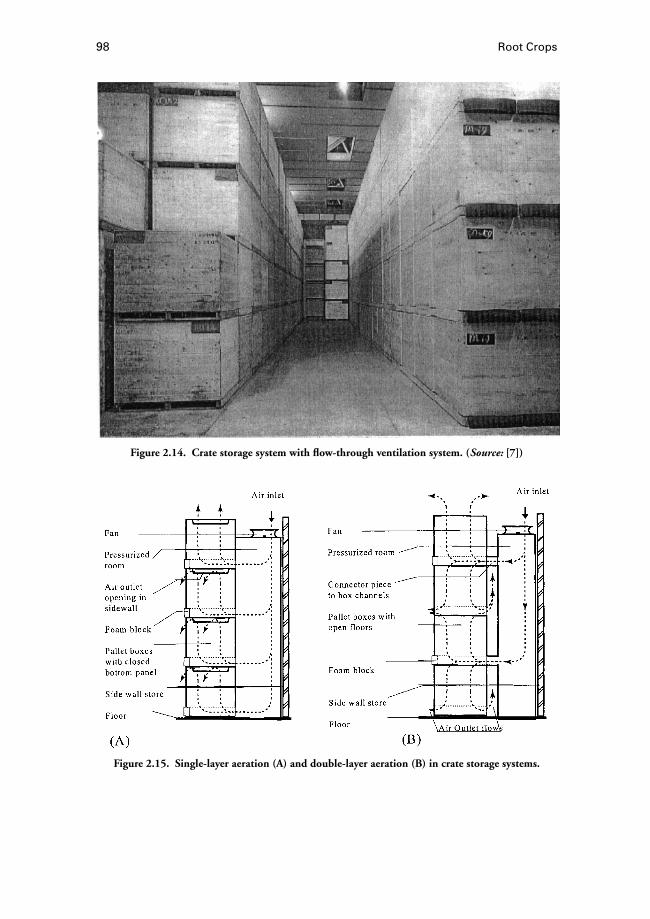
98 Root Crops
Figure 2.14. Crate storage system with flow-through ventilation system. (Source: [7])
Figure 2.15. Single-layer aeration (A) and double-layer aeration (B) in crate storage systems.

Storage of Potatoes 99
Stack height is normally four crates. The distance between crate rows should at leastbe 10 cm. The flow-through system can be used for any potato type. To allow a reasonableair distribution rows should not be longer then nine crates for single-layer aeration andnot longer then five crates for double-layer aeration.
The flow-along system is only suitable for dry and sorted potatoes. The crates shouldhave open walls and floors and should be placed in rows of no more then 15 m. Thedistance between crate rows and between the outer crate rows and storage side wallsshould be at least 100 mm. At the fan side and at the opposite side in the length directionof the rows the minimal distance between crates and storage side wall should be 300 mm.Air coolers, ceiling channels, or vertical aeration tubes must allow equal distribution ofventilation air over the top layer (Fig. 2.16).
Storage in bags is only used for seed potatoes. Bags are piled up to heights of upto 5 m.
Storage DesignThermal insulation of a store is necessary for proper control of the storage conditions.
Free heat exchange between the storage room and the outdoor environment is thenlimited, and surface condensation on walls or ceilings can be prevented or stronglylimited [8]. Not only is the insulation level of the materials used important, but also theattachment and design of joints are very important. Generally used insulation materialsare polystyrene, polyurethane (plates or sprayed at location), and mineral wool. Materialsdiffer in physical properties, such as density, heat conductance, vapor barrier and price.
The storage must be insulated in such a way that excessive heat losses in cold periodsand excessive heat gains in warm periods as well as inner-surface condensation in coldperiods are prevented. Generally for cold periods a U-value or heat-conductivity co-efficient of 0.30 W·m−2·K−1 is suggested; for longer storage periods without use ofmechanical cooling, 0.25 W·m−2·K−1 is suggested; and if mechanical cooling is ap-plied 0.20 W·m−2·K−1 for ceilings, 0.25 W·m−2·K−1 for walls, and 0.50 W·m−2·K−1
for floors are suggested [9]. Solar heat loads on the roof can be minimized using re-flective materials or a naturally aerated cavity or attic between roof cover and insulatedceiling.
Generally one should choose vapor barriers on the inside as well as on the outside ofthe insulation layer to prevent internal condensation in the insulation layer. This needfor vapor barriers is dependent, however, on the external climate and the duration of thestorage period. The building hood not only influences heat and moisture transport butalso the exchange of oxygen and carbon dioxide.
Condensation on the building hood can be prevented by• Decreasing the temperature difference between the inner surface of the building
component and the air in the indoor airspace (that is the storage room). Preventor insulate thermal bridges and choose a low U-value for building components.Another option is to install recirculating fans over the potato bulk to increase airmovement and heat exchange between room air and building hood (Fig. 2.17).
• Decreasing the humidity ratio (kg vapor per kg dry air) in the air of the indoorairspace. This can be achieved by placing a moisture-absorbent layer on top of the
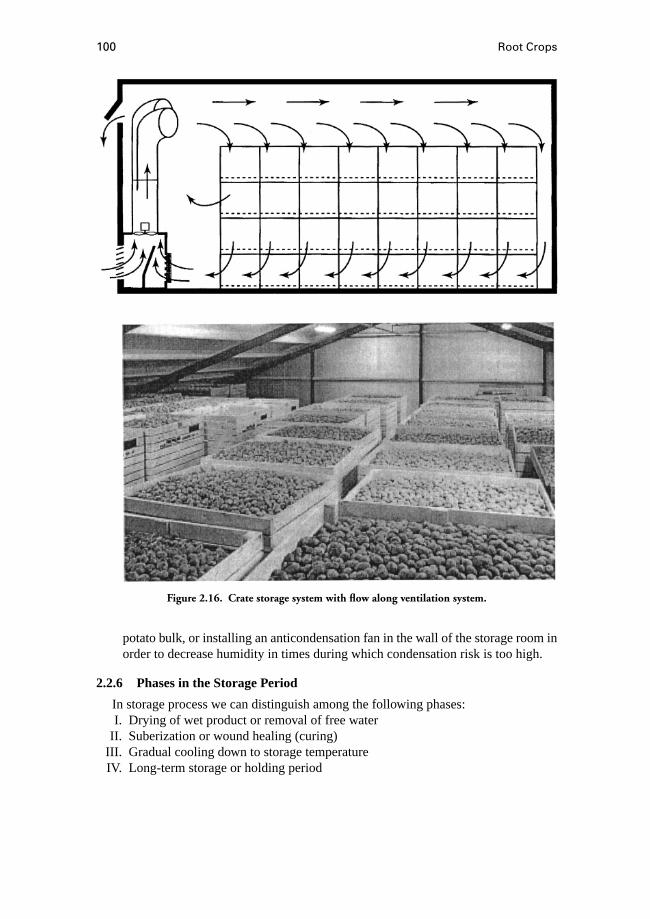
100 Root Crops
Figure 2.16. Crate storage system with flow along ventilation system.
potato bulk, or installing an anticondensation fan in the wall of the storage room inorder to decrease humidity in times during which condensation risk is too high.
2.2.6 Phases in the Storage Period
In storage process we can distinguish among the following phases:I. Drying of wet product or removal of free water
II. Suberization or wound healing (curing)III. Gradual cooling down to storage temperatureIV. Long-term storage or holding period
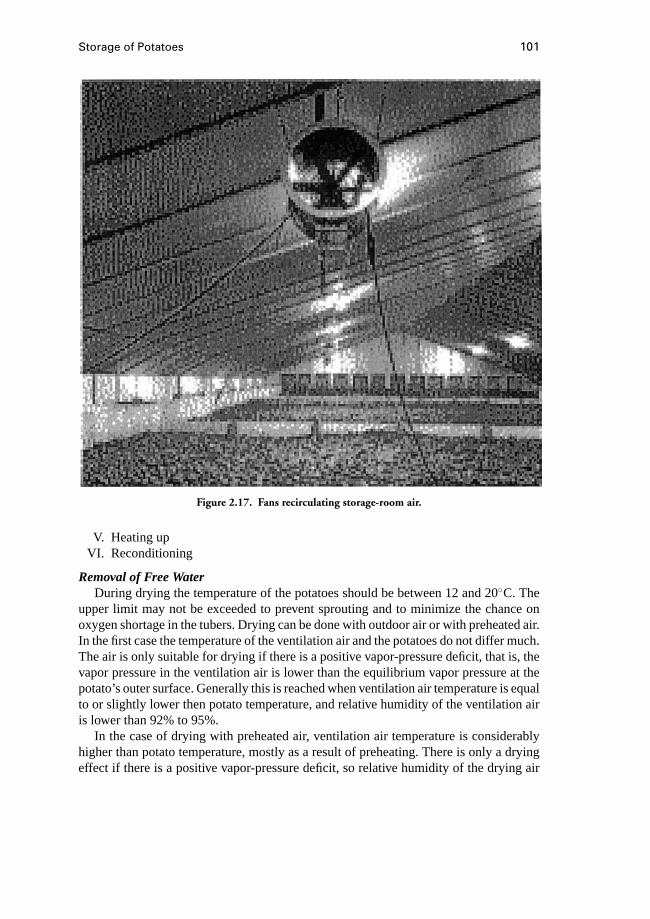
Storage of Potatoes 101
Figure 2.17. Fans recirculating storage-room air.
V. Heating upVI. Reconditioning
Removal of Free WaterDuring drying the temperature of the potatoes should be between 12 and 20◦C. The
upper limit may not be exceeded to prevent sprouting and to minimize the chance onoxygen shortage in the tubers. Drying can be done with outdoor air or with preheated air.In the first case the temperature of the ventilation air and the potatoes do not differ much.The air is only suitable for drying if there is a positive vapor-pressure deficit, that is, thevapor pressure in the ventilation air is lower than the equilibrium vapor pressure at thepotato’s outer surface. Generally this is reached when ventilation air temperature is equalto or slightly lower then potato temperature, and relative humidity of the ventilation airis lower than 92% to 95%.
In the case of drying with preheated air, ventilation air temperature is considerablyhigher than potato temperature, mostly as a result of preheating. There is only a dryingeffect if there is a positive vapor-pressure deficit, so relative humidity of the drying air
102 Root Crops
should be relatively low. When ventilation is done with this warm air, the ventilation airwill cool. The energy set free is used to speed up the evaporation process. Remainingenergy heats the potato bulk. When ventilation air cools below dewpoint, condensationin the potato stack results. This should be prevented.
Suberization or Wound Healing (Curing)Potato tubers are subject to different degrees of damage during harvest, lifting,
transport, transfer and storage, which can result in black spots and other quality losses.Moisture loss and liability to parasitic attack of wounded tubers is by far greater incomparison with undamaged tubers. The capability and recovery time of an injuredpotato to heal depends on variety, maturity of tuber, physiological state, and storageconditions. Influencing storage conditions can be identified as temperature, relative hu-midity, presence of sprout inhibitors, and O2 and CO2 concentrations. Wound healing ismore rapid at higher temperatures. Wound-induced suberization and periderm formationoccur most rapidly at 25◦C and stop at a temperature of 35◦C or temperatures below 5◦C.Also, a higher relative humidity speeds up wound healing; however, condensation on thetubers or dry outer cell layers in the periderm slows down wound healing. Wound healingdoes not occur under anaerobic conditions, or more precisely at oxygen concentrationsbelow 3% to 5%. High carbon-dioxide concentrations (5% to 15%) inhibit periderm for-mation also if oxygen concentrations are higher than 21% minus the CO2 concentration(expressed as a volume percentage). Sprout-inhibitor application should be delayed toensure formation of continuous wound periderm. If relative humidity is 80% to 95% andoxygen concentrations as close to 21% as possible and carbon-dioxide concentrationsunder 5%, the progress of the suberization process is measurable by counting degreedays. Reference [10] gives a standard of 150 degree days to complete the process. Thedegree days are calculated as:
n∑i=1
(Tpotato− 5)≥ 150 (2.37)
whereTpotato is the average potato temperature in the bulk. Potato temperatures higherthan 20◦C should be prevented. If the potato bulk shows severe damage, the requirednumber of degree days can be increased. A numeric relation between degree of damageand required degree days is not available.
Cooling Down to Storage TemperaturePotatoes must be cooled to storage temperature. Both stored heat in the bulk (3600
J·kg−1K−1) and respiration heat (1000–4200 J·kg−1d−1 [11]) must be removed. In thisphase the largest cooling capacity is needed to allow a fast decrease of temperature.Dependent on external climate, this can be achieved with outdoor air, optionally incombination with fixed or mobile mechanical cooling installations. In hot climates theuse of cooling systems is inevitable. Cooling air with low enthalpy has the highestcooling capacity; however, a low humidity results in unacceptable moisture loss. Vapordeficit between potato and ventilation air should be limited or a lower limit to relativehumidity of the ventilation air should be set (controller function). For example, 60%.
Storage of Potatoes 103
The ratio between heat loss and moisture loss can serve as an index number to guide thisprocess:
Q
M= α
Gv
∂T
∂C+ r (2.38)
whereQ=heat loss per cubic meter [W·m−3]M =moisture loss per cubic meter [kg·s−1m−3]∂T = local temperature difference between potato and ventilation air [K]∂C= local absolute humidity difference between potato and ventilation air
[kg·m−3]r =evaporation heat of water [J·kg−1]
The heat-transfer coefficient (α) and moisture transfer coefficient (Gv = δ/r ; δ is de-scribed in Eq. (2.47)) are dependent on the ventilation rate. At airflow rates used inpractice for mechanically ventilated stores, ventilation flows are approximately constantfor given stacks and fans in operations. The ratio between energy loss and moisture loss(Q/M) then only depends on∂T/∂C. Strong temperature variation in the stack shouldbe avoided to keep the potatoes dormant.
Long-term Storage or Holding PeriodDuring storage, weight and quality loss should be minimized. Storage losses are
determined mainly by potato condition, storage conditions, and duration of the storageperiod. Weight losses are caused by• Respiration• Evaporation of inter- or intracellular moisture from the potato• Sprouting• Storage diseases
By means of respiration the potato releases the required energy for its life processes.The respiration process converts carbohydrates (and oxygen) into carbonic acid, waterand energy (2825 kJ·mol−1 carbohydrates). The carbohydrates result from perpetualconversions of starch, which is a reversible chemical reaction controlled by enzymesand temperature. Respiration is minimal at 5◦C, slowly increases until 15◦C, and has astronger increase at higher temperatures. Below 3◦C respiration increases to be equal tothat at 20◦C at the freezing point. Respiration results in loss of dry matter, although theselosses in well-designed stores seldom exceed 1.5% of the original fresh weight; however,this represents about 6% of the total dry material [11]. Indirectly, respiration causes moreweight loss due to moisture removal as an effect of ventilation that was necessary toremove respiration heat load. Advised storage temperatures are given in Table 2.7.
Respiration rate is a function of environmental factors such as storage temperature(Table 2.8), humidity, potato volatiles, sprout inhibitors, and carbon dioxide and oxy-gen concentrations of the air. High humidity and sprout inhibitors decrease respira-tion rate. Figures on respiration rate are given in terms of heat production (W·m−3,W·metricton−1, or kJ·metricton−1d−1) or in terms of carbon-dioxide production (1 moleper 470.8 kJ). Literature shows considerable variation concerning respiration heat pro-duction [13, 14].
104 Root Crops
Table 2.7. Advised storage temperatures for potatoes(in degrees Celcius)
Potato Destination Storage Temperature
Seed potatoes 2–4Consumer potatoes 4–5French fry\dried products 5–8Chip industry 7–10Starch and derivatives 6
Source: [12].
Table 2.8. Respiration heat production of stored potatoes
4◦C 6◦C 8◦C 10◦C 14◦C 20◦C
Respiration heat (W·ton−1) 18 19 21 22 25 31
Source: [14].
Respiration of a sprouting potato is about four times as high as that of a dormant potato.Sprouts also significantly increase evaporation of moisture from the potato. Sprouting canbe prevented at a storage temperature of 2 to 4◦C or by applying sprout inhibitor. The gen-erally used sprout inhibitor chemical is CIPC (isopropyl-N-[3-chlorophenyl]carbonate).This chemical controls the sprouting of consumer and processing potatoes which nor-mally occurs 2 to 3 months after harvest. The duration of the dormancy period is stronglyinfluenced by the storage temperature level and variations. CIPC is volatilized and dis-trubuted through the ventilation system after suberization and cool-down have beencompleted. It is not advisable to use the same store subsequently for seed potatoes aswell, but if this is the case, all exposed structural surfaces and air contact surfaces shouldbe thoroughly steam-cleaned.
Quality losses during this period are caused by• Evaporation of water• Change in the chemical composition• Spreading of disease• Damage from extreme temperatures
Product quality is greatly influenced by the history of the potato lot prior to storage.Quality is discussed further in Section 2.2.11).
Heating UpBefore delivery potatoes are heated, because at relatively low temperatures they are
susceptible to black spot when handled. Dependent on the sensitivity of the variety, thetemperature should be raised to 12 to 20◦C (low-risk temperature range) or better to 15to 18◦C (safe temperature range). Temperatures over 20◦C should be avoided to preventblack hearts. Heating can be done with the existing ventilation system, outside air or incolder climates gas or diesel heaters.
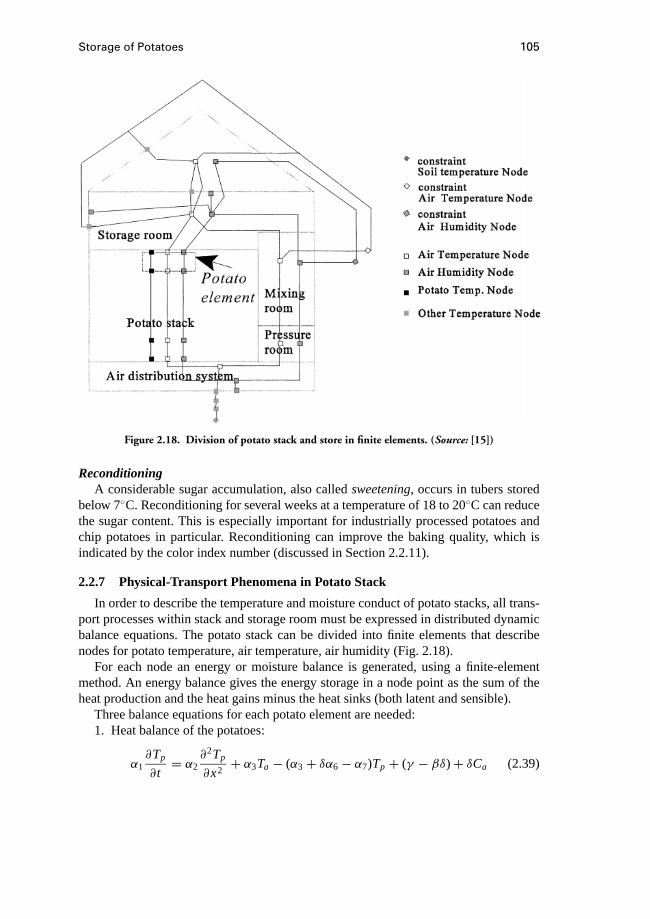
Storage of Potatoes 105
Figure 2.18. Division of potato stack and store in finite elements. (Source: [15])
ReconditioningA considerable sugar accumulation, also calledsweetening, occurs in tubers stored
below 7◦C. Reconditioning for several weeks at a temperature of 18 to 20◦C can reducethe sugar content. This is especially important for industrially processed potatoes andchip potatoes in particular. Reconditioning can improve the baking quality, which isindicated by the color index number (discussed in Section 2.2.11).
2.2.7 Physical-Transport Phenomena in Potato Stack
In order to describe the temperature and moisture conduct of potato stacks, all trans-port processes within stack and storage room must be expressed in distributed dynamicbalance equations. The potato stack can be divided into finite elements that describenodes for potato temperature, air temperature, air humidity (Fig. 2.18).
For each node an energy or moisture balance is generated, using a finite-elementmethod. An energy balance gives the energy storage in a node point as the sum of theheat production and the heat gains minus the heat sinks (both latent and sensible).
Three balance equations for each potato element are needed:1. Heat balance of the potatoes:
α1∂Tp
∂t= α2
∂2Tp
∂x2+ α3Ta − (α3+ δα6− α7)Tp + (γ − βδ)+ δCa (2.39)
106 Root Crops
2. Heat balance for air inside potato stack:
α4
α3
∂T1
∂x= Ta − T1 (2.40)
3. Moisture balance for air inside a potato stack:
α5
δ
∂Ca
∂x= (α6Tp + β)− Ca (2.41)
whereTp=potato temperature (◦C)Ta=air temperature (◦C)Ca= vapor concentration in air (kg·m−3)β = intercept of linearizedCmax (ms−1)
Cmax=Ca at saturation (ms−1)δ= r · Gv (J2 kg−2 s−1)r =evaporation heat of water (J·kg−1)
Gv = flow variable for mass transfer of vapor from potatoes to ambient air(J·s−1 kg−1)
γ = intercept of linearized potato heat production (J·m−3 s)The parameters used in the balance equationsα1 throughα7,β, andδ are described below:
α1 = (1− ε)(ρC)p (Jm−3K−1)
whereε=porosity of the potato stackρp=density of the potatoes (kg·m−3)Cp=heat capacity of potatoes (J·kg−1 K−1]
The porosity of potatoes in storage is independent of the size and shape of the potatoes.If they are assumed to be bulb-shaped with equal diameter, this is called the equivalentpotato diameter. The porosity of stacked equal-sized bulbs is 0.26 [16]. Potatoes are notexactly bulb-shaped, nor do they have an equal hydraulic diameter. This leads to a higherporosity. Boel estimated for the porosity of potato stacks a range of 0.33 to 0.36. Thedensity of potatoes is dependent on the circumstances during growth. Potato density isabout 1080 kg·m−3 and heat capacity of potatoes is about 3560 J·kg−1K−1.
α2 = λvλv = apparent heat conductance (W·m−1K−1)
The value for the heat conductance is according to Hendrikse [17] equal to 0.33.
α3 = αAv
whereα=heat-transfer coefficient (W·m−2 K−1)
Av =potato surface area per cubic meter (m2 m−3)Ample research has been done on estimation of the value of this heat-transfer coefficientat different ventilation rates and different sizes and shapes of the potato stack. The results
Storage of Potatoes 107
are given in a form in which the Nusselt number (Nu) is presented as a function of theReynolds number (Re) and Prandtl number (Pr). Beukema [18] gives this function forRegreater than 180:
Nu= 1.27(1− ε)0.41 Re0.59 Pr0.33 (2.42)
wherev = air velocity in potato stack (=1/ε ∗ vundisturbed) (m·s−1)ν = viscosity of air (=1.4∗ 10−5) (m2·s−1)d = average potato diameter (m)λ = heat conductance air (= 0.021) (W·m−1K−1)
From the heat transfer coefficient forRegreaterthan180 can be derived:
α = λ
d1.27(1− ε)0.41
(dv
ν
)0.59(ν
d
)0.33
(2.43)
The heat transfer coefficient is dependent on the air speed and can be described as afunction of the air speed forε = 0.33 andd = 0.05:
α = 3.80v0.59 (W·m−2 K−1)
The surface area per cubic meter for bulbs can be described by the following equation:
Av = 6(1− ε)d
(2.44)
Boel [16] indicates that this equation provides a good estimation for the area of potatoes.A convection parameter for heat transport with air moving through the potato stack,
dependent of the real air velocity in the potato stack (disturbed air velocity), isα4.
α4 = vd ∗ (ρC)a (J·m−2 K−1 s−1)
wherevd is the disturbed air velocity in the potato stack (m·s−1). The parameterα5
depends on the undisturbed air velocity:
α5 = εvu (ms−1)
Equation (2.45) gives a linearized function for maximum moisture concentration in air,Cmax (kg·m−3), using differentα6 andβ values in several temperature intervals.
Cmax= α6Tp + β (2.45)
The heat production of the potatoes in storage is estimated with the following linearizedfunction.
Qp = α7Tp + γ (2.46)
whereQp=heat production of potatoes (W·m−3)γ = intercept linearizedQp (= 3.4) (W·m−3)α7= trend in linearizedQp (= 0.4) (W·m−3 K−1)
The given values ofα7 andγ are only valid in the temperature range from 3 to 10◦C.
108 Root Crops
Finally, the parametersδ andβ are discussed.δ is split into two complementaryparameters, one for evaporation from the inside of the potato and one for evaporationand condensation of water on the outer surface of the potato:
δ = SWδ1+ |SW− 1|δ2 (2.47)
whereδ1=energy flow needed to evaporate 1 kg of water from the inside of the
potato (W·kg−1)δ2=energy flow needed to evaporate 1 kg of water from the potato’s outer
surface (W·kg−1)If condensation on the potatoes occurs the switch function SW= 0; in case of normalevaporation through the potato peal, SW= 1.δ1 can be described as:
δ1 = r Avγ
(1
β+ r δ
D
)−1
(2.48)
β = mass transfer coefficient from a wet surface to air (ms−1)
wherer δ=depth of the potato peal (m)γ =permeability of the potato pealr =evaporation heat of water (=24.85×10⁵) (J·kg−1)D=diffusion coefficient of vapor in air (m2 s−1)
The mass transfer coefficientβ (m·s−1) in this equation is equal to [18]:
β = α
ρCLe−
23 (2.49)
whereLe= the Lewis number,a/Da=heat distribution coefficient of air (m2s−1)
The equation describing the heatflow per kilogram of condensated water (δ2
[W kg−1]) is:
δ2 = r Avβ (2.50)
The three basic equations (2.39) through (2.41) can be used to create element ma-trices in order to allow computational calculation of a matrix–vector equation set:Me T
e+ Se Te = f e for each element defined. The element mass matrixMe is mul-tiplied with the derivative of the element state vectorT
e, added to the element-stiffness
matrix Se multiplied with the element state vectorTe, which equals the element loadsvector f e. The state vector holds the state variables: potato temperatures, air tempera-tures, and air humidities; the loads vectorf contains all state variable independent partsof the balance equations. This set of equations can be completed by adding elementsfor ventilation, heat loss through the construction of the storage (see Fig. 2.18), and
Storage of Potatoes 109
heat flows to and from equipment such as heaters, coolers, fans, and humidifiers. Allelement matrix equations can be aggregated into one matrix equation describing thetotal potato storage system:MT + ST = f . This equation can be the core of a modeldescription of a potato store. An example of such a model is AMOD [15], which isdeveloped by Wageningen Agricultural University in cooperation with Delft TechnicalUniversity.
2.2.8 Process Control
In controlling the storage process we distinguish different ways to manage actuatorslike fans, mixing valves, and air-conditioning units such as coolers, heaters, humidifiers,and anticondensation units:• Manual control: cheap but inaccurate. Disadvantages are that a lot of human atten-
tion to the control process is required, the chance of unwanted effects, and that it isnot an optimal use of available time if ventilation with outdoor air is appropriate.
• Minimum/maximum control using thermostats: This control is only effective ifpotatoes are cooled down. The maximum thermostat setting is approximately 2◦Cbelow the product temperature and the minimum thermostat setting is about 4◦Cbelow the maximum but never below 1 to 2◦C. If outdoor air temperature is betweenthe setpoints of the two thermostats, ventilation air is allowed in to cool the stack.
• Differential control using thermostats: This control uses the product temperature,outdoor temperature, and temperature in the air-distribution system as inputs. Fansare turned on if the product temperature is outside the setpoint area and the presettemperature difference between outdoor air and the product is a fact. The mixingvalve is controlled with help of the measured temperature in the air-distributionsystem. A disadvantage is that control of humidity and of air-conditioning unitsrequires separate control units.
• Control with process computer: Indoor climate and potato temperature are con-trolled automatically based on a choosen or given control strategy, which can bedifferent for each phase in the storage process, based on product temperature and ontemperature and humidity of outdoor air, air in the storage room, and air in the airdistribution system. Advantages are a full integration of the control of all actuators;that ventilation with outside air, mixed air, and conditioned air can be controlledby the process computer based upon economic criteria; that no additional equip-ment such as timers is needed (for periodical internal ventilation, use of cheaperpower rates, etc.); and that the process computer can be coupled with a personalcomputer to allow remote monitoring and control of setpoints and postprocessingof data.
2.2.9 Equipment in Storage Houses
The most important equipment in a potato store is the airflow equipment (fans)plus the air-distribution system (which is part of store contruction), mixing valves, air-conditioning equipment, and sensors.
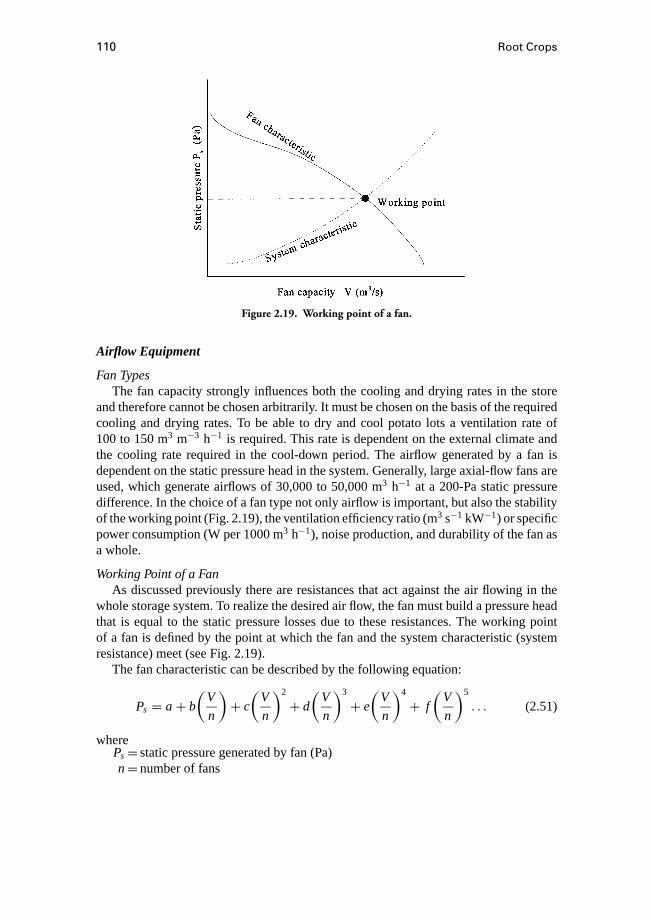
110 Root Crops
Figure 2.19. Working point of a fan.
Airflow Equipment
Fan TypesThe fan capacity strongly influences both the cooling and drying rates in the store
and therefore cannot be chosen arbitrarily. It must be chosen on the basis of the requiredcooling and drying rates. To be able to dry and cool potato lots a ventilation rate of100 to 150 m3 m−3 h−1 is required. This rate is dependent on the external climate andthe cooling rate required in the cool-down period. The airflow generated by a fan isdependent on the static pressure head in the system. Generally, large axial-flow fans areused, which generate airflows of 30,000 to 50,000 m3 h−1 at a 200-Pa static pressuredifference. In the choice of a fan type not only airflow is important, but also the stabilityof the working point (Fig. 2.19), the ventilation efficiency ratio (m3 s−1 kW−1) or specificpower consumption (W per 1000 m3 h−1), noise production, and durability of the fan asa whole.
Working Point of a FanAs discussed previously there are resistances that act against the air flowing in the
whole storage system. To realize the desired air flow, the fan must build a pressure headthat is equal to the static pressure losses due to these resistances. The working pointof a fan is defined by the point at which the fan and the system characteristic (systemresistance) meet (see Fig. 2.19).
The fan characteristic can be described by the following equation:
Ps = a+ b
(V
n
)+ c
(V
n
)2
+ d
(V
n
)3
+ e
(V
n
)4
+ f
(V
n
)5
. . . (2.51)
wherePs= static pressure generated by fan (Pa)n=number of fans
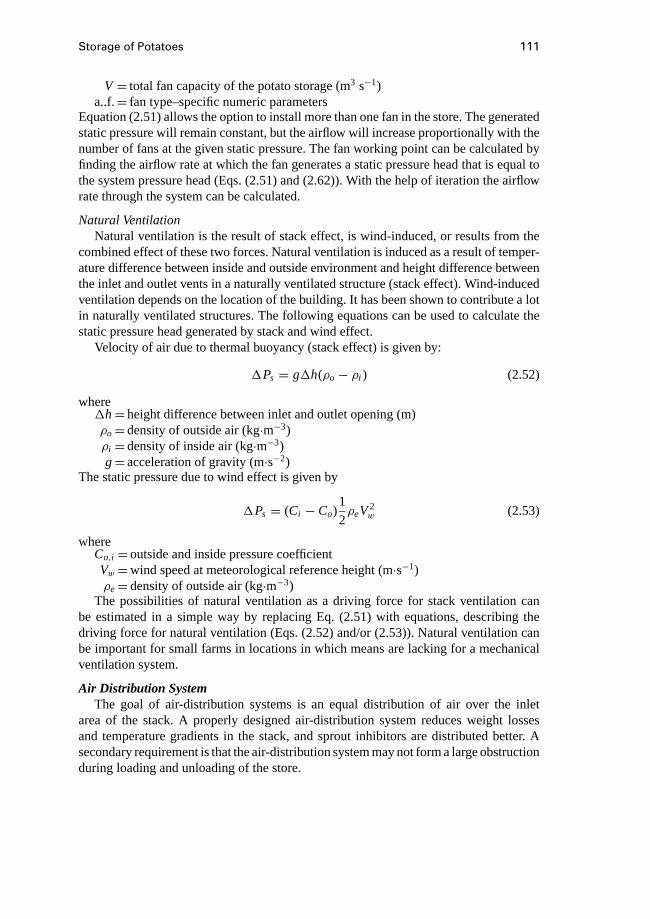
Storage of Potatoes 111
V = total fan capacity of the potato storage (m3 s−1)a..f.= fan type–specific numeric parameters
Equation (2.51) allows the option to install more than one fan in the store. The generatedstatic pressure will remain constant, but the airflow will increase proportionally with thenumber of fans at the given static pressure. The fan working point can be calculated byfinding the airflow rate at which the fan generates a static pressure head that is equal tothe system pressure head (Eqs. (2.51) and (2.62)). With the help of iteration the airflowrate through the system can be calculated.
Natural VentilationNatural ventilation is the result of stack effect, is wind-induced, or results from the
combined effect of these two forces. Natural ventilation is induced as a result of temper-ature difference between inside and outside environment and height difference betweenthe inlet and outlet vents in a naturally ventilated structure (stack effect). Wind-inducedventilation depends on the location of the building. It has been shown to contribute a lotin naturally ventilated structures. The following equations can be used to calculate thestatic pressure head generated by stack and wind effect.
Velocity of air due to thermal buoyancy (stack effect) is given by:
1Ps = g1h(ρo − ρi ) (2.52)
where1h=height difference between inlet and outlet opening (m)ρo=density of outside air (kg·m−3)ρi =density of inside air (kg·m−3)g=acceleration of gravity (m·s−2)
The static pressure due to wind effect is given by
1Ps = (Ci − Co)1
2ρeV2
w (2.53)
whereCo,i =outside and inside pressure coefficientVw =wind speed at meteorological reference height (m·s−1)ρe=density of outside air (kg·m−3)
The possibilities of natural ventilation as a driving force for stack ventilation canbe estimated in a simple way by replacing Eq. (2.51) with equations, describing thedriving force for natural ventilation (Eqs. (2.52) and/or (2.53)). Natural ventilation canbe important for small farms in locations in which means are lacking for a mechanicalventilation system.
Air Distribution SystemThe goal of air-distribution systems is an equal distribution of air over the inlet
area of the stack. A properly designed air-distribution system reduces weight lossesand temperature gradients in the stack, and sprout inhibitors are distributed better. Asecondary requirement is that the air-distribution system may not form a large obstructionduring loading and unloading of the store.

112 Root Crops
Figure 2.20. Underground channels (A) and fully slatted floor (B) under potatoes stored in bulk.
Potatoes Stored in BulkPractical systems are channels above floor level, channels below floor level, or fully
slatted floor with aeration channels below (Fig. 2.20). A fully slatted floor is the best so-lution to achieve optimal air distribution, because there are no floor parts through whichno air is admitted to the stack. Airspeed at the entrance of the floor channels should be4 to 6 m·s−1.
Channels above floor level are wooden triangular ducts or perforated half-round cor-rugated steel elements. Low investment and high flexibility of floor use are the mainadvantages. The distance between the center line of two channels should be smaller thanor equal to the stack height to prevent dead areas. Airspeed in the channels may rangefrom 6 to 10 m·s−1. To restrict friction losses and allow good air distribution a maxi-mum air speed of 8 m·s−1 should be considered. To allow uniform distribution of outletairflows along the length of the duct, the cross-section must decrease with the lengthmeasured from the inlet side without showing sudden changes. Outlet openings must beprojected as close to the floor as possible to prevent dead areas. For wooden channels thetotal outlet area of a duct may be two to three times the area of the cross-section of thelargest element. For half-round steel ducts the outlet area should be restricted to 1.5 to 2times the cross-sectional area of the largest element. The obstruction of outlet openingsby potatoes is smaller with half-round corrugated steel pipes than with triangular woodenducts. An airspeed of 4 m·s−1 in the outlet openings is seen as an optimum value thatallows minimal pressure loss.
Underground channels are projected closer together. A center-line distance of twochannels of 80% of the stack height is advised. Underground channels are designed asequal (static) pressure channels or as channels with a constant cross-sectional area. Forequal-pressure channels the ratio of hydraulic diameter at the rear end and the hydraulicdiameter at the front end should be between 1 : 4 and 1 : 6. The shape theoretically needed
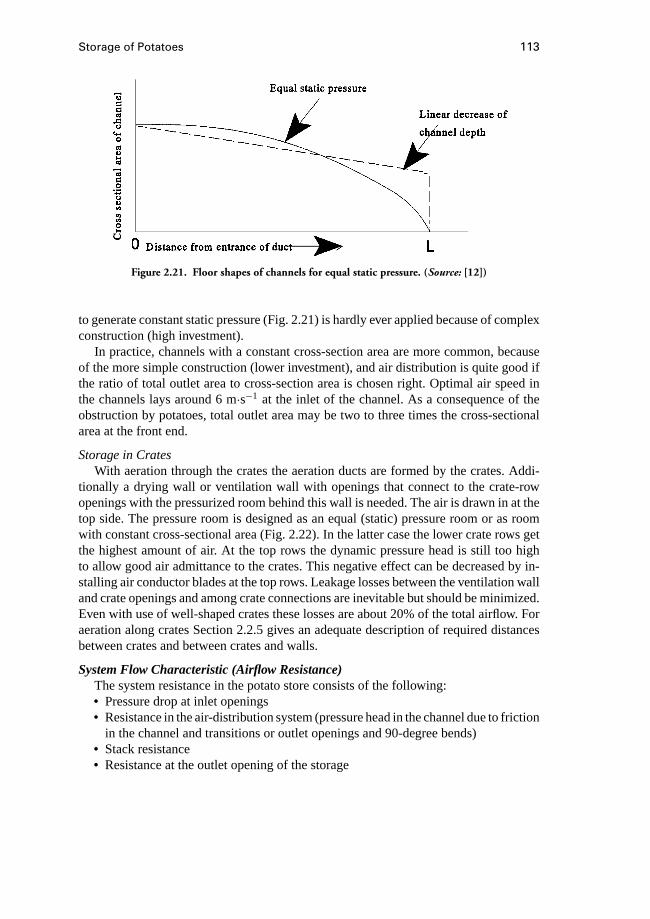
Storage of Potatoes 113
Figure 2.21. Floor shapes of channels for equal static pressure. (Source: [12])
to generate constant static pressure (Fig. 2.21) is hardly ever applied because of complexconstruction (high investment).
In practice, channels with a constant cross-section area are more common, becauseof the more simple construction (lower investment), and air distribution is quite good ifthe ratio of total outlet area to cross-section area is chosen right. Optimal air speed inthe channels lays around 6 m·s−1 at the inlet of the channel. As a consequence of theobstruction by potatoes, total outlet area may be two to three times the cross-sectionalarea at the front end.
Storage in CratesWith aeration through the crates the aeration ducts are formed by the crates. Addi-
tionally a drying wall or ventilation wall with openings that connect to the crate-rowopenings with the pressurized room behind this wall is needed. The air is drawn in at thetop side. The pressure room is designed as an equal (static) pressure room or as roomwith constant cross-sectional area (Fig. 2.22). In the latter case the lower crate rows getthe highest amount of air. At the top rows the dynamic pressure head is still too highto allow good air admittance to the crates. This negative effect can be decreased by in-stalling air conductor blades at the top rows. Leakage losses between the ventilation walland crate openings and among crate connections are inevitable but should be minimized.Even with use of well-shaped crates these losses are about 20% of the total airflow. Foraeration along crates Section 2.2.5 gives an adequate description of required distancesbetween crates and between crates and walls.
System Flow Characteristic (Airflow Resistance)The system resistance in the potato store consists of the following:• Pressure drop at inlet openings• Resistance in the air-distribution system (pressure head in the channel due to friction
in the channel and transitions or outlet openings and 90-degree bends)• Stack resistance• Resistance at the outlet opening of the storage
114 Root Crops
Figure 2.22. Different designs of pressurized rooms for crate storage: (A) constantsectional area; (B) equal pressure. (Source: [7])
Resistance at the Inlet OpeningThe resistance at the inlet opening can be calculated by the following equation:
1P = Copen
(Aopen)2
1
2ρV2 (2.54)
whereCopen= resistance coefficient (Euler number) for a sharp rectangular openingAopen=area of the inlet opening (m2)
V =airflow through the opening (m3 s−1)The air passes this opening before it passes the fan. The value of the Euler number forsharp openings is approximately 2.5, which is equivalent to a discharge coefficient of0.63 [20].
Resistance in the Air-distribution SystemWhile moving from the inlet opening to the potatoes the air encounters first the fan,
then one or two 90-degree turns between the pressure room and the duct system belowthe potato bin. The first component of the resistance, generated by the 90-degree turn,can be calculated using the approach described for the inlet opening. Only the Eulernumber changes from the calculation for the inlet openings:
1P = nC90◦
(Aduct)2
1
2ρV2 (2.55)
whereC90◦ = resistance coefficient of a 90-degree curveAduct=area of the duct after passing the 90-degree curve (m2)
N=number of 90-degree curves
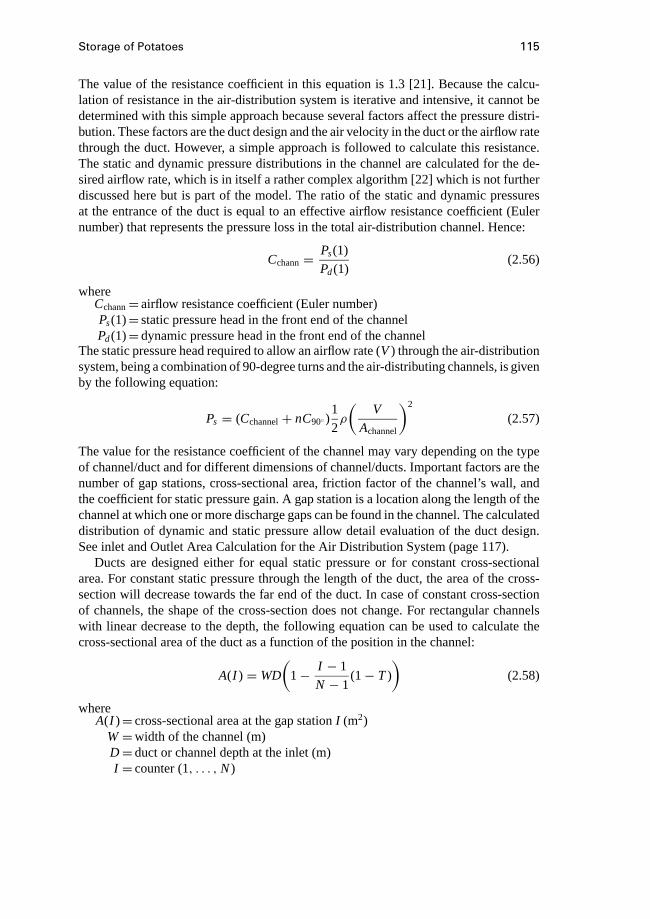
Storage of Potatoes 115
The value of the resistance coefficient in this equation is 1.3 [21]. Because the calcu-lation of resistance in the air-distribution system is iterative and intensive, it cannot bedetermined with this simple approach because several factors affect the pressure distri-bution. These factors are the duct design and the air velocity in the duct or the airflow ratethrough the duct. However, a simple approach is followed to calculate this resistance.The static and dynamic pressure distributions in the channel are calculated for the de-sired airflow rate, which is in itself a rather complex algorithm [22] which is not furtherdiscussed here but is part of the model. The ratio of the static and dynamic pressuresat the entrance of the duct is equal to an effective airflow resistance coefficient (Eulernumber) that represents the pressure loss in the total air-distribution channel. Hence:
Cchann= Ps(1)
Pd(1)(2.56)
whereCchann=airflow resistance coefficient (Euler number)Ps(1)= static pressure head in the front end of the channelPd(1)=dynamic pressure head in the front end of the channel
The static pressure head required to allow an airflow rate (V) through the air-distributionsystem, being a combination of 90-degree turns and the air-distributing channels, is givenby the following equation:
Ps = (Cchannel+ nC90◦ )1
2ρ
(V
Achannel
)2
(2.57)
The value for the resistance coefficient of the channel may vary depending on the typeof channel/duct and for different dimensions of channel/ducts. Important factors are thenumber of gap stations, cross-sectional area, friction factor of the channel’s wall, andthe coefficient for static pressure gain. A gap station is a location along the length of thechannel at which one or more discharge gaps can be found in the channel. The calculateddistribution of dynamic and static pressure allow detail evaluation of the duct design.See inlet and Outlet Area Calculation for the Air Distribution System (page 117).
Ducts are designed either for equal static pressure or for constant cross-sectionalarea. For constant static pressure through the length of the duct, the area of the cross-section will decrease towards the far end of the duct. In case of constant cross-sectionof channels, the shape of the cross-section does not change. For rectangular channelswith linear decrease to the depth, the following equation can be used to calculate thecross-sectional area of the duct as a function of the position in the channel:
A(I ) =WD
(1− I − 1
N − 1(1− T)
)(2.58)
whereA(I )= cross-sectional area at the gap stationI (m2)
W=width of the channel (m)D=duct or channel depth at the inlet (m)I = counter (1, . . . , N)
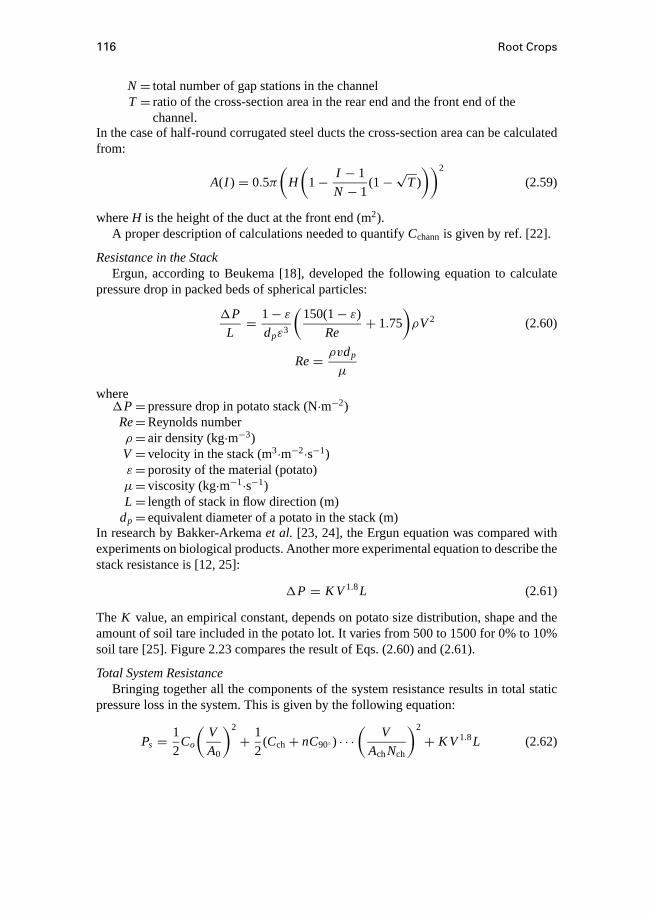
116 Root Crops
N= total number of gap stations in the channelT = ratio of the cross-section area in the rear end and the front end of the
channel.In the case of half-round corrugated steel ducts the cross-section area can be calculatedfrom:
A(I ) = 0.5π
(H
(1− I − 1
N − 1(1−√
T)
))2
(2.59)
whereH is the height of the duct at the front end (m2).A proper description of calculations needed to quantifyCchannis given by ref. [22].
Resistance in the StackErgun, according to Beukema [18], developed the following equation to calculate
pressure drop in packed beds of spherical particles:
1P
L= 1− ε
dpε3
(150(1− ε)
Re+ 1.75
)ρV2 (2.60)
Re= ρvdp
µ
where1P=pressure drop in potato stack (N·m−2)Re=Reynolds numberρ=air density (kg·m−3)V = velocity in the stack (m3·m−2·s−1)ε=porosity of the material (potato)µ= viscosity (kg·m−1·s−1)L = length of stack in flow direction (m)
dp=equivalent diameter of a potato in the stack (m)In research by Bakker-Arkemaet al. [23, 24], the Ergun equation was compared withexperiments on biological products. Another more experimental equation to describe thestack resistance is [12, 25]:
1P = K V1.8L (2.61)
The K value, an empirical constant, depends on potato size distribution, shape and theamount of soil tare included in the potato lot. It varies from 500 to 1500 for 0% to 10%soil tare [25]. Figure 2.23 compares the result of Eqs. (2.60) and (2.61).
Total System ResistanceBringing together all the components of the system resistance results in total static
pressure loss in the system. This is given by the following equation:
Ps = 1
2Co
(V
A0
)2
+ 1
2(Cch+ nC90◦ ) · · ·
(V
AchNch
)2
+ K V1.8L (2.62)
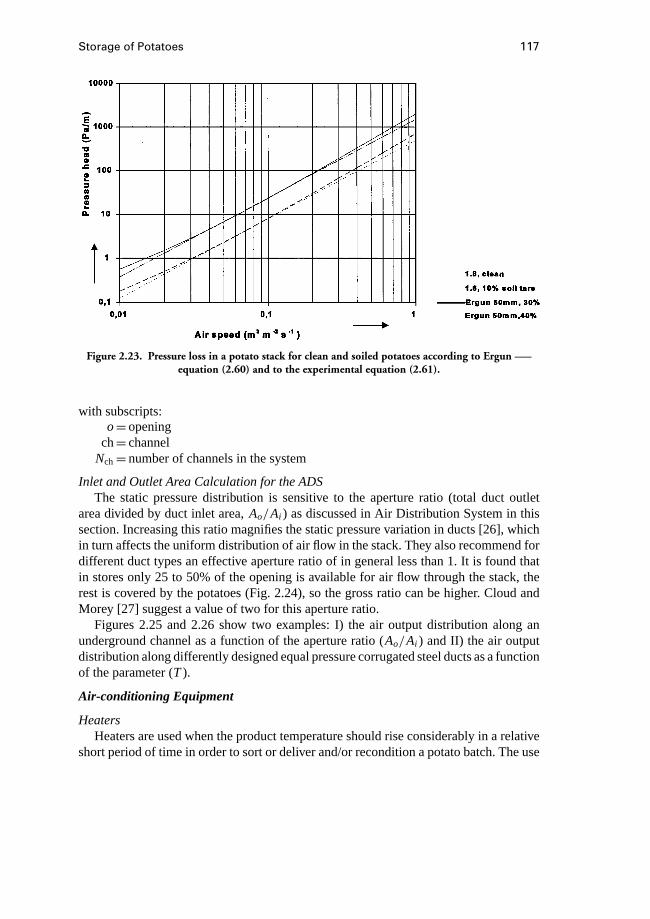
Storage of Potatoes 117
Figure 2.23. Pressure loss in a potato stack for clean and soiled potatoes according to Ergun —–equation (2.60) and to the experimental equation (2.61).
with subscripts:o=opening
ch= channelNch=number of channels in the system
Inlet and Outlet Area Calculation for the ADSThe static pressure distribution is sensitive to the aperture ratio (total duct outlet
area divided by duct inlet area,Ao/Ai ) as discussed in Air Distribution System in thissection. Increasing this ratio magnifies the static pressure variation in ducts [26], whichin turn affects the uniform distribution of air flow in the stack. They also recommend fordifferent duct types an effective aperture ratio of in general less than 1. It is found thatin stores only 25 to 50% of the opening is available for air flow through the stack, therest is covered by the potatoes (Fig. 2.24), so the gross ratio can be higher. Cloud andMorey [27] suggest a value of two for this aperture ratio.
Figures 2.25 and 2.26 show two examples: I) the air output distribution along anunderground channel as a function of the aperture ratio (Ao/Ai ) and II) the air outputdistribution along differently designed equal pressure corrugated steel ducts as a functionof the parameter (T).
Air-conditioning Equipment
HeatersHeaters are used when the product temperature should rise considerably in a relative
short period of time in order to sort or deliver and/or recondition a potato batch. The use
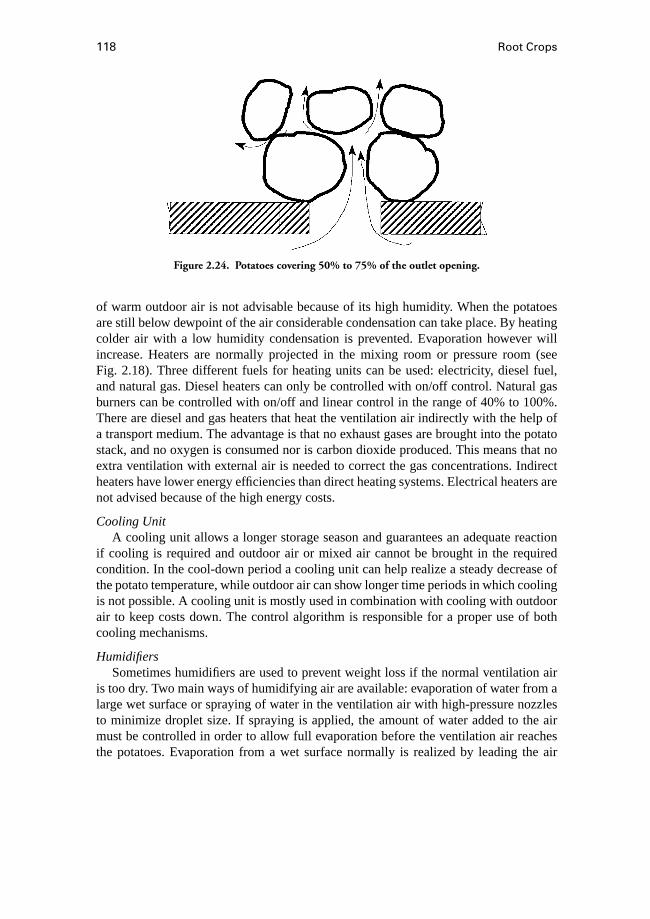
118 Root Crops
Figure 2.24. Potatoes covering 50% to 75% of the outlet opening.
of warm outdoor air is not advisable because of its high humidity. When the potatoesare still below dewpoint of the air considerable condensation can take place. By heatingcolder air with a low humidity condensation is prevented. Evaporation however willincrease. Heaters are normally projected in the mixing room or pressure room (seeFig. 2.18). Three different fuels for heating units can be used: electricity, diesel fuel,and natural gas. Diesel heaters can only be controlled with on/off control. Natural gasburners can be controlled with on/off and linear control in the range of 40% to 100%.There are diesel and gas heaters that heat the ventilation air indirectly with the help ofa transport medium. The advantage is that no exhaust gases are brought into the potatostack, and no oxygen is consumed nor is carbon dioxide produced. This means that noextra ventilation with external air is needed to correct the gas concentrations. Indirectheaters have lower energy efficiencies than direct heating systems. Electrical heaters arenot advised because of the high energy costs.
Cooling UnitA cooling unit allows a longer storage season and guarantees an adequate reaction
if cooling is required and outdoor air or mixed air cannot be brought in the requiredcondition. In the cool-down period a cooling unit can help realize a steady decrease ofthe potato temperature, while outdoor air can show longer time periods in which coolingis not possible. A cooling unit is mostly used in combination with cooling with outdoorair to keep costs down. The control algorithm is responsible for a proper use of bothcooling mechanisms.
HumidifiersSometimes humidifiers are used to prevent weight loss if the normal ventilation air
is too dry. Two main ways of humidifying air are available: evaporation of water from alarge wet surface or spraying of water in the ventilation air with high-pressure nozzlesto minimize droplet size. If spraying is applied, the amount of water added to the airmust be controlled in order to allow full evaporation before the ventilation air reachesthe potatoes. Evaporation from a wet surface normally is realized by leading the air
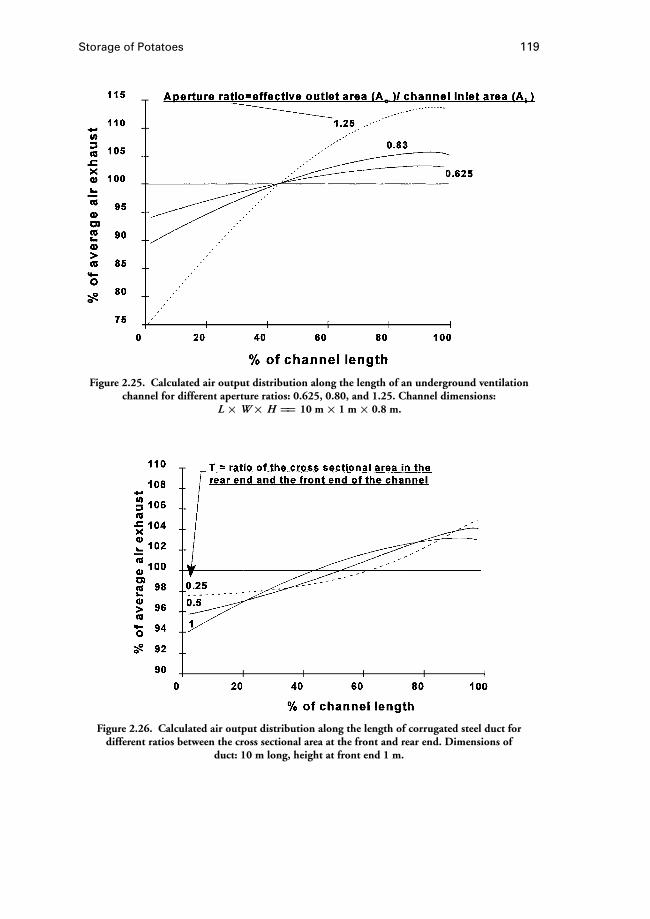
Storage of Potatoes 119
Figure 2.25. Calculated air output distribution along the length of an underground ventilationchannel for different aperture ratios: 0.625, 0.80, and 1.25. Channel dimensions:
L ×W× H == 10 m× 1 m× 0.8 m.
Figure 2.26. Calculated air output distribution along the length of corrugated steel duct fordifferent ratios between the cross sectional area at the front and rear end. Dimensions of
duct: 10 m long, height at front end 1 m.

120 Root Crops
through a wet pad. This humidification process is almost adiabatical; that is, enthalpyof the ventilation air is approximately constant. This means latent heat is added and anequal quantity of sensible heat is removed. The consequence is that the humidified aircools down.
AnticondensationEquipment to prevent condensation in the storage room is restricted to additional
small fans in the room between potato stack and ceiling (see Fig. 2.17) or in the endwalls of the storage room above the highest potato level to refresh the air in the storageroom (see Section 2.2.5).
SensorsIn order to get information from the storage process, or the indoor climate, temperature
and humidity measurements have to be carried out. Common temperature sensors inautomatically controlled stores are PT-100 and NTC sensors, in which the electricalresistance is temperature-dependent. The NTC has a high resistance, thus making thecable resistance negligible, but sensors of different producers cannot be exchanged andthe sensors are not entirely stable. After long-term usage the accuracy decreases. ThePT-100 sensor is most common. The sensor is very stable and exchangeable with otherbrands. Because of the low electrical resistance, correction for the cable resistance isnecessary. For this purpose a more expensive three- or four-wire cable is necessary.A standard PT-100 element has an inaccuracy of 0.3◦C. More accurate sensors areavailable but more expensive. On average, one temperature sensor per 100 ton of potatoesis enough. Further, it is advizable to place some sensors near the sidewalls of storesto monitor extreme temperatures in the stack. Sensors with different pen lengths areavailable to allow temperature measurement at various levels in a potato stack. To preventerrors from electrical or magnetical fields the use of shielded cables is advizable. Relative-humidity sensors are normally capacitative sensors.
2.2.10 Product Handling During Storage
Loading of Bulk StoresA field transport load is received in a buffer unit that should produce a constant,
clean product flow to the transport belts. Best is if the product flow is measured and thespeed of the floor belt is adjusted accordingly. The second function is to clean soil tarefrom the potatoes. Then the product is put on a transport line, consisting of low speedV-shaped transport belts with a transport capacity of about 70 ton/h. At the end of thetransport line a special-purpose transport belt is used, a “cell loader,” which can moveup and down to restrict the falling height and which moves along a circle segment ofvarying radius to allow equal loading over a full cell width. Some times the movementsof cell loaders can be programmed to allow automatic terace filling [25]. Drop heightsof potatoes should be restricted to less than 150 mm for a free fall on a hard surface, lessthan 300 mm for a fall on other potatoes, and less than 750 mm if the fall is broken ona soft 45 degree–angled surface. The allowable drop height is somewhat dependent onthe potato’s diameter. Large diameters require a smaller maximum fall height.
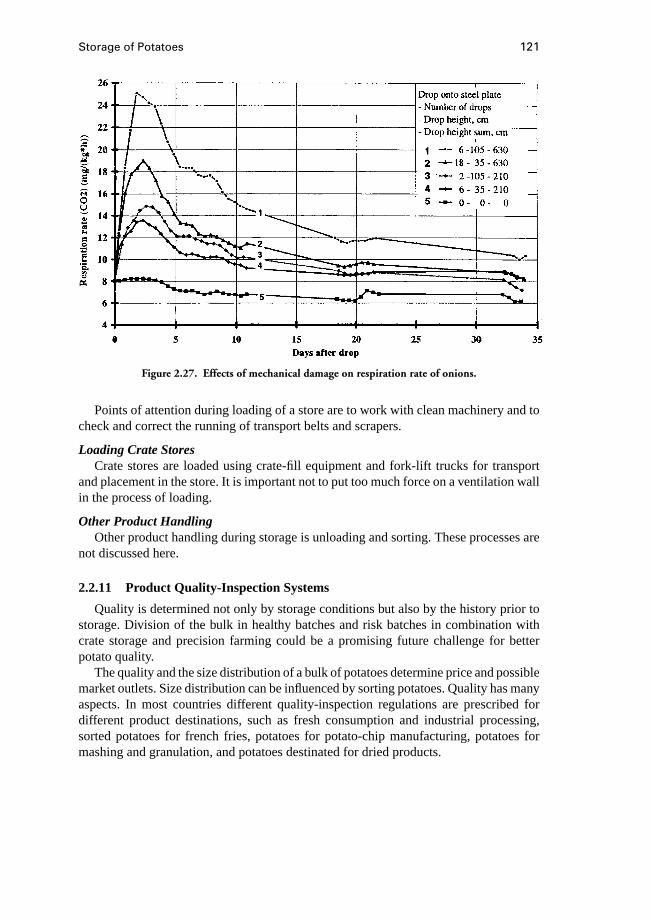
Storage of Potatoes 121
Figure 2.27. Effects of mechanical damage on respiration rate of onions.
Points of attention during loading of a store are to work with clean machinery and tocheck and correct the running of transport belts and scrapers.
Loading Crate StoresCrate stores are loaded using crate-fill equipment and fork-lift trucks for transport
and placement in the store. It is important not to put too much force on a ventilation wallin the process of loading.
Other Product HandlingOther product handling during storage is unloading and sorting. These processes are
not discussed here.
2.2.11 Product Quality-Inspection Systems
Quality is determined not only by storage conditions but also by the history prior tostorage. Division of the bulk in healthy batches and risk batches in combination withcrate storage and precision farming could be a promising future challenge for betterpotato quality.
The quality and the size distribution of a bulk of potatoes determine price and possiblemarket outlets. Size distribution can be influenced by sorting potatoes. Quality has manyaspects. In most countries different quality-inspection regulations are prescribed fordifferent product destinations, such as fresh consumption and industrial processing,sorted potatoes for french fries, potatoes for potato-chip manufacturing, potatoes formashing and granulation, and potatoes destinated for dried products.
122 Root Crops
Table 2.9. Possible defects in potatoes
Defect Permitted Percentage
Frost damage 0Attached soil (tare) 2Decay (wet rot) 2Black hearts 2Glass 3Powder burn 3Internal sprouts >1 cm 3Scabies 3Wrinkling or limpness 5Physical defects and growth cracks 8
Generally, from a potato lot, two samples are taken for inspection, one for the inspec-tion at hand and the other for a second opinion if requested by the grower. The samplesare generally assessed on:• Weight percentage of tare (soil and sprouts) and weight percentage of potatoes with
defects (Table 2.9)• Distribution of potatoes over a range of sorting classes• Quality index based upon black coloring, internal coloring, and glassiness• Temperature at arrival (≥12◦C), underwater weight, baking color index
Frost damage can occur due to an error in the ventilation system or due to an insufficientinsulation level. Rot can be caused by wet potatoes, glass, poor ventilation, or conden-sation on walls or ceiling. Black hearts are caused by an oxygen deficit in the tuber.Heating up potatoes with air that is too warm increases dissimilation, which can causea shortage of oxygen [12].
Powder burn shows as thick and leathery peel at places that were damaged previously.The use of chemical means for sprout control on damaged tubers induces powder burn,especially in combination with incomplete wound healing. Spots larger than 20 mmare seen as external defects [29]. Internal sprouting occurs if time intervals betweenadministering sprout suppressants are too long. We speak of scabies on a tuber if morethan one sixth of the tuber surface shows this disease and the depth of the damaged areais more than 2 mm. At a moisture loss higher than 10%, wrinkling and limpness occurs.Tubers with growth cracks longer than one third of the tuber length and depths larger than10 mm are rejected. The distribution of a potato batch over sorting classes influences theprice greatly. Larger sizes and more uniform lots get a better price. Based on the qualityindex a bonus or rebate is calculated over the yield price. A poor quality index can evencause rejection of a potato lot by a buyer (wholesaler or in the processing industry).
Sensitivity for black spots can be measured by shacking a sample for 30 seconds,which is considered normal in practice. Then the potato sample is preserved for 48 hoursto allow black coloring. Black spots occur if potatoes are not heated properly beforetransport. After peeling the sample, the tubers are divided in four classes based on thelargest black spot: I) no black spots, II) light (spots< 2 mm), III) moderate (diameterbetween 2 and 5 mm), IV) heavy (diameter black spots> 10 mm).
Storage of Potatoes 123
Glassiness is judged by submerging a sample in a salt bath. The density of the saltwater is variety-dependent. Floating potatoes are cut to show the largest cut area andassigned to three classes of glassiness (light, moderate, heavy).
The underwater weight is a measure for the dry-matter content of potatoes, and it ismeasured by submerging 1000 g of potatoes in a water vessel. The minimum value forthe underwater weight is 360 g. The dry-matter content can be calculated from [8]:
% dry matter= 0.0492· underwater weight+ 2.00 (2.63)
For french fries and the potato-chip industry baking quality is important. Dependent onthe concentration of reducing sugars during a baking process, the product can show adark color and a bitter taste. The test on reducing sugar is carried out by selecting 20healthy tubers, cutting one fry of 1×1 cm from each tuber, baking the fries, and judging,the color against a standard color-index chart. This results in a baking color index thatmay not be higher than 4, which is equivalent to 0.35% reducing sugars in the freshweight of the potatoes.
The potato storage process can influence these quality parameters: black spots, bakingcolor index, decay, frost damage, black hearts, powder burn, internal sprouting, andmoisture loss (wrinkling and limpness).
References
1. Brittanica CD version 2.0, Encyclopeadia Brittanica 1995.2. Brittanica World Data. 1997.Brittanica Book of the Year. ed. D. Calhoun. Encyclo-
peadia Brittanica, Chicago.3. LEI-DLO. 1994. Landbouwcijfers [Dutch Agricultural Statistics]. The Hague. NI-
VAA, The Hague Netherlands.4. NIVAA Holland. 1995. Productie en afzet consumptie- en industrieaardappelen
[Production and market for consumer and processing potatoes]. The Hague: DutchPotato Office.
5. Lemaga, B.,et al.1994. Production constraints and some improved technologies ofpotato production in Ethiopia [unpublished report]. Addis Ababa, Ethiopia: Instituteof Agricultural Research.
6. FAO. 1986. Farm structures in tropical climates.InFAO/SIDA Cooperative Pro-gramme: Rural Structures in East and Southeast Africa, ed. L. P. Bengtsson andJ. H. Whitaker. FAO, Rome, Italy.
7. Scheer, A. 1996. Ventilatiesystemen voor kistenbewaring aardappelen [Ventilationsystems in crate stores for potatoes].Landbouwmechanisatie47(9):16–18.
8. van der Schild, J. H. W. 1986. Aardappelbewaring: van inschuren tot afleveren[Potato storage: Loading to unloading stores]. Institute for Storage and Processingof Orable Products, Verweij Wageningen.
9. Scheer, A. 1990. Mechanische koeling van pootgoed en consumptieaardappe-len [Mechanical cooling of seed and consumer potatoes].Landbouwmechanisatie41(8):7–10.
10. Potato Storage. 1985. Stoneleigh, UK: National Agricultural Centre.

124 Root Crops
11. Hesen, J. C. 1987. Potato storage in temperate climates. Publication no. 370; Institutefor Storage and Processing of Arable Products.
12. Rastovski, A., and A. van Es. 1987.Storage of Potatoes: Postharvest Behaviour,Store Design, Storage Practice, Handling. Institute for Storage and Processing ofOrable Products, Pudoc Wageningen. Centre for Agricultural Publishing and Doc-umentation, Wageningen, Netherlands.
13. Irvine, D. A., D. S. Jayas, and G. Mazza. 1993. Resistance to airflow through cleanand soiled potatoes.Trans. ASAE36:1405–1410.
14. Scheer, A. 1991. Mechanische koeling van aardappelen (mechanical cooling ofpotatoes).Landbouwmechanisatie42(1):64–66.
15. Van’t Ooster, A. 1996. Engineering in arable farms: Potato storage. Lecture book,Agricultural Engineering, Wageningen Agricultural University.
16. Boel, R. L. A. 1991. Validatie en uitbreiding van een bestaand model voor de simu-latie van het thermisch en hygrisch gedrag van een aardappelstapeling gebaseerd ophet programma BFEP [Validation and development of an existing model for simu-lation of the thermal and hygric behavior of a potato bulk store with BFEP]. MSc-Thesis. Department of Agricultural Engineering and Physics, Wageningen Agricul-tural University. (not published).
17. Hendrikse, M. H. 1985. Bouwfysische aspecten van aardappelbewaarplaatsen [Phys-ical aspects of potato stores]. MSc-Thesis Department Civil Engineering, TU-Delft,nr. C-042, Delft. (not published)
18. Beukema, J. J. 1980. Heat and mass transfer during cooling and storage of agricul-tural products as influenced by natural convection. Ph.D. diss., Wageningen Agri-cultural University, Pudoc Wageningen.
19. Bird, R. B., W. E. Stewart, and E. N. Lightfoot. 1960.Transport phenomena.New York: John Wiley and Sons.
20. Wilson J. O., L. D. Albright, J. M. Walker. 1983. Ventilation Air Distribution. Chapterin. Ventilation of Agricultural Structures, eds. M. A. Hellickson, J. M. Walker, J. A.Basselman. St. Joseph, MI: ASAE.
21. ASHRAE. 1989.Handbook of Fundamentals(SI edition). ed. R. A. Parsons Atlanta:Author.
22. Boer, L. A. 1995. Modellering van ventilatiesystemen bij de bewaring van aardap-pelen [Modelling of ventilation systems in stores for potatoes]. MSc-Thesis Depart-ment of Agricultural Engineering and Physics, Wageningen Agricultural University.(not published)
23. Bakker-Arkema, F. W., R. J. Patterson, and W. G. Bickert. 1969. Static pressureairflow relationship in packed beds of granular biological materials such as cherrypits.Trans. ASAE12:134–136.
24. Patterson, R. J., F. W. Bakker-Arkema, and W. G. Bickert. 1971. Static pressureairflow relationships in packed beds of granular biological materials such as grain—II. Trans. ASAE14:172–174.
25. Hunter, J. H. 1986. Heat of respiration and weight loss from potatoes in storage. InEngineering for Potatoes, ed. B. F. Cargill. St. Joseph, MI: Michigan State University& American Society of Agricultural Engineers.
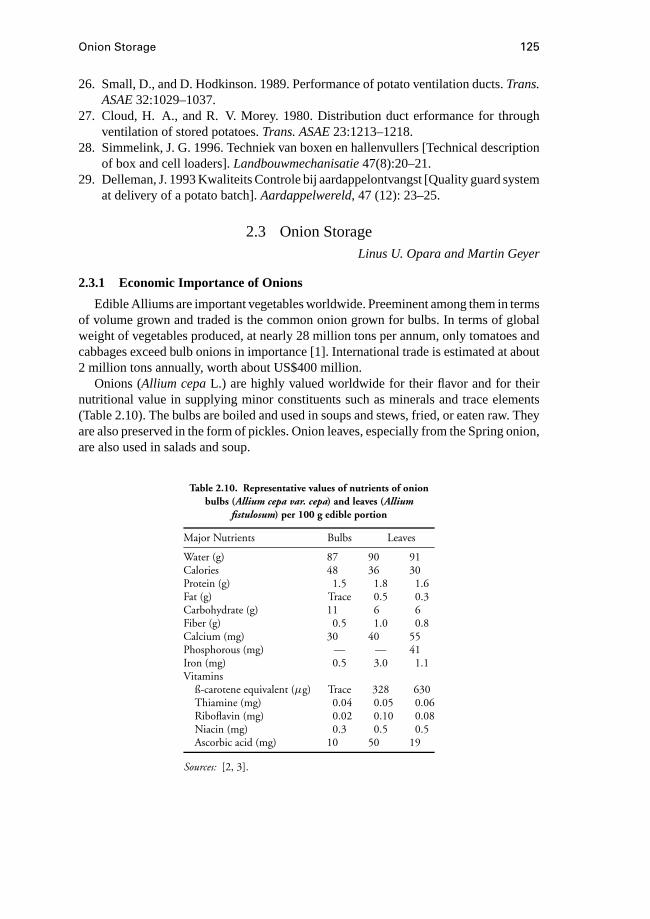
Onion Storage 125
26. Small, D., and D. Hodkinson. 1989. Performance of potato ventilation ducts.Trans.ASAE32:1029–1037.
27. Cloud, H. A., and R. V. Morey. 1980. Distribution duct erformance for throughventilation of stored potatoes.Trans. ASAE23:1213–1218.
28. Simmelink, J. G. 1996. Techniek van boxen en hallenvullers [Technical descriptionof box and cell loaders].Landbouwmechanisatie47(8):20–21.
29. Delleman, J. 1993 Kwaliteits Controle bij aardappelontvangst [Quality guard systemat delivery of a potato batch].Aardappelwereld, 47 (12): 23–25.
2.3 Onion StorageLinus U. Opara and Martin Geyer
2.3.1 Economic Importance of Onions
Edible Alliums are important vegetables worldwide. Preeminent among them in termsof volume grown and traded is the common onion grown for bulbs. In terms of globalweight of vegetables produced, at nearly 28 million tons per annum, only tomatoes andcabbages exceed bulb onions in importance [1]. International trade is estimated at about2 million tons annually, worth about US$400 million.
Onions (Allium cepaL.) are highly valued worldwide for their flavor and for theirnutritional value in supplying minor constituents such as minerals and trace elements(Table 2.10). The bulbs are boiled and used in soups and stews, fried, or eaten raw. Theyare also preserved in the form of pickles. Onion leaves, especially from the Spring onion,are also used in salads and soup.
Table 2.10. Representative values of nutrients of onionbulbs (Allium cepa var. cepa) and leaves (Allium
fistulosum) per 100 g edible portion
Major Nutrients Bulbs Leaves
Water (g) 87 90 91Calories 48 36 30Protein (g) 1.5 1.8 1.6Fat (g) Trace 0.5 0.3Carbohydrate (g) 11 6 6Fiber (g) 0.5 1.0 0.8Calcium (mg) 30 40 55Phosphorous (mg) — — 41Iron (mg) 0.5 3.0 1.1Vitamins
ß-carotene equivalent (µg) Trace 328 630Thiamine (mg) 0.04 0.05 0.06Riboflavin (mg) 0.02 0.10 0.08Niacin (mg) 0.3 0.5 0.5Ascorbic acid (mg) 10 50 19
Sources: [2, 3].
126 Root Crops
Onions are a major crop in the tropics, which account for nearly 30% of total globalproduction [4]. Estimated loss of total crop in these countries is high and can reach 20% to95% [5]. Losses between wholesale and retail of over 9% have been reported for Springonions [6]. Although some tropical countries are net importers, export potential of onionsis developing in several tropical regions partly because if dried and packed properly thebulbs can be transported for considerable distances without deteriorating. Storage forseveral months also is possible if suitable bulb temperatures can be maintained.
Proper storage environment is critical to minimize bulb softening, shriveling, weightloss, and development of storage rots and decay. Different cultivars have variable storagelife. In general, poor-keeping cultivars are less pungent [7] and have a low dry-mattercontent [8], a low refractive index [9, 10], and high relative rate of water loss and totalwater loss, especially in the period immediately following harvest. Poor-storing cultivarsalso are more susceptible to storage rots, sprout more readily [11], and benefit more from“curing.”
2.3.2 Physiology and Quality
The commercially grown bulb onion is a biennial crop with origin in Asia. The bulbsare naturally dormant organs adapted to maintaining the plant as viable during a periodunfavorable for growth. In the native habitat of the wild ancestors of onions and garlicthe bulbs may have enabled the plants to survive periods of summer drought and wintercold [1]. The onion shows a distinctly marked dormancy between the vegetative and thegenerative growth periods. Therefore, bulbs are natural storage organs, well adapted forlong-term crop storage.
The outer dry skins are very important for maintaining the dormancy, preventingwater loss, and excluding pathogens. Bulb storage rests on knowledge of the physiologyplus a knowledge of the pathology of diseases of stored bulbs. Depending on variety, thedormancy and storage period ranges from a few days to several months. The storage lifedepends also on climatic conditions (especially temperature) during storage. The dor-mancy is shortened by external stimulation such as mechanical stress during harvest andhandling, lighting during storage, and fluctuation of storage temperature and humidity.
During dormancy the bulb is protected by the outer scales. In this way the outer scaleslose water and form dry skins while the inner scales stay fresh and firm. As dormancydeclines the sprout leaves elongate and become visible. Sprout development takes energyfrom all scales and causes the bulbs to become soft, resulting in quality loss.
Temperature EffectsSprouting is depressed during dormancy at lower and higher temperatures. The rate
of elongation of sprouts within the bulb and the rate of leaf initiation were much fasterat 15 than at 0 or 30◦C. Therefore, sprout development in onion bulbs, unlike mostphysiological processes, does not increase in rate progressively as temperature increases.Once sprouting has occurred in rooted bulbs, sprout growth rate increases progressivelywith temperature [1].
Metabolic ActivityRespiration rates of produce indicate the degree of metabolic activity and provide use-
ful insights in the design of storage systems for environmental and atmospheric control.
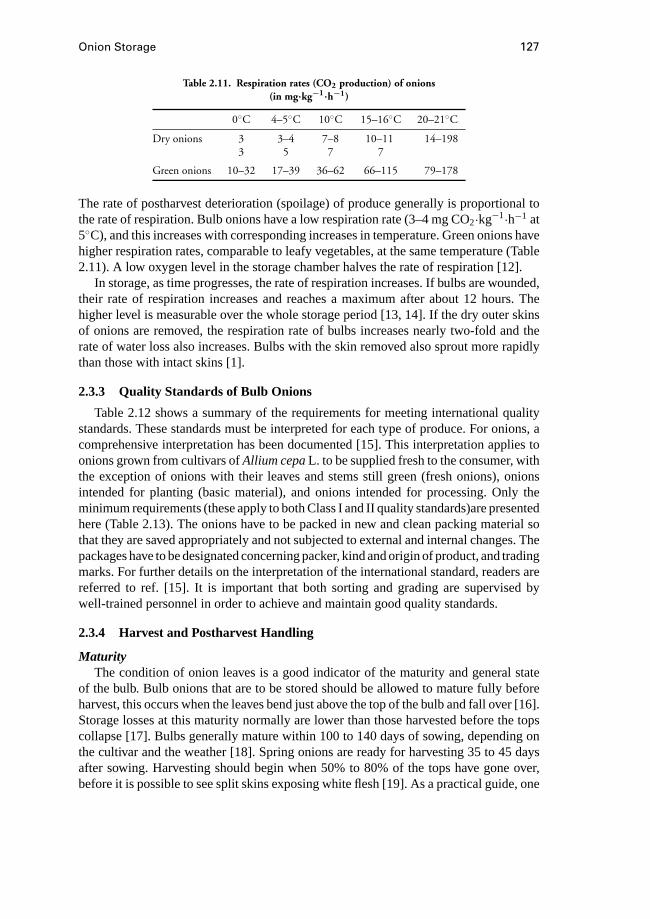
Onion Storage 127
Table 2.11. Respiration rates (CO2 production) of onions(in mg·kg−1·h−1)
0◦C 4–5◦C 10◦C 15–16◦C 20–21◦C
Dry onions 3 3–4 7–8 10–11 14–1983 5 7 7
Green onions 10–32 17–39 36–62 66–115 79–178
The rate of postharvest deterioration (spoilage) of produce generally is proportional tothe rate of respiration. Bulb onions have a low respiration rate (3–4 mg CO2·kg−1·h−1 at5◦C), and this increases with corresponding increases in temperature. Green onions havehigher respiration rates, comparable to leafy vegetables, at the same temperature (Table2.11). A low oxygen level in the storage chamber halves the rate of respiration [12].
In storage, as time progresses, the rate of respiration increases. If bulbs are wounded,their rate of respiration increases and reaches a maximum after about 12 hours. Thehigher level is measurable over the whole storage period [13, 14]. If the dry outer skinsof onions are removed, the respiration rate of bulbs increases nearly two-fold and therate of water loss also increases. Bulbs with the skin removed also sprout more rapidlythan those with intact skins [1].
2.3.3 Quality Standards of Bulb Onions
Table 2.12 shows a summary of the requirements for meeting international qualitystandards. These standards must be interpreted for each type of produce. For onions, acomprehensive interpretation has been documented [15]. This interpretation applies toonions grown from cultivars ofAllium cepaL. to be supplied fresh to the consumer, withthe exception of onions with their leaves and stems still green (fresh onions), onionsintended for planting (basic material), and onions intended for processing. Only theminimum requirements (these apply to both Class I and II quality standards)are presentedhere (Table 2.13). The onions have to be packed in new and clean packing material sothat they are saved appropriately and not subjected to external and internal changes. Thepackages have to be designated concerning packer, kind and origin of product, and tradingmarks. For further details on the interpretation of the international standard, readers arereferred to ref. [15]. It is important that both sorting and grading are supervised bywell-trained personnel in order to achieve and maintain good quality standards.
2.3.4 Harvest and Postharvest Handling
MaturityThe condition of onion leaves is a good indicator of the maturity and general state
of the bulb. Bulb onions that are to be stored should be allowed to mature fully beforeharvest, this occurs when the leaves bend just above the top of the bulb and fall over [16].Storage losses at this maturity normally are lower than those harvested before the topscollapse [17]. Bulbs generally mature within 100 to 140 days of sowing, depending onthe cultivar and the weather [18]. Spring onions are ready for harvesting 35 to 45 daysafter sowing. Harvesting should begin when 50% to 80% of the tops have gone over,before it is possible to see split skins exposing white flesh [19]. As a practical guide, one
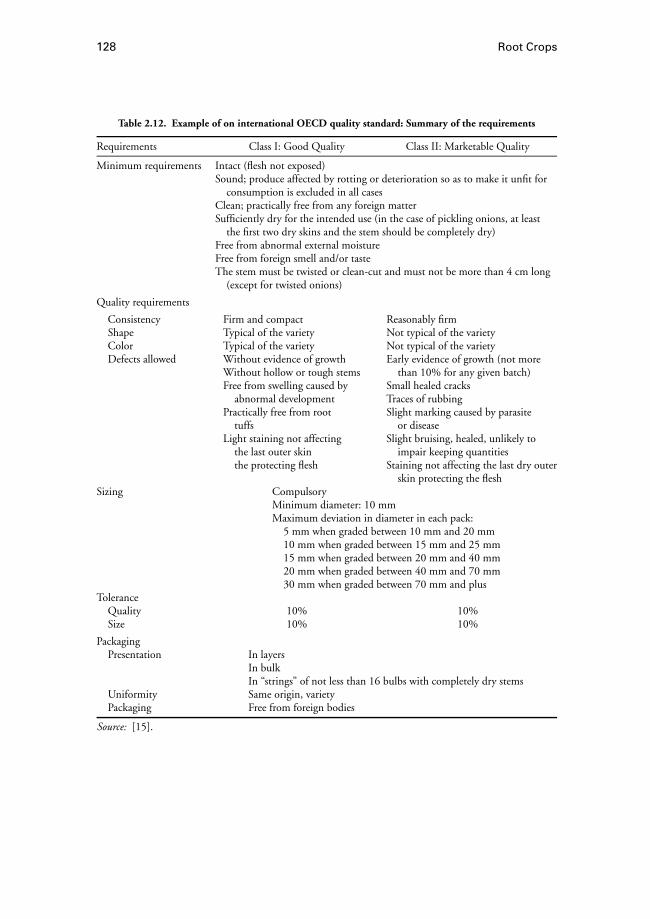
128 Root Crops
Table 2.12. Example of on international OECD quality standard: Summary of the requirements
Requirements Class I: Good Quality Class II: Marketable Quality
Minimum requirements Intact (flesh not exposed)Sound; produce affected by rotting or deterioration so as to make it unfit for
consumption is excluded in all casesClean; practically free from any foreign matterSufficiently dry for the intended use (in the case of pickling onions, at least
the first two dry skins and the stem should be completely dry)Free from abnormal external moistureFree from foreign smell and/or tasteThe stem must be twisted or clean-cut and must not be more than 4 cm long
(except for twisted onions)
Quality requirements
Consistency Firm and compact Reasonably firmShape Typical of the variety Not typical of the varietyColor Typical of the variety Not typical of the varietyDefects allowed Without evidence of growth Early evidence of growth (not more
Without hollow or tough stems than 10% for any given batch)Free from swelling caused by Small healed cracks
abnormal development Traces of rubbingPractically free from root Slight marking caused by parasite
tuffs or diseaseLight staining not affecting Slight bruising, healed, unlikely to
the last outer skin impair keeping quantitiesthe protecting flesh Staining not affecting the last dry outer
skin protecting the fleshSizing Compulsory
Minimum diameter: 10 mmMaximum deviation in diameter in each pack:
5 mm when graded between 10 mm and 20 mm10 mm when graded between 15 mm and 25 mm15 mm when graded between 20 mm and 40 mm20 mm when graded between 40 mm and 70 mm30 mm when graded between 70 mm and plus
ToleranceQuality 10% 10%Size 10% 10%
PackagingPresentation In layers
In bulkIn “strings” of not less than 16 bulbs with completely dry stems
Uniformity Same origin, varietyPackaging Free from foreign bodies
Source: [15].
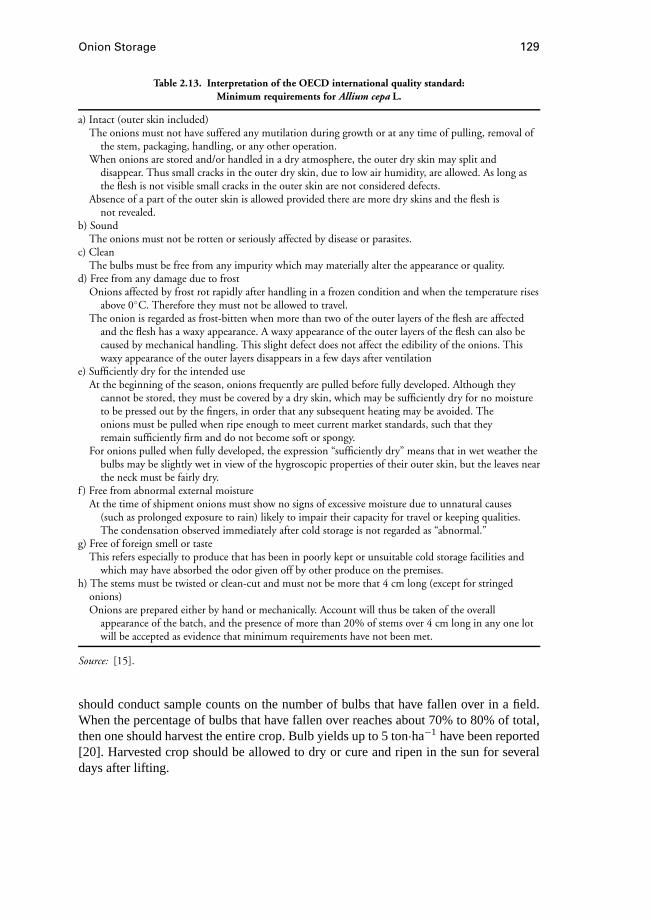
Onion Storage 129
Table 2.13. Interpretation of the OECD international quality standard:Minimum requirements for Allium cepa L.
a) Intact (outer skin included)The onions must not have suffered any mutilation during growth or at any time of pulling, removal of
the stem, packaging, handling, or any other operation.When onions are stored and/or handled in a dry atmosphere, the outer dry skin may split and
disappear. Thus small cracks in the outer dry skin, due to low air humidity, are allowed. As long asthe flesh is not visible small cracks in the outer skin are not considered defects.
Absence of a part of the outer skin is allowed provided there are more dry skins and the flesh isnot revealed.
b) SoundThe onions must not be rotten or seriously affected by disease or parasites.
c) CleanThe bulbs must be free from any impurity which may materially alter the appearance or quality.
d) Free from any damage due to frostOnions affected by frost rot rapidly after handling in a frozen condition and when the temperature rises
above 0◦C. Therefore they must not be allowed to travel.The onion is regarded as frost-bitten when more than two of the outer layers of the flesh are affected
and the flesh has a waxy appearance. A waxy appearance of the outer layers of the flesh can also becaused by mechanical handling. This slight defect does not affect the edibility of the onions. Thiswaxy appearance of the outer layers disappears in a few days after ventilation
e) Sufficiently dry for the intended useAt the beginning of the season, onions frequently are pulled before fully developed. Although they
cannot be stored, they must be covered by a dry skin, which may be sufficiently dry for no moistureto be pressed out by the fingers, in order that any subsequent heating may be avoided. Theonions must be pulled when ripe enough to meet current market standards, such that theyremain sufficiently firm and do not become soft or spongy.
For onions pulled when fully developed, the expression “sufficiently dry” means that in wet weather thebulbs may be slightly wet in view of the hygroscopic properties of their outer skin, but the leaves nearthe neck must be fairly dry.
f ) Free from abnormal external moistureAt the time of shipment onions must show no signs of excessive moisture due to unnatural causes
(such as prolonged exposure to rain) likely to impair their capacity for travel or keeping qualities.The condensation observed immediately after cold storage is not regarded as “abnormal.”
g) Free of foreign smell or tasteThis refers especially to produce that has been in poorly kept or unsuitable cold storage facilities and
which may have absorbed the odor given off by other produce on the premises.h) The stems must be twisted or clean-cut and must not be more that 4 cm long (except for stringed
onions)Onions are prepared either by hand or mechanically. Account will thus be taken of the overall
appearance of the batch, and the presence of more than 20% of stems over 4 cm long in any one lotwill be accepted as evidence that minimum requirements have not been met.
Source: [15].
should conduct sample counts on the number of bulbs that have fallen over in a field.When the percentage of bulbs that have fallen over reaches about 70% to 80% of total,then one should harvest the entire crop. Bulb yields up to 5 ton·ha−1 have been reported[20]. Harvested crop should be allowed to dry or cure and ripen in the sun for severaldays after lifting.
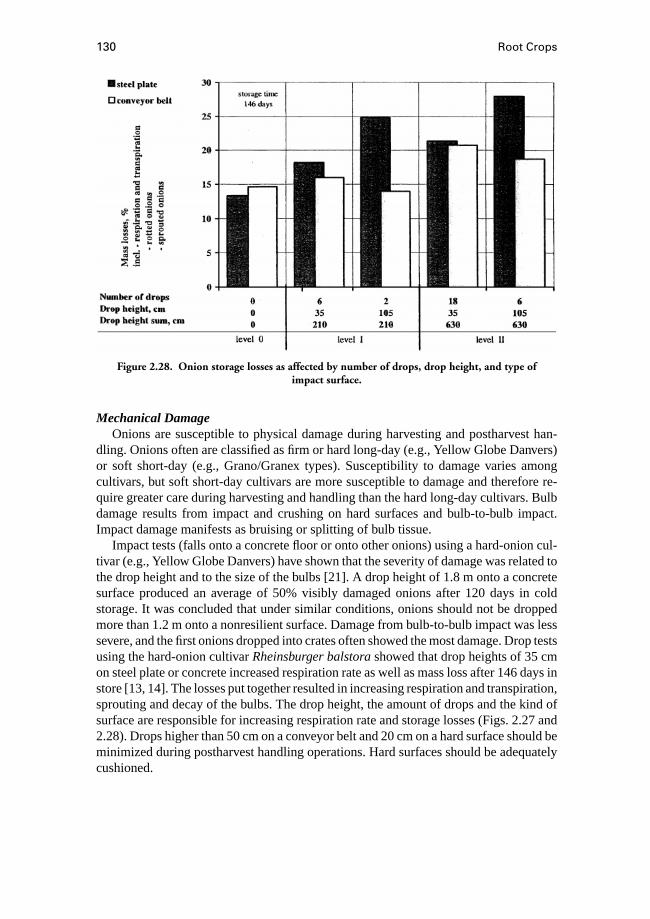
130 Root Crops
Figure 2.28. Onion storage losses as affected by number of drops, drop height, and type ofimpact surface.
Mechanical DamageOnions are susceptible to physical damage during harvesting and postharvest han-
dling. Onions often are classified as firm or hard long-day (e.g., Yellow Globe Danvers)or soft short-day (e.g., Grano/Granex types). Susceptibility to damage varies amongcultivars, but soft short-day cultivars are more susceptible to damage and therefore re-quire greater care during harvesting and handling than the hard long-day cultivars. Bulbdamage results from impact and crushing on hard surfaces and bulb-to-bulb impact.Impact damage manifests as bruising or splitting of bulb tissue.
Impact tests (falls onto a concrete floor or onto other onions) using a hard-onion cul-tivar (e.g., Yellow Globe Danvers) have shown that the severity of damage was related tothe drop height and to the size of the bulbs [21]. A drop height of 1.8 m onto a concretesurface produced an average of 50% visibly damaged onions after 120 days in coldstorage. It was concluded that under similar conditions, onions should not be droppedmore than 1.2 m onto a nonresilient surface. Damage from bulb-to-bulb impact was lesssevere, and the first onions dropped into crates often showed the most damage. Drop testsusing the hard-onion cultivarRheinsburger balstorashowed that drop heights of 35 cmon steel plate or concrete increased respiration rate as well as mass loss after 146 days instore [13, 14]. The losses put together resulted in increasing respiration and transpiration,sprouting and decay of the bulbs. The drop height, the amount of drops and the kind ofsurface are responsible for increasing respiration rate and storage losses (Figs. 2.27 and2.28). Drops higher than 50 cm on a conveyor belt and 20 cm on a hard surface should beminimized during postharvest handling operations. Hard surfaces should be adequatelycushioned.
Onion Storage 131
During the handling of soft onion cultivars in particular, drops greater than a fewcentimeters should be avoided, and machinery such as grading equipment should bepadded, especially on projecting corners. Some soft cultivars (e.g., Texas Early Grano)also are susceptible to crushing if stacked in sacks. For such cultivars, packaging of bulbsin cartons is recommended for transportation and marketing. To minimize bulb damageduring harvesting, the soft or short-day cultivars usually are pulled and bagged by handin the United States, and large-scale mechanized onion-harvesting machinery is suitableonly for hard onion cultivars.
As bulbs are susceptible to physical injury such as bruising due to compressiondamage, bulk storage heights should not exceed 3.5 to 4 cm [1, 22]. Bulb damage bybruising and shattering can be reduced by packaging in boxes, but this may requiresubstantial investment. In addition to the lowering of appearance quality, bruising andsplitting resulting from mechanical damage also affect bulb internal-quality attributes.Experimental studies showed that bruising changed the scale texture and made the outerfleshy scale soft, flattened, and pithyin appearance when cut through [21]. Wounding alsoresulted in sprouting and decay on the wounded areas, and damage of freshly harvestedbulbs caused the exudation of sap from the basal stem plate, resulting in microbialinfection of the affected areas. The physiological effects of wounding on onion bulb arewell documented [23].
HarvestingHand harvesting usually is carried out by levering the bulbs with a fork to loosen them
and pulling the tops by hand. This is the common practice in many developing countriesin which farming is manual labor–intensive. In developed countries, especially on large-scale farms, mechanical harvesting commonly is used. The harvesting techniques dependupon the weather at harvest time. In areas where warm, dry weather occurs reliably, thecuring and bagging of the crop can be done in the field (two-phase harvesting). In wetter,temperate regions, mechanical harvesting and artificial heating and ventilation for dryingare essential to produce reliably high-quality bulbs on a large scale.
Two-phase harvesting usually has the following steps: mowing the leaves (not cogent);stubbing, undercutting, and sieving the onions to remove stones and clods; rolling thesoil in the row to get a plane surface; drying the bulbs (windrowing) 8 to 10 daysin the field; turning the bulbs one to two times; harvesting, sieving, and hand grading,overloading into a trailer or in crates; and transporting. For one-phase harvesting, usuallycommercial potato harvesters have been adapted. After mowing the leaves the crop isharvested immediately, sieved, hand graded, and loaded onto the trailer.
Labor costs for two-phase harvesting are about 30% to 100% higher than for one-phase harvesting. The disadvantage of one-phase harvesting is the energy consumptionfor the drying process. Using combine harvesting [24], the standardized working hourshave been calculated to be 2.7 to 2.9 h·ha−1 for stubbing, 2.4 to 2.6 h·ha−1 for turningand 8.9 to 11 h·ha−1. The highest mechanical impacts on the bulbs occurred duringloading, when the onions dropped on the uncushioned bottom of the empty trailer [14].Reducing drop height, cushioning the bottom of the trailer, or using drop sails can reducethe incidence of bulb damage.
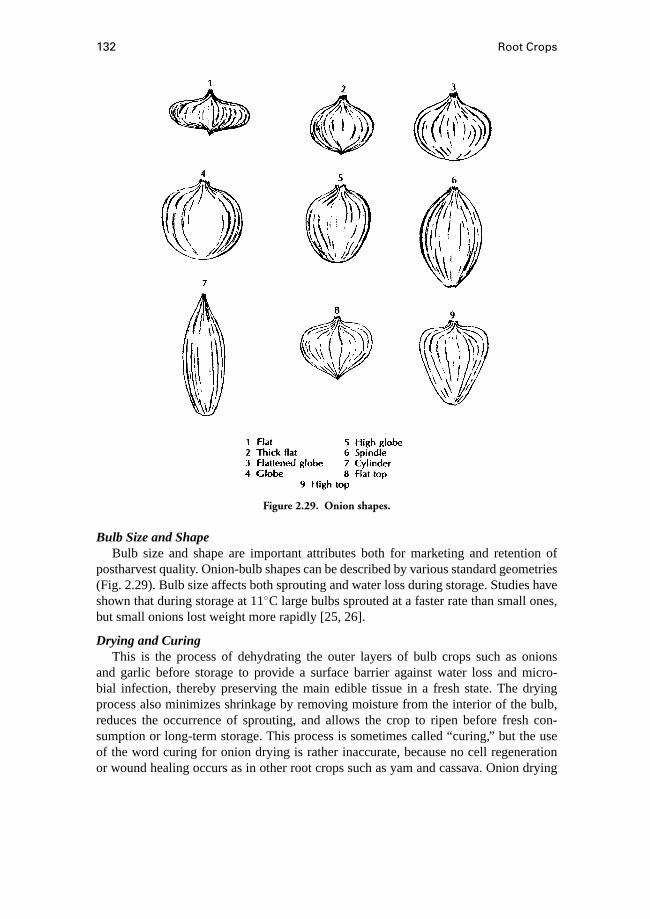
132 Root Crops
Figure 2.29. Onion shapes.
Bulb Size and ShapeBulb size and shape are important attributes both for marketing and retention of
postharvest quality. Onion-bulb shapes can be described by various standard geometries(Fig. 2.29). Bulb size affects both sprouting and water loss during storage. Studies haveshown that during storage at 11◦C large bulbs sprouted at a faster rate than small ones,but small onions lost weight more rapidly [25, 26].
Drying and CuringThis is the process of dehydrating the outer layers of bulb crops such as onions
and garlic before storage to provide a surface barrier against water loss and micro-bial infection, thereby preserving the main edible tissue in a fresh state. The dryingprocess also minimizes shrinkage by removing moisture from the interior of the bulb,reduces the occurrence of sprouting, and allows the crop to ripen before fresh con-sumption or long-term storage. This process is sometimes called “curing,” but the useof the word curing for onion drying is rather inaccurate, because no cell regenerationor wound healing occurs as in other root crops such as yam and cassava. Onion drying
Onion Storage 133
normally is achieved with weight losses of 3% to 5% [2, 22] and up to 10% with artificialdrying [27].
Traditionally, drying of onions has been carried out in the field and calledwindrowing.Windrowing involves harvesting the mature bulbs and laying them on their sides (inwindrows) on the surface of the soil to dry for 1 or 2 weeks. In hot tropical climates, thebulbs should be windrowed in such a way as to reduce the exposed surface, to minimizedamage due to direct exposure to the sun. In wet weather, the bulbs can take a longertime to dry and may develop higher levels of rots during storage. The side of the bulb incontact with wet soil or moisture also may develop brown strains or pixels that reduce theappearance quality and value [16]. Clearly, successful windrowing is weather-dependentand therefore not used extensively in many large-scale commercial enterprises. Bulbsharvested for storage require in total 14 to 20 days of ripening or drying before beingstored. Onions also may be harvested in trays that are then stacked at the side of the fieldto dry. In some tropical regions, the bulbs are tied together in groups by plaiting the tops,which are then hung over poles in sheds to dry naturally.
Alternatively, harvested bulbs are taken straight from the field and artificially driedin either a store, a shed, barns, or a special drier. This method is commonly used if cropsare stored in bulk, but it also can be applied to bags, boxed, or bins [28]. Bulbs are laidon racks and air is rapidly passed across the surface of the bulbs night and day [19,27]. Drying may take 7 to 10 days and is considered complete when the necks of thebulbs have dried out and are tight and the skins shriekwhen held in the hand. The controlof humidity level in the store is critical. If humidity is too high, drying is delayed andfungal infection can increase. On the other hand, if relative humidity is too low (below60%), excessive water loss and splitting of the bulb’s outer skins can occur [29], and thisincreases storage losses and reduces bulb value. The use in well-ventilated conditions ofwire mesh and air at about 30◦C, 60% to 75% relative humidity, and 150 m3·h−1·m−3 isrecommended.
Sorting and Grading Before StorageSorting of bulbs is important before storage to ensure that only good-quality bulbs are
placed in store. Any damaged, diseased, or rotten bulbs must be removed. The presence ofthese defects reduces storage life of affected bulbs and leads to the infection of otherwisesound produce within the store.
In developed countries separation and sorting before storage takes place during har-vesting with the combine. After mechanical separation of small onions, earth, stones,and clods, up to four graders manually select damaged and rotted onions. Onions thatare stored in loose bulk are separated from dirt and leaves again on their way to the shedusing special facilities. It should be taken into consideration that every handling processinduces mechanical load on the bulbs. In developing countries bulbs often are sortedbefore and after drying if they are dried in a separate structure to the store.
Grading After StorageGrading enables the handler to package the bulbs according to quality standards and
market requirements. A usual process line follows certain steps (Fig. 2.30). The steps aremostly mechanized. Transports in crates is done using fork-lifts using open transport with
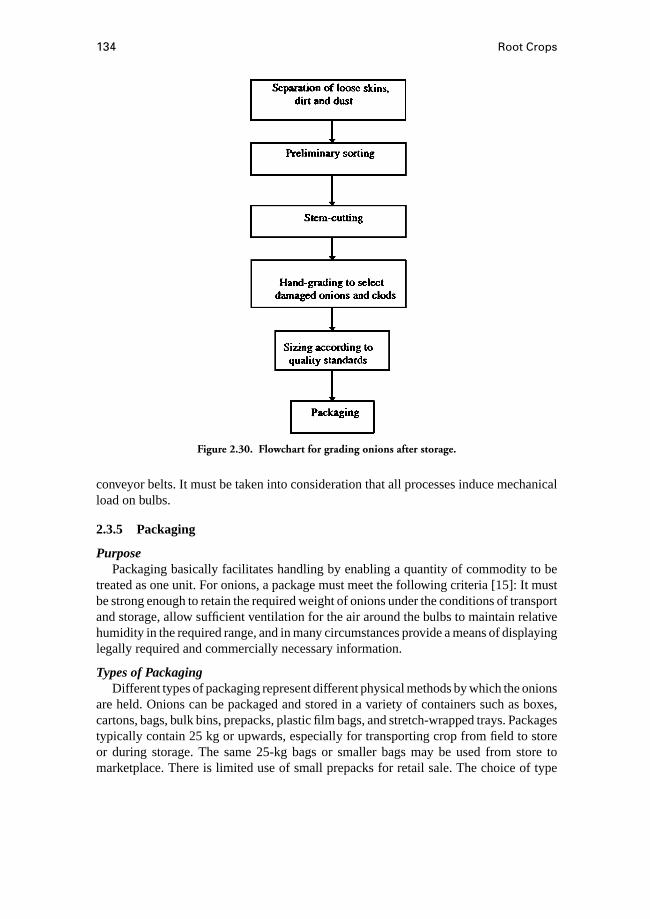
134 Root Crops
Figure 2.30. Flowchart for grading onions after storage.
conveyor belts. It must be taken into consideration that all processes induce mechanicalload on bulbs.
2.3.5 Packaging
PurposePackaging basically facilitates handling by enabling a quantity of commodity to be
treated as one unit. For onions, a package must meet the following criteria [15]: It mustbe strong enough to retain the required weight of onions under the conditions of transportand storage, allow sufficient ventilation for the air around the bulbs to maintain relativehumidity in the required range, and in many circumstances provide a means of displayinglegally required and commercially necessary information.
Types of PackagingDifferent types of packaging represent different physical methods by which the onions
are held. Onions can be packaged and stored in a variety of containers such as boxes,cartons, bags, bulk bins, prepacks, plastic film bags, and stretch-wrapped trays. Packagestypically contain 25 kg or upwards, especially for transporting crop from field to storeor during storage. The same 25-kg bags or smaller bags may be used from store tomarketplace. There is limited use of small prepacks for retail sale. The choice of type

Onion Storage 135
of packaging depends on size of crop, length of storage, and marketing requirements. Aproblem with packaging onions in boxes, net bags, and bulk bins is that if the packagesare too large, airflow pattern tends to be around rather than through them. Under thiscondition, the respiration heat of the bulbs results in a warm, humid environment inthe center of the package, giving rise to decay or sprouting. In large stores, the capitalinvestment in packaging may be quite substantial.
BagsBags (sacks and nets) used for onion packaging fall into three groups: general-purpose
jute sacks, as used for many agricultural commodities; open-weave sacks of sisal-likefiber; open-mesh nets, normally of plastic materials; and big bags, used alternatively tocrates, containing up to 1000 kg.
Jute sacks are readily available in most developing countries, but their disadvantages[15] include that they generally are too large, possibly containing 100 kg of onions, andhence difficult to handle and increasing risk of mechanical damage; bulbs are not visiblethrough the fabric, making it more difficult to monitor condition during storage; there issome resistance to airflow if they are used in an aerated store; they are difficult to labeleffectively; and recycled sacks may encourage spread of postharvest diseases.
Sisal sacks are made from sisal-like hard fibers and have an open weave, with thickthreads spaced between about 10 and 15 cm apart. The rough nature of the fiber provides asufficiently stable weave. These sacks are similar to jute sacks, but allow limited visibilityof the onions and create less impedance to airflow.
Open-mesh nets are the most widely used package for onions, and they are normallyred or orange in color. The slippery nature of plastics can result in the movement of thethreads, allowing large holes to open up. To overcome this problem, alternative nets areproduced industrially to give fully stable mesh and a stronger bag. The principal tech-niques include using extruded net from high-density polyvinyl chloride (PVC), knitted(warp-knitted) and asymmetric construction, and special weave in which weft threadsare doubled, and twisted.
These nets also are slowly degraded by sunlight, and should not be left outdoors forlong periods before use. In comparison with the other types of bags, they offer severaladvantages, including light weight, small bulk when empty, general availability in 12.5-and 25-kg sizes, fairly good visibility of bulbs, excellent ventilation, good hygiene, easyclosing (draw-string types only), and the fact that crop brand and marketing informationmay be printed around the middle of the bag for easy identification.
Trays, Boxes/Cartons, and BinsA range of rigid containers are used to package onions for transportation, marketing,
and storage. The principal rigid containers are trays (containing 10–15 kg of onions each),boxes (containing up to 25 kg), and bulk bins (containing up to 1000 kg). These typesof packaging enable segregation of onions into different cultivars or sources. Choice ofpackaging material is important, as wooden bins, for example, are liable to termite attackand weathering during off-season. Rigid containers also are expensive, need regularmaintenance, and require a forklift for handling larger containers. Where rigid containersare used for onion storage, building design is simpler than that for large-scale loose bulk
136 Root Crops
storage, as reinforcement of retaining walls is not required to support the bulbs. Handlingdamage of bulbs during filling and emptying can be frequent, but damage is reducedduring store loading and unloading operations in comparison with loose bulk handlingand storage.
Special attention is required during stacking of containers to ensure that the ventila-tion air is forced through the containers of bulbs and not around them. However, rigidcontainers facilitate regular inspection of produce, and if problems occur with the stack,the area affected often is limited to a few trays, boxes, or bins that may be more easilyisolated and removed than in a loose bulk handling system.
PrepacksThe weight of retail prepacks for onions typically is in the range of 0.5 to 1.5 kg,
and prepacks are associated with self-service retailing. Prepacking of onions sold in asupermarket allows price to be attached to produce; collates a number of pieces intoone unit of sale and may promote sale of a larger quantity than would be purchasedotherwise; provides a clean odorless unit for the customer to handle; and reduces timespent at the check-out [15]. The use of weight/price-labeling machines and bar codinghas reduced the need to pack to fixed nominal weights. During preparation for retail, thequantity of produce is measured by hand or machine and filled into the pack. Then theactual weight and price or bar code are calculated automatically and printed on a labelthat is attached to the package. This mechanized weighing and labeling system assists thepacker in accurate record keeping and avoids losses due to inaccurate pack weights. Thethree main types of onion prepacks are nets, plastic film bags, and stretch-wrapped trays:
Nets are in essence smaller versions of the nets used for bulk handling. Net prepacksare preferable to the other types of onion prepacks because they do not promote anincrease in relative humidity inside the package. Netting is available as a tube, which isthen loaded onto a metal tube on the packing machine. The prepack can be closed in twoalternative ways: The two ends can be closed using a metal clip, and a card label canbe attached simultaneously; or one end can be clipped and the other closed by stitching,through a card label.
Plastic film bags are cheaper than nets if made from low-density polyethylene orpolypropylene films, but the shelf life of onions is likely less than in a net. The bagsmust be perforated to assist air and gas exchange to counteract the increase in humidityinside the bag as the onions respire. The recommended size of holes is 6 mm in diameter,and the number of holes should not be less than eight in a 1-kg pack [15]. Methods forfilling the film bags range from manual to full automation, and a bunched closure usingadhesive tape is considered most appropriate.
Stretch-wrapped trays are used for prepacking a small number of pieces, usually fourto six. Depending on availability and price, the tray is available in a range of materialssuch as clear plastic, expanded plastic, or molded pulp. The film is made from a specialformulation of PVC or polyethylene and is usually very thin (12–15µm) with a very highvapor-transmission rate. The relative humidity inside the pack tends to rise, and packedonions must be inspected regularly for onset of deterioration. The plastic film must beheat-sealed and a range of equipment is available from manual to full automation. The
Onion Storage 137
packing requires electricity, and this limits the use of stretch wrapping in rural tropicalareas.
Other SystemsMany other methods of holding onions for transportation or storage are practiced that
cannot readily be classified under any of the previously discussed types of packaging.Tying the bulbs together by means of their tops to produce a bunch of bulbs is
also a form of packaging. It is suitable for transporting small quantities of crop, andduring storage the bunches are hung from the roof or from special racks. This is partic-ularly suitable for rural small-crop handling and marketing but is not compatible withlarge-scale operations due to the high labor intensity and the need to hang the strings instorage.
Shelves can be made from either wooden slats or metal mesh on a wooden or metalframe and usually are fixed in position with the bulbs loaded and unloaded in the store.Ventilation (natural or forced) usually is achieved by passing air over the shelves. Toachieve adequate aeration of the bulbs, the depth of bulbs on the shelves should be limitedto 10 cm.
Rather than in any container onions also are stored in loose bulk, with the bulbs heapeddirectly on the floor or elevated platform. Because they are not restrained, the bulbs rollduring store loading to completely fill the storage space. Bulk storage permits maximumutilization of store space, and uniform aeration is easier to achieve than in stacks of bagsor other rigid packaging. However, where bulk storage is to implemented the retainingwalls must be strengthened when storing larger quantities of bulbs, and arrangementsneed to be made for rebagging before subsequent marketing. It also is difficult to inspectbulbs regularly under these storage conditions. Loose bulk is most suitable for large-scaleoperations in which forced ventilation is provided during long-term storage; however,because of their softness, the sweet cultivars such as Vidalia Sweets should not be storedin loose bulk.
2.3.6 Bulb-Storage Requirements
Preparation for StorageThe aim of storage is to extend the period of availability of crop, maintain optimum
bulb quality and, minimize losses from physical, physiological, and pathological agents.During preparation for marketing and storage, selected bulbs should be firm and theneck dry and thin; thick-necked bulbs should be discarded [18, 19]. Skin color shouldbe typical of the cultivar. Microbial infections such asAspergillus nigeroccur duringproduction of onions, but these only develop on the bulbs during storage if the storageenvironment is conducive for their growth. Prior to storage, the crop must be cleanedand graded, and all damaged or diseased bulbs removed. Careful harvest and prestoragetreatments with minimal mechanical loads are important to achieve a long storage period.Storeroom temperature, relative humidity, and atmospheric composition influence thelength of storage that can be achieved without significant storage losses and reductionof bulb quality.
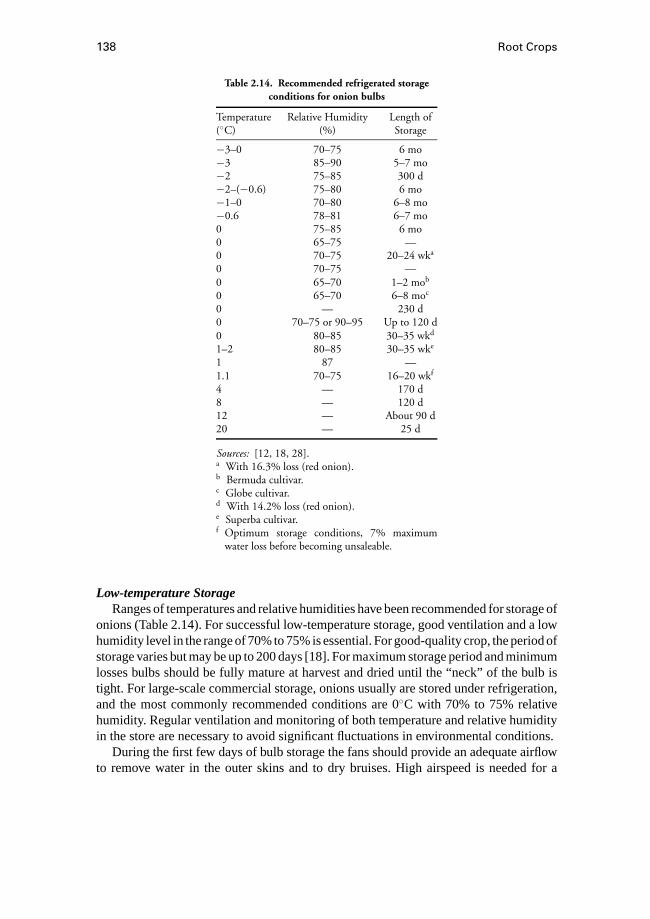
138 Root Crops
Table 2.14. Recommended refrigerated storageconditions for onion bulbs
Temperature Relative Humidity Length of(◦C) (%) Storage
−3–0 70–75 6 mo−3 85–90 5–7 mo−2 75–85 300 d−2–(−0.6) 75–80 6 mo−1–0 70–80 6–8 mo−0.6 78–81 6–7 mo0 75–85 6 mo0 65–75 —0 70–75 20–24 wka
0 70–75 —0 65–70 1–2 mob
0 65–70 6–8 moc
0 — 230 d0 70–75 or 90–95 Up to 120 d0 80–85 30–35 wkd
1–2 80–85 30–35 wke
1 87 —1.1 70–75 16–20 wkf
4 — 170 d8 — 120 d12 — About 90 d20 — 25 d
Sources: [12, 18, 28].a With 16.3% loss (red onion).b Bermuda cultivar.c Globe cultivar.d With 14.2% loss (red onion).e Superba cultivar.f Optimum storage conditions, 7% maximum
water loss before becoming unsaleable.
Low-temperature StorageRanges of temperatures and relative humidities have been recommended for storage of
onions (Table 2.14). For successful low-temperature storage, good ventilation and a lowhumidity level in the range of 70% to 75% is essential. For good-quality crop, the period ofstorage varies but may be up to 200 days [18]. For maximum storage period and minimumlosses bulbs should be fully mature at harvest and dried until the “neck” of the bulb istight. For large-scale commercial storage, onions usually are stored under refrigeration,and the most commonly recommended conditions are 0◦C with 70% to 75% relativehumidity. Regular ventilation and monitoring of both temperature and relative humidityin the store are necessary to avoid significant fluctuations in environmental conditions.
During the first few days of bulb storage the fans should provide an adequate airflowto remove water in the outer skins and to dry bruises. High airspeed is needed for a
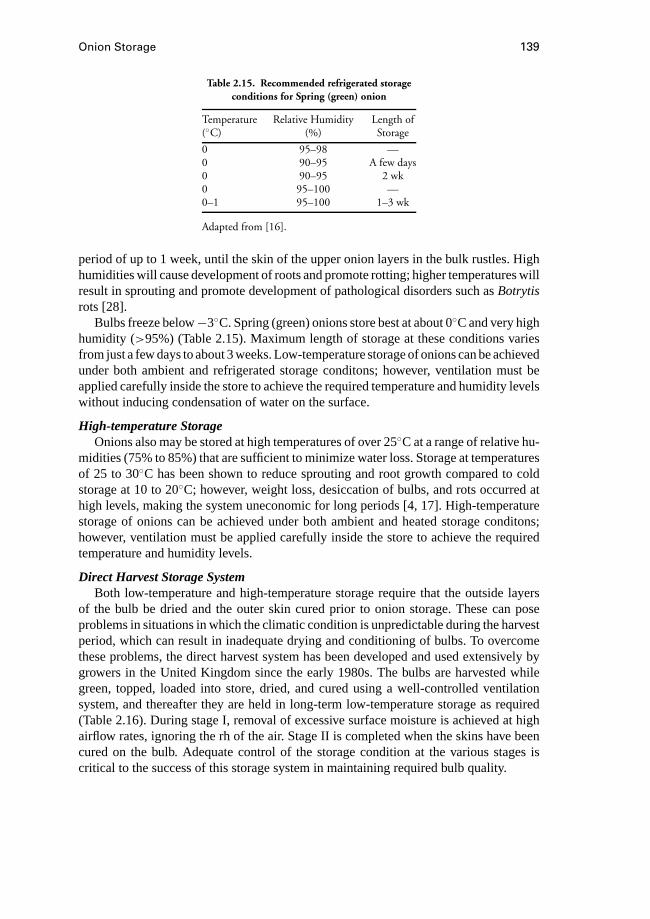
Onion Storage 139
Table 2.15. Recommended refrigerated storageconditions for Spring (green) onion
Temperature Relative Humidity Length of(◦C) (%) Storage
0 95–98 —0 90–95 A few days0 90–95 2 wk0 95–100 —0–1 95–100 1–3 wk
Adapted from [16].
period of up to 1 week, until the skin of the upper onion layers in the bulk rustles. Highhumidities will cause development of roots and promote rotting; higher temperatures willresult in sprouting and promote development of pathological disorders such asBotrytisrots [28].
Bulbs freeze below−3◦C. Spring (green) onions store best at about 0◦C and very highhumidity (>95%) (Table 2.15). Maximum length of storage at these conditions variesfrom just a few days to about 3 weeks. Low-temperature storage of onions can be achievedunder both ambient and refrigerated storage conditons; however, ventilation must beapplied carefully inside the store to achieve the required temperature and humidity levelswithout inducing condensation of water on the surface.
High-temperature StorageOnions also may be stored at high temperatures of over 25◦C at a range of relative hu-
midities (75% to 85%) that are sufficient to minimize water loss. Storage at temperaturesof 25 to 30◦C has been shown to reduce sprouting and root growth compared to coldstorage at 10 to 20◦C; however, weight loss, desiccation of bulbs, and rots occurred athigh levels, making the system uneconomic for long periods [4, 17]. High-temperaturestorage of onions can be achieved under both ambient and heated storage conditons;however, ventilation must be applied carefully inside the store to achieve the requiredtemperature and humidity levels.
Direct Harvest Storage SystemBoth low-temperature and high-temperature storage require that the outside layers
of the bulb be dried and the outer skin cured prior to onion storage. These can poseproblems in situations in which the climatic condition is unpredictable during the harvestperiod, which can result in inadequate drying and conditioning of bulbs. To overcomethese problems, the direct harvest system has been developed and used extensively bygrowers in the United Kingdom since the early 1980s. The bulbs are harvested whilegreen, topped, loaded into store, dried, and cured using a well-controlled ventilationsystem, and thereafter they are held in long-term low-temperature storage as required(Table 2.16). During stage I, removal of excessive surface moisture is achieved at highairflow rates, ignoring the rh of the air. Stage II is completed when the skins have beencured on the bulb. Adequate control of the storage condition at the various stages iscritical to the success of this storage system in maintaining required bulb quality.
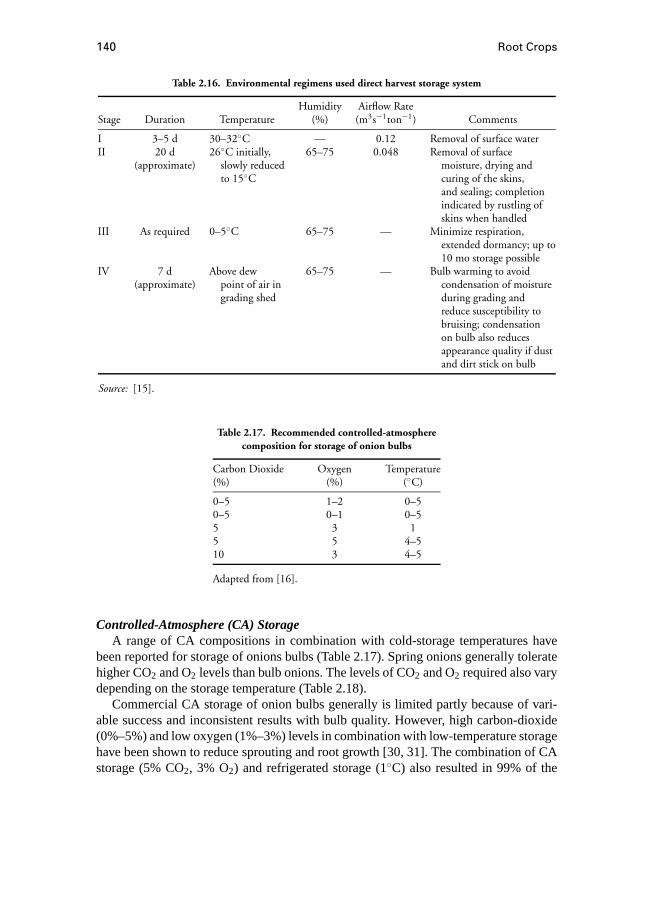
140 Root Crops
Table 2.16. Environmental regimens used direct harvest storage system
Humidity Airflow RateStage Duration Temperature (%) (m3s−1ton−1) Comments
I 3–5 d 30–32◦C — 0.12 Removal of surface waterII 20 d 26◦C initially, 65–75 0.048 Removal of surface
(approximate) slowly reduced moisture, drying andto 15◦C curing of the skins,
and sealing; completionindicated by rustling ofskins when handled
III As required 0–5◦C 65–75 — Minimize respiration,extended dormancy; up to10 mo storage possible
IV 7 d Above dew 65–75 — Bulb warming to avoid(approximate) point of air in condensation of moisture
grading shed during grading andreduce susceptibility tobruising; condensationon bulb also reducesappearance quality if dustand dirt stick on bulb
Source: [15].
Table 2.17. Recommended controlled-atmospherecomposition for storage of onion bulbs
Carbon Dioxide Oxygen Temperature(%) (%) (◦C)
0–5 1–2 0–50–5 0–1 0–55 3 15 5 4–510 3 4–5
Adapted from [16].
Controlled-Atmosphere (CA) StorageA range of CA compositions in combination with cold-storage temperatures have
been reported for storage of onions bulbs (Table 2.17). Spring onions generally toleratehigher CO2 and O2 levels than bulb onions. The levels of CO2 and O2 required also varydepending on the storage temperature (Table 2.18).
Commercial CA storage of onion bulbs generally is limited partly because of vari-able success and inconsistent results with bulb quality. However, high carbon-dioxide(0%–5%) and low oxygen (1%–3%) levels in combination with low-temperature storagehave been shown to reduce sprouting and root growth [30, 31]. The combination of CAstorage (5% CO2, 3% O2) and refrigerated storage (1◦C) also resulted in 99% of the

Onion Storage 141
Table 2.18. Recommended controlled-atmosphere composition forstorage of Spring (green) onions
CarbonDioxide Oxygen Temperature(%) (%) (◦C) Comments
5 1 0 Stored for 6–8 wk0–5 2–3 0–5 Had only a slight effect10–20 2–4 — —10–20 1–2 0–5 Had only a fair effect but was
of limited commercial use
Adapted from [16].
onion bulbs being considered marketable after 7 months storage; however, 9% weightloss occurred [32].
Response of onions to CA storage is cultivar-dependent, and it is recommendedthat trials be conducted under local conditions to determine the appropriate level ofgas composition for storing local cultivars. In general, the pungency of pungent onionsincreases after CA storage. For the Vidalia Sweets, which are known for their sweet-ness and low pungency, the recommended storage conditions [33] are 1◦C, 70%to 80% relative humidity, 3% O2, 5% CO2, 92% N2, and a ventilation rate of5 m3·h−1·m−3.
Currently, the application of CA technology for onion storage is limited almost en-tirely to the temperate climates in the developed countries. However, it has considerablepotential to reduce weight loss and extend storage life in tropical countries if technicallyappropriate and economically feasible options can be implemented. Bulb weight lossunder CA conditions is about 1.5% per month compared with ambient storage losses (ex-cluding rots and sprouting) of 2% to 3% in a tropical condition. Similarly, onion weightloss was limited to 15% over 7 months of cool CA storage, compared with the 40% typicalof onions held under heated forced-air ventilated storage in a tropical environment [15].
Generalized Effects of Storage RegimesThe purpose of onion storage is to extend bulb storage life and minimize the loss of
quality. It is therefore important that both temperature and relative humidity (Fig. 2.31)in the store are maintained at levels that inhibit sprouting and development of storagepathogens as well as control excessive water loss from the bulbs, which results in shriveland weight loss.
2.3.7 Control of Storage Disorders and Diseases
During postharvest handling and storage, bulbs are susceptible to sprouting and a rangeof diseases due to infection by microorganisms. If these are not adequately controlled,considerable storage losses and reduction of quality attributes can occur. Bulbs maysprout and also develop rots at higher storage temperatures or when they are removedfrom store for marketing.
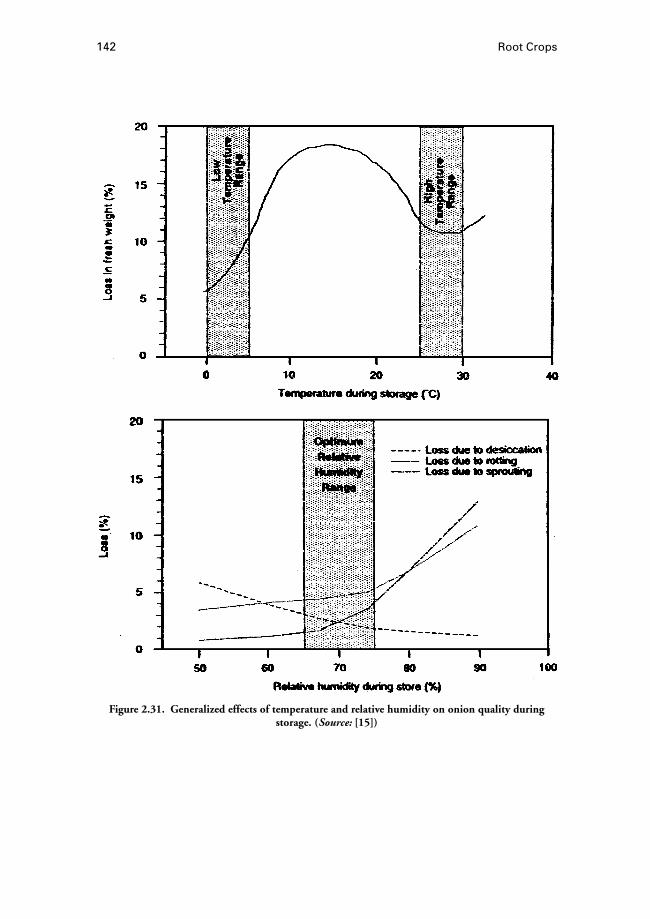
142 Root Crops
Figure 2.31. Generalized effects of temperature and relative humidity on onion quality duringstorage. (Source: [15])

Onion Storage 143
Control of SproutingVarious chemicals and gamma irradiation have been shown to prevent sprouting of
onions during storage [4]. Application of doses of 20 to 30 Gy irradiation as soon aspossible after harvest prevents sprouting. The effectiveness is highly reduced if irradiationis delayed [34]. A chemical sprout-suppressant called maleic hydrazide (MH) is the mostcommonly used. Application of MH at 2500 parts per million on the growing crop a fewweeks before harvest prevents sprouting during storage of onions [4, 18] and thus extendstheir length of storage. It is important to apply the chemical treatment during the periodof crop growth so that the chemical can be translocated to the apex of the growing pointtowards the center of the bulb. Foliar application rates of 8.5 L·ha−1 at 10% fallover [19]and 5.4 L of 36% active ingredient preparation in about 600 L of water per hectare when30% to 50% of the tops have fallen over have been recommended [28].
Spray timing is critical but not less than 10 days before harvesting. Also, MH shouldnot be applied to very immature bulbs, because too much is absorbed into the growingpoint, which then dies; this often is followed by a brown bacterial rot. Bulbs also remainvery soft. In any local situation, consult the manufacturer’s recommendation to determinethe appropriate time and application rate. It is important to note that the use of manyagrochemicals including MH is governed by legislation in several countries, and thislegislation must be consulted before chemical usage.
Control of Postharvest DiseasesThe most important postharvest diseases of onions are neck rot or grey mold (Botrytis
allii Munn), basal bulb rot (Fusarium oxysporumSchlecht ex Fr), and black mould(Aspergillus nigerVan Tiegh). Neck rot is a storage disease and is widespread whereonions are grown. It may develop at any point of the bulb, but it is most common onthe damaged neck tissues. Affected areas develop a brown soft rot followed by a densecover of grey–green powdery spores. Infection is seed-borne, and it has been suggestedthat there is no bulb-to-bulb transmission during storage [35]. Control of the disease hasbeen accomplished by dusting seeds with benomyl at a rate of 1 g active material perkilogram of seed before planting.
Basal bulb rot is a soil-borne disease that can affect onions at any stage of developmentand causes death of seedlings, especially in warm climates. If the roots and basal plateof the growing bulbs get infected at a late stage of development, external symptoms maynot appear until storage at ambient temperatures, during which affected bulbs quicklydevelop a semiwatery rot and eventually become desiccated empty shells. The fungus isthought to survive from season to season in the field on weed hosts. The developmentof the disease in storage can be inhibited by holding the bulbs under refrigeration at 0 to1◦C, and experimental trials have shown that dipping the seeds in suspension of benomyl(1000 ppm) for 15 minutes gives some degree of control.
During storage, black mold is characterized by the appearance of black powderyspore masses on the outer scales of the bulbs, especially along the vascular strands ofveins. The effect is not generally devastating, although localized spots can be severe.In general, white onions are less susceptible than colored varieties, and the disease iscontrolled during cold storage at 0 to 1◦C [28].

144 Root Crops
2.3.8 Types of Storage Structures
Traditional Simple SheltersSeveral simple onion-storage structures have been developed and modified over the
years such as mud, dung, and straw cottages commonly found in tropical developingcountries. The principal function of these simple shelters is to protect harvested cropfrom the elements. These structures have a slatted wooden stage inside on which thebulbs are piled up to about 1 m deep, and ventilation is achieved by the natural prevailingwind passing through the structure. Square straw cottages are built on upright polesdriven into the ground. Nails are then driven into the poles, and bunches of onions,plaited together by their tops, are suspended from these nails.
Windbreaks also provide a traditional method of storing onions in both developing anddeveloped countries, and up to 6 months of storage have been claimed by some farmers[16]. They are made in the field from a wooden base that allows a space below the onionstack and about 30 cm from the ground. Two parallel rows of stakes about 1 m apart aredriven into the ground around the wooden base, and wire mesh is stretched between thestakes and across the two ends of the windbreak. The stakes should be slightly slopingoutwards and about 2 m high. Onions are then placed within the cage, topped with 15 to20 cm of loose straw, and covered with polyethylene sheets (about 500-gauge), whichare tied down and weighted with bricks. To maximize ventilation and drying of bulbs,windbreaks should be built with the longest axis at right angles to the prevailing wind.
In addition to existing traditional stores such as those built from straw (Fig. 2.32) avariety of improved small-scale ambient structures for onion storage have been developedin many tropical countries (Figs. 2.33–2.35).
Figure 2.32. Onion store built from straw. (Source: [28])
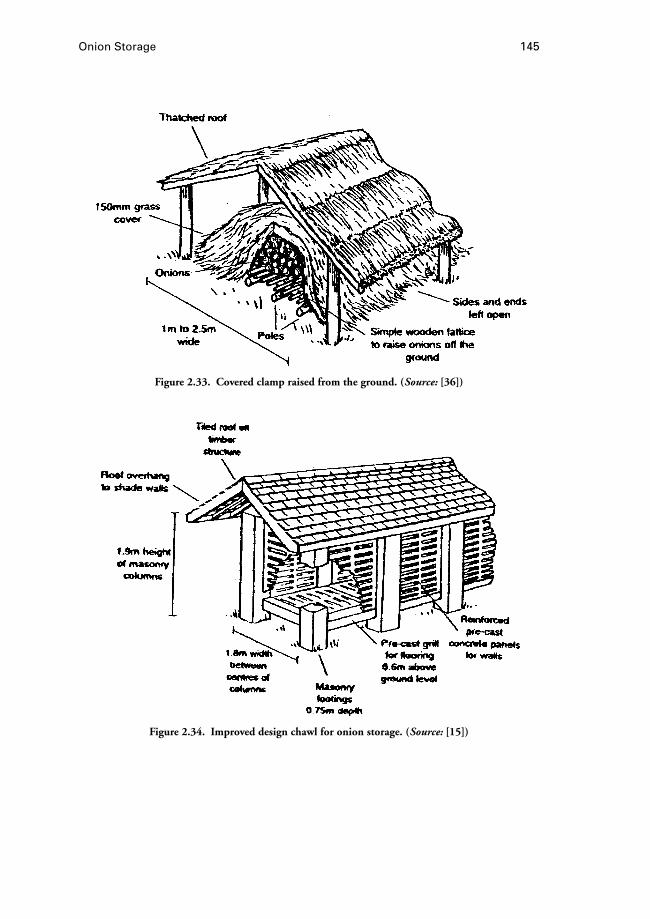
Onion Storage 145
Figure 2.33. Covered clamp raised from the ground. (Source: [36])
Figure 2.34. Improved design chawl for onion storage. (Source: [15])

146 Root Crops
Figure 2.35. Improved naturally ventilated onion store. (Source: [36])
Ventilated Stores
Forced-ventilated StoresForced-ventilated stores use heated air for the drying and storage of onions. Heated air
from a fan-burner is channeled to the onion bin or storage chamber, which may be con-structed of metal weld-mesh (Figs. 2.36–2.38). In these stores, uniform air distributionis achieved by an arrangement of plenum chambers and laterals.
Night-ventilated StoresThese stores use the variation between night and day temperature to keep stores cool,
especially in hot tropical climates. The following features are important in the designof a night-ventilated store [16]: It should be well insulated and the crop placed inside;a differential thermostat should be installed to constantly compare the outside airtemperature with the inside store temperature; and a fan should be installed into the storethat is switched on when the outside temperature is lower than the temperature withinthe store and switched off at night when the temperatures have equalized. Performanceevaluation of a night-ventilated onion store (Fig. 2.39) based on the above principles

Onion Storage 147
Figure 2.36. Forced-ventilated onion store. (Source: [37])
Figure 2.37. Low-cost, weld-mesh onion store. (Source: [38])
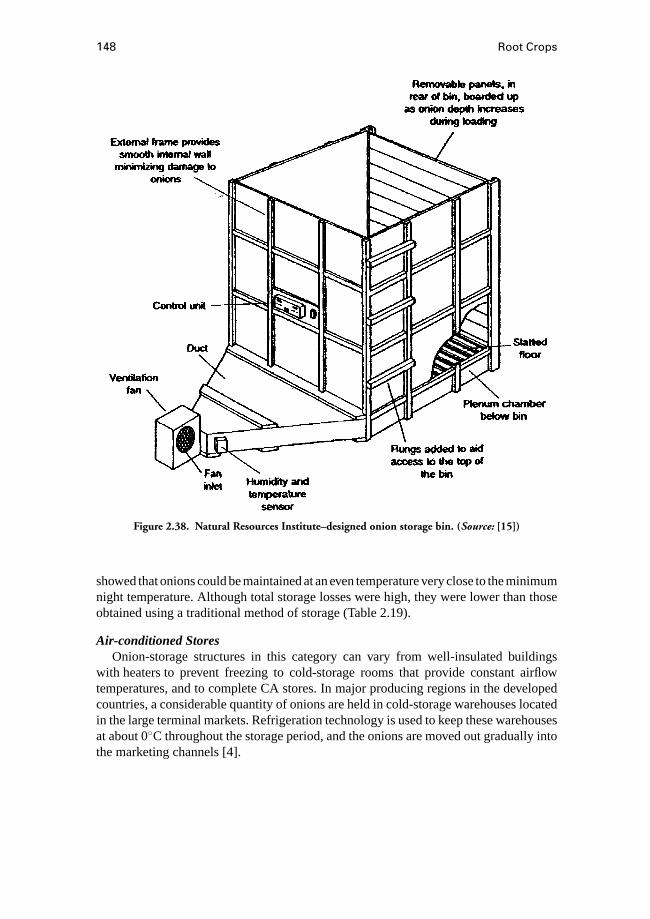
148 Root Crops
Figure 2.38. Natural Resources Institute–designed onion storage bin. (Source: [15])
showed that onions could be maintained at an even temperature very close to the minimumnight temperature. Although total storage losses were high, they were lower than thoseobtained using a traditional method of storage (Table 2.19).
Air-conditioned StoresOnion-storage structures in this category can vary from well-insulated buildings
with heaters to prevent freezing to cold-storage rooms that provide constant airflowtemperatures, and to complete CA stores. In major producing regions in the developedcountries, a considerable quantity of onions are held in cold-storage warehouses locatedin the large terminal markets. Refrigeration technology is used to keep these warehousesat about 0◦C throughout the storage period, and the onions are moved out gradually intothe marketing channels [4].
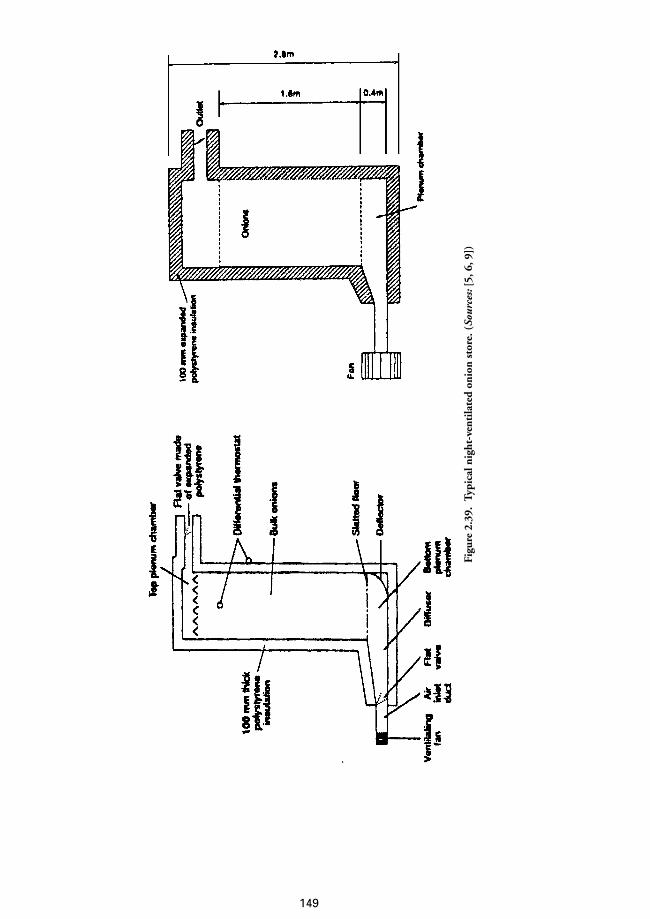
Figu
re2.
39.
Typi
caln
ight
-ven
tila
ted
onio
nst
ore.
(Sou
rces
:[5,
6,9]
)
149
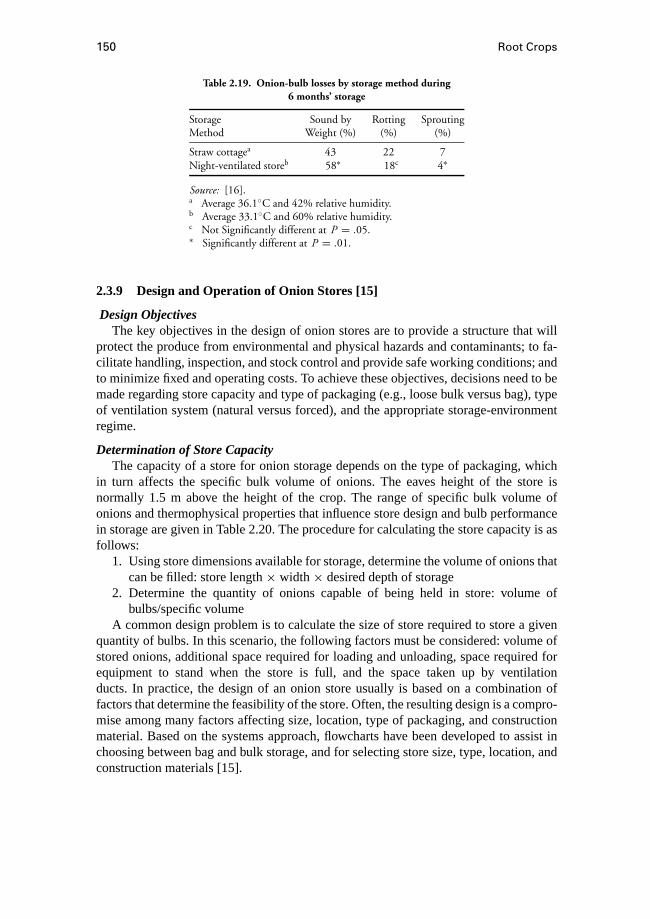
150 Root Crops
Table 2.19. Onion-bulb losses by storage method during6 months’ storage
Storage Sound by Rotting SproutingMethod Weight (%) (%) (%)
Straw cottagea 43 22 7Night-ventilated storeb 58∗ 18c 4∗
Source: [16].a Average 36.1◦C and 42% relative humidity.b Average 33.1◦C and 60% relative humidity.c Not Significantly different at P = .05.∗ Significantly different at P = .01.
2.3.9 Design and Operation of Onion Stores [15]
Design ObjectivesThe key objectives in the design of onion stores are to provide a structure that will
protect the produce from environmental and physical hazards and contaminants; to fa-cilitate handling, inspection, and stock control and provide safe working conditions; andto minimize fixed and operating costs. To achieve these objectives, decisions need to bemade regarding store capacity and type of packaging (e.g., loose bulk versus bag), typeof ventilation system (natural versus forced), and the appropriate storage-environmentregime.
Determination of Store CapacityThe capacity of a store for onion storage depends on the type of packaging, which
in turn affects the specific bulk volume of onions. The eaves height of the store isnormally 1.5 m above the height of the crop. The range of specific bulk volume ofonions and thermophysical properties that influence store design and bulb performancein storage are given in Table 2.20. The procedure for calculating the store capacity is asfollows:
1. Using store dimensions available for storage, determine the volume of onions thatcan be filled: store length× width× desired depth of storage
2. Determine the quantity of onions capable of being held in store: volume ofbulbs/specific volume
A common design problem is to calculate the size of store required to store a givenquantity of bulbs. In this scenario, the following factors must be considered: volume ofstored onions, additional space required for loading and unloading, space required forequipment to stand when the store is full, and the space taken up by ventilationducts. In practice, the design of an onion store usually is based on a combination offactors that determine the feasibility of the store. Often, the resulting design is a compro-mise among many factors affecting size, location, type of packaging, and constructionmaterial. Based on the systems approach, flowcharts have been developed to assist inchoosing between bag and bulk storage, and for selecting store size, type, location, andconstruction materials [15].
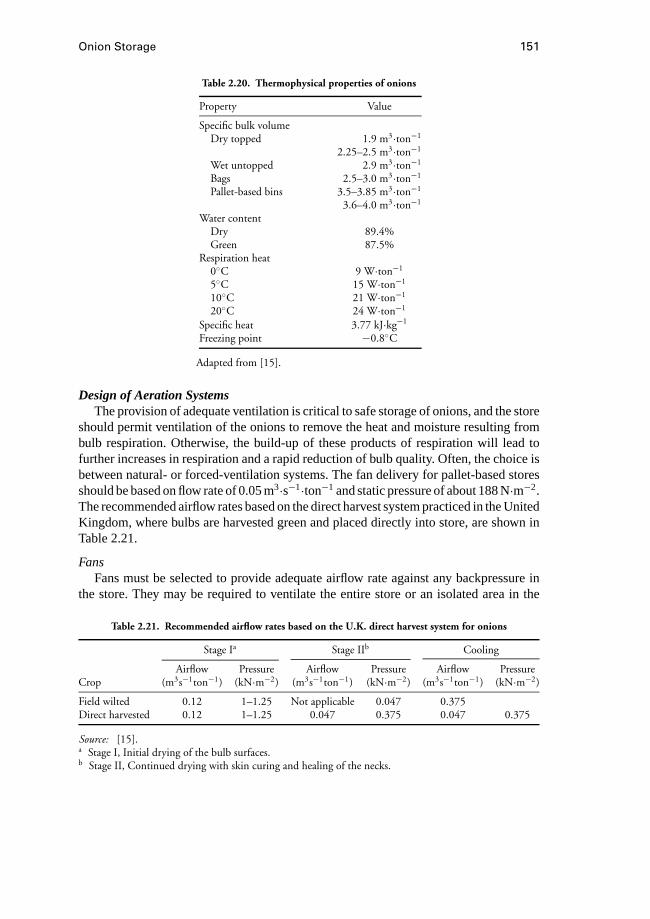
Onion Storage 151
Table 2.20. Thermophysical properties of onions
Property Value
Specific bulk volumeDry topped 1.9 m3·ton−1
2.25–2.5 m3·ton−1
Wet untopped 2.9 m3·ton−1
Bags 2.5–3.0 m3·ton−1
Pallet-based bins 3.5–3.85 m3·ton−1
3.6–4.0 m3·ton−1
Water contentDry 89.4%Green 87.5%
Respiration heat0◦C 9 W·ton−1
5◦C 15 W·ton−1
10◦C 21 W·ton−1
20◦C 24 W·ton−1
Specific heat 3.77 kJ·kg−1
Freezing point −0.8◦C
Adapted from [15].
Design of Aeration SystemsThe provision of adequate ventilation is critical to safe storage of onions, and the store
should permit ventilation of the onions to remove the heat and moisture resulting frombulb respiration. Otherwise, the build-up of these products of respiration will lead tofurther increases in respiration and a rapid reduction of bulb quality. Often, the choice isbetween natural- or forced-ventilation systems. The fan delivery for pallet-based storesshould be based on flow rate of 0.05 m3·s−1·ton−1 and static pressure of about 188 N·m−2.The recommended airflow rates based on the direct harvest system practiced in the UnitedKingdom, where bulbs are harvested green and placed directly into store, are shown inTable 2.21.
FansFans must be selected to provide adequate airflow rate against any backpressure in
the store. They may be required to ventilate the entire store or an isolated area in the
Table 2.21. Recommended airflow rates based on the U.K. direct harvest system for onions
Stage Ia Stage IIb Cooling
Airflow Pressure Airflow Pressure Airflow PressureCrop (m3s−1ton−1) (kN·m−2) (m3s−1ton−1) (kN·m−2) (m3s−1ton−1) (kN·m−2)
Field wilted 0.12 1–1.25 Not applicable 0.047 0.375Direct harvested 0.12 1–1.25 0.047 0.375 0.047 0.375
Source: [15].a Stage I, Initial drying of the bulb surfaces.b Stage II, Continued drying with skin curing and healing of the necks.

152 Root Crops
Table 2.22. Maximum permitted air velocitiesin ventilated systems
Location Air Velocity (m·s−1)
Main duct 10Lateral ducts 10Inlet to fan house 5Inlet to recirculation vents 5Exhaust ventilator 5Intake ventilator 7.5
Source: [15].
store. Fans should be capable of providing an airflow rate of 0.047 m3·s−1·ton−1 of totalstore capacity against a back pressure of 375 N·m−2 (see Table 2.21). If rapid dryingis required at the beginning of storage, this guideline also allows a higher airflow rateof 0.12 m3·s−1·ton−1 to be applied against a back pressure of up to 1250 N·m−2 to onethird of the store. In general, single axial-flow fans are used for most vegetable stores upto 200 ton, but in larger stores, a pair of matching axial fans are used, enabling the fanoutput to be matched to the area under ventilation.
Within the ventilation system, maximum air velocities exist at different locations(Table 2.22). The size of ducts and ventilators should be chosen to ensure that themaximum air velocities are not exceeded, and the cross-sectional area is calculated asthe ratio of the total airflow (m3·s−1) to the maximum permitted air velocity (m·s−1).
Main DuctsThese must be sized to meet the air delivery required but should not be less 1.3 m high
and 0.8 m wide to allow access for the operator. Access doors should have minimumdimensions of 0.6 m× 0.9 m. The main ducts or plenum chambers must be capable ofwithstanding the forces exerted by the air, and the loads imposed by the onions, if usedas a retaining wall. As a design guide, every 250 N·m−2 of air will exert 25.5 kg·m−2
force on the walls, with an additional 160 kg·m−2 lateral thrust for every meter depthof onions. Controlled roughening of the internal surfaces of the main duct will createsufficient turbulence to reduce the development of static pressure regain in the main duct.
Lateral DuctsAs with main ducts, these should be sized to ensure that air velocities do not exceed
10 m·s−1. Lateral ducts should be limited to 10 m in length, and typical cross-sectionalareas for most root vegetables are 0.17 m2 per meter length of lateral. Over 10 m length,lateral ducts should be tapered to increase the pressure further back along the lateral,thereby reducing the pressure gradient along the length. Table 2.23 gives a useful guidefor determining the amount of tapering to reduce static pressure regain.
Positioning of VentilatorsTo achieve maximum benefits, it is important that ventilators are well positioned
to remove relatively high-temperature air (Fig. 2.40). High-level ventilators are more
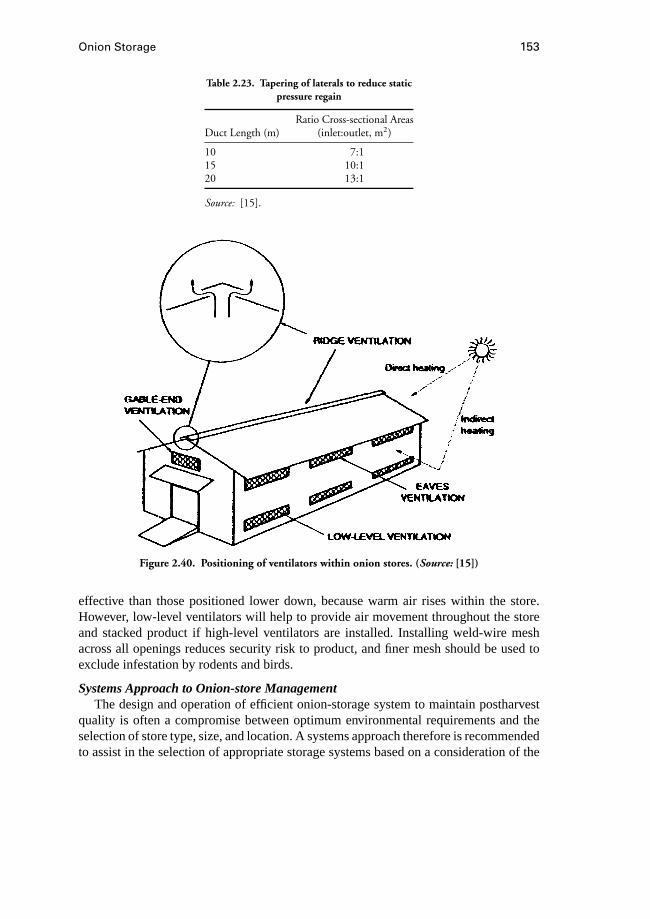
Onion Storage 153
Table 2.23. Tapering of laterals to reduce staticpressure regain
Ratio Cross-sectional AreasDuct Length (m) (inlet:outlet, m2)
10 7:115 10:120 13:1
Source: [15].
Figure 2.40. Positioning of ventilators within onion stores. (Source: [15])
effective than those positioned lower down, because warm air rises within the store.However, low-level ventilators will help to provide air movement throughout the storeand stacked product if high-level ventilators are installed. Installing weld-wire meshacross all openings reduces security risk to product, and finer mesh should be used toexclude infestation by rodents and birds.
Systems Approach to Onion-store ManagementThe design and operation of efficient onion-storage system to maintain postharvest
quality is often a compromise between optimum environmental requirements and theselection of store type, size, and location. A systems approach therefore is recommendedto assist in the selection of appropriate storage systems based on a consideration of the

154 Root Crops
Figure 2.41. Decision tree for selection of store size, type, location, and materials for bulb onions.(Source: [15])
interrelated factors of environmental conditions, site, materials, technical assistance, andskills (Fig. 2.41).
References
1. Brewster, J. L. 1994.Onions and Other Vegetable Alliums. Wallingford, UK: CABInternational.
2. Platt, B. S. 1962. Table of representative values of food commonly used in tropi-cal countries. Medical Research Council, Special Report Series No. 302. London:HMSO.
3. FAO. 1972.Food Composition Table for Use in East Asia. Rome: Author.4. Thompson, A. K., R. H. Booth, and F. J. Proctor. 1972. Onion storage in the tropics.
Tropical Science14(1):19–34.5. Report of the Steering Committee on Postharvest Food Losses in Developing Coun-
tries. 1978. Washington DC: National Research Council, National Science Founda-tion.
6. Amuttiratana, D., and W. Passornsiri. 1992.Postharvest Losses of Vegetables: AReport on Workshop Held Between 17 and 22 October at the Pakistan Agricultural
Onion Storage 155
Research Council, Islamabad, Pakistan, ed. M. H. Bhatti, Ch. Hafeez, A. Jaggar,and Ch. M. Farooq. FAO Regional Co-operation for Vegetable Research and Devel-opment RAS/89/41.
7. van Kampen, J. 1970. The improvement of available onion varieties.Zaadbelangen24:135–139.
8. Woodman, R. M., and H. R. Barnell. 1937. The connection between the keepingquality of commercial varieties of onions and the rates of water loss during storage.Ann. Appl. Biol. 24:219–235.
9. Foskett, R. L., and C. E. Petterson. 1950. Relation of dry matter content to storagequality of some onion varieties and hybrids.Proc. Amer. Soc. Hort. Sci. 55:314–318.
10. Hanoaka, T., and K. Ito. 1957. Studies on the keeping quality of onions: I. Relationbetween the characters of the bulbs and their sprouting during storage.J. Hort. Ass.Japan26:129–136.
11. Magruder, R., R. E. Webster, H. A. Jones, T. E. Randall, G. B. Snyder, H. D. Brown,and L. R. Hawthrone. 1941. Storage qualities of principal varieties of Americanonions. US Dept. Agric., Circ. 619.
12. Robinson, J. E., K. M. Brown, and W. G. Burton. 1975. Storage characteristics ofsome vegetables and soft fruits.Ann. Appl. Biol. 81:339.
13. Oberbarnscheidt, B., B. Herold, and M. Geyer. 1996. Speisezwiebeln: Mechanischbelastet bei Ernte und Aufbereitung.Gemuse32:492–496.
14. Oberbarnscheidt, B., M. Geyer, and B. Herold. 1996. Einfluß mechanischer Belas-tungen auf Atmung und Masseverluste bei Speisezwiebeln. Bornimer Agrartechnis-che Berichte H.8.
15. Brice, J., L. Currah, A. Malins, and R. Bancroft. 1997.Onion Storage in the Tropics:A Practical Guide to Methods of Storage and Their Selection. Chatham, UK: NaturalResources Institute.
16. Thompson, A. K. 1996.Postharvest Technology of Fruits and Vegetables. London:Blackwell Science.
17. Stow, J. P. 1975. Effects of humidity on losses of bulb onions (Allium cepa) storedat high temperature.Experimental Agriculture11:81–87.
18. Tindall, H. D. 1983.Vegetables in The Tropics. London: The McMillan Press.19. O’Connor, D. 1979.Onion Storage: Grower Guide No. 2. London: Grower Books.20. Rice, R. P., L. W. Rice, and H. D. Tindall. 1993.Fruit and Vegetable Production in
Warm Climates. London: The MacMillan Press.21. Isenberg, F. M. 1955. The effects of height of fall on onion bruising.Proc. Amer.
Soc. Hort. Sci. 66:331–333.22. Bottcher, H. 1996. Frischhaltung und Lagerung von Gem¨use. Stuttgart: Eugen
Ulmer.23. Currah, L., and F. J. Proctor. 1990. Onions in tropical regions. Natural Resources
Institute Bulletin No. 35. Natural Resources Institute, Chatham, UK.24. KTBL. 1993. Taschenbuch Gartenbau. Daten f¨ur die Betriebskalkulation. 4. Auflage,
Munster Hiltrup.

156 Root Crops
25. Karmarkar, D. V., and B. M. Joshi. 1941. Investigations on the storage of onions.Indian Journal of Agricultural Science11:82–94.
26. Kapur, N. S., P. B. Mathur, and K. K. Singh. 1953. Cold storage of onions.IndianJournal of Horticulture10:9–38.
27. de Visser, C. L. M. 1993: Teelt van Zaaiuien. Proefstation en Informatie—en Ken-niscentrum voor de Akkerbouw en de Groenteteelt in de Vollegrond, Lelystad,Teelthandleiting nr. 52.
28. Thompson, A. K. 1982. The storage and handling of onions. Report of the TropicalProducts Institute, G160. Chatham, UK.
29. Bleasdale, J. K. A., G. W. Tucker, and K. Hough. 1969. Bulb storage of onions, onionskins colour and keeping quality.In National Vegetable Research Station AnnualReport, pp. 78–79. UK.
30. SeaLand. 1991.Shipping Guide to Perishables. Iselin, NJ: SeaLand Service.31. Hardenburg, R. E., A. E. Watada, and C. Y. Wang. 1990. The commercial storage of
fruits, vegetables and florist and nursery stocks. USDA, ARS, Agriculture HandBook66.
32. Smittle, D. A. 1989. Controlled atmosphere storage of Vidalia onions.In Interna-tional Controlled Atmosphere Conference 5th Proceedings, Wenatchee, Washington,USA, vol. 2.
33. Smittle, D. A. 1988. Evaluation of storage methods for “Granex” onions.J. Amer.Soc. Hort. Sci. 113:877–880.
34. Chachin, K., and K. Ogata. 1971. Effects of delay between harvest and irradiationand storage temperatures on the sprout inhibition of onions by gamma radiation.J.Food Sci. Technol. (Japan)18:378.
35. Maude, R. B., and A. H. Presley. 1977. Neck rot (Botrytis allii) of bulb onions:1. Seed-borne infection and its relationship to the disease in the onion crop. 2. Seed-borne infection in relationship to the disease in store and the effect of seed treatment.Ann. Appl. Biol.86:163–180, 181–188.
36. Bengtsson, L. L., and J. H. Whitaker, eds. 1988. Farm structures in tropical cli-mates: A textbook for structural engineering and design. InFAO/SIDA Co-operativeProgramme: Rural Structures in East and South-East Africa. pp. 248–249. Rome:FAO.
37. Shukla, G. S., and R. K. Gupta. 1994. Development and evaluation of concentric-typestorage structures for onions. Alliums for the Tropics.Acta Horticulturae358:389–394.
38. Gray Grain. 1988.Onion Drier. UK: Author.39. Skultab, K., and A. K. Thompson. 1992. Design of a night ventilated onion store for
the tropics.Agricultural Mechanisation in Asia, Africa and Latin America23(1):51–55.
40. Hruschka, H. W. 1974. Storage and shelf life of packaged green onions. UnitedStates Department of Agriculture, Market Research Report 1974.
41. Scholz, E. W., H. B. Johnson, and W. R. Buford. 1963. Heat evaluation rates of someTexas-grown fruits and vegetables.Journal of the Rio Grande Valley HorticulturalSociety17:170–175.
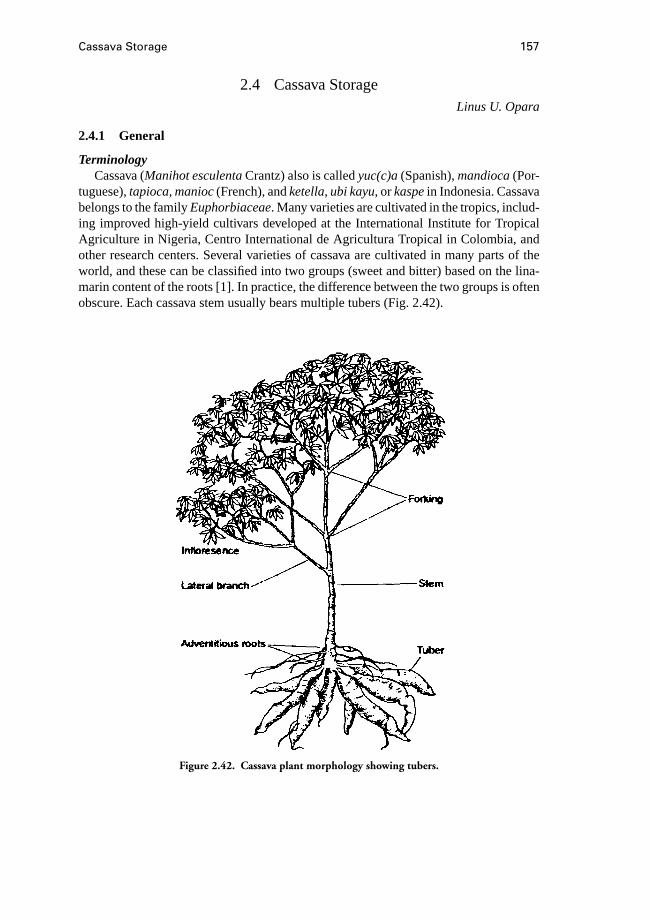
Cassava Storage 157
2.4 Cassava StorageLinus U. Opara
2.4.1 General
TerminologyCassava (Manihot esculentaCrantz) also is calledyuc(c)a(Spanish),mandioca(Por-
tuguese),tapioca, manioc(French), andketella, ubi kayu, orkaspein Indonesia. Cassavabelongs to the familyEuphorbiaceae. Many varieties are cultivated in the tropics, includ-ing improved high-yield cultivars developed at the International Institute for TropicalAgriculture in Nigeria, Centro International de Agricultura Tropical in Colombia, andother research centers. Several varieties of cassava are cultivated in many parts of theworld, and these can be classified into two groups (sweet and bitter) based on the lina-marin content of the roots [1]. In practice, the difference between the two groups is oftenobscure. Each cassava stem usually bears multiple tubers (Fig. 2.42).
Figure 2.42. Cassava plant morphology showing tubers.

158 Root Crops
Economic ImportanceCassava originated in Latin America and is now cultivated in almost all parts of the
world. Total world cultivated area is about 15.76 million ha, of which 9.30 million ha arein Africa and 3.79 million ha in Asia. In the early 1990s, world production of cassavawas approximately 140 million ton, and the top producers were Brazil, Thailand, Zaire,Nigeria, Indonesia, Tanzania, Uganda, India, Paraguay, and Mozambique. Current globalannual production is estimated to be over 152.22 million ton, of which about 46.28%is produced in Africa, 33.66% in Asia, and 19.28% in South America. Average annualworld yield has been estimated to be 9.66 ton·ha−1, and experimental yields of over60 ton·ha−1 have been recorded [2].
During the period from 1988 through 1990, developing countries produced 149 mil-lion ton of cassava, and between 1961 and 1988 production increased by 100%. Also,during the period from 1961 through 1988, the area in cassava production increased byabout 50%, and yields increased by 32% [3]. During the past four decades, the output ofcassava has grown much faster in Africa than in the other major producing regions, duemainly to increases in cultivated area (Table 2.24).
Cassava ranks as the most important root crop in terms of world production, aheadof the sweet potato. It is also the most important root crop in most tropical countriesand provides the major source of dietary calories for about 500 million people in manydeveloping countries in Africa, Latin America, and Asia. The roots are used as foodfor humans and livestock, and leaves of many cultivars are used as vegetable. Many
Table 2.24. Cassava production, area, and yield in developing countries
Total Sub-saharan Africaa Asiab Latin Americac
1988–1990Production (×1000 ton) 149,193 65,344 52,836 31,013Area (×1000 ha) 15,074 8,440 4,013 2,621Yield (ton·ha−1) 9.9 7.7 13.2 11.8
Changes in production1973–75 vs. 1961–63 41.2 35.2 61.4 33.41988–90 vs. 1973–75 41.3 49.6 74.7 −2.11988–90 vs. 1961–63 99.5 102.3 181.8 30.6
Changes in area1973–75 vs. 1961–63 28.4 25.3 27.0 39.11988–90 vs. 1973–75 17.8 18.4 36.5 −3.71988–90 vs. 1961–63 51.3 48.3 73.4 33.9
Changes in yield1973–75 vs. 1961–63 9.9 7.9 27.1 −4.11988–90 vs. 1973–75 19.9 26.4 27.9 1.71988–90 vs. 1961–63 31.8 36.4 62.6 −2.5
Source: [3].a Not including Algeria, Egypt, Libya, Morocco, Tunisia, and South Africa.b Not including Israel and Japan but including Oceania (except Australia and New Zealand).c Including Central, North (except Canada and the United States), and South America.
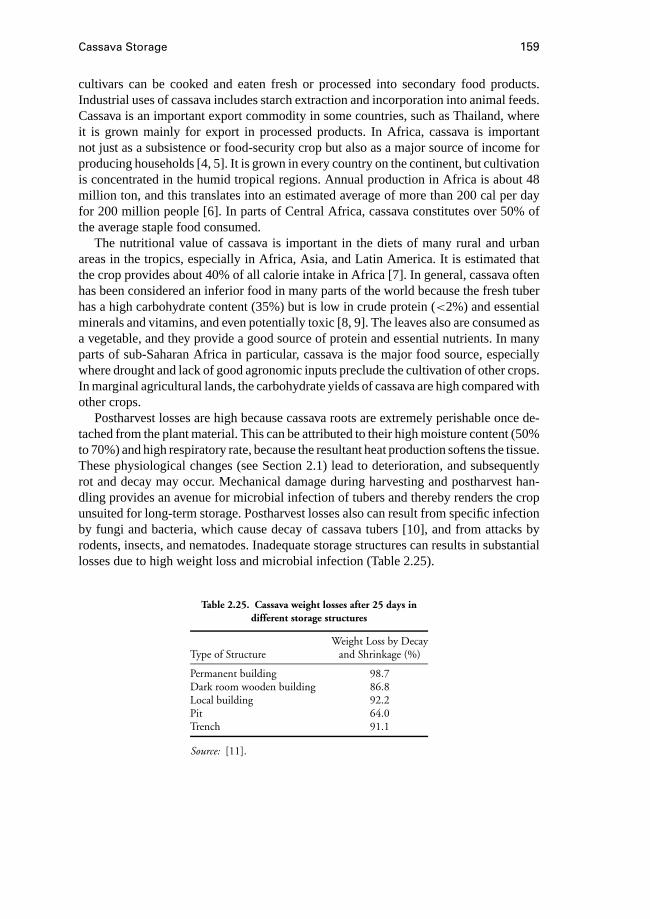
Cassava Storage 159
cultivars can be cooked and eaten fresh or processed into secondary food products.Industrial uses of cassava includes starch extraction and incorporation into animal feeds.Cassava is an important export commodity in some countries, such as Thailand, whereit is grown mainly for export in processed products. In Africa, cassava is importantnot just as a subsistence or food-security crop but also as a major source of income forproducing households [4, 5]. It is grown in every country on the continent, but cultivationis concentrated in the humid tropical regions. Annual production in Africa is about 48million ton, and this translates into an estimated average of more than 200 cal per dayfor 200 million people [6]. In parts of Central Africa, cassava constitutes over 50% ofthe average staple food consumed.
The nutritional value of cassava is important in the diets of many rural and urbanareas in the tropics, especially in Africa, Asia, and Latin America. It is estimated thatthe crop provides about 40% of all calorie intake in Africa [7]. In general, cassava oftenhas been considered an inferior food in many parts of the world because the fresh tuberhas a high carbohydrate content (35%) but is low in crude protein (<2%) and essentialminerals and vitamins, and even potentially toxic [8, 9]. The leaves also are consumed asa vegetable, and they provide a good source of protein and essential nutrients. In manyparts of sub-Saharan Africa in particular, cassava is the major food source, especiallywhere drought and lack of good agronomic inputs preclude the cultivation of other crops.In marginal agricultural lands, the carbohydrate yields of cassava are high compared withother crops.
Postharvest losses are high because cassava roots are extremely perishable once de-tached from the plant material. This can be attributed to their high moisture content (50%to 70%) and high respiratory rate, because the resultant heat production softens the tissue.These physiological changes (see Section 2.1) lead to deterioration, and subsequentlyrot and decay may occur. Mechanical damage during harvesting and postharvest han-dling provides an avenue for microbial infection of tubers and thereby renders the cropunsuited for long-term storage. Postharvest losses also can result from specific infectionby fungi and bacteria, which cause decay of cassava tubers [10], and from attacks byrodents, insects, and nematodes. Inadequate storage structures can results in substantiallosses due to high weight loss and microbial infection (Table 2.25).
Table 2.25. Cassava weight losses after 25 days indifferent storage structures
Weight Loss by DecayType of Structure and Shrinkage (%)
Permanent building 98.7Dark room wooden building 86.8Local building 92.2Pit 64.0Trench 91.1
Source: [11].
160 Root Crops
Cassava roots are particularly more perishable than other tuber crops because they donot exhibit endogenous dormancy (see Section 2.5), have no function in propagation, andpossess no bud primordia from which regrowth can occur [12, 13]. Food and AgriculturalOrganisation (FAO) surveys estimate that losses of cassava roots in Brazil, Indonesia,and the Dominican Republic were 10%, 10%, and 24.4%, respectively. Studies in theDominican Republic estimate that 17.4% of the cassava root marketed fresh was lostbefore it could be consumed, although it remained only 1 or 2 days at the wholesalelevel of the market chain [14]. In 1978, it was estimated that global postharvest lossesof cassava amounted to 10% of production [15]. Despite the predominant position ofcassava among all other root and tuber crops, the poor postharvest storage life is a majoreconomic constraint in its utilization.
2.4.2 Maturity, Harvesting, and Yield
Root MaturityThe maturity of cassava roots varies among the different cultivars. In general, the roots
mature in 9 to 24 months after planting. Some low-yielding, quick-ripening varieties canbe harvested a period of 6 months after planting. Mature cassava roots can be harvestedyear-round. During the growing season, both root and starch production increase rapidlyto their maximum value, and they decline afterwards. Where possible, harvesting shouldbe timed to correspond with the period of maximum value of the desired root attribute.Leaving the roots in the ground for too long could lead to lignification, which manifestsin a tough, woody tissue.
HarvestingHarvesting usually is carried out manually by digging around the roots, plucking the
roots individually, or lifting the entire bunch attached to the stem. In light soils, theentire root can be lifted by pulling the stem. In some places, the stalks are cut 40 to50 cm aboveground by hand or machine the day before harvest. Planting material for thenext season is selected and the rest is burned. Cassava roots are highly perishable, andharvesting must be carried out carefully to avoid damage to the roots.
In some parts of southeastern Nigeria where food supply is inadequate and cassavais the main crop, some rural farmers harvest their crop twice. In this situation, the firstharvest is often after the rainy season. A modified form of double harvesting also isadopted by some farmers to ensure that good-quality planting materials are left intactuntil the beginning of the next growing season. Many experimental designs of mechanicalharvesting devices have been developed [16], but these have limited application for mostof the rural subsistence farmers who cultivate a large proportion of the total production.In many cassava-growing areas, the leaves are harvested as a source of food and cash.Multiple harvesting up to twice per week has been reported [17], but this practice couldadversely affect root yields due to decreased photosynthetic activity.
Root YieldRoot yields are variable depending on a combination of genetic, environmental, ma-
turity, and crop-management factors. Improved varieties can yield 1.5 times more than

Cassava Storage 161
Table 2.26. Yield components of cassava in Nigeria
Fresh Root Plant Density Average Root Harvest(ton·ha−1) (stand·ha−1) Weight (kg) Roots per Plant Index
Improved VarietyMinimum 3.20 1250 0.09 3.15 0.30Mean 19.44 9595 0.45 6.17 0.59Maximum 36.00 20000 1.14 35.68 0.89SD 8.32 4702.92 0.23 5.49 0.14N 34 34 34 34 34
Local VarietyMinimum 1.25 1250 0.05 0.37 0.32Mean 13.41 10586 0.38 4.03 0.56Maximum 74.10 41250 1.69 12.19 0.89SD 10.02 5170.50 0.25 2.01 0.13N 105 105 105 105 105
Source: [5].
local varieties (Table 2.26). Between 10 and 24 months after planting, yields up to 11.0to 17.0 ton·ha−1 and 17.0 to 19.0 ton·ha−1 are possible with local and improved varieties,respectively [5]. The improved varieties also have better yields than the local varietiesin an intercropping pattern commonly practiced in many tropical developing countries.The yield of sole-cropped improved varieties (23 ton·ha−1) was 40% higher than cropsgrown under an intercropping pattern as major crops (16.6 ton·ha−1), and nearly 95%higher than when they were grown as minor crops (12.1 ton·ha−1). Yields among theworld’s major producing regions are shown in Table 2.24.
2.4.3 Handling, Curing, and Packaging
Cassava roots, especially the “sweet” types, are highly susceptible to physical in-jury such as bruising. Bruised tissue turns greyish. In addition to the downgrading ofroots, bruising accelerates physiological deterioration and also provides an avenue foropportunistic infection with decay-causing microbial agents. To reduce impact and com-pression damage, roots should be harvested with 2 to 3 cm of stem attached. Carefulhandling of roots also is required.
Curing refers to the process of wound healing with the development and suberizationof new epidermal tissue calledperiderm. Cassava roots are cured at high humidity levelsto improve potential storage life. The recommended conditions are 30 to 40◦C and 90%to 95% relative humidity for 2 to 5 days [18].
For long-distance transportation, roots should be packaged adequately for ease ofhandling and to reduce the incidence of damage. Full-telescopic fiberboard boxes, 23 kgwith excelsior or paper wrapping and padding, should be used where they are available[19]. Packaging in moist materials such as sawdust or in wooden boxes allows curingand storage of fresh cassava roots for 1 to 2 months [20]. Only roots in top qualitycondition should be packaged and stored. Desirable attributes include thick root, brown

162 Root Crops
skin, white flesh, and root length of 15.9 to 25.0 cm. Roots in top-quality condition havea longer storage and shelf life and therefore allow more time for transportation, storage,and marketing.
2.4.4 Storage Environment Requirements
Storage of Fresh RootFresh cassava roots are highly perishable and can suffer serious physiological dete-
rioration within 24 hours after harvest. The common practice in most producing areasis to consume them close to the place of production by selling or processing the har-vested roots immediately. Fresh cassava roots can be stored in the ground by delayingharvest of mature crop until needed. When mature roots are left in the ground, theolder roots tend to become fibrous and woody [20]. Roots also can be harvested andreburied in a cool place for short storage or held in modified environments in speciallybuilt storage structures. A moist storage environment is essential to control primarydeterioration [21, 22]. Delaying harvest provides long-term storage, because posthar-vest storage of fresh cassava often is a short-term strategy due to its highly perishablenature.
Storage at ambient conditions is the most widely practiced for cassava roots. However,these conditions promote rapid deterioration of roots, and several postharvest treatmentshave been recommended to prolong storage life and minimize the incidence of diseasesand disorders.
Cassava roots store fairly well under refrigeration. Cassava is the only root that tol-erates low temperatures and can be stored at 0 to 2◦C for up to 6 months [23]. Theroots will last for 1 to 2 weeks at 5.5 to 7◦C and 85% to 90% relative humidity instorage. Storage at 20◦C and above with high humidity results in large losses. Severalcombinations of storage temperature and relative humidity have been recommended(Table 2.27). The optimum storage requirement depends on variety, climatic conditions,
Table 2.27. Recommended storage conditionsfor cassava (Manihot esculenta)
Temperature Relative(◦C) Humidity (%) Storage Life
0 85 23 wk0–2 85–90 5–6 mo0–2 85–90 Several mo0–5 85–90 1–2 mo0–5 85–95 ≤6 mo1 90 5–6 mo5–8 80–90 2–4 wk
10 90–95 10–14 d13–14 — 9 d20 60 2–4 wk
Sources: [18, 24–30].
Cassava Storage 163
and incidence of mechanical damage during harvesting and handling operations. A ben-eficial effect of refrigerated storage is to slow down the physiological and pathologicalprocesses that lead to deterioration, and losses include visual and organoleptic qualityattributes. For most cultivars, the roots store well at 0 to 5◦C with 85% to 90% relativehumidity [31, 32]. Storage at 3◦C created losses of 6% to 7% per week, while storageat 1.7 to 3.3◦C and 80% to 90% relative humidity for 2 weeks resulted in an 11% loss.Stored roots also had internal browning and mold growth [33]. Precooling of roots byhydrocooling or forced air is recommended for refrigerated long-term storage. Cassavais not susceptible to chilling injury as are other tropical root crops if held at too low atemperature [34].
Storage of Processed Cassava ProductsAdequately dried products can be stored up to 3 to 6 months provided insect infestation
is controlled [31]. The storage life and keeping quality depend on the moisture content ofthe product. For dried chips, the moisture content normally should be less than 14%, andpolythene-lined jute bags can be used successfully to store the chips. For cassava flour, itis advisable to store dried chips and mill them when flour is required. The milled productthen can be stored in thick-gauge airtight plastic bags. Moisture and insect ingress intothe package must be prevented.
2.4.5 Postharvest Treatments
Treatment of freshly harvested roots with sodium hypochlorite, or dipping in fungi-cides such as benomyl or Thiabendazole, and packing them in plastic reduces thedevelopment of storage rots and decay [35]. Cassava roots also can be stored in goodcondition for 1 to 2 months at ambient room temperature following coating with paraffinwax [36]. This wax treatment is applied on roots destined for export market in someparts of the Latin America. Both hot-air and hot-water treatment of roots minimize theincidence of vascular streaking during storage [37]. Modified atmosphere packaging ofcassava roots with polyethylene bags at ambient conditions can be useful to maintaintheir freshness for several weeks [38, 39].
2.4.6 Storage Disorders and Diseases
Cassava is susceptible to several pre- and postharvest disorders, pests, and diseases.Well-illustrated texts devoted to the problems of field and postharvest diseases anddisorders of cassava are available [25, 40]. Fungal root rot is a major cause of both pre-and postharvest microbial deterioration, but bacterial soft rot also is quite common. Thereare three principal types of preharvest root rots: generalized pungent soft rot caused byPhytophthoraspp., generalized nonpungent rot caused byPythiumspp., and localizedrot caused by smallpox root disease. The most common problems in stored cassava rootsare rots and vascular streaking.
Vascular streaking, also described as “blue vein” [41], results from physiologicaldeterioration and is followed by secondary microbial rotting. Physiological deterioration
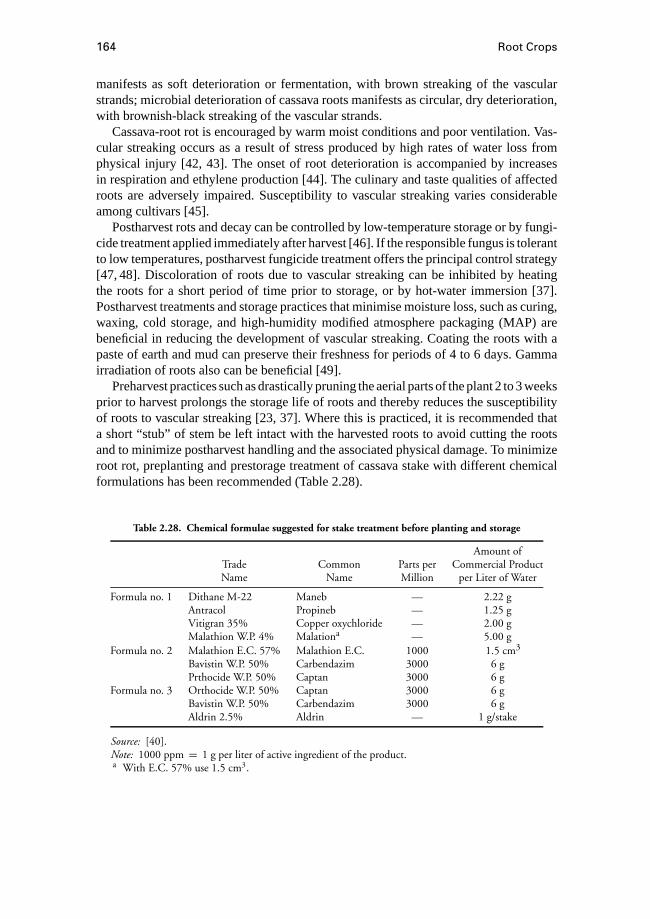
164 Root Crops
manifests as soft deterioration or fermentation, with brown streaking of the vascularstrands; microbial deterioration of cassava roots manifests as circular, dry deterioration,with brownish-black streaking of the vascular strands.
Cassava-root rot is encouraged by warm moist conditions and poor ventilation. Vas-cular streaking occurs as a result of stress produced by high rates of water loss fromphysical injury [42, 43]. The onset of root deterioration is accompanied by increasesin respiration and ethylene production [44]. The culinary and taste qualities of affectedroots are adversely impaired. Susceptibility to vascular streaking varies considerableamong cultivars [45].
Postharvest rots and decay can be controlled by low-temperature storage or by fungi-cide treatment applied immediately after harvest [46]. If the responsible fungus is tolerantto low temperatures, postharvest fungicide treatment offers the principal control strategy[47, 48]. Discoloration of roots due to vascular streaking can be inhibited by heatingthe roots for a short period of time prior to storage, or by hot-water immersion [37].Postharvest treatments and storage practices that minimise moisture loss, such as curing,waxing, cold storage, and high-humidity modified atmosphere packaging (MAP) arebeneficial in reducing the development of vascular streaking. Coating the roots with apaste of earth and mud can preserve their freshness for periods of 4 to 6 days. Gammairradiation of roots also can be beneficial [49].
Preharvest practices such as drastically pruning the aerial parts of the plant 2 to 3 weeksprior to harvest prolongs the storage life of roots and thereby reduces the susceptibilityof roots to vascular streaking [23, 37]. Where this is practiced, it is recommended thata short “stub” of stem be left intact with the harvested roots to avoid cutting the rootsand to minimize postharvest handling and the associated physical damage. To minimizeroot rot, preplanting and prestorage treatment of cassava stake with different chemicalformulations has been recommended (Table 2.28).
Table 2.28. Chemical formulae suggested for stake treatment before planting and storage
Amount ofTrade Common Parts per Commercial ProductName Name Million per Liter of Water
Formula no. 1 Dithane M-22 Maneb — 2.22 gAntracol Propineb — 1.25 gVitigran 35% Copper oxychloride — 2.00 gMalathion W.P. 4% Malationa — 5.00 g
Formula no. 2 Malathion E.C. 57% Malathion E.C. 1000 1.5 cm3
Bavistin W.P. 50% Carbendazim 3000 6 gPrthocide W.P. 50% Captan 3000 6 g
Formula no. 3 Orthocide W.P. 50% Captan 3000 6 gBavistin W.P. 50% Carbendazim 3000 6 gAldrin 2.5% Aldrin — 1 g/stake
Source: [40].Note: 1000 ppm = 1 g per liter of active ingredient of the product.a With E.C. 57% use 1.5 cm3.

Cassava Storage 165
Figure 2.43. Cassava stored in trench with completesoil cover.
Figure 2.44. Fully filled trench under thatch shed.
2.4.7 Types of Storage Structures
Traditional StructuresBurying harvested roots underground is a common storage method. Roots also are
piled in heaps and watered daily to keep fresh. Several types of storage structures havebeen used, ranging from pit and trench (Fig. 2.43) to bamboo-thatch room (Fig. 2.44)and permanent building. Weight loss and microbial losses are high in these structures(see Table 2.25), due to poor environmental control.
Improved Storage StructuresSeveral structures and methods have been utilized to improve the storage life and
minimize spoilage of cassava roots. Two low-cost structures that can be implementedsuccessfully by farmers and processors [50] are: trenches and boxes containing sawdust(Fig. 2.45). In either structure it is recommended that cassava roots should be harvestedundamaged with about 14 to 20 cm of stem attached. Roots in sawdust storage should
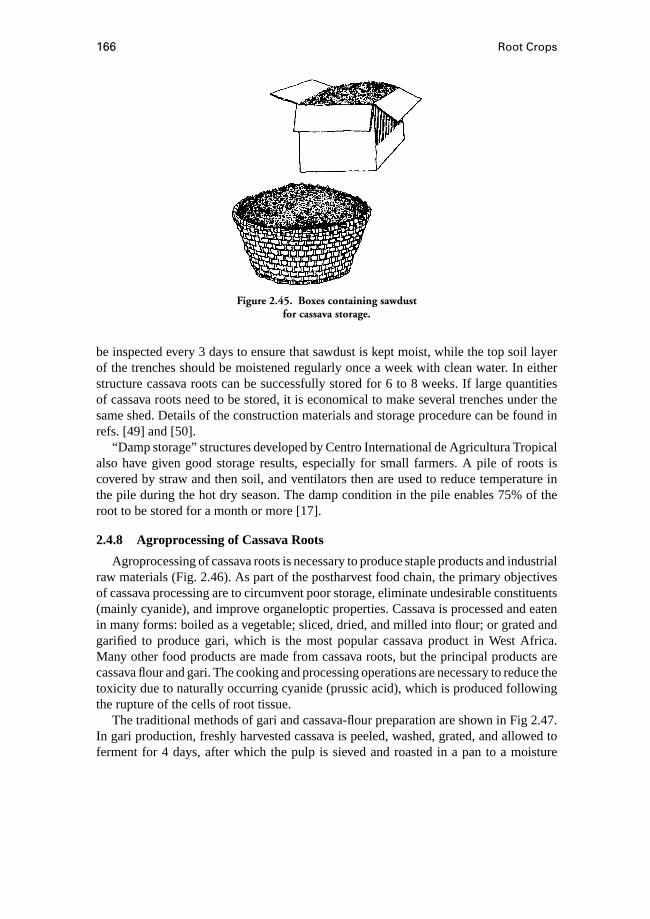
166 Root Crops
Figure 2.45. Boxes containing sawdustfor cassava storage.
be inspected every 3 days to ensure that sawdust is kept moist, while the top soil layerof the trenches should be moistened regularly once a week with clean water. In eitherstructure cassava roots can be successfully stored for 6 to 8 weeks. If large quantitiesof cassava roots need to be stored, it is economical to make several trenches under thesame shed. Details of the construction materials and storage procedure can be found inrefs. [49] and [50].
“Damp storage” structures developed by Centro International de Agricultura Tropicalalso have given good storage results, especially for small farmers. A pile of roots iscovered by straw and then soil, and ventilators then are used to reduce temperature inthe pile during the hot dry season. The damp condition in the pile enables 75% of theroot to be stored for a month or more [17].
2.4.8 Agroprocessing of Cassava Roots
Agroprocessing of cassava roots is necessary to produce staple products and industrialraw materials (Fig. 2.46). As part of the postharvest food chain, the primary objectivesof cassava processing are to circumvent poor storage, eliminate undesirable constituents(mainly cyanide), and improve organeloptic properties. Cassava is processed and eatenin many forms: boiled as a vegetable; sliced, dried, and milled into flour; or grated andgarified to produce gari, which is the most popular cassava product in West Africa.Many other food products are made from cassava roots, but the principal products arecassava flour and gari. The cooking and processing operations are necessary to reduce thetoxicity due to naturally occurring cyanide (prussic acid), which is produced followingthe rupture of the cells of root tissue.
The traditional methods of gari and cassava-flour preparation are shown in Fig 2.47.In gari production, freshly harvested cassava is peeled, washed, grated, and allowed toferment for 4 days, after which the pulp is sieved and roasted in a pan to a moisture
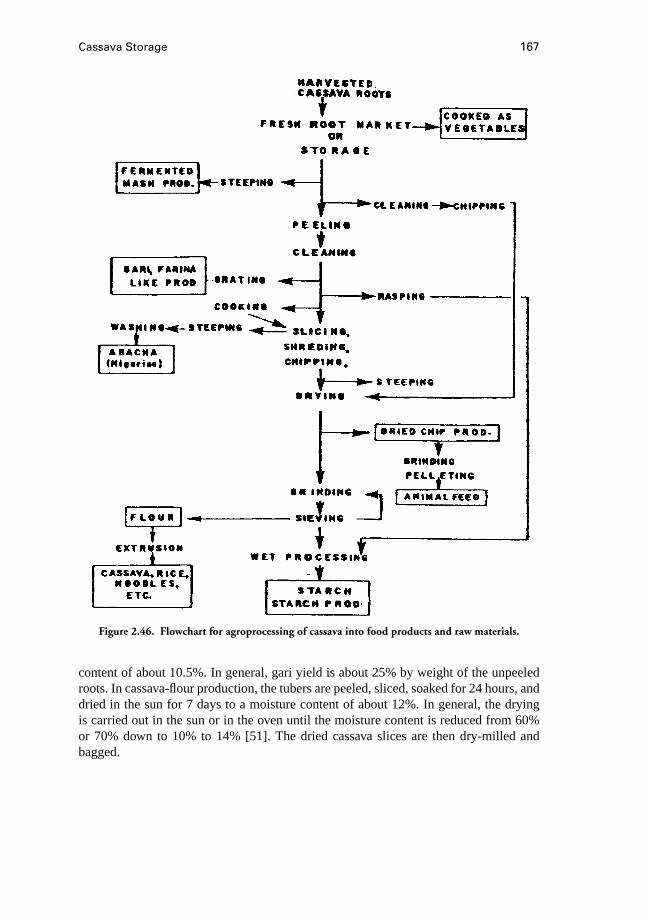
Cassava Storage 167
Figure 2.46. Flowchart for agroprocessing of cassava into food products and raw materials.
content of about 10.5%. In general, gari yield is about 25% by weight of the unpeeledroots. In cassava-flour production, the tubers are peeled, sliced, soaked for 24 hours, anddried in the sun for 7 days to a moisture content of about 12%. In general, the dryingis carried out in the sun or in the oven until the moisture content is reduced from 60%or 70% down to 10% to 14% [51]. The dried cassava slices are then dry-milled andbagged.
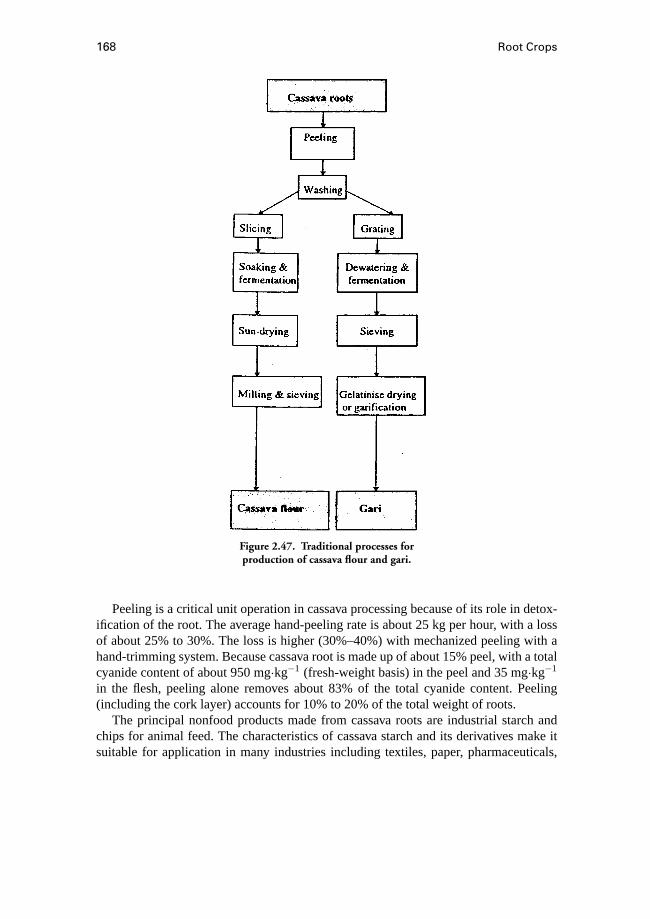
168 Root Crops
Figure 2.47. Traditional processes forproduction of cassava flour and gari.
Peeling is a critical unit operation in cassava processing because of its role in detox-ification of the root. The average hand-peeling rate is about 25 kg per hour, with a lossof about 25% to 30%. The loss is higher (30%–40%) with mechanized peeling with ahand-trimming system. Because cassava root is made up of about 15% peel, with a totalcyanide content of about 950 mg·kg−1 (fresh-weight basis) in the peel and 35 mg·kg−1
in the flesh, peeling alone removes about 83% of the total cyanide content. Peeling(including the cork layer) accounts for 10% to 20% of the total weight of roots.
The principal nonfood products made from cassava roots are industrial starch andchips for animal feed. The characteristics of cassava starch and its derivatives make itsuitable for application in many industries including textiles, paper, pharmaceuticals,
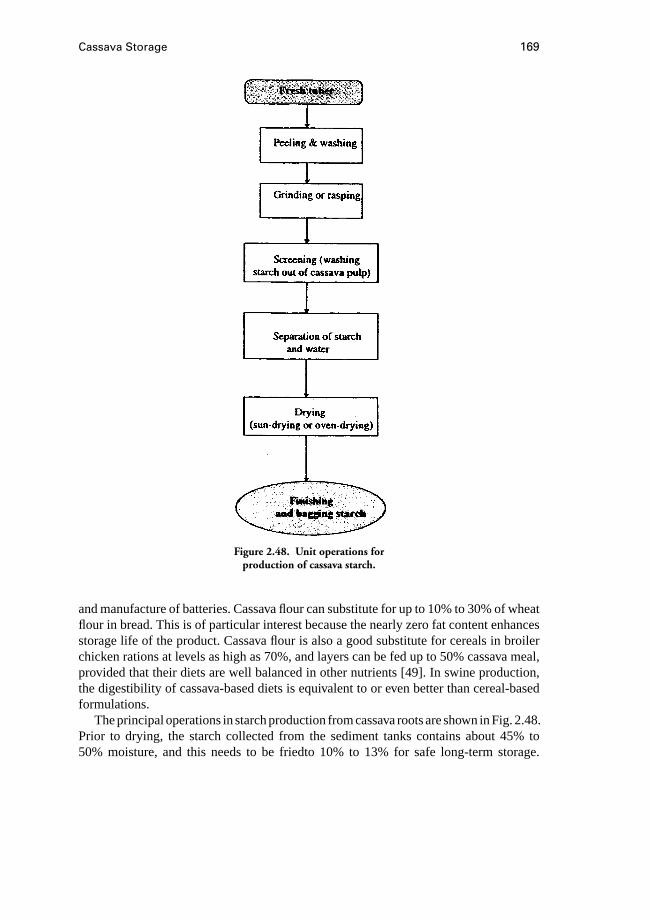
Cassava Storage 169
Figure 2.48. Unit operations forproduction of cassava starch.
and manufacture of batteries. Cassava flour can substitute for up to 10% to 30% of wheatflour in bread. This is of particular interest because the nearly zero fat content enhancesstorage life of the product. Cassava flour is also a good substitute for cereals in broilerchicken rations at levels as high as 70%, and layers can be fed up to 50% cassava meal,provided that their diets are well balanced in other nutrients [49]. In swine production,the digestibility of cassava-based diets is equivalent to or even better than cereal-basedformulations.
The principal operations instarch production from cassava roots are shown in Fig. 2.48.Prior to drying, the starch collected from the sediment tanks contains about 45% to50% moisture, and this needs to be friedto 10% to 13% for safe long-term storage.

170 Root Crops
Evaporative drying in the open air or in ovens is preferred. During sun drying, 1 to 2days will be sufficient in the dry season to reduce the moisture content to a safe level. Ifoven drying is used, the drying temperature should be kept below the gelatinization tem-perature of starch granules. Normally, a drying temperature of 50 to 60◦C is sufficient.A summary of the mass balance at each processing stage for gari production is shown inFig. 2.49.
Considerable success has been achieved in various cassava-growing areas in the mech-anization of processing operations for gari and flour production. Commercially availablemachinery and processing techniques are well documented for both rural and indus-trial processing [3, 9, 16, 17, 52, 53],including cost estimates [49]. Typical equipmentused for gari production, from tuber peeling to garification, are shown in Figs. 2.50and 2.51.
2.4.9 Nutritional and Engineering Properties
Nutritional PropertiesCassava root is a good energy source, containing high quantities of carbohydrate and
water. Contents of protein and minerals are small (Table 2.29); dry-matter content of thefresh root is about 40%.
Physicochemical CompositionCassava tubers consist of a fibrous peel (10%–15% of tuber weight) and a core
(Fig. 2.52) which is the main storage region for starch. The peel has only about 50%the starch content of the core (Fig. 2.53). Cassava contains two cyanogenic glucosides(linamarin and lotaustralin), which upon hydrolysis produce the very toxic cyanide.Linamarin is present in much larger quantities, usually up to 90% of the total [57], andthe normal cyanogen content of cassava roots varies between 15 and 400 mg HCn perkilogram fresh weight [58]. Variety and environmental and cultivation practices affectthe concentration in roots, and there is also considerable variation in the distribution ofthe glucosides within the single root. The cyanogenic glucosides increase from the centerof the tuber outward, with the highest HCn content in the peel [59]. The presence ofresidual cyanide in improperly processed cassava foods contributes to the developmentof goiter and spastic paraparesis, which are endemic in several regions in Africa [7]. Theleaves generally contain 5 to 10 times more cyanide than the tubers. The cyanide contentcan be established only by chemical analysis of the leaf or tuber [1, 60], and not by anyparticular morphological or organoleptic attributes.
In addition to the nutritional and antinutritional properties of starch, there are somephysicochemical characteristics of cassava roots that are relevant to the identification ofprocessing and value adding. These are summarized in Table 2.30.
Thermophysical and Rheological PropertiesThe thermophysical and rheological properties of cassava root affect the utilization
and options in processing. The principal properties in this regard are starch-grain size,starch-extraction rate, viscosity, and gelatinization temperature (Table 2.31).
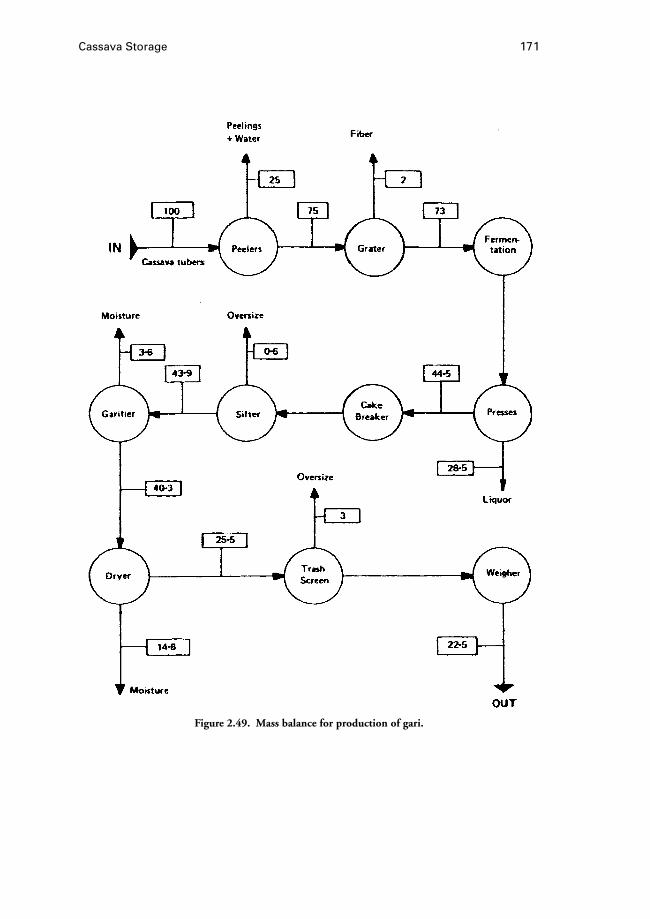
Cassava Storage 171
Figure 2.49. Mass balance for production of gari.
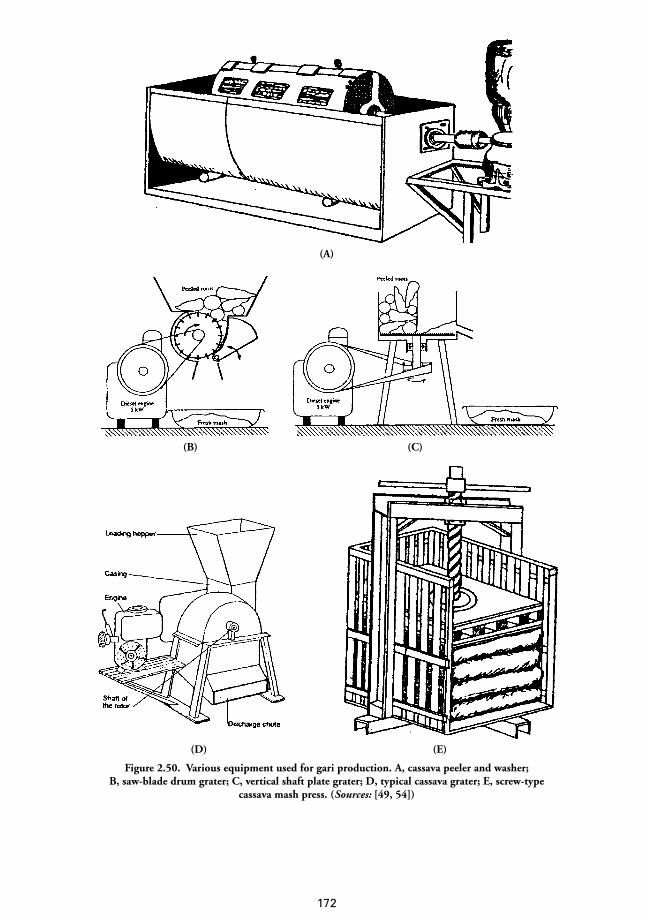
(A)
(B) (C)
(D) (E)
Figure 2.50. Various equipment used for gari production. A, cassava peeler and washer;B, saw-blade drum grater; C, vertical shaft plate grater; D, typical cassava grater; E, screw-type
cassava mash press. (Sources: [49, 54])
172
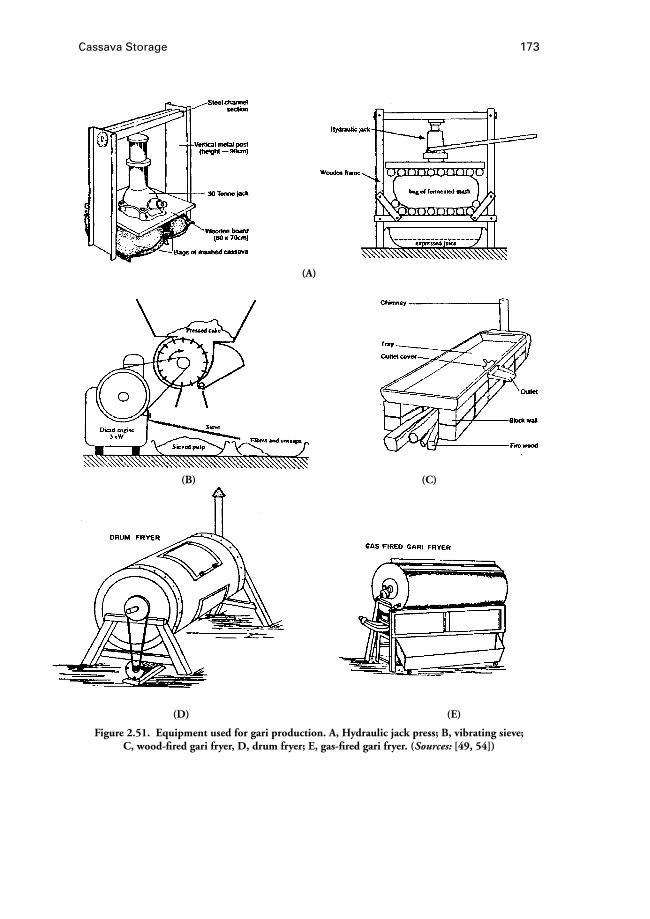
Cassava Storage 173
(A)
(B) (C)
(D) (E)
Figure 2.51. Equipment used for gari production. A, Hydraulic jack press; B, vibrating sieve;C, wood-fired gari fryer, D, drum fryer; E, gas-fired gari fryer. (Sources: [49, 54])

174 Root Crops
Table 2.29. Average nutritional compositionof fresh cassava (wet-weight basis)
Per 100-gComponent Edible Portion
Food energy 146 calWater 62.5 gCarbohydrate 34.7 gProtein 1.2 gFat 0.3 gCalcium 33 mgIron 0.7 mgVitamin A TraceThiamine, B1 0.6 mgRiboflavin, B2 0.03 mgNiacin 0.6 mgVitamin C 36 mg
Source: [55].
Table 2.30. Some physicochemical properties ofcassava roots relevant to its use as raw material
for agroprocessing and value-adding
Property Quantity
Dry matter 30%–40%Starch 27%–36% FWTotal sugars 0.5%–2.5% FWProtein 0.5%–2.0% FWFibre 1.0% FWLipids 0.5% FWVitamin A 17 g/100 g FWVitamin C 50 mg/100 g FWAsh 0.5%–1.5% FWEnergy 607 kJ/100 gAntinutritional factors Cyanogens
Source: [3].
Table 2.31. Some thermophysical and rheologicalproperties of cassava roots
Property Quantity
Starch extraction rate 22%–25%Starch grain size 5–50 µmAmylose 15%–29%Maximum viscosity 700–1100 BUGelatinization temperature 49–73◦C
Source: [3].

Cassava Storage 175
Figure 2.52. Sections through a cassava tuber. (Source: [56])
Figure 2.53. Transverse section showing relative size of starch grains in cassava root. (Source: [7])
Physical and Mechanical PropertiesThe physical and mechanical properties of agricultural and food materials are impor-
tant parameters for designing handling and processing equipment. Typical cassava tubergeometry is shown in Fig. 2.54, with maximum tuber cross-sectional diameter occurringtowards the stem region. Values of relevant physical properties are shown in Table 2.32.The coefficients of friction and rolling resistance (Table 2.33) between cassava tuberand various surfaces have been quantified. Mechanical properties relevant to the designof a cassava peeler also have been reported (Table 2.34). A range of other engineeringproperties of cassava tubers essential for design calculations for the mechanization ofvarious agroprocessing operations or analysis of industrialization processes and systemsalso have been reported (Table 2.35).
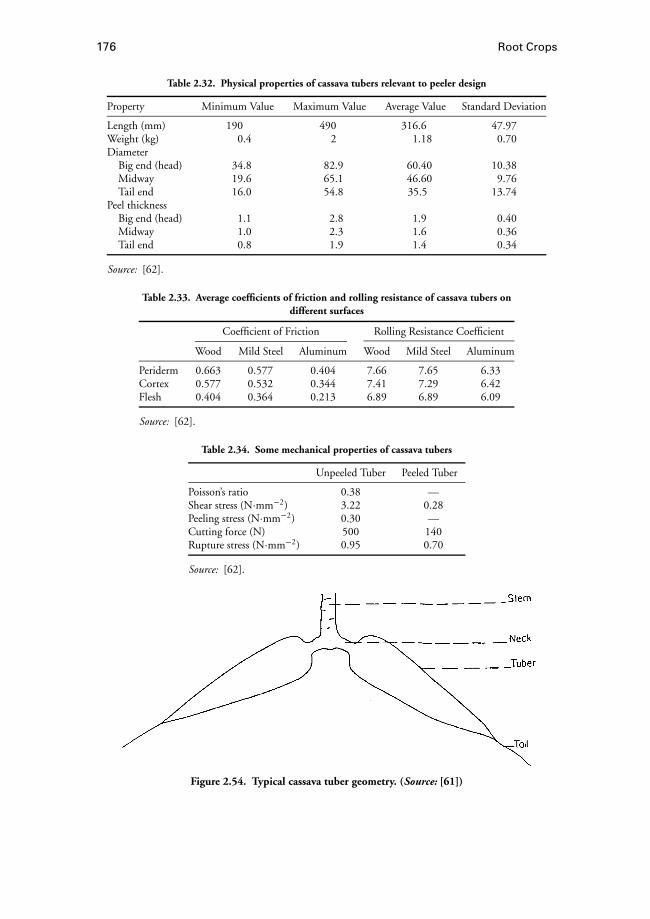
176 Root Crops
Table 2.32. Physical properties of cassava tubers relevant to peeler design
Property Minimum Value Maximum Value Average Value Standard Deviation
Length (mm) 190 490 316.6 47.97Weight (kg) 0.4 2 1.18 0.70Diameter
Big end (head) 34.8 82.9 60.40 10.38Midway 19.6 65.1 46.60 9.76Tail end 16.0 54.8 35.5 13.74
Peel thicknessBig end (head) 1.1 2.8 1.9 0.40Midway 1.0 2.3 1.6 0.36Tail end 0.8 1.9 1.4 0.34
Source: [62].
Table 2.33. Average coefficients of friction and rolling resistance of cassava tubers ondifferent surfaces
Coefficient of Friction Rolling Resistance Coefficient
Wood Mild Steel Aluminum Wood Mild Steel Aluminum
Periderm 0.663 0.577 0.404 7.66 7.65 6.33Cortex 0.577 0.532 0.344 7.41 7.29 6.42Flesh 0.404 0.364 0.213 6.89 6.89 6.09
Source: [62].
Table 2.34. Some mechanical properties of cassava tubers
Unpeeled Tuber Peeled Tuber
Poisson’s ratio 0.38 —Shear stress (N·mm−2) 3.22 0.28Peeling stress (N·mm−2) 0.30 —Cutting force (N) 500 140Rupture stress (N·mm−2) 0.95 0.70
Source: [62].
Figure 2.54. Typical cassava tuber geometry. (Source: [61])

Cassava Storage 177
Table 2.35. Some engineering properties of cassava roots and methods of determination
Description (Mean Value) Method of Determination
Shape Spindle shaped; elongated ovoid; Comparison with knownbarrel shaped with rounded ends; geometrical shapesconical with rounded ends(conical with rounded ends)
Roundness of transverse 0.65 to 1.0 (0.85) Actual area of section areasection of circumscribing circle
Length 10–55 cm (25 cm) Direct measurementAverage straight length 10 cm Direct measurementMaximum diameter 2.5 to 15 cm (6.3 cm) Direct measurementMass of individual tuber 25 to 4000 g (175 g) Direct measurementMean specific gravity of 1.025 Water displacement
whole rootMoisture content Tail and midportion: 85% to 93% (w.b.) Aerated oven
Head portion: 78% to 86% (88%) (w.b.)Solid density 1.92 to 2.3 g·cm−3 (2.0 g·cm−3) Air comparison pycnometer
using ground bone-drytubers, averageparticle size 250 µ
Thickness of outer periderm 0.25 to 0.3 mm Instron testing machine,time-displacementrecording
Thickness of cortex 1.0 to 2.0 mm (1.5 mm) Instron testing machine,time-displacementrecording
Modulus of deformability 3.45E+06–4.82 E+06 Pa Tangent to stress–strainor apparent modulus curve at designated stress
Bioyield strength (9.3E+05 Pa) Force–deformation curve ina compressive test
Shear strength Medullary zone: 6.76E+05 Pa Double shear test usingCentral pith zone: 96E+05 Pa Instron testing machineSection with chord: 2.14E+06 Pa
Specific heat (0.94 J·kg−1·K−1) Calorimeter methodof mixtures
Thermal conductivity (0.285 W·m−1·K−1 ) Modified Fitch Apparatusof tuber flesh
Thermal conductivity (0.61 W·m−1·K−1 ) Thermal conductivity probeof white gari at 610kg·m−3 bulk density
Adapted from [56].Note: Tests on unidentified variety of cassava from University of Florida Agricultural and Educational
Center.
Effects of Processing on Biochemical Properties and Nutritional PropertiesProcessing of cassava roots affects the biochemical contents of the resulting products
such as gari and flour. The two principal effects are the detoxification of the productsand removal of moisture. In experiments with two bitter cassava cultivars, fermentationof the pulp for 96 hours during gari production reduced the hydrogen cyanide (HCN)

178 Root Crops
Table 2.36. Cyanide content of two bitter cassava cultivars and the effects of pH on cyanide levelduring processing
30572 Garri 30555 Garri
Time (h) HCn Level ± SD (ppm) pH Flour HCn Level ± SD (ppm) pH Flour
0 42 ± 0.45 6.7 42 ± 0.3 39 ± 1.1 6.8 39 ± 0.7924 31 ± 0.32 4.1 26 ± 0.72 28 ± 0.73 4.2 24 ± 0.7348 24 ± 0.11 3.9 — 22 ± 1.3 4.0 —72 20 ± 0.36 3.9 — 19 ± 0.96 3.9 —96 20 ± 1.87 3.8 — 19 ± 0.37 3.9 —Product 12 ± 0.81 20 ± 0.11 10 ± 0.37 19 ± 0.87
Source: [60].
Table 2.37. Detoxification of cyanide during gari processing
HCN Detoxification on peeledOperation Material (ppm) root (%)
Whole cassava root 306 —Peeling Peel 660 —
Peeled root 184 0Grating Slurry 104 16–92Dewatering after Cake 52 71.74
fermentationPressed juice 86 53.26
Roasting Gari 10 94.56
Source: [55].
Table 2.38. Moisture content at various stages in gari processing
Operation Product Moisture content (%)
Grating Slurry (pulp) 60–65Fermentation Fermented pulp —Dewatering (centrifuge) Cake 47–50Roasting Semidry gari 30–35Final drying Gari 8–10
Source: [55].
content by 52% and 57% [60]. Soaking of the sliced tissue for 24 hours in cassava-flour production prior to sun-drying resulted in 38% reduction in HCN content for bothcultivars. Gari processing reduced HCN content than cassava flour processing (Tables2.36 and 2.37). In general, garification reduces moisture content to about 8% to 10%(Table 2.38). The low moisture content gives gari a good shelf life.
One of the very important quality attributes of gari is the swelling capacity in water,which should be at least three times the initial volume of the dry grits (Table 2.39).Particle size of gari ranges from below 50µm (fine) to over 2000µm (coarse). Inpractice, the quality of gari is judged by the degree of coarseness and moisture content
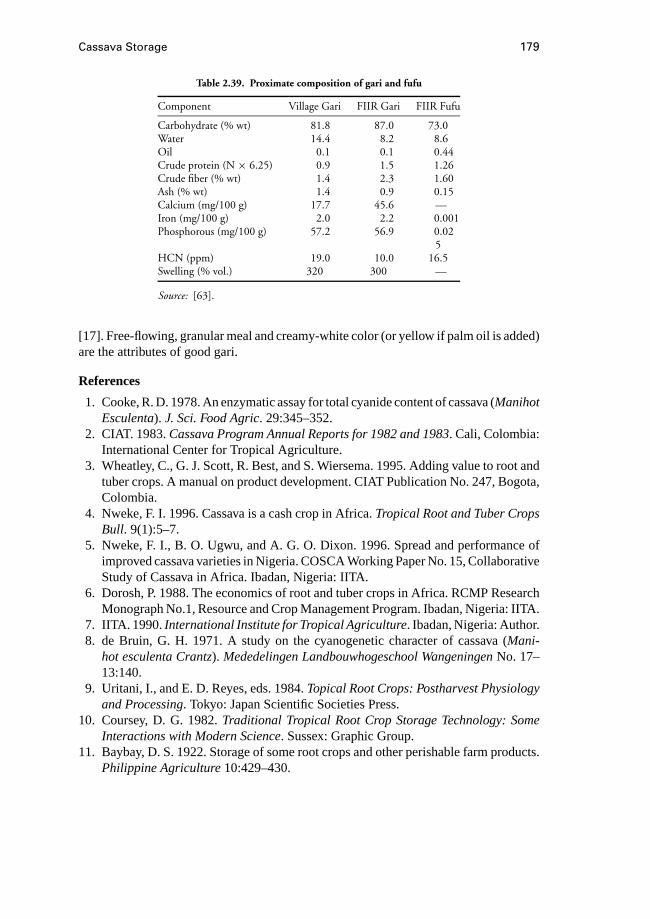
Cassava Storage 179
Table 2.39. Proximate composition of gari and fufu
Component Village Gari FIIR Gari FIIR Fufu
Carbohydrate (% wt) 81.8 87.0 73.0Water 14.4 8.2 8.6Oil 0.1 0.1 0.44Crude protein (N × 6.25) 0.9 1.5 1.26Crude fiber (% wt) 1.4 2.3 1.60Ash (% wt) 1.4 0.9 0.15Calcium (mg/100 g) 17.7 45.6 —Iron (mg/100 g) 2.0 2.2 0.001Phosphorous (mg/100 g) 57.2 56.9 0.02
5HCN (ppm) 19.0 10.0 16.5Swelling (% vol.) 320 300 —
Source: [63].
[17]. Free-flowing, granular meal and creamy-white color (or yellow if palm oil is added)are the attributes of good gari.
References
1. Cooke, R. D. 1978. An enzymatic assay for total cyanide content of cassava (ManihotEsculenta). J. Sci. Food Agric. 29:345–352.
2. CIAT. 1983.Cassava Program Annual Reports for 1982 and 1983. Cali, Colombia:International Center for Tropical Agriculture.
3. Wheatley, C., G. J. Scott, R. Best, and S. Wiersema. 1995. Adding value to root andtuber crops. A manual on product development. CIAT Publication No. 247, Bogota,Colombia.
4. Nweke, F. I. 1996. Cassava is a cash crop in Africa.Tropical Root and Tuber CropsBull. 9(1):5–7.
5. Nweke, F. I., B. O. Ugwu, and A. G. O. Dixon. 1996. Spread and performance ofimproved cassava varieties in Nigeria. COSCA Working Paper No. 15, CollaborativeStudy of Cassava in Africa. Ibadan, Nigeria: IITA.
6. Dorosh, P. 1988. The economics of root and tuber crops in Africa. RCMP ResearchMonograph No.1, Resource and Crop Management Program. Ibadan, Nigeria: IITA.
7. IITA. 1990.International Institute for Tropical Agriculture. Ibadan, Nigeria: Author.8. de Bruin, G. H. 1971. A study on the cyanogenetic character of cassava (Mani-
hot esculenta Crantz). Mededelingen Landbouwhogeschool WangeningenNo. 17–13:140.
9. Uritani, I., and E. D. Reyes, eds. 1984.Topical Root Crops: Postharvest Physiologyand Processing. Tokyo: Japan Scientific Societies Press.
10. Coursey, D. G. 1982.Traditional Tropical Root Crop Storage Technology: SomeInteractions with Modern Science. Sussex: Graphic Group.
11. Baybay, D. S. 1922. Storage of some root crops and other perishable farm products.Philippine Agriculture10:429–430.
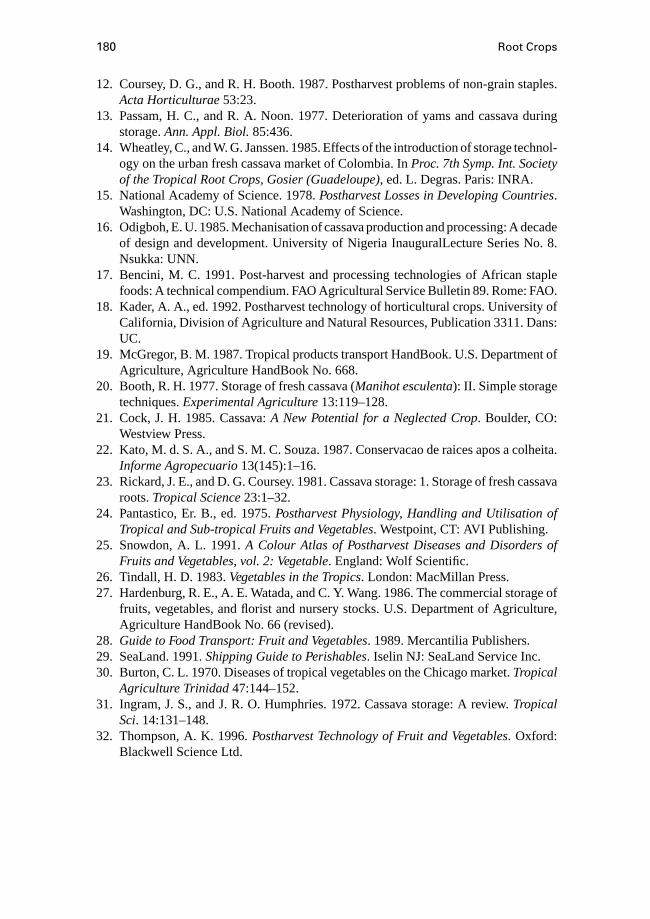
180 Root Crops
12. Coursey, D. G., and R. H. Booth. 1987. Postharvest problems of non-grain staples.Acta Horticulturae53:23.
13. Passam, H. C., and R. A. Noon. 1977. Deterioration of yams and cassava duringstorage.Ann. Appl. Biol.85:436.
14. Wheatley, C., and W. G. Janssen. 1985. Effects of the introduction of storage technol-ogy on the urban fresh cassava market of Colombia. InProc. 7th Symp. Int. Societyof the Tropical Root Crops, Gosier (Guadeloupe), ed. L. Degras. Paris: INRA.
15. National Academy of Science. 1978.Postharvest Losses in Developing Countries.Washington, DC: U.S. National Academy of Science.
16. Odigboh, E. U. 1985. Mechanisation of cassava production and processing: A decadeof design and development. University of Nigeria InauguralLecture Series No. 8.Nsukka: UNN.
17. Bencini, M. C. 1991. Post-harvest and processing technologies of African staplefoods: A technical compendium. FAO Agricultural Service Bulletin 89. Rome: FAO.
18. Kader, A. A., ed. 1992. Postharvest technology of horticultural crops. University ofCalifornia, Division of Agriculture and Natural Resources, Publication 3311. Dans:UC.
19. McGregor, B. M. 1987. Tropical products transport HandBook. U.S. Department ofAgriculture, Agriculture HandBook No. 668.
20. Booth, R. H. 1977. Storage of fresh cassava (Manihot esculenta): II. Simple storagetechniques.Experimental Agriculture13:119–128.
21. Cock, J. H. 1985. Cassava:A New Potential for a Neglected Crop. Boulder, CO:Westview Press.
22. Kato, M. d. S. A., and S. M. C. Souza. 1987. Conservacao de raices apos a colheita.Informe Agropecuario13(145):1–16.
23. Rickard, J. E., and D. G. Coursey. 1981. Cassava storage: 1. Storage of fresh cassavaroots.Tropical Science23:1–32.
24. Pantastico, Er. B., ed. 1975.Postharvest Physiology, Handling and Utilisation ofTropical and Sub-tropical Fruits and Vegetables. Westpoint, CT: AVI Publishing.
25. Snowdon, A. L. 1991.A Colour Atlas of Postharvest Diseases and Disorders ofFruits and Vegetables, vol. 2: Vegetable. England: Wolf Scientific.
26. Tindall, H. D. 1983.Vegetables in the Tropics. London: MacMillan Press.27. Hardenburg, R. E., A. E. Watada, and C. Y. Wang. 1986. The commercial storage of
fruits, vegetables, and florist and nursery stocks. U.S. Department of Agriculture,Agriculture HandBook No. 66 (revised).
28. Guide to Food Transport: Fruit and Vegetables. 1989. Mercantilia Publishers.29. SeaLand. 1991.Shipping Guide to Perishables. Iselin NJ: SeaLand Service Inc.30. Burton, C. L. 1970. Diseases of tropical vegetables on the Chicago market.Tropical
Agriculture Trinidad47:144–152.31. Ingram, J. S., and J. R. O. Humphries. 1972. Cassava storage: A review.Tropical
Sci. 14:131–148.32. Thompson, A. K. 1996.Postharvest Technology of Fruit and Vegetables. Oxford:
Blackwell Science Ltd.
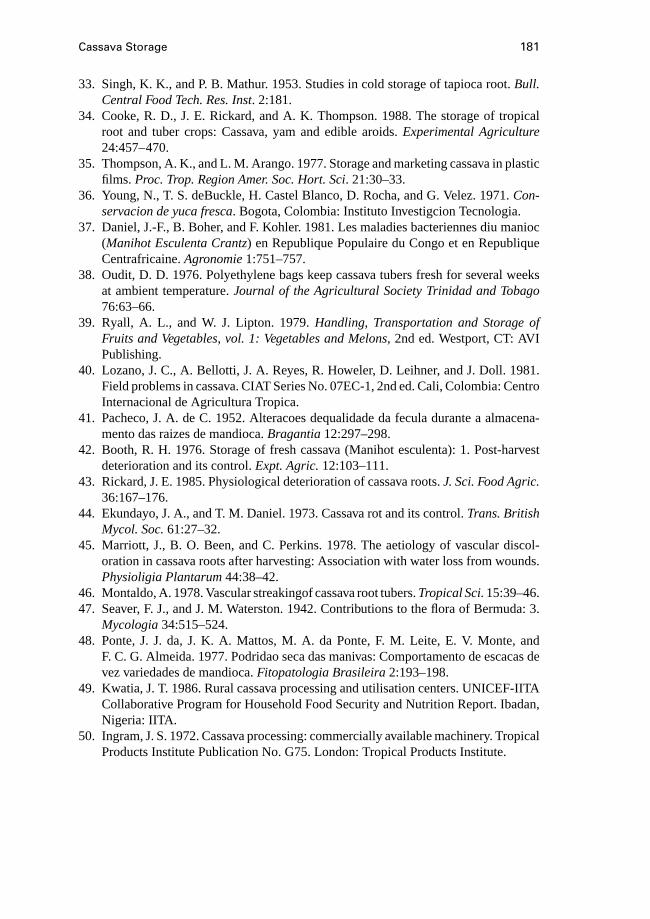
Cassava Storage 181
33. Singh, K. K., and P. B. Mathur. 1953. Studies in cold storage of tapioca root.Bull.Central Food Tech. Res. Inst. 2:181.
34. Cooke, R. D., J. E. Rickard, and A. K. Thompson. 1988. The storage of tropicalroot and tuber crops: Cassava, yam and edible aroids.Experimental Agriculture24:457–470.
35. Thompson, A. K., and L. M. Arango. 1977. Storage and marketing cassava in plasticfilms. Proc. Trop. Region Amer. Soc. Hort. Sci. 21:30–33.
36. Young, N., T. S. deBuckle, H. Castel Blanco, D. Rocha, and G. Velez. 1971.Con-servacion de yuca fresca. Bogota, Colombia: Instituto Investigcion Tecnologia.
37. Daniel, J.-F., B. Boher, and F. Kohler. 1981. Les maladies bacteriennes diu manioc(Manihot Esculenta Crantz) en Republique Populaire du Congo et en RepubliqueCentrafricaine.Agronomie1:751–757.
38. Oudit, D. D. 1976. Polyethylene bags keep cassava tubers fresh for several weeksat ambient temperature.Journal of the Agricultural Society Trinidad and Tobago76:63–66.
39. Ryall, A. L., and W. J. Lipton. 1979.Handling, Transportation and Storage ofFruits and Vegetables, vol. 1: Vegetables and Melons, 2nd ed. Westport, CT: AVIPublishing.
40. Lozano, J. C., A. Bellotti, J. A. Reyes, R. Howeler, D. Leihner, and J. Doll. 1981.Field problems in cassava. CIAT Series No. 07EC-1, 2nd ed. Cali, Colombia: CentroInternacional de Agricultura Tropica.
41. Pacheco, J. A. de C. 1952. Alteracoes dequalidade da fecula durante a almacena-mento das raizes de mandioca.Bragantia12:297–298.
42. Booth, R. H. 1976. Storage of fresh cassava (Manihot esculenta): 1. Post-harvestdeterioration and its control.Expt. Agric.12:103–111.
43. Rickard, J. E. 1985. Physiological deterioration of cassava roots.J. Sci. Food Agric.36:167–176.
44. Ekundayo, J. A., and T. M. Daniel. 1973. Cassava rot and its control.Trans. BritishMycol. Soc.61:27–32.
45. Marriott, J., B. O. Been, and C. Perkins. 1978. The aetiology of vascular discol-oration in cassava roots after harvesting: Association with water loss from wounds.Physioligia Plantarum44:38–42.
46. Montaldo, A. 1978. Vascular streakingof cassava root tubers.Tropical Sci.15:39–46.47. Seaver, F. J., and J. M. Waterston. 1942. Contributions to the flora of Bermuda: 3.
Mycologia34:515–524.48. Ponte, J. J. da, J. K. A. Mattos, M. A. da Ponte, F. M. Leite, E. V. Monte, and
F. C. G. Almeida. 1977. Podridao seca das manivas: Comportamento de escacas devez variedades de mandioca.Fitopatologia Brasileira2:193–198.
49. Kwatia, J. T. 1986. Rural cassava processing and utilisation centers. UNICEF-IITACollaborative Program for Household Food Security and Nutrition Report. Ibadan,Nigeria: IITA.
50. Ingram, J. S. 1972. Cassava processing: commercially available machinery. TropicalProducts Institute Publication No. G75. London: Tropical Products Institute.
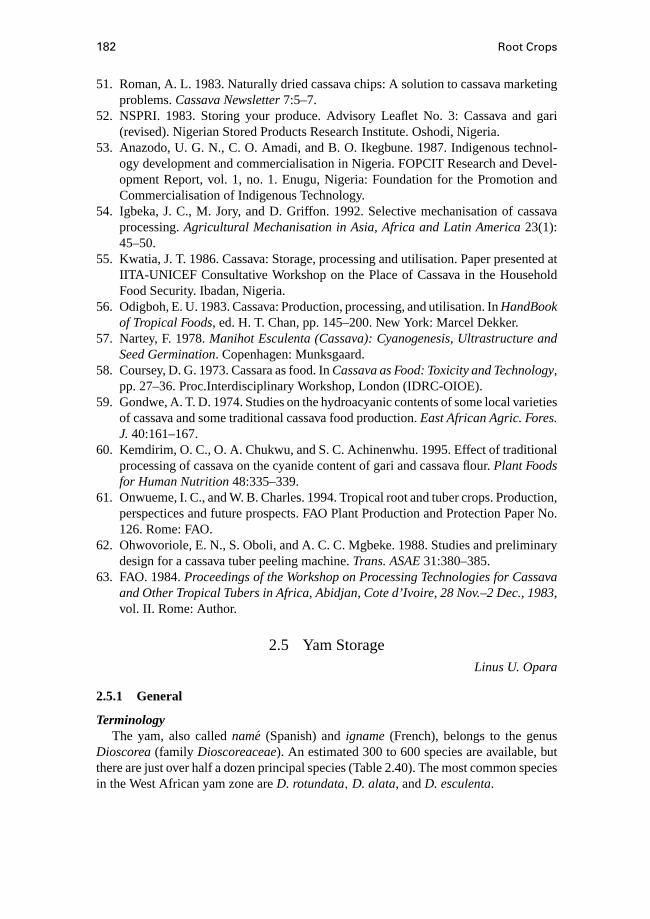
182 Root Crops
51. Roman, A. L. 1983. Naturally dried cassava chips: A solution to cassava marketingproblems.Cassava Newsletter7:5–7.
52. NSPRI. 1983. Storing your produce. Advisory Leaflet No. 3: Cassava and gari(revised). Nigerian Stored Products Research Institute. Oshodi, Nigeria.
53. Anazodo, U. G. N., C. O. Amadi, and B. O. Ikegbune. 1987. Indigenous technol-ogy development and commercialisation in Nigeria. FOPCIT Research and Devel-opment Report, vol. 1, no. 1. Enugu, Nigeria: Foundation for the Promotion andCommercialisation of Indigenous Technology.
54. Igbeka, J. C., M. Jory, and D. Griffon. 1992. Selective mechanisation of cassavaprocessing.Agricultural Mechanisation in Asia, Africa and Latin America23(1):45–50.
55. Kwatia, J. T. 1986. Cassava: Storage, processing and utilisation. Paper presented atIITA-UNICEF Consultative Workshop on the Place of Cassava in the HouseholdFood Security. Ibadan, Nigeria.
56. Odigboh, E. U. 1983. Cassava: Production, processing, and utilisation. InHandBookof Tropical Foods, ed. H. T. Chan, pp. 145–200. New York: Marcel Dekker.
57. Nartey, F. 1978.Manihot Esculenta (Cassava): Cyanogenesis, Ultrastructure andSeed Germination. Copenhagen: Munksgaard.
58. Coursey, D. G. 1973. Cassara as food. InCassava as Food: Toxicity and Technology,pp. 27–36. Proc.Interdisciplinary Workshop, London (IDRC-OIOE).
59. Gondwe, A. T. D. 1974. Studies on the hydroacyanic contents of some local varietiesof cassava and some traditional cassava food production.East African Agric. Fores.J. 40:161–167.
60. Kemdirim, O. C., O. A. Chukwu, and S. C. Achinenwhu. 1995. Effect of traditionalprocessing of cassava on the cyanide content of gari and cassava flour.Plant Foodsfor Human Nutrition48:335–339.
61. Onwueme, I. C., and W. B. Charles. 1994. Tropical root and tuber crops. Production,perspectices and future prospects. FAO Plant Production and Protection Paper No.126. Rome: FAO.
62. Ohwovoriole, E. N., S. Oboli, and A. C. C. Mgbeke. 1988. Studies and preliminarydesign for a cassava tuber peeling machine.Trans. ASAE31:380–385.
63. FAO. 1984.Proceedings of the Workshop on Processing Technologies for Cassavaand Other Tropical Tubers in Africa, Abidjan, Cote d’Ivoire, 28 Nov.–2 Dec., 1983,vol. II. Rome: Author.
2.5 Yam StorageLinus U. Opara
2.5.1 General
TerminologyThe yam, also calledname (Spanish) andigname(French), belongs to the genus
Dioscorea(family Dioscoreaceae). An estimated 300 to 600 species are available, butthere are just over half a dozen principal species (Table 2.40). The most common speciesin the West African yam zone areD. rotundata, D. alata, andD. esculenta.
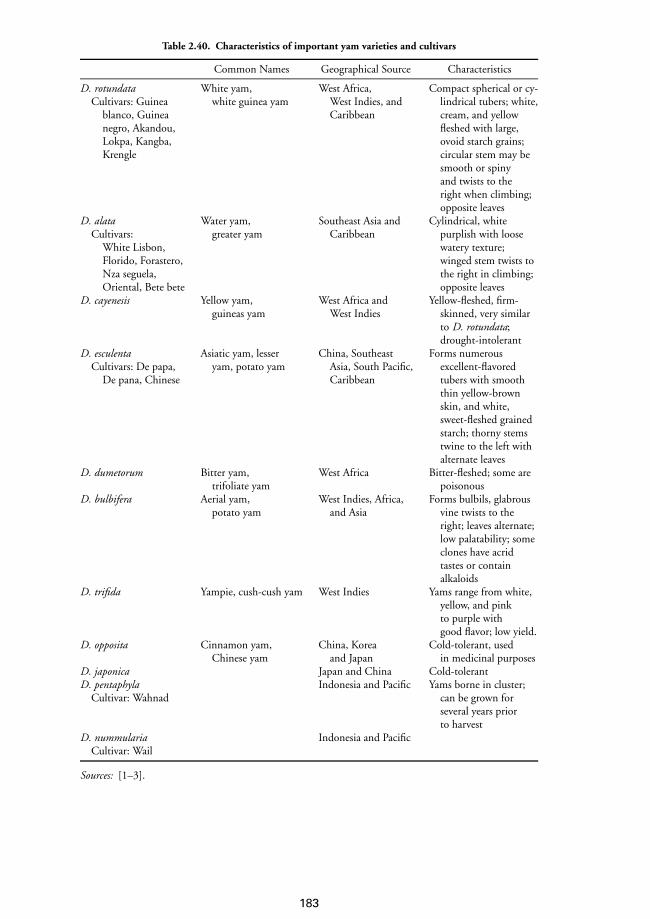
Table 2.40. Characteristics of important yam varieties and cultivars
Common Names Geographical Source Characteristics
D. rotundata White yam, West Africa, Compact spherical or cy-Cultivars: Guinea white guinea yam West Indies, and lindrical tubers; white,
blanco, Guinea Caribbean cream, and yellownegro, Akandou, fleshed with large,Lokpa, Kangba, ovoid starch grains;Krengle circular stem may be
smooth or spinyand twists to theright when climbing;opposite leaves
D. alata Water yam, Southeast Asia and Cylindrical, whiteCultivars: greater yam Caribbean purplish with loose
White Lisbon, watery texture;Florido, Forastero, winged stem twists toNza seguela, the right in climbing;Oriental, Bete bete opposite leaves
D. cayenesis Yellow yam, West Africa and Yellow-fleshed, firm-guineas yam West Indies skinned, very similar
to D. rotundata;drought-intolerant
D. esculenta Asiatic yam, lesser China, Southeast Forms numerousCultivars: De papa, yam, potato yam Asia, South Pacific, excellent-flavored
De pana, Chinese Caribbean tubers with smooththin yellow-brownskin, and white,sweet-fleshed grainedstarch; thorny stemstwine to the left withalternate leaves
D. dumetorum Bitter yam, West Africa Bitter-fleshed; some aretrifoliate yam poisonous
D. bulbifera Aerial yam, West Indies, Africa, Forms bulbils, glabrouspotato yam and Asia vine twists to the
right; leaves alternate;low palatability; someclones have acridtastes or containalkaloids
D. trifida Yampie, cush-cush yam West Indies Yams range from white,yellow, and pinkto purple withgood flavor; low yield.
D. opposita Cinnamon yam, China, Korea Cold-tolerant, usedChinese yam and Japan in medicinal purposes
D. japonica Japan and China Cold-tolerantD. pentaphyla Indonesia and Pacific Yams borne in cluster;
Cultivar: Wahnad can be grown forseveral years priorto harvest
D. nummularia Indonesia and PacificCultivar: Wail
Sources: [1–3].
183
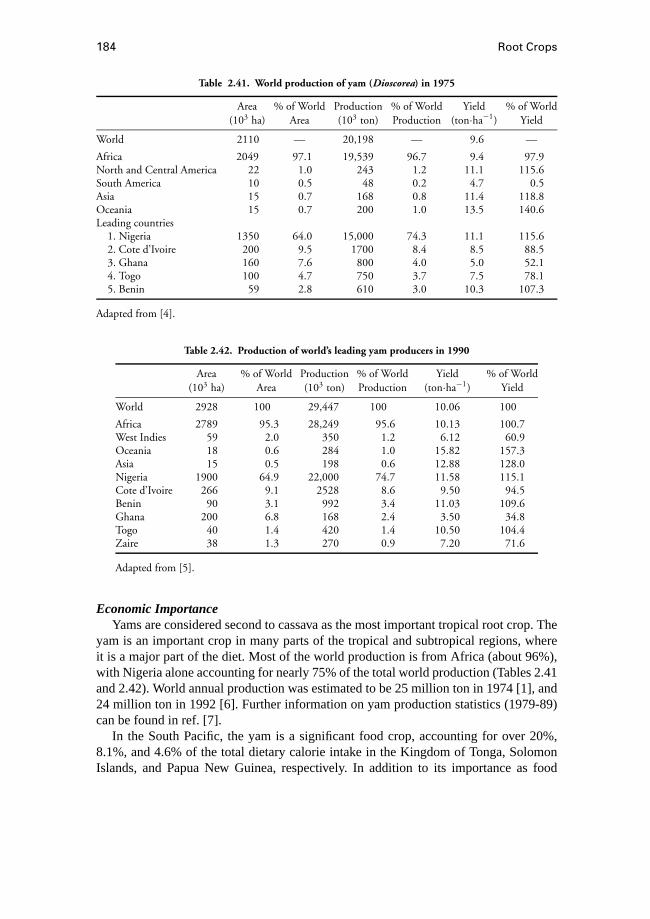
184 Root Crops
Table 2.41. World production of yam (Dioscorea) in 1975
Area % of World Production % of World Yield % of World(103 ha) Area (103 ton) Production (ton·ha−1) Yield
World 2110 — 20,198 — 9.6 —
Africa 2049 97.1 19,539 96.7 9.4 97.9North and Central America 22 1.0 243 1.2 11.1 115.6South America 10 0.5 48 0.2 4.7 0.5Asia 15 0.7 168 0.8 11.4 118.8Oceania 15 0.7 200 1.0 13.5 140.6Leading countries
1. Nigeria 1350 64.0 15,000 74.3 11.1 115.62. Cote d’Ivoire 200 9.5 1700 8.4 8.5 88.53. Ghana 160 7.6 800 4.0 5.0 52.14. Togo 100 4.7 750 3.7 7.5 78.15. Benin 59 2.8 610 3.0 10.3 107.3
Adapted from [4].
Table 2.42. Production of world’s leading yam producers in 1990
Area % of World Production % of World Yield % of World(103 ha) Area (103 ton) Production (ton·ha−1) Yield
World 2928 100 29,447 100 10.06 100
Africa 2789 95.3 28,249 95.6 10.13 100.7West Indies 59 2.0 350 1.2 6.12 60.9Oceania 18 0.6 284 1.0 15.82 157.3Asia 15 0.5 198 0.6 12.88 128.0Nigeria 1900 64.9 22,000 74.7 11.58 115.1Cote d’Ivoire 266 9.1 2528 8.6 9.50 94.5Benin 90 3.1 992 3.4 11.03 109.6Ghana 200 6.8 168 2.4 3.50 34.8Togo 40 1.4 420 1.4 10.50 104.4Zaire 38 1.3 270 0.9 7.20 71.6
Adapted from [5].
Economic ImportanceYams are considered second to cassava as the most important tropical root crop. The
yam is an important crop in many parts of the tropical and subtropical regions, whereit is a major part of the diet. Most of the world production is from Africa (about 96%),with Nigeria alone accounting for nearly 75% of the total world production (Tables 2.41and 2.42). World annual production was estimated to be 25 million ton in 1974 [1], and24 million ton in 1992 [6]. Further information on yam production statistics (1979-89)can be found in ref. [7].
In the South Pacific, the yam is a significant food crop, accounting for over 20%,8.1%, and 4.6% of the total dietary calorie intake in the Kingdom of Tonga, SolomonIslands, and Papua New Guinea, respectively. In addition to its importance as food
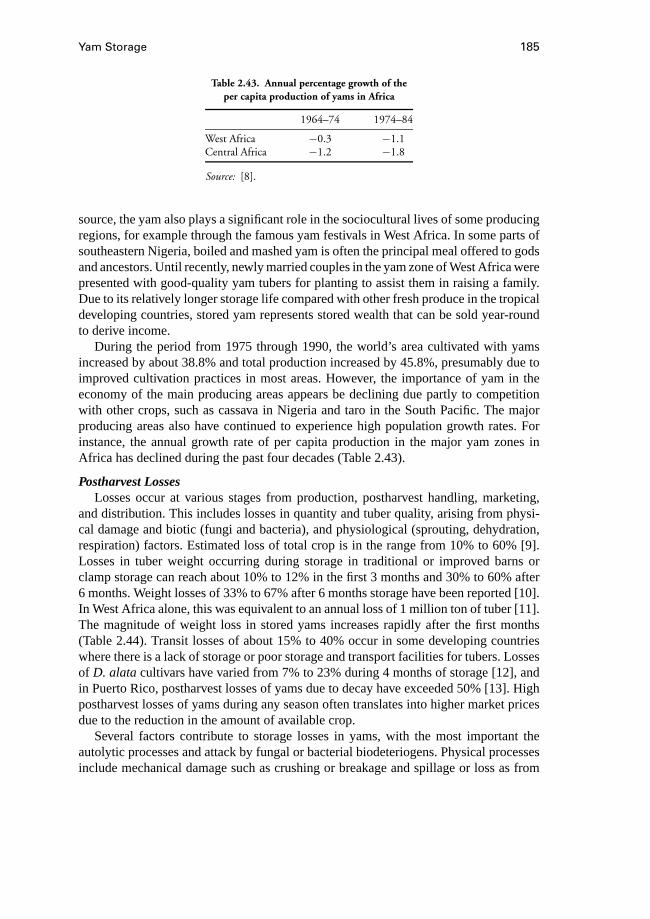
Yam Storage 185
Table 2.43. Annual percentage growth of theper capita production of yams in Africa
1964–74 1974–84
West Africa −0.3 −1.1Central Africa −1.2 −1.8
Source: [8].
source, the yam also plays a significant role in the sociocultural lives of some producingregions, for example through the famous yam festivals in West Africa. In some parts ofsoutheastern Nigeria, boiled and mashed yam is often the principal meal offered to godsand ancestors. Until recently, newly married couples in the yam zone of West Africa werepresented with good-quality yam tubers for planting to assist them in raising a family.Due to its relatively longer storage life compared with other fresh produce in the tropicaldeveloping countries, stored yam represents stored wealth that can be sold year-roundto derive income.
During the period from 1975 through 1990, the world’s area cultivated with yamsincreased by about 38.8% and total production increased by 45.8%, presumably due toimproved cultivation practices in most areas. However, the importance of yam in theeconomy of the main producing areas appears be declining due partly to competitionwith other crops, such as cassava in Nigeria and taro in the South Pacific. The majorproducing areas also have continued to experience high population growth rates. Forinstance, the annual growth rate of per capita production in the major yam zones inAfrica has declined during the past four decades (Table 2.43).
Postharvest LossesLosses occur at various stages from production, postharvest handling, marketing,
and distribution. This includes losses in quantity and tuber quality, arising from physi-cal damage and biotic (fungi and bacteria), and physiological (sprouting, dehydration,respiration) factors. Estimated loss of total crop is in the range from 10% to 60% [9].Losses in tuber weight occurring during storage in traditional or improved barns orclamp storage can reach about 10% to 12% in the first 3 months and 30% to 60% after6 months. Weight losses of 33% to 67% after 6 months storage have been reported [10].In West Africa alone, this was equivalent to an annual loss of 1 million ton of tuber [11].The magnitude of weight loss in stored yams increases rapidly after the first months(Table 2.44). Transit losses of about 15% to 40% occur in some developing countrieswhere there is a lack of storage or poor storage and transport facilities for tubers. Lossesof D. alatacultivars have varied from 7% to 23% during 4 months of storage [12], andin Puerto Rico, postharvest losses of yams due to decay have exceeded 50% [13]. Highpostharvest losses of yams during any season often translates into higher market pricesdue to the reduction in the amount of available crop.
Several factors contribute to storage losses in yams, with the most important theautolytic processes and attack by fungal or bacterial biodeteriogens. Physical processesinclude mechanical damage such as crushing or breakage and spillage or loss as from
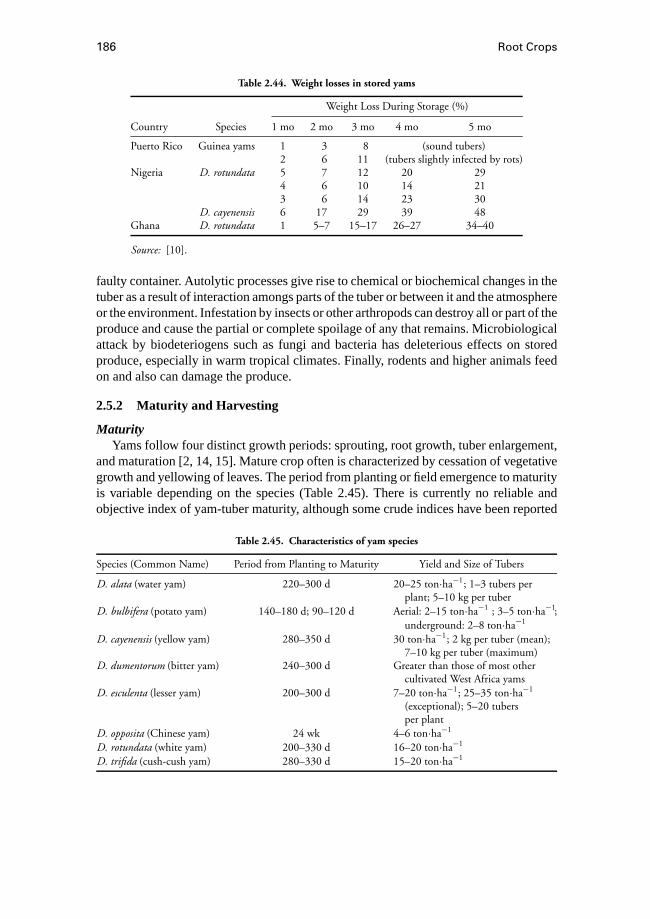
186 Root Crops
Table 2.44. Weight losses in stored yams
Weight Loss During Storage (%)
Country Species 1 mo 2 mo 3 mo 4 mo 5 mo
Puerto Rico Guinea yams 1 3 8 (sound tubers)2 6 11 (tubers slightly infected by rots)
Nigeria D. rotundata 5 7 12 20 294 6 10 14 213 6 14 23 30
D. cayenensis 6 17 29 39 48Ghana D. rotundata 1 5–7 15–17 26–27 34–40
Source: [10].
faulty container. Autolytic processes give rise to chemical or biochemical changes in thetuber as a result of interaction amongs parts of the tuber or between it and the atmosphereor the environment. Infestation by insects or other arthropods can destroy all or part of theproduce and cause the partial or complete spoilage of any that remains. Microbiologicalattack by biodeteriogens such as fungi and bacteria has deleterious effects on storedproduce, especially in warm tropical climates. Finally, rodents and higher animals feedon and also can damage the produce.
2.5.2 Maturity and Harvesting
MaturityYams follow four distinct growth periods: sprouting, root growth, tuber enlargement,
and maturation [2, 14, 15]. Mature crop often is characterized by cessation of vegetativegrowth and yellowing of leaves. The period from planting or field emergence to maturityis variable depending on the species (Table 2.45). There is currently no reliable andobjective index of yam-tuber maturity, although some crude indices have been reported
Table 2.45. Characteristics of yam species
Species (Common Name) Period from Planting to Maturity Yield and Size of Tubers
D. alata (water yam) 220–300 d 20–25 ton·ha−1; 1–3 tubers perplant; 5–10 kg per tuber
D. bulbifera (potato yam) 140–180 d; 90–120 d Aerial: 2–15 ton·ha−1 ; 3–5 ton·ha−1;underground: 2–8 ton·ha−1
D. cayenensis (yellow yam) 280–350 d 30 ton·ha−1; 2 kg per tuber (mean);7–10 kg per tuber (maximum)
D. dumentorum (bitter yam) 240–300 d Greater than those of most othercultivated West Africa yams
D. esculenta (lesser yam) 200–300 d 7–20 ton·ha−1; 25–35 ton·ha−1
(exceptional); 5–20 tubersper plant
D. opposita (Chinese yam) 24 wk 4–6 ton·ha−1
D. rotundata (white yam) 200–330 d 16–20 ton·ha−1
D. trifida (cush-cush yam) 280–330 d 15–20 ton·ha−1
Yam Storage 187
based on the percentage of tuber length that is whitish at harvest, nonfriable after cook-ing, or bitter after cooking [16]. The most frequently reported measure is the periodfrom planting to harvest (growing period), but it has been suggested that the time fromemergence to maturity provides a better measure of growing period, because plantedtuber can remain dormant for some time [17].
Most edible yams reach maturity 8 to 11 months after planting. Techniques such asusing physiologically aged planting material, presprouting of setts[16], application ofsprout-promoting substances (e.g., ethephon and 2-chloroethanol) [18, 19], and harvest-ing before complete shoot senescence can decrease the duration of field dormancy andthereby reduce the length period from emergence to maturity. Common pests are beetlesand rodents, and these can reduce yields and tuber quality significantly. In general, yamsare very resistant to fungi, but some cultivars such asD. alata are more susceptible.In many parts of the West African yam zone, mature yams are harvested at the end ofthe rainy season or in the early part of the dry season, which coincides with the end ofvegetative growth.
HarvestingHarvesting is by traditional methods of digging, which are labor-intensive. Sticks and
spades made of wood are preferred to metallic tools, as they are less likely to damagethe fragile tubers. Harvesting of aerial tubers or bulbs is usually by manual pluckingfrom the vine. Although some success in mechanical yam harvesting has been reported,especially forD. compositatubers for pharmaceutical uses [20], various noncommercialequipment is available. The use of a potato spinner has been suggested for harvestingspecies that produce a number of small tubers [17]. Successful mechanization of yamharvesting would require extensive changes in current traditional cultivation practices,including staking and mixed cropping, and possibly in tuber architecture and physicalproperties.
Yams can be harvested once (single-harvesting) or twice (double-harvesting) duringthe season to obtain a first (early) and second (late) harvest. The first harvest has also beenreferred to by the terms “topping,” “beheading,” and “milking,” all of which have beenconsidered inadequate and obsolete [16]. In single-harvesting, each plant is harvestedonce; this occurs at the end of the season when crop is mature. The harvesting processinvolves digging around the tuber to loosen it from the soil, lifting it, and cutting fromthe vine with the corm attached to the tuber. The time of harvest is critical in terms oftuber maturity, yield, and postharvest quality. Depending on the cultivar, the period fromplanting or emergence to maturity varies from about 6 to 7 months [17] or even 6 to 10months.
For double-harvesting, periods of 8 to 10 months and 4 to 5 months from planting oremergence to maturity have been recommended [1, 17]. First harvest at 5 to 6 monthsafter planting and the second 3 to 4 months later also have been reported [3]. The firstharvest is made by removing the soil around the tuber carefully and cutting the lowerportion, leaving the upper part of the tuber or the “head” to heal and continue to grow.The soil is returned and the plant is left to grow until the end of the season for the secondharvest. Some yam cultivars produce several small tubers in the second growth following
188 Root Crops
the early harvest. Double-harvesting is most applicable to short-term varieties such asD. rotundata, and toD. cayenensisandD. alata to lesser extents.
A comparison of single- and double-harvesting showed that yields were similar andplants senesce at about the same time. However, single-harvested tubers had better eatingquality than the double-harvested tubers. More detailed comparison can be found in ref.[17].
Tuber YieldThe average yield of tubers is variable among the major producing areas (see Tables
2.41 and 2.42). Yield also depends on the species (see Table 2.43), seed piece, andgrowing environment; it ranges from 8 to 50 ton·ha−1 in 6 to 10 months. Yields of8 to 30 ton·ha−1 in commercial yam production also have been reported, the exactvalue depending on the location, variety, and cultivation practices [17]. In Nigeria, yamtuber yields varied with ecology, ranging from 10 ton·ha−1 in Onitsha (forest zone)and Abakaliki (derived savanna) to 40 ton·ha−1 in Zaki-Biam (Guinea savanna) fromplanting densities of 2500, 2700, and 12,000 stands per hectare, respectively [11]. Manyyam cultivars produce only a single large tuber, and the approximate multiplication ratio(fresh-weight yield to weight of planting material) for the yam is 5. Between 1975 and1990, there were yield increases in all major producing countries except Ghana. Duringthis period, the average world yield increased by nearly 11%.
2.5.3 Postharvest Handling, Curing, and Packaging
Yams are fragile and susceptible to physical damage during harvesting and postharvesthandling. Injury can lead to infection by rotting organisms and loss during subsequentstorage. Injury also accelerates the respiration rate of tubers, which may lead to rapidweight loss and development of shrivel. Physical damage of yam tubers can be classifiedas follows [21]:
Digger cuts: the digger point cutting the tuber in two partsBreak-off injuries: the breaking off of rounded protuberances at the tail
(distal) end or on the surface of the tubersSerious bruises: bruises that cause the skin to peel off over more than 20%
of the tuber surface; may be caused by the tubers being stepped on duringharvesting
Small bruises: surface thumbnail cracks, less than 1.2 cm long, that do notremove the flesh of the tuber
Packaging tubers in full-telescopic fiberboard cartons with paper wrapping or ex-celsior reduces bruising during postharvest handling.Tubers can be contained in loosepacks, or units of 11 kg and 23 kg [22]. For transportation, the cartons are hand-loadedor unitized on pallets.
Curing allows suberization of surface injuries and reduces weight loss and rotting inroot crops. Postharvest curing of yams is recommend before storage of tubers so as to“heal” any physical injury that may have occurred during harvesting and handling. Curingcan be accomplished under tropical ambient conditions or in a controlled environment.Traditionally, yams are cured by drying the tubers in the sun for a few days. The optimum
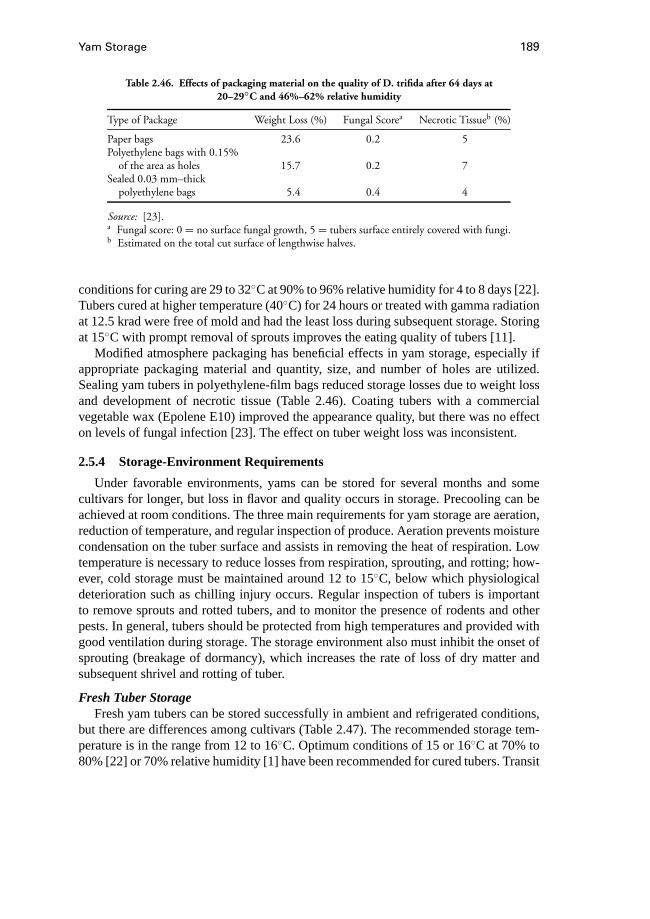
Yam Storage 189
Table 2.46. Effects of packaging material on the quality of D. trifida after 64 days at20–29◦C and 46%–62% relative humidity
Type of Package Weight Loss (%) Fungal Scorea Necrotic Tissueb (%)
Paper bags 23.6 0.2 5Polyethylene bags with 0.15%
of the area as holes 15.7 0.2 7Sealed 0.03 mm–thick
polyethylene bags 5.4 0.4 4
Source: [23].a Fungal score: 0 = no surface fungal growth, 5 = tubers surface entirely covered with fungi.b Estimated on the total cut surface of lengthwise halves.
conditions for curing are 29 to 32◦C at 90% to 96% relative humidity for 4 to 8 days [22].Tubers cured at higher temperature (40◦C) for 24 hours or treated with gamma radiationat 12.5 krad were free of mold and had the least loss during subsequent storage. Storingat 15◦C with prompt removal of sprouts improves the eating quality of tubers [11].
Modified atmosphere packaging has beneficial effects in yam storage, especially ifappropriate packaging material and quantity, size, and number of holes are utilized.Sealing yam tubers in polyethylene-film bags reduced storage losses due to weight lossand development of necrotic tissue (Table 2.46). Coating tubers with a commercialvegetable wax (Epolene E10) improved the appearance quality, but there was no effecton levels of fungal infection [23]. The effect on tuber weight loss was inconsistent.
2.5.4 Storage-Environment Requirements
Under favorable environments, yams can be stored for several months and somecultivars for longer, but loss in flavor and quality occurs in storage. Precooling can beachieved at room conditions. The three main requirements for yam storage are aeration,reduction of temperature, and regular inspection of produce. Aeration prevents moisturecondensation on the tuber surface and assists in removing the heat of respiration. Lowtemperature is necessary to reduce losses from respiration, sprouting, and rotting; how-ever, cold storage must be maintained around 12 to 15◦C, below which physiologicaldeterioration such as chilling injury occurs. Regular inspection of tubers is importantto remove sprouts and rotted tubers, and to monitor the presence of rodents and otherpests. In general, tubers should be protected from high temperatures and provided withgood ventilation during storage. The storage environment also must inhibit the onset ofsprouting (breakage of dormancy), which increases the rate of loss of dry matter andsubsequent shrivel and rotting of tuber.
Fresh Tuber StorageFresh yam tubers can be stored successfully in ambient and refrigerated conditions,
but there are differences among cultivars (Table 2.47). The recommended storage tem-perature is in the range from 12 to 16◦C. Optimum conditions of 15 or 16◦C at 70% to80% [22] or 70% relative humidity [1] have been recommended for cured tubers. Transit
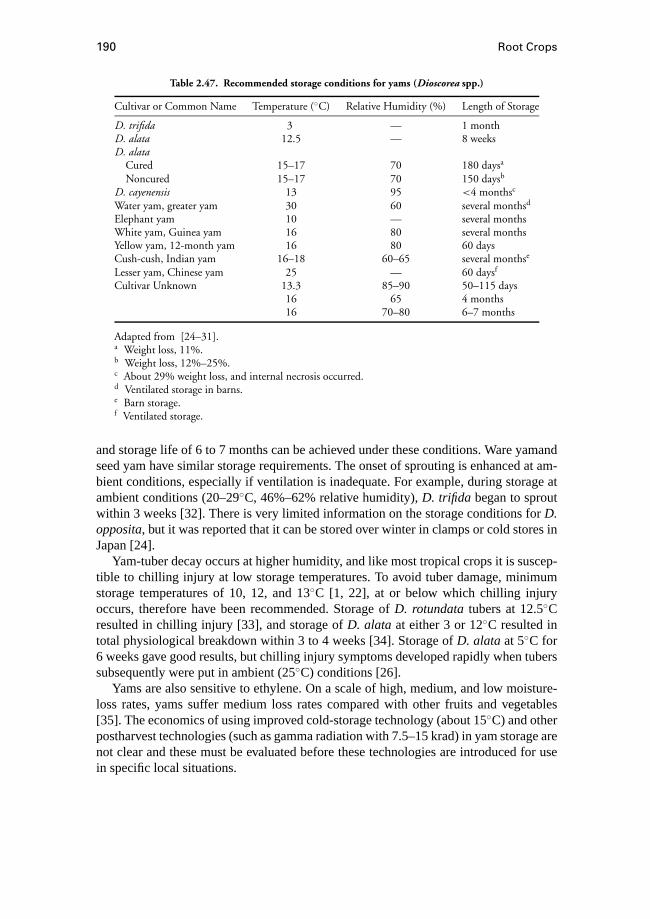
190 Root Crops
Table 2.47. Recommended storage conditions for yams (Dioscorea spp.)
Cultivar or Common Name Temperature (◦C) Relative Humidity (%) Length of Storage
D. trifida 3 — 1 monthD. alata 12.5 — 8 weeksD. alata
Cured 15–17 70 180 daysa
Noncured 15–17 70 150 daysb
D. cayenensis 13 95 <4 monthsc
Water yam, greater yam 30 60 several monthsd
Elephant yam 10 — several monthsWhite yam, Guinea yam 16 80 several monthsYellow yam, 12-month yam 16 80 60 daysCush-cush, Indian yam 16–18 60–65 several monthse
Lesser yam, Chinese yam 25 — 60 daysf
Cultivar Unknown 13.3 85–90 50–115 days16 65 4 months16 70–80 6–7 months
Adapted from [24–31].a Weight loss, 11%.b Weight loss, 12%–25%.c About 29% weight loss, and internal necrosis occurred.d Ventilated storage in barns.e Barn storage.f Ventilated storage.
and storage life of 6 to 7 months can be achieved under these conditions. Ware yamandseed yam have similar storage requirements. The onset of sprouting is enhanced at am-bient conditions, especially if ventilation is inadequate. For example, during storage atambient conditions (20–29◦C, 46%–62% relative humidity),D. trifida began to sproutwithin 3 weeks [32]. There is very limited information on the storage conditions forD.opposita, but it was reported that it can be stored over winter in clamps or cold stores inJapan [24].
Yam-tuber decay occurs at higher humidity, and like most tropical crops it is suscep-tible to chilling injury at low storage temperatures. To avoid tuber damage, minimumstorage temperatures of 10, 12, and 13◦C [1, 22], at or below which chilling injuryoccurs, therefore have been recommended. Storage ofD. rotundatatubers at 12.5◦Cresulted in chilling injury [33], and storage ofD. alata at either 3 or 12◦C resulted intotal physiological breakdown within 3 to 4 weeks [34]. Storage ofD. alataat 5◦C for6 weeks gave good results, but chilling injury symptoms developed rapidly when tuberssubsequently were put in ambient (25◦C) conditions [26].
Yams are also sensitive to ethylene. On a scale of high, medium, and low moisture-loss rates, yams suffer medium loss rates compared with other fruits and vegetables[35]. The economics of using improved cold-storage technology (about 15◦C) and otherpostharvest technologies (such as gamma radiation with 7.5–15 krad) in yam storage arenot clear and these must be evaluated before these technologies are introduced for usein specific local situations.
Yam Storage 191
Controlled-Atmosphere StorageNo significant beneficial effects of controlled atmospheres on commercial yam storage
has been demonstrated. In general, controlled-atmosphere storage has minimal effect onyam storage [28]; however, fully matureD. oppositatubers can be stored for long periodsof time at high O2 tensions or at 5◦C. These conditions reduced the incidence of tuberbrowning [36].
Storage of Processed Yam ProductsProcessed yam products such as dried chips, biscuits, and flour generally are not
stored for long periods. A variety of packages is used for storage including baskets,gunny bags, polyethylene bags, polyethylene-lined jute bags, and basins made of plasticor metal. Packaging can occur before or after storage in room conditions or in silos.It is important to exclude moisture, insects (mostlyAraecerus fasciculatusDe G. andSitophiilus zeamaysMots), and rodents. If the same packaging is used for other products,fumigation with phostoxin by placing the tablets on or in the bags and covering with agas-proof sheet is recommended.
2.5.5 Tuber Dormancy in Storage
Dormancy is the temporary suspension of visible growth of any plant structure con-taining a meristem [37]. In stored yam tubers, this refers to the period during whichsprouting is inhibited. The end of dormancy thus is marked by the onset of sprouting.Knowledge of the potential length of dormancy for stored tuber is important becauseonce dormancy breaks, the tubers also senesce rapidly, with loss of the stored foodcarbohydrate [38]. Yam tuber does not sprout during the early part of storage, evenunder suitable growth conditions. The environmental conditions affecting yam-tuberdormancy are photoperiod, white and colored lights, temperature, relative humidity, andpartial oxygen pressure [39].
The length of tuber dormancy is endogenously controlled, and conditions such asavailability of soil moisture [40] or cool temperature [10] are ineffective triggers ofsprouting. Physiological age of tubers affects their readiness to sprout, but by approx-imately 6 months after harvesting, dormancy disappears completely and budless settsplanted after that period will require nearly the same time to sprout [41]. The length ofthe dormant period depends on the yam species (Table 2.48).
2.5.6 Storage Disorders and Diseases
SproutingSprouting marks the breakage of dormancy in yams. Sprouts are initiated in a meris-
tematic region about 1 cm from the edge of the tuber. Different stages occur during theinternal formation of the sprout (Fig. 2.55) and the external development (Fig. 2.56)[2, 16, 17]. During storage, one or more buds may develop from the head region ofyam tuber. Although the mechanism in the yam tuber is not clear, dormancy has beenassociated with low levels of glutathione in the tuber [40], and batatasins may play a role

192 Root Crops
Table 2.48. Length of dormancy of tubers ofmajor edible yam species
Period ofLocality Dormancy (wk)
D. alata Caribbean 14–16Nigeria 14–16
D. bulbifera Nigeria 19–20D. cayenensis Nigeria 4–8D. dumetorum Nigeria 14–16D. esculenta Caribbean 4–8
Nigeria 12–18D. rotundata Nigeria 12–14
14–16D. trifida Caribbean 2–4
Adapted from [26, 40, 42–44].
Figure 2.55. Progressive stages in sprout formation in D. rotundata. C, Cork layer; M, layer ofmeristematic cells; P, parenchyma cells with only small amount of stored starch; SP, storageparenchyma with stored starch and constituting the bulk of the tuber; V, vascular bundles.
(Source: [45])

Yam Storage 193
Figure 2.56. Stages in the sprouting of Dioscoreatuber. a, Normal tuber piece before planting;
b, formation of sprouting locus; c, appearance ofdifferentiated shoot buds; d, enlargement of the shoot
bud and development of roots. (Source: [45])
[46]. However, sprouting is dependent on the time of harvest and storage temperature.Tubers sprout rapidly at ambient temperatures (25–30◦C) and high relative humid-ity once dormancy is broken. Sprouting is a major of source of dry-matter loss. Rootletformation requires high humidity to occur. Sprouting can be a problem in storage, but thesprouts can be rubbed off during inspection of tubers. Sprout formation is considerablydelayed at 35 or 15◦C. Thus, leaving unharvested or planted tubers in the soil may exposethem to supraoptimal temperatures, which may inhibit sprouting or retard their sproutingin many tropical areas in which soil temperatures exceed 35◦C for several hours nearlyevery day [17].
Irradiation of yam tubers with gamma rays has been used successfully in yam storageto control sprouting. The optimal dose for sprout inhibition varies with yam species, but7.5 krad appears to the critical dose [47]. The higher the dose, the lower the percentage ofrotting up to 15.0 krad, beyond which the percentage of rotting increases. In a trial witheight cultivars ofD. rotundata, irradiation between 5 and 20 krad caused 50% reductionin weight loss in comparison with controls [48, 49]. To achieve complete suppressionof the nematode population in infected yam tubers, a dose of 30 krad was required[50]. It has been postulated that the inhibition of sprouting in irradiated yams is due tointerference with nucleic acid metabolism in the meristem tissue [39].
Control of Diseases and PestsYams are susceptible to preharvest attack by the yam beetle and microorganisms such
as nematodes and yam virus. The major postharvest disease is tuber rot, caused mostlyby fungi. The types of diseases and pests and their control measures are summarized inTable 2.49. Fumigation is with methyl bromide, but practitioners should note that the usesuch chemicals in agriculture and food processes is now prohibited or strictly regulatedin many countries and regions. Rodents can be controlled by fencing, poisoning, and

194 Root Crops
Table 2.49. Pests and diseases in yams
Common Name Organism Incidence and Characteristics Control Strategy
Yam beetle Heteroligus meles A major pest in West Africa; Dusting of the sets withadults migrate by flying to insecticide beforeother farms/plots; they planting (note that somefeed on the tuber, insecticides can bethereby leaving holes persistent and harmfulon them; tubers loss to the environment);appearance quality and very late plantingbecome prone to can reduce infestationrotting during storage but affect yields
Chrysomelid Lilioceris livida Removal of lavae by handbeetle or spraying carbaryl
Scales Aspidiella hartii Removal of pests witha brush andtreatment with diazinonplus white oil ormalathion prior toplanting
Mealy bugs Planococcus citri Use of clean stockYam anthracnose Fungi such as Occurs in all yam-producing Use of resistant cultivar
Colletotrichum and areas; infection from (e.g., TDA 291,Glomerella ingulata inoculum borne within TDA 297), maneb orimplicated. the planting set or in; benomyl, and good
the soil results in field sanitationblackening and die-backof the leaves and shoot
Nematodes Yam nematode They reside in the tuber Crop rotation and(Scutellonema bradys) and remain active fallowing, and plantingand the root knot during storage; wounded with healthy materials;nematode areas provide entry for soil fumigation with(Meloidogyne spp.) decay-causing bacterial nematicides may beare the most serious and fungi uneconomical
Yam virus Occurs throughout the Use of virus-free plantingcomplex West African yam zone; materials or resistant
reduces yields cultivars; thermotherapyconsiderably and meristem culture
Tuber rots Soft rots caused by Infection in the Planting with disease-freePenicillium spp., field can lead persist material; crop rotation;Fusariu oxysporum, and to rotting during minimizing of physicaland Botrydiplodia storage damage to tuber duringtheobromae; dry rots postharvest operations;caused by Rosselinia treating of the set orand Sphaerostilbe tuber with systemic
fungicide or alkalinematerial such as
Bordeaux mixture;adequate aeration andregular inspection ofstored tuber
Adapted from [1, 17, 51].

Yam Storage 195
Figure 2.57. Traditional “yam house.”
trap setting. There are extensive reviews in the literature on yam pests and diseases andtheir control measures [10, 17, 25, 39].
2.5.7 Types of Storage Structures
Traditional SheltersLeaving the tubers in the ground until harvest is required is the simplest storage
technique practiced by some rural farmers. This underground, on-farm storage, however,prevents the use of the farmland for further cropping. In some parts of West Africa andOceania, individual tubers are suspended from a horizontal pole supported about 1 to2 m above the ground by two forked sticks. Harvested yams also can be put in ashes andcovered with soil, with or without grass mulch as shelter. “Yam houses” frequently arefound in many yam-growing regions. These have thatched roofs and wooden floors, andthe walls sometimes are made simply out of bamboo (Fig. 2.57).
The yam barn is the principal traditional yam storage structure in the major producingareas. Barns usually are located in shaded areas and constructed so as to facilitate adequateventilation while protecting tubers from flooding and insect attack. There are severaldesigns, but they all consist of a vertical wooden framework to which the tubers areindividually attached. Most barns are constructed in a shaded enclosure to protect tubersfrom direct sunlight (Fig. 2.58). In a typical yam barn, galvanized iron was used to protectthe structure against rats which were considered a major problem during tuber storage(Fig. 2.59).

196 Root Crops
Figure 2.58. Inside view of a yam barn.(Source: [52])
Figure 2.59. Protection of a shaded yam barn against rats.(Source: [52])

Yam Storage 197
Two tubers are tied to a rope at each end hung on horizontal poles 1 to 2 m high.Barns up to 4 m high are also not uncommon. Depending on the quantity of tuber tobe stored, frames can be 2 m or more in length. The ropes are usually fibrous, but insoutheastern Nigeria they are made from the raffia obtained from top part of the palmwine tree. Many farmers have permanent barns that need annual maintenance during theyear’s harvest. In these situations, the verticals posts often are made from growing trees,which are trimmed periodically. Palm fronds and other materials are used to provideshade. The vegetative growth on the vertical trees also shades the tubers from excessivesolar heat and rain. The use of open-sided shelves made from live poles, bamboo poles,or sawn wood has been recommended to enable careful handling and easy inspectionin comparison with tying tubers to poles, which can cause physical damage and rotting[7]. In barn storage, yams have a maximum storage life of 6 months, and therefore barnstorage is most suited for long-term varieties. Storage losses can be high (10%–15%in 3 months, and 30%–50% after 6 months) if tubers are not treated for rotting usingfungicides such as Benlate, Captan, or Thiabendazole.
Another traditional storage involves stacking yams in small heaps in crevices of rockoutcrops or large trees near the house or in the farm. Similarly, they can be heaped inloose bulk on the floor. Yams also are stored in raised platforms or on shelves in shedsor huts used for other purposes, such as maize cribs, or specially constructed for yamstorage. Such stores usually are located in the shade of large trees, and the yams arestacked up to the top. This type of structure entails considerable handling of the tubersand therefore is suited for the varieties more resistant to physical injury. In some regionssuch as the South Pacific, such raised platforms contain only one or two layers of yamsto ensure that adequate aeration is provided and that inspection can be carried out easily.Leaves and similar materials are placed on top of the tubers to shade them.
Underground structures such as pits, ditches, and clamps also are used for yam storagefor limited periods, especially the early varieties, which often are harvested before theend of the rainy season. During construction of pits, the earth dug out is used to build alow wall around the edge. The temperature in the storage space also can be moderatedby placing cut vegetation over the ditch, clamp, or pit. In these structures, ventilationand rodent attack of tubers is a major problem, and it is difficult to inspect the tubers.These factors have limited the use of underground pits and clamps on a commercialscale.
Improved Traditional SheltersImproved storage structures for yams often are well ventilated, weatherproof, and
stronger than traditional shelters. Additional features also may be provided to excludepests and rodents. A typical improved yam barn has side walls 1.2 m high and wiremesh to ward off rodents and birds [11]. The roof is double-thatched and extended tothe eaves with a smooth floor of cement or mud, and only one entry door provided toguard against entry of rodents. Tubers are stored on platforms or shelves. Tubers storedin such improved structures had only 10% spoilage after 5 to 6 months.
An improved pit storage structure has been developed for holding up to 150 tu-bers [53]. The design (Fig. 2.60) enables low temperatures and high humidities tobe maintained, which results in low storage loss and delayed sprouting of tubers. A

198 Root Crops
Figure 2.60. Experimental pit structure for yam storage. (Source: [53])
Yam Storage 199
large-scale airtight yam house capable of holding 10,000 tubers suitable for rural areasin developing countries has been reported [54]. The room was aerated intermittently toimpose an anaerobic environment on the tubers. Tubers were arranged on three-layeredwooden racks, and after 5 months in storage both weight loss and microbial decay wereminimal.
Refrigerated StoresRefrigerated stores provide low-temperature and medium- to high-humidity envi-
ronments for storage. The equipment capacity should be matched with the maximumheat load in the store. Construction materials must be selected to minimize heat gainthrough the building envelope into the store. Environment-monitoring equipment shouldbe installed to ensure that tuber temperature does not fall below 12 to 15◦C to pre-vent cold-temperature injury. In the design of structural components for yam storage,it also is important to consider equipment and duct work for ventilation and the needfor movement of handling equipment for filling and emptying the store. Although theenvironmental regimes for cold storage of yams have been established, the use of re-frigerated storage is very limited. Consequently, there is very limited information on thedesign and construction of refrigerated cool-store facilities for yams.
2.5.8 Agroprocessing of Yam
Yams usually are marketed as fresh produce. However, tubers also are processed intoseveral food products that are relished in many parts of the tropics. In general, commonmethods of preparation are boiling, baking, and frying. Boiled and baked yam can beeaten with vegetable sauce or red palm oil. Boiled yam also can be pounded or mashedin mortar and eaten as fufu or utara. Equipment for automatic boiling and mashing ofyam into fufu now is available commercially.
Yam cultivars that contain toxic substances such as dioscorene are first sliced andsoaked in salt water for several hours before further processing for consumption. Thesetoxic species are used to make toxic bait for fishing and hunting. Industrial processingand utilization of yam includes starch, poultry and livestock feed, and production of yamflour.
Yam flake is one of the common industrial food products of yam (Fig. 2.61). Exten-sive information on yam-processing methods, equipment, and packaging techniques areavailable in the literature [7]. Residues from sifting as well as peels represent losses inthe energy value of tuber, but they can be used as animal feed. Nutrient losses in yamproducts obtained from processing can be high, particularly in minerals and vitamins. Inproducts obtained from secondary processing such as biscuits and fufu, the amount ofloss depends principally on the amount of edible surface exposed during processing op-erations. Primary operations such as milling affect the thiamine and riboflavin contentsof D. rotundata, with average losses of 22% and 37%, respectively. Sun drying resultsin high losses of B vitamins with little change in mineral content. Pounding yam flour ina traditional wooden mortar or grinding in an electric mixer has similar effects. Lossesduring culinary preparation of peeled yam can amount to 10% to 15% [7].
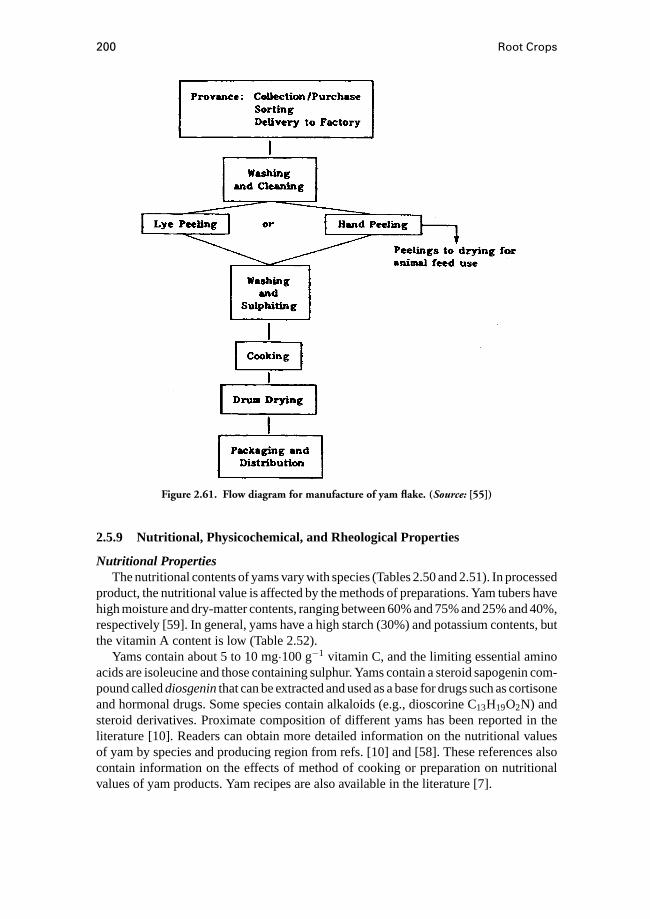
200 Root Crops
Figure 2.61. Flow diagram for manufacture of yam flake. (Source: [55])
2.5.9 Nutritional, Physicochemical, and Rheological Properties
Nutritional PropertiesThe nutritional contents of yams vary with species (Tables 2.50 and 2.51). In processed
product, the nutritional value is affected by the methods of preparations. Yam tubers havehigh moisture and dry-matter contents, ranging between 60% and 75% and 25% and 40%,respectively [59]. In general, yams have a high starch (30%) and potassium contents, butthe vitamin A content is low (Table 2.52).
Yams contain about 5 to 10 mg·100 g−1 vitamin C, and the limiting essential aminoacids are isoleucine and those containing sulphur. Yams contain a steroid sapogenin com-pound calleddiosgeninthat can be extracted and used as a base for drugs such as cortisoneand hormonal drugs. Some species contain alkaloids (e.g., dioscorine C13H19O2N) andsteroid derivatives. Proximate composition of different yams has been reported in theliterature [10]. Readers can obtain more detailed information on the nutritional valuesof yam by species and producing region from refs. [10] and [58]. These references alsocontain information on the effects of method of cooking or preparation on nutritionalvalues of yam products. Yam recipes are also available in the literature [7].

Yam Storage 201
Table 2.50. Summary of proximate analyses of yam tubers
MoistureContent Carbohydrate Fat Crude Protein Crude Fibre Ash
Species (%) (%) (%) (%) (%) (%)
D. alata(water yam) 65–73 22–29 0.03–0.27 1.12–2.78 0.65–1.40 0.67–2.06
D. cayenensis(yellow yam) 83 15 0.05 1.02 0.40 0.53
D. rotundata(white yam) 58–73 23 0.12 1.09–1.99 0.35–0.79 0.68–2.56
D. opposita 70–80 16–29 0.06–1.10 1.11–3.10 0.33–1.00 0.69–1.10D. esculenta
(lesser yam) 67–81 17–25 0.04–0.29 1.29–1.87 0.18–1.51 0.50–1.24D. bulbifera
(potato yam) 63–67 27–33 0.04 1.12–1.50 0.70–0.73 1.08–1.51D. dumentorum
(bitter yam) 79 17 0.28 2.78 0.30 0.72D. hispida 78 18 0.16 1.81 0.93 0.69D. trifida
(cush-cush yam) — 38 0.44 2.54 — —
Source: [10].
Physicochemical PropertiesTuber size and shape are variable depending on the species, and both genetic and
environmental factors have considerable effects. Tuber size can range from a few cen-timeters and grams, to 2 to 3 m and over 50 kg. The tubers of most important cultivars arecylindrical in shape, with some roots and growth cracks present; however, some cultivarshave an enlarged middle section (Fig. 2.62). The gross morphology of mature tuber in-cludes several layers of cork tissue produced from successive cork cambia forming onebeneath another, with the cork cells arranged radially in rows. A ring of meristematiccells, made up of several layers of tangentially elongated, thin-walled cells, lies beneaththe cortex (see Fig. 2.26). The parenchyma cells surrounding the vascular bundles con-tain most of the starch grains (rounded or elliptical). Yams also contain tannin cells, andcells containing bundles of crystals (raphids) also are present. It is widely believed thatthese crystals are responsible for the itchiness of raw yam tuber and some other rootcrops when eaten or placed in contact with the skin.
Yam tuber contains about 10% to 20% carbohydrate on a fresh-weight basis, withamylopectin as the main constituent of yam starch [39]. Amylose accounts for 10% to28% of the starch and influences the starch properties considerably. The iodine bindingcapacity values of yam starch are directly related to the amylose content (Table 2.53).
Respiration RatesRespiration rate is a good indicator of metabolic activity in tissue and therefore
provides a useful guide to potential storage life. It usually is measured by the rate ofO2 depletion or the rate of CO2 evolution. Tuber age, degree of physical damage, andspoilage by microorganisms affect the rate of respiration. Yams respire actively at harvestand during sprouting. Respiratory activity is minimal during the period of dormancy

Tabl
e2.
51.
Nut
rien
tco
nten
tof
yam
spec
ies
per
100-
ged
ible
tube
rpo
rtio
ns
D.a
lata
D.b
ulbi
fera
D.c
ayen
ensis
D.d
umen
toru
mD
.esc
ulen
taD
.rot
unda
taD
.tri
fida
Dio
scor
easp
p.(W
ater
Yam
)(P
otat
oYa
m)
(Yel
low
Yam
)(B
itte
rYa
m)
(Les
ser
Yam
)(W
hite
Yam
)(C
ush-
Cus
hYa
m)
Wat
er(m
L)69
6571
8067
7080
80.7
76a
79b
74a
Cal
orie
s11
913
511
271
124
112
7187
7810
2Pr
otei
n(g
)1.
92.
31.
51.
53.
23.
51.
51.
91.
41.
52.
54Fa
t(g)
0.2
0.1
0.1
0.1
0.1
0.1
0.1
0.2
0.2
0.2
0.44
Car
bohy
drat
e(g
)27
.831
2616
2825
1620
1824
38Fi
ber
(g)
0.8
1.5
0.9
0.6
0.8
0.5
0.6
0.6
1.2
0.6
Cal
cium
(mg)
5228
6936
5262
368
3840
12Ph
osph
orou
s(m
g)61
5229
1745
5317
3828
5835
Iron
(mg)
0.8
165.
25.
20.
521.
12.
00.
8V
itam
ins
β-c
arot
ene
equi
vale
nt(µ
g)10
10 5T
hiam
ine
(mg)
0.11
0.05
0.10
0.10
Rib
oflav
in(m
g)0.
020.
030.
040.
01N
iaci
n(m
g)0.
30.
50.
50.
8A
scor
bic
acid
(mg)
612 6
15
Ada
pted
from
[24,
56–5
8].
aTw
ova
lues
repo
rted
.b
Bul
bilo
rae
rial
tube
r.
202
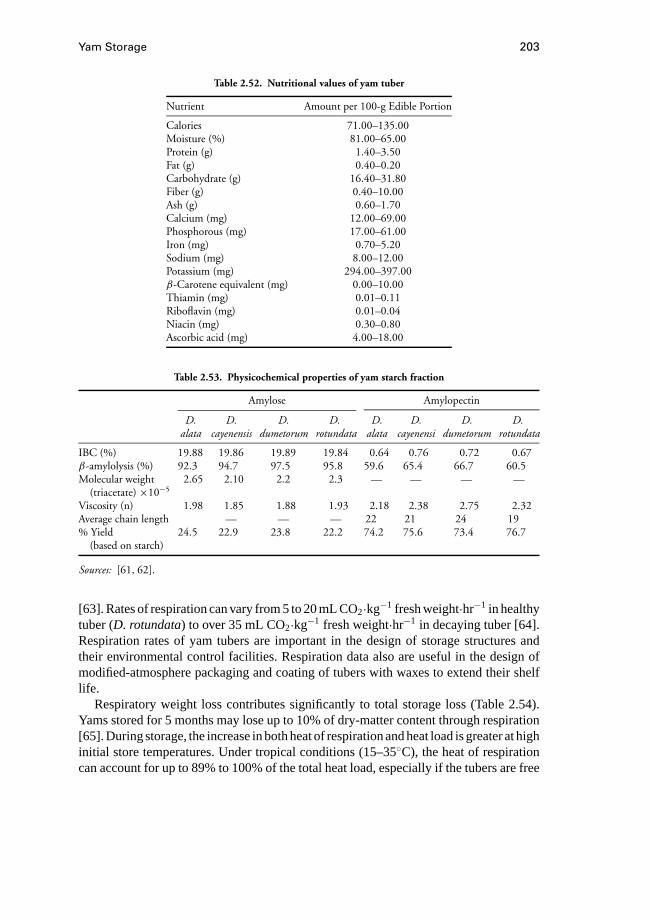
Yam Storage 203
Table 2.52. Nutritional values of yam tuber
Nutrient Amount per 100-g Edible Portion
Calories 71.00–135.00Moisture (%) 81.00–65.00Protein (g) 1.40–3.50Fat (g) 0.40–0.20Carbohydrate (g) 16.40–31.80Fiber (g) 0.40–10.00Ash (g) 0.60–1.70Calcium (mg) 12.00–69.00Phosphorous (mg) 17.00–61.00Iron (mg) 0.70–5.20Sodium (mg) 8.00–12.00Potassium (mg) 294.00–397.00β-Carotene equivalent (mg) 0.00–10.00Thiamin (mg) 0.01–0.11Riboflavin (mg) 0.01–0.04Niacin (mg) 0.30–0.80Ascorbic acid (mg) 4.00–18.00
Table 2.53. Physicochemical properties of yam starch fraction
Amylose Amylopectin
D. D. D. D. D. D. D. D.alata cayenensis dumetorum rotundata alata cayenensi dumetorum rotundata
IBC (%) 19.88 19.86 19.89 19.84 0.64 0.76 0.72 0.67β-amylolysis (%) 92.3 94.7 97.5 95.8 59.6 65.4 66.7 60.5Molecular weight 2.65 2.10 2.2 2.3 — — — —
(triacetate) ×10−5
Viscosity (n) 1.98 1.85 1.88 1.93 2.18 2.38 2.75 2.32Average chain length — — — 22 21 24 19% Yield 24.5 22.9 23.8 22.2 74.2 75.6 73.4 76.7
(based on starch)
Sources: [61, 62].
[63]. Rates of respiration can vary from 5 to 20 mL CO2·kg−1 fresh weight·hr−1 in healthytuber (D. rotundata) to over 35 mL CO2·kg−1 fresh weight·hr−1 in decaying tuber [64].Respiration rates of yam tubers are important in the design of storage structures andtheir environmental control facilities. Respiration data also are useful in the design ofmodified-atmosphere packaging and coating of tubers with waxes to extend their shelflife.
Respiratory weight loss contributes significantly to total storage loss (Table 2.54).Yams stored for 5 months may lose up to 10% of dry-matter content through respiration[65]. During storage, the increase in both heat of respiration and heat load is greater at highinitial store temperatures. Under tropical conditions (15–35◦C), the heat of respirationcan account for up to 89% to 100% of the total heat load, especially if the tubers are free

204 Root Crops
Figure 2.62. Morphology and anatomy of yam tuber. I, fifth month; II, ninth month.(Sources: [2, 17, 60])
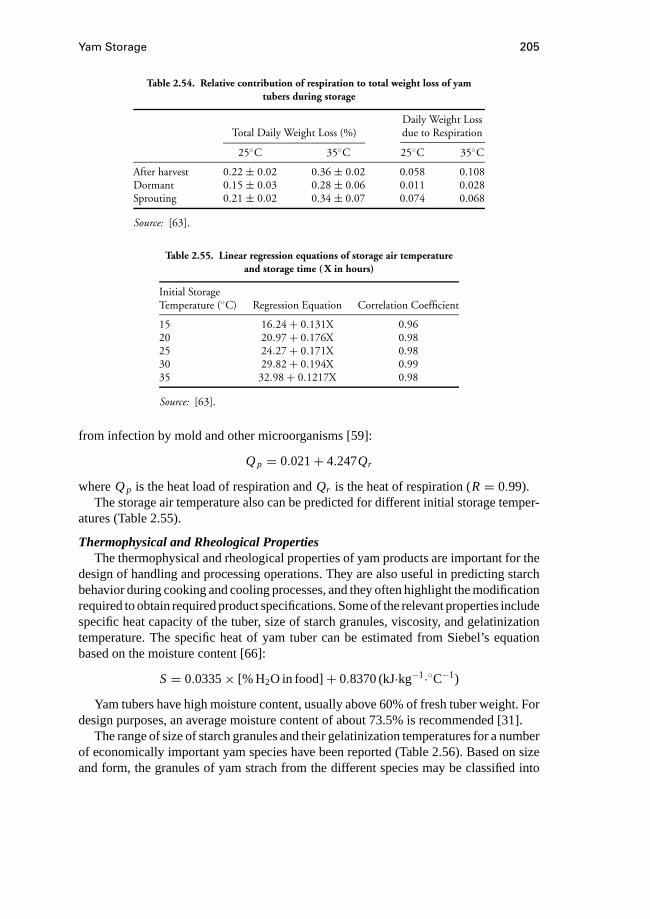
Yam Storage 205
Table 2.54. Relative contribution of respiration to total weight loss of yamtubers during storage
Daily Weight LossTotal Daily Weight Loss (%) due to Respiration
25◦C 35◦C 25◦C 35◦C
After harvest 0.22 ± 0.02 0.36 ± 0.02 0.058 0.108Dormant 0.15 ± 0.03 0.28 ± 0.06 0.011 0.028Sprouting 0.21 ± 0.02 0.34 ± 0.07 0.074 0.068
Source: [63].
Table 2.55. Linear regression equations of storage air temperatureand storage time ( X in hours)
Initial StorageTemperature (◦C) Regression Equation Correlation Coefficient
15 16.24+ 0.131X 0.9620 20.97+ 0.176X 0.9825 24.27+ 0.171X 0.9830 29.82+ 0.194X 0.9935 32.98+ 0.1217X 0.98
Source: [63].
from infection by mold and other microorganisms [59]:
Qp = 0.021+ 4.247Qr
whereQp is the heat load of respiration andQr is the heat of respiration (R= 0.99).The storage air temperature also can be predicted for different initial storage temper-
atures (Table 2.55).
Thermophysical and Rheological PropertiesThe thermophysical and rheological properties of yam products are important for the
design of handling and processing operations. They are also useful in predicting starchbehavior during cooking and cooling processes, and they often highlight the modificationrequired to obtain required product specifications. Some of the relevant properties includespecific heat capacity of the tuber, size of starch granules, viscosity, and gelatinizationtemperature. The specific heat of yam tuber can be estimated from Siebel’s equationbased on the moisture content [66]:
S= 0.0335× [% H2O in food]+ 0.8370 (kJ·kg−1·◦C−1)
Yam tubers have high moisture content, usually above 60% of fresh tuber weight. Fordesign purposes, an average moisture content of about 73.5% is recommended [31].
The range of size of starch granules and their gelatinization temperatures for a numberof economically important yam species have been reported (Table 2.56). Based on sizeand form, the granules of yam strach from the different species may be classified into
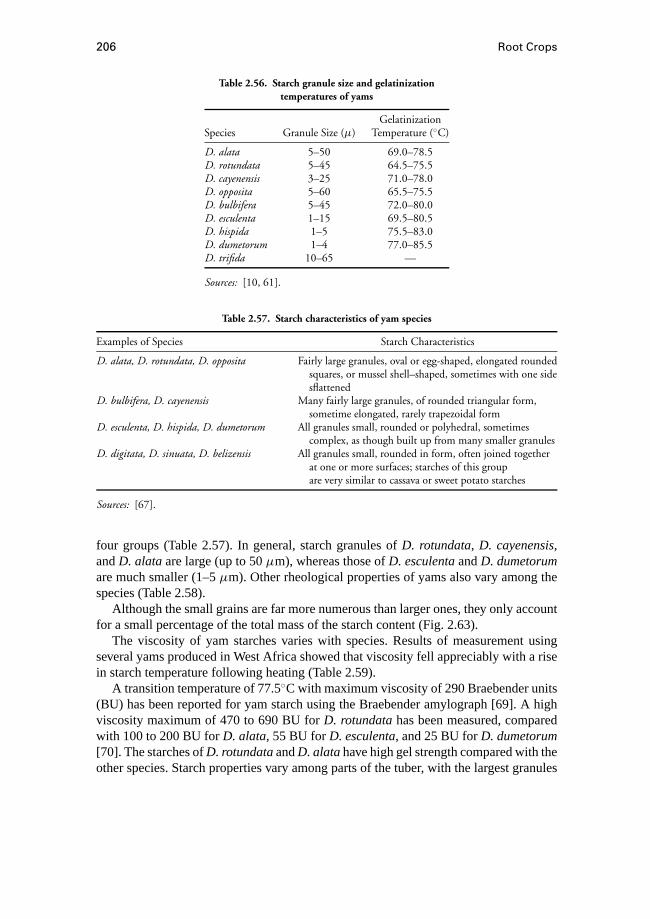
206 Root Crops
Table 2.56. Starch granule size and gelatinizationtemperatures of yams
GelatinizationSpecies Granule Size (µ) Temperature (◦C)
D. alata 5–50 69.0–78.5D. rotundata 5–45 64.5–75.5D. cayenensis 3–25 71.0–78.0D. opposita 5–60 65.5–75.5D. bulbifera 5–45 72.0–80.0D. esculenta 1–15 69.5–80.5D. hispida 1–5 75.5–83.0D. dumetorum 1–4 77.0–85.5D. trifida 10–65 —
Sources: [10, 61].
Table 2.57. Starch characteristics of yam species
Examples of Species Starch Characteristics
D. alata, D. rotundata, D. opposita Fairly large granules, oval or egg-shaped, elongated roundedsquares, or mussel shell–shaped, sometimes with one sidesflattened
D. bulbifera, D. cayenensis Many fairly large granules, of rounded triangular form,sometime elongated, rarely trapezoidal form
D. esculenta, D. hispida, D. dumetorum All granules small, rounded or polyhedral, sometimescomplex, as though built up from many smaller granules
D. digitata, D. sinuata, D. belizensis All granules small, rounded in form, often joined togetherat one or more surfaces; starches of this groupare very similar to cassava or sweet potato starches
Sources: [67].
four groups (Table 2.57). In general, starch granules ofD. rotundata, D. cayenensis,andD. alataare large (up to 50µm), whereas those ofD. esculentaandD. dumetorumare much smaller (1–5µm). Other rheological properties of yams also vary among thespecies (Table 2.58).
Although the small grains are far more numerous than larger ones, they only accountfor a small percentage of the total mass of the starch content (Fig. 2.63).
The viscosity of yam starches varies with species. Results of measurement usingseveral yams produced in West Africa showed that viscosity fell appreciably with a risein starch temperature following heating (Table 2.59).
A transition temperature of 77.5◦C with maximum viscosity of 290 Braebender units(BU) has been reported for yam starch using the Braebender amylograph [69]. A highviscosity maximum of 470 to 690 BU forD. rotundatahas been measured, comparedwith 100 to 200 BU forD. alata, 55 BU forD. esculenta, and 25 BU forD. dumetorum[70]. The starches ofD. rotundataandD. alatahave high gel strength compared with theother species. Starch properties vary among parts of the tuber, with the largest granules
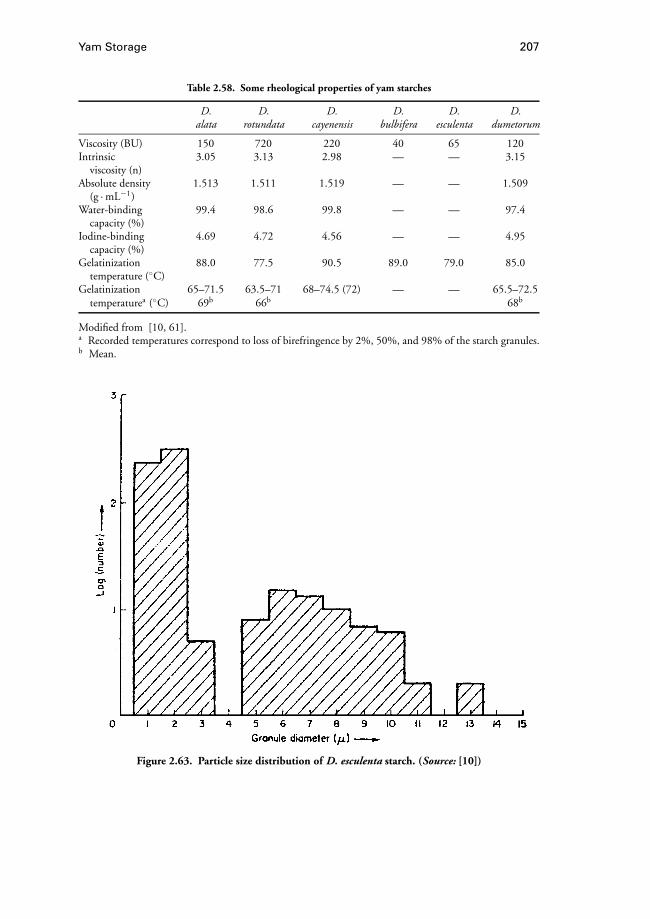
Yam Storage 207
Table 2.58. Some rheological properties of yam starches
D. D. D. D. D. D.alata rotundata cayenensis bulbifera esculenta dumetorum
Viscosity (BU) 150 720 220 40 65 120Intrinsic 3.05 3.13 2.98 — — 3.15
viscosity (n)Absolute density 1.513 1.511 1.519 — — 1.509
(g ·mL−1)Water-binding 99.4 98.6 99.8 — — 97.4
capacity (%)Iodine-binding 4.69 4.72 4.56 — — 4.95
capacity (%)Gelatinization 88.0 77.5 90.5 89.0 79.0 85.0
temperature (◦C)Gelatinization 65–71.5 63.5–71 68–74.5 (72) — — 65.5–72.5
temperaturea (◦C) 69b 66b 68b
Modified from [10, 61].a Recorded temperatures correspond to loss of birefringence by 2%, 50%, and 98% of the starch granules.b Mean.
Figure 2.63. Particle size distribution of D. esculenta starch. (Source: [10])

208 Root Crops
Table 2.59. Viscosity characteristics of yamstarches in West Africa
Viscosity GelatinizationSpecies (BU) Temperature (◦C)
D. alata 150 88.0D. rotundata 720 77.5D. cayenensis 220 90.5D. bulbifera 40 89.0D. esculenta 65 79.0D. dumetorum 120 85.0
Source: [68].
Table 2.60. Swelling power and solubility of yam starches
Swelling Power (%) Solubility (%)
Temperature D. D. D. D. D. D. D. D.(◦C) alata cayenensis dumetorum rotundata alata cayenensis dumetorum rotundata
60 5.01 8.25 7.38 3.10 2.70 1.30 2.64 1.8070 7.05 9.88 8.96 7.50 3.50 2.40 4.35 4.2180 11.50 11.97 12.15 12.55 4.55 4.25 7.02 6.0590 15.45 14.83 15.52 16.50 6.98 7.90 7.02 6.0595 20.50 16.90 18.65 21.50 7.80 13.80 16.80 11.90
Source: [61].
Table 2.61. Swelling and gelatinization attributes of yam starches
At 95◦C
Pasting Maximum Period of Apparent CriticalTemperaturea Viscositya Increasing Viscositya Rate of Concentration
Species (◦C) (BU) Increase Viscosity Swelling Value
D. rotundata 73.5 980 22.5 min 2.3 24.9 4.0D. esculenta 78.5 500 Steadily increasing 23.0 4.3D. cayenensis 75.0 690 16.5 min 2.4 21.3 4.7D. alata 77.5 620 Steadily increasing 18.3 5.5D. dumetorum 83.0 185 Steadily increasing 13.9 7.2
Source: [73].a Data obtained from Braebender viscogragh curves.
located in the central portions of the tuber. In general, the viscosities of some yamstarches are relatively low, especially for species such asD. hispidaandD. anguina[71]. This factor, in addition to the high costs of production, has limited the commercialexploitation of yam starches for industrial application.
In general, most yam starches create viscous pastes with high gel strengths comparedwith the starches of other tropical starch crops [72]. These rheological properties arerelated to the swelling and solubility attributes (Tables 2.60 and 2.61) of the starch
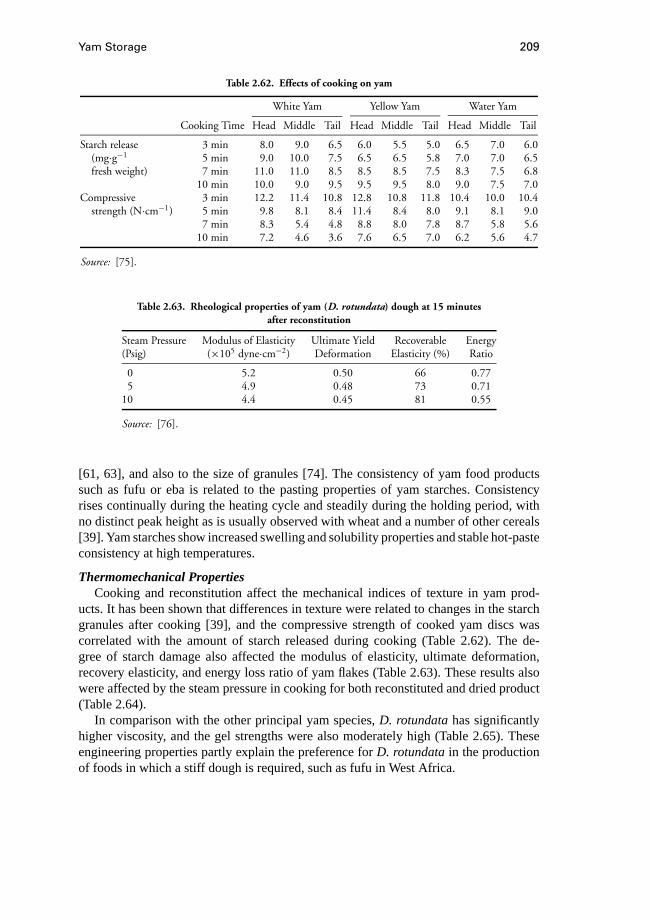
Yam Storage 209
Table 2.62. Effects of cooking on yam
White Yam Yellow Yam Water Yam
Cooking Time Head Middle Tail Head Middle Tail Head Middle Tail
Starch release 3 min 8.0 9.0 6.5 6.0 5.5 5.0 6.5 7.0 6.0(mg·g−1 5 min 9.0 10.0 7.5 6.5 6.5 5.8 7.0 7.0 6.5fresh weight) 7 min 11.0 11.0 8.5 8.5 8.5 7.5 8.3 7.5 6.8
10 min 10.0 9.0 9.5 9.5 9.5 8.0 9.0 7.5 7.0Compressive 3 min 12.2 11.4 10.8 12.8 10.8 11.8 10.4 10.0 10.4
strength (N·cm−1) 5 min 9.8 8.1 8.4 11.4 8.4 8.0 9.1 8.1 9.07 min 8.3 5.4 4.8 8.8 8.0 7.8 8.7 5.8 5.6
10 min 7.2 4.6 3.6 7.6 6.5 7.0 6.2 5.6 4.7
Source: [75].
Table 2.63. Rheological properties of yam (D. rotundata) dough at 15 minutesafter reconstitution
Steam Pressure Modulus of Elasticity Ultimate Yield Recoverable Energy(Psig) (×105 dyne·cm−2) Deformation Elasticity (%) Ratio
0 5.2 0.50 66 0.775 4.9 0.48 73 0.71
10 4.4 0.45 81 0.55
Source: [76].
[61, 63], and also to the size of granules [74]. The consistency of yam food productssuch as fufu or eba is related to the pasting properties of yam starches. Consistencyrises continually during the heating cycle and steadily during the holding period, withno distinct peak height as is usually observed with wheat and a number of other cereals[39]. Yam starches show increased swelling and solubility properties and stable hot-pasteconsistency at high temperatures.
Thermomechanical PropertiesCooking and reconstitution affect the mechanical indices of texture in yam prod-
ucts. It has been shown that differences in texture were related to changes in the starchgranules after cooking [39], and the compressive strength of cooked yam discs wascorrelated with the amount of starch released during cooking (Table 2.62). The de-gree of starch damage also affected the modulus of elasticity, ultimate deformation,recovery elasticity, and energy loss ratio of yam flakes (Table 2.63). These results alsowere affected by the steam pressure in cooking for both reconstituted and dried product(Table 2.64).
In comparison with the other principal yam species,D. rotundatahas significantlyhigher viscosity, and the gel strengths were also moderately high (Table 2.65). Theseengineering properties partly explain the preference forD. rotundatain the productionof foods in which a stiff dough is required, such as fufu in West Africa.
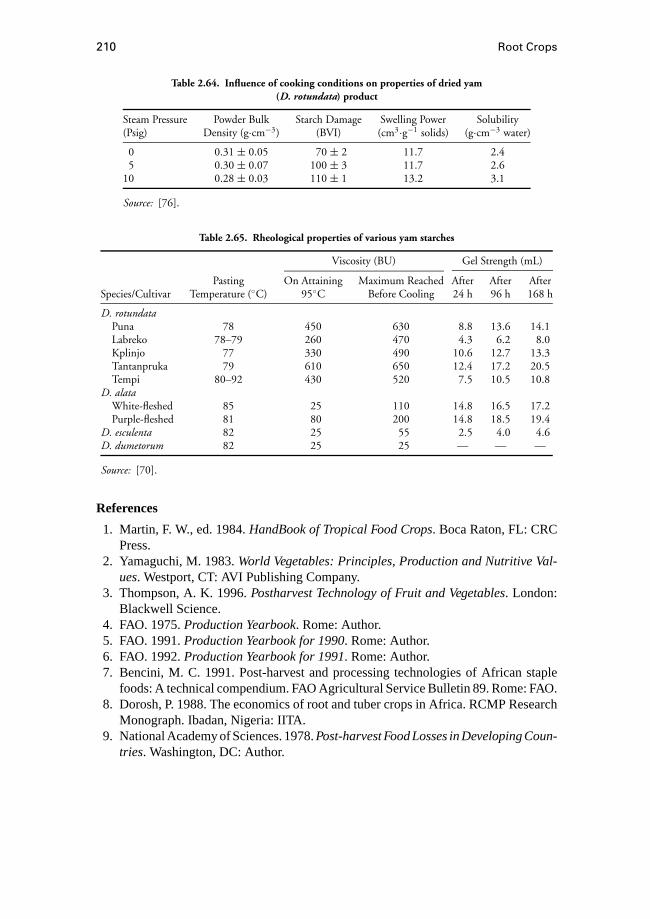
210 Root Crops
Table 2.64. Influence of cooking conditions on properties of dried yam(D. rotundata) product
Steam Pressure Powder Bulk Starch Damage Swelling Power Solubility(Psig) Density (g·cm−3) (BVI) (cm3·g−1 solids) (g·cm−3 water)
0 0.31 ± 0.05 70 ± 2 11.7 2.45 0.30 ± 0.07 100 ± 3 11.7 2.6
10 0.28 ± 0.03 110 ± 1 13.2 3.1
Source: [76].
Table 2.65. Rheological properties of various yam starches
Viscosity (BU) Gel Strength (mL)
Pasting On Attaining Maximum Reached After After AfterSpecies/Cultivar Temperature (◦C) 95◦C Before Cooling 24 h 96 h 168 h
D. rotundataPuna 78 450 630 8.8 13.6 14.1Labreko 78–79 260 470 4.3 6.2 8.0Kplinjo 77 330 490 10.6 12.7 13.3Tantanpruka 79 610 650 12.4 17.2 20.5Tempi 80–92 430 520 7.5 10.5 10.8
D. alataWhite-fleshed 85 25 110 14.8 16.5 17.2Purple-fleshed 81 80 200 14.8 18.5 19.4
D. esculenta 82 25 55 2.5 4.0 4.6D. dumetorum 82 25 25 — — —
Source: [70].
References
1. Martin, F. W., ed. 1984.HandBook of Tropical Food Crops. Boca Raton, FL: CRCPress.
2. Yamaguchi, M. 1983.World Vegetables: Principles, Production and Nutritive Val-ues. Westport, CT: AVI Publishing Company.
3. Thompson, A. K. 1996.Postharvest Technology of Fruit and Vegetables. London:Blackwell Science.
4. FAO. 1975.Production Yearbook. Rome: Author.5. FAO. 1991.Production Yearbook for 1990. Rome: Author.6. FAO. 1992.Production Yearbook for 1991. Rome: Author.7. Bencini, M. C. 1991. Post-harvest and processing technologies of African staple
foods: A technical compendium. FAO Agricultural Service Bulletin 89. Rome: FAO.8. Dorosh, P. 1988. The economics of root and tuber crops in Africa. RCMP Research
Monograph. Ibadan, Nigeria: IITA.9. National Academy of Sciences. 1978.Post-harvest Food Losses in Developing Coun-
tries. Washington, DC: Author.
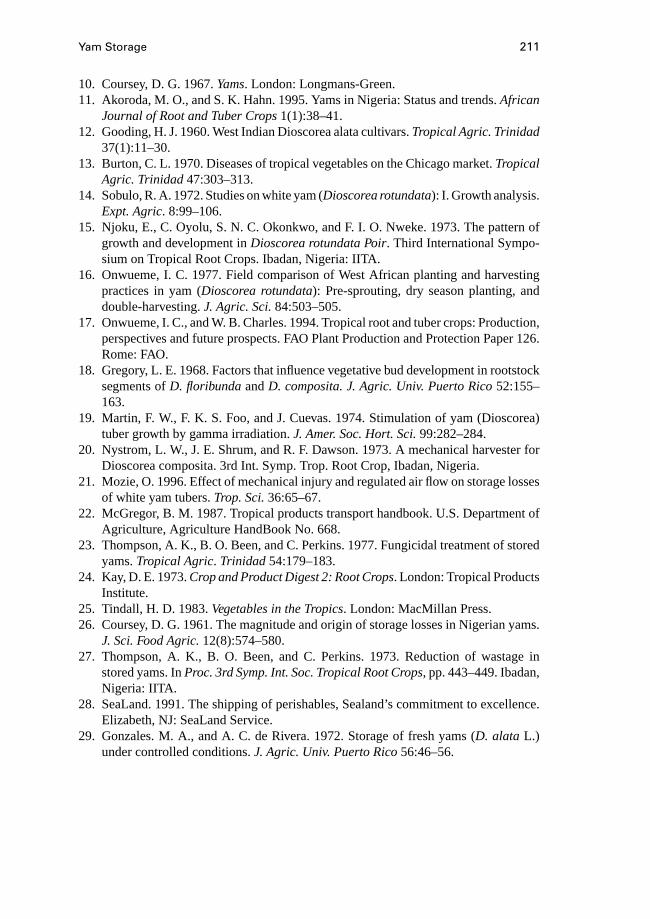
Yam Storage 211
10. Coursey, D. G. 1967.Yams. London: Longmans-Green.11. Akoroda, M. O., and S. K. Hahn. 1995. Yams in Nigeria: Status and trends.African
Journal of Root and Tuber Crops1(1):38–41.12. Gooding, H. J. 1960. West Indian Dioscorea alata cultivars.Tropical Agric. Trinidad
37(1):11–30.13. Burton, C. L. 1970. Diseases of tropical vegetables on the Chicago market.Tropical
Agric. Trinidad47:303–313.14. Sobulo, R. A. 1972. Studies on white yam (Dioscorea rotundata): I. Growth analysis.
Expt. Agric. 8:99–106.15. Njoku, E., C. Oyolu, S. N. C. Okonkwo, and F. I. O. Nweke. 1973. The pattern of
growth and development inDioscorea rotundata Poir. Third International Sympo-sium on Tropical Root Crops. Ibadan, Nigeria: IITA.
16. Onwueme, I. C. 1977. Field comparison of West African planting and harvestingpractices in yam (Dioscorea rotundata): Pre-sprouting, dry season planting, anddouble-harvesting.J. Agric. Sci.84:503–505.
17. Onwueme, I. C., and W. B. Charles. 1994. Tropical root and tuber crops: Production,perspectives and future prospects. FAO Plant Production and Protection Paper 126.Rome: FAO.
18. Gregory, L. E. 1968. Factors that influence vegetative bud development in rootstocksegments ofD. floribundaandD. composita. J. Agric. Univ. Puerto Rico52:155–163.
19. Martin, F. W., F. K. S. Foo, and J. Cuevas. 1974. Stimulation of yam (Dioscorea)tuber growth by gamma irradiation.J. Amer. Soc. Hort. Sci.99:282–284.
20. Nystrom, L. W., J. E. Shrum, and R. F. Dawson. 1973. A mechanical harvester forDioscorea composita. 3rd Int. Symp. Trop. Root Crop, Ibadan, Nigeria.
21. Mozie, O. 1996. Effect of mechanical injury and regulated air flow on storage lossesof white yam tubers.Trop. Sci.36:65–67.
22. McGregor, B. M. 1987. Tropical products transport handbook. U.S. Department ofAgriculture, Agriculture HandBook No. 668.
23. Thompson, A. K., B. O. Been, and C. Perkins. 1977. Fungicidal treatment of storedyams.Tropical Agric. Trinidad54:179–183.
24. Kay, D. E. 1973.Crop and Product Digest 2: Root Crops. London: Tropical ProductsInstitute.
25. Tindall, H. D. 1983.Vegetables in the Tropics. London: MacMillan Press.26. Coursey, D. G. 1961. The magnitude and origin of storage losses in Nigerian yams.
J. Sci. Food Agric.12(8):574–580.27. Thompson, A. K., B. O. Been, and C. Perkins. 1973. Reduction of wastage in
stored yams. InProc. 3rd Symp. Int. Soc. Tropical Root Crops, pp. 443–449. Ibadan,Nigeria: IITA.
28. SeaLand. 1991. The shipping of perishables, Sealand’s commitment to excellence.Elizabeth, NJ: SeaLand Service.
29. Gonzales. M. A., and A. C. de Rivera. 1972. Storage of fresh yams (D. alata L.)under controlled conditions.J. Agric. Univ. Puerto Rico56:46–56.

212 Root Crops
30. Guide to Food Transport: Fruit and Vegetables. 1989. Mercantilia Publishers.31. Hardenburg, R. E., A. E. Watada, and C. Y. Wang. 1986. The commercial storage of
fruits, vegetables, and florist and nursery stocks. U.S. Department of Agriculture,Agriculture HandBook No. 66 (revised).
32. Thompson, A. K. 1996.Postharvest Technology of Fruit and Vegetables. London:Blackwell Science.
33. Coursey, D. G. 1968. Low temperature injury in yams.J. Food Technology3:143–150.
34. Czyhrinciw, N., and W. Jaffe. 1951. Modificacions quimicas durante la conservacionde raices tuberculos.Archos Venez. Nutr.2(1):49–67.
35. Safeway Stores, Inc. 1986.Transit and Storage Properties of Produce Commodities.Newark, DE: Produce Marketing Assoc.
36. Imakawa, S. 1967. Browning of Chinese yam (D. batatas). Hokkaido DaigakuHobun Kiyo6:445–447.
37. Lang, G. A. 1987. Dormancy: A new universal terminology.HortScience22:815–820.
38. Passam, H. C., and R. A. Noon. 1977. Deterioration of yams and cassava duringstorage.Ann. Appl. Biol.85:436–440.
39. Osagie, A. U. 1992.The Yam Tuber in Storage. Benin City, Nigeria: PostharvestResearch Unit, Department of Biochemistry, University of Benin.
40. Campbell, J. S., V. O. Chukwueke, F. A. Teriba, and H. V. S. Ho-a-shu. 1962.Some physiological experiments with the white Lisbon yam (Dioscorea alataL.):I. The breakage of the rest period in tubers by chemical means.Emp. J. Exp. Agric.30(118):108–114.
41. Onwueme, I. C. 1975. Influence of storage time on earliness of sprouting and tuberingin Dioscorea rotundata yams. J. Agric. Sci. Camb.84:503–505.
42. Nwoke, F. I. O., and S. N. C. Okonkwo. 1981. Length of tuber dormancy in yam(D. spp.).Nigerian J. Agric. Sci.3:153–156.
43. Hayward, L. A. W., and H. M. Walker. 1961. The effect of pre-harvest foliar sprayingwith maleic hydrazide on the storage of yams.Ann. Rep. West Afr. Stored ProductsRes. Unit, pp. 107–115.
44. Passam, H. C. 1982. Dormancy in yams in relation to storage. InYams—Ignames,ed. J. Miege and S. N. Lyonga, pp. 285–293. Oxford: Clarendon Press.
45. Onwueme, I. C. 1973. The sprouting process of yam (D. spp) tuber pieces.J. Agric.Sci. Camb.81:375–379.
46. Ireland, C. R., W. W. Schwabe, and D. G. Coursey. 1981. The occurrence of batatasinsin the Dioscoreaceae.Phytochemistry20:1569–1571.
47. Adesuyi, S. A. 1982. Application of high technology to the improvement of yamstorage. InYams–Ignames, ed. J. Miege and S. N. Lyonga, pp. 312–319. Oxford:Clarendon Press.
48. Adesuyi, S. A. 1978. Progress in food irradiation: Nigeria food irradiation.Inform9:47.
49. Adesuyi, S. A. 1976. The use of radiation for control of sprouting and improvingthe food qualities of yamsDioscoreaspp., part of a co-ordinated programme on
Yam Storage 213
the shelf-life extension of irradiated fruits and vegetables. Final Report, Int. AtomicEnergy, Vienna (IAEA-R-1506-F).
50. Adesiyan, S. O. 1977. Studies on the effects of gamma radiation (from Cobalt 60source) on storage life of white yam (Dioscorea rotundata var. efon) infected withScutellonema bradys. Ann. Appl. Biol.86:213–218.
51. Ng, S. Y. C. 1991. Virus-free yam (Dioscorea rotundata Poir): Distribution methods.In Proc. 9th Int. Soc. Trop. Root Crops, Accra, Ghana.
52. Wilson, J. E., and L. Victor. 1980. Relationships between seedlings and their vege-tative progenies in white yam (D. rotundata). INRA Int. Seminar on the Yam 1981,pp. 269–278.
53. Ezeike, G. O. I. 1985. Experimental analysis of yam (D. spp.) tuber stability intropical storages.Trans. ASAE28:1641–1645.
54. Osuji, G. O. (ed.) 1987. The manipulation of the carbohydrate metabolism of theyam tuber to prolong its storage life and induce uniformity of sprouting.Advancesin Yam Research2.
55. Coursey, D. G. 1983. Yams. InHandBook of Tropical Foods, ed. H. T. Chan,pp. 555–601. New York: Marcel Dekker.
56. FAO. 1968.Food Composition Table for Use in Africa. Rome: Author.57. FAO. 1972.Food Composition Table for Use in East Asia. Rome: Author.58. Bradbury, J. H., and W. D. Holloway. 1988.Chemistry of Tropical Root Crops: Sig-
nificance for Nutrition and Agriculture in the Pacific. Canberra, Australia: AustralianCentre for International Agricultural Research.
59. Alakali, S. E. Obeta, and O. Ijabo. 1995. Heat of respiration of yam tubers and itseffects on heat load.African Journal of Root and Tuber Crops1(1):31–35.
60. Degras, L. 1983.The Yam: A Tropical Root Crop. London: The MacMillan Press.61. Emiola, L., and L. C. Delarosa. 1981. Physicochemical characteristics of yam
starches.J. Food Biochem. 5:115–130.62. Whelan, W. J. 1964. Hydrolysis with B-amylase and preparation of the -amylase
limit dextrin of amylopectin. InMethods of Carbohydrate Chemistry, vol. IV,ed. R. L. Whistler, pp. 261–266. New York: Academic Press.
63. Passam, H. C., S. J. Read, and J. E. Rickard. 1978. The respiration of yam tubersand its contribution to storage loss.Trop. Agric.55:207–214.
64. Coursey, D. G., and J. D. Russul. 1969. A note on endogenous and biodeteriora-tive factors in the respiration of dormant yam tubers.Int. Biodeterioration Bull.5:27–30.
65. Coursey, D. G., and H. M. Walker. 1960. A study of the origins of weight loss instored yams.Rep. West Afr. Stored Prod. Res. Unit, pp. 61–64.
66. Siebel, J. E. 1892. Specific heat of various products.Ice and Refrigeration2:256–257.
67. Seidmann, J. 1964. Mikroskopische untersuchung verschiedener Dioscorea-starken.Starke16:246–253.
68. Greenwood-Barton, L. H. 1961. Yam starches from Nigeria. Report No. 51 of theTropical Products Institute, London.
69. Hollo, J. 1964. L’utilisation industrielle de l’igname. Paper presented to the 1st

214 Root Crops
Congres Internationale des Industries Agricoles et Alimentaires des Zones Tropi-cales et Sub-tropicales, Abidjan.
70. Rasper, V., and D. G. Coursey. 1967. Properties of starches of some West Africanyams.J. Sci. Food Agric.18:240–244.
71. Rao, P. S., and R. M. Beri. 1952. Tubers of Dioscorea hispida Dennst.Indian Forester78(3):113–133.
72. Rasper, V. 1969. Investigations on starches from major starch crops grown in Ghana:I. Hot paste viscosity and gel forming powder.J. Sci. Food Agric.20:165–171.
73. Rasper, V. 1969. Investigations on starches from major starch crops grown in Ghana:II. Swelling and solubility patterns; amyclastic susceptibility.J. Sci. Food Agric.20:642–646.
74. Rasper, V. 1971. Investigations on starches from major starch crops grown in Ghana:III. Particle size and particle size distribution.J. Sci. Food Agric.22:572–580.
75. Onayemi, O. R. O. Babalola, and A. Badanga. 1987. Textural properties of cookedtropical yam (D. spp.).J. Texture Studies18:17–29.
76. Ayernor, G. S. 1976. Particulate properties and rheology of pregelled yam (Dioscorearotundata) products.J. Food. Sci.41:180–182.
2.6 Storage of Edible AroidsLinus U. Opara
2.6.1 General
Terminology and ScopeThe aroids (familyAraceae) contain many food crops grown in several tropical and
subtropical countries (Table 2.66). The most important edible aroids are thetaro orcocoyam (Colocasia esculenta) (Fig. 2.64) and tannia or new cocoyam (Xanthosomasagittifolium) (Fig. 2.65), which together are calledcocoyamsin many parts of the world,especially in Africa. For the purpose of this sections, the terminologyedible aroidsisbe used to include the cocoyams and other edible members of the Aracae family. Ifdistinction is necessary to highlight differences in storage and other attributes of thetwo most important edible aroids, the termtaro is used forColocasiaand tannia forXanthosoma.
Because of their great economic importance compared with other types of ediblearoids, the information covered in this article is based on these two edible aroids. It isimportant to note thatAlocasia cyrtospermaandAmorphophallusspp. are cultivatedglobally to a very limited extent, and they are important food crops in some parts ofIndia, Southeast Asia, and the Pacific Islands [2].
Economic ImportanceThese aroids are cultivated in the lowland humid areas and contribute an important
part to the carbohydrate content of the diet in these regions. They produce edible starchystorage corms or cormels. Although the edible aroids are less important than othertropical root crops such as yam, cassava, and sweet potato, they are still a major staple in

Storage of Edible Aroids 215
Table 2.66. Types of edible aroids
Botanical Name Common Names Comments
Colocasia esculenta Taro, malanga, old cocoyam, The term “taro” has also been used to(L.) Schott eddoe, gabi, dasheen, ede refer to the edible aroids in general
Xanthosoma spp. Tannia, ede, new cocoyam X. sagittifolium is the most important,while X. atrovirens, X. violaceum,and X. carau are of lesser importance
Alocasia spp. Giant taro Includes A. macrorrhiza as the main cultivatedspecies and A. indica, A. fornicata, andA. cucullata as minor species
Cyrtosperma Swamp taro —chamissonis
Amorphophallus Elephant yam A. concophyllus, A. varialbis, andcampanulatus A. rivieri are also edible
Figure 2.64. Taro (Colocasiaesculenta) plant. (Source: [1])
some parts of the tropics and subtropics. In the South Pacific region in particular, aroidsrepresent a very high proportion of the root crops.
World production of edible aroids is difficult to estimate because of the subsistencenature of agriculture in fragmented landholdings in the producing areas. Estimated worldproduction in 1988 was around 5.5 million ton, constituting about 3.3% of all root crops[3, 4]. Total world production area of taro alone was estimated to be about 993× 103 hain 1983, with 80% in Africa [5]. During this period, global production of taro was 5.607million ton, with about 61.33% in Africa and 38.67% in Asia.
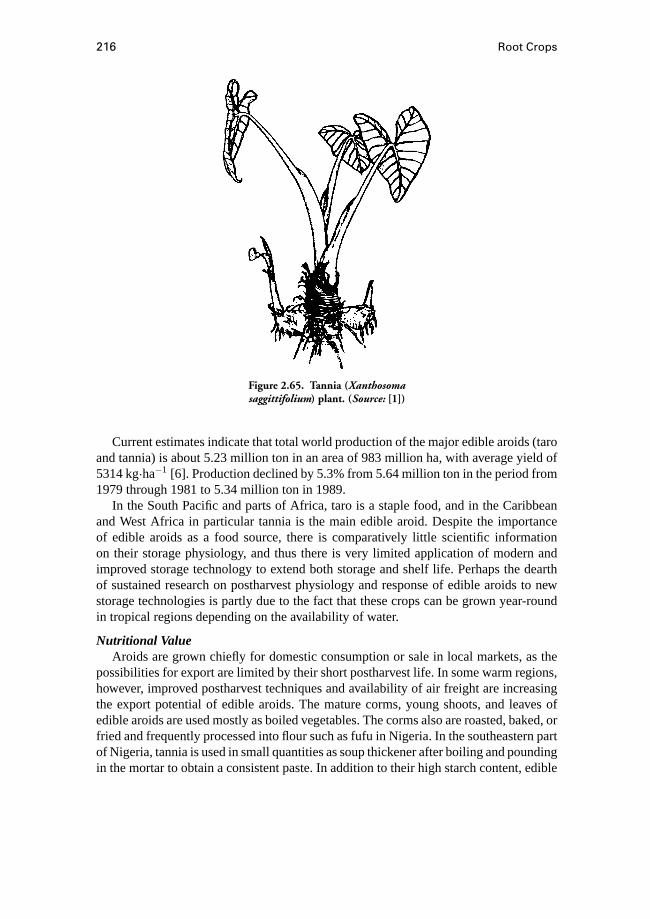
216 Root Crops
Figure 2.65. Tannia (Xanthosomasaggittifolium) plant. (Source: [1])
Current estimates indicate that total world production of the major edible aroids (taroand tannia) is about 5.23 million ton in an area of 983 million ha, with average yield of5314 kg·ha−1 [6]. Production declined by 5.3% from 5.64 million ton in the period from1979 through 1981 to 5.34 million ton in 1989.
In the South Pacific and parts of Africa, taro is a staple food, and in the Caribbeanand West Africa in particular tannia is the main edible aroid. Despite the importanceof edible aroids as a food source, there is comparatively little scientific informationon their storage physiology, and thus there is very limited application of modern andimproved storage technology to extend both storage and shelf life. Perhaps the dearthof sustained research on postharvest physiology and response of edible aroids to newstorage technologies is partly due to the fact that these crops can be grown year-roundin tropical regions depending on the availability of water.
Nutritional ValueAroids are grown chiefly for domestic consumption or sale in local markets, as the
possibilities for export are limited by their short postharvest life. In some warm regions,however, improved postharvest techniques and availability of air freight are increasingthe export potential of edible aroids. The mature corms, young shoots, and leaves ofedible aroids are used mostly as boiled vegetables. The corms also are roasted, baked, orfried and frequently processed into flour such as fufu in Nigeria. In the southeastern partof Nigeria, tannia is used in small quantities as soup thickener after boiling and poundingin the mortar to obtain a consistent paste. In addition to their high starch content, edible
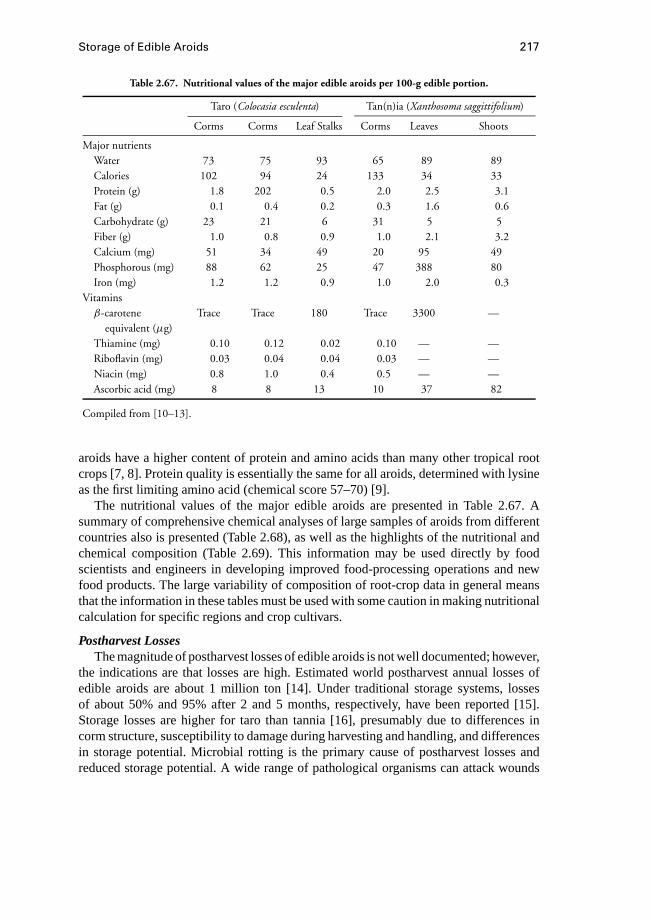
Storage of Edible Aroids 217
Table 2.67. Nutritional values of the major edible aroids per 100-g edible portion.
Taro (Colocasia esculenta) Tan(n)ia (Xanthosoma saggittifolium)
Corms Corms Leaf Stalks Corms Leaves Shoots
Major nutrientsWater 73 75 93 65 89 89Calories 102 94 24 133 34 33Protein (g) 1.8 202 0.5 2.0 2.5 3.1Fat (g) 0.1 0.4 0.2 0.3 1.6 0.6Carbohydrate (g) 23 21 6 31 5 5Fiber (g) 1.0 0.8 0.9 1.0 2.1 3.2Calcium (mg) 51 34 49 20 95 49Phosphorous (mg) 88 62 25 47 388 80Iron (mg) 1.2 1.2 0.9 1.0 2.0 0.3
Vitaminsβ-carotene Trace Trace 180 Trace 3300 —
equivalent (µg)Thiamine (mg) 0.10 0.12 0.02 0.10 — —Riboflavin (mg) 0.03 0.04 0.04 0.03 — —Niacin (mg) 0.8 1.0 0.4 0.5 — —Ascorbic acid (mg) 8 8 13 10 37 82
Compiled from [10–13].
aroids have a higher content of protein and amino acids than many other tropical rootcrops [7, 8]. Protein quality is essentially the same for all aroids, determined with lysineas the first limiting amino acid (chemical score 57–70) [9].
The nutritional values of the major edible aroids are presented in Table 2.67. Asummary of comprehensive chemical analyses of large samples of aroids from differentcountries also is presented (Table 2.68), as well as the highlights of the nutritional andchemical composition (Table 2.69). This information may be used directly by foodscientists and engineers in developing improved food-processing operations and newfood products. The large variability of composition of root-crop data in general meansthat the information in these tables must be used with some caution in making nutritionalcalculation for specific regions and crop cultivars.
Postharvest LossesThe magnitude of postharvest losses of edible aroids is not well documented; however,
the indications are that losses are high. Estimated world postharvest annual losses ofedible aroids are about 1 million ton [14]. Under traditional storage systems, lossesof about 50% and 95% after 2 and 5 months, respectively, have been reported [15].Storage losses are higher for taro than tannia [16], presumably due to differences incorm structure, susceptibility to damage during harvesting and handling, and differencesin storage potential. Microbial rotting is the primary cause of postharvest losses andreduced storage potential. A wide range of pathological organisms can attack wounds
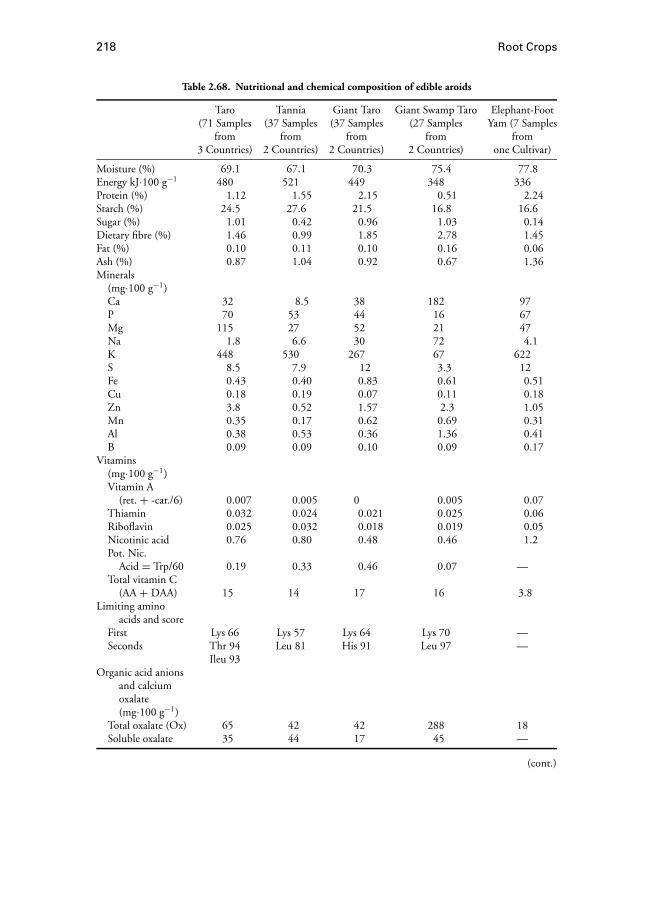
218 Root Crops
Table 2.68. Nutritional and chemical composition of edible aroids
Taro Tannia Giant Taro Giant Swamp Taro Elephant-Foot(71 Samples (37 Samples (37 Samples (27 Samples Yam (7 Samples
from from from from from3 Countries) 2 Countries) 2 Countries) 2 Countries) one Cultivar)
Moisture (%) 69.1 67.1 70.3 75.4 77.8Energy kJ·100 g−1 480 521 449 348 336Protein (%) 1.12 1.55 2.15 0.51 2.24Starch (%) 24.5 27.6 21.5 16.8 16.6Sugar (%) 1.01 0.42 0.96 1.03 0.14Dietary fibre (%) 1.46 0.99 1.85 2.78 1.45Fat (%) 0.10 0.11 0.10 0.16 0.06Ash (%) 0.87 1.04 0.92 0.67 1.36Minerals
(mg·100 g−1)Ca 32 8.5 38 182 97P 70 53 44 16 67Mg 115 27 52 21 47Na 1.8 6.6 30 72 4.1K 448 530 267 67 622S 8.5 7.9 12 3.3 12Fe 0.43 0.40 0.83 0.61 0.51Cu 0.18 0.19 0.07 0.11 0.18Zn 3.8 0.52 1.57 2.3 1.05Mn 0.35 0.17 0.62 0.69 0.31Al 0.38 0.53 0.36 1.36 0.41B 0.09 0.09 0.10 0.09 0.17
Vitamins(mg·100 g−1)Vitamin A
(ret. + -car./6) 0.007 0.005 0 0.005 0.07Thiamin 0.032 0.024 0.021 0.025 0.06Riboflavin 0.025 0.032 0.018 0.019 0.05Nicotinic acid 0.76 0.80 0.48 0.46 1.2Pot. Nic.
Acid = Trp/60 0.19 0.33 0.46 0.07 —Total vitamin C
(AA + DAA) 15 14 17 16 3.8Limiting amino
acids and scoreFirst Lys 66 Lys 57 Lys 64 Lys 70 —Seconds Thr 94 Leu 81 His 91 Leu 97 —
Ileu 93Organic acid anions
and calciumoxalate(mg·100 g−1)
Total oxalate (Ox) 65 42 42 288 18Soluble oxalate 35 44 17 45 —
(cont.)
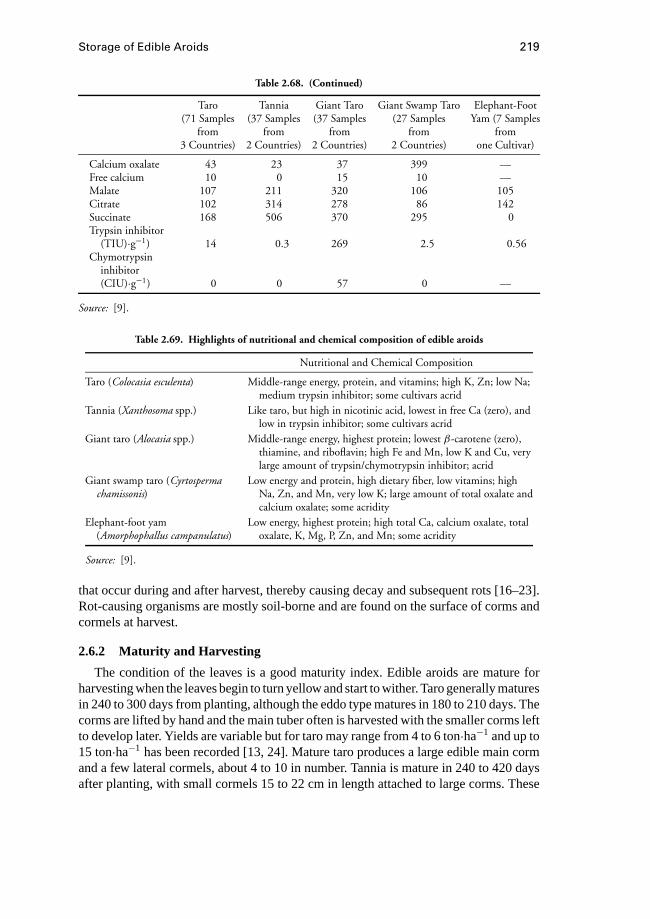
Storage of Edible Aroids 219
Table 2.68. (Continued)
Taro Tannia Giant Taro Giant Swamp Taro Elephant-Foot(71 Samples (37 Samples (37 Samples (27 Samples Yam (7 Samples
from from from from from3 Countries) 2 Countries) 2 Countries) 2 Countries) one Cultivar)
Calcium oxalate 43 23 37 399 —Free calcium 10 0 15 10 —Malate 107 211 320 106 105Citrate 102 314 278 86 142Succinate 168 506 370 295 0Trypsin inhibitor
(TIU)·g−1) 14 0.3 269 2.5 0.56Chymotrypsin
inhibitor(CIU)·g−1) 0 0 57 0 —
Source: [9].
Table 2.69. Highlights of nutritional and chemical composition of edible aroids
Nutritional and Chemical Composition
Taro (Colocasia esculenta) Middle-range energy, protein, and vitamins; high K, Zn; low Na;medium trypsin inhibitor; some cultivars acrid
Tannia (Xanthosoma spp.) Like taro, but high in nicotinic acid, lowest in free Ca (zero), andlow in trypsin inhibitor; some cultivars acrid
Giant taro (Alocasia spp.) Middle-range energy, highest protein; lowest β-carotene (zero),thiamine, and riboflavin; high Fe and Mn, low K and Cu, verylarge amount of trypsin/chymotrypsin inhibitor; acrid
Giant swamp taro (Cyrtosperma Low energy and protein, high dietary fiber, low vitamins; highchamissonis) Na, Zn, and Mn, very low K; large amount of total oxalate and
calcium oxalate; some acridityElephant-foot yam Low energy, highest protein; high total Ca, calcium oxalate, total
(Amorphophallus campanulatus) oxalate, K, Mg, P, Zn, and Mn; some acridity
Source: [9].
that occur during and after harvest, thereby causing decay and subsequent rots [16–23].Rot-causing organisms are mostly soil-borne and are found on the surface of corms andcormels at harvest.
2.6.2 Maturity and Harvesting
The condition of the leaves is a good maturity index. Edible aroids are mature forharvesting when the leaves begin to turn yellow and start to wither. Taro generally maturesin 240 to 300 days from planting, although the eddo type matures in 180 to 210 days. Thecorms are lifted by hand and the main tuber often is harvested with the smaller corms leftto develop later. Yields are variable but for taro may range from 4 to 6 ton·ha−1 and up to15 ton·ha−1 has been recorded [13, 24]. Mature taro produces a large edible main cormand a few lateral cormels, about 4 to 10 in number. Tannia is mature in 240 to 420 daysafter planting, with small cormels 15 to 22 cm in length attached to large corms. These

220 Root Crops
should be harvested before they produce new shoots. The corms are lifted by hand, andmature cormels may be harvested continuously for 500 days or more, leaving the maincorm in the ground. Tannia yields about 6 to 12 ton·ha−1 of corms, but yields of 12 to20 ton·ha−1 often are obtained.
2.6.3 Postharvest Handling and Curing
HandlingHarvested corms usually are carried in baskets, jute bags, or carts from the farms
to storage room or directly to the market for sale to the consumer [1]. Some harvestedcorms are consumed by the farmers directly or put in storage for later use (Fig. 2.66).Corms are susceptible to mechanical injury during harvesting and postharvest handling,and it has been reported that mechanical damage is the major reason why corms fail tomeet consumer and storage standards [1]. Extra care should be taken to avoid damageto the corms during postharvest handling, because the presence of damage may lead torapid deterioration during subsequent handling and storage. Impact studies have shownthat the percentage of corms damaged by dropping does not change very much with dropheight (Fig. 2.67), but the severity of damage increases significantly with the drop height(Fig. 2.68).
For the fresh market, taros normally are washed and the roots and fibers discarded.They are graded and packed in crates for transportation. Crates are preferred becausethey are firm and reduce the incidence of mechanical damage to corms. Corms destinedfor storage are cleaned but not washed and also may be cured to enhance repair of anyphysical injury present.
Cleaning the edible aroids to meet strict export quarantine requirements is an essentialpart of the postharvest handling system. Currently, New Zealand regulation stipulates
Figure 2.66. Postharvest handling system forcorms. (Redrawn from [25])
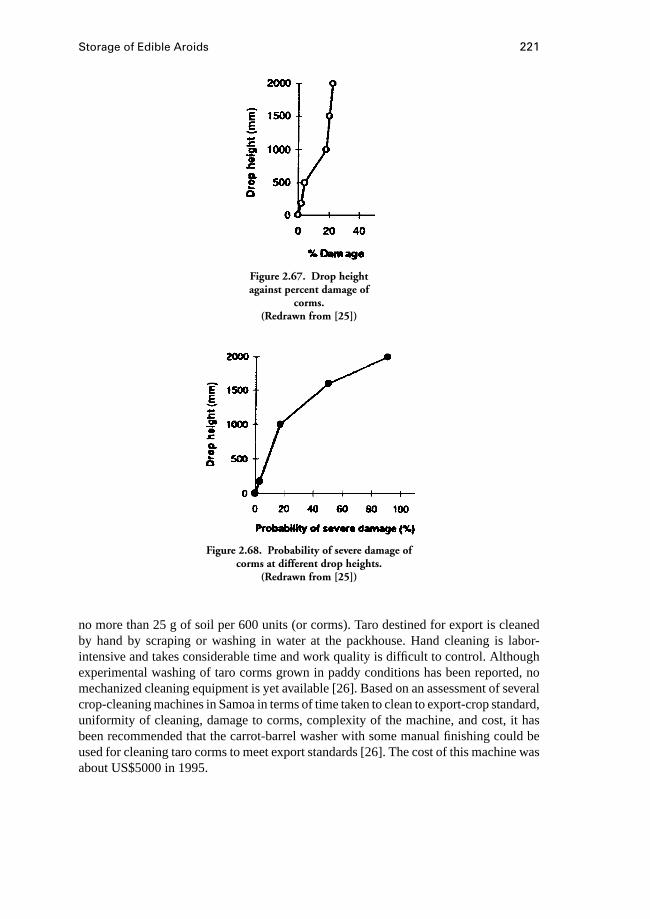
Storage of Edible Aroids 221
Figure 2.67. Drop heightagainst percent damage of
corms.(Redrawn from [25])
Figure 2.68. Probability of severe damage ofcorms at different drop heights.
(Redrawn from [25])
no more than 25 g of soil per 600 units (or corms). Taro destined for export is cleanedby hand by scraping or washing in water at the packhouse. Hand cleaning is labor-intensive and takes considerable time and work quality is difficult to control. Althoughexperimental washing of taro corms grown in paddy conditions has been reported, nomechanized cleaning equipment is yet available [26]. Based on an assessment of severalcrop-cleaning machines in Samoa in terms of time taken to clean to export-crop standard,uniformity of cleaning, damage to corms, complexity of the machine, and cost, it hasbeen recommended that the carrot-barrel washer with some manual finishing could beused for cleaning taro corms to meet export standards [26]. The cost of this machine wasabout US$5000 in 1995.
222 Root Crops
Curing of CormsSeveral wounds are made on tannia corm when the cormels (usually 4 to 10 in number)
are removed, and one wound inevitably is made on taro cormels when they are cut offfrom the parent corm. During trimming to remove the residual planting material fromthe base of the corms and the petiole of leaf base, additional wounds also are madethat have poor healing properties [27]. Because wounding of corms is necessary duringharvesting and trimming, it is important that the crop is cured before long-term storageto in order to promote a rapid wound-repair process, thereby slowing down the rates ofphysiological and pathological deterioration.
Traditionally, curing usually is accomplished by placing corms in the sun until thewounded surface dries out. Corms also can be cured in naturally ventilated barns or otherstorage structures. Curing is less effective if damage to corms is extensive. Fungicidetreatment may be necessary if base trimming is practiced.
In-depth studies on the effects of curing on aroids are scanty. Curing can be achievedat elevated temperatures in a high-humidity environment, but the application of agro-chemical sprout-suppressants has been suggested to cause an inhibitory effect on woundhealing and periderm formation [17, 28, 29].
Curing corms at 35◦C and 95% relative humidity for 5 days reduces the rate ofsprouting and weight loss in tannia [12, 25], and temperatures below 20◦C have beenreported to cause very slow wound healing of dasheen cormels [27]. It was recommendedthat brief storage of corms under tropical ambient conditions (24 or 30◦C with 85%humidity) promoted curing in taro and tannia corms [30, 31]. Other studies have reportedthat the best conditions for wound healing were 34 to 36◦C with 95% to 100% relativehumidity [32]. However, under these conditions wound healing occurred more readilyat the top of corms than at the base and sometimes failed to occur at the base. If cormshad severe bruising, periderm develops sporadically.
2.6.4 Storage of Fresh Corms
There is considerable variation in the storage behavior of the different edible aroids.Taros are more difficult to store than tannia [17, 31]. Storage of fresh corms is importantfor distant marketing, to free farm land for new cropping, and to ensure the availability ofseed cormels in the next planting season. Edible aroids have a short period of shelf life,however, and this creates specific problems with the supply of new planting materials.In particular, storage at ambient temperatures is considered impossible due to a veryhigh incidence of fungal decay. Under high storage temperatures (25◦C and above) andhumidities (85% and above), more sprouting and decay occurs with taro than with tanniacormels [31]. However, less sprouting and decay occurred with taro at high temperatureand low humidity than at high temperature and high humidity, but weight loss was higher.Under tropical ambient conditions, tannia cultivars were stored successfully for about 5to 6 weeks, but up to 60% decay occurred in taro corms.
Traditional Low-cost StructuresAroids are stored in a variety of traditional low-cost structures such as shade, huts,
and underground pits. Sometimes the corms are placed in boxes before loading into the
Storage of Edible Aroids 223
building. Corms also may be stored in heaps in the shade or covered with straw or plantainleaves. In parts of southern China, it is common practice to pile the corms in heaps andcover them with soil or seal them in leaf-lined pits in the ground [33]. In parts of thePhilippines, corms are stored on wooden platforms with the corms arranged in irregularrows and covered with dry grass and finally with soil. As practiced in some parts of theSouth Pacific, corms may be harvested with about 30 cm of their basal petioles attached,tied into bundles, and stored suspended in the shade. In pit storage, corms are placedinside pits and covered with leaves and soil [34]. Storage in leaf-lined soil pits also ispracticed. The pits or trenches usually are dug in well-drained soil in shaded areas. Insome parts of Nigeria, the trenches then are covered with dry grass and finally soil. Thesetraditional storage conditions reduce moisture loss and promote the curing of wounds.The storage life of taro corms has been extended for up to 4 weeks with no effect on thestorage of tannia [21, 27, 34]. Under these conditions, the incidence of fungal infectionis reduced and the corms remain physiologically active, leading to production of rootsand shoot.
Studies carried out in Cameroon showed that traditional storage pits in a confinedenvironment gave more satisfactory results than storage on trays in well-ventilated huts[7]. After several weeks of storage, there was no difference in taste or texture betweenstored and fresh corms. After 4 weeks, however, 10% to 20% of the corms was destroyedby bacterial infection. Storage losses can be reduced by minimizing the occurrence ofmechanical damage and leaving the corms untrimmed [4]. Taro can be stored in shadedpits for about 4 months without significant losses in quality and quantity, and satisfactorystorage has been achieved for up 3 months under a variety of tropical conditions. Ingeneral, tannia keeps better in traditional pit storage than in a ventilated room or barn[13]. Mature tannia corms do not deteriorate if left in the ground, and it is also commonpractice to harvest corms for immediate utilization as required.
Modification of traditional storage structures to achieve improved environmental con-trol also can improve the storage life of corms and reduce incidence of decay. For instance,a comparison of corms (with roots and petiole intact) stored in a modified clamp (27–28.4◦C, 90%–98.8% relative humidity) or in a hut (29.8–32◦C, 58.8% humidity) showedthat the percentage of decay was less in clamp storage than in hut storage.
Although most traditional methods of storage have been practiced since time im-memorial, they are suited mainly for short-term storage and have limited success withlong-term storage, which is a prerequisite for modern-day postharvest handling andmarketing. Existing results are largely variable, and in many instances the corms de-cay and become unfit for human consumption after a short period. Different levels ofcorm wastage and losses have been reported for different lengths of storage and for thedifferent types of edible aroids (Table 2.70).
It has been shown that taro and tannia can be stored at tropical ambient conditions(24–29◦C with 86%–98% relative humidity) for at least 2 weeks without significantchanges in nutritional values such as crude protein content and total amino acids [31].However, there is a significant reduction in starch content and an increase in total sugarcontent. During this period, also, sucrose was the most abundant sugar and maltose wasconsistently the least abundant in both fresh and stored corms.

224 Root Crops
Table 2.70. Storage losses of corms under traditional storage methodsin ambient conditions
Type of Aroid Length of Storage Degree of Losses
Taro 5–10 d Became unfit for human consumptionTaro 1–2 wk Became unfit for human consumptionTaro 2 wk Decayed rapidlyTaro 6 wk 28% fresh-weight loss and 53% decayTaro 2 mo 50% lossTaro 3 mo More than 30% wastageTaro 5 mo 95% lossTannia 2 wk 5% decayTannia 6 wk 35% fresh-weight loss and 40% decay
Compiled from [15, 17, 21, 23, 35].
Table 2.71. Recommended storage conditions for tannia
Temperature Relative Length of(◦C) Humidity (%) Storage
7 80 17.1–18.6 wk7.2 80 18 wk7–10 80 16–20 wk15 85 5–6 wk
Compiled from [13, 31, 37, 38].
Ventilated StorageDuring storage in well-ventilated stores (about 26◦C and 76% humidity), tannia corms
had 1% weight loss per week, but sprouting occurred after 6 weeks. The corms still wereedible after 9 weeks, storage [36]. Other studies have shown that tannia corms maybe stored in well-ventilated conditions for up to 6 months [13, 21], although loss ofeating quality was observed after 8 weeks. Several factors including corm maturity, en-vironmental condition, agroclimatology, extent of physical injury, and preharvest factorscontribute to the variable storage results. Studies carried out in the Philippines showedthat ventilated storage of corms in the dark at 24◦C resulted in 30% decay after 1 to 3weeks [7].
Refrigerated StorageCorm storage life is improved using low-temperature refrigerated storage (Tables 2.71
and 2.72). However, refrigerated-storage techniques have higher costs compared withtraditional and ventilated-storage methods. They require capital investment in equipment,packaging, relevant skilled technical labor, and a power supply.
Selection of any storage technique must be guided by consideration of a crop’s eco-nomic value, its intended use, and the appropriateness of the technology to local condi-tions.
At low temperature (15◦C) and high humidity (85%), both taro and tannia successfullyhave been stored for 5 to 6 weeks [31]. Storage life generally is improved at conditionsof lower temperature and high humidity. If the storage environment can be maintained
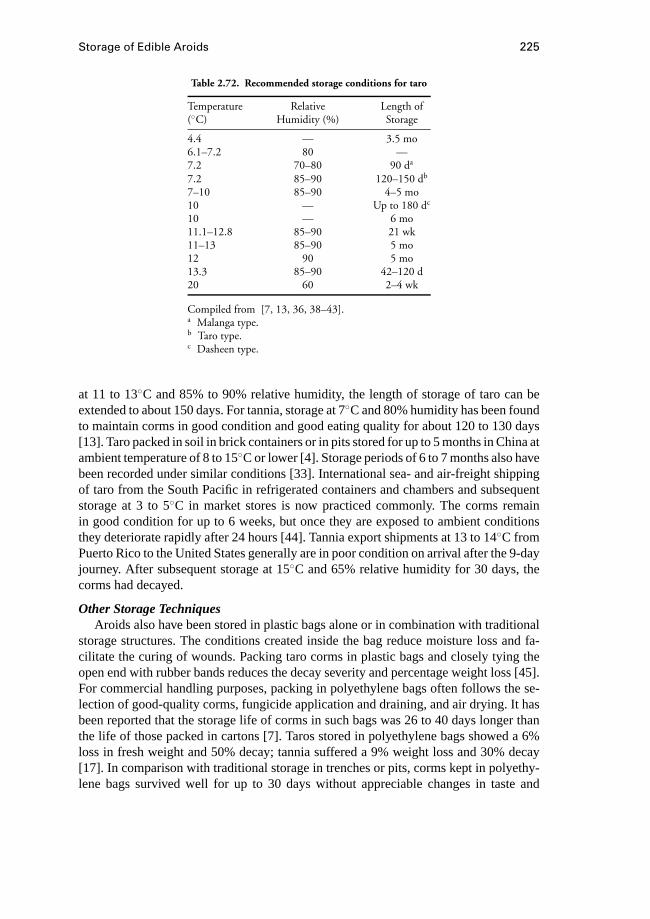
Storage of Edible Aroids 225
Table 2.72. Recommended storage conditions for taro
Temperature Relative Length of(◦C) Humidity (%) Storage
4.4 — 3.5 mo6.1–7.2 80 —7.2 70–80 90 da
7.2 85–90 120–150 db
7–10 85–90 4–5 mo10 — Up to 180 dc
10 — 6 mo11.1–12.8 85–90 21 wk11–13 85–90 5 mo12 90 5 mo13.3 85–90 42–120 d20 60 2–4 wk
Compiled from [7, 13, 36, 38–43].a Malanga type.b Taro type.c Dasheen type.
at 11 to 13◦C and 85% to 90% relative humidity, the length of storage of taro can beextended to about 150 days. For tannia, storage at 7◦C and 80% humidity has been foundto maintain corms in good condition and good eating quality for about 120 to 130 days[13]. Taro packed in soil in brick containers or in pits stored for up to 5 months in China atambient temperature of 8 to 15◦C or lower [4]. Storage periods of 6 to 7 months also havebeen recorded under similar conditions [33]. International sea- and air-freight shippingof taro from the South Pacific in refrigerated containers and chambers and subsequentstorage at 3 to 5◦C in market stores is now practiced commonly. The corms remainin good condition for up to 6 weeks, but once they are exposed to ambient conditionsthey deteriorate rapidly after 24 hours [44]. Tannia export shipments at 13 to 14◦C fromPuerto Rico to the United States generally are in poor condition on arrival after the 9-dayjourney. After subsequent storage at 15◦C and 65% relative humidity for 30 days, thecorms had decayed.
Other Storage TechniquesAroids also have been stored in plastic bags alone or in combination with traditional
storage structures. The conditions created inside the bag reduce moisture loss and fa-cilitate the curing of wounds. Packing taro corms in plastic bags and closely tying theopen end with rubber bands reduces the decay severity and percentage weight loss [45].For commercial handling purposes, packing in polyethylene bags often follows the se-lection of good-quality corms, fungicide application and draining, and air drying. It hasbeen reported that the storage life of corms in such bags was 26 to 40 days longer thanthe life of those packed in cartons [7]. Taros stored in polyethylene bags showed a 6%loss in fresh weight and 50% decay; tannia suffered a 9% weight loss and 30% decay[17]. In comparison with traditional storage in trenches or pits, corms kept in polyethy-lene bags survived well for up to 30 days without appreciable changes in taste and

226 Root Crops
texture. Dipping corms in 1% NaCl before storage in polythene bags provided additionalprotection against fungal infection [35], and the best storage results were obtained whenthe petioles and corm apex were left intact. Ash may be added as a fungicide.
Storage media such as coir dust and hull ash have been reported to increase storagelife and reduce the severity of decay of corms. In trials withColocasia(dasheen type),placing corms in a medium of rice-hull ash extended the usual storage life of corms by14 days [46]. The following procedure was followed: Corms with petioles and about 5cm of leaf stalk were packed in boxes made of marine plywood (46× 61× 31 cm),and rice-hull ash (40%–45% moisture) was spread evenly at the bottom of the box ata thickness of about 5 cm. A layer of corms was placed on the ash and covered withanother layer of the same medium about 3 cm thick. This arrangement allowed 10 cormsin a box. Results showed that after 30 days, storage, corms stored in moist rice-hull ashhad the least weight loss (8.5%) and severity of decay (<20%) compared with cormsstored without any medium, which had decay severity 80% or greater. In addition, cormsstored without medium also were the first to show severe decay.
The presence of roots and petioles affects the storage potential of edible aroids. In astudy of three groups of taro corms (without petiole and growing point; with a growingpoint and 15 cm petiole; and with a growing point and 30 cm petiole), packed in plasticboxes (46× 30× 15 cm) and stored inside a building with adequate ventilation andlighting (20.7–24.3◦C) over a period of 5 weeks, the corms incurred weight losses of16.1%, 22.0%, and 27.4%, respectively [47].
In another study [48] with four categories of taro corms (group I with roots and peti-oles, group II with petiole and roots removed, group III with roots and petiole removed,and group IV with roots and petiole intact) stored under ambient conditions (27–32◦C,65%–85% relative humidity) over a period of 2 weeks group I corms showed a smallerweight loss and more severe decay (20% of total corm area); groups II and IV showedmore weight loss but less decay. Group IV also had less decay and more weight lossthan group I when corms were stored in a modified clamp or in a hut. The biochemicalpathways or physiological mechanisms for the reduction of decay in corms stored withpetioles and roots is not yet known; however, the greater weight loss was attributed tothe increased surface area for moisture transport due to the presence of petiole and roots,in addition to the high sap and water content of the petiole.
Tannia corms can be stored satisfactorily in damp coir media with significant reduc-tions in weight loss and decay incidence. During a 6-week storage trial in which ediblearoids were put in boxes containing coir dust and stored under ambient conditions (27–32◦C), taro corms showed a 28% weight loss and 50% decay, while weight loss anddecay were 30% and 25%, respectively [17]. If corms were stored in boxes containingmoist coir, taro showed a 21% weight loss and 50% decay, while weight loss and decaywere only 7% and 5%, respectively. For best results, it important to ensure that the coiris damp and not wet, as the latter exacerbates decay of corms.
2.6.5 Control of Storage Diseases and Disorders
Rot and decay of stored corms is a problem with edible aroids and can be causedby representatives of all the major taxonomic groups [4]. Fungicide application is often
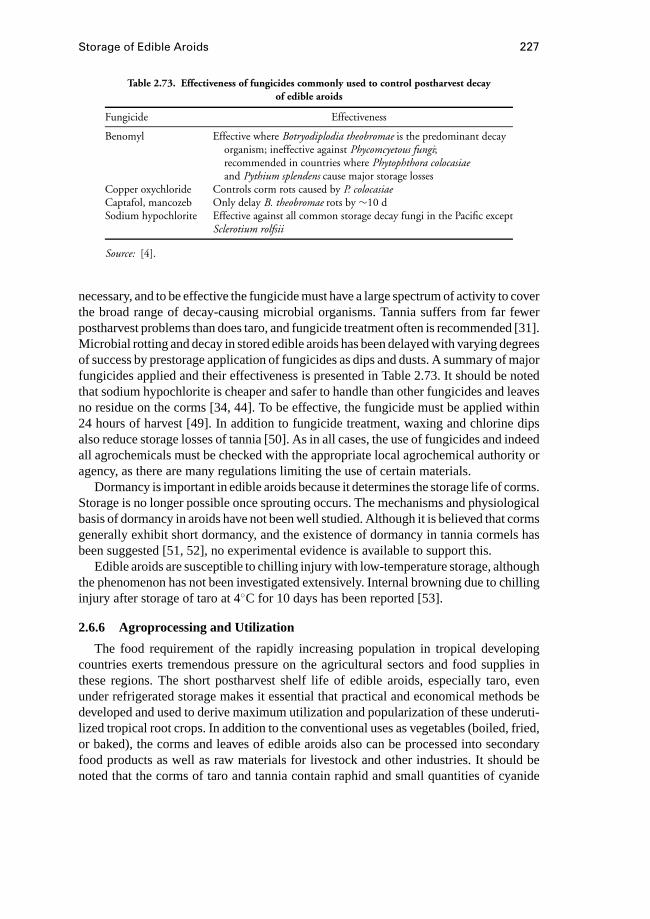
Storage of Edible Aroids 227
Table 2.73. Effectiveness of fungicides commonly used to control postharvest decayof edible aroids
Fungicide Effectiveness
Benomyl Effective where Botryodiplodia theobromae is the predominant decayorganism; ineffective against Phycomcyetous fungi;recommended in countries where Phytophthora colocasiaeand Pythium splendens cause major storage losses
Copper oxychloride Controls corm rots caused by P. colocasiaeCaptafol, mancozeb Only delay B. theobromae rots by ∼10 dSodium hypochlorite Effective against all common storage decay fungi in the Pacific except
Sclerotium rolfsii
Source: [4].
necessary, and to be effective the fungicide must have a large spectrum of activity to coverthe broad range of decay-causing microbial organisms. Tannia suffers from far fewerpostharvest problems than does taro, and fungicide treatment often is recommended [31].Microbial rotting and decay in stored edible aroids has been delayed with varying degreesof success by prestorage application of fungicides as dips and dusts. A summary of majorfungicides applied and their effectiveness is presented in Table 2.73. It should be notedthat sodium hypochlorite is cheaper and safer to handle than other fungicides and leavesno residue on the corms [34, 44]. To be effective, the fungicide must be applied within24 hours of harvest [49]. In addition to fungicide treatment, waxing and chlorine dipsalso reduce storage losses of tannia [50]. As in all cases, the use of fungicides and indeedall agrochemicals must be checked with the appropriate local agrochemical authority oragency, as there are many regulations limiting the use of certain materials.
Dormancy is important in edible aroids because it determines the storage life of corms.Storage is no longer possible once sprouting occurs. The mechanisms and physiologicalbasis of dormancy in aroids have not been well studied. Although it is believed that cormsgenerally exhibit short dormancy, and the existence of dormancy in tannia cormels hasbeen suggested [51, 52], no experimental evidence is available to support this.
Edible aroids are susceptible to chilling injury with low-temperature storage, althoughthe phenomenon has not been investigated extensively. Internal browning due to chillinginjury after storage of taro at 4◦C for 10 days has been reported [53].
2.6.6 Agroprocessing and Utilization
The food requirement of the rapidly increasing population in tropical developingcountries exerts tremendous pressure on the agricultural sectors and food supplies inthese regions. The short postharvest shelf life of edible aroids, especially taro, evenunder refrigerated storage makes it essential that practical and economical methods bedeveloped and used to derive maximum utilization and popularization of these underuti-lized tropical root crops. In addition to the conventional uses as vegetables (boiled, fried,or baked), the corms and leaves of edible aroids also can be processed into secondaryfood products as well as raw materials for livestock and other industries. It should benoted that the corms of taro and tannia contain raphid and small quantities of cyanide

228 Root Crops
and therefore should not be fed to humans or livestock without cooking. Raphids areminute bundles of crystals of calcium oxalate (0.1%–0.4% of fresh weight of taro), whichaccounts for the irritating effect of the raw corm.
Processed FoodThe readily digestible small starch grains of taro (1–4µm) compared with the large
grains of tannia (17–20µm) makes taro suitable for several food products especiallyas food for potentially allergic infants, and persons with gastrointestinal disorders [2].Among the root crops, taro is perhaps most widely prepared or processed into moreconsumable forms. These include poi (fresh or fermented paste, canned, and canned-acidified), flour, cereal base, beverage powders, chips, sun-dried slices, grits, and drum-dried flakes [54, 55].
Cocoyam flour can be manufactured in several ways, but the key operations includepeeling fresh or precooked corms and cormels, drying, and grinding into flour. In com-mercial practice, the flour is made by peeling the corms and cormels, slicing them, andwashing them thoroughly with water to remove adhering mucilage. After soaking in wa-ter overnight, the slices are washed and immersed in 0.25% sulphurous acid for 3 hours.Finally, the slices are blanched in boiling water for 4 to 5 minutes, dried thoroughly at 57to 60◦C, and then milled into flour. The details and comparison of alternative processesfor manufacturing cocoyam flour are well documented [54], including those developedand practiced in Hawaii, India, Samoa, and Nigeria.
The corms and cormels of cocoyams can be boiled and pounded into a paste likepounded yam in parts of West Africa. In southeastern Nigeria in particular, boiled co-coyams also can be mixed with boiled yam or gari (a type of cassava flour) and poundedinto a paste. The paste usually is made into balls and swallowed after dipping in soup orstew.
Taro also can be processed into poi, which is a purplish-gray paste. Poi is consideredan excellent food and is popular in Hawaii and the South Pacific. It is sold commerciallyin plastic bags, jars, or cans in Hawaii. Poi is prepared as follows: First, the corms andcormels are pressure-cooked, washed, peeled, and mashed into a semifluid consistency;the product then is passed through a series of strainers, the final strainer having a 0.5-mmdiameter grade; and finally, the product is bagged and sold as fresh drink or stored inroom temperature to ferment through the action ofLactobacillsspp. bacteria. Followingthe fermentation, the product becomes more acidic (pH declines from about 5.7 to 3.9).In some areas, coconut products may be added to the fermented poi before consumption.
Canned fresh (“ready-to-eat”) poi is the unfermented product less than 4 hours old con-taining 18% total solids or more. For a standard 566-g can, the thermal process requiresabout 100 minutes of cooking time at 116◦C [56]. On the other hand, canned-acidifiedpoi is the unfermented product less than 4 hours old to which 1% w/w commercial-gradelactic acid (50% lactic acid) has been added. It usually contains 18% or more total solids,with a shelf life comparable to other canned foods [56]. In trials with gamma-radiation,a minimum of 7 kGy was required to increase the shelf life of poi to 7 to 10 days [57].High-quality dehydrated poi made by freeze-drying has been reported; however, theprocess was considered expensive.
Storage of Edible Aroids 229
The edible aroids, and in particular taro, can be made into about a dozen differentfood products. An extensive review of the experimental and commercial processes forthese products can be found in ref. [54], and readers interested in these details areadvised to consult this reference. In summary, these reports demonstrate that stableintermediate products such as flour and dried slices can be prepared and further extrudedinto convenient, ready-to-use, stable forms such as taro rice, noodles, and macaroni.
Animal FeedstuffIn many parts of the tropics and subtropics where cocoyam and other root crops are
grown as staple foods, development of the livestock industries still is hampered by thelack of or inadequate production of feeds. Often, imported feeds are too expensive forfarmers in these subsistence environments. The use of cocoyam by-products includingleaves potentially could maximize animal production at minimum expense to assist inmeeting the food requirements in these areas. Besides the benefit of producing animalfeed and therefore either a new source of income or the ability to feed more domesticlivestock, removal of the leaves would improve field sanitation [58] and reduce thesubsequent land preparation required.
It has been noted that root crops in general, and taro in particular, would make anexcellent source of animal feed [59]. Silage made from the entire crop was suggestedspecifically. Indeed, taro corms, cormels, and leaves are used to a limited extent as animalfeed. This limited use is attributed to the acridity problem that renders the leaves, petioles,and corms unacceptable for use without costly, high-energy preparation [60]. All partsof the plant contain acrid principles that are irritating to the mouth and esophagus; thesecan be removed by cooking or fermentation.
The potential of cocoyams as an animal feed is too great to be ignored, considering thehigh yield of petioles, top, and leaves. Based on an average of 2 kg of taro tops per plantper 31 weeks and a spacing of 80× 80 cm, a yield of 52.5 metric ton per hectare per yearhas been estimated [61]. Some aroids such as giant taro can yield up to 167.8 metric tonof leaves and stems per hectare per year. Optimum fertilizer application raised the yieldto 226.8 metric ton per hectare per year, the equivalent of 27.2 metric ton dry matter with34% crude protein and 17% carbohydrates [62, 63]. Experimental trials indicate that upto 7 ton of taro leaves and petioles per hectare can be achieved in a 3-month period [64].Yields of 9 to 14 and 16 to 25 ton·ha−1·y−1 fresh weight of tops have been reported forLehua Maoli and Bun-Long aroids, respectively [61].
Considering the high moisture content of the plant tops (up to 88%) in addition to theacridity problem, there is clearly the need for some level of processing for storage andneutralization of the acridity if root and tuber crops are to used for animal feed. Field-drying alone cannot adequately meet this requirement for leaves, tops, and petioles,considering their high moisture content and the environmental conditions under whichthe crop is grown. The silage process therefore has been recommended, and the goal isto have the material ferment quickly and reach a state of equilibrium [65]. A good silagetherefore should have less than 75% moisture, a pH of 4.5 or below, a low ammoniacnitrogen level; little or no butyric acid, and a lactic-acid content of 3% to 13% on adry-matter basis [65–67].

230 Root Crops
Figure 2.69. Typical cross-sectional view of a trench silo for ensiling taro. (Source: [68])
The silage process is well documented in general agriculture literature. It dependsprimarily on lactobacilli acting in anaerobic conditions to lower the pH of the foragethrough production of lactic and other organic acids to preserve the material. The avail-ability of carbohydrates in the forage as an energy source for the lactobacilli is critical.For materials destined for ensiling, proper harvesting and packing techniques must beused to ensure that air is excluded from the trench. This also prevents the productionof unwanted products such as butyric acid. Successful ensilage is measured in terms ofthe efficiency of preservation and the usefulness of the end products for animal feed.The lactic acid is the primary constituent that preserves the silage and also has a positivecorrelation with animal intakes due to increased palatability. However, the primary factoraffecting the performance of animal feed on silage is the feeding value of the crop at theonset of ensiling [68].
Experimental trench silos have been constructed and used successfully to ensile theleaf, petiole, and whole parts of taro (Fig. 2.69). Based on test results, it was found thatthe acrid factor or factors in taro were either neutralized or destroyed, whereas the raw,unensiled material was quite acrid and caused irritation to workers handling the material.In addition to these results, other studies on the feeding value of taro silage have shownthat the fermentation characteristics are comparable with other silage, and that taro silagecould meet much of the feed needs for brood sows with no reproductive problems andgood litter performance [61].
The problem posed by the high moisture content of taro silage (90%–92% water)as an animal feed can be minimized by ensiling taro tops along with other feedstuffs
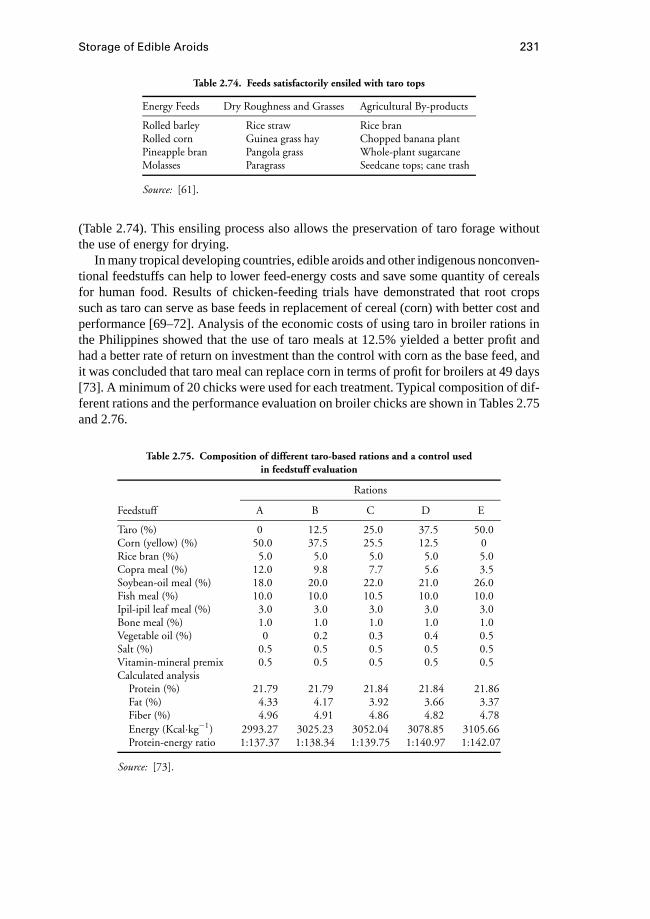
Storage of Edible Aroids 231
Table 2.74. Feeds satisfactorily ensiled with taro tops
Energy Feeds Dry Roughness and Grasses Agricultural By-products
Rolled barley Rice straw Rice branRolled corn Guinea grass hay Chopped banana plantPineapple bran Pangola grass Whole-plant sugarcaneMolasses Paragrass Seedcane tops; cane trash
Source: [61].
(Table 2.74). This ensiling process also allows the preservation of taro forage withoutthe use of energy for drying.
In many tropical developing countries, edible aroids and other indigenous nonconven-tional feedstuffs can help to lower feed-energy costs and save some quantity of cerealsfor human food. Results of chicken-feeding trials have demonstrated that root cropssuch as taro can serve as base feeds in replacement of cereal (corn) with better cost andperformance [69–72]. Analysis of the economic costs of using taro in broiler rations inthe Philippines showed that the use of taro meals at 12.5% yielded a better profit andhad a better rate of return on investment than the control with corn as the base feed, andit was concluded that taro meal can replace corn in terms of profit for broilers at 49 days[73]. A minimum of 20 chicks were used for each treatment. Typical composition of dif-ferent rations and the performance evaluation on broiler chicks are shown in Tables 2.75and 2.76.
Table 2.75. Composition of different taro-based rations and a control usedin feedstuff evaluation
Rations
Feedstuff A B C D E
Taro (%) 0 12.5 25.0 37.5 50.0Corn (yellow) (%) 50.0 37.5 25.5 12.5 0Rice bran (%) 5.0 5.0 5.0 5.0 5.0Copra meal (%) 12.0 9.8 7.7 5.6 3.5Soybean-oil meal (%) 18.0 20.0 22.0 21.0 26.0Fish meal (%) 10.0 10.0 10.5 10.0 10.0Ipil-ipil leaf meal (%) 3.0 3.0 3.0 3.0 3.0Bone meal (%) 1.0 1.0 1.0 1.0 1.0Vegetable oil (%) 0 0.2 0.3 0.4 0.5Salt (%) 0.5 0.5 0.5 0.5 0.5Vitamin-mineral premix 0.5 0.5 0.5 0.5 0.5Calculated analysis
Protein (%) 21.79 21.79 21.84 21.84 21.86Fat (%) 4.33 4.17 3.92 3.66 3.37Fiber (%) 4.96 4.91 4.86 4.82 4.78Energy (Kcal·kg−1) 2993.27 3025.23 3052.04 3078.85 3105.66Protein-energy ratio 1:137.37 1:138.34 1:139.75 1:140.97 1:142.07
Source: [73].

232 Root Crops
Table 2.76. Cost and feed performance analysis on broiler chicks fed on taro meal
Treatment
Taro Meal 0% 12.5% 25% 37.5% 50%
Cost of 25.85 a 24.24 abc 25.44 ab 25.04 abc 22.04 dproduction (P)
Profit (P) 4.36 b 6.16 a 0.84 c −3.72 d −3.77 eReturn on 16.89 b 25.41 a 3.21 c −14.87 d −17.11 e
investment (P)Feed cost per kg 15.26 d 14.99 d 17.77 c 24.95 b 30.97 a
live weight (P)Initial weight (kg) 46.9 46.9 46.9 46.9 46.9Weight gain (kg) 1324.8 ab 1335.1 a 1148.6 c 922.1 d 798.47 dFeed 3634 cd 3638.2 cd 3770.9 c 4342.2 b 4678.3 a
consumption (kg)Feed conversion 2.05 cd 2.02 cd 2.35 c 3.24 b 4.12 a
efficiency
Adapted from [73].Note: Any two means having a common letter in a row are not significantly different at 5% using DMRT.P, Phillipine pesos.
Industrial Raw MaterialsIndustrial use of edible aroids is very limited, although the starch (an important
industrial raw material) content of taro, for instance, accounts for nearly 78% of thecarbohydrate fraction (Table 2.77). The small size of the taro starch grains (1–4µm)makes them readily digestible as a food material but unsuitable as a source of industrialstarch. Furthermore, although the protein content of taro corms (1.4% to 3.0% on fresh-weight basis and about 7% on a dry-weight basis) is slightly higher than that of othermajor root and crops, and they are also rich in essential amino acids, they are rather lowin histidine, lysine, isoleucine, tryptophan, and methionine [2].
Despite the considerable efforts made and some success achieved in promoting thegrowing and utilization of aroids as a food source in many tropical developing coun-tries, economic considerations such as high labor demand and special agroclimatologyrequirements for crop growth so far have hampered the exploitation of edible aroids
Table 2.77. Fractional analysis ofcarbohydrate content of taro corm
Component %
Starch 77.9Pentosans 2.6Crude protein 1.4Dextrin 0.5Reducing sugars 0.5Sucrose 0.1Amylose 17–28
Sources: [74, 75].
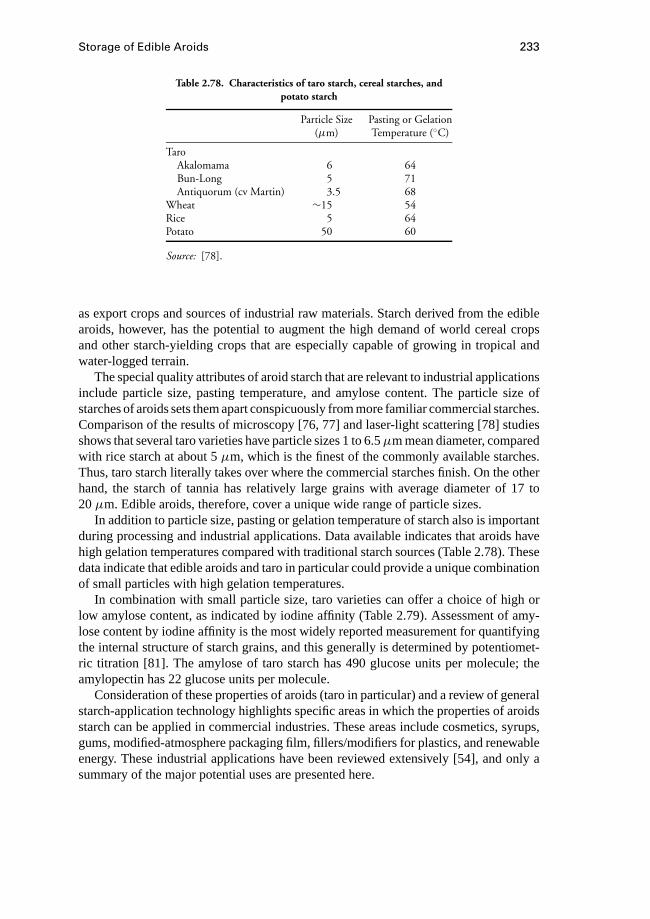
Storage of Edible Aroids 233
Table 2.78. Characteristics of taro starch, cereal starches, andpotato starch
Particle Size Pasting or Gelation(µm) Temperature (◦C)
TaroAkalomama 6 64Bun-Long 5 71Antiquorum (cv Martin) 3.5 68
Wheat ∼15 54Rice 5 64Potato 50 60
Source: [78].
as export crops and sources of industrial raw materials. Starch derived from the ediblearoids, however, has the potential to augment the high demand of world cereal cropsand other starch-yielding crops that are especially capable of growing in tropical andwater-logged terrain.
The special quality attributes of aroid starch that are relevant to industrial applicationsinclude particle size, pasting temperature, and amylose content. The particle size ofstarches of aroids sets them apart conspicuously from more familiar commercial starches.Comparison of the results of microscopy [76, 77] and laser-light scattering [78] studiesshows that several taro varieties have particle sizes 1 to 6.5µm mean diameter, comparedwith rice starch at about 5µm, which is the finest of the commonly available starches.Thus, taro starch literally takes over where the commercial starches finish. On the otherhand, the starch of tannia has relatively large grains with average diameter of 17 to20µm. Edible aroids, therefore, cover a unique wide range of particle sizes.
In addition to particle size, pasting or gelation temperature of starch also is importantduring processing and industrial applications. Data available indicates that aroids havehigh gelation temperatures compared with traditional starch sources (Table 2.78). Thesedata indicate that edible aroids and taro in particular could provide a unique combinationof small particles with high gelation temperatures.
In combination with small particle size, taro varieties can offer a choice of high orlow amylose content, as indicated by iodine affinity (Table 2.79). Assessment of amy-lose content by iodine affinity is the most widely reported measurement for quantifyingthe internal structure of starch grains, and this generally is determined by potentiomet-ric titration [81]. The amylose of taro starch has 490 glucose units per molecule; theamylopectin has 22 glucose units per molecule.
Consideration of these properties of aroids (taro in particular) and a review of generalstarch-application technology highlights specific areas in which the properties of aroidsstarch can be applied in commercial industries. These areas include cosmetics, syrups,gums, modified-atmosphere packaging film, fillers/modifiers for plastics, and renewableenergy. These industrial applications have been reviewed extensively [54], and only asummary of the major potential uses are presented here.
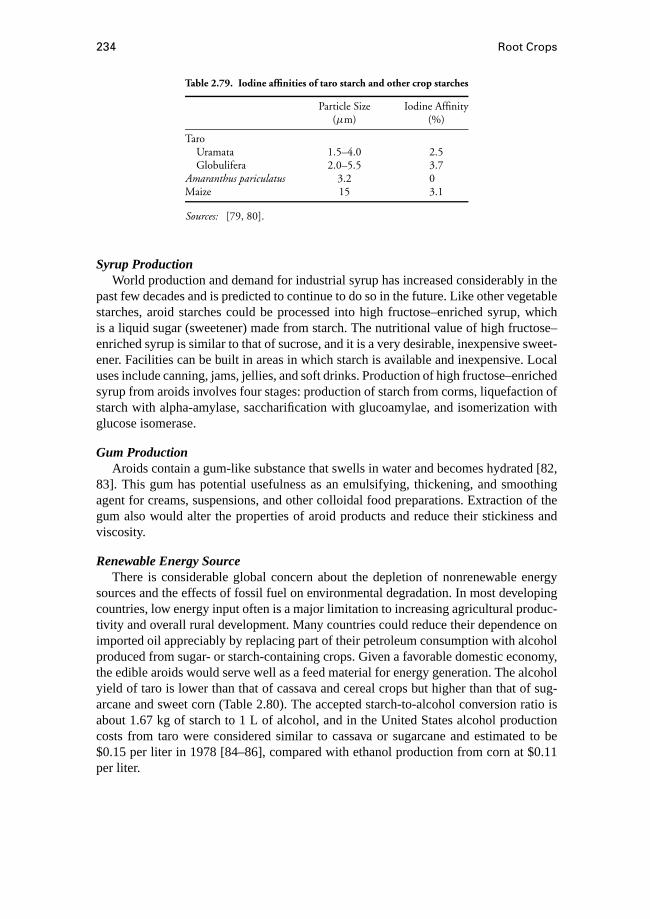
234 Root Crops
Table 2.79. Iodine affinities of taro starch and other crop starches
Particle Size Iodine Affinity(µm) (%)
TaroUramata 1.5–4.0 2.5Globulifera 2.0–5.5 3.7
Amaranthus pariculatus 3.2 0Maize 15 3.1
Sources: [79, 80].
Syrup ProductionWorld production and demand for industrial syrup has increased considerably in the
past few decades and is predicted to continue to do so in the future. Like other vegetablestarches, aroid starches could be processed into high fructose–enriched syrup, whichis a liquid sugar (sweetener) made from starch. The nutritional value of high fructose–enriched syrup is similar to that of sucrose, and it is a very desirable, inexpensive sweet-ener. Facilities can be built in areas in which starch is available and inexpensive. Localuses include canning, jams, jellies, and soft drinks. Production of high fructose–enrichedsyrup from aroids involves four stages: production of starch from corms, liquefaction ofstarch with alpha-amylase, saccharification with glucoamylae, and isomerization withglucose isomerase.
Gum ProductionAroids contain a gum-like substance that swells in water and becomes hydrated [82,
83]. This gum has potential usefulness as an emulsifying, thickening, and smoothingagent for creams, suspensions, and other colloidal food preparations. Extraction of thegum also would alter the properties of aroid products and reduce their stickiness andviscosity.
Renewable Energy SourceThere is considerable global concern about the depletion of nonrenewable energy
sources and the effects of fossil fuel on environmental degradation. In most developingcountries, low energy input often is a major limitation to increasing agricultural produc-tivity and overall rural development. Many countries could reduce their dependence onimported oil appreciably by replacing part of their petroleum consumption with alcoholproduced from sugar- or starch-containing crops. Given a favorable domestic economy,the edible aroids would serve well as a feed material for energy generation. The alcoholyield of taro is lower than that of cassava and cereal crops but higher than that of sug-arcane and sweet corn (Table 2.80). The accepted starch-to-alcohol conversion ratio isabout 1.67 kg of starch to 1 L of alcohol, and in the United States alcohol productioncosts from taro were considered similar to cassava or sugarcane and estimated to be$0.15 per liter in 1978 [84–86], compared with ethanol production from corn at $0.11per liter.
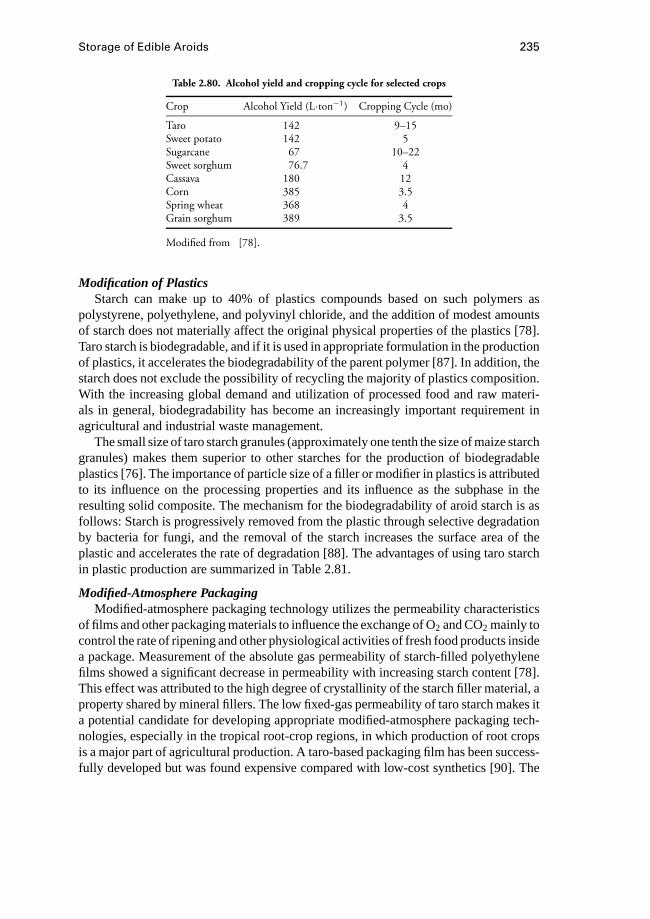
Storage of Edible Aroids 235
Table 2.80. Alcohol yield and cropping cycle for selected crops
Crop Alcohol Yield (L·ton−1) Cropping Cycle (mo)
Taro 142 9–15Sweet potato 142 5Sugarcane 67 10–22Sweet sorghum 76.7 4Cassava 180 12Corn 385 3.5Spring wheat 368 4Grain sorghum 389 3.5
Modified from [78].
Modification of PlasticsStarch can make up to 40% of plastics compounds based on such polymers as
polystyrene, polyethylene, and polyvinyl chloride, and the addition of modest amountsof starch does not materially affect the original physical properties of the plastics [78].Taro starch is biodegradable, and if it is used in appropriate formulation in the productionof plastics, it accelerates the biodegradability of the parent polymer [87]. In addition, thestarch does not exclude the possibility of recycling the majority of plastics composition.With the increasing global demand and utilization of processed food and raw materi-als in general, biodegradability has become an increasingly important requirement inagricultural and industrial waste management.
The small size of taro starch granules (approximately one tenth the size of maize starchgranules) makes them superior to other starches for the production of biodegradableplastics [76]. The importance of particle size of a filler or modifier in plastics is attributedto its influence on the processing properties and its influence as the subphase in theresulting solid composite. The mechanism for the biodegradability of aroid starch is asfollows: Starch is progressively removed from the plastic through selective degradationby bacteria for fungi, and the removal of the starch increases the surface area of theplastic and accelerates the rate of degradation [88]. The advantages of using taro starchin plastic production are summarized in Table 2.81.
Modified-Atmosphere PackagingModified-atmosphere packaging technology utilizes the permeability characteristics
of films and other packaging materials to influence the exchange of O2 and CO2 mainly tocontrol the rate of ripening and other physiological activities of fresh food products insidea package. Measurement of the absolute gas permeability of starch-filled polyethylenefilms showed a significant decrease in permeability with increasing starch content [78].This effect was attributed to the high degree of crystallinity of the starch filler material, aproperty shared by mineral fillers. The low fixed-gas permeability of taro starch makes ita potential candidate for developing appropriate modified-atmosphere packaging tech-nologies, especially in the tropical root-crop regions, in which production of root cropsis a major part of agricultural production. A taro-based packaging film has been success-fully developed but was found expensive compared with low-cost synthetics [90]. The
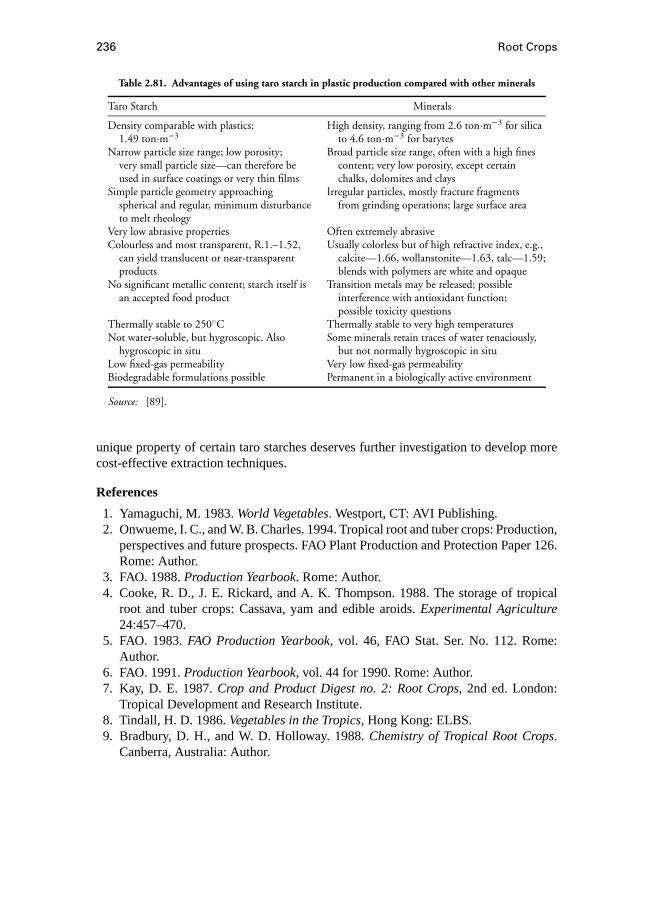
236 Root Crops
Table 2.81. Advantages of using taro starch in plastic production compared with other minerals
Taro Starch Minerals
Density comparable with plastics: High density, ranging from 2.6 ton·m−3 for silica1.49 ton·m−3 to 4.6 ton·m−3 for barytes
Narrow particle size range; low porosity; Broad particle size range, often with a high finesvery small particle size—can therefore be content; very low porosity, except certainused in surface coatings or very thin films chalks, dolomites and clays
Simple particle geometry approaching Irregular particles, mostly fracture fragmentsspherical and regular, minimum disturbance from grinding operations; large surface areato melt rheology
Very low abrasive properties Often extremely abrasiveColourless and most transparent, R.1.–1.52, Usually colorless but of high refractive index, e.g.,
can yield translucent or near-transparent calcite—1.66, wollanstonite—1.63, talc—1.59;products blends with polymers are white and opaque
No significant metallic content; starch itself is Transition metals may be released; possiblean accepted food product interference with antioxidant function;
possible toxicity questionsThermally stable to 250◦C Thermally stable to very high temperaturesNot water-soluble, but hygroscopic. Also Some minerals retain traces of water tenaciously,
hygroscopic in situ but not normally hygroscopic in situLow fixed-gas permeability Very low fixed-gas permeabilityBiodegradable formulations possible Permanent in a biologically active environment
Source: [89].
unique property of certain taro starches deserves further investigation to develop morecost-effective extraction techniques.
References
1. Yamaguchi, M. 1983.World Vegetables. Westport, CT: AVI Publishing.2. Onwueme, I. C., and W. B. Charles. 1994. Tropical root and tuber crops: Production,
perspectives and future prospects. FAO Plant Production and Protection Paper 126.Rome: Author.
3. FAO. 1988.Production Yearbook. Rome: Author.4. Cooke, R. D., J. E. Rickard, and A. K. Thompson. 1988. The storage of tropical
root and tuber crops: Cassava, yam and edible aroids.Experimental Agriculture24:457–470.
5. FAO. 1983.FAO Production Yearbook, vol. 46, FAO Stat. Ser. No. 112. Rome:Author.
6. FAO. 1991.Production Yearbook, vol. 44 for 1990. Rome: Author.7. Kay, D. E. 1987.Crop and Product Digest no. 2: Root Crops, 2nd ed. London:
Tropical Development and Research Institute.8. Tindall, H. D. 1986.Vegetables in the Tropics, Hong Kong: ELBS.9. Bradbury, D. H., and W. D. Holloway. 1988.Chemistry of Tropical Root Crops.
Canberra, Australia: Author.
Storage of Edible Aroids 237
10. FAO. 1968.Food Consumption Table for Use in Africa, Bethesda, MD: FAO andU.S. Department of Health, Education and Welfare.
11. FAO. 1972. FoodConsumption Table for Use in East Asia. Rome: Author.12. Platt, B. S. 1962. Table of representative values of food commonly used in tropical
countries, Medical Research Council, Spec. Rep. Series No. 302. London: HMSO13. Tindall, H. D. 1983.Vegetables in the Tropics. London: The MacMillan Press.14. Booth, R. H. 1982. Storage. InPest Control in Tropical Root Crops, PANS Manual
No. 4, pp. 37–55 London: Centre for Overseas Pest Research.15. Praquin, J. Y., and J. C. Miche. 1971. Essai de conservation de taros et macabo au
Cameroun. IRAT, Station de Dschang, Report preliminaire 1.16. Okeke, G. C. 1982. Studies on the etiology and symptomatology of root and storage
rot disease of cocoyam in Nigeria.Beitraege zur tropischem Landwirtschaft undveterinaermedizin20:287–293.
17. Passam, H. C. 1982. Experiments on the storage of eddoes and tannia (ColocasiaandXanthosomaspp.) under tropical ambient conditions.Tropical Science24(2):9–46.
18. Maduewesi, J. N. C., and R. C. I. Onyike. 1981. Fungal rotting of cocoyams in storagein Nigeria. InTropical Root Crops: Research Strategies for the 1980s, Proceedingsof the 1st Triennial Root Crops Symposium, ed. E. R. Terry, K. A. Oduro, and F.Caveness, pp. 235–238. ISTRC-Africa Branch, 8–12 September, Ibadan, Nigeria.
19. Nwufo, M. I., and A. O. Fajola. 1981. Storage rot diseases of cocoyam (Colocasiaesculenta) in South Eastern Nigeria.J. Root Crops7(62):53–59.
20. Ogundana, S. K. 1977. The pathogenicity of the fungi causing rot in the corms ofcocoyam (Xanthosoma sagittifolium). International Biodeterioration and Bulletin13(1):5–8.
21. Gollifer, D. E., and R. H. Booth. 1973. Storage losses of taro corms in the BritishSolomon Islands Protectorate.Ann. Appl. Biol. 73:349–356.
22. Posnette, A. F. 1945. Root-rot of cocoyams (Xanthosoma sagittifolium(L.)). TropicalAgriculture, Trinidad22(9):164–170.
23. Baybay, D. S. 1922. Storage of some root crops and other perishable farm products.Philippine Agriculture10:429–430.
24. Rice, R. P., L. W. Rice., and H. D. Tindall. 1990.Fruit and Vegetable Production inWarm Climates. London: The MacMillan Press.
25. Baryeh, E. A. 1993. Infestation, damage and grading of cocoyam.AgriculturalMechanisation in Asia, Africa and Latin America24(2):43–46, 50.
26. IRETA. September, 1997. Postharvest systems for improved quality of Pacific Islandexport taro.IRETA’s South Pacific Agricultural News, p. 7.
27. Been, B. O., J. Marriott, and C. Perkins. 1975. Wound periderm formation in dasheenand its effects on storage. InProceedings of a Meeting of the Caribbean Food CropSociety held in Trinidad, p. 13.
28. Baumgardner, R. A., and L. E. Scott. 1963. The relation of pectin substances tofirmness of processed sweet potatoes.Proc. Amer. Soc. Hort. Sci.83:629.
29. Booth, R. H. 1974. Postharvest deterioration of tropical root crops: Losses and theircontrol.Trop. Sci.16:49.
238 Root Crops
30. Agbor-Egbe, T. A. 1989. Study of the composition and changes occurring duringstorage of a range of edible aroids. Ph.D. diss. University of Reading, U.K.
31. Agbo-Egbe, T., and J. E. Rickard. 1991. Study on the factors affecting storage ofedible aroids.Ann. Appl. Biol.119:121–130.
32. Rickard, J. E. 1981. Biochemical changes involved in post-harvest deterioration ofcassava roots.Trop. Sci.23:235.
33. Plucknett, D. L., and M. S. White. 1979. Storage and processing of taro in thePeoples Republic of China. InSmall-scale Processing and Storage of Tropical RootCrops, ed. D. L. Plucknett, pp. 119–123, Westview Trop. Agr. Series, no. 1. Boulder,Colorado: Westview Press.
34. Jackson, G. V. H., D. E. Golifer, J. A. Pinegar, and F. J. Newhook. 1979.The use of fungicides against post-harvest decay of stored taro in the SolomonIslands. InSmall-scale Processing and Storage of Tropical Root Crops, ed. D. L.Plucknett, pp. 130–150, Westview Trop. Agr. Series, no. 1. Boulder, CL: WestviewPress.
35. Rickard, J. E. 1983. Post-harvest management of taro (Colocasia esculentavaresculenta). Alafua Agric. Bull.8:43.
36. Thompson, A. K. 1996.Postharvest Technology of Fruit and Vegetables. Oxford:Blackwell Science.
37. Gooding, H. J., and J. S. Campbell. 1961. Preliminary trials of West AfricanXanthosoma cultivars.Tropical Agriculture (Trinidad)38:145.
38. Snowdon, A. L. 1991.A Colour Atlas of Postharvest Diseases and Disorders ofFruits and Vegetables, vol. 2:Vegetables.London: Wolfe Scientific.
39. Wardlaw, C. W. 1937. Tropical fruits and vegetables: An account of their storageand transport. Low Temperature Research Station, Imperial College of TropicalAgriculture, Trinidad, Memoir 7.
40. SeaLand. 1991.Shipping Guide to Perishable. Iselin, NJ: SeaLand Service Inc.41. Lutz, J. M., and R. E. Hardenburg. 1968. The commercial storage of fruits, veg-
etables and florist and nursery stocks. U.S. Department of Agriculture, AgricultureHandBook 66.
42. Pantastico, E. B., ed. 1975.Postharvest Physiology, Handling and Utilisa-tion of Tropical and Sub-tropical Fruits and Vegetables. Westpoint, CT: AVIPublishing.
43. Guide to Food Transport: Fruit and Vegetables. 1989. Mercantilia Publishers.44. Wilson, J. E. 1983. Storage of taro corms and leaves.Alafua Agric. Bull.8(2):35–37.45. Quevedo, M. A., R. T. Sanico, and M. E. Baliao. 1991. The control of post-harvest
diseases of taro corms.Trop. Sci.31:359.46. Quevedo, M. A., and A. D. Ramos. 1988. Storage medium for taro corms.Radix
10:6.47. Pardales, J. R., R. S. de la Pena, and F. M. Melchor. 1982. Effects of temperature
and methods of preparation on the storability of upland taro corms.Radix4:12.48. Quevedo, M. A., and A. D. Ramos. 1992. Method of corm preparation for storage
of taro corm.Trop. Science32:121.

Storage of Edible Aroids 239
49. Adams, H., A. Pattanjalidal, and Clark. 1985. Effects of metalaxyl and benomylon post-harvest decay of corms of dasshenColocasia esculenta(L.) Schott. InProceedings of the 7th Symposium of the International Society for Tropical RootCrops, Guadeloupe.
50. Burton, C. L. 1970. Diseases of tropical vegetables on the Chicago market.Trop.Agric. Trinidad47:303–313.
51. O’Hair, S. K., and M. P. Asokan. 1986. Edible aroids: Botany and horticulture.Horticultural Reviews8:43–99.
52. Plucknett, D. L. 1983. Taxonomy of the genus Colocasia. InTaro: A Review ofColocasia esculenta and its Potentials, ed. J. K. Wang. Honolulu: University ofHawaii Press.
53. Rhee, J. K., and M. Iwata. 1982. Histological observations on the chilling injury oftaro tubers during cold storage.J. Jpn. Soc. Hortic. Sci.51:362.
54. Wang, J., ed. 1983.Taro A Review of Colocasia esculenta and its Potentials.Honolulu: University of Hawaii Press.
55. Payne, J. H., G. J. Ley, and G. Akau. 1941. Processing and chemical investigationof taro. HawaiiAgr. Exp. Sta. Bull. 393, Orono, ME.
56. Sherman, G. D., G. W. Duernberg, H. Seagrave-Smith, and T. Shaw. 1952. Foodprocessor’s handbook for Hawaiian fruits and vegetables.Hawaii Agr. Expt. Sta.Progress NotesNo. 81.
57. Moy, J. H., and B. B. Lee Loy. 1969. Shelf life extension of poi by gamma irradiation.Nucl. Sci. Abst.23:1039.
58. Ooka, J. J. 1983. Taro diseases. InTaro: A Review of Colocasia esculenta and itsPotentials, ed. J. Wang, pp. 236–257. Honolulu: University of Hawaii Press.
59. Coursey, D. G., and D. Halliday. 1975. The edible aroids.World Crops20:25–30.60. Tang, C. S., and W. W. Sakai. 1983. Acridity of taro and related plants in Araceae. In
Taro: A Review of Colocasia esculenta and its Potentials, ed. J. Wang, pp. 148–164.Honolulu: University of Hawaii Press.
61. Carpenter, J. R., and W. E. Steinke. 1983. Animal feed. InTaro: A Review of Colo-casia esculenta and its Potentials, ed. J. Wang, pp. 268–300. Honolulu: Universityof Hawaii Press.
62. Peters, F. E. 1958. The chemical composition of South Pacific foods. South PacificCommission Technical Paper 115.
63. Miller, C. D. 1929. Food values of breadfruit, taro leaves, coconut and sugar cane.Bernice P. Bishop Mus. Bull. 64:1–23.
64. de la Pena, R. S. 1981. Unpublished interin report on the response of taro top yieldto cutting internal, time to initial cutting, and fertilizer. Coll. Trop. Agr. and HumanResources, Univ. of Hawaii.
65. Moore, L. A. 1962. Grass-legume silage. InForages, ed. H. D. Hughes, M. E. Heath,and D. S. Metcalfe, pp. 535–546. Ames, IA: Iowa State University Press.
66. McCullough, M. E., ed. 1978.NFIA Literature Review on Fermentation of Silage: AReview. West Des Moines, IA. Grabts-in-Aid Commitee, National Feed IngredientsAssociation.
240 Root Crops
67. Brierem, K., and O. Ulvesli. 1954. Meld. Norg.Landhr-Hogstk. 34:373–479.68. Wang, J. K., W. E. Steinke, and J. R. Carpenter. 1981. Food, feed and fuel from taro.
Paper presented at the Int. Cong. on Agricultural Engineering and Agro-Industriesin Asia, 10–13 November, Bangkok, Thailand.
69. Anigbogu, N. M. 1995. Taro as a substitute for corn in broiler rations.IITA TropicalRoot and Tuber Crops Bulletin8(2):89.
70. Diongzon, W. E. E. 1981. The future of taro genetic improvement.Radix3:1.71. Galvaz, C. F. 1980. Root crops flour: Successful substitute for wheat flour in the soy
sauce production.Radix1, July–Dec.72. Jamora and S. Danilo. 1975. Gabi: Root-crops for profit.Agric. Publishing Series
44:6–8.73. Anigbogu, N. M. 1996. Economic costs of using taro (Colocasia esculenta Linn.)
in broiler rations.IITA Tropical Root and Tuber Crops Bulletin9(1):8–10.74. Coursey, D. G. 1968. The edible aroids.World Crops20:25–30.75. Oyenuga, V. A. 1968.Nigeria’s Foods and Feeding Stuffs. Ibadan, Nigeria: Univer-
sity of Ibadan Press.76. Higashihara, M., M. Umeki, and T. Yamamoto. 1975. Isolation and some properties
of taro root starch.Denpun Kagaku(J. Japan Soc. Starch Sci.) 22:61–65.77. Radley, J. A. 1940.Starch and its Derivatives. London: Chapman and Hall.78. Griffin, G. J. L., and J. Wang. 1983. Industrial uses. InTaro: A Review of Colocasia
esculenta and its Potentials, ed. J. Wang, pp. 301–302. Honolulu: University ofHawaii Press.
79. Modi, J. D., and P. R. Kulkarni. 1976. New starches: The properties of the starchfrom Amaranthus paniculatus, Linn. Acta Alimentaro9:399.
80. Goering, K. J., and B. De Haas. 1972. New starches: VIII. Properties of the smallgranule starch fromColocasia esculenta. Cereal Chem. 49:712–719.
81. Schoch, T. J. 1964. Iodometric titration of amylose. InMethods in Carbohy-drate Chemistry, vol. 4A, ed. R. I. Whistler, pp. 157–160. New York: AcademicPress.
82. Gaind, K. N., K. S. Chopra, and A. C. Dua. 1968. Study of the mucilages of cormand tuber ofColocasia esculenta Linn: I. Emulsifying properties.Indian J. Pharm.30:208–211.
83. Gaind, K. N., K. C. Chopra, and A. C. Dua. 1969. Mucilages of corm and tuber ofColocasia esculenta Linn: II. Binding properties.Indian J. Pharm. 31:156–158.
84. Phillips. T. P. 1978. Economic implications of new techniques in cassava harvest-ing and processing. InCassava Harvesting and Processing, ed. E. J. Weber, J. H.Cock, and A. Chouinard, pp. 66–74. Proceedings of a workshop held at CIAT, Cali,Colombia, 24–28 April.
85. Milfont, W. N. 1978. Prospects of cassava fuel alcohol in Brazil. InCassava Har-vesting and Processing, ed. E. J. Weber, J. H. Cock, and A. Chouinard, pp. 46–48.Proceedings of a workshop held at CIAT, Cali, Colombia, 24–28 April.
86. Brown, L. R. 1980. Food or fuel: New competition for the world’s cropland. World-watch Paper 35. Washington, DC: Worldwatch Institute.

Storage of Edible Aroids 241
87. Griffin, G. J. L. 1979. Non-food application of starch with special reference topotential uses of taro. InSmall-scale Processing and Storage of Tropical Root Crops,ed. D. L. Plucknett, pp. 275–299. Westview Tropical Agriculture Series, no. 1.Boulder, CO: Westview Press.
88. Griffin, G. J. L. 1974. Biodegradable fillers in thermoplastics.Amer. Chem. Soc.Adv. Chem.134:159–170.
89. Plucknett, D. L., ed. 1979.Small-scale Processing and Storage of Tropical RootCrops. Westview Tropical Agriculture Series, no. 1. Boulder, CO: Westview Press.
90. Simmonds, H. R., C. Ellis, and C. W. S. Bigelow. 1943.Handbook of Plastics.London: Chapman and Hall.

242
3 Fruit and Vegetables
C. J. Studman, Co-Editor
3.1 Fruit and Vegetable QualityC. J. Studman
3.1.1 Importance of Fruits and Vegetables, and Quality Considerations
Fruit and vegetables form an essential part of a balanced diet. They are an importantpart of world agricultural food production, even though their production volumes aresmall compared with grains (Table 3.1). Fruit and vegetables are important sources ofdigestible carbohydrates, minerals, and vitamins, particularly vitamins A and C (Table3.2). In addition they provide roughage (indigestible carbohydrates), which is neededfor normal healthy digestion [1].
Technology has enabled exporters to supply markets around the world with highquality product, and in some cases to introduce and develop new markets. This hasincluded introducing new crops and often defining the quality standards for these crops.The agricultural engineer has an important role to play in enabling producers to defineand meet quality requirements.
QualityWhere fresh food is concerned, most people can decide the difference between a
product that is of good quality and one that is not. Quality is an increasingly importantfactor in the production and marketing of biological products. Consumers in many coun-tries are becoming more discerning as their affluence increases, and would-be suppliersof products must meet these demands if they are to maintain or increase market share.However, what do we mean by quality? Its assessment is very subjective and depends ona person’s viewpoint and preferences. There are three key areas to consider: its meaning,measurement, and maintenance.
3.1.2 Meaning of Quality
In the ISO 9000 standard (developed by the International Standards Organisation),quality is defined as “the totality of features and characteristics of a product or servicethat bear on its ability to satisfy stated or implied needs” [5, 6]. Kader [7] defines it forfruit and vegetables as “the combination of attributes or properties that give them valuein terms of human food.”
243
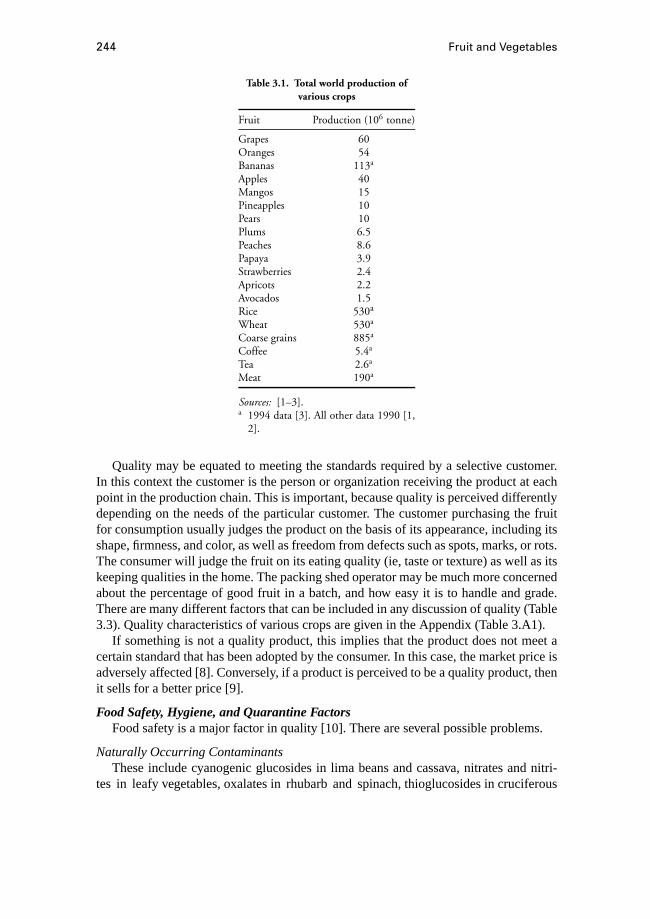
244 Fruit and Vegetables
Table 3.1. Total world production ofvarious crops
Fruit Production (106 tonne)
Grapes 60Oranges 54Bananas 113a
Apples 40Mangos 15Pineapples 10Pears 10Plums 6.5Peaches 8.6Papaya 3.9Strawberries 2.4Apricots 2.2Avocados 1.5Rice 530a
Wheat 530a
Coarse grains 885a
Coffee 5.4a
Tea 2.6a
Meat 190a
Sources: [1–3].a 1994 data [3]. All other data 1990 [1,
2].
Quality may be equated to meeting the standards required by a selective customer.In this context the customer is the person or organization receiving the product at eachpoint in the production chain. This is important, because quality is perceived differentlydepending on the needs of the particular customer. The customer purchasing the fruitfor consumption usually judges the product on the basis of its appearance, including itsshape, firmness, and color, as well as freedom from defects such as spots, marks, or rots.The consumer will judge the fruit on its eating quality (ie, taste or texture) as well as itskeeping qualities in the home. The packing shed operator may be much more concernedabout the percentage of good fruit in a batch, and how easy it is to handle and grade.There are many different factors that can be included in any discussion of quality (Table3.3). Quality characteristics of various crops are given in the Appendix (Table 3.A1).
If something is not a quality product, this implies that the product does not meet acertain standard that has been adopted by the consumer. In this case, the market price isadversely affected [8]. Conversely, if a product is perceived to be a quality product, thenit sells for a better price [9].
Food Safety, Hygiene, and Quarantine FactorsFood safety is a major factor in quality [10]. There are several possible problems.
Naturally Occurring ContaminantsThese include cyanogenic glucosides in lima beans and cassava, nitrates and nitri-
tes in leafy vegetables, oxalates in rhubarb and spinach, thioglucosides in cruciferous

Tabl
e3.
2.A
ppro
xim
ate
com
posi
tion
ofm
ajor
frui
tsgr
own
inth
ew
orld
Car
bo-
Phos
-N
icot
inic
Asc
orbi
cW
ater
Ene
rgy
Prot
ein
Fat
hydr
ate
Min
eral
sC
alci
umph
orus
Iron
Mag
nesi
umV
itam
inA
Thi
amin
eR
ibofl
avin
acid
acid
(Vit
C)
(%)
(kca
l/10
0g)
(%)
(%)
(%)
(%)
(mg/
100
g)(m
g/10
0g)
(mg/
100
g)(m
g/10
0g)
(IU
)(m
g/10
0g)
(mg/
100
g)(m
g/10
0g)
(mg/
100
g)
Gra
pes
81.6
671.
31.
015
.70.
416
120.
413
100
0.05
0.03
0.3
4O
rang
es86
.049
1.0
0.2
12.2
0.6
4120
0.4
1120
00.
100.
040.
450
Ban
anas
75.7
851.
10.
212
.60.
68
260.
733
190
0.05
0.06
0.7
10A
pple
s84
.458
0.2
0.6
14.5
0.3
710
0.3
890
0.03
0.02
0.1
4M
ango
s83
.459
0.5
0.2
15.4
0.4
1212
0.8
—63
00.
050.
060.
453
Pine
appl
es85
.452
0.4
0.2
13.7
0.3
188
0.5
—15
0.08
0.04
0.2
61Pe
ars
83.2
610.
70.
415
.30.
48
110.
37
200.
020.
040.
14
Plum
s81
.166
0.5
0.2
17.8
0.4
1817
0.5
930
00.
080.
030.
55
Peac
hes
89.1
380.
60.
19.
70.
59
190.
510
1330
0.02
0.05
1.0
7Pa
paya
90.7
320.
50.
18.
30.
420
130.
4—
110
0.03
0.04
0.3
46A
pric
ots
85.3
511.
00.
212
.80.
717
230.
512
2700
0.03
0.04
0.6
10A
vaca
dos
74.4
80.5
1.8
20.6
—1.
214
270.
723
—0.
070.
121.
911
Stra
wbe
rrie
s89
.937
0.7
0.5
8.4
0.5
2121
1.0
1260
0.03
0.07
0.6
59
Sour
ces:
[1,4
].
245

246 Fruit and Vegetables
Table 3.3. Quality factors for fresh fruit and vegetables
Hygiene and quarantine factorsQuarantine: passenger parasites (larvae, pupae,adults)Consumer safety: natural toxicants, contaminants
(spray residues, heavy metals, etc.), mycotoxins (fungi,etc.), microbial contamination
Cosmetic appearanceSize: weight, volume, dimensionsShape: regularity, length, diameterSurface texture: smoothness, waxiness, glossColor: uniformity, intensity, spectralPhysical defects: splits, cuts, dents, (apparent)
bruisesPathological/entomological: scale, fungi, insectsPhysiological: browning, genetic defects
Texture and flavor factorsTexture: firmness (hardness/softness), crispness, juiciness,
mealiness (grittiness), fibrousness (toughness)Flavor: sweetness, sourness (acidity), astringency,
bitterness, aroma (volatile compounds), off flavorsoff odors
Nutritional: dietary fiber, cancer inhibitors/accelerators,carbohydrates, proteins, lipids, vitamins, minerals
Adapted from [7].
vegetables, and glycoalkaloids (solanine) in potatoes [11]. Traditional processing andcooking practices usually remove the bulk of these contaminants, but there could beproblems if new consumers are introduced to new crops.
Natural ContaminantsMycotoxins (fungal toxins), bacterial toxins, and heavy metals occur naturally and
can be present in some crops.
Synthetic ToxicantsAgricultural chemical residues, and introduced environmental pollutants such as lead,
can be a problem unless production systems are controlled and monitored carefully. Indeveloped countries levels of these usually are very low (e.g., in the United States in themid-1990s less than 1% of products showed excessive traces [11]). In many countriesconsumers are very concerned about the levels of chemical-spray deposits found inand on fresh products. For this reason food imports often are subjected to very carefulchemical analysis. Evidence of pesticide residues above acceptable levels, or the presenceof unapproved or banned spray deposits, renders entire shipments of otherwise soundcrops unsaleable. Growers therefore must be especially concerned with ensuring thatno illegal sprays are used on crops, and that withholding periods are strictly enforced.Normal practice is to maintain a spray diary, which indicates what sprays were used onthe crop at what times prior to harvest.
Fruit and Vegetable Quality 247
Microbial ContaminationViewed by most health professionals as the most serious health concern, microbial
contamination is viewed by consumers as being less important than chemical toxicants.Bacteria can be introduced onto fresh fruit and vegetables through the use of untreatedorganic fertilizers (e.g., manure), or through insufficiently treated wastewater. Inadequatehygiene standards in packing sheds and anywhere else in the food chain can also causeproblems. The problem is exacerbated because fruit and vegetables often are eaten fresh.Washing fresh produce is a help, but the water used should also be clean and free ofcontaminants.
Clearly any biological food product must be safe to eat and must not present a riskto the consumer, or to the importing country. Fruit and vegetables are always at riskof carrying disease, insects, or larvae that could cause major problems if introduced tocountries in which they are not present. Requirements vary between countries, dependingon whether the country is free of a particular disease. America and most other marketsare concerned about fire blight, leaf roller, Mediterranean fruit fly, and nysius; Japan hasstrict requirements concerning codlin moth. New Zealand and Australia are particularlyconcerned about fruit fly because an infestation prevents them exporting products to keyinternational markets. Some insects are passengers rather than parasites of the crop inquestion. The nysius insect is a serious threat to wheat crops and may be transported infruit cartons, even though it does not affect the fruit itself.
Controls must be in place to ensure that such problems are absent from produce. Theserequire careful control of packing sheds and cool stores, including the use of lighting thatdoes not attract insects. Often orchard spraying is a major method of control of parasites,but this introduces concerns about chemical residues on fruit. Consumers of the 1990sare far more conscious of these issues than any previous generation, and food safety islikely to be the most important quality factor in the 21st century [10].
Cosmetic AppearanceThere is no doubt that in most developed markets the appearance of fruit and vegetables
has a major influence on perceived quality. Quality is defined in terms of shape, color,size, uniformity, and absence of apparent defects [11]. Thus, in the case of bruising inapples, the surface size and appearance of the bruise is more important in the fresh fruitmarket than the volume of the bruise. Bruises may be present, but if they cannot be seen,they do not appear to be of importance to the market. On the other hand, fruit that appearsto be bruised or marked, but is not, loses value.
Shape and appearance are important quality factors: The cross-section of a kiwifruitis an attractive pattern, and a strong market was developed for this fruit as a decorationfor salads and main dishes in high-quality restaurants.
Taste, Texture, and Nutritional FactorsTable 3.2 lists compositional components of fruit and vegetables. Vegetables are high
in mineral substances including K, Na, Ca, Mg, Fe, Mn, Al, P, Cl, and S. Particularlyimportant are their contents of K, Fe, and Ca. Spinach, carrots, cabbage, and tomatoesare particularly rich in minerals. Vegetables with high Ca include green beans, cabbage,onions, and beans. Fruits rich in minerals include strawberries, cherries, peaches and
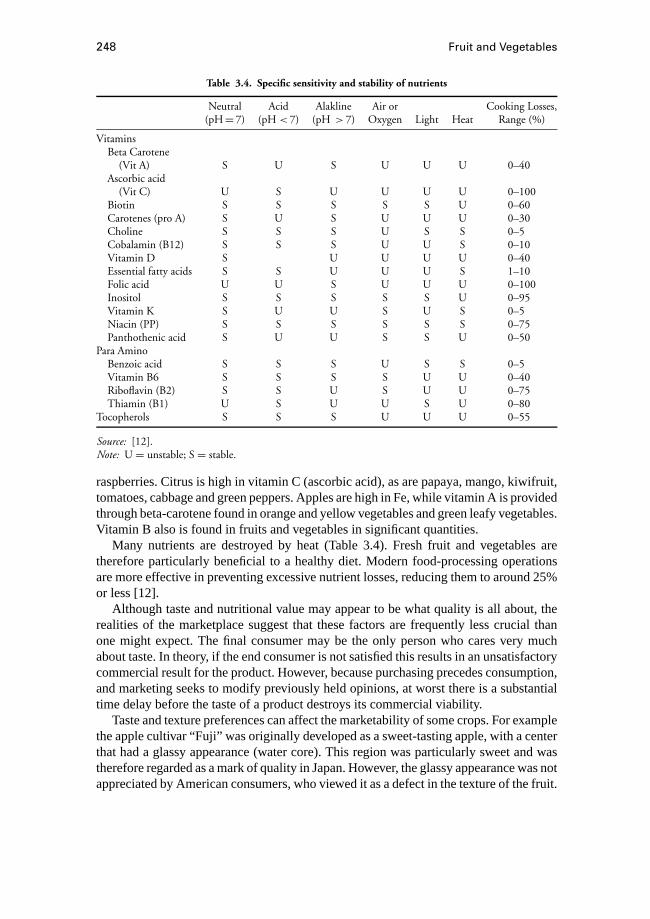
248 Fruit and Vegetables
Table 3.4. Specific sensitivity and stability of nutrients
Neutral Acid Alakline Air or Cooking Losses,(pH= 7) (pH < 7) (pH > 7) Oxygen Light Heat Range (%)
VitaminsBeta Carotene
(Vit A) S U S U U U 0–40Ascorbic acid
(Vit C) U S U U U U 0–100Biotin S S S S S U 0–60Carotenes (pro A) S U S U U U 0–30Choline S S S U S S 0–5Cobalamin (B12) S S S U U S 0–10Vitamin D S U U U U 0–40Essential fatty acids S S U U U S 1–10Folic acid U U S U U U 0–100Inositol S S S S S U 0–95Vitamin K S U U S U S 0–5Niacin (PP) S S S S S S 0–75Panthothenic acid S U U S S U 0–50
Para AminoBenzoic acid S S S U S S 0–5Vitamin B6 S S S S U U 0–40Riboflavin (B2) S S U S U U 0–75Thiamin (B1) U S U U S U 0–80
Tocopherols S S S U U U 0–55
Source: [12].Note: U = unstable; S = stable.
raspberries. Citrus is high in vitamin C (ascorbic acid), as are papaya, mango, kiwifruit,tomatoes, cabbage and green peppers. Apples are high in Fe, while vitamin A is providedthrough beta-carotene found in orange and yellow vegetables and green leafy vegetables.Vitamin B also is found in fruits and vegetables in significant quantities.
Many nutrients are destroyed by heat (Table 3.4). Fresh fruit and vegetables aretherefore particularly beneficial to a healthy diet. Modern food-processing operationsare more effective in preventing excessive nutrient losses, reducing them to around 25%or less [12].
Although taste and nutritional value may appear to be what quality is all about, therealities of the marketplace suggest that these factors are frequently less crucial thanone might expect. The final consumer may be the only person who cares very muchabout taste. In theory, if the end consumer is not satisfied this results in an unsatisfactorycommercial result for the product. However, because purchasing precedes consumption,and marketing seeks to modify previously held opinions, at worst there is a substantialtime delay before the taste of a product destroys its commercial viability.
Taste and texture preferences can affect the marketability of some crops. For examplethe apple cultivar “Fuji” was originally developed as a sweet-tasting apple, with a centerthat had a glassy appearance (water core). This region was particularly sweet and wastherefore regarded as a mark of quality in Japan. However, the glassy appearance was notappreciated by American consumers, who viewed it as a defect in the texture of the fruit.
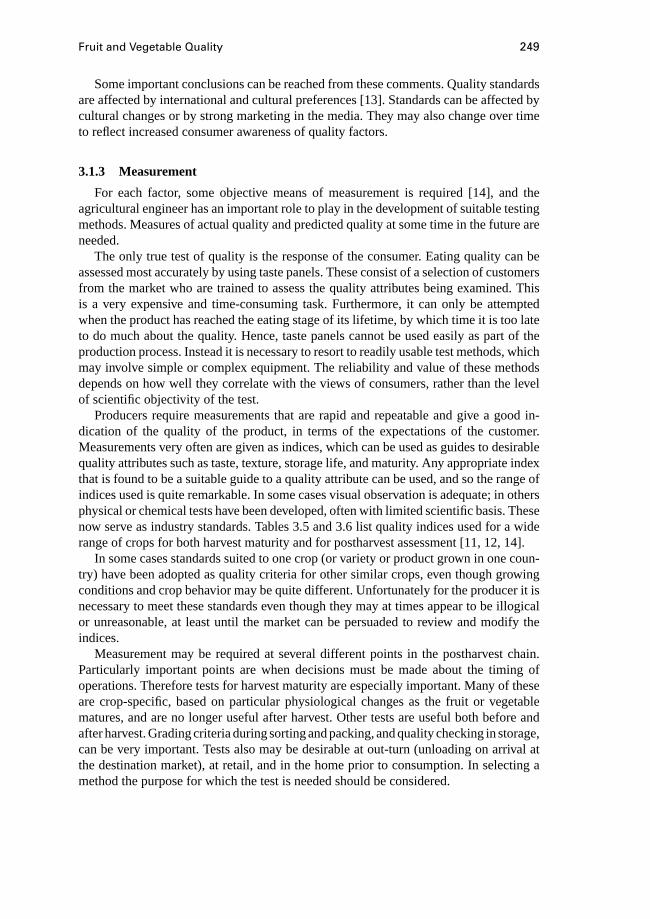
Fruit and Vegetable Quality 249
Some important conclusions can be reached from these comments. Quality standardsare affected by international and cultural preferences [13]. Standards can be affected bycultural changes or by strong marketing in the media. They may also change over timeto reflect increased consumer awareness of quality factors.
3.1.3 Measurement
For each factor, some objective means of measurement is required [14], and theagricultural engineer has an important role to play in the development of suitable testingmethods. Measures of actual quality and predicted quality at some time in the future areneeded.
The only true test of quality is the response of the consumer. Eating quality can beassessed most accurately by using taste panels. These consist of a selection of customersfrom the market who are trained to assess the quality attributes being examined. Thisis a very expensive and time-consuming task. Furthermore, it can only be attemptedwhen the product has reached the eating stage of its lifetime, by which time it is too lateto do much about the quality. Hence, taste panels cannot be used easily as part of theproduction process. Instead it is necessary to resort to readily usable test methods, whichmay involve simple or complex equipment. The reliability and value of these methodsdepends on how well they correlate with the views of consumers, rather than the levelof scientific objectivity of the test.
Producers require measurements that are rapid and repeatable and give a good in-dication of the quality of the product, in terms of the expectations of the customer.Measurements very often are given as indices, which can be used as guides to desirablequality attributes such as taste, texture, storage life, and maturity. Any appropriate indexthat is found to be a suitable guide to a quality attribute can be used, and so the range ofindices used is quite remarkable. In some cases visual observation is adequate; in othersphysical or chemical tests have been developed, often with limited scientific basis. Thesenow serve as industry standards. Tables 3.5 and 3.6 list quality indices used for a widerange of crops for both harvest maturity and for postharvest assessment [11, 12, 14].
In some cases standards suited to one crop (or variety or product grown in one coun-try) have been adopted as quality criteria for other similar crops, even though growingconditions and crop behavior may be quite different. Unfortunately for the producer it isnecessary to meet these standards even though they may at times appear to be illogicalor unreasonable, at least until the market can be persuaded to review and modify theindices.
Measurement may be required at several different points in the postharvest chain.Particularly important points are when decisions must be made about the timing ofoperations. Therefore tests for harvest maturity are especially important. Many of theseare crop-specific, based on particular physiological changes as the fruit or vegetablematures, and are no longer useful after harvest. Other tests are useful both before andafter harvest. Grading criteria during sorting and packing, and quality checking in storage,can be very important. Tests also may be desirable at out-turn (unloading on arrival atthe destination market), at retail, and in the home prior to consumption. In selecting amethod the purpose for which the test is needed should be considered.
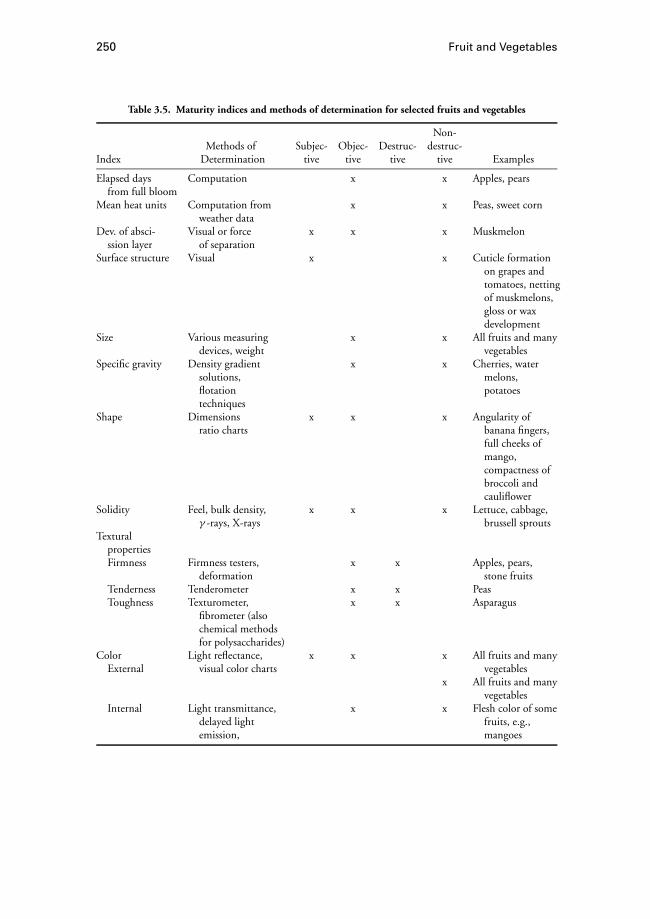
250 Fruit and Vegetables
Table 3.5. Maturity indices and methods of determination for selected fruits and vegetables
Non-Methods of Subjec- Objec- Destruc- destruc-
Index Determination tive tive tive tive Examples
Elapsed days Computation x x Apples, pearsfrom full bloom
Mean heat units Computation from x x Peas, sweet cornweather data
Dev. of absci- Visual or force x x x Muskmelonssion layer of separation
Surface structure Visual x x Cuticle formationon grapes andtomatoes, nettingof muskmelons,gloss or waxdevelopment
Size Various measuring x x All fruits and manydevices, weight vegetables
Specific gravity Density gradient x x Cherries, watersolutions, melons,flotation potatoestechniques
Shape Dimensions x x x Angularity ofratio charts banana fingers,
full cheeks ofmango,compactness ofbroccoli andcauliflower
Solidity Feel, bulk density, x x x Lettuce, cabbage,γ -rays, X-rays brussell sprouts
TexturalpropertiesFirmness Firmness testers, x x Apples, pears,
deformation stone fruitsTenderness Tenderometer x x PeasToughness Texturometer, x x Asparagus
fibrometer (alsochemical methodsfor polysaccharides)
Color Light reflectance, x x x All fruits and manyExternal visual color charts vegetables
x All fruits and manyvegetables
Internal Light transmittance, x x Flesh color of somedelayed light fruits, e.g.,emission, mangoes
Fruit and Vegetable Quality 251
Table 3.5. (Continued)
Non-Methods of Subjec- Objec- Destruc- destruc-
Index Determination tive tive tive tive Examples
Internal structure Light transmittance, x x x Jelly-like formationdelayed light, in tomatoesemission, visual x Kiwifruit; apple pipexamination color; jelly-like
formation intomatoes; fleshcolor of some fruits,e.g., mangoes
CompositionalfactorsTotal solids Dry weight x x Avocados, kiwifruitStarch content KI test, other x x Apples, pears
chemical testsSugar content Hand refractometer, x x Apples, pears, stone
chemical tests fruits, grapes,kiwifruit
Acid content Titration, x x Citrus, pomegranates,(or sugar/acid chemical tests papaya, melonsratio)
Juice content Extraction, x x Citruschemical tests
Oil content Extraction, x x Avocadoschemical tests
Tannin content Ferric chloride test, x x Persimmons, dateschemical tests
Internal ethylene Gas chromatography x x Apples, pears
Source: Modified from [11].
Measurement methods can be destructive or nondestructive. Destructive tests includetests that are themselves nondestructive but require samples to be cut from products.Tests can be further roughly grouped (according to the method used), into mechanical,visual (by human eye or by instrument), electrical, chemical, or biological. In some casesseveral methods may be combined to give an overall quality index.
Mechanical Destructive IndicesFirmness measurements in fruits and vegetables have been used for over 60 years as
guides to the quality of the product [15–17]. Firmness meters attempt to record a valuethat represents how easily the product can be deformed under a pressure applied to alimited area of its surface (or more simply what happens when you squeeze it). Theyrange from laboratory systems costing thousands of dollars to much cheaper handhelddevices, which can be used in the field [16–18]. The devices have been applied to awide range of fruits and are often the main test specified to establish the acceptabilityof the product for a particular market or storage condition. Harkeret al. recently havecompleted an extensive review of texture measurement [18].
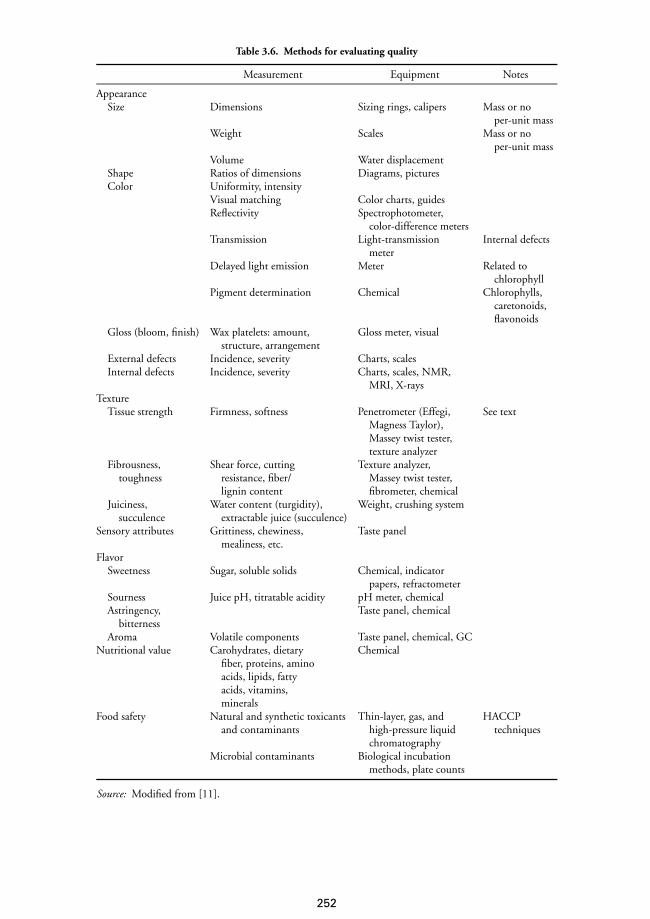
Table 3.6. Methods for evaluating quality
Measurement Equipment Notes
AppearanceSize Dimensions Sizing rings, calipers Mass or no
per-unit massWeight Scales Mass or no
per-unit massVolume Water displacement
Shape Ratios of dimensions Diagrams, picturesColor Uniformity, intensity
Visual matching Color charts, guidesReflectivity Spectrophotometer,
color-difference metersTransmission Light-transmission Internal defects
meterDelayed light emission Meter Related to
chlorophyllPigment determination Chemical Chlorophylls,
caretonoids,flavonoids
Gloss (bloom, finish) Wax platelets: amount, Gloss meter, visualstructure, arrangement
External defects Incidence, severity Charts, scalesInternal defects Incidence, severity Charts, scales, NMR,
MRI, X-raysTexture
Tissue strength Firmness, softness Penetrometer (Effegi, See textMagness Taylor),Massey twist tester,texture analyzer
Fibrousness, Shear force, cutting Texture analyzer,toughness resistance, fiber/ Massey twist tester,
lignin content fibrometer, chemicalJuiciness, Water content (turgidity), Weight, crushing system
succulence extractable juice (succulence)Sensory attributes Grittiness, chewiness, Taste panel
mealiness, etc.Flavor
Sweetness Sugar, soluble solids Chemical, indicatorpapers, refractometer
Sourness Juice pH, titratable acidity pH meter, chemicalAstringency, Taste panel, chemical
bitternessAroma Volatile components Taste panel, chemical, GC
Nutritional value Carohydrates, dietary Chemicalfiber, proteins, aminoacids, lipids, fattyacids, vitamins,minerals
Food safety Natural and synthetic toxicants Thin-layer, gas, and HACCPand contaminants high-pressure liquid techniques
chromatographyMicrobial contaminants Biological incubation
methods, plate counts
Source: Modified from [11].
252
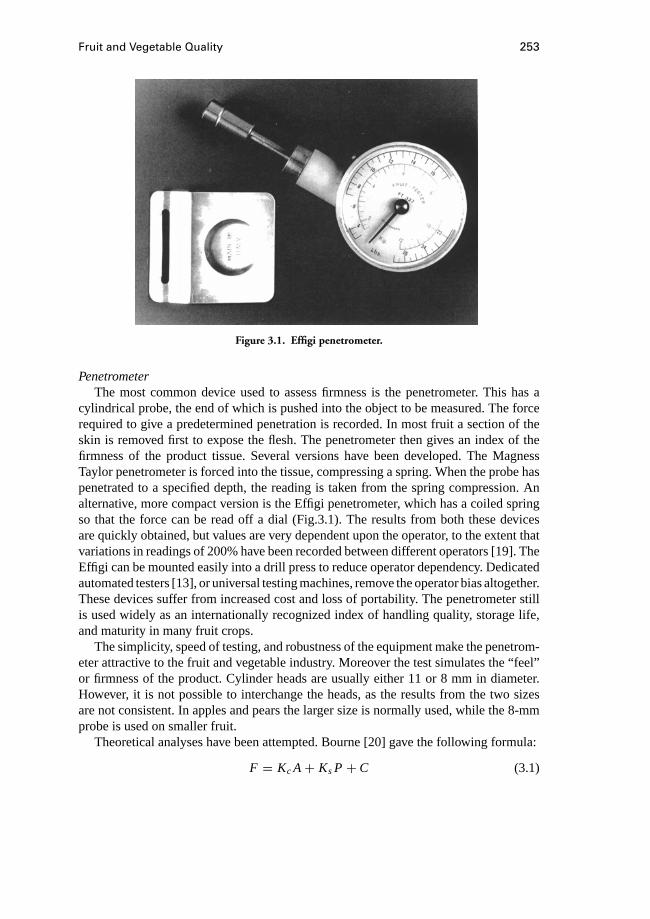
Fruit and Vegetable Quality 253
Figure 3.1. Effigi penetrometer.
PenetrometerThe most common device used to assess firmness is the penetrometer. This has a
cylindrical probe, the end of which is pushed into the object to be measured. The forcerequired to give a predetermined penetration is recorded. In most fruit a section of theskin is removed first to expose the flesh. The penetrometer then gives an index of thefirmness of the product tissue. Several versions have been developed. The MagnessTaylor penetrometer is forced into the tissue, compressing a spring. When the probe haspenetrated to a specified depth, the reading is taken from the spring compression. Analternative, more compact version is the Effigi penetrometer, which has a coiled springso that the force can be read off a dial (Fig.3.1). The results from both these devicesare quickly obtained, but values are very dependent upon the operator, to the extent thatvariations in readings of 200% have been recorded between different operators [19]. TheEffigi can be mounted easily into a drill press to reduce operator dependency. Dedicatedautomated testers [13], or universal testing machines, remove the operator bias altogether.These devices suffer from increased cost and loss of portability. The penetrometer stillis used widely as an internationally recognized index of handling quality, storage life,and maturity in many fruit crops.
The simplicity, speed of testing, and robustness of the equipment make the penetrom-eter attractive to the fruit and vegetable industry. Moreover the test simulates the “feel”or firmness of the product. Cylinder heads are usually either 11 or 8 mm in diameter.However, it is not possible to interchange the heads, as the results from the two sizesare not consistent. In apples and pears the larger size is normally used, while the 8-mmprobe is used on smaller fruit.
Theoretical analyses have been attempted. Bourne [20] gave the following formula:
F = Kc A+ KsP + C (3.1)

254 Fruit and Vegetables
whereF is the puncture force,Kc is the compression strength,Ks is the shear strength,A is the area of the punch,P is the perimeter of the punch, andC is a constant. Moredetailed theoretical and experimental studies have been conducted, which have shownthat the main component ofF is due to compression [21].
Other problems of the penetrometer include its limited range, especially for fruitthat softens dramatically. There is a wide scatter in the readings among similar fruit,and usually at least 20 samples are required for one value. In softer fruit removal ofthe skin before testing can introduce significant errors, depending on the thickness ofthe slice. The indenter measurement is not easily modeled in theoretical terms anddoes not correlate well with other mechanical measurements. Values are affected bysurface properties, whereas in some fruit the texture at depth would provide a morereliable quality indicator. Dupratet al. [16] have advocated using the firmness mea-sured at 5 to 9 mm depth as a standard rather than at the surface. This requires a tex-ture analyzer rather than an ordinary penetrometer to measure the force as a functionof depth.
Pea TenderometerThis device is widely recognized as the standard measure for pea tenderness. A sample
of peas is loaded into the testing chamber, and a set of blades cuts through the sample,using a rising pendulum weight to measure the force required [22, 23].
Texture AnalyzersResearch laboratories commonly use universal testing machines to determine phys-
ical properties of crops. Very low loads are needed, and most machines in engineeringlaboratories are insufficiently sensitive. It is important to avoid external vibrations of andhigh stresses on the sample during mounting. For these reasons sensitive universal testingmachines have been developed that are dedicated to the measurement of food texture.Modern systems use a computer for control and recording of data, and sophisticatedloading cycles can be developed [16].
Indenting heads include a penetrometer cylinder, a spherical indenter, and a flat plateto give compression tests between parallel plattens. One system measures the burstingstrength of the skin of tomatoes and the whole-fruit compression resistance in the sametest [16]. Measurements can be taken on whole fruits and vegetables or cut samples.Theoretical values can be obtained from stress–strain data, according to the loadinggeometry. Formulae are given in Table 3.A2 in the Appendix. Tensile tests also canbe performed, especially for fibrous products. Shear tests and viscosity measurementsalso can be used [24, 25]. Common loading cycles include applying a fixed compressiondistance or a percentage of the fruit diameter. Alternatively the deformation after applyinga fixed load for a given time can be determined. For cherries a double-loading test canbe used. In this the fruit is loaded, and the load-against-deformation curve is plotted[16]. After a fixed time at maximum load, the load is removed, and after a set time it isreapplied to produce a second force–deformation curve. Differences in areas under thecurves indicate tissue recovery. Texture analyzers also can be used for nondestructivemeasurements, as discussed subsequently.
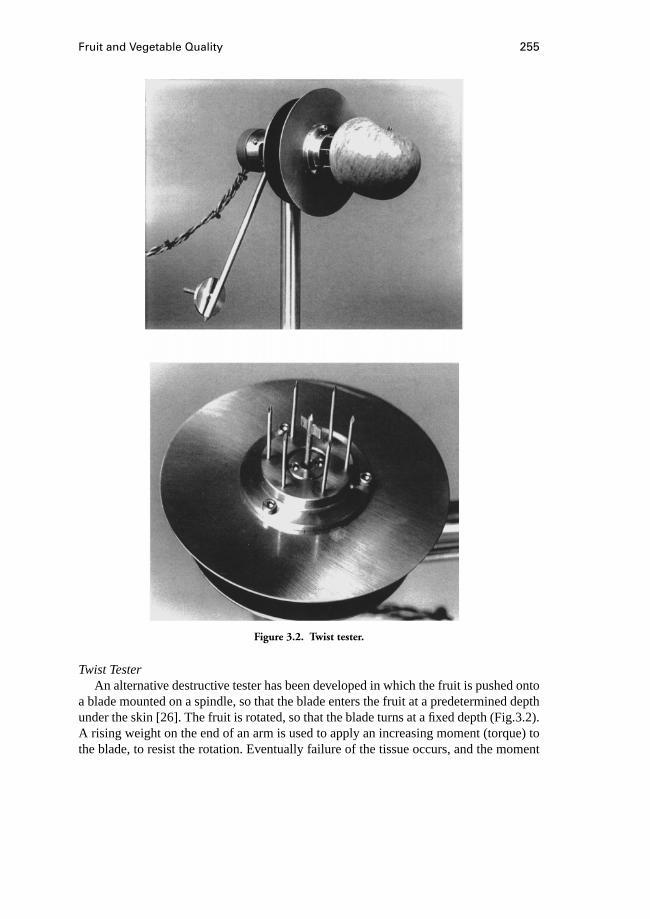
Fruit and Vegetable Quality 255
Figure 3.2. Twist tester.
Twist TesterAn alternative destructive tester has been developed in which the fruit is pushed onto
a blade mounted on a spindle, so that the blade enters the fruit at a predetermined depthunder the skin [26]. The fruit is rotated, so that the blade turns at a fixed depth (Fig.3.2).A rising weight on the end of an arm is used to apply an increasing moment (torque) tothe blade, to resist the rotation. Eventually failure of the tissue occurs, and the moment
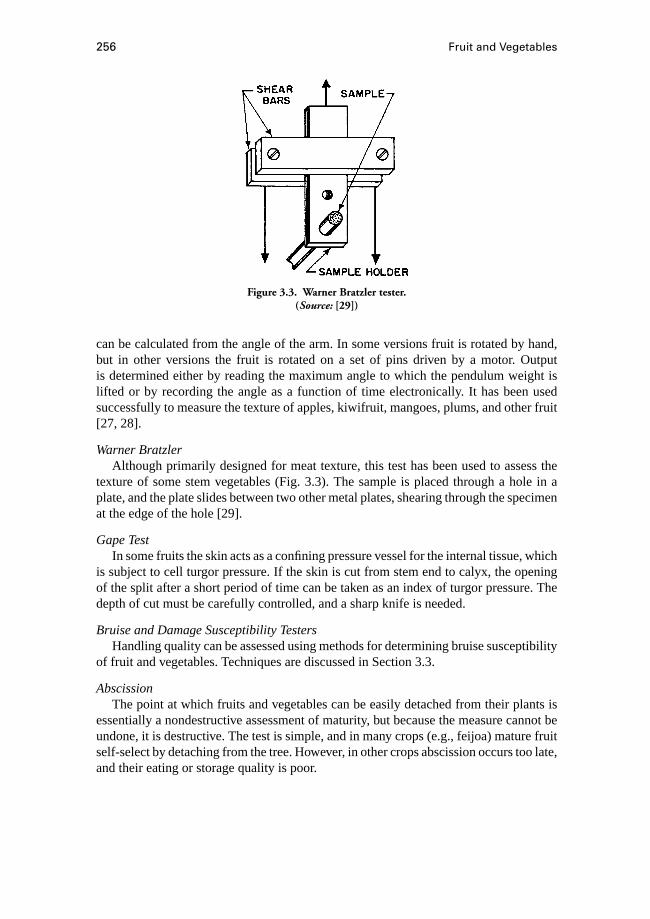
256 Fruit and Vegetables
Figure 3.3. Warner Bratzler tester.(Source: [29])
can be calculated from the angle of the arm. In some versions fruit is rotated by hand,but in other versions the fruit is rotated on a set of pins driven by a motor. Outputis determined either by reading the maximum angle to which the pendulum weight islifted or by recording the angle as a function of time electronically. It has been usedsuccessfully to measure the texture of apples, kiwifruit, mangoes, plums, and other fruit[27, 28].
Warner BratzlerAlthough primarily designed for meat texture, this test has been used to assess the
texture of some stem vegetables (Fig. 3.3). The sample is placed through a hole in aplate, and the plate slides between two other metal plates, shearing through the specimenat the edge of the hole [29].
Gape TestIn some fruits the skin acts as a confining pressure vessel for the internal tissue, which
is subject to cell turgor pressure. If the skin is cut from stem end to calyx, the openingof the split after a short period of time can be taken as an index of turgor pressure. Thedepth of cut must be carefully controlled, and a sharp knife is needed.
Bruise and Damage Susceptibility TestersHandling quality can be assessed using methods for determining bruise susceptibility
of fruit and vegetables. Techniques are discussed in Section 3.3.
AbscissionThe point at which fruits and vegetables can be easily detached from their plants is
essentially a nondestructive assessment of maturity, but because the measure cannot beundone, it is destructive. The test is simple, and in many crops (e.g., feijoa) mature fruitself-select by detaching from the tree. However, in other crops abscission occurs too late,and their eating or storage quality is poor.
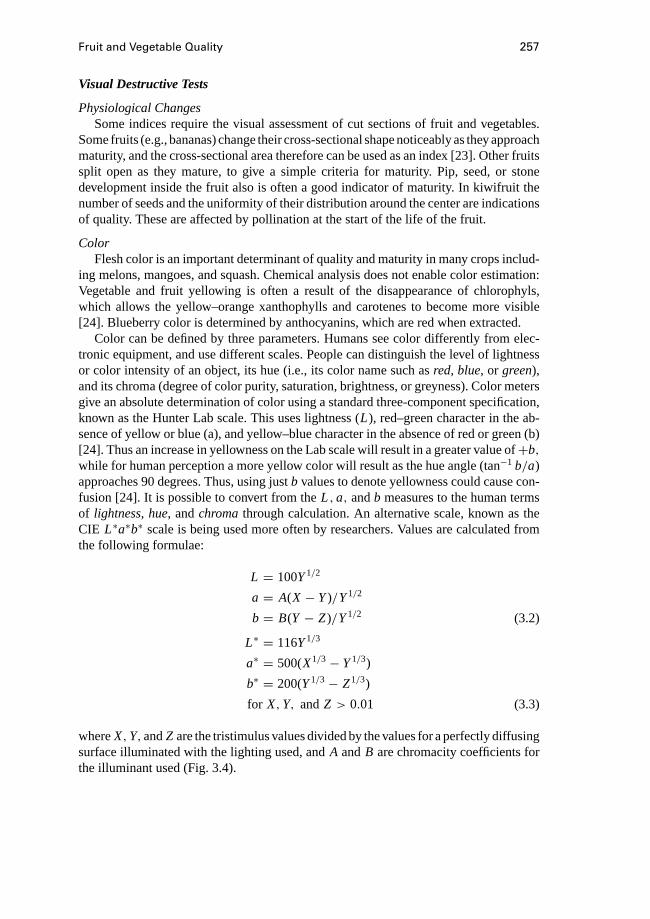
Fruit and Vegetable Quality 257
Visual Destructive Tests
Physiological ChangesSome indices require the visual assessment of cut sections of fruit and vegetables.
Some fruits (e.g., bananas) change their cross-sectional shape noticeably as they approachmaturity, and the cross-sectional area therefore can be used as an index [23]. Other fruitssplit open as they mature, to give a simple criteria for maturity. Pip, seed, or stonedevelopment inside the fruit also is often a good indicator of maturity. In kiwifruit thenumber of seeds and the uniformity of their distribution around the center are indicationsof quality. These are affected by pollination at the start of the life of the fruit.
ColorFlesh color is an important determinant of quality and maturity in many crops includ-
ing melons, mangoes, and squash. Chemical analysis does not enable color estimation:Vegetable and fruit yellowing is often a result of the disappearance of chlorophyls,which allows the yellow–orange xanthophylls and carotenes to become more visible[24]. Blueberry color is determined by anthocyanins, which are red when extracted.
Color can be defined by three parameters. Humans see color differently from elec-tronic equipment, and use different scales. People can distinguish the level of lightnessor color intensity of an object, its hue (i.e., its color name such asred, blue, or green),and its chroma (degree of color purity, saturation, brightness, or greyness). Color metersgive an absolute determination of color using a standard three-component specification,known as the Hunter Lab scale. This uses lightness (L), red–green character in the ab-sence of yellow or blue (a), and yellow–blue character in the absence of red or green (b)[24]. Thus an increase in yellowness on the Lab scale will result in a greater value of+b,while for human perception a more yellow color will result as the hue angle (tan−1 b/a)approaches 90 degrees. Thus, using justb values to denote yellowness could cause con-fusion [24]. It is possible to convert from theL ,a, andb measures to the human termsof lightness, hue, andchromathrough calculation. An alternative scale, known as theCIE L∗a∗b∗ scale is being used more often by researchers. Values are calculated fromthe following formulae:
L = 100Y1/2
a = A(X − Y)/Y1/2
b = B(Y − Z)/Y1/2 (3.2)
L∗ = 116Y1/3
a∗ = 500(X1/3− Y1/3)
b∗ = 200(Y1/3− Z1/3)
for X,Y, andZ > 0.01 (3.3)
whereX,Y,andZ are the tristimulus values divided by the values for a perfectly diffusingsurface illuminated with the lighting used, andA andB are chromacity coefficients forthe illuminant used (Fig. 3.4).
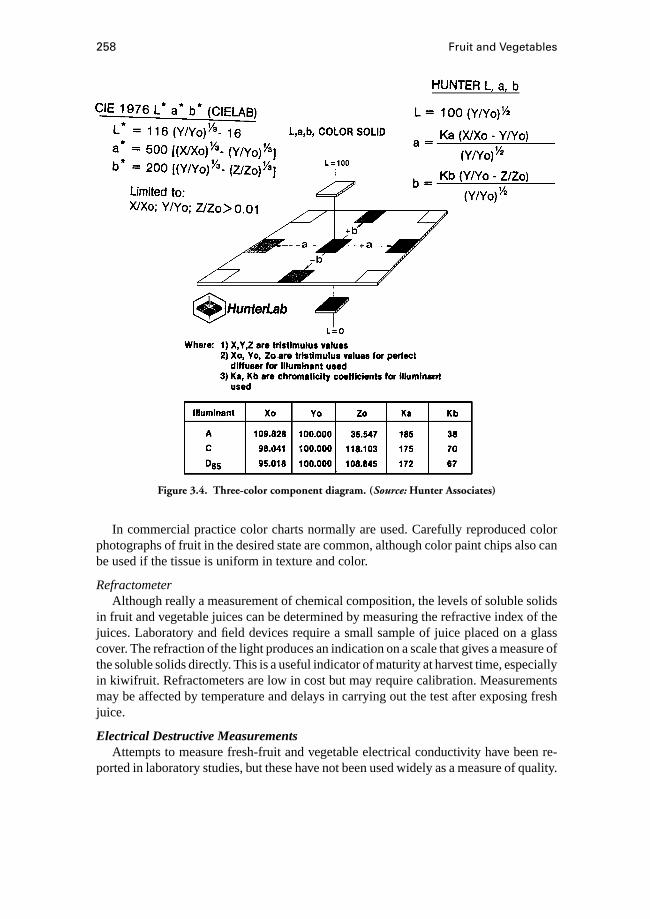
258 Fruit and Vegetables
Figure 3.4. Three-color component diagram. (Source: Hunter Associates)
In commercial practice color charts normally are used. Carefully reproduced colorphotographs of fruit in the desired state are common, although color paint chips also canbe used if the tissue is uniform in texture and color.
RefractometerAlthough really a measurement of chemical composition, the levels of soluble solids
in fruit and vegetable juices can be determined by measuring the refractive index of thejuices. Laboratory and field devices require a small sample of juice placed on a glasscover. The refraction of the light produces an indication on a scale that gives a measure ofthe soluble solids directly. This is a useful indicator of maturity at harvest time, especiallyin kiwifruit. Refractometers are low in cost but may require calibration. Measurementsmay be affected by temperature and delays in carrying out the test after exposing freshjuice.
Electrical Destructive MeasurementsAttempts to measure fresh-fruit and vegetable electrical conductivity have been re-
ported in laboratory studies, but these have not been used widely as a measure of quality.
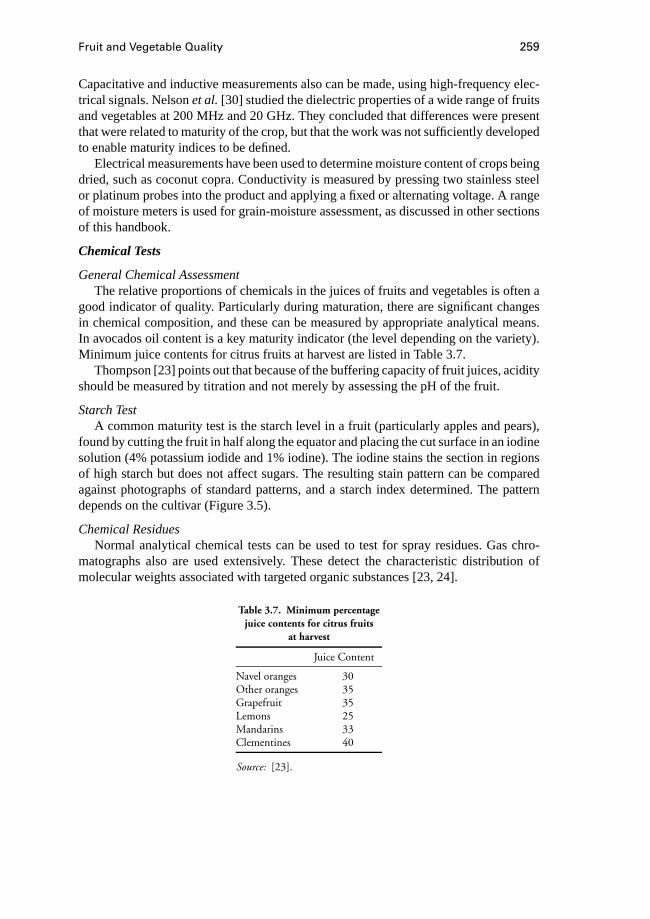
Fruit and Vegetable Quality 259
Capacitative and inductive measurements also can be made, using high-frequency elec-trical signals. Nelsonet al.[30] studied the dielectric properties of a wide range of fruitsand vegetables at 200 MHz and 20 GHz. They concluded that differences were presentthat were related to maturity of the crop, but that the work was not sufficiently developedto enable maturity indices to be defined.
Electrical measurements have been used to determine moisture content of crops beingdried, such as coconut copra. Conductivity is measured by pressing two stainless steelor platinum probes into the product and applying a fixed or alternating voltage. A rangeof moisture meters is used for grain-moisture assessment, as discussed in other sectionsof this handbook.
Chemical Tests
General Chemical AssessmentThe relative proportions of chemicals in the juices of fruits and vegetables is often a
good indicator of quality. Particularly during maturation, there are significant changesin chemical composition, and these can be measured by appropriate analytical means.In avocados oil content is a key maturity indicator (the level depending on the variety).Minimum juice contents for citrus fruits at harvest are listed in Table 3.7.
Thompson [23] points out that because of the buffering capacity of fruit juices, acidityshould be measured by titration and not merely by assessing the pH of the fruit.
Starch TestA common maturity test is the starch level in a fruit (particularly apples and pears),
found by cutting the fruit in half along the equator and placing the cut surface in an iodinesolution (4% potassium iodide and 1% iodine). The iodine stains the section in regionsof high starch but does not affect sugars. The resulting stain pattern can be comparedagainst photographs of standard patterns, and a starch index determined. The patterndepends on the cultivar (Figure 3.5).
Chemical ResiduesNormal analytical chemical tests can be used to test for spray residues. Gas chro-
matographs also are used extensively. These detect the characteristic distribution ofmolecular weights associated with targeted organic substances [23, 24].
Table 3.7. Minimum percentagejuice contents for citrus fruits
at harvest
Juice Content
Navel oranges 30Other oranges 35Grapefruit 35Lemons 25Mandarins 33Clementines 40
Source: [23].
260 Fruit and Vegetables
Figure 3.5. Starch test scale for red delicious apples. (Source: [31])
Moisture-Content MeasurementIn addition to electrical measurement, moisture content can be determined accurately
by oven drying, to establish the dry weight after removal of moisture.
Biological Destructive TestersThe presence of pathogens and bacteria can be determined by a range of cell-culture
techniques. Samples of skin or tissue are placed in a suitable growth media and incubatedfor several days. Pathogens reproduce to levels at which they can easily be detected andcounted.
Combinations of Test MethodsFor many crops one measurement of maturity or quality is inadequate. Attempts have
been made to combine several measurements into a maturity index. For apples, the Streifindex is defined as
SI = F/(RS) (3.4)

Fruit and Vegetable Quality 261
whereF is the penetrometer firmness force in Newtons divided by 9.8 measured withan 11 mm probe pushed to a depth of 8 mm in 2 seconds,R is the Brix refractive index(% Brix), andS is the starch-conversion stage, measured on a scale from 1 to 10 [32,33]. Typical values for apples at harvest are in the range from (on average) 0.07 for theJonagold cultivar to 0.3 for Elstar [33]. Use of this index enabled the optimum harvest date(OHD) to be predicted in one cultivar of apple (Jonagold) using the following formula:
Days to OHD= −47.7− 19.6 · Ln(SI) (3.5)
The formula was not reliable for individual orchards to an accuracy of better than a fewdays but did predict the optimum harvest date for a district well [34].
3.1.4 Nondestructive Testing Methods and Their Advantages
Nondestructive methods offer significant advantages over destructive methods. Ob-viously there is a saving in the number of fruits or vegetables wasted, but there are otheradvantages: First, the same fruit can be retested several times throughout its lifetime,giving a reduction in variability as a result of random sampling of fruit in growth andstorage trials (each fruit becomes its own control). This means that test procedures shouldbecome more reliable and rigorous, because measurements can be correlated better withfruit performance by tracking the development and storage behavior of individual fruit.This improves predictions of storage life. Other advantages are that samples taken frompacked fruit do not need to be replaced. This has major advantages for quality-controlinspection procedures: There is no mess or problem of disposal of sampled fruit—theycan be repacked or returned to the packing line. On-line assessment of every fruit is apossibility. In scientific experiments, because the same fruit can be used again and againwithout interrupting its normal life cycle, the number of samples required can be reduced.
Tests that could be conducted in situ in the orchard have additional advantages. Itwould be possible to test fruit during growth, without removal from the tree, and toevaluate the relationship between orchard management and postharvest properties in arigorous fashion.
The following tests are in principle nondestructive, although in some cases a testmay result in damage. For example, mechanical test pressures may exceed tissue failurestrength in some samples, especially as the fruit softens. Care should be taken to ensurethat the test is not producing any effect that would be harmful in the long term. Pittset al. [35] tested several nondestructive devices on apples but found problems with allof them. Abbott et al. [36] recently produced a detailed review.
Mechanical NDT Tests
Mass and Bulk DensityMass is one of the most obvious quality indices and is easy to measure. Density
can be measured using Archimedes’ principle. The fruit is weighed in air and thensuspended in water. The apparent loss in mass is equal to the volume of the fruit multipliedby the density of water. Computer-linked scales can perform the simple calculationsautomatically and shorten measurement times to a few seconds. Flotation systems can

262 Fruit and Vegetables
sort fruit and vegetables whose specific gravity is close to 1.0 (e.g., mangoes). Addition ofsalt or sugar solutions to the water tank can alter the density and hence the cut-off pointbetween floating and sinking fruits. Bubbling air through water reduces the effectivedensity, and this also can be used for sorting.
Quasistatic Low-pressure IndentersA large number of different techniques involve applying low-pressure compression
to intact fruits and vegetables. Some are quasistatic, and in general these can be setup using a modern texture analyser. For example, Jeffery and Banks [37] described akiwifruit indenter in which a modified micrometer dial gauge applied a fixed weight toa specimen placed underneath. The weight caused the sample to deform, and from theshape of the deformation curve a softness index was established by appropriate curve-fitting techniques. This procedure was relatively slow and required a computer loggingsystem. A similar approach has been taken in a commercial meter for testing avocados.In this case the load was applied using a weight hung at the end of a pivoted beam, witha dial gauge at the other end. Similar see-saw–type loading devices have been used byseveral researchers [36].
For leafy vegetables such as lettuce and cabbage it is possible to assess the harvestmaturity by lightly pressing the vegetable by hand. French workers have used a textureanalyzer for this purpose [16].
Dynamic Low-pressure IndentersOthers indenters involve impact devices using small accelerometers to measure impact
parameters. In the Soft-sense system (Hortresearch, Hamilton, NZ), kiwifruit are droppedfrom a small height onto a force transducer [38]. The Kiwifirm (Industrial ResearchLtd., Auckland) applies a small impact load to the sample without producing apparentdamage [38]. Several other research groups have developed testing devices, and all claimadvantages for their systems [14, 16, 39–43]. Typical analyses involve measurement ofthe dwell time (the period that the impact force remains above 50% or 80% of the peakvalue), or the area under the force–time curve (see Section 3.3).
Nondestructive Use of Texture AnalyzersSome researchers have used modern texture analyzers capable of following com-
plex loading patterns. Provided the equipment is sufficiently sensitive and is capable ofmeasuring force and displacement continuously, a wide range of nondestructive mea-surements can be taken. Measurements made include compressibility, energy absorptionduring a loading cycle, and whole-fruit modulus of elasticity determined by compressionbetween flat platters. This latter test is suited to cherries and other soft fruits [16].
Acoustic MethodsClark and Mikelson [44] described the acoustic-response method, for an estimate
of the overall or global texture of fruits that are approximately spherical. The acousticimpulse response method makes use of the sound signal emitted by the fruit as it vibratesin response to a gentle short-duration shock, produced by tapping with a small rodor pendulum. The signal is captured by a microphone, and the principle frequency of
Fruit and Vegetable Quality 263
vibration is then calculated by means of a fast Fourier transform. The technique has beenapplied successfully to the determination of melon ripeness. In other products, problemsof interpreting the data remain.
In principle, the resonant frequency of an object depends directly on its geometry, itsmass, and the modulus of elasticity of the material of which it is made. In the case offruit, the modulus of elasticity reduces as the fruit matures (from 5 MPa for an unripegreen apple to 0.5 MPa for an overripe fruit), and this reduction may indicate changesin the turgor pressure and physical properties of the plant tissue [45, 46].
Cooke and Rand [47, 48] proposed a mathematical model for the interpretation of thevibrational behavior of intact fruit. They showed that the elastic modulus (or Young’smodulus) can be estimated satisfactorily as follows:
E = C · f 2 ·m2/3 · ρ1/3 (3.6)
whereE is the coefficient of elasticity (Pa),C is a constant,f is the frequency withgreatest amplitude (Hz),m is the mass (kg), andρ is the density (kg/m3). The implicationsof this are thatE can be determined provided two other parameters (density and mass)are known. For a particular cultivar density variation is often quite small. Mass can bemeasured in the laboratory, and in the field it can be estimated from fruit diameter.
Other laboratory techniques also have been suggested for measuring the vibrationalcharacteristics of fruits and vegetables. The resonance method suggested by Abbottet al.[49, 50] involves placing the whole fruit on a platform that can be vibrated over a rangeof frequencies from 20 to 4000 Hz, and measuring the response using an accelerometer.The random-vibration method [51] makes use of excitation over a wide range of frequen-cies. Resonant properties are deduced from the transmitted vibration across the fruit forcertain preselected frequencies. Problems remain, including the need to allow for fruitshape variability. Sonic tomography and vibration transmission also have been studied[24, 52].
Visual Nondestructive Measurements
Size and ShapeAs fruits grow their shapes and sizes change. Assessment of size is one of the simplest
methods for assessing maturity prior to and at harvest for many vegetables. In some casesthe size determines the product: Capsicums may be marketed as zucchini while small,and as marrows when large. Baby corns, sweet corn, and maize may be the same cultivar(Zea mays saccharata) harvested at different stages. Mango maturity can be assessed insome cultivars by examining the position and angle the shoulder makes with the stalkand its point of attachment to the fruit [23].
ColorSurface color is used widely for maturity and quality assessment and is probably the
most common characteristic used in the selection and harvesting of many fruit. Generallyassessments are still performed manually, particularly in the field, although inside pack-ing sheds color sorters are now available commercially for many crops. Although manualmeasurement may be subject to operator fatigue, human error, and variability, automatic
264 Fruit and Vegetables
systems are still often considerably inferior, because humans provide a more subjectiveassessments than machines. Color assessment often can be complex: For example, inapples that develop a partial red color, harvest maturity is based on the background color,which remains in the green-to-yellow range of colors, even though the red color appearsto dominate. Human graders have been shown to fail to grade fruit correctly due to theinfluence of the blush color [53].
Machine vision systems are likely to continue to advance rapidly in speed and ac-curacy and should become increasingly reliable for discrimination of fruit maturity.However, in some countries the social implications and the cost of automation may beunacceptable. Although automatic systems using image analysis are being introducedworldwide, currently the majority of fruits and vegetables still are assessed by humans,because cost considerations and the availability of labor still favour human operators.The efficiency and effectiveness of manual inspection remain crucial. Ergonomic factorsaffect the performance of people [24], and so studies are in progress into what factorsaffect the ability of people to detect substandard products. Studies of background colorand lighting levels are aimed at optimizing the physical environment [54, 55]. Other is-sues, such as ensuring that production processes do not harm the environment or offendhuman ethical values, also must be considered [13].
Lighting levels are particularly important in grading operations. High levels of il-lumination are recommended for most grading using natural or artificial lighting. Luxlevels should be high (in excess of 1000) [56], but it is also important to avoid glare andstrong reflections from background tables and rollers. Black backgrounds maximize therelative light levels on the fruit being inspected, but if the light is directly overhead, andthe operator is looking at the fruit from the side, then the lower part of the fruit may betoo dark. For this reason non-white neutral colors (grays) are probably the most usefulinspection backgrounds.
In storage, visual appearance is often a good indicator of changes in product quality.Random sampling and inspection for rots, shrivel, and decay are used widely to monitorlong-term product quality.
Near-infrared Reflectance and Other Electromagnetic RadiationResearchers have studied the use electromagnetic radiation from ultraviolet to infrared
[57]. As well as measuring moisture content, near-infrared reflectance measurementshave been correlated with quality factors such as sugar content, firmness, carbohydrates,and acidity in various fruits including apples and mangoes [42, 58, 59]. Near-infraredreflectance also has been used to detect bruising in apples [60, 61].
Gamma- and x-rays also have been used to detect internal disorders in fruit andvegetables [23]. Radiographic systems have detected water core in apples, hollow heartin potatoes, split pits in peaches, and the maturity of lettuce heads at harvest [62, 63].
Delayed Light Emission and TransmittanceSome fruit will re-emit radiation for a short time after exposure to a bright light. The
amount of delayed radiation is a measure of the chlorophyll present, and this is inverselydependent on the maturity. The method has been used with satsumas, tomatoes, andpapaya. Other studies have used the transmittance and reflectance of light for papayaand citrus [23]. The reradiated energy is affected by wavelength and intensity of the

Fruit and Vegetable Quality 265
exciting radiation, sample thickness, area of excitation, and ambient temperature, andthere is considerable variation among similar samples [64].
Other Visual Methods of AssessmentA wide number of visual indicators can be used to determine maturity and quality. The
state of foliage is particularly useful for many vegetable crops (e.g., optimum storage ofpotatoes may be obtained if they are dug up after the leaves and stems have died down).
Nondestructive Testing—Electrical and Nuclear Magnetic ResonanceVery little success has been achieved in using electrical properties of fruit and veg-
etables for nondestructive assessment of quality. However, there is some evidence thatelectrical conductivity is affected by mechanical or physiological damage [23, 65].
Nuclear magnetic resonance has shown some potential as a method for detectinginternal defects in apples, peaches, pears, onions, prunes, and olives. It also can be usedto determine sugar content in bananas [66], potatoes, grapes, and carrots [52], and oilcontent in avocados [67]. Magnetic resonance imaging can provide a three-dimensionalimage and has been used to detect defects in apples and other fruits [68]. Nuclear magneticresonance and magnetic resonance imaging are expensive techniques.
Nondestructive Testing—Chemical
Respiration RateAs discussed in Section 3.2, some fruits and vegetables change their rate of respiration
as they mature and ripen. These changes can be used to identify when fruit and vegetablesare near the end of their storage life and should be sold.
Head Gases and AromaRipeness of fruit can be indicated by changes in the production of ethylene, or other
volatiles. Although these changes may be too small for humans to detect, fruit flies andother insects may be attracted by volatiles. Monitoring sensors therefore also could beused.
Nondestructive Testing—BiologicalHarvest dates can be estimated from the elapsed time after flowering for some fruits
and vegetables. In practice it is difficult to be precise. Degree-day calculations (cumu-lative product of time and temperature) are a guide to maturity for some greenhousecrops.
BiosensorsBiosensors that mimic taste and smell offer useful potential for quality assessment
[24]. These include ion-selective glass electrodes. These have enzyme or antibody filmcoverings that affect the number of hydrogen ions sensed. Metal-oxide gas detectors canreact to specific gases. These detectors are still in the experimental stage.
Problems with Nondestructive Test MethodsThere are a number of problems that need to be overcome before the benefits of
nondestructive testing can be exploited. Nondestructive methods are relatively new, andin most cases the results of the measurement have yet to be interpreted in terms thatare relevant to the industry. These methods are generally indirect, in the sense that they
266 Fruit and Vegetables
measure properties that may be a consequence of quality, but correlations between theseproperties and practical terms are not known.
Industry and researchers are familiar with current assessment measures, and althoughthey recognize the inadequacy of most of the tests, they are reluctant to adopt newmeasurements until they are proven to be of value and well related to more familiarmeasures. This implies that before a new system is implemented, there is a need forfull-scale trials including taste-panel assessments, conducted over a number of seasons.
The problem is always to correlate the reading from the device with an appropriatequality parameter such as bruising resistance or texture determined by taste panels. Ingeneral the correlations for most devices have been quite poor [35]. However, betterresults have been obtained when more than one parameter has been measured, and cor-relations determined using a statistical treatment (such as principle component analysis)or an expert system approach [69]. Nondestructive testing methods therefore offer someexciting possibilities for improving quality assessment but may be slow to gain industrialacceptance. New methods, however, are being developed continually.
3.1.5 Maintenance of Quality
In the fresh fruit and vegetable market, meeting a standard requires that appropriatequality-assurance methods be in place to govern the production and postharvest handlingof the product. In order to maintain these standards it is essential that an appropriatequality-assurance program is established. In this regard the ISO 9000 series of standardsis a major aid in helping producers to establish their own procedures [5, 6]. However,these standards are not designed for food crops in particular. Rather they are guidelinesto setting and operating standards, rather than quality standards themselves. For everycrop it is helpful if clear standards are defined, as this gives producers clear indicationsof what is needed. Such standards tend to be large documents. They can be developedby producers or by marketing and retail organizations.
International and Domestic MarketsStandards for export crops can be particularly demanding, especially where crops may
compete with locally grown products. However, more frequently the standards accuratelyreflect consumer expectations in the market. On local and domestic markets standardsare sometimes nonexistent, although this depends on the size of the country and the levelof infrastructure. In either case there is an economic advantage in producing crops of arecognizable standard: commercial buyers prefer products from growers with good repu-tations for quality who therefore obtain a greater return [8, 9, 14, 24]. There are marketingadvantages in using a brand name that carries a quality assurance for the customer.
Standards may be established that relate to all aspects of production and supply of afruit or vegetable. For all of the criteria listed in Table 3.3 standards may be set that rangefrom total absence of certain defects to a maximum tolerance level. Any standard shouldbe clear and easy to understand for graders. Illustrations and color photographs are oftenmore useful than written explanations. An example of a domestic market standard isshown in Table 3.8. Criteria used in U.S. standards for fruits and vegetables are given inthe Appendix, Table 3. A1.

Fruit and Vegetable Quality 267
Table 3.8. Product specifications for oranges
Characteristic
Cleanliness Free from dirt, dust, or other foreign substances (except wax)Shape Typical of variety (slight variation allowed)Washing All graded oranges to be washed and waxedSizing Less than 15% variation in diameter in any one containerAcceptible packaging F40 packs (18 kg), cartons (16–20 kg), bins (300 kg), plastic bags (various)
types
Grade 1 Grade 2 Grade 3
Color (navel oranges) Full color Full color < 10% surface greeningon < 25% of batch
Color (valencia oranges) Full color < 10% surface greening < 20% surface greeningon < 25% of batch on < 50% of batch
Sizing 65–90 mm diameter 55–90 mm diameter 55–90 mm diameterSkin thickness < 8 mm Variable thickness OK Variable thickness OKStems—Length < 3.0 mm < 3.0 mm < 10% over 3.00 mm—missing buttons Nil < 20% < 50%Defect allowances
Light blemish < 1.0 cm2 < 3.0 cm2 Light blemish OKDark blemish None < 0.5 cm2 aggregate < 3.0 cm2 aggregate
(oleocellosis) (each fruit) (each fruit)Bruises, cuts, None < 0.25 cm2 aggregate length < 1.0 cm3 aggregate
and punctures lengthInsect damage /stains None < 0.5 cm2 < 1 cm2
Rots and decay None < 2% < 5%Dry fruit None Nil < 5%
Adapted from Turners and Growers (New Zealand) TAG Quality System.
In the example in Table 3.8 there are three grade standards, and fruit are labeledaccording to the grade. This example is a fairly simple standard, representing an attemptto develop a completely new standard for the market. There are no requirements for priorcool storage, temperature of product, different grade sizes, labeling, or spray-depositlimits, although these may be required in other documentation. Growers are expected tosupply produce to the market sorted to meet these grade standards.
Quality Inspection and ControlIn order to meet these standards fruits and vegetables must be inspected prior to
submission to market, and substandard produce must be downgraded or removed. Qualitycontrol requires continual checks to ensure that standards are maintained, by samplinggraded produce carefully. In apple-handling systems this is achieved by sampling 1 cartonin 50 or 100 in each grade size, according to a specified protocol. Accurate records shouldbe kept of all defects found in these results, so that slow changes in quality levels can beidentified and corrected. If an out-of-grade carton is found, immediate corrective actionis needed. Usually this is achieved by advising sorters of the problem and by repackingcartons packed since the last sample was checked. Some specifications require that asecond carton be checked immediately and corrective action taken according to the
268 Fruit and Vegetables
cumulative results of the two samples. Again it is important that the procedure be wellunderstood and rigorously enforced.
This level of control requires good training of graders and inspectors. Inspectorsmay be employed by the packing shed or by a marketing organization. Incentives tograders for maintaining good quality are needed, rather than threats, which are usuallycounterproductive.
Total Quality ManagementIn order to develop and maintain quality systems in the postharvest industry, total
quality management procedures offer a basis for successful management development.The emphasis of this system is to aim at continual improvement in quality standardswithin the organization. This is achieved by a process of identifying small changes thatwould improve product quality, implementing the changes, evaluating the outcomes,and then adapting or modifying further. Total quality management requires that qualitydefinitions are discussed and agreed by everyone in the production chain, and that aquality manual is produced for use by the company concerned.
In the apple and kiwifruit industries in New Zealand, quality standards are maintainedby a process in which approved grading sheds employ quality-assurance personnel, whoare trained to conduct regular checks on produce, using a carefully developed samplingprocedure [70]. Checks also are conducted by the main marketing organization on receiptof product at the shipping depot. Strict documentation procedures are implementedthroughout. The marketing organization conducts training and certification programs forquality-control personnel each year, including updating staff on changes to standards.
Quality checks are required throughout the postharvest chain. These include not onlychecks on the quality of the product but also an assessment of the procedures and facilitiesat each part of the handling chain. Checks on product quality normally are undertakenwhenever the product changes hands or has completed a unit operation in the chain.
Changes in StandardsStandards should be variable in time rather than absolute, in order to enable producers
to react to, or be proactive in setting, new consumer requirements. This implies that thetechnologist has to continually seek new measurement methods capable of establishingnew standards at all points in the product’s life.
References
1. Salunkhe, D. K., and S. S. Kadam. 1995.Handbook of Fruit Science and Technology.New York: Dekker.
2. FAO. 1995. Commodity Review and Outlook 1994–5.FAO Economic and SocialDevelopment SeriesNo. 53. Rome: Author.
3. FAO. 1996. FAO Yearbook 1995.FAO Statistics SeriesNo. 132. Rome: Author.4. MaCrae, R., R. K. Robinson, and M. J. Sadler eds. 1993.Encyclopedia of Food
Science, Food Technology, and Nutrition. London: Academic Press.5. ISO. 1986.ISO 8402: Quality—Vocabulary. International Standards Organisation.6. ISO. 1987.ISO 9000-9003: Quality Management Systems. International Standards
Organisation.
Fruit and Vegetable Quality 269
7. Kader, A. A. 1983. Postharvest quality maintenance of fruits and vegetables indeveloping countries. InPostharvest Physiology and Crop Production, pp. 455–470. New York: Plenum.
8. Holt, J. E., and D. Schoorl. 1984. A hard systems approach to the management ofquality in apple distribution.Agricultural Systems13:129–142.
9. Herregods, M. 1994. Profitable quality: Cost and profits concerning marketing aproduct preferred by the consumer. InCOST 94, the Postharvest Treatment of Fruitand Vegetables, Quality Criteria, 5th Workshop Proceedings, Slovenia 1994, pp. 21–32. Luxembourg: European Commission.
10. Kader, A. A. 1997. Quality in relation to marketability of fruits and vegetables.Keynote paper, Proceedings of the 5th Fruit Nut and Vegetable Engineering Sym-posium, University of California, Davis.
11. Kader, A. A. 1992.Postharvest technology of agricultural crops. Publication 3311,2nd ed. University of California, Davis.
12. Dauthy, M. E. 1995. Fruit and vegetable processing.FAO Agricultural ServicesBulletinASB 119. Rome: FAO.
13. Amos, N. D., L. U. Opara, C. J. Studman, G. L. Wall, and C. Walsh. 1994. Techniquesto assist with meeting international standards for the export of fresh produce. Section6a, XII CIGR AgEng’94 Conference, Milan, Italy.
14. Watada, A. 1993. The methodology for the determination of the quality of fruitsand vegetables: Influence of new technologies. Paper 37, International Sympo-sium on the Quality of Fruit and Vegetables: Influence of Pre- and Post-harvestFactors and Technology, International Society for Horticultural Science, Chania,Greece.
15. Abbott, J. A., A. E. Watada, and D. R. Massie. 1976. Effe-Gi, Magness-Taylor, andInstron Fruit pressure testing devices for apples, peaches and nectarines.Journal ofthe American Society of Horticultural Science101:698–700.
16. Duprat, F., E. Pietri, M. G. Grotte, and C. J. Studman. 1995. A multipurpose firmnesstester for fruits and vegetables.J. Computers and Electronics in Agriculture12:211–223.
17. Bourne, M. C. 1979. Theory and application of the puncture test in food texturemeasurement. InFood Texture and Rheology, ed. P. Sherman, pp. 95–142. NewYork: Academic Press.
18. Harker, F. R., R. J. Redgwell, I. C. Hallett, S. H. Murray, and Carter, G. 1997. Textureof fresh fruit.Horticultural Reviews20:121–224.
19. Harker, F. R., J. H. Maindonald, and P. J. Jackson. 1996. Penetrometer measurementof apple and kiwifruit firmness: Operator and instrument differences.J. AmericanSociety of Horticultural Science121:927–936.
20. Bourne, M. C. 1966. Measurement of shear and compression components of punc-ture tests.J. Food Science31:282–291.
21. Yang, Y. M., and N. N. Mohsenin. 1974. Analysis of the mechanics of the fruitpressure tester.J. Texture Studies5:213–238.
22. Knight, C. 1991. Crop production harvesting and storage. InVegetable Processing,ed. D. Arthey and C. Dennis, pp. 12–41. New York: Blackie.
270 Fruit and Vegetables
23. Thompson, A. K. 1996.Postharvest Technology of Fruit and Vegetables. Oxford:Blackwell.
24. Shewfelt, R. L., and S. E. Prussia. 1993.Postharvest Handling: A Systems Approach.San Diego: Academic Press.
25. Kapsalis, J. G. 1987.Objective methods in food quality assessment. Boca Raton,FL: CRC Press.
26. Studman, C. J., and L. Boyd. 1994. Measurement of firmness in fruits and vegetables.XII CIGR World Congress AgEng ’94 Conference, Milan, Italy.
27. Griessel, H. M. 1995. The use of internal and positional variations in flesh firmnessof “May Glo” nectarines as a maturity determinant.J. South African Society ofHorticultural Science5 (2):81–84
28. Ha, N. G., L. U. Opara, and C. J. Studman, 1997. Effect of harvest dates, storage tem-perature, and postharvest treatments on quality of Buoi Mango fruit.6th AgriculturalEngineering Students Conference Proceedings, Massey University, pp. 68–71.
29. Mohsenin, N. N. 1986.Physical Properties of Plant and Animal Materials, 2nd ed.New York: Gordon and Breach.
30. Nelson, S. O., W. R. Forbus, and K. C. Lawrence, 1995. Microwave dielectricproperties of fruits and vegetables and possible use for maturity sensing. ConferenceProceedings,International Conference on Harvest and Postharvest Technologiesfor Fresh Fruits and Vegetables, Mexico, pp. 497–504.
31. Priest, K. L., and E. C. Lougheed. 1988. Evaluating maturity of McIntosh and RedDelicious apples.Agdex211/50. Ontario, Canada: Ontario Ministry of Agricultureand Food.
32. Streif, J. 1983. Der optimale Erntetermin beim Apfel: I. (Optimum harvest datefor apples: I. Quality and maturity). Qualitatsentwicklung und Reife.Garten-bauwissemschaft48: p154–159.
33. Streif, J. 1996. Optimum harvest date for different apple cultivars in the Bodenseearea. COST 94, Determination and Prediction of Optimum Harvest Date of Appleand Pears. Working Group Proceedings, Norway, 1994, pp. 15–20. Luxembourg:European Commission.
34. de Jager, A., and F. P. M. M. Roelofs. 1996 Prediction of optimum harvest dateof Jonagold. COST 94, Determination and Prediction of Optimum Harvest Dateof Apple and Pears. Working Group Proceedings, Norway 1994, pp. 21–32.Luxembourg: European Commission.
35. Pitts, M., R. Cavalieri, S. Drake, and J. Fellman. 1997. Evaluating apple firmnesssensors.Washington State University Tree Fruit Postharvest Journal8(4):13–22.
36. Abbott, J. A., R. Lu, B. L. Upchurch, and R. L. Stroshine, 1997. Technologies fornondestructive quality evaluation of fruits and vegetables.Horticultural Reviews20:1–120.
37. Jeffery, P. B., and N. H. Banks, 1994. Firmness-temperature coefficient of kiwifruit.New Zealand Journal of Crop and Horticultural Science22:1–4.
38. Hopkirk, G., A. White, M. S. Arnold, and J. H. Maindonald, 1994. Four newdevices for measuring kiwifruit firmness. KMB Project Report 92/16. Auckland,New Zealand: New Zealand Kiwifruit Marketing Board.
Fruit and Vegetable Quality 271
39. Delwiche, M. J., N. Singh, H. Arevalo, and J. Mehlschau, 1991. A second generationfruit firmness sorter. ASAE Paper 91-6042. St Joseph; MI: ASAE.
40. Peleg, K. 1994. A new sensor for non-destructive measurement of fruit firmness.Conference Proceedings, 5th International Conference on the Physical Propertiesof Agricultural Materials, University of Bonn, Bonn, 1993, paper 931136.
41. Bellon, V., G. Rabatel, and C. Guizard. 1992. Automatic sorting of fruit: Sensorsfor the future.Food Control(January):49–54.
42. Chen, P., and Z. Sun, 1991. A review of non-destructive methods for qualityevaluation and sorting of agricultural products.Journal of Agricultural EngineeringResearch, 49:85–98.
43. Ruiz-Altisent, M. 1994. Non-destructive quality measurement and modelling infruits. Conference proceedings, 5th International Conference on the PhysicalProperties of Agricultural Materials, University of Bonn, Bonn, 1993, paper931153.
44. Clarke, H. L., and W. Mikelson. 1942. Fruit ripeness tester. U.S. patent 2277037.45. Duprat, F., M. G. Grotte, E. Pietri, and D. Loonis. 1997. The acoustic response
method for measuring the overall firmness on fruit.Journal of AgriculturalEngineering Research66:251–259.
46. De Baerdemaeker, J. 1989. The use of mechanical resonance measurements todetermine fruit texture.Acta Horticulturae258:331–339.
47. Cooke, J. R. 1972. An interpretation of the resonant behavior of intact fruitsand vegetables.Transactions of the American Society of Agricultural Engineers16:1075–1080.
48. Cooke, J. R., and R. H. Rand. 1973. A mathematical study of resonance in intactfruits and vegetables using a 3-media elastic sphere model.Journal of AgriculturalEngineering Research18:141–157.
49. Abbott, J. A., G. S. Bachman, R. F. Childers, J. V. Fitzgerald, and F. J. Matusik.1968. Sonic techniques for measuring texture of fruits and vegetables.FoodTechnology22:101–112.
50. Abbott, J. A., R. F. Childers, G. S. Bachman, J. V. Fitzgerald, and F. J. Matusik.1968. Acoustic vibration for detecting textural quality of apples.Proceedings ofthe American Society for Horticultural Science93:725–737.
51. Finney, E. E. 1971. Random vibration techniques for non-destructive evaluation ofpeach firmness.Journal of Agricultural Engineering Research16:81–87.
52. Tollner E. W., J. K. Brecht, and B. L. Upchurch. 1993. Nondestructive evaluation:Detection of external and internal attributes frequently associated with quality ordamage. InPostharvest Handling: A Systems Approach, ed. R. L. Shewfelt andS. E. Prussia, pp. 225–255. San Diego: Academic Press.
53. Paulus, I., and E. Schrevens. 1997. A methodology to study the interaction ofexternal features of apples on human quality classification. Conference Proceedings,Fifth International Symposium on Fruit, Nut and Vegetable Production, Universityof California, Davis.
54. Guyer, D., R. Brook, and E. Timm, 1993. Lighting systems for fruit and vegetablesorting. Bulletin AEIS-618, USDA. East Lansing, MI: Michigan State University.
272 Fruit and Vegetables
55. Studman, C. J. 1994. Design of apple grading tables. Project report, New ZealandApple and Pear Marketing Board, Wellington, New Zealand.
56. Nicholas, J. V. 1985. Color and light for the inspection table. Sirtec Publica-tion no. 1. Wellington, New Zealand: Department of Scientific and IndustrialResearch.
57. Birth G. S., and G. H. Hecht, 1987. The physics of near infrared reflectance. InNearInfrared Technology in the Agricultural and Food Industries, ed. P. C. Williamsand K. H. Norris, pp. 1–15. St. Paul, MN: Society of Cereal Chemists.
58. Kouno, Y., T. Mizuno, and H. Maeda. 1993. Feasibility study into NIR techniquesfor measurement of internal qualities of some tropical fruits.Proceedings ofICAMPE ’93, Korean Society for Agricultural Machinery, Seoul, pp. 326–333.
59. Birth, G. S., G. G. Dull., W. P. Renfro, and S. J. Kays. 1985. Nondestructivespectrophotometric determination of dry matter in onions.J. Amer. Soc. Hort. Sci.110:297–303.
60. Upchurch, B. L., H. A. Affeldt, W. R. Hruschka, K. H. Norris, and J. A. Throop.1990. Spectrophotometric study of bruises on whole “Red Delicious” apples.Transactions of the American Society of Agricultural Engineers33:585–589.
61. Affeldt, H. A., B. L. Upchurch, K. H. Norris, and J. A. Throop. 1989. Bruise de-tection on “Golden Delicious” apples. American Society of Agricultural Engineers89–3011. St Joseph, MI: ASAE.
62. Cavalieri, R. 1997. Detection of watercore in apples.Washington State UniversityTree Fruit Postharvest Journal8(4):3–8.
63. Lenker, D. H., and P. A. Adrian, 1971. Use of X-rays for selecting mature lettuceheads.Transactions of the American Society of Agricultural Engineers4:894–898.
64. Gunasekaran, S. 1990. Delayed light emission as a means of quality evaluationof fruits and vegetables.CRC Critical Reviews in Food Science and Nutrition29(1):19–34.
65. Koto, K. 1987. Non-destructive measurements of fruit quality by electricalimpedance. Agricultural Machinery Research Report no. 17, Kyoto University,Japan.
66. Cho, S. I., and G. W. Krutz, 1989. Fruit ripeness detection by using NMR. AmericanSociety of Agricultural Engineers Paper 89–6620. St Joseph, MI: ASAE.
67. McCarthy, M. J., P. Chen, R. Kauten, and Y. Sarig, 1989. Maturity evaluation ofavocados by NMR methods.American Society of Agricultural Engineerstechnicalpaper 89–3548.
68. Chen P., M. J. McCarthy, and R. Kauten, 1989. NMR for internal quality evaluationof fruits and vegetables.Transactions of the American Society of AgriculturalEngineers32:1747–1753.
69. Steinmetz, V., E. Mesbahi, V. Bellon-Maurel, E. Molto, and R. Pons, 1997. Flexiblereal-time sensor fusion for peach quality assessment. Conference Proceedings,Fifth International Symposium on Fruit, Nut and Vegetable Production, Universityof California, Davis.
70. Enzafruit International. 1997.Quality Assurance Manual. Hastings, New Zealand:Enzafruit.
Fruit and Vegetable Storage Requirements 273
3.2 Fruit and Vegetable Storage RequirementsE. W. Hewett
3.2.1 Fundamentals
It is becoming increasingly important to present top-quality products to discerninginternational consumers. Most major supermarket chains buy horticultural products tospecification (size, weight, color, and freedom from defects); buyers are rejecting prod-ucts that deviate from precontracted specification ranges.
It is therefore imperative that growers, exporters, shippers, and scientists work togetherto ensure that customer quality standards are being met. An important first step in thisprocess is to ensure that all concerned understand the nature of product perishability andappreciate important biological factors that influence deterioration.
An understanding of these features will improve industry’s ability to deliver high-quality produce to its markets, both locally and overseas. Postharvest technologies needto take account of the living nature of horticultural products, and in particular their sus-ceptibility to physical, pathological, and physiological deterioration. Both physical andtemperature abuse of produce can lead to increased decay. Optimum storage tempera-tures are generally as close to freezing temperature as can be achieved without inducingchilling injury. For some crops this is 0◦C, but for crops sensitive to chilling it may beas high as 16◦C. Optimized refrigeration and controlled-atmosphere storage conditionsreduce respiration, achieving slower deterioration and enhanced storage life. Preventingethylene contamination of the storage environment from external sources or by ethylene-producing crops is important to maximize storage life. These approaches, combined withnew engineering and molecular approaches, will be important in the production and han-dling systems used to get products to market.
Postharvest technologists attempt to maintain quality through the cool chain, slowingdeterioration to improve storage and shelf life, and thus ensuring consumers have high-quality fruits and vegetables to purchase. They seek to control the handling, transport, andstorage conditions to ensure optimal quality [1]. Postharvest physiologists seek to under-stand and develop strategies to control the basic physiological and biochemical changesthat occur in harvested plant products during handling and storage. It is only throughsuch understanding that sensible and meaningful recommendations can be made formanipulation of elements in the cool chain to ensure quality products reach all markets.
Morphological structure of fruits and vegetables is incredibly diverse, comprisingall plant parts, such as roots, underground stems, stems, leaves and flowers, and flowerparts [2]. Therefore it is not surprising that handling and storage recommendations formaximum postharvest life vary from product to product.
This section addresses several key elements that influence deterioration in freshlyharvested horticultural crops. It also indicates potential opportunities for quality en-hancement, based on recent biological discoveries.
3.2.2 Horticultural Products Are Living Entities
The harvesting operation is a catastrophic event, removing the product from itssource of minerals and water (from roots) and in most cases from its source of energy
274 Fruit and Vegetables
(carbohydrates from the leaves). Freshly harvested horticultural products remain aliveafter harvest, in contrast with other food products such as cereals, meat, and milk-baseditems. Horticultural products are very active metabolically, as reflected in their relativelyhigh respiration rate.
After harvest, horticultural products do not remain in a constant condition but continueto develop through the following processes that are genetically predetermined:
maturation⇒ ripening⇒ senescence⇒ death
The developmental processes of maturation and ripeness merge and overlap. Maturitymay have two aspects, and it is important to distinguish between them.Physiological ma-turity refers to that stage of development when maximum growth has occurred and propercompletion of subsequent ripening can occur even if the product has been harvested.Com-mercial maturityis that stage of development of a fruit or vegetable that is required by themarket (retailer or consumer); it may have little relation to physiological maturity andmay occur at various stages of ripeness depending on individual consumer preference [3].
Final eating quality is critically dependent on harvesting at the correct maturity stage,so that normal ripening can occur with the concomitant development of flavor, texture,aroma and juiciness required by consumers. In many fruits, ripening occurs either onor off the tree. Optimum eating quality for many vegetable crops is attained before fullmaturity. Examples include peas, green beans, broccoli, sweet corn, zucchini, asparagus,and leafy vegetables; if these products are left attached to the parent plant and notharvested at the correct time, their quality is much reduced. A range of maturity indiceshas been developed for fruits and vegetables (see Table 3.5).
Deterioration commences at harvest; postharvest technologies are designed to slowthe rate of ripening and senescence and hence quality decline. If deterioration is rapid,poor-quality product can be removed at the point of production or packing at whichquality inspection occurs; if deterioration is slow the product may pass initial qualityinspection yet be of reduced acceptability to consumers because of poor appearance,texture, or taste. This is likely to make future purchases unlikely [2].
3.2.3 Deterioration of Fresh Products
Deterioration results from three main types of effects: physical, physiological, andpathological. Most of the following discussion involves physiological effects, but a briefmention of physical and pathological effects is warranted.
Physical EffectsProduce can sustain mechanical or physical damage at all stages of the chain from
harvest to consumption. Bruises, cuts, abrasions, and fractures occur as a result of poorhandling or inadequate packaging. Such damage dramatically increases water loss andsusceptibility to infection by postharvest fungi and bacteria. In addition, respiration andethylene production are enhanced in wounded tissue; these all lead to rapid quality lossin physically damaged organs.
Both product firmness and water status influence susceptibility to mechanical damage.Development of gentle yet effective handling systems and appropriate packages, together
Fruit and Vegetable Storage Requirements 275
with education of personnel, are required to minimize physical damage. This is discussedin Section 3.3.
Pathological EffectsPostharvest decay of produce results in major losses of horticulture foods worldwide.
Any physical damage to produce provides an ideal entry point for such pathogens.A wide range of fungi and bacteria contribute to postharvest losses in fruit and veg-
etables throughout the world, especially in situations in which cool-chain managementis inadequate. These postharvest pathogens may infect produce at various preharveststages through plant or fruit development, at harvest, or after harvest while products arein store or in transit to market.
Latent infections occur during flower or early fruit development, but after initialpenetration the infective agent becomes quiescent until the product has reached a stageof maturity or ripeness that allows it to recommence growth and spread throughoutthe product. Examples includeBotrytis cinereaon strawberries,Monolinia fructicolaon peaches, andColletotrichum gloeosporioideson avocado and mango. Removal ofpreviously infected fruit and application of appropriate fungicides at bloom are therecommended means of control.
Infection through wounds in the product surface (including the picking scar in fruitsuch as kiwifruit) occur especially following mechanical damage sustained throughrough handling at harvest and during grading, sizing, and packaging. Saprophytic organ-isms that would normally not cause a problem, such asRhizopus stoloniferaandMucorspp., have the potential to cause substantial damage, in addition to other ubiquitousfungi and bacteria. Introduction of systems to minimize risks of physical damage, suchas training of staff and total quality management systems, should reduce opportunitiesfor this type of infection to occur.
Growth of many postharvest fungi is inhibited or markedly reduced at storage temper-atures below 5◦C. Unfortunately several successful pathogens, includingBotrytis cinereaandMonolinia fructicola, survive and grow slowly at 0◦C, ready to proliferate rapidlywhen product temperature increases after storage.
Although many pathogens have the potential to cause postharvest decay, most lossesare the result of a relatively few highly effective organisms, many of which have a widehost range, attacking tropical, subtropical, and temperate products (Table 3.9). Tradi-tionally control has required a range of chemicals, applied both as preharvest sprays andpostharvest dips or drenches, but increasingly markets are not accepting such postharvesttreatments.
Recent consumer resistance to spray residues has led to development of nonchemicalor biological control methods to combat postharvest fungal pathogens. Naturally occur-ring yeasts seem promising for reducing several widespread postharvest pathogens [5].
Chilling InjuryMost tropical and subtropical products are susceptible to chilling injury when exposed
to temperatures above freezing but below a critical threshold temperature for each par-ticular product (Fig. 3.6 and Table 3.10). These chilling temperatures cause breakdown

276 Fruit and Vegetables
Table 3.9. Some major postharvest diseases of fresh fruits and vegetables
Crop Disease Pathogens
Apple, pear Lenticel rot Phlycataena vagabunda(Gloeosporium album)
Blue mold rot Penicillium expansumBull’s eye rot Pezicula malicorticisBitter rot Colletotrichum gloeosporioidesEye rot Nectria galligena
Stone fruits Brown rot Monolinia fructicolaGrey mold Botrytis cinereaRhizopus Rhizopus spp.Blue mold Penicillium expansumAlternaria rot Alternaria alternata
Strawberries Gray mold rot Botrytis cinereaRhizopus rot Rhizopus spp.Anthracnose Colletotrichum gloeosporioides
Grapes Gray mold rot Botrytis cinereaAlternaria rot Alternaria alternataCladosporium rot Cladosporium herbarumBlue mold rot Penicillium expansum
Banana and plantain Anthracnose Colletotrichum musaeThielaviopsis finger-stem rot Thielaviopsis paradoxaBotryodiplodia finger-stem rot Botryodiplodia theobromaeFusarium finger-stem and spot rot Fusarium roseum
Tropical fruits Cigar-end rot Verticillium theobromaeCrown rot Fusarium roseum
Pineapple Thielaviopsis soft rot: water blister, black rot Thielaviopsis paradoxaBacterial brown rot Erwinia ananasFruitlet core rot Penicillium funiculosum
Tomatoes Alternaria rot Alternaria alternataBuckeye rot Phytophthora parasiticaBotrytis rot Botrytis cinereaRhizopus rot Rhizopus spp.Sour rot Geotrichum candidum
Carrots Bacterial soft rot Erwinia carotovoraWhite rot Sclerotinia minorBlack mold Thielaviopsis basicola
Citrus fruits Blue mold rot Penicillium italicumGreen mold rot Penicillium digitatumBrown rot Phytophthora citrophthoraDiplodia rot Diplodia natalensisPhomopsis rot Phomopsis citriAlternaria rot Alternaria citriTrichoderma rot Trichoderma lignorumSour rot Geotrichum candidum
Avocado Dothiorella stem-end rot Dothiorella gregariaDiplodia stem-end rot Diplodia natalensisAnthracnose Colletotrichum gloeosporiodesPhomopsis stem-end rot Phomopsis citri
Kiwifruit Gray mold Botrytis cinereaSurface mold Alternaria alternata
(Cont.)
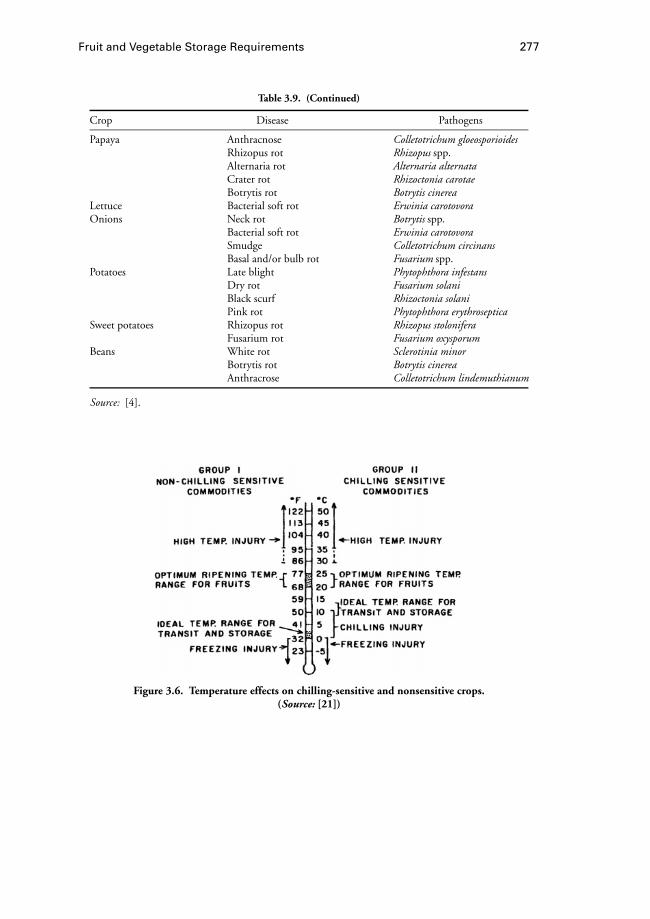
Fruit and Vegetable Storage Requirements 277
Table 3.9. (Continued)
Crop Disease Pathogens
Papaya Anthracnose Colletotrichum gloeosporioidesRhizopus rot Rhizopus spp.Alternaria rot Alternaria alternataCrater rot Rhizoctonia carotaeBotrytis rot Botrytis cinerea
Lettuce Bacterial soft rot Erwinia carotovoraOnions Neck rot Botrytis spp.
Bacterial soft rot Erwinia carotovoraSmudge Colletotrichum circinansBasal and/or bulb rot Fusarium spp.
Potatoes Late blight Phytophthora infestansDry rot Fusarium solaniBlack scurf Rhizoctonia solaniPink rot Phytophthora erythroseptica
Sweet potatoes Rhizopus rot Rhizopus stoloniferaFusarium rot Fusarium oxysporum
Beans White rot Sclerotinia minorBotrytis rot Botrytis cinereaAnthracrose Colletotrichum lindemuthianum
Source: [4].
Figure 3.6. Temperature effects on chilling-sensitive and nonsensitive crops.(Source: [21])
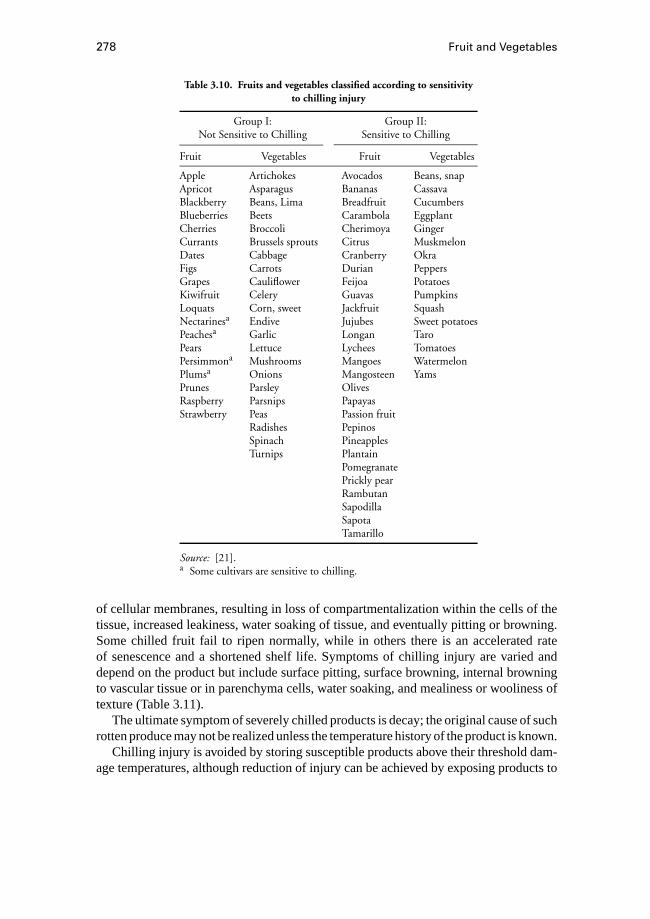
278 Fruit and Vegetables
Table 3.10. Fruits and vegetables classified according to sensitivityto chilling injury
Group I: Group II:Not Sensitive to Chilling Sensitive to Chilling
Fruit Vegetables Fruit Vegetables
Apple Artichokes Avocados Beans, snapApricot Asparagus Bananas CassavaBlackberry Beans, Lima Breadfruit CucumbersBlueberries Beets Carambola EggplantCherries Broccoli Cherimoya GingerCurrants Brussels sprouts Citrus MuskmelonDates Cabbage Cranberry OkraFigs Carrots Durian PeppersGrapes Cauliflower Feijoa PotatoesKiwifruit Celery Guavas PumpkinsLoquats Corn, sweet Jackfruit SquashNectarinesa Endive Jujubes Sweet potatoesPeachesa Garlic Longan TaroPears Lettuce Lychees TomatoesPersimmona Mushrooms Mangoes WatermelonPlumsa Onions Mangosteen YamsPrunes Parsley OlivesRaspberry Parsnips PapayasStrawberry Peas Passion fruit
Radishes PepinosSpinach PineapplesTurnips Plantain
PomegranatePrickly pearRambutanSapodillaSapotaTamarillo
Source: [21].a Some cultivars are sensitive to chilling.
of cellular membranes, resulting in loss of compartmentalization within the cells of thetissue, increased leakiness, water soaking of tissue, and eventually pitting or browning.Some chilled fruit fail to ripen normally, while in others there is an accelerated rateof senescence and a shortened shelf life. Symptoms of chilling injury are varied anddepend on the product but include surface pitting, surface browning, internal browningto vascular tissue or in parenchyma cells, water soaking, and mealiness or wooliness oftexture (Table 3.11).
The ultimate symptom of severely chilled products is decay; the original cause of suchrotten produce may not be realized unless the temperature history of the product is known.
Chilling injury is avoided by storing susceptible products above their threshold dam-age temperatures, although reduction of injury can be achieved by exposing products to
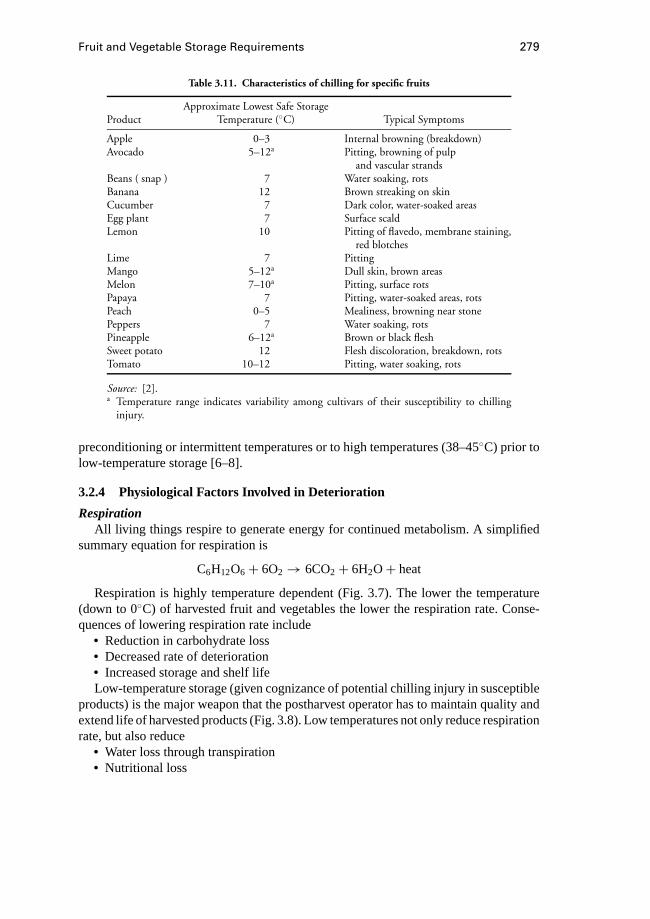
Fruit and Vegetable Storage Requirements 279
Table 3.11. Characteristics of chilling for specific fruits
Approximate Lowest Safe StorageProduct Temperature (◦C) Typical Symptoms
Apple 0–3 Internal browning (breakdown)Avocado 5–12a Pitting, browning of pulp
and vascular strandsBeans ( snap ) 7 Water soaking, rotsBanana 12 Brown streaking on skinCucumber 7 Dark color, water-soaked areasEgg plant 7 Surface scaldLemon 10 Pitting of flavedo, membrane staining,
red blotchesLime 7 PittingMango 5–12a Dull skin, brown areasMelon 7–10a Pitting, surface rotsPapaya 7 Pitting, water-soaked areas, rotsPeach 0–5 Mealiness, browning near stonePeppers 7 Water soaking, rotsPineapple 6–12a Brown or black fleshSweet potato 12 Flesh discoloration, breakdown, rotsTomato 10–12 Pitting, water soaking, rots
Source: [2].a Temperature range indicates variability among cultivars of their susceptibility to chilling
injury.
preconditioning or intermittent temperatures or to high temperatures (38–45◦C) prior tolow-temperature storage [6–8].
3.2.4 Physiological Factors Involved in Deterioration
RespirationAll living things respire to generate energy for continued metabolism. A simplified
summary equation for respiration is
C6H12O6+ 6O2→ 6CO2+ 6H2O+ heat
Respiration is highly temperature dependent (Fig. 3.7). The lower the temperature(down to 0◦C) of harvested fruit and vegetables the lower the respiration rate. Conse-quences of lowering respiration rate include• Reduction in carbohydrate loss• Decreased rate of deterioration• Increased storage and shelf lifeLow-temperature storage (given cognizance of potential chilling injury in susceptible
products) is the major weapon that the postharvest operator has to maintain quality andextend life of harvested products (Fig. 3.8). Low temperatures not only reduce respirationrate, but also reduce• Water loss through transpiration• Nutritional loss

280 Fruit and Vegetables
Figure 3.7. Tempertaure effects on respiration ofseveral fresh horticultural products. (modified
from [9])
Figure 3.8. Generalized temperature effects on qualityand storage life of horticultural products. (modified
from [9])
• Postharvest decay• Ethylene productionPractical application of such information has been incorporated into successful cool-
chain management for many products. Immediately after harvest, products should beplaced in a well-ventilated shade environment to prevent large temperature increasesthat occur if products are exposed to direct sunlight.
Rapid cooling as soon as possible after harvest (to reduce respiration rate) is usedcommonly in the horticultural industry, particularly for very perishable products suchas strawberries and broccoli but also for kiwifruit and apples. Hydrocooling, vacuum

Fruit and Vegetable Storage Requirements 281
cooling, or forced air-cooling is used widely to remove field heat rapidly. The methodchosen depends on the crop.
Respiration rate of horticultural products varies, but as a general rule perishability is afunction of respiration rate; the greater the respiration rate the more perishable the productand the shorter the time it can be stored and still maintain acceptable quality. Activelygrowing products, such as asparagus or broccoli, or tropical fruit, such as cherimoya ormango, have high rates of respiration and limited storage life.
Differences do exist among cultivars, so it is important that this be taken into accountfor cool store and packaging. A summary of optimum storage temperatures for selectedfruits and vegetables is shown in the Appendix, Table 3.A3.
Packages should be designed to allow cool air to flow directly over products, ensuringrapid temperature pull-down and consequent temperature maintenance. Regrettably, toomany packages in current use are largely inpenetratable to air movement, resulting in aslow temperature decrease, influencing quality negatively (see Section 3.3).
Minimizing temperature variation from the optimum recommended during storageimproves uniformity in product quality. Refinements are being made in refrigeration-control systems, cool-store design, and pallet-stacking patterns to optimize air temper-ature and airflow through and around pallets in cool stores [10]. This prevents hot spotsfrom developing in localized areas within the store that would lead to higher respirationrates, more rapid deterioration, and hence poorer quality than in parts of the store inwhich product temperature was optimised (see Section 3.4).
Freezing point of most horticultural products after harvest is between−2 and−1◦C.Temperatures in coolstores should be maintained at or slightly above 0◦C for temper-ate products to avoid freezing; damage caused by freezing will disrupt cell walls andmembranes, leading to loss of cellular compartmentation and increased susceptibilityto infection by fungi and bacteria. Deterioration is rapid, generally irreversible, andterminal if products are removed from freezing temperatures and allowed to thaw.
Increasing interest is being shown in the potential of short-term prestorage exposureto relatively high temperatures (35–55◦C) as a means of reducing chilling injury [7],as a quarantine treatment for disinfesting products of pests [11] and for reducing therate of some senescence processes. Product-specific high-temperature treatments havebeen shown to reduce ethylene production, prevent yellowing and retard softening in anumber of products [6], all of which can extend storage life.
Controlled and Modified AtmospheresIt has long been recognised (since the 1920s and 1930s) that controlling the atmo-
sphere around products influences respiration rate. Respiration rate is a function of O2
and CO2 concentration. Respiration decreases as O2 concentration in the environment,and hence inside the product, is reduced. Eventually an O2 concentration is reached,below which CO2 production rapidly increases (Fig. 3.9) as anaerobic respiration pre-dominates. The O2 concentration at which respiration is at a minimum is called theanaerobic compensation point(ACP). The ACP or lower oxygen limit [13] varies withtemperature, fruit type, and cultivar and among fruit, probably because of varying skinpermeance to O2 and CO2 movement [14]. Derivation of ACP needs to be undertaken for
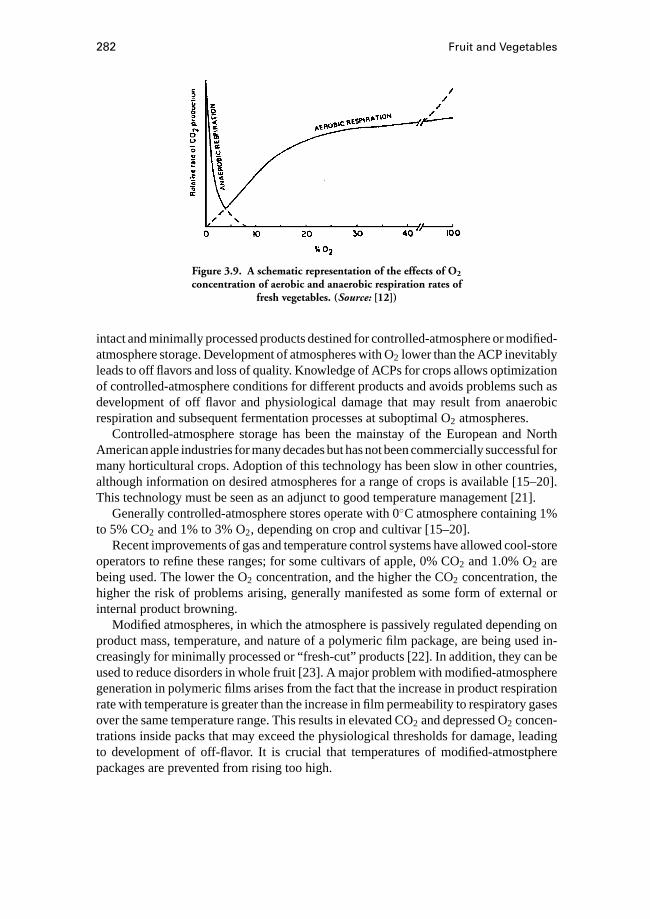
282 Fruit and Vegetables
Figure 3.9. A schematic representation of the effects of O2
concentration of aerobic and anaerobic respiration rates offresh vegetables. (Source: [12])
intact and minimally processed products destined for controlled-atmosphere or modified-atmosphere storage. Development of atmospheres with O2 lower than the ACP inevitablyleads to off flavors and loss of quality. Knowledge of ACPs for crops allows optimizationof controlled-atmosphere conditions for different products and avoids problems such asdevelopment of off flavor and physiological damage that may result from anaerobicrespiration and subsequent fermentation processes at suboptimal O2 atmospheres.
Controlled-atmosphere storage has been the mainstay of the European and NorthAmerican apple industries for many decades but has not been commercially successful formany horticultural crops. Adoption of this technology has been slow in other countries,although information on desired atmospheres for a range of crops is available [15–20].This technology must be seen as an adjunct to good temperature management [21].
Generally controlled-atmosphere stores operate with 0◦C atmosphere containing 1%to 5% CO2 and 1% to 3% O2, depending on crop and cultivar [15–20].
Recent improvements of gas and temperature control systems have allowed cool-storeoperators to refine these ranges; for some cultivars of apple, 0% CO2 and 1.0% O2 arebeing used. The lower the O2 concentration, and the higher the CO2 concentration, thehigher the risk of problems arising, generally manifested as some form of external orinternal product browning.
Modified atmospheres, in which the atmosphere is passively regulated depending onproduct mass, temperature, and nature of a polymeric film package, are being used in-creasingly for minimally processed or “fresh-cut” products [22]. In addition, they can beused to reduce disorders in whole fruit [23]. A major problem with modified-atmospheregeneration in polymeric films arises from the fact that the increase in product respirationrate with temperature is greater than the increase in film permeability to respiratory gasesover the same temperature range. This results in elevated CO2 and depressed O2 concen-trations inside packs that may exceed the physiological thresholds for damage, leadingto development of off-flavor. It is crucial that temperatures of modified-atmostpherepackages are prevented from rising too high.
Fruit and Vegetable Storage Requirements 283
Development of models that predict the physiological responses of products to ir-regular and often unpredictable changes in temperature during handling, storage, andtransport of modified-atmosphere packaged products should assist in the developmentof relatively low-risk systems [24].
EthyleneEthylene is an ubiquitous, naturally occurring gaseous compound produced by plants
that at very low concentrations can influence many aspects of plant growth and devel-opment [25]. It is particularly important in the maturation, ripening and senescence offruits, flowers and vegetables.
Ethylene is a simple, two-carbon unsaturated compound:
H H\ /
C == C/ \
H H
It is also a contamination product from petroleum-powered engines, from cigarettesmoke, and from the ballasts of fluorescent lights.
Ethylene can have both positive and negative effects on product quality [21]. Positiveeffects include• Coordination of several ripening events• Induction of abscission and color change from green to yellow• Induction of softening, juice development, and flavor• Promotion of uniform ripening• Commercial ripening of avocados, bananas, kiwifruit, and tomatoes
However, important negative effects of ethylene on quality include• Accelerated senescence even at low temperatures• Induced loss of green color in leaves• Induction of abscission in flowers and fruit• Increased organ softening even at concentrations as low as 0.001µL ·L−1 [26].• Induction of some physiological disorders• Initiation of ripening in climacteric fruit that cannot be reversed.Increasingly, attempts are being made to prevent ethylene from accumulating in pack-
ages or in cool stores. Ethylene-absorbing material can be placed inside sachets (e.g.,potassium permanganate on perlite) or is used for scrubbing ethylene from cool stores(e.g., activated charcoal). However, in general, stringent attention to hygiene conditionsin and around packing sheds and ensuring that exhaust fumes do not contaminate productsare the best ways of preventing ethylene accumulation.
Fruits can be categorized as climacteric or nonclimacteric (Table 3.12) depending ontheir response to and ability to produce ethylene [27]. Climacteric fruit are those thatproduce relatively large amounts of ethylene during ripening on or off the tree. Peakproduction generally coincides with a concurrent respiratory peak within 3 to 10 days ofharvest, after which respiration may decline. Ethylene production is autocatalytic in that
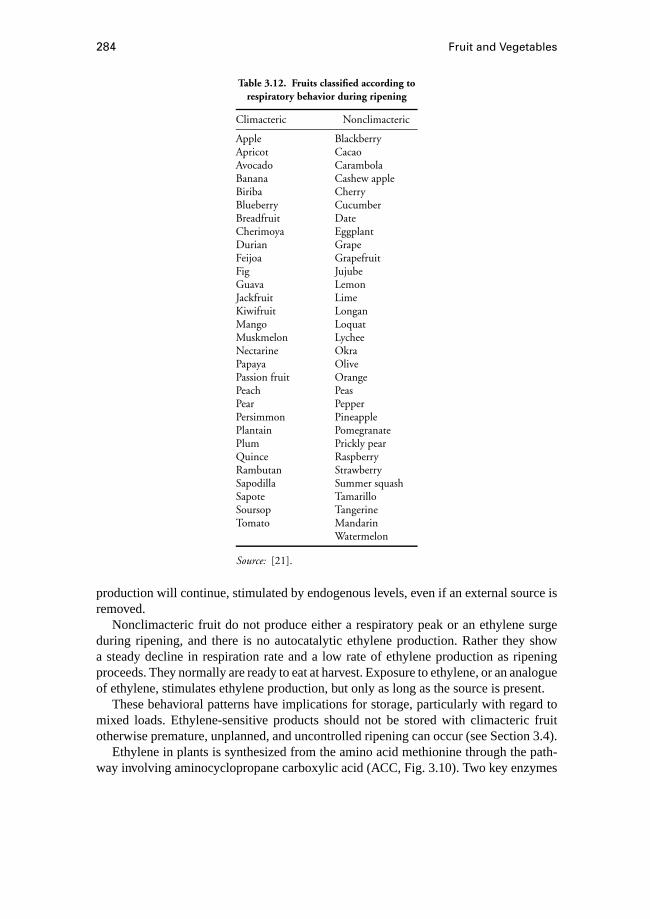
284 Fruit and Vegetables
Table 3.12. Fruits classified according torespiratory behavior during ripening
Climacteric Nonclimacteric
Apple BlackberryApricot CacaoAvocado CarambolaBanana Cashew appleBiriba CherryBlueberry CucumberBreadfruit DateCherimoya EggplantDurian GrapeFeijoa GrapefruitFig JujubeGuava LemonJackfruit LimeKiwifruit LonganMango LoquatMuskmelon LycheeNectarine OkraPapaya OlivePassion fruit OrangePeach PeasPear PepperPersimmon PineapplePlantain PomegranatePlum Prickly pearQuince RaspberryRambutan StrawberrySapodilla Summer squashSapote TamarilloSoursop TangerineTomato Mandarin
Watermelon
Source: [21].
production will continue, stimulated by endogenous levels, even if an external source isremoved.
Nonclimacteric fruit do not produce either a respiratory peak or an ethylene surgeduring ripening, and there is no autocatalytic ethylene production. Rather they showa steady decline in respiration rate and a low rate of ethylene production as ripeningproceeds. They normally are ready to eat at harvest. Exposure to ethylene, or an analogueof ethylene, stimulates ethylene production, but only as long as the source is present.
These behavioral patterns have implications for storage, particularly with regard tomixed loads. Ethylene-sensitive products should not be stored with climacteric fruitotherwise premature, unplanned, and uncontrolled ripening can occur (see Section 3.4).
Ethylene in plants is synthesized from the amino acid methionine through the path-way involving aminocyclopropane carboxylic acid (ACC, Fig. 3.10). Two key enzymes

Fruit and Vegetable Storage Requirements 285
Figure 3.10. Ethylene biosynthetic pathway in plantsincluding process inhibitors and promoters.
286 Fruit and Vegetables
catalyze reactions in this pathway: ACC synthase, the rate-limiting enzyme that convertsS-adenosylmethionine to ACC; and ACC oxidase, which converts ACC to ethylene.
Storage of climacteric fruit at low temperatures or low O2 concentrations resultsin reduced ethylene production because of the inhibition of ACC oxidase activity. Thusanother beneficial effect of low temperature controlled-atmosphere storage of climactericfruit is this reduction in endogenous ethylene, which in turn helps extend storage andshelf life. However, the beneficial effects of controlled-atmosphere are enhanced if ascrubber is utilized to maintain ethylene concentrations at a minimum.
The pathway of ethylene biosynthesis is well established for higher plants (seeFig. 3.10). Some chemicals are available to inhibit the key rate-limiting enzyme, ACCsynthase, but although relatively effective in reducing ethylene production, they havenot gained commercial acceptance. Low temperatures and controlled-atmosphere con-ditions reduce the conversion of ACC to ethylene. Several compounds are available thatwhen absorbed into the plant or product can prevent ethylene from binding to putativeethylene receptors and hence inhibit ethylene action [25]. Silver thiosulphate is widelyused in the cut-flower industry to prolong shelf life [25]. New compounds such as di-azocyclopentadiene and 1-methylcyclopropene are very effective inhibitors of ethyleneaction [28] and are still under evaluation for use in the cut-flower and nursery industries.
Ethylene is widely used on several fruit crops to induce uniform and consistent ripen-ing, to provide “ready to eat” product for consumers. Application of ethylene as a ripen-ing or degreening gas, at concentrations from 10 to 200 ppm, generally combined withCO2 or N2, is used routinely for tomatoes, bananas, avocados, kiwifruit, and citrus attemperatures of 15 to 25◦C and at 80% to 95% relative humidity [2].
3.2.5 Preharvest Factors Affecting Postharvest Quality
Ultimate eating quality of fruit is largely predetermined at harvest. Choice of cultivar,rootstock, irrigation, fertilizer regime, training, and pruning systems will impact fruitsize and color at harvest.
Calcium is the fifth most abundant element in soil, and symptoms of Ca deficiency arerarely seen on leaves of plants. However, because uptake, transport, and distribution of Cawithin plants is different from those of other major elements, fruit, bulky leafy vegetables,and root crops are often deficient in this element. More than 30 physiological qualitydefects can be directly attributed to shortage of Ca [29]. Disorders caused by deficienciesin Ca often develop during cool storage, with fruit having appeared in good condition atharvest.
Uptake of calcium is predominantly by young, actively growing roots; this elementmoves passively with water in xylem tissues at a rate largely determined by transpiration.It does not move in phloem tissues to any great extent and hence is not redistributedfrom one organ to another. Calcium is distributed mainly to those tissues with a hightranspiration rate, so organs with a large surface area–to–mass ratio (leaves, youngdeveloping fruit) will contain more calcium than those with a lesser surface area–to–massratio (large fruit, tubers, heart vegetables). This element plays a crucial role in maintainingintegrity of cell walls and membranes. It is also involved in transduction of external
Fruit and Vegetable Storage Requirements 287
stimuli to cells. Thus, deficiencies of calcium dramatically affect quality attributes suchas firmness, texture, and susceptibility to a range of physiological disorders such aspitting, internal breakdown and chilling injury, as well as influencing susceptibility toinfection by postharvest pathogens [29–31].
Calcium enhancement is best achieved by adding Ca directly to fruit, either by pre-harvest sprays or postharvest vacuum infiltration or dipping treatments using CaCl2
[32]. Application of Ca to the soil as lime generally will not ameliorate Ca-related fruit-quality problems. It should be possible to establish product-specific calcium thresholdconcentrations, below which quality problems are likely to occur, and devise appropriatemanagement strategies to enhance tissue concentrations of calcium.
Other mineral elements can affect product quality. Excess of nitrogen, imbalanceof nitrogen, potassium and magnesium, and deficiency of phosphorus and certain mi-croelements all can result in detrimental effects on product quality and reduce storagelife.
3.2.6 Harvesting and Its Effect on Postharvest Quality
Great care must be taken during harvesting of perishable fruits and vegetables toavoid physical damage (see Section 3.3). Any mechanical damage that occurs at harvest,during movement of product to the packhouse, or through grading and packing lines willresult in enhanced respiration, elevated ethylene production, water loss and increasedsusceptibility to infection by postharvest pathogens, all of which can induce rapid de-terioration and loss of quality. A number of simple but effective steps can be taken toreduce physical damage from occurring during this phase of the harvesting and handlingsystem [33]. These include careful handling of the product at all stages of the operation,good sanitation and hygiene with all equipment (this may include addition of chlorine [ashypochlorite at 50–150 ppm] to water dumps in the packing and grading line to reducemicroorganisms), maintenance of packing equipment to prevent excessive drops ontohard surfaces, and padding of all machinery surfaces on which products may impact.
Curing is a simple method of reducing losses due to decay and water loss during stor-age of some products including some citrus fruit, root, tuber, and bulb crops. Prestorageexposure for 1 to 10 days (time depending on product), at 12 to 20◦C for potatoes, ki-wifruit, and citrus, or to 30 to 40◦C for sweet potatoes, yams, onions, garlic, and cassava,allows some moisture loss but induces wound healing by development of new suber-ized epidermal tissue, thus preventing decay development and further excessive waterloss [21].
3.2.7 New Postharvest Opportunities
Customers, especially supermarket buyers, are requiring increasingly uniform andconsistent products with narrowing margins of quality specification. Technologists arepoised to make further significant contributions to improving the quality of fresh har-vested horticultural products. Further refinements can be expected as we learn moreabout the interaction of preharvest factors with responses of products to the postharvestenvironment.
288 Fruit and Vegetables
Specific knowledge of product response to endogenous CO2, O2, and C2H4 at differenttimes and temperatures after harvest, together with the sophisticated temperature- andgas-control systems currently available, creates the opportunity for modulating storageenvironments to continuously minimize respiration rate and hence deterioration. This canbe achieved in both static land-based cool stores and in seagoing containers. Intermittentshock treatments to minimize some physiological disorders, including chilling injury,also may be possible [7].
Considerable efforts are being made to develop active packaging to overcome prob-lems associated with changing temperatures during storage and transit of modified-atmosphere packages. Development of films that can increase permeability in responseto a chemical signal (e.g., ethanol or acetaldehyde produced during anaerobic respira-tion) may soon become a reality. The possibility for creating surface coatings, whichreduce water loss but at the same time allow the establishment of appropriate internalatmospheres in fruit but do not allow physiologically “dangerous” levels of gases todevelop, is exciting.
Rapid advances are being made in creating equipment that can monitor internal qualityattributes nondestructively. Already it is possible to grade fruit electronically for size andcolour; near infrared detectors already are used commercially in Japan and France tomeasure soluble solids content in fruit on grading lines. The ability to separate productsaccurately and consistently on the basis of specific internal chemical composition createsthe opportunity for providing particular quality attributes (taste or sensory) for discerningniche markets.
Genetic manipulation of plants probably offers the greatest opportunity for makinglong-term sustainable advances in reducing deterioration rates and extending storage andshelf life of horticultural products. Naturally occurring, long-life mutant tomatoes arenow available for commercial production. Combining genetic traits conferring normalshape and flavor attributes with those conferring reduced ethylene production, traditionalplant breeders have been able to create highly acceptable cultivars that have a muchextended shelf life compared with previous cultivars.
Molecular biology has allowed scientists to incorporate desirable genes into the ge-netic makeup of traditional crops. The first commercially produced food plant of thistype accepted by the FDA in the USA was the Flavr Savr tomato produced by Calgene.Molecular technology was used to inhibit cell-wall breakdown and hence slow fruitsoftening. The Flavr Savr tomatoes are more resistant to handling damage, and hencepostharvest decay, than normal tomatoes, as well as producing a more viscous paste thatis a great advantage for tomato processors. Tomatoes have been produced with much-reduced ethylene production and hence greatly extended shelf life. Similar lines havebeen created for apple, peach, and kiwifruit and are being evaluated for other productionand quality attributes.
References
1. Shewfelt, R. L., and S. E. Prussia, ed. 1993.Postharvest Handling: A Systems Ap-proach. Academic Press, San Diego, California, USA.
Fruit and Vegetable Storage Requirements 289
2. Wills, R. H. B., T. H. Lee, D. Graham, W. B. McGlasson, and E. G. Hall. 1989.Postharvest: An Introduction to the Physiology and Handling of Fruit and Vegetables.N.S.W. University Press, Sydney, Australia.
3. Watada, A. E., R. C. Herner, A. A. Kader, R. J. Romani, and G. L. Staby. 1984.Terminology for the description of developmental stages of horticultural crops.HortSci.19:20–21.
4. Somme, N. F., J. Fortlag, and D. C. Edwards. 1991. Postharvest diseases of selectedcommodities. InPostharvest Technology of Horticultural Crops, ed. A. A. Kader,University of California Publication 3311, pp. 117–160.
5. Wilson, C. L., M. E. Wisniewski, ed. 1994.Biological Control of Postharvest Dis-eases of Fruits and Vegetables: Theory and Practice. CRC Press, Boca Raton,Florida, USA.
6. Klein, J. D., and S. Lurie. 1992. Heat treatments for improved postharvest qualityof horticultural crops.Hort. Technology2:316–320.
7. Wang, C. Y. 1993. Approaches to reduce chilling injury of fruits and vegetables.Hort. Rev.15:63–95.
8. Woolf, A. B., and M. Lay Yee. 1997. Pretreatment at 38◦C of Hass avocado confersthermotolerance to 50◦C hot water treatments.HortSci.32:705–708.
9. Hardenburg, R. E., A. E. Watada, and C. Y. Wang. 1986. The commercial storage offruits, vegetables, and florist and nursery stocks. U.S. Department of Agriculture,Agriculture Handbook 66, pp. 136.
10. Amos, N., D. J. Cleland, N. H. Banks, and A. C. Cleland. 1993. A survey of airflow, temperature and relative humidity patterns on a large horticultural coolstore.Refrigeration Sci. Tech. 3:414–422.
11. Paull, R. E. 1994. Heat and cold treatments. InInsect Pests and Fresh HorticulturalProducts: Treatment and Responses, ed. R. E. Paull and J. W. Armstrong, pp. 191–222. UK: CAB International.
12. Kader, A. 1987. Respiration and gas exchange of vegetables. InPostharvest Physi-ology of Vegetables, ed. J. Weichmann, pp. 25–43. Marcel Dekker, New York, USA.
13. Yearsley, C. W., N. H. Banks, S. Ganesh, and D. J. Cleland. 1996. Determination oflower oxygen limits for apple fruit.Postharvest Biol. Tech.8:95–109.
14. Dadzie, B. K., N. H. Banks, D. J. Cleland, and E. W. Hewett. 1996. Changes inrespiration and ethylene production of apples in response to internal and externaloxygen partial pressures.Postharvest Biol. Tech.9:297–309.
15. Kupferman, E. 1997. Controlled atmosphere storage of apples. InCA’97, vol. 2,Apples and Pears, ed., E. J. Mitcham, pp. 1–30. Proceedings of the 7th Interna-tional Controlled Atmosphere Research Conference, University of California, Davis,Postharvest Horticultural Series No. 16.
16. Richardson, D. G. 1997. Controlled atmosphere storage of pears. InCA ’97, vol.2, Apples and Pears, ed., E. J. Mitcham, pp. 1–30. Proceedings of the 7th Interna-tional Controlled Atmosphere Research Conference, University of California, Davis,Postharvest Horticultural Series No. 16.
17. Kader, A. A. 1997. A summary of CA requirements and recommendations for fruitsother than apples and pears. InCA ’97, vol. 3, Fruits Other than Apples and Pears, ed.,

290 Fruit and Vegetables
A. A. Kader, pp. 1–34. Proceedings of the 7th International Controlled AtmosphereResearch Conference, University of California, Davis, Postharvest HorticulturalSeries No. 17.
18. Saltveit, M. E. 1997. A summary of CA requirements and recommendations forharvested vegetables. InCA’97, vol. 4, Vegetables and Ornamentals, ed., M. E.Saltveit, pp. 98–117. Proceedings of 7th International Controlled Atmosphere Re-search Conference, University of California, Davis, Postharvest Horticultural SeriesNo. 18.
19. Reid, M. S. 1997. A summary of CA requirements and recommendations for orna-mentals and cut flowers. InCA ’97, vol. 4, Vegetables and Ornamentals, ed. M. E.Saltveit, pp. 98–117. Proceedings of the 7th International Controlled AtmosphereResearch Conference, University of California, Davis, Postharvest Horticultural Se-ries No. 18.
20. Gorny, J. R. 1997. A summary of CA requirements and recommendations for fresh-cut (minimally processed) fruits and vegetables. InCA ’97, vol. 5, Fresh-cut Fruitsand Vegetables and MAP, ed. J. R. Gorny, pp. 30–66. Proceedings of the 7th In-ternational Controlled Atmosphere Research Conference, University of California,Davis, Postharvest Horticultural Series No. 19.
21. Kader, A. A. 1992. Postharvest technology of horticultural crops. University ofCalifornia, Publication 3311, pp. 296.
22. Watada, A. E., N. P. Ko., and D. A. Minott. 1996. Factors affecting quality of fresh-cut horticultural products.Postharvest Biol. Tech.9:115–125.
23. Hewett, E. W., and C. J. Thompson. 1989. Modified atmosphere storage and bitterpit reduction in Cox’s Orange Pippin apples.Sci. Hortic.39:117–139.
24. Merts, I., D. J. Cleland, N. H. Banks, and A. C. Cleland. 1993. Prediction of chillingtimes for objectives of regular multi-dimensional shape using a general geometricfactor.Refrig. Sci. Technol.33:259–267.
25. Abeles, F. B., P. W. Morgan, and M. Saltveit. 1992.Ethylene in Plant Biology.Academic Press, San Diego, California, USA.
26. Jeffrey P. B., and N. H. Banks. 1996. Effects of ethylene on kiwifruit softening incoolstore.N. Z. Kiwifruit Journal110 (March): 9.
27. Biale, J. B., and R. E. Young. 1981. Respiration and ripening in fruit: Retrospectand prospects. InRecent Advances: Biochemistry of Fruits and Vegetables, ed., J.Friend and M. J. Rhodes, pp. 1–39, Academic Press, New York, USA.
28. Serek, M., E. C. Sisler, and M. S. Reid. 1994. Novel gaseous ethylene bindinginhibitor prevents ethylene effects in potted flowering plants.J. Am. Soc. HortSci.119:1230–1233.
29. Shear, C. B. 1975. Calcium related disorders of fruits and vegetables.HortSci.10:361–365.
30. Conway, W. S. 1989. Altering nutritional factors after harvest to enhance resistanceto postharvest disease.Phytopath. 79:1384–1387.
31. Poovaiah, B. W., G. M. Glenn, and A. S. N. Reddy. 1988. Calcium and fruit softening.Hort. Rev.10:107–153.
Handling Systems and Packaging 291
32. Hewett, E. W., and C. B. Watkins. 1991. Bitter pit control by sprays and vacuuminfiltration of calcium in “Cox’s Orange Pippin” apples.HortSci.26:284–286.
33. Kader, A. A. 1993. Postharvest handling. InThe Biology of Horticulture, ed. J. E.Preece and P. E. Read, pp. 353–377. John Wiley and Sons, New York, USA.
3.3 Handling Systems and PackagingC. J. Studman
3.3.1 Postharvest Losses
Fruit and vegetables must be transferred from the field to the table, to arrive in astate that is acceptable to the consumer. Although traditional farm- and orchard-gatesales still can provide a useful income, the increasingly lucrative demand for year-roundsupplies from urban dwellers and international markets requires that there has to be anincreasing level of handling, transportation, and storage of products. Unlike cereals, fruitand vegetables are essentially highly perishable commodities. Most fruit and vegetablecrops begin to deteriorate as soon as they are harvested, and most are particularly proneto handling damage at all times. In general, the level of susceptibility of these products tohandling damage is greatly underestimated, usually because the effects of mishandlingdo not appear until some time after the damage occurred.
Estimates of postharvest losses are difficult to make. Generally accepted valuesare 25% to 50% of production in less-developed countries [1–4], and around 10%to 25% elsewhere. Poor handling and storage can easily result in a total crop lossanywhere. Estimated losses for various crops in less-developed countries are given inTable 3.13. In developed marketing systems losses are lower (e.g., Table 3.14). As thetable implies, not all losses are due to poor handling, but handling damage is known toaccelerate other types of deterioration, particularly the development of molds and rots.
This section reviews postharvest procedures and operations for fresh fruit and vegeta-bles and considers ways to avoid handling damage. Packaging options also are described.Requirements for fruit intended for canning and processing are generally less severe, butfinancial returns are also usually lower.
3.3.2 Postharvest Operations
The types of operations are summarized in Table 3.15. Clearly processes differ amongcrops, and some crops do not require all the stages listed or may require further operationsto enhance the quality of the product. Seven major steps are involved, and the examplegiven in the right-hand column is based on the postharvest chain for apples. Other cropsare discussed in the text.
HarvestProduct for the fresh-fruit market mostly is harvested by hand into suitable containers.
Fruit are easily damaged at harvest time, so care is required. Mechanical aids are availablefor harvesting in the form of gantries, picking ladders, and in some cases mobile conveyorsystems, but more commonly the picker collects the fruit into a small holder such as a
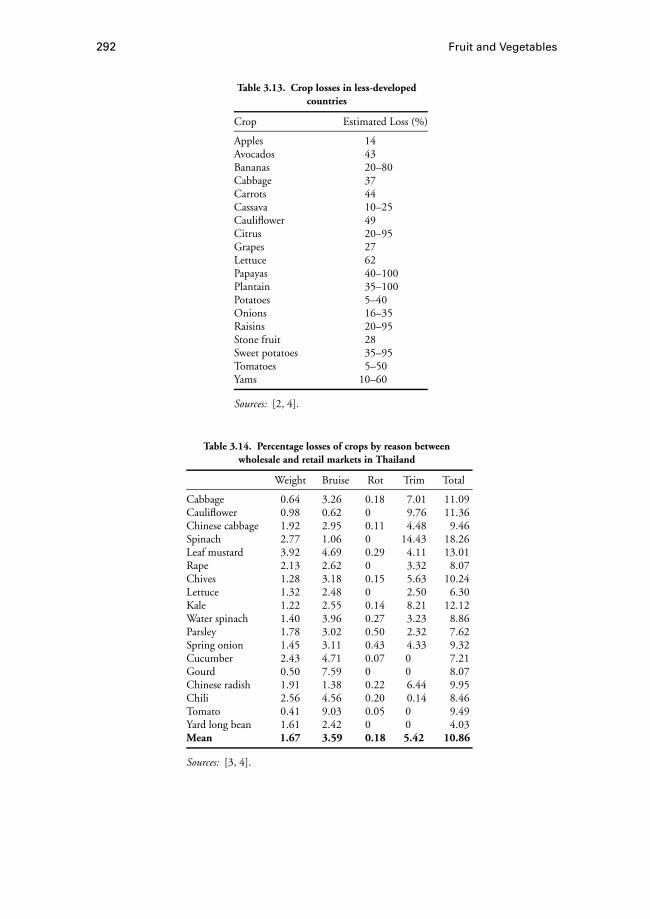
292 Fruit and Vegetables
Table 3.13. Crop losses in less-developedcountries
Crop Estimated Loss (%)
Apples 14Avocados 43Bananas 20–80Cabbage 37Carrots 44Cassava 10–25Cauliflower 49Citrus 20–95Grapes 27Lettuce 62Papayas 40–100Plantain 35–100Potatoes 5–40Onions 16–35Raisins 20–95Stone fruit 28Sweet potatoes 35–95Tomatoes 5–50Yams 10–60
Sources: [2, 4].
Table 3.14. Percentage losses of crops by reason betweenwholesale and retail markets in Thailand
Weight Bruise Rot Trim Total
Cabbage 0.64 3.26 0.18 7.01 11.09Cauliflower 0.98 0.62 0 9.76 11.36Chinese cabbage 1.92 2.95 0.11 4.48 9.46Spinach 2.77 1.06 0 14.43 18.26Leaf mustard 3.92 4.69 0.29 4.11 13.01Rape 2.13 2.62 0 3.32 8.07Chives 1.28 3.18 0.15 5.63 10.24Lettuce 1.32 2.48 0 2.50 6.30Kale 1.22 2.55 0.14 8.21 12.12Water spinach 1.40 3.96 0.27 3.23 8.86Parsley 1.78 3.02 0.50 2.32 7.62Spring onion 1.45 3.11 0.43 4.33 9.32Cucumber 2.43 4.71 0.07 0 7.21Gourd 0.50 7.59 0 0 8.07Chinese radish 1.91 1.38 0.22 6.44 9.95Chili 2.56 4.56 0.20 0.14 8.46Tomato 0.41 9.03 0.05 0 9.49Yard long bean 1.61 2.42 0 0 4.03Mean 1.67 3.59 0.18 5.42 10.86
Sources: [3, 4].

Handling Systems and Packaging 293
Table 3.15. Example of postharvest operations for fresh fruitand vegetables
Postharvest Operations Example: Operational Steps forand Procedures Apples
Harvest 1. HarvestField packaging 2. Transfer to field bin
(or field sorting)Transport out of field 3. Transport to packing shedPacking shed operations 4. Reception
5. Drenching6. Precooling7. Unloading from field bin8. Washing and drying9. Waxing
10. Presorting (color, size range)11. Sorting12. Singulating13. Grading to size14. Packing15. Labeling16. Final shed quality control17. Palletization
Storage 18. Cooling19. Cool storage
Shipment to market 20. Loading and transportationRetailing 21. Retailing operations
picking apron or bucket, which holds not more than 15 kg of fruit. Mangoes, papaya,apples, and fruit grown in tall trees can be harvested using picking poles: Fruit is separatedfrom the tree by a sharp cutting edge on the end of the pole and falls into a net just under thecutter [4, 5]. In some countries fruit is harvested by hand, placed onto straw on the groundunder the trees, hand-sorted, and packed into containers before leaving the orchard. Underthese conditions consistent quality control is difficult to achieve among orchards, but fruitmay sustain less handling damage. Fruit cleanliness also may be a problem.
Mechanical harvesters have been developed for many crops including apples, straw-berries, blackcurrents, blueberries, cherries, and raspberries. Harvesting involves shakingthe tree or cane by mechanical vibration and catching the detached fruit underneath ina large blanket or net [4]. However, these systems can cause significant damage to thecrop and are generally only suitable for fruit to be used for processing. There are alsodifficulties if the fruit on the tree do not all ripen at the same time.
Some fresh vegetables are harvested by mechanical means. These include peas, beans,tomatoes, brussel sprouts, and root crops, particularly if the product is for processing.Details of such operations are provided elsewhere (e.g., by Thompson [4]). However,the risk of damage is great, and many fresh vegetables are harvested by hand cutting. Insome cases (e.g., pumpkin, squash, cabbage, lettuce), after hand or machine cutting, thevegetables are placed onto a conveyor system that removes them from the field or to amobile grading or packaging machine (Fig. 3.11).

294 Fruit and Vegetables
Figure 3.11. Self-propelled field pack system. (Source: Highlander Ramsay Welding MachinePromotional Brochure, 1993.)
Figure 3.12. Field Bin. One bin is partially submerged in a water dumpusing a fork lift truck. Fully automated systems also are used.
Transfer to Field BinCrops such as apples are collected into larger containers (field bins, Fig. 3.12), which
are transported out of the orchard. The transfer into the field bin is a serious potentialcause of damage, unless pickers are well trained. Fruit-on-fruit impact and impactsagainst the sides and base of the bin are potential sources of severe bruising.

Handling Systems and Packaging 295
Transport to Packing ShedThis journey also is potentially damaging to fruit. In most cases, the fruit as yet have
no packaging to protect them, and they must be transported over rough farm tracksand other roads to the grading shed or market, which may be several kilometers away.Training and good management of drivers is essential to keep transport speeds to levelsthat are safe for the product.
ReceptionIt is vital to have documentation about a crop arriving at a grading shed. The doc-
umentation should record details of who the product is from, the harvest date, and thedelivery date to the shed, as well as full details about the crop and pesticides used dur-ing its growth. This allows the grower to receive appropriate credit for the product andensures that quality guidelines have been adhered to prior to arrival of the product at theshed. Spray certificates and other documentation also may be required. Reliable docu-mentation requires careful inventory control, including clear procedures for recordingall shipments and marking the field bins.
PrecoolingIf the product cannot be dealt with immediately when it arrives at the packing shed,
it is essential to minimize the deterioration of product. For most crops this involvesreducing the temperature. Sensible procedures include• Harvesting early in the day (fruit will be coolest before sunrise, but fruit may damage
more easily)• Keeping fruit in shade (pole-frame structures with shade cloth coverings are a low-
cost option)• Dumping into cold water• Placing fruit straight into precooler if fruit cannot be processed immediately
Highly perishable leafy vegetable crops can be cooled rapidly in the field using mobilevacuum coolers (see Section 3.4).
DrenchingSome varieties require fungicide or other preventative drenching to reduce physio-
logical disorders or infestations. Calcium drenches are common for many crops. Thiscan be done using an overhead spray system that washes through the field bin, or dippingthe bin in a bath, which may be outside the grading shed.
Unloading from Field Bin or TrailerThis operation needs to be achieved with the minimum of damage. For apples, sub-
merging the field bin in water results in little damage. Apples can be floated out andinto channels using water (see Fig. 3.12). This procedure works well for fruit with adensity less than that of water. Pears also can be removed in the same way, providing asuitable chemical is added to the water to increase its density. If water cannot be used,then options include tipping the bin over slowly or using side openings on the bin. Somesystems have been developed using a false bottom, which is raised up inside the bin, sothat fruit are removed from the top. Alternatively, bin inverters are used (e.g., Fig. 3.13).
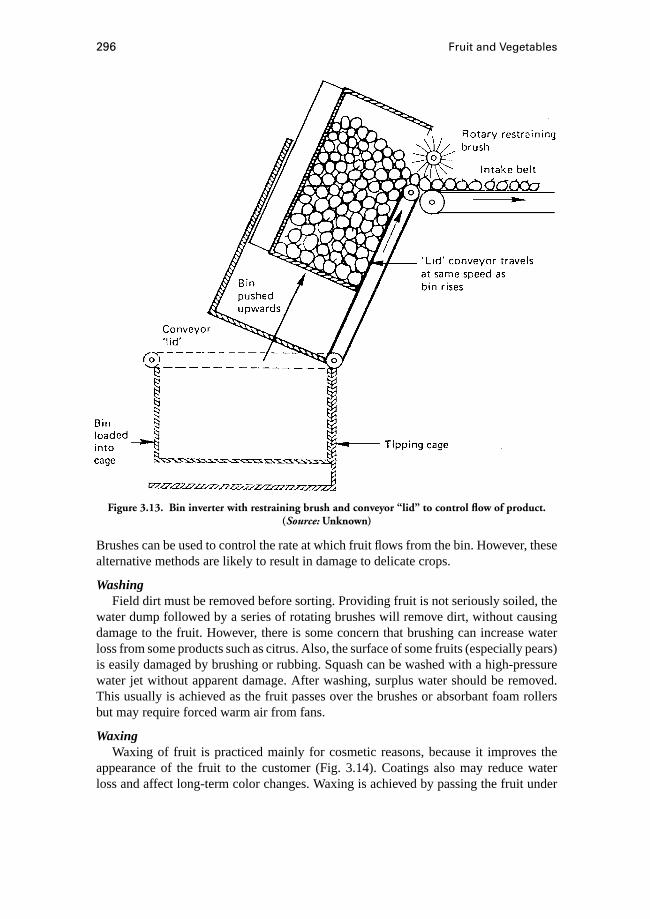
296 Fruit and Vegetables
Figure 3.13. Bin inverter with restraining brush and conveyor “lid” to control flow of product.(Source: Unknown)
Brushes can be used to control the rate at which fruit flows from the bin. However, thesealternative methods are likely to result in damage to delicate crops.
WashingField dirt must be removed before sorting. Providing fruit is not seriously soiled, the
water dump followed by a series of rotating brushes will remove dirt, without causingdamage to the fruit. However, there is some concern that brushing can increase waterloss from some products such as citrus. Also, the surface of some fruits (especially pears)is easily damaged by brushing or rubbing. Squash can be washed with a high-pressurewater jet without apparent damage. After washing, surplus water should be removed.This usually is achieved as the fruit passes over the brushes or absorbant foam rollersbut may require forced warm air from fans.
WaxingWaxing of fruit is practiced mainly for cosmetic reasons, because it improves the
appearance of the fruit to the customer (Fig. 3.14). Coatings also may reduce waterloss and affect long-term color changes. Waxing is achieved by passing the fruit under
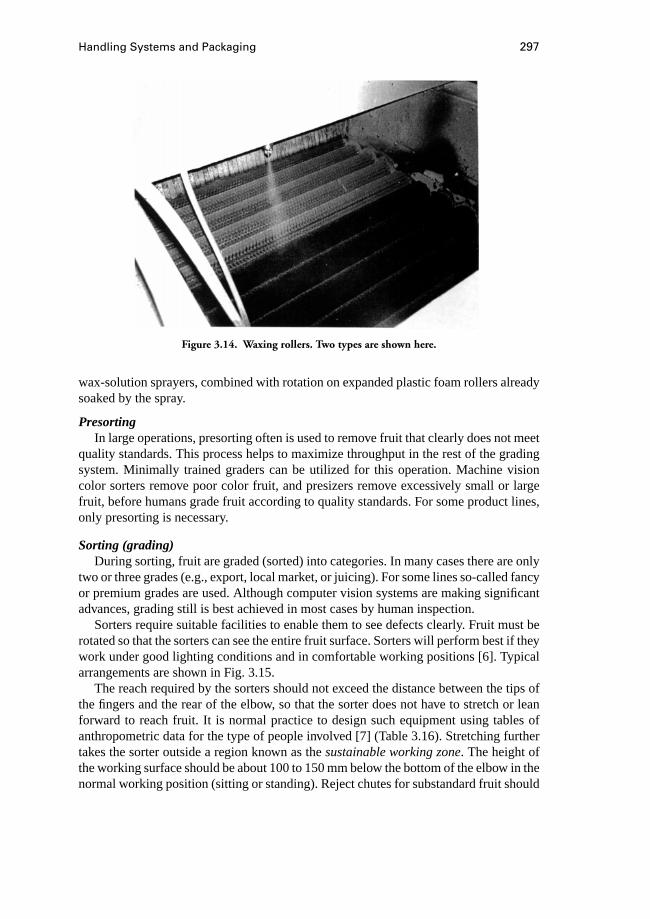
Handling Systems and Packaging 297
Figure 3.14. Waxing rollers. Two types are shown here.
wax-solution sprayers, combined with rotation on expanded plastic foam rollers alreadysoaked by the spray.
PresortingIn large operations, presorting often is used to remove fruit that clearly does not meet
quality standards. This process helps to maximize throughput in the rest of the gradingsystem. Minimally trained graders can be utilized for this operation. Machine visioncolor sorters remove poor color fruit, and presizers remove excessively small or largefruit, before humans grade fruit according to quality standards. For some product lines,only presorting is necessary.
Sorting (grading)During sorting, fruit are graded (sorted) into categories. In many cases there are only
two or three grades (e.g., export, local market, or juicing). For some lines so-called fancyor premium grades are used. Although computer vision systems are making significantadvances, grading still is best achieved in most cases by human inspection.
Sorters require suitable facilities to enable them to see defects clearly. Fruit must berotated so that the sorters can see the entire fruit surface. Sorters will perform best if theywork under good lighting conditions and in comfortable working positions [6]. Typicalarrangements are shown in Fig. 3.15.
The reach required by the sorters should not exceed the distance between the tips ofthe fingers and the rear of the elbow, so that the sorter does not have to stretch or leanforward to reach fruit. It is normal practice to design such equipment using tables ofanthropometric data for the type of people involved [7] (Table 3.16). Stretching furthertakes the sorter outside a region known as thesustainable working zone. The height ofthe working surface should be about 100 to 150 mm below the bottom of the elbow in thenormal working position (sitting or standing). Reject chutes for substandard fruit should
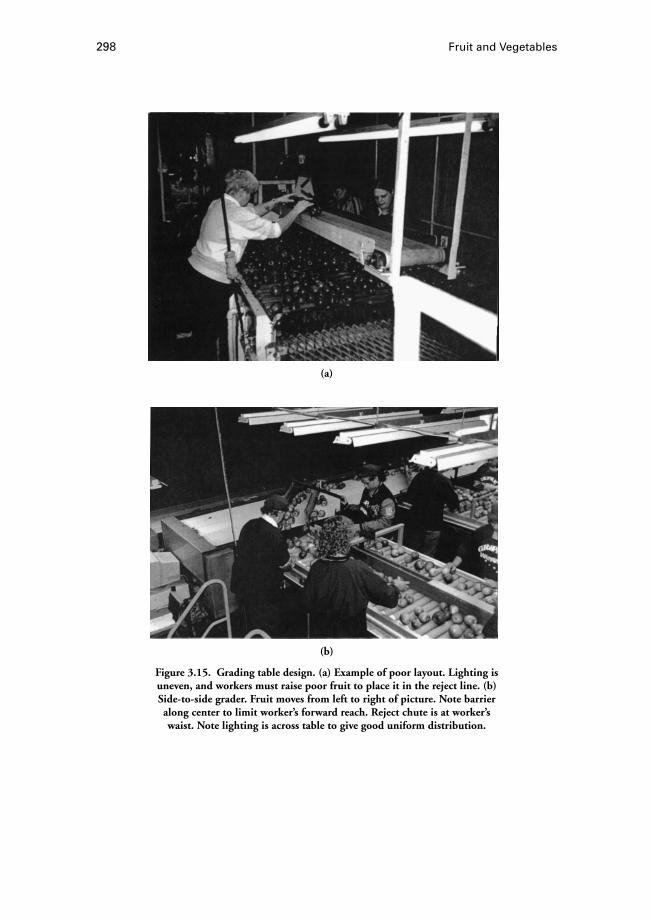
298 Fruit and Vegetables
(a)
(b)
Figure 3.15. Grading table design. (a) Example of poor layout. Lighting isuneven, and workers must raise poor fruit to place it in the reject line. (b)Side-to-side grader. Fruit moves from left to right of picture. Note barrieralong center to limit worker’s forward reach. Reject chute is at worker’swaist. Note lighting is across table to give good uniform distribution.
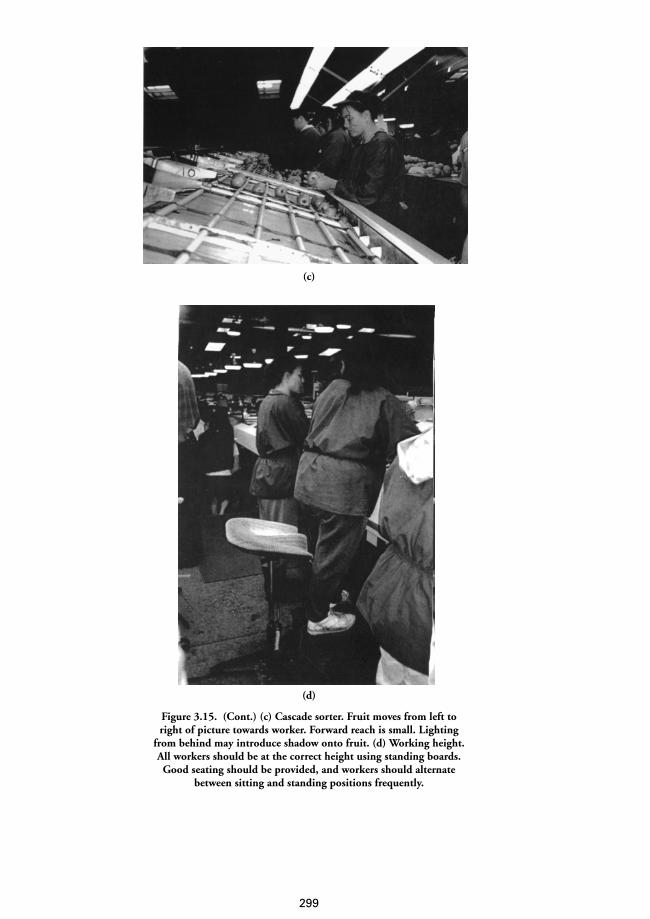
(c)
(d)
Figure 3.15. (Cont.) (c) Cascade sorter. Fruit moves from left toright of picture towards worker. Forward reach is small. Lighting
from behind may introduce shadow onto fruit. (d) Working height.All workers should be at the correct height using standing boards.Good seating should be provided, and workers should alternate
between sitting and standing positions frequently.
299
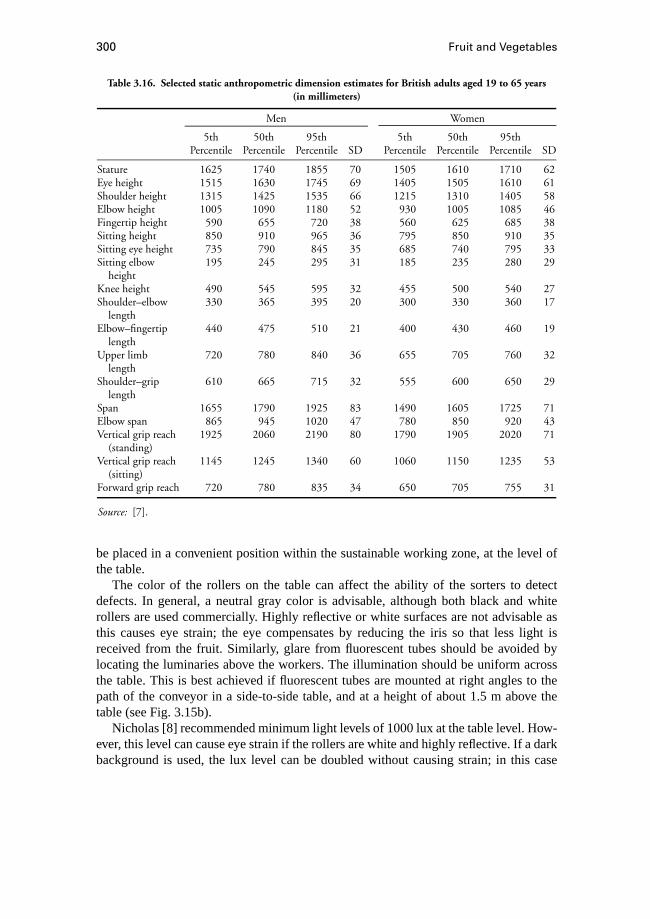
300 Fruit and Vegetables
Table 3.16. Selected static anthropometric dimension estimates for British adults aged 19 to 65 years(in millimeters)
Men Women
5th 50th 95th 5th 50th 95thPercentile Percentile Percentile SD Percentile Percentile Percentile SD
Stature 1625 1740 1855 70 1505 1610 1710 62Eye height 1515 1630 1745 69 1405 1505 1610 61Shoulder height 1315 1425 1535 66 1215 1310 1405 58Elbow height 1005 1090 1180 52 930 1005 1085 46Fingertip height 590 655 720 38 560 625 685 38Sitting height 850 910 965 36 795 850 910 35Sitting eye height 735 790 845 35 685 740 795 33Sitting elbow 195 245 295 31 185 235 280 29
heightKnee height 490 545 595 32 455 500 540 27Shoulder–elbow 330 365 395 20 300 330 360 17
lengthElbow–fingertip 440 475 510 21 400 430 460 19
lengthUpper limb 720 780 840 36 655 705 760 32
lengthShoulder–grip 610 665 715 32 555 600 650 29
lengthSpan 1655 1790 1925 83 1490 1605 1725 71Elbow span 865 945 1020 47 780 850 920 43Vertical grip reach 1925 2060 2190 80 1790 1905 2020 71
(standing)Vertical grip reach 1145 1245 1340 60 1060 1150 1235 53
(sitting)Forward grip reach 720 780 835 34 650 705 755 31
Source: [7].
be placed in a convenient position within the sustainable working zone, at the level ofthe table.
The color of the rollers on the table can affect the ability of the sorters to detectdefects. In general, a neutral gray color is advisable, although both black and whiterollers are used commercially. Highly reflective or white surfaces are not advisable asthis causes eye strain; the eye compensates by reducing the iris so that less light isreceived from the fruit. Similarly, glare from fluorescent tubes should be avoided bylocating the luminaries above the workers. The illumination should be uniform acrossthe table. This is best achieved if fluorescent tubes are mounted at right angles to thepath of the conveyor in a side-to-side table, and at a height of about 1.5 m above thetable (see Fig. 3.15b).
Nicholas [8] recommended minimum light levels of 1000 lux at the table level. How-ever, this level can cause eye strain if the rollers are white and highly reflective. If a darkbackground is used, the lux level can be doubled without causing strain; in this case
Handling Systems and Packaging 301
more light is received by the eye from the fruit, so that defect detection should be easier[9]. If graders are sorting for color, the fluorescent tubes used should not cause changesto the appearance. In comparison with sunlight, normal “cool white” tubes have a bluebias, which makes products appear too green to the grader [10].
The “Cascade” sorter design also is used for fruit (see Fig. 3.15c). This has theadvantage that fruit is presented directly in front of the sorter. Only one person is ableto inspect a particular fruit (whereas in the side-to-side design two or three sorterscan inspect each fruit). This increases the responsibility of the sorter but also enablesmanagement to identify sorters who are consistently making errors, so that feedback andspecific corrective training can be given.
SingulatingIf fruit are to be sorted according to weight, the singulator separates fruit into pockets
or cups so that each fruit can be weighed independently. The fruit can then be separatedinto appropriate sizes by sorting according to the weight recorded for the cup. Variousdevices including transfer wheels and expanding belts can be used for singulation.
Sorting into Size BandsCustomer preference internationally is for products that are sorted into sizes, either by
weight or by dimension, according to the shape and regularity of the product. Conformityof size is particularly desirable for packaging and display purposes. Some fruits andvegetable cultivars have a consistent shape, so that they can be conveniently weighedand sorted. The result is a product that is consistent in volume and shape and packseasily. Electronic or mechanical methods can be used for weighing; shape sorters can beclassified as mechanical or visual.
Electronic WeighingIn the electronic system all fruit are weighed at one point. Data is fed to a computer,
which selects and preprograms the drop point. Fruit may rest on several fingers (ratherthan a single cup, as in Fig. 3.16), which are programmed to release the fruit at therequired point, and the fruit rolls off sideways.
Mechanical WeighingIn a mechanical system, each fruit is “weighed” as it passes each exit point. A me-
chanical lever releases the fruit if the weight exceeds the preset trigger level at that point.Drop points therefore must be arranged along the line in increasing weight, which cancause logistical problems. Resetting the machine for different weight ranges also can bea slow process.
Mechanical systems are usually less costly and can be maintained and repaired bya trained mechanic. However, dust and wear can affect the weighing accuracy, so thatweight bands are generally large. The operator must therefore allow a greater margin forerror to avoid underweight cartons.
Comparison of Electronic and Mechanical WeighingCompared with mechanical systems, the advantages of electronic systems are that• The drop position can be selected to suit the shed design.

302 Fruit and Vegetables
Figure 3.16. Single-line side-drop system for apples. This photo also showsoverhead rubber fingers to reduce fruit velocity.
• It is simple to reprogram the system for a different size distribution of fruit (e.g.,allow two or more drop positions for one fruit size if there is more fruit in that size).
• More accurate weighing can be achieved (most involve several repeats and averag-ing), reducing weight allowances.
• Faster flow rates are possible.• Accurate count size records can be made automatically.• It is possible to reduce the overfill allowance to a minimum.• There is immediate feedback of performance data.• The computer system enables other data to be stored at the same time to monitor
performance of the whole shed operation.• Quality-control problems can be detected rapidly, and rectification of problems is
faster (hence fewer cartons may need to be repacked).• Maintenance is more straightforward (by replacement of failed components).Disadvantages are the cost, and the need for specialist computer and electronic service
personnel.In both systems fruit are dropped at an exit point by a mechanism that releases the
cup so that the fruit falls downwards or sideways onto an exit conveyor belt (Fig. 3.16).On some machines, fruit fall into paper pulp trays or cartons directly. On others they fallinto a rotating bin, from which they are packed into cartons by hand.
Sorting by SizeSome crops (e.g., tomatoes, carrots) produce inconsistent results if sorted by weight.
Better results are obtained if they are sorted according to shape, using expanding screensor tapers. Fruit moves through the sorter and passes over or rolls along a continuouslyenlarging exit orifice until it is able to fall through into the appropriate container, suchas in Fig. 3.17. In the field, crops also can be sized by eye, or by using a set of rings orplastic cards of predetermined size.
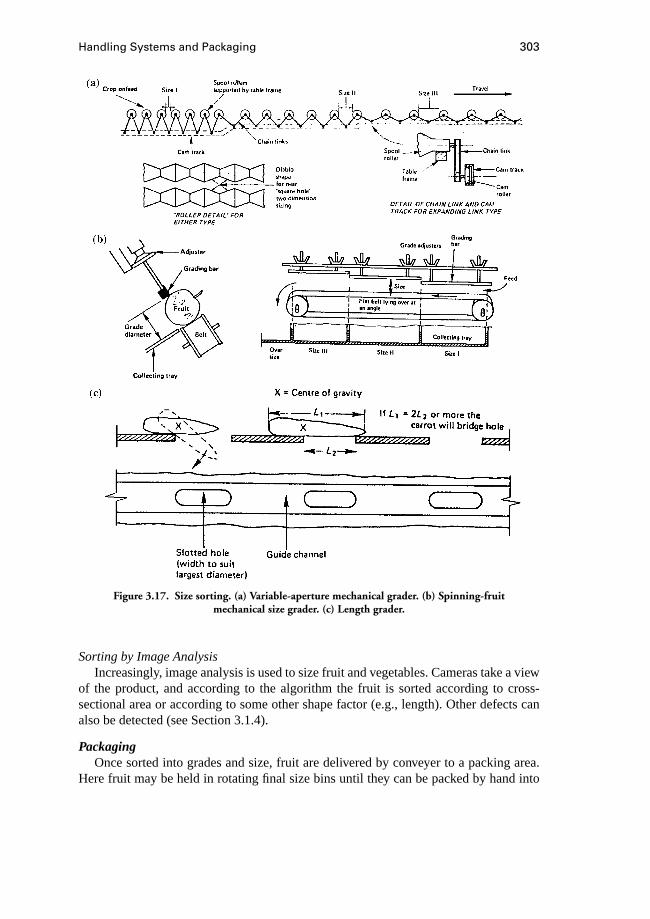
Handling Systems and Packaging 303
Figure 3.17. Size sorting. (a) Variable-aperture mechanical grader. (b) Spinning-fruitmechanical size grader. (c) Length grader.
Sorting by Image AnalysisIncreasingly, image analysis is used to size fruit and vegetables. Cameras take a view
of the product, and according to the algorithm the fruit is sorted according to cross-sectional area or according to some other shape factor (e.g., length). Other defects canalso be detected (see Section 3.1.4).
PackagingOnce sorted into grades and size, fruit are delivered by conveyer to a packing area.
Here fruit may be held in rotating final size bins until they can be packed by hand into

304 Fruit and Vegetables
Figure 3.17. (Cont.) (d) Diverging roller grader. (Source: unknown)
cartons. Alternatively, if automatic tray fillers are used, fruit fall into a paper pulp traydirectly, and a human packer checks the alignment of the fruit (e.g., the stem positionmay be upwards or to one side depending on the cultivar), and does a final brief qualitycheck for missed defects before placing the loaded tray into a carton. Fruit and vegetablesalso may be wrapped individually in foam liners or films before, or instead of, packingthem in a rigid container.
Packaging is a vital product component. It has a major influence on storage lifeand on the marketability of the product. Packaging fulfils several functions includingcontainment, facilitating transportation, protection of fruit from further damage, pro-tection of the environment from contents of package (for example, if the contents aredirty), marketing, product advertising, and stock control. These are discussed in Section3.3.4.
LabelingA key part of the postharvest process is to ensure that the product is clearly identified.
On the international market, some fresh fruits require considerable detail. This mayinclude, for example, harvest date, packing date, and name of grower and packer, aswell as details about the cultivar and grade. This information can be critical if quality-management problems arise in the retail market.
Quality ControlQuality-control checks must be carried out before the fruit leaves the packing shed.
In some industries, marketing organizations approve sheds with certificated inspectors,which reduces the need for additional checks made later in the chain (by which timecorrective action is costly and difficult).
Handling Systems and Packaging 305
Although a check should be made once the fruit has been packed, good qualitymanagement requires that the process be continuous and cover all parts of the chain. Thusproblems can be identified early and corrective action taken. Therefore an important partof a packing shed is an area set aside for quality-control inspection. This area needs to beas well lit and designed as the sorting-table area and should be in the center of activitiesso that the inspectors have close contact with the workers. However, it should also bedesigned so that the inspectors can work without disturbance from other activities.
PalletizationCartons of fruit are increasingly palletized before distribution. This is discussed in
Section 3.3.4.
CoolingAfter packing fruit should be returned to the cool store. Even previously cooled fruit
will have warmed up during sorting and will need recooling. For rapid cooling it isnecessary to place fruit into a precooler for fast cooling to store temperature, beforetransferring to the normal coolstore. Precoolers are designed to extract heat as quicklyas possible and desirable by using directed forced air flow through the load to be cooled.Cool-storage systems are discussed subsequently. Cool stores may be located at thepacking shed or at the distribution point for the region.
CoolstorageOnce at store temperature, fruit and vegetables can be transferred to a larger cool
store. Its function is to maintain rather than reduce the temperature of the product. Thisis discussed in Section 3.4.
Loading and TransportationFinally, product is loaded onto appropriate transportation by forklift truck and trans-
ported to the eventual market destination. This may be days or months after packing.Although the product usually has been packaged, it is still vulnerable to damage ifsubjected to rough rides over a considerable distance. Over long distances refrigeratedvehicles are essential.
Wholesaling and RetailingFor many crops the worst handling takes place in the last part of the chain to the final
consumer. Products are distributed to retailers through wholesale outlets that may not besuited to long-term storage or handling. Products usually are inspected superficially, andbulk loads are broken down for shipment to retail outlets. Thus a great deal of handlingis likely to occur under unfavorable conditions. Modern systems require that packagingbe designed with these factors in mind.
The final handling step is to put products on display for the consumer. At this stagethe packaging may be removed or damaged as it is opened. For example, if apples aretipped out of cartons into retail displays and then allowed to be handled by customers,the amount of bruising damage becomes extremely high. To overcome this problem,some products are being marketed in “retail trade display” cartons, which are designedto fit the space available on the retail shelving. They hold fruit only one or two layersdeep, so that it is not necessary to remove fruit from the packaging.
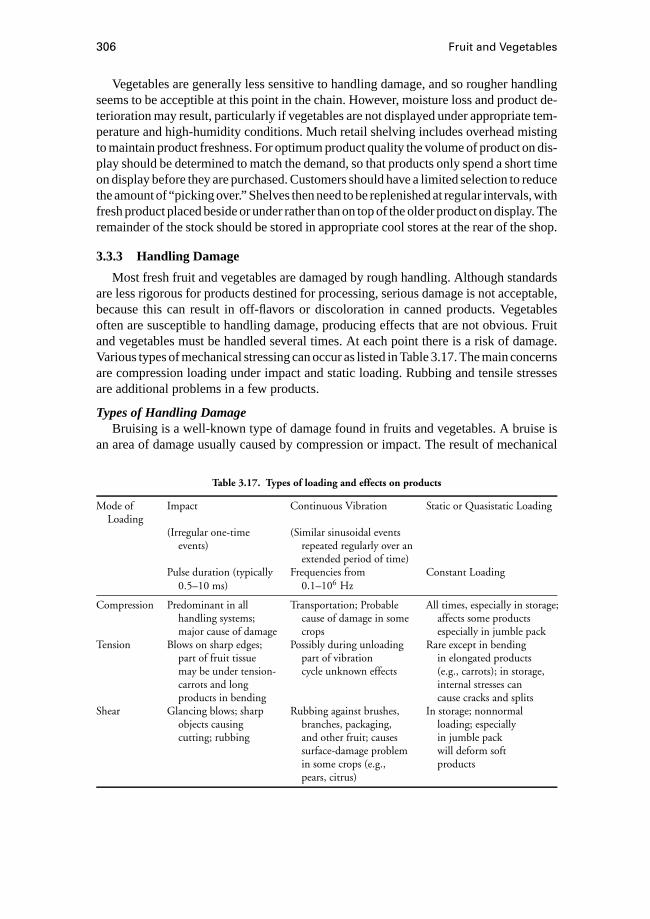
306 Fruit and Vegetables
Vegetables are generally less sensitive to handling damage, and so rougher handlingseems to be acceptible at this point in the chain. However, moisture loss and product de-terioration may result, particularly if vegetables are not displayed under appropriate tem-perature and high-humidity conditions. Much retail shelving includes overhead mistingto maintain product freshness. For optimum product quality the volume of product on dis-play should be determined to match the demand, so that products only spend a short timeon display before they are purchased. Customers should have a limited selection to reducethe amount of “picking over.” Shelves then need to be replenished at regular intervals, withfresh product placed beside or under rather than on top of the older product on display. Theremainder of the stock should be stored in appropriate cool stores at the rear of the shop.
3.3.3 Handling Damage
Most fresh fruit and vegetables are damaged by rough handling. Although standardsare less rigorous for products destined for processing, serious damage is not acceptable,because this can result in off-flavors or discoloration in canned products. Vegetablesoften are susceptible to handling damage, producing effects that are not obvious. Fruitand vegetables must be handled several times. At each point there is a risk of damage.Various types of mechanical stressing can occur as listed in Table 3.17. The main concernsare compression loading under impact and static loading. Rubbing and tensile stressesare additional problems in a few products.
Types of Handling DamageBruising is a well-known type of damage found in fruits and vegetables. A bruise is
an area of damage usually caused by compression or impact. The result of mechanical
Table 3.17. Types of loading and effects on products
Mode of Impact Continuous Vibration Static or Quasistatic LoadingLoading
(Irregular one-time (Similar sinusoidal eventsevents) repeated regularly over an
extended period of time)Pulse duration (typically Frequencies from Constant Loading
0.5–10 ms) 0.1–106 Hz
Compression Predominant in all Transportation; Probable All times, especially in storage;handling systems; cause of damage in some affects some productsmajor cause of damage crops especially in jumble pack
Tension Blows on sharp edges; Possibly during unloading Rare except in bendingpart of fruit tissue part of vibration in elongated productsmay be under tension- cycle unknown effects (e.g., carrots); in storage,carrots and long internal stresses canproducts in bending cause cracks and splits
Shear Glancing blows; sharp Rubbing against brushes, In storage; nonnormalobjects causing branches, packaging, loading; especiallycutting; rubbing and other fruit; causes in jumble pack
surface-damage problem will deform softin some crops (e.g., productspears, citrus)
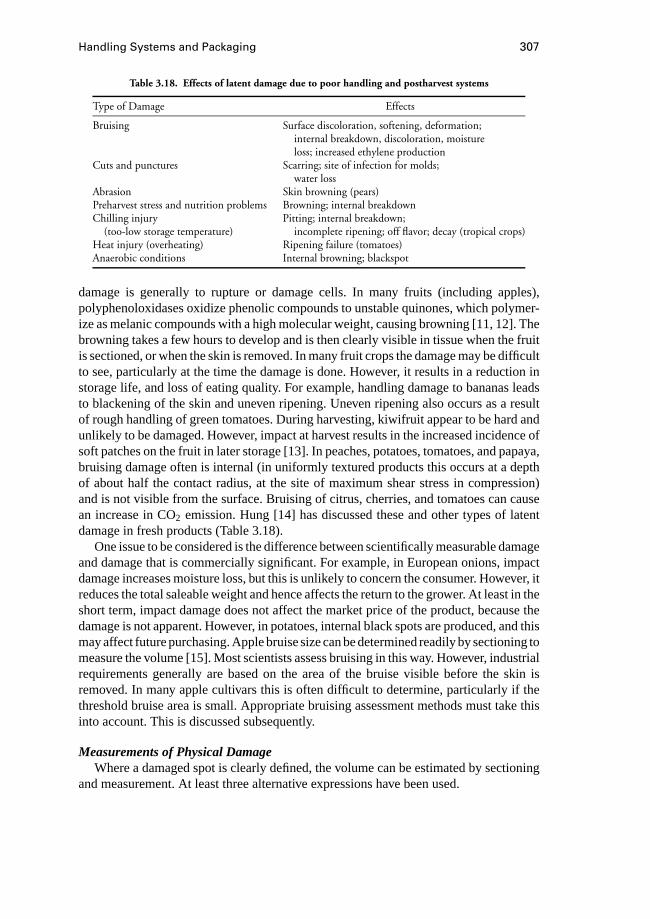
Handling Systems and Packaging 307
Table 3.18. Effects of latent damage due to poor handling and postharvest systems
Type of Damage Effects
Bruising Surface discoloration, softening, deformation;internal breakdown, discoloration, moistureloss; increased ethylene production
Cuts and punctures Scarring; site of infection for molds;water loss
Abrasion Skin browning (pears)Preharvest stress and nutrition problems Browning; internal breakdownChilling injury Pitting; internal breakdown;
(too-low storage temperature) incomplete ripening; off flavor; decay (tropical crops)Heat injury (overheating) Ripening failure (tomatoes)Anaerobic conditions Internal browning; blackspot
damage is generally to rupture or damage cells. In many fruits (including apples),polyphenoloxidases oxidize phenolic compounds to unstable quinones, which polymer-ize as melanic compounds with a high molecular weight, causing browning [11, 12]. Thebrowning takes a few hours to develop and is then clearly visible in tissue when the fruitis sectioned, or when the skin is removed. In many fruit crops the damage may be difficultto see, particularly at the time the damage is done. However, it results in a reduction instorage life, and loss of eating quality. For example, handling damage to bananas leadsto blackening of the skin and uneven ripening. Uneven ripening also occurs as a resultof rough handling of green tomatoes. During harvesting, kiwifruit appear to be hard andunlikely to be damaged. However, impact at harvest results in the increased incidence ofsoft patches on the fruit in later storage [13]. In peaches, potatoes, tomatoes, and papaya,bruising damage often is internal (in uniformly textured products this occurs at a depthof about half the contact radius, at the site of maximum shear stress in compression)and is not visible from the surface. Bruising of citrus, cherries, and tomatoes can causean increase in CO2 emission. Hung [14] has discussed these and other types of latentdamage in fresh products (Table 3.18).
One issue to be considered is the difference between scientifically measurable damageand damage that is commercially significant. For example, in European onions, impactdamage increases moisture loss, but this is unlikely to concern the consumer. However, itreduces the total saleable weight and hence affects the return to the grower. At least in theshort term, impact damage does not affect the market price of the product, because thedamage is not apparent. However, in potatoes, internal black spots are produced, and thismay affect future purchasing. Apple bruise size can be determined readily by sectioning tomeasure the volume [15]. Most scientists assess bruising in this way. However, industrialrequirements generally are based on the area of the bruise visible before the skin isremoved. In many apple cultivars this is often difficult to determine, particularly if thethreshold bruise area is small. Appropriate bruising assessment methods must take thisinto account. This is discussed subsequently.
Measurements of Physical DamageWhere a damaged spot is clearly defined, the volume can be estimated by sectioning
and measurement. At least three alternative expressions have been used.
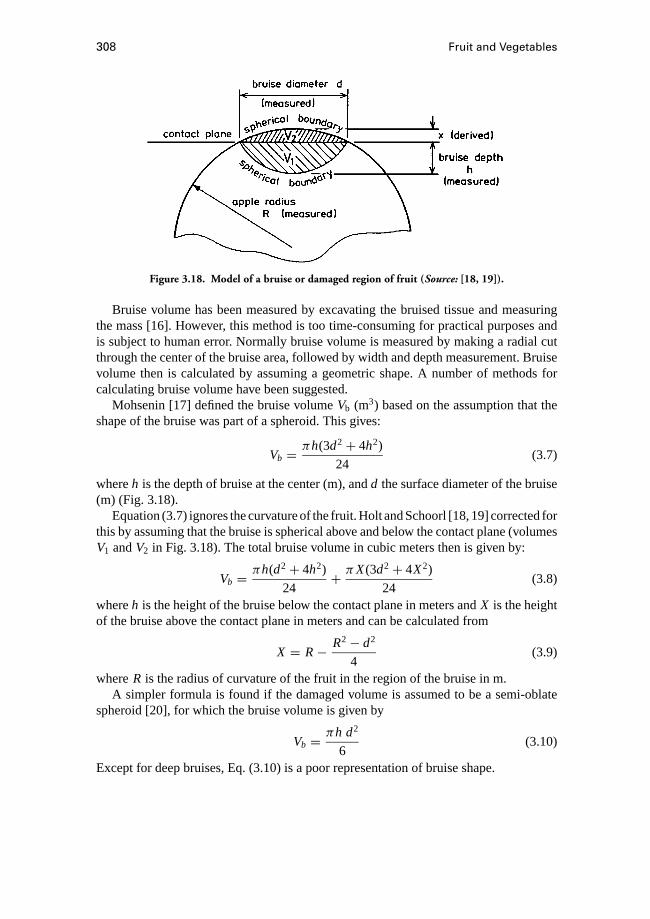
308 Fruit and Vegetables
Figure 3.18. Model of a bruise or damaged region of fruit (Source: [18, 19]).
Bruise volume has been measured by excavating the bruised tissue and measuringthe mass [16]. However, this method is too time-consuming for practical purposes andis subject to human error. Normally bruise volume is measured by making a radial cutthrough the center of the bruise area, followed by width and depth measurement. Bruisevolume then is calculated by assuming a geometric shape. A number of methods forcalculating bruise volume have been suggested.
Mohsenin [17] defined the bruise volumeVb (m3) based on the assumption that theshape of the bruise was part of a spheroid. This gives:
Vb = πh(3d2+ 4h2)
24(3.7)
whereh is the depth of bruise at the center (m), andd the surface diameter of the bruise(m) (Fig. 3.18).
Equation (3.7) ignores the curvature of the fruit. Holt and Schoorl [18, 19] corrected forthis by assuming that the bruise is spherical above and below the contact plane (volumesV1 andV2 in Fig. 3.18). The total bruise volume in cubic meters then is given by:
Vb = πh(d2+ 4h2)
24+ πX(3d2+ 4X2)
24(3.8)
whereh is the height of the bruise below the contact plane in meters andX is the heightof the bruise above the contact plane in meters and can be calculated from
X = R− R2− d2
4(3.9)
whereR is the radius of curvature of the fruit in the region of the bruise in m.A simpler formula is found if the damaged volume is assumed to be a semi-oblate
spheroid [20], for which the bruise volume is given by
Vb = πh d2
6(3.10)
Except for deep bruises, Eq. (3.10) is a poor representation of bruise shape.
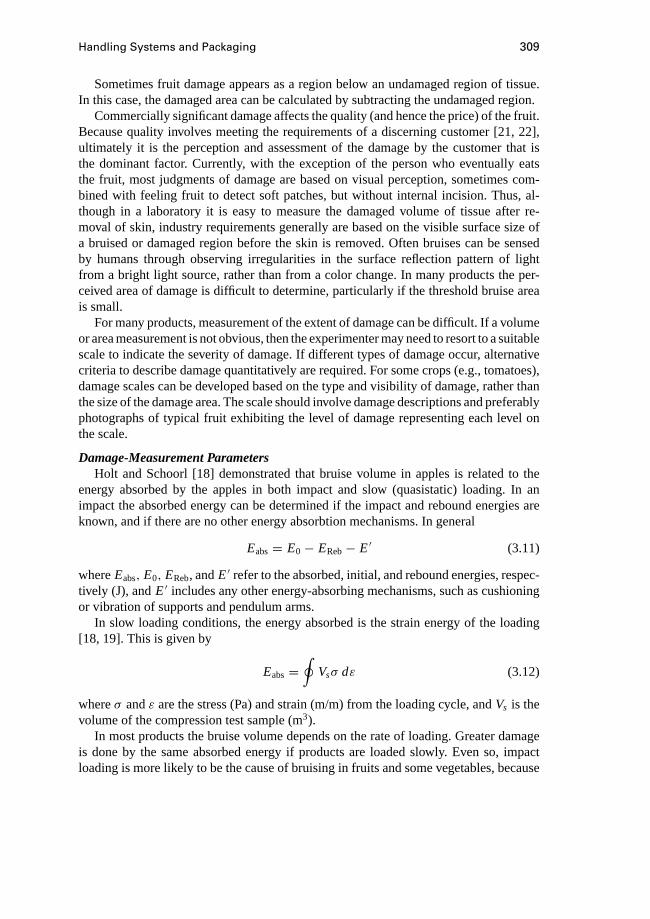
Handling Systems and Packaging 309
Sometimes fruit damage appears as a region below an undamaged region of tissue.In this case, the damaged area can be calculated by subtracting the undamaged region.
Commercially significant damage affects the quality (and hence the price) of the fruit.Because quality involves meeting the requirements of a discerning customer [21, 22],ultimately it is the perception and assessment of the damage by the customer that isthe dominant factor. Currently, with the exception of the person who eventually eatsthe fruit, most judgments of damage are based on visual perception, sometimes com-bined with feeling fruit to detect soft patches, but without internal incision. Thus, al-though in a laboratory it is easy to measure the damaged volume of tissue after re-moval of skin, industry requirements generally are based on the visible surface size ofa bruised or damaged region before the skin is removed. Often bruises can be sensedby humans through observing irregularities in the surface reflection pattern of lightfrom a bright light source, rather than from a color change. In many products the per-ceived area of damage is difficult to determine, particularly if the threshold bruise areais small.
For many products, measurement of the extent of damage can be difficult. If a volumeor area measurement is not obvious, then the experimenter may need to resort to a suitablescale to indicate the severity of damage. If different types of damage occur, alternativecriteria to describe damage quantitatively are required. For some crops (e.g., tomatoes),damage scales can be developed based on the type and visibility of damage, rather thanthe size of the damage area. The scale should involve damage descriptions and preferablyphotographs of typical fruit exhibiting the level of damage representing each level onthe scale.
Damage-Measurement ParametersHolt and Schoorl [18] demonstrated that bruise volume in apples is related to the
energy absorbed by the apples in both impact and slow (quasistatic) loading. In animpact the absorbed energy can be determined if the impact and rebound energies areknown, and if there are no other energy absorbtion mechanisms. In general
Eabs= E0− EReb− E′ (3.11)
whereEabs, E0, EReb, andE′ refer to the absorbed, initial, and rebound energies, respec-tively (J), andE′ includes any other energy-absorbing mechanisms, such as cushioningor vibration of supports and pendulum arms.
In slow loading conditions, the energy absorbed is the strain energy of the loading[18, 19]. This is given by
Eabs=∮
Vsσ dε (3.12)
whereσ andε are the stress (Pa) and strain (m/m) from the loading cycle, andVs is thevolume of the compression test sample (m3).
In most products the bruise volume depends on the rate of loading. Greater damageis done by the same absorbed energy if products are loaded slowly. Even so, impactloading is more likely to be the cause of bruising in fruits and some vegetables, because
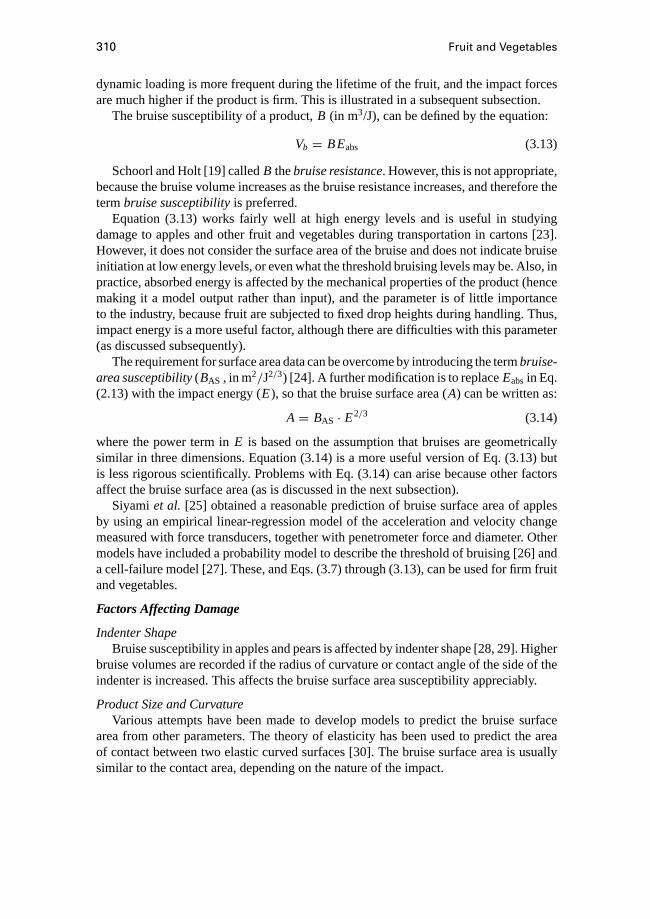
310 Fruit and Vegetables
dynamic loading is more frequent during the lifetime of the fruit, and the impact forcesare much higher if the product is firm. This is illustrated in a subsequent subsection.
The bruise susceptibility of a product,B (in m3/J), can be defined by the equation:
Vb = BEabs (3.13)
Schoorl and Holt [19] calledB thebruise resistance. However, this is not appropriate,because the bruise volume increases as the bruise resistance increases, and therefore thetermbruise susceptibilityis preferred.
Equation (3.13) works fairly well at high energy levels and is useful in studyingdamage to apples and other fruit and vegetables during transportation in cartons [23].However, it does not consider the surface area of the bruise and does not indicate bruiseinitiation at low energy levels, or even what the threshold bruising levels may be. Also, inpractice, absorbed energy is affected by the mechanical properties of the product (hencemaking it a model output rather than input), and the parameter is of little importanceto the industry, because fruit are subjected to fixed drop heights during handling. Thus,impact energy is a more useful factor, although there are difficulties with this parameter(as discussed subsequently).
The requirement for surface area data can be overcome by introducing the termbruise-area susceptibility(BAS , in m2/J2/3) [24]. A further modification is to replaceEabsin Eq.(2.13) with the impact energy (E), so that the bruise surface area (A) can be written as:
A = BAS · E2/3 (3.14)
where the power term inE is based on the assumption that bruises are geometricallysimilar in three dimensions. Equation (3.14) is a more useful version of Eq. (3.13) butis less rigorous scientifically. Problems with Eq. (3.14) can arise because other factorsaffect the bruise surface area (as is discussed in the next subsection).
Siyamiet al. [25] obtained a reasonable prediction of bruise surface area of applesby using an empirical linear-regression model of the acceleration and velocity changemeasured with force transducers, together with penetrometer force and diameter. Othermodels have included a probability model to describe the threshold of bruising [26] anda cell-failure model [27]. These, and Eqs. (3.7) through (3.13), can be used for firm fruitand vegetables.
Factors Affecting Damage
Indenter ShapeBruise susceptibility in apples and pears is affected by indenter shape [28, 29]. Higher
bruise volumes are recorded if the radius of curvature or contact angle of the side of theindenter is increased. This affects the bruise surface area susceptibility appreciably.
Product Size and CurvatureVarious attempts have been made to develop models to predict the bruise surface
area from other parameters. The theory of elasticity has been used to predict the areaof contact between two elastic curved surfaces [30]. The bruise surface area is usuallysimilar to the contact area, depending on the nature of the impact.

Handling Systems and Packaging 311
In dynamic situations, mass is a factor in the extent of bruising, because impact energyis proportional to mass. However, mass is not likely to affect bruise susceptibility, unlesslarger fruit differ in mechanical and chemical composition compared with smaller fruit.Mass effects can be confused with maturity effects, because more mature fruit andvegetables also may tend to be larger if they have been allowed more time to grow.
Bruise Color and VisibilityThe chemical reaction causing bruising depends on the level of phenolic compounds
in the tissue, and the availability of oxygen. There is some evidence to suggest that theextent of browning may depend on preharvest factors [31] as well as cultivar effects.Bruise visibility may be affected by the optical transmissivity of the skin and by skinpigmentation and it may decrease with time.
A model may be defined in terms of the commercial bruise susceptibility (BCS inm2/J2/3) [32]:
BCS= f (BP) · BAS (3.15)
whereBP is a bruise visibility factor, and
BAS = f (cell wall strength)· f (turgor pressure)· f (fruit geometry) (3.16)
Weight Loss in StorageMoisture loss in storage reduces the bruise threshold of apples [33, 34]. This suggests
that controlled water loss may help to reduce handling damage in fresh fruit.
Threshold of BruisingStudies of apples often involve high-impact energies above 0.1 J, so that bruises are
clearly visible. However, the threshold of visible damage, rather than the onset and extentof subsurface damage, is important to the industry. Probability models have been usedto define the onset of bruising in apples [34]. Another approach is to drop fruit from ageometric progression of heights using a pendulum system. After each impact fruit areinspected and rated according to the appearance of bruises. Experiments have shown thatthis approach gives results that can be related to bruising levels found commercially [24].
For other fruits and vegetables similar results are likely. It is therefore important thatproduct testing conditions are designed to measure factors that are important for theparticular product. For example, a rotating drum system has been developed to representgrader loading [35].
There are many factors that can alter the amount of impact damage to products.These are listed in Table 3.19. Important information for fruit and vegetables shouldinclude guidance on effects of temperature, maturity at harvest, and storage time ondamage levels. These are discussed further subsequently. Seasonal and cultivar effectsalso should be understood. The effects of preharvest and postharvest factors on bruisingin apples are listed in Table 3.20. Bruise susceptibilities for various apple cultivars aregiven in Table 3.21.
It is helpful to use a scientific approach to the study of damage, by considering themechanical theory of damage.
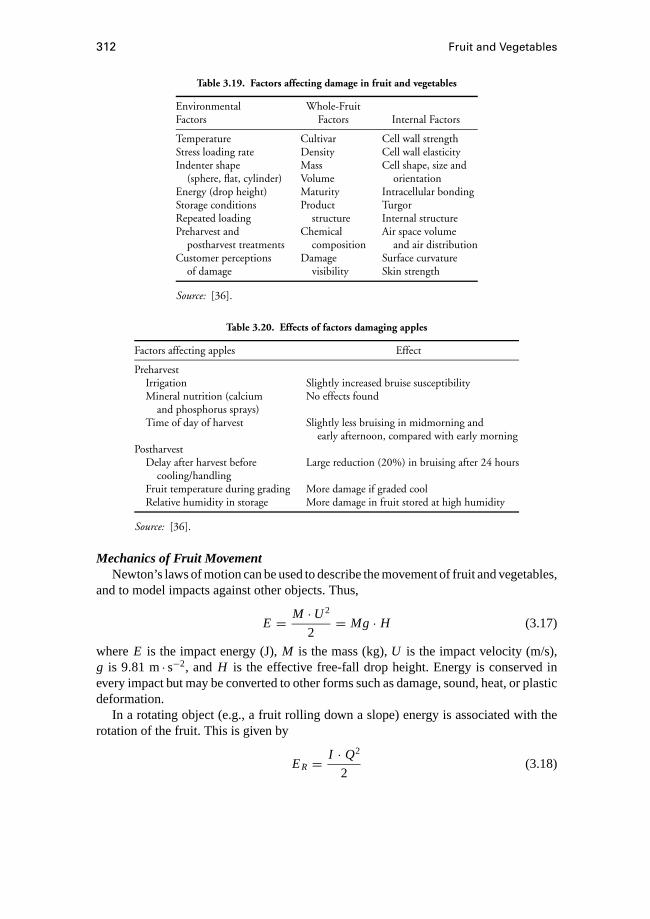
312 Fruit and Vegetables
Table 3.19. Factors affecting damage in fruit and vegetables
Environmental Whole-FruitFactors Factors Internal Factors
Temperature Cultivar Cell wall strengthStress loading rate Density Cell wall elasticityIndenter shape Mass Cell shape, size and
(sphere, flat, cylinder) Volume orientationEnergy (drop height) Maturity Intracellular bondingStorage conditions Product TurgorRepeated loading structure Internal structurePreharvest and Chemical Air space volume
postharvest treatments composition and air distributionCustomer perceptions Damage Surface curvature
of damage visibility Skin strength
Source: [36].
Table 3.20. Effects of factors damaging apples
Factors affecting apples Effect
PreharvestIrrigation Slightly increased bruise susceptibilityMineral nutrition (calcium No effects found
and phosphorus sprays)Time of day of harvest Slightly less bruising in midmorning and
early afternoon, compared with early morningPostharvest
Delay after harvest before Large reduction (20%) in bruising after 24 hourscooling/handling
Fruit temperature during grading More damage if graded coolRelative humidity in storage More damage in fruit stored at high humidity
Source: [36].
Mechanics of Fruit MovementNewton’s laws of motion can be used to describe the movement of fruit and vegetables,
and to model impacts against other objects. Thus,
E = M ·U2
2= Mg · H (3.17)
whereE is the impact energy (J),M is the mass (kg),U is the impact velocity (m/s),g is 9.81 m· s−2, and H is the effective free-fall drop height. Energy is conserved inevery impact but may be converted to other forms such as damage, sound, heat, or plasticdeformation.
In a rotating object (e.g., a fruit rolling down a slope) energy is associated with therotation of the fruit. This is given by
ER = I · Q2
2(3.18)

Handling Systems and Packaging 313
Table 3.21. Reported range of bruise susceptibilities ofapples cultivars
BruiseTest Energy Susceptibility
Cultivar (J) (mL/J)
SplendourFresh 0.31 2.9Stored, low humidity 0.31 2.2Stored, high humidity 0.31 3.3
Splendoura 0.1–0.6 3.0Braeburn
Fresh 0.31 1.7Stored, low humidity 0.31 1.6Stored, high humidity 0.31 2.0
Granny SmithFresh 0.31 2.5Stored, high humidity 0.31 2.9
Granny Smitha 0.78 7.6–9.2b
Golden Deliciousa 0.009–0.49 0.9–9.8Golden Deliciousa 0.47 4.3–6.6Golden Delicious (late)a 0.047–0.42 2.6Bramley’s Seedlinga 0.19 3.0–4.1McIntosha 0.009–0.49 1.5–10.8
Sources: [34] except as marked.a Data from various studies reported by Lincoln Technol-
ogy (New Zealand).b Based on absorbed energy; others based on total energy.
whereER is rotational energy (J),Q is angular rotation in radians per second, andI isthe moment of inertia (kg·m2), which for a spherical object of radiusr (m) is given by
I = 7 · M · r 2
5(rolling) (3.19)
I = 2 · M · r 2
5(spinning about center). (3.20)
The momentumT (N · s) of an object with velocityU (m/s) is given by:
T = M ·U (3.21)
In an impact momentum is always conserved (this is a very helpful fact for predictingdynamic movement after a collision).
Quasistatic LoadingUnder slow loading conditions the behavior of most fruit and vegetables is nonelastic.
Energy absorbed during a loading cycle can be determined from the area enclosed bythe stress–strain curve and is given by Eq. (3.12). This represents the hysteresis in theloading and unloading cycle. In many fruits the absorbed energy is related to the level
314 Fruit and Vegetables
of damage to the tissue, unless other mechanisms are acting that do not cause damage[21]. These could include permanent deformation without cell damage. Providing therelationship between stress (σ ) and strain (ε) is known, this can be calculated. However,the relationship is complex. A number of models have been used to describe it, includingthe Maxwell and Kelvin models and their derivatives [17].
Analysis of Compression LoadingA starting point for estimation of fruit damage during handling is Hertz’s general
theory of the elastic contact of two curved surfaces [30]. The radius of the contact areabetween two spheres is given by:
a = 3
√3 · π · F · R · k
4(3.22)
where
k = 1− ν21
π · Y1+ 1− ν2
2
π · Y2(3.23)
and1
R= 1
R1+ 1
R2(3.24)
whereR is the relative radius of curvature of the two surfaces (m),R1 andR2 are the radiiof curvature of the two surfaces in the contact area (m),Y is the modulus of elasticity(Pa),ν is the Poisson’s ratio of the material,F is the applied force (N), and the subscripts1 and 2 refer to the two objects. Values ofY andν for fruits are given in Table 3.A4 inthe Appendix.
The analysis is valid only if the fruit behaves perfectly elastically. Fruits are generallyviscoelastic in behavior, but in an impact (at least up to the point of tissue failure), theelastic model is useful for predicting the contact area. This enables a calculation of thesize of the damaged area, because the two are closely related. In quasistatic loading,stress relaxation is likely to occur, and so the elastic model is not particularly helpful.Modified formula have been developed to allow for viscous effects [25]. If the surfacesare not spherical a small correction is needed [17], but within experimental error thisusually can be ignored. An effective radius of curvature can be found if the radii ofcurvature (R1A and R1B in meters) in two orthogonal directions are measured, and theequivalent curvature determined from
1
R1= 1
R1A+ 1
R1B(3.25)
with a similar formula forR2. For a more precise analysis see Table 3.A2 in the Appendix.
Impact LoadingImpact mechanics provides a simple explanation of fruit damage. Newton’s second
law can be written as
F = M · du
dt(3.26)
Handling Systems and Packaging 315
whereM is the mass (kg),t is time (s), andu is the velocity (m/s) of an object strikinga rigid object. Integrating gives∫
F · dt = M (U ′ −U ) (3.27)
whereU is the initial velocity andU ′ is the velocity after impact (m/s). The right-handside of Eq. (3.27) is the momentum change, and the left-hand side is the area underthe force–time curve for the impact, known as theimpulse. If a fruit strikes an object,its velocity must be changed to arrest its movement, and so the momentum change isdetermined by the geometrical constraints and the path of movement of the fruit. Theextent to which the fruit rebounds depends on the level of elasticity of the impact (i.e.,the loss of energy). A useful parameter to determine this is the coefficient of restitution,e, defined by
e= velocity of separation
velocity of approach(3.28)
where 0≤e≤1. For a perfectly elastic impacte = 1, and the kinetic energy is con-served. The value ofe depends on the two surfaces in contact, and the severity of theimpact. In apples values range from 0.9 for very gentle impacts to 0.4 or less for im-pacts in which considerable damage is done. For two different materialse is given by[17]
e12 = e11Y2+ e22Y1
Y1+ Y2(3.29)
wheree11 refers to the first material striking itself,Y is the elastic modulus (Pa), and thesubscripts refer to the first and second materials.
When two finite masses impact, the kinetic energy loss (J) is given by
1E = (1− e2)M1M2(U1−U2)2
2(M1+ M2)(3.30)
where the subscripts refer to the first and second masses (kg) [17].Oncee is fixed, the total momentum change is determined, and so is the total impulse.
However, bothF andt depend on the surfaces. The area under the curve depends on thenature of the surfaces and their curvature in the impact area, as well as the kinetic energyof the impact. In an impact the total time of the impact can be very small, soF must becorrespondingly larger. Soft surfaces that cushion the impact are effective because theyincrease the duration of contact. Figure 3.19 shows examples of idealized impulses forvarious impacts of a sphere onto a flat surface.
In Fig. 3.19a both curves are symmetrical and the impact is perfectly elastic—thatis, the sphere rebounds at the same speed with which it struck (e= 1). In Fig. 3.19b, inthe curve with 0< e< 1, there is some nonelastic behavior. The peak may be flattenedor irregular and extended. The pulse is no longer symmetrical, and the rebound speedis less than the impact speed. The peak force recorded may not coincide with the point
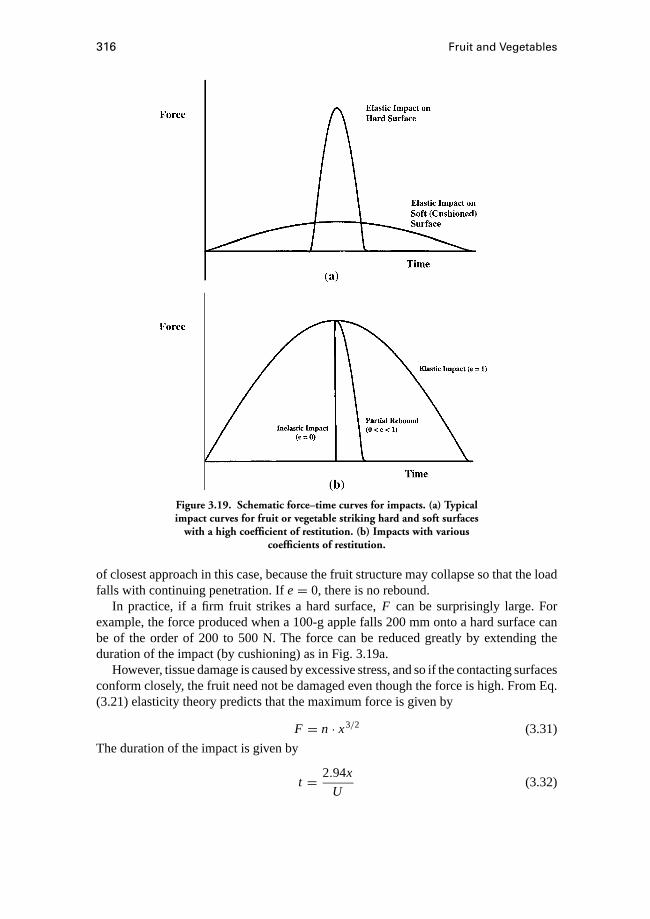
316 Fruit and Vegetables
Figure 3.19. Schematic force–time curves for impacts. (a) Typicalimpact curves for fruit or vegetable striking hard and soft surfaces
with a high coefficient of restitution. (b) Impacts with variouscoefficients of restitution.
of closest approach in this case, because the fruit structure may collapse so that the loadfalls with continuing penetration. Ife= 0, there is no rebound.
In practice, if a firm fruit strikes a hard surface,F can be surprisingly large. Forexample, the force produced when a 100-g apple falls 200 mm onto a hard surface canbe of the order of 200 to 500 N. The force can be reduced greatly by extending theduration of the impact (by cushioning) as in Fig. 3.19a.
However, tissue damage is caused by excessive stress, and so if the contacting surfacesconform closely, the fruit need not be damaged even though the force is high. From Eq.(3.21) elasticity theory predicts that the maximum force is given by
F = n · x3/2 (3.31)
The duration of the impact is given by
t = 2.94x
U(3.32)
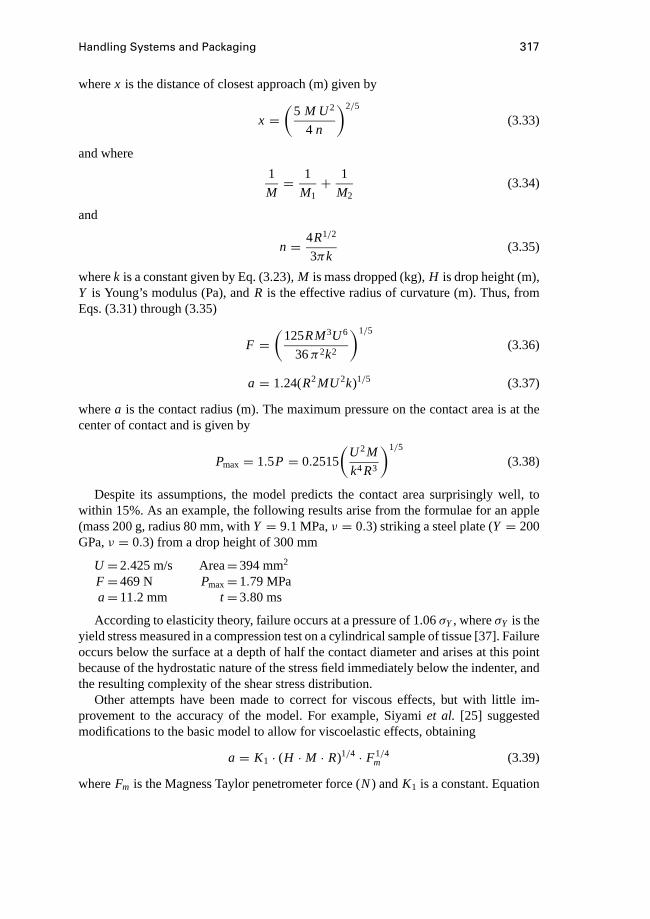
Handling Systems and Packaging 317
wherex is the distance of closest approach (m) given by
x =(
5 M U2
4 n
)2/5
(3.33)
and where
1
M= 1
M1+ 1
M2(3.34)
and
n = 4R1/2
3πk(3.35)
wherek is a constant given by Eq. (3.23),M is mass dropped (kg),H is drop height (m),Y is Young’s modulus (Pa), andR is the effective radius of curvature (m). Thus, fromEqs. (3.31) through (3.35)
F =(
125RM3U6
36π2k2
)1/5
(3.36)
a = 1.24(R2MU2k)1/5 (3.37)
wherea is the contact radius (m). The maximum pressure on the contact area is at thecenter of contact and is given by
Pmax= 1.5P = 0.2515
(U2M
k4R3
)1/5
(3.38)
Despite its assumptions, the model predicts the contact area surprisingly well, towithin 15%. As an example, the following results arise from the formulae for an apple(mass 200 g, radius 80 mm, withY = 9.1 MPa,ν = 0.3) striking a steel plate (Y = 200GPa,ν = 0.3) from a drop height of 300 mm
U =2.425 m/s Area=394 mm2
F =469 N Pmax=1.79 MPaa=11.2 mm t =3.80 ms
According to elasticity theory, failure occurs at a pressure of 1.06σY, whereσY is theyield stress measured in a compression test on a cylindrical sample of tissue [37]. Failureoccurs below the surface at a depth of half the contact diameter and arises at this pointbecause of the hydrostatic nature of the stress field immediately below the indenter, andthe resulting complexity of the shear stress distribution.
Other attempts have been made to correct for viscous effects, but with little im-provement to the accuracy of the model. For example, Siyamiet al. [25] suggestedmodifications to the basic model to allow for viscoelastic effects, obtaining
a = K1 · (H · M · R)1/4 · F1/4m (3.39)
whereFm is the Magness Taylor penetrometer force (N) andK1 is a constant. Equation
318 Fruit and Vegetables
(3.39) gives only a slightly better correlation than the elasticity model (Eq. [3.37]) forapples.
These models demonstrate that the diameter or relative radius of curvature of the fruitand the impacting surface have a significant effect on the bruise surface area, even ifthere is no effect on the bruise susceptibility (which appears to be the case in apples[38]). This has implications for the commercial assessment of bruising.
Impact EnergyMany researchers report impact energy rather than absorbed energy. This is partly
driven by pragmatism, because the design of handling-equipment systems requires thespecification of acceptible drop heights for fruit. These are determined from maximumvelocity and thus kinetic energy considerations. In addition, some experimental designsrender absorbed energy unmeasurable (e.g., where a sphere is dropped down a plastictube [35]). Unfortunately, impact energy is ambiguous in two-body impacts, because itdepends on the frame of reference of the observer, as a simple example shows: If twoapples of the same massM kg impact at a relative speed ofu m/s, the impact energy is 0.5M ·u2, but if both apples are viewed as moving towards each other with velocityu/2, theimpact energy in this reference frame is only 0.25M ·u2. In cases in which one object isregarded as being infinitely massive, the ambiguity is removed, but in cases in which thecolliding surfaces are of similar mass (especially in the case of apple-to-apple impact),the practice of determining the kinetic energy as if only one object is moving leads toinconsistencies. A more suitable reference frame in these cases is the zero-momentumreference frame defined by6(M · u) = 0. Use of this frame results in the impact energybeing a minimum. If absorbed energy is used, the inconsistency is removed, because itsvalue is independent of the reference frame.
3.3.4 Packaging
Packaging is needed for fresh fruit products throughout the postharvest chain. Theproducer must use some means to get bulk product to market, while the consumer mustbe able to carry fruit home without serious damage. Packages can be in a range of sizes.For a single person, a package weighing up to 20 kg is easy to handle. Larger packagescan be carried, with some effort, up to around 40 kg, and in some markets even packagesof 100 kg or more are carried by hand. In less developed countries more fruit is handledunpackaged on local markets (e.g., pineapple, cucumber, banana hands), but export fruitusually requires packaging.
Although some fresh products (e.g., squash, pumpkins, oranges, potatoes) are trans-ported to market in bulk, this practice inevitably causes some damage. A range of pack-aging systems are used for fresh fruit and vegetables.
Because fresh produce is alive, it is essential that the microenvironment around theproduct is suitable. Ventilation is needed to remove heat and maintain oxygen levelsas carbon dioxide is generated through respiration. Thus, ventilation holes must beprovided in cartons. If cartons are stacked on pallets, ventilation pathways should not beobstructed. This requires stacking on the pallet to allow for airflow between cartons, or

Handling Systems and Packaging 319
careful design of the positioning of the air vents so that they line up under all stackingconfigurations.
Unfortunately, products also lose water during storage. This results in a loss in productmass, and sometimes shriveling. Packaging (especially plastic films) can be used toreduce this problem. A balance is required that allows for some gas transfer but reduceswater loss to an acceptable level. The balance also may vary among cultivars.
Purposes of PackagingThere are four key purposes of packaging, as shown in the following subsections.
ContainmentThis is the basic function of packaging. The product must be contained so that it
can be transported as required. Failure to contain the product leads to loss, damage, andpollution of the environment.
ProtectionThis is especially important for perishable and easily damaged products. The product
must be protected from environmental effects, including water, undesirable moisturevapor, odors, microorganisms, dust, shock, vibration, and compression. The packagealso helps to reduce the risk of theft, willful damage, and contamination.
Apportionment and ConvenienceThe package enables the product to be divided up into convenient quantities so that
it can be transported easily and distributed in sizes that suit the retailer or consumer. Forlong-distance transportation the primary packages must be designed so that they can beunitized, that is, grouped together so they can be transported as a single item such as apallet load.
CommunicationThe package also must provide information about its contents. The package provides
the ideal place to give the information needed for good quality management, with detailsabout the crop, including variety, quantity of fruit, harvest date, origin, storage require-ments, and grower identification. It can be also used for marketing purposes (‘a packagemust protect what it sells and sell what it protects’).
Containment: Types of Packing ConfigurationFruit can be arranged into cartons in various ways (see Fig. 3.19). Factors that should
be considered include cost, need for atmospheric control or modification, need for pro-tection from compression, impact or rubbing damage, and market and shipping sizerequirements.
Individual WrappingsFruit may be individually wrapped in tissue paper. The purpose is to protect the fruit
during transportation (especially if the product is prone to rubbing damage), to provide anattractive look to the product, to control the atmosphere around the fruit (moisture, carbondioxide, and oxygen) and possibly to provide a source of fungicide to reduce postharvestdisorders, by impregnating the tissue with a suitable chemical (e.g., diphenyl for citrus).
320 Fruit and Vegetables
Jumble PackingThe most common packaging worldwide is probably the jumble pack, in which fruit
are placed inside a container at random without intervening cushioning material. Thispackage is the simplest and least costly, in terms of material requirements and packingeffort. However, it offers little protection to the product during transportation, and sodamage levels can be high.
The container may be a cardboard carton, a sack, a plastic bag, or a traditional containerwoven from local materials. The features of this style of packaging are• Simplicity• Low cost• Easy filling• Low packing density• Little protection for product from impact and compression• Unattractive appearance to consumer• Product normally measured by weight• Readily handles odd-shaped and mixed-sized products• Settling during transportationSmaller fruits, such as strawberries and cherries, are usually jumble-packed. Although
this may be acceptable for low-value products for the local market, it is not well suitedto larger-sized high-value products destined for distant markets, especially if they aresusceptible to mechanical damage.
Pattern PacksFor higher-valued produce, pattern packing systems should be considered. The prod-
uct is placed in a regular configuration and is likely to have protective packaging toseparate it from other fruit and provide the regular placement pattern. For products thathave been sized and have a regular shape, fruit tray packs provide good positioning andprotection. Each tray is shaped to contain an array of pockets, so that one fruit fits ineach pocket. The next tray is placed on top, so that the fruit is positioned in a pocketformed by the underside of the upper tray. Fruit are therefore separated from fruit in thelayer above and prevented from moving sideways to contact other fruit in the same layer.Trays can be made from paper pulp, plastic, or expanded foam (Fig. 3.20a).
There are two distinct types of tray. In the design shown in Fig. 3.20a, the productsupports the tray above. Depending on the design of the carton, the product also maysupport some of the weight of the cartons stacked on top (the pressure pack).
These packs are suitable for apples and pears. Two stacking arrangements are possible:an in-line arrangement (Fig. 3.20a), which results in each fruit being supported by onlytwo fruit; and the face-centered cubic arrangement, in which each fruit is supported byfour fruit (Fig. 3.21). The latter tray design provides cushioning through a “hammock”effect (Fig. 3.22).
Alternatively, the peg type is designed so that the product carries no load. Betweeneach fruit the tray forms a column, which supports the tray above (see Fig. 3.20b). Theproduct is free to move within the pocket. If transportation involves significant vibrationthe product may be damaged by rubbing (causing skin blemishes) or bruising.

Handling Systems and Packaging 321
(a)
(b)
Figure 3.20. Packaging. (a) Pressure-pack tray system. (b) Peg-type traysystem (from [39]).
Paper pulp trays and expanded foam trays provide a significant cushioning effect toreduce impact damage [40]. Paper pulp readily absorbs moisture and helps to removeexcess water from around the fruit. This softens the tray so that it molds more closelyaround the fruit.
Theoretical analyses, based on crystallography, give the maximum number of objectsthat can be put into a finite-sized container. Practical results depend upon the shapeand uniformity of the product. Many products are spheroidal in shape (i.e., they have acircular cross-section in at least one plane, while in the other two orthogonal planes thecross-sections may be elliptical). Peleg [39] discussed the packing properties of identical
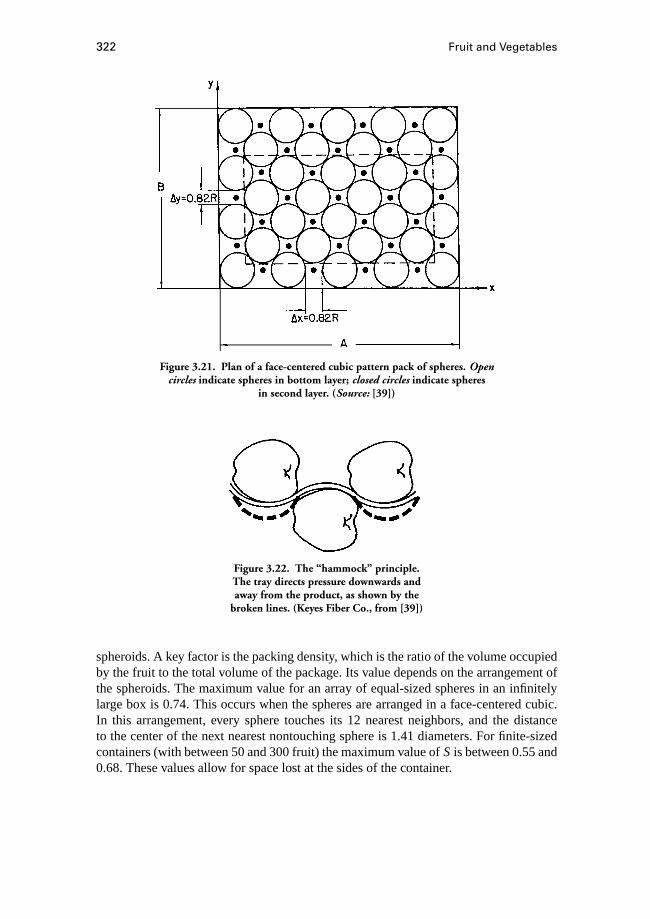
322 Fruit and Vegetables
Figure 3.21. Plan of a face-centered cubic pattern pack of spheres. Opencircles indicate spheres in bottom layer; closed circles indicate spheres
in second layer. (Source: [39])
Figure 3.22. The “hammock” principle.The tray directs pressure downwards andaway from the product, as shown by the
broken lines. (Keyes Fiber Co., from [39])
spheroids. A key factor is the packing density, which is the ratio of the volume occupiedby the fruit to the total volume of the package. Its value depends on the arrangement ofthe spheroids. The maximum value for an array of equal-sized spheres in an infinitelylarge box is 0.74. This occurs when the spheres are arranged in a face-centered cubic.In this arrangement, every sphere touches its 12 nearest neighbors, and the distanceto the center of the next nearest nontouching sphere is 1.41 diameters. For finite-sizedcontainers (with between 50 and 300 fruit) the maximum value ofS is between 0.55 and0.68. These values allow for space lost at the sides of the container.
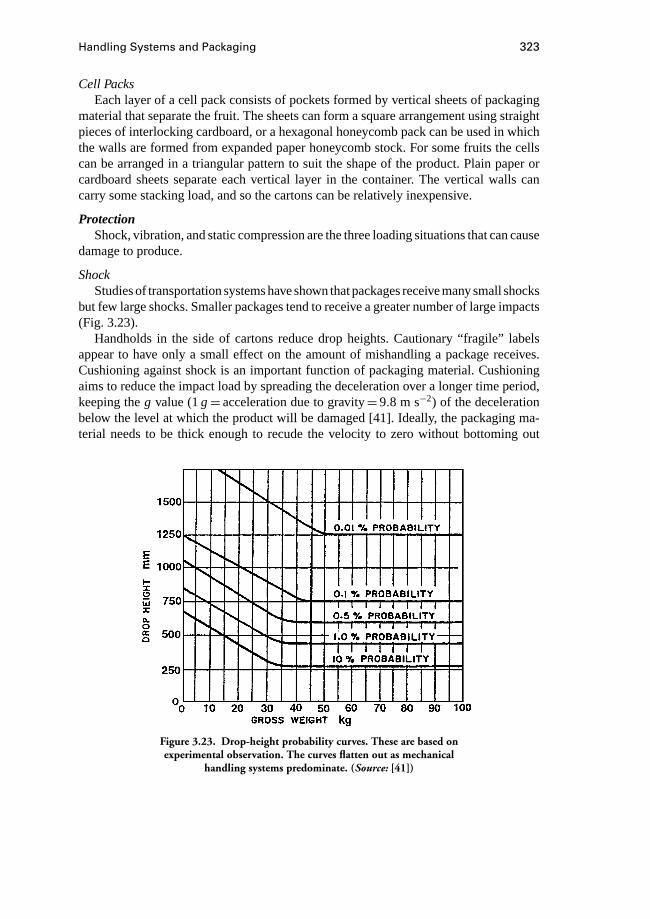
Handling Systems and Packaging 323
Cell PacksEach layer of a cell pack consists of pockets formed by vertical sheets of packaging
material that separate the fruit. The sheets can form a square arrangement using straightpieces of interlocking cardboard, or a hexagonal honeycomb pack can be used in whichthe walls are formed from expanded paper honeycomb stock. For some fruits the cellscan be arranged in a triangular pattern to suit the shape of the product. Plain paper orcardboard sheets separate each vertical layer in the container. The vertical walls cancarry some stacking load, and so the cartons can be relatively inexpensive.
ProtectionShock, vibration, and static compression are the three loading situations that can cause
damage to produce.
ShockStudies of transportation systems have shown that packages receive many small shocks
but few large shocks. Smaller packages tend to receive a greater number of large impacts(Fig. 3.23).
Handholds in the side of cartons reduce drop heights. Cautionary “fragile” labelsappear to have only a small effect on the amount of mishandling a package receives.Cushioning against shock is an important function of packaging material. Cushioningaims to reduce the impact load by spreading the deceleration over a longer time period,keeping theg value (1g=acceleration due to gravity=9.8 m s−2) of the decelerationbelow the level at which the product will be damaged [41]. Ideally, the packaging ma-terial needs to be thick enough to recude the velocity to zero without bottoming out
Figure 3.23. Drop-height probability curves. These are based onexperimental observation. The curves flatten out as mechanical
handling systems predominate. (Source: [41])
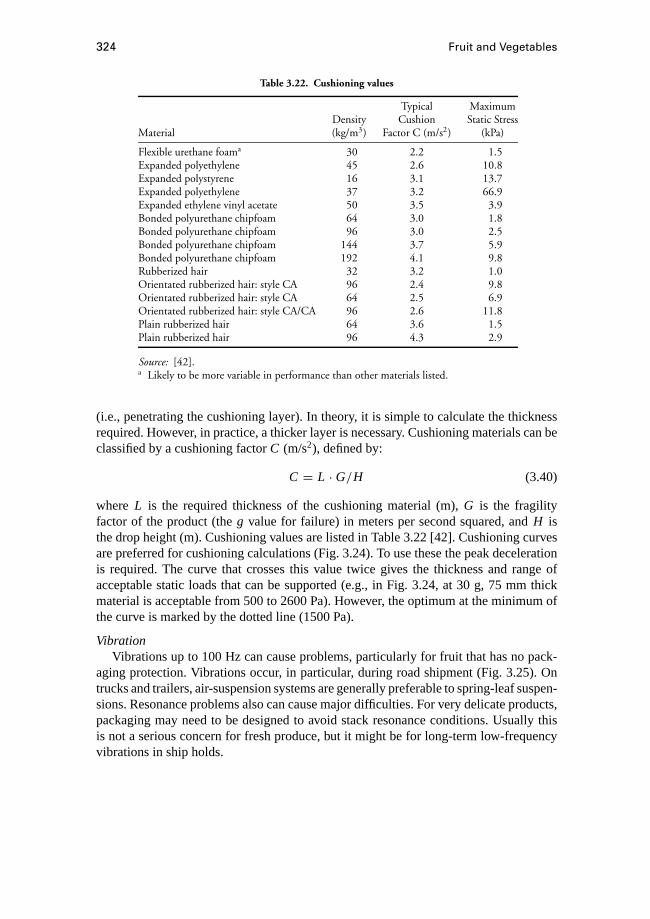
324 Fruit and Vegetables
Table 3.22. Cushioning values
Typical MaximumDensity Cushion Static Stress
Material (kg/m3) Factor C (m/s2) (kPa)
Flexible urethane foama 30 2.2 1.5Expanded polyethylene 45 2.6 10.8Expanded polystyrene 16 3.1 13.7Expanded polyethylene 37 3.2 66.9Expanded ethylene vinyl acetate 50 3.5 3.9Bonded polyurethane chipfoam 64 3.0 1.8Bonded polyurethane chipfoam 96 3.0 2.5Bonded polyurethane chipfoam 144 3.7 5.9Bonded polyurethane chipfoam 192 4.1 9.8Rubberized hair 32 3.2 1.0Orientated rubberized hair: style CA 96 2.4 9.8Orientated rubberized hair: style CA 64 2.5 6.9Orientated rubberized hair: style CA/CA 96 2.6 11.8Plain rubberized hair 64 3.6 1.5Plain rubberized hair 96 4.3 2.9
Source: [42].a Likely to be more variable in performance than other materials listed.
(i.e., penetrating the cushioning layer). In theory, it is simple to calculate the thicknessrequired. However, in practice, a thicker layer is necessary. Cushioning materials can beclassified by a cushioning factorC (m/s2), defined by:
C = L · G/H (3.40)
where L is the required thickness of the cushioning material (m),G is the fragilityfactor of the product (theg value for failure) in meters per second squared, andH isthe drop height (m). Cushioning values are listed in Table 3.22 [42]. Cushioning curvesare preferred for cushioning calculations (Fig. 3.24). To use these the peak decelerationis required. The curve that crosses this value twice gives the thickness and range ofacceptable static loads that can be supported (e.g., in Fig. 3.24, at 30 g, 75 mm thickmaterial is acceptable from 500 to 2600 Pa). However, the optimum at the minimum ofthe curve is marked by the dotted line (1500 Pa).
VibrationVibrations up to 100 Hz can cause problems, particularly for fruit that has no pack-
aging protection. Vibrations occur, in particular, during road shipment (Fig. 3.25). Ontrucks and trailers, air-suspension systems are generally preferable to spring-leaf suspen-sions. Resonance problems also can cause major difficulties. For very delicate products,packaging may need to be designed to avoid stack resonance conditions. Usually thisis not a serious concern for fresh produce, but it might be for long-term low-frequencyvibrations in ship holds.
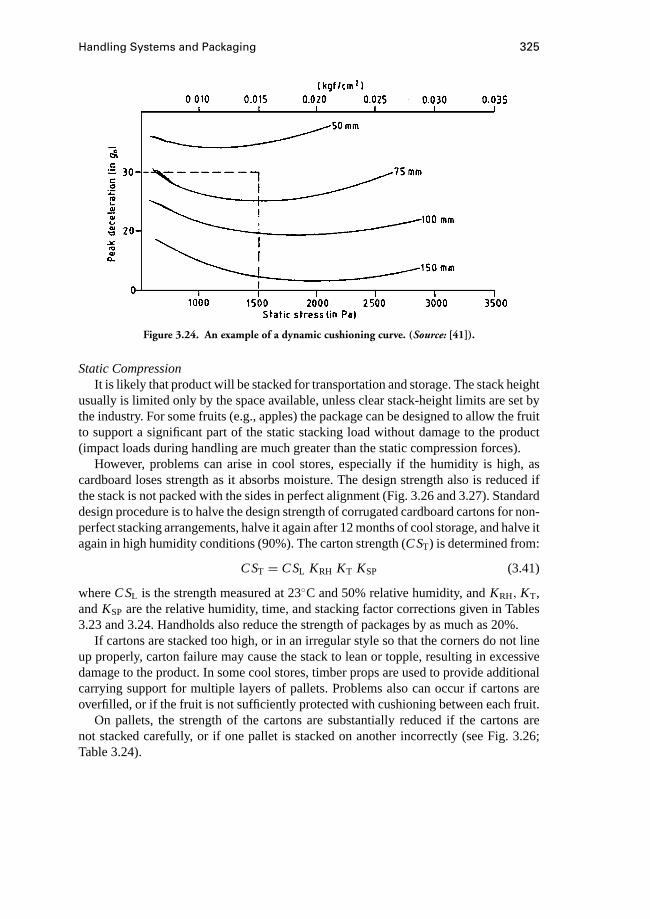
Handling Systems and Packaging 325
Figure 3.24. An example of a dynamic cushioning curve. (Source: [41]).
Static CompressionIt is likely that product will be stacked for transportation and storage. The stack height
usually is limited only by the space available, unless clear stack-height limits are set bythe industry. For some fruits (e.g., apples) the package can be designed to allow the fruitto support a significant part of the static stacking load without damage to the product(impact loads during handling are much greater than the static compression forces).
However, problems can arise in cool stores, especially if the humidity is high, ascardboard loses strength as it absorbs moisture. The design strength also is reduced ifthe stack is not packed with the sides in perfect alignment (Fig. 3.26 and 3.27). Standarddesign procedure is to halve the design strength of corrugated cardboard cartons for non-perfect stacking arrangements, halve it again after 12 months of cool storage, and halve itagain in high humidity conditions (90%). The carton strength (CST) is determined from:
CST = CSL KRH KT KSP (3.41)
whereCSL is the strength measured at 23◦C and 50% relative humidity, andKRH, KT,andKSP are the relative humidity, time, and stacking factor corrections given in Tables3.23 and 3.24. Handholds also reduce the strength of packages by as much as 20%.
If cartons are stacked too high, or in an irregular style so that the corners do not lineup properly, carton failure may cause the stack to lean or topple, resulting in excessivedamage to the product. In some cool stores, timber props are used to provide additionalcarrying support for multiple layers of pallets. Problems also can occur if cartons areoverfilled, or if the fruit is not sufficiently protected with cushioning between each fruit.
On pallets, the strength of the cartons are substantially reduced if the cartons arenot stacked carefully, or if one pallet is stacked on another incorrectly (see Fig. 3.26;Table 3.24).
326 Fruit and Vegetables
Figure 3.25. Typical sources of vehicle bed vibrations. (Source: [41])

Handling Systems and Packaging 327
Figure 3.26. Effect of overhang on compression stack strength(see Table 3.23). (Source: [41])
Figure 3.27. A typical pallet of cartons (Enzafruit). Thebottom three rows are “perfectly” stacked to give maximum
strength (see Table 3.22).
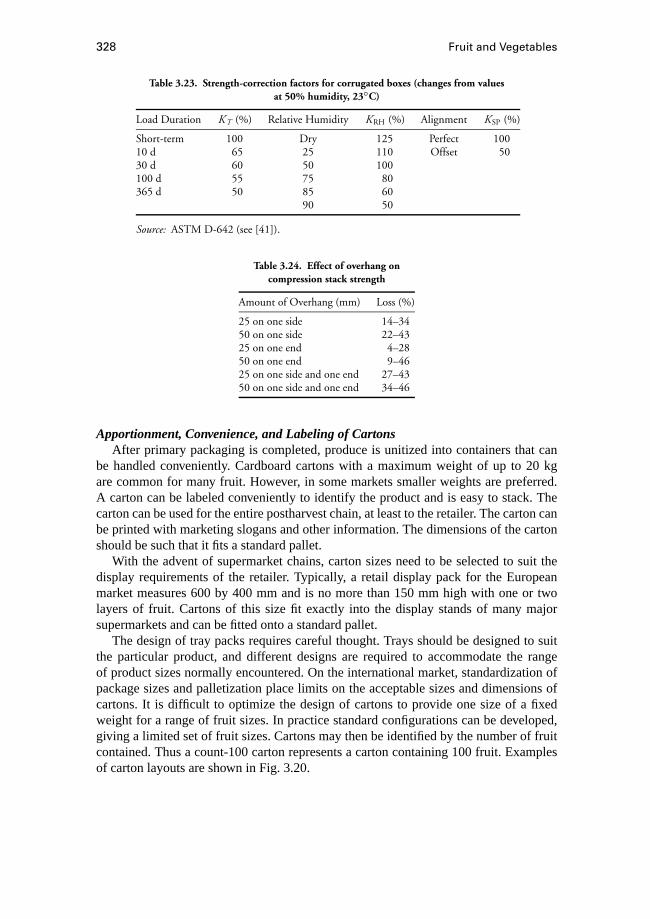
328 Fruit and Vegetables
Table 3.23. Strength-correction factors for corrugated boxes (changes from valuesat 50% humidity, 23◦C)
Load Duration K T (%) Relative Humidity KRH (%) Alignment KSP (%)
Short-term 100 Dry 125 Perfect 10010 d 65 25 110 Offset 5030 d 60 50 100100 d 55 75 80365 d 50 85 60
90 50
Source: ASTM D-642 (see [41]).
Table 3.24. Effect of overhang oncompression stack strength
Amount of Overhang (mm) Loss (%)
25 on one side 14–3450 on one side 22–4325 on one end 4–2850 on one end 9–4625 on one side and one end 27–4350 on one side and one end 34–46
Apportionment, Convenience, and Labeling of CartonsAfter primary packaging is completed, produce is unitized into containers that can
be handled conveniently. Cardboard cartons with a maximum weight of up to 20 kgare common for many fruit. However, in some markets smaller weights are preferred.A carton can be labeled conveniently to identify the product and is easy to stack. Thecarton can be used for the entire postharvest chain, at least to the retailer. The carton canbe printed with marketing slogans and other information. The dimensions of the cartonshould be such that it fits a standard pallet.
With the advent of supermarket chains, carton sizes need to be selected to suit thedisplay requirements of the retailer. Typically, a retail display pack for the Europeanmarket measures 600 by 400 mm and is no more than 150 mm high with one or twolayers of fruit. Cartons of this size fit exactly into the display stands of many majorsupermarkets and can be fitted onto a standard pallet.
The design of tray packs requires careful thought. Trays should be designed to suitthe particular product, and different designs are required to accommodate the rangeof product sizes normally encountered. On the international market, standardization ofpackage sizes and palletization place limits on the acceptable sizes and dimensions ofcartons. It is difficult to optimize the design of cartons to provide one size of a fixedweight for a range of fruit sizes. In practice standard configurations can be developed,giving a limited set of fruit sizes. Cartons may then be identified by the number of fruitcontained. Thus a count-100 carton represents a carton containing 100 fruit. Examplesof carton layouts are shown in Fig. 3.20.
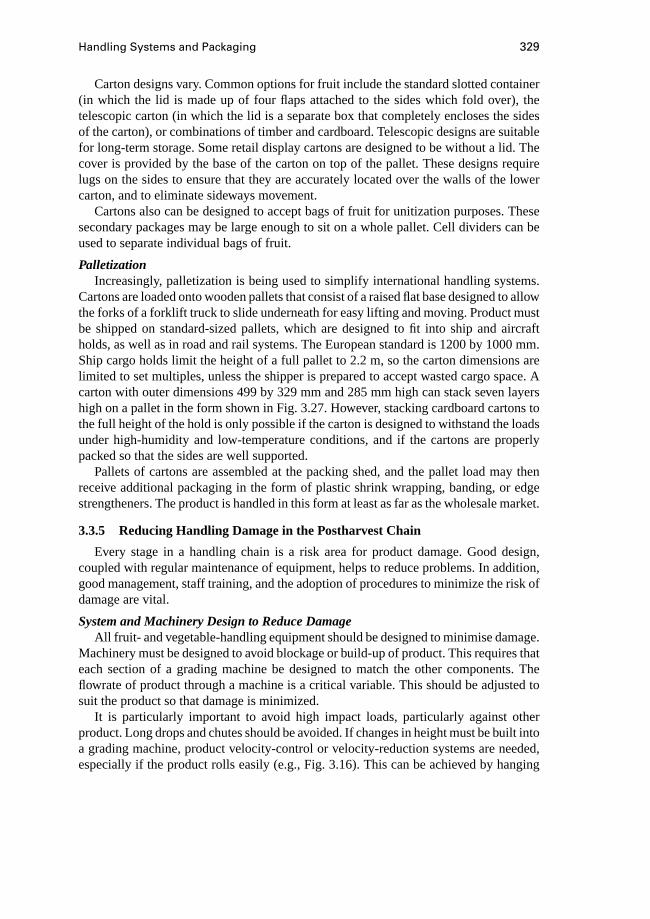
Handling Systems and Packaging 329
Carton designs vary. Common options for fruit include the standard slotted container(in which the lid is made up of four flaps attached to the sides which fold over), thetelescopic carton (in which the lid is a separate box that completely encloses the sidesof the carton), or combinations of timber and cardboard. Telescopic designs are suitablefor long-term storage. Some retail display cartons are designed to be without a lid. Thecover is provided by the base of the carton on top of the pallet. These designs requirelugs on the sides to ensure that they are accurately located over the walls of the lowercarton, and to eliminate sideways movement.
Cartons also can be designed to accept bags of fruit for unitization purposes. Thesesecondary packages may be large enough to sit on a whole pallet. Cell dividers can beused to separate individual bags of fruit.
PalletizationIncreasingly, palletization is being used to simplify international handling systems.
Cartons are loaded onto wooden pallets that consist of a raised flat base designed to allowthe forks of a forklift truck to slide underneath for easy lifting and moving. Product mustbe shipped on standard-sized pallets, which are designed to fit into ship and aircraftholds, as well as in road and rail systems. The European standard is 1200 by 1000 mm.Ship cargo holds limit the height of a full pallet to 2.2 m, so the carton dimensions arelimited to set multiples, unless the shipper is prepared to accept wasted cargo space. Acarton with outer dimensions 499 by 329 mm and 285 mm high can stack seven layershigh on a pallet in the form shown in Fig. 3.27. However, stacking cardboard cartons tothe full height of the hold is only possible if the carton is designed to withstand the loadsunder high-humidity and low-temperature conditions, and if the cartons are properlypacked so that the sides are well supported.
Pallets of cartons are assembled at the packing shed, and the pallet load may thenreceive additional packaging in the form of plastic shrink wrapping, banding, or edgestrengtheners. The product is handled in this form at least as far as the wholesale market.
3.3.5 Reducing Handling Damage in the Postharvest Chain
Every stage in a handling chain is a risk area for product damage. Good design,coupled with regular maintenance of equipment, helps to reduce problems. In addition,good management, staff training, and the adoption of procedures to minimize the risk ofdamage are vital.
System and Machinery Design to Reduce DamageAll fruit- and vegetable-handling equipment should be designed to minimise damage.
Machinery must be designed to avoid blockage or build-up of product. This requires thateach section of a grading machine be designed to match the other components. Theflowrate of product through a machine is a critical variable. This should be adjusted tosuit the product so that damage is minimized.
It is particularly important to avoid high impact loads, particularly against otherproduct. Long drops and chutes should be avoided. If changes in height must be built intoa grading machine, product velocity-control or velocity-reduction systems are needed,especially if the product rolls easily (e.g., Fig. 3.16). This can be achieved by hanging
330 Fruit and Vegetables
flaps over chutes, but these tend to cause blockages if product size and shape vary.Pockets on transfer conveyers are a more positive system. Horizontal product transfercan be facilitated with power-driven overhead brushes, which sweep the product gentlyat a controlled speed in the desired direction.
Conveying machines to fill large bins are available commercially. These are designedso that the product is transported to the chute outlet at a controlled rate and deliveredjust above the product already in the bin. The chutes on these machines move sidewaysso that filling is even across the bin.
Machinery MaintenanceHandling and grading equipment can cause significant damage if it is not maintained
properly. The most common deficiencies are wear of cushioning materials at criticalpoints and timing faults at transfer points between one component of a machine and an-other. Cushioning should be checked daily, particularly at transfer points, and replacedfrequently. Often dirt can build up in the material, which reduces its effectiveness asa cushion. Timing between singulators and weighing cups is critical for grading ma-chines for single fruit such as apples and pears, and these should also be monitoredclosely for signs of problems. Machinery should be given a thorough overhaul beforethe start of the season, and cushioning should be renewed throughout the machine.Performance should be monitored carefully, particularly at the start of the season. Han-dling machinery can behave differently when fully loaded with fresh fruit or vegetables,compared with operation with only a few samples from the previously season passingthrough.
Staff TrainingBecause much of the damage to fruit and vegetables is latent, workers can be unaware
that they are causing damage. Regular training helps to keep awareness levels high.When problems arise, these need to be corrected. Good management practices help.For example, paying staff by the quantity of product picked is an encouragement towork too fast, resulting in excessive damage. Poor supervision and long working hoursalso encourage poor handling practices. Total quality management systems should beadopted. These encourage staff involvement in quality improvements. It is essential thatin every part of the chain a consistent approach is maintained: Pickers will see little pointin being careful if packers mistreat fresh products.
Fruit and vegetables are most susceptible to damage when they are transferred. Forkliftoperators should be made aware of the need for careful handling. After products arepackaged the risk of damage still remains, and the tendancy for staff to believe that theproduct cannot be damaged inside a package should be corrected. Drop tests on applecartons showed that a 600-mm drop can result in damage to 70% of the fruit, even ifpaper-pulp tray dividers are used [23].
Reducing Bruise SusceptibilitySome products can be handled more easily if handling is delayed after harvest. Pota-
toes, taro, apples and onions are examples. There is some evidence that fruit handledcold will be slightly more bruised than fruit handled at room temperature [24, 32, 35].
Handling Systems and Packaging 331
There are conflicting research results on the effects of storage times and fruit maturityon handling damage susceptibility (e.g., see Tables 3.19 through 3.21). The direction ofthe change appears to depend on the variety [32, 43]. Turgor pressure and tissue strengthcan affect bruising in apples independently. High turgor pressure increases the amountof bruising. Factors that cause an increase in turgor pressure include harvesting earlyin the day and increased maturity of fruit. Factors that reduce turgor pressure includewater loss, or length of storage time. Lower turgor pressure probably reduces bruisesusceptibility, because impact forces are reduced. Unfortunately, this has to be balancedwith customer preferences for fresh, high-turgor fruits and vegetables.
Although maturity and size affect bruising during handling, rainfall prior to harvest,time of day of picking, and storage conditions are recognized by commercial growers asfactors that affect bruising levels [31].
Another factor is the structure of the fruit. Large cells or cells that are under greaterstress are more likely to be damaged by mechanical loading than smaller cells. Khanand Vincent [44, 45] found that apple texture in some cultivars is anisotropic, and thatcells close to the core of the apple have different mechanical properties than cells nearerthe skin. Thus, there are a number of geometrical factors that need to be considered fora complete understanding of product damage.
Factors that change cell-wall strength and stiffness alter bruising susceptibility. Pos-itive factors include calcium levels in the fruit; negative factors include product age andpoor storage conditions. The small increase in bruising occurring at low temperaturesmay occur because cell walls become less flexible at low temperature, as indicated bytwist-test measurements [46].
In storage, bruising may diminish or increase depending on whether the effects dueto loss of turgor pressure are balanced by the loss in cell-wall strength [32, 43].
3.3.6 Identification of Problem Areas in Handling Systems
Frequently it is possible to identify problem points in a handling chain. For apples,damage increases steadily as fruit progresses along the handling chain [47–51]. Theworst problems in the orchard occur when fruit are placed into field bins from pickingbuckets. Cushioned field bins, combined with special techniques to avoid forming a pileof fruit inside the bin, help reduce problems. In grading sheds, most bruising occurswhen fruit falls from the weighing cups onto other apples in final size bins and at thesingulator on some grading machines (but not all). Panget al. [52] found that fruit-to-fruit impact could be a major cause of damage. High- and low-damage points in applehandling systems are listed in Table 3.25.
In order to identify problem areas the options are either to conduct a series of ex-periments using a large sample of fruit or to use a suitable device to assess loadingdamage. Survey techniques can be slow, especially if a fault occurs in the middle ofthe season. The procedure requires that a sample of about 100 fruit be passed over eachpoint considered as a potential problem. A control sample of the same number shouldbe placed in the machine and removed without passing through the section under test toeliminate extraneous handling effects during the test. Once the damage has developed
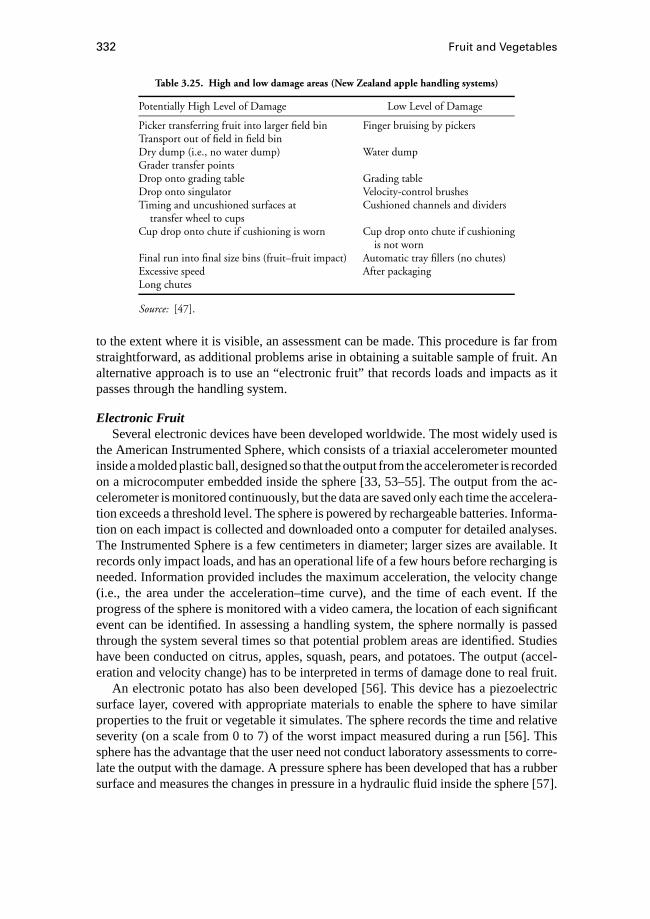
332 Fruit and Vegetables
Table 3.25. High and low damage areas (New Zealand apple handling systems)
Potentially High Level of Damage Low Level of Damage
Picker transferring fruit into larger field bin Finger bruising by pickersTransport out of field in field binDry dump (i.e., no water dump) Water dumpGrader transfer pointsDrop onto grading table Grading tableDrop onto singulator Velocity-control brushesTiming and uncushioned surfaces at Cushioned channels and dividers
transfer wheel to cupsCup drop onto chute if cushioning is worn Cup drop onto chute if cushioning
is not wornFinal run into final size bins (fruit–fruit impact) Automatic tray fillers (no chutes)Excessive speed After packagingLong chutes
Source: [47].
to the extent where it is visible, an assessment can be made. This procedure is far fromstraightforward, as additional problems arise in obtaining a suitable sample of fruit. Analternative approach is to use an “electronic fruit” that records loads and impacts as itpasses through the handling system.
Electronic FruitSeveral electronic devices have been developed worldwide. The most widely used is
the American Instrumented Sphere, which consists of a triaxial accelerometer mountedinside a molded plastic ball, designed so that the output from the accelerometer is recordedon a microcomputer embedded inside the sphere [33, 53–55]. The output from the ac-celerometer is monitored continuously, but the data are saved only each time the accelera-tion exceeds a threshold level. The sphere is powered by rechargeable batteries. Informa-tion on each impact is collected and downloaded onto a computer for detailed analyses.The Instrumented Sphere is a few centimeters in diameter; larger sizes are available. Itrecords only impact loads, and has an operational life of a few hours before recharging isneeded. Information provided includes the maximum acceleration, the velocity change(i.e., the area under the acceleration–time curve), and the time of each event. If theprogress of the sphere is monitored with a video camera, the location of each significantevent can be identified. In assessing a handling system, the sphere normally is passedthrough the system several times so that potential problem areas are identified. Studieshave been conducted on citrus, apples, squash, pears, and potatoes. The output (accel-eration and velocity change) has to be interpreted in terms of damage done to real fruit.
An electronic potato has also been developed [56]. This device has a piezoelectricsurface layer, covered with appropriate materials to enable the sphere to have similarproperties to the fruit or vegetable it simulates. The sphere records the time and relativeseverity (on a scale from 0 to 7) of the worst impact measured during a run [56]. Thissphere has the advantage that the user need not conduct laboratory assessments to corre-late the output with the damage. A pressure sphere has been developed that has a rubbersurface and measures the changes in pressure in a hydraulic fluid inside the sphere [57].
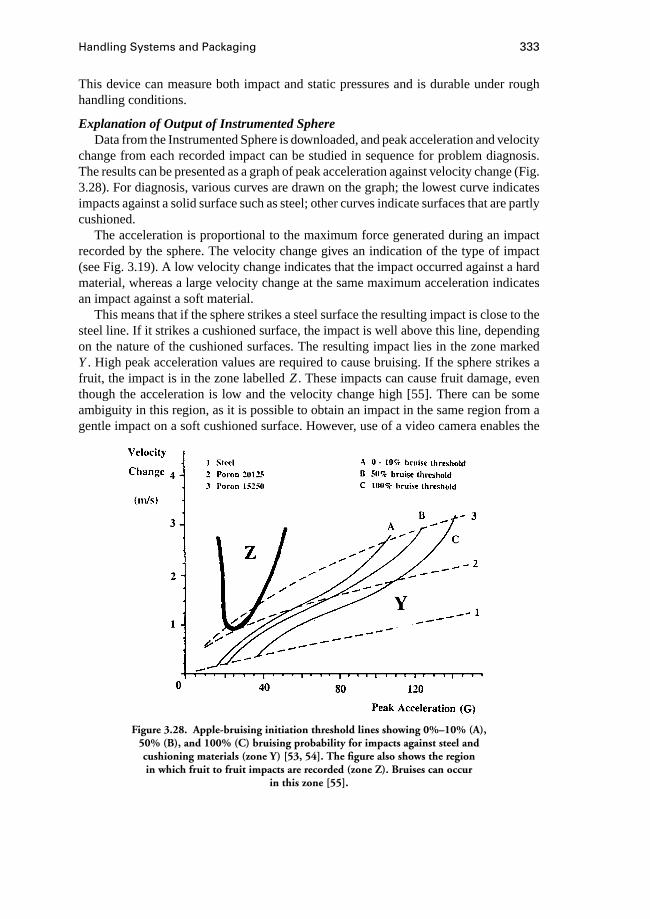
Handling Systems and Packaging 333
This device can measure both impact and static pressures and is durable under roughhandling conditions.
Explanation of Output of Instrumented SphereData from the Instrumented Sphere is downloaded, and peak acceleration and velocity
change from each recorded impact can be studied in sequence for problem diagnosis.The results can be presented as a graph of peak acceleration against velocity change (Fig.3.28). For diagnosis, various curves are drawn on the graph; the lowest curve indicatesimpacts against a solid surface such as steel; other curves indicate surfaces that are partlycushioned.
The acceleration is proportional to the maximum force generated during an impactrecorded by the sphere. The velocity change gives an indication of the type of impact(see Fig. 3.19). A low velocity change indicates that the impact occurred against a hardmaterial, whereas a large velocity change at the same maximum acceleration indicatesan impact against a soft material.
This means that if the sphere strikes a steel surface the resulting impact is close to thesteel line. If it strikes a cushioned surface, the impact is well above this line, dependingon the nature of the cushioned surfaces. The resulting impact lies in the zone markedY. High peak acceleration values are required to cause bruising. If the sphere strikes afruit, the impact is in the zone labelledZ. These impacts can cause fruit damage, eventhough the acceleration is low and the velocity change high [55]. There can be someambiguity in this region, as it is possible to obtain an impact in the same region from agentle impact on a soft cushioned surface. However, use of a video camera enables the
Figure 3.28. Apple-bruising initiation threshold lines showing 0%–10% (A),50% (B), and 100% (C) bruising probability for impacts against steel andcushioning materials (zone Y) [53, 54]. The figure also shows the regionin which fruit to fruit impacts are recorded (zone Z). Bruises can occur
in this zone [55].
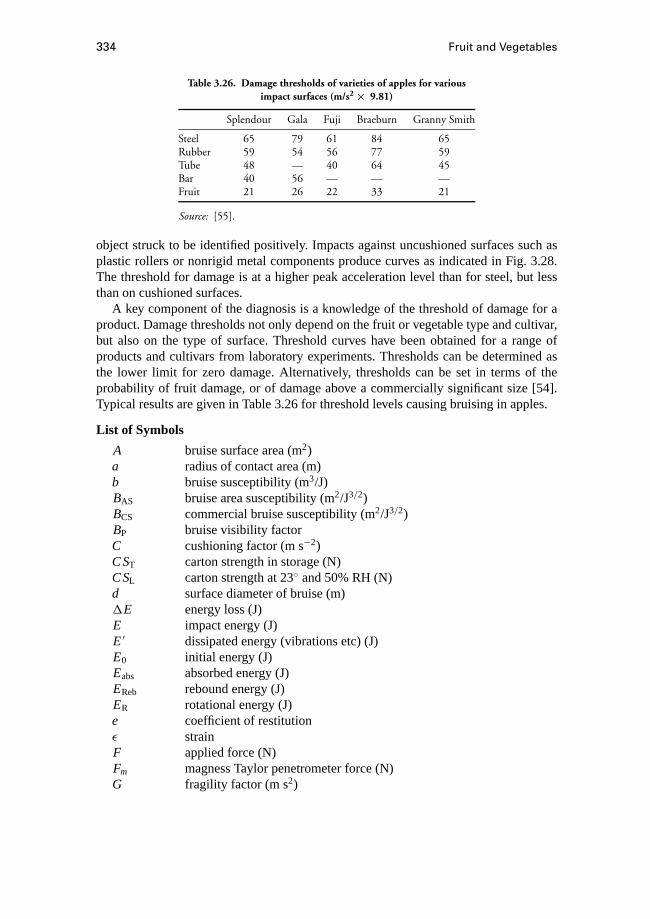
334 Fruit and Vegetables
Table 3.26. Damage thresholds of varieties of apples for variousimpact surfaces (m/s2× 9.81)
Splendour Gala Fuji Braeburn Granny Smith
Steel 65 79 61 84 65Rubber 59 54 56 77 59Tube 48 — 40 64 45Bar 40 56 — — —Fruit 21 26 22 33 21
Source: [55].
object struck to be identified positively. Impacts against uncushioned surfaces such asplastic rollers or nonrigid metal components produce curves as indicated in Fig. 3.28.The threshold for damage is at a higher peak acceleration level than for steel, but lessthan on cushioned surfaces.
A key component of the diagnosis is a knowledge of the threshold of damage for aproduct. Damage thresholds not only depend on the fruit or vegetable type and cultivar,but also on the type of surface. Threshold curves have been obtained for a range ofproducts and cultivars from laboratory experiments. Thresholds can be determined asthe lower limit for zero damage. Alternatively, thresholds can be set in terms of theprobability of fruit damage, or of damage above a commercially significant size [54].Typical results are given in Table 3.26 for threshold levels causing bruising in apples.
List of Symbols
A bruise surface area (m2)a radius of contact area (m)b bruise susceptibility (m3/J)BAS bruise area susceptibility (m2/J3/2)BCS commercial bruise susceptibility (m2/J3/2)BP bruise visibility factorC cushioning factor (m s−2)CST carton strength in storage (N)CSL carton strength at 23◦ and 50% RH (N)d surface diameter of bruise (m)1E energy loss (J)E impact energy (J)E′ dissipated energy (vibrations etc) (J)E0 initial energy (J)Eabs absorbed energy (J)EReb rebound energy (J)ER rotational energy (J)e coefficient of restitutionε strainF applied force (N)Fm magness Taylor penetrometer force (N)G fragility factor (m s2)
Handling Systems and Packaging 335
g acceleration due to gravity (9.81 m· s−2)h bruise depth at centre (m)H drop height (m)I inertia (kg cdot m2)K1 empirical constant - equation (3.39)KRH, KT, KSP Relative Humidity, time, and stacking factor
correction factors for corrugated cardboardcontainers (%)
k material constant defined in Eq (3.23)L thickness of cushioning material (m)M, M1, M2 mass (kg)n constant defined in Eq (3.35)Pmax maximum pressure on contact area (Pa)Q angular rotation (rad· s−1)R, R1, R2 radii of curvature in contact area (m)R1A, R1B orthogonal radii of curvature of surface 1 etc.r radius of sphere (m)σ stress (Pa)S packing densityT momentum (N s)t time (s)U initial velocity before impact (m· s−1)U ′ velocity after impact (m· s−1)u velocity (m· s−1)Vb bruise volume (m3)Vs volume of compression sample (m3)ν Poisson’s ratio of the materialX bruise height above contact plane (m)x closest approach distance (m)Y Young’s modulus of elasticity (Pa)
References
1. Burden J., and R. B. H. Wills. 1989. Prevention of food losses: Fruits, vegetables androot crops: A training manual. FAO training series No. 17/2. Rome: United NationsFood and Agriculture Organisation.
2. American National Research Council. 1978.Report of the Steering Committee forStudy on Postharvest Food Losses in Developing Countries. Washington, DC: Na-tional Science Foundation.
3. Amuttiratana, D., and W. Passornsiri. 1992. Postharvest losses in Thailand. InPostharvest Losses of Vegetables, ed. M. H. Bhatti, C. A. Hafeez, A. Jaggar, andC. M. Farooq. Workshop report, Oct. 1992, Islamabad, FAO publication RAS/89/41.
4. Thompson, A. K. 1996.Postharvest Technology of Fruit and Vegetables. Oxford:Blackwell.

336 Fruit and Vegetables
5. Kitinoja, L., and A. A. Kader. 1995. Small-scale postharvest handling practices, 3rded. Postharvest Horticulture Series No. 8, Department of Pomology, University ofCalifornia, Davis.
6. Studman, C. J. Ergonomics in apple sorting: A pilot study.Journal of AgriculturalEngineering Research70:323–334.
7. Pheasant, S. T. 1988.Bodyspace: Anthropometry, Ergonomics and Design. London:Taylor and Francis.
8. Nicholas, J. V. 1985. Colour and light for the inspection table. Sirtec PublicationNo. 1, Department of Scientific and Industrial Research, Wellington, New Zealand.
9. Brown G. K., D. Marshall, and D. Timm. 1993. Lighting for fruit and vegetablesorting. Conference Proceedings, Fourth International Symposium on Fruit, Nutand Vegetable Production, paper 935.13, Valencia.
10. Shewfelt, R. L., and S. E. Prussia, eds. 1995.Postharvest Handling: A SystemsApproach. San Diego: Academic Press.
11. Rodriguez, L., M. Tuiz, and M. R. de Felipe. 1990. Differences in structural responseof granny smith apples under mechanical impact and compression.J. Text. Stud.21(2):155–164.
12. Vamos-Vigyazo, L. 1981. Polyphenol oxidase and peroxidase in fruits and vegeta-bles.CRC Critical Reviews of Food Science15:49–127.
13. Davie, I. J. 1997. Role of calcium and mechanical damage in the development oflocalised premature softening in coolstored kiwifruit. Ph.D. diss., Massey University,New Zealand.
14. Hung, Y.C. 1993. Latent damage: A systems perspective. InPostharvest Handling:A Systems Approach, eds. R. L. Shewfelt, and S. E. Prussia, chapter 10. San Diego:Academic Press.
15. Ouyang, L., and C. J. Studman. 1997. Bruise measurement by image analysis. Con-ference Proceedings, Fifth International Symposium on Fruit, Nut and VegetableProduction, University of California, Davis.
16. Klein, J. D. 1987. Relationship of harvest date, storage conditions, and fruit charac-teristics to bruise susceptibility of apple.Journal of the American Society of Horti-cultural Science112(1):113–118.
17. Mohsenin, N. N. 1986.Physical Properties of Plant and Animal Materials, 2nd ed.New York: Gordon and Breach.
18. Holt, J. E., and D. Schoorl. 1977. Bruising and energy dissipation in apples.Journalof Texture Studies7:421–432.
19. Schoorl, D., and J. E. Holt. 1980. Bruise resistance measurements in apples.Journalof Texture Studies11:389–394.
20. Chen, P., and Z. Sun. 1981. Impact parameters related to bruise injury in ap-ples.American Society of Agricultural Engineers, paper 81–3041. St Joseph, MI:ASAE.
21. Kader, A. A. 1983. Postharvest quality maintenance of fruits and vegetables indeveloping countries. InPostharvest Physiology and Crop Production, pp. 455–470. New York: Plenum.
Handling Systems and Packaging 337
22. Studman, C. J. 1994. Quality in Fresh Fruit: Meaning, Measurement and Mainte-nance. Proc. AGENG’94 Milan, Italy. Paper 94-G-067.
23. Heap, R. A. 1994. Performance of recycled paper pulp trays in relation to impactdamage in apple cartons. Master’s thesis, Department of Agricultural Engineering,Massey University.
24. Pang, D. W., C. J. Studman, N. H. Banks, and P. H. Baas. 1996. Rapid assessment ofthe susceptibility of apples to bruising.Journal of Agricultural Engineering Research64:37–48.
25. Siyami, S., G. K. Brown, G. J. Burgess, J. B. Gerrish, B. R.Tennes, C. L. Burton,and R. H. Zapp. 1988. Apple impact bruise prediction models.Transactions of theAmerican Society of Agricultural Engineers31:1038–1046.
26. Bollen, F., and B. T. Dela Rue. 1994. Assessment of damage in the apple postharvesthandling system. Conference on Engineering in Agriculture, Australian Society ofAgricultural Engineers, New Zealand, paper 94/012.
27. Roudot, A. C., F. Duprat, and C. Wenian. 1991. Modelling the response of applesto loads.Journal of Agricultural Engineering Research48:249–259.
28. Studman, C. J., and N. H. Banks. 1989. Indenter shape effects in the impact bruisingof apples and nashi. Conference Proceedings, Paper A14, 4th International Confer-ence on the Physical Properties of Agricultural Materials, Rostock, East Germany.
29. Studman, C. J., and N. H. Banks. 1989b. The measurement of bruise susceptibility inapples and nashi. Conference proceedings, International Symposium on AgriculturalEngineering, vol. 3, pp. 31–36.
30. Timoshenko, S. P., and J. N. Goodier. 1970.Theory of Elasticity, 3rd ed. New York:McGraw-Hill.
31. Mowatt, C. M. 1997. Reduction of bruising in apples. Ph.D. diss., Massey University,New Zealand.
32. Studman, C. J. 1997. Factors affecting the bruise susceptibility of fruit. InProceed-ings of Conference on Plant Biomechanics 1997, ed. G. Jeronimidis, and J. F. V.Vincent. Reading: University of Reading.
33. Hyde, G. M. 1997. Bruising: Impacts, why apples bruise, and what you can doto minimize bruising.Treefruit Postharvest Journal Washington State University8(4):9–12.
34. Kuang, M. 1998. Evaluation of alternative methods of bruise measurements in applefruit. Master’s thesis, Massey University, New Zealand.
35. Bollen, F., and B. T. Dela Rue. 1994. Assessment of damage in the apple postharvesthandling system. Conference on Engineering in Agriculture, Australian Society ofAgricultural Engineers, New Zealand, paper 94/012.
36. Mowatt, C. M., and N. H. Banks. 1994. Factors influencing the bruise susceptibilityof apples. Final project report to the New Zealand Apple and Pear Marketing Board,Hastings, New Zealand.
37. Johnson, K. L. 1985.Contact Mechanics. New York: Cambridge University Press.38. Dela Rue, B. 1996. A hierarchical modelling procedure to determine factors in apple
bruising. Postharvest ’96 Conference proceedings, Taupo, New Zealand.
338 Fruit and Vegetables
39. Peleg, K. 1985.Produce Handling, Packaging and Distribution. Westport, CT: AVIPublishing.
40. Holt, J. E., D. Schoorl, and C. Lucas. 1981. Prediction of bruising in impactedmultilayered apple packs.Transactions of the American Society of AgriculturalEngineers24:242–247.
41. Soroka, W. 1996.Fundamentals of Packaging Technology. Herndon, VA: Instituteof Packaging Professionals.
42. British Standards Institute. 1992. Packaging Standards BS1133: Section 12.43. Garcia, J. L., M. Ruiz-Altisent, and P. Barriero. 1995. Factors influencing mechanical
properties and bruise susceptibility of apples and pears.Journal of AgriculturalEngineering Research61:11–18.
44. Khan, A. A., and J. F. Vincent. 1990. Anisotrophy of apple parenchyma.Journal ofScience in Agriculture52:455–466.
45. Khan, A. A., and J. F. Vincent. 1993. Anisotrophy in the fracture properties ofapple flesh as investigated by crack opening tests.Journal of Materials Science28:45–51.
46. Studman, C. J., and L. Boyd. 1994. Measurement of Firmness in Fruit and Vegeta-bles. Proc. AGENG’94 Milan, Italy. Paper 94-G-066.
47. Banks, N. H. 1991. Identification of sources of bruises on Hawkes Bay gradingequipment. Project report to New Zealand Apple and Pear Marketing Board, MasseyUniversity, New Zealand.
48. Schulte, N. L., E. J. Timm, G. K. Brown, D. E. Marshall, and C. L. Burton. 1990.Apple damage assessment during intrastate transportation.Applied Engineering inAgriculture6:753–758.
49. Schulte, N. L., E. J. Timm, P. A. Armstrong, and G. K. Brown. 1991. Apple bruis-ing: A problem during hand harvesting. Proceedings of the American Society ofAgricultural Engineers, paper no. 91-1021.
50. Brown, G. K., C. L. Burton, S. A. Sargent, N. L. Schulte Pason, E. J. Timm, andD. E. Marshall. 1987. Apple packing line damage assessment. Proceedings of theAmerican Society of Agricultural Engineers, paper no. 87-6515.
51. Jones C. S., J. E. Holt, and D. Schoorl. 1991. A model to predict damage to hor-ticultural produce during transport.Journal of Agricultural Engineering Research50(4):259–272.
52. Pang D. W., C. J. Studman, and G. T. Ward. 1992. Bruising damage in apple-to-appleimpact.Journal of Agricultural Engineering Research52:229–240.
53. Zapp, H. R., E. Ehlert., G. K. Brown, P. P. Armstrong, and S. S. Sober. 1990.Advanced instrumented sphere (IS) for impact measurements.Transactions of theAmerican Society of Agricultural Engineers33:955–960.
54. Tennes, B. R., H. R. Zapp, D. E. Marshall, and P. R. Armstrong. 1990. Applehandling impacts data acquisition and analysis with an instrumented sphere.Journalof Agricultural Engineering Research47:269–276.
55. Pang, W., C. J. Studman, and N. H. Banks. 1992. Analysis of damage thresholds inapple-to-apple impacts using an instrumented sphere.New Zealand Journal of Cropand Horticultural Science20:159–166.

Cold-Storage Systems 339
56. Anderson, G. 1990. The development of artificial fruits and vegetables. Pro-ceedings of International Conference on Agricultural Mechanisation, Zaragoza,2:133–13.
57. Herold, B., I. Truppel, G. Siering, and M. Geyer. 1996. A pressure measuring spherefor monitoring handling of fruit and vegetables.Computers and Electronics in Agri-culture15(1):73–88.
3.4 Cold-Storage SystemsJ. F. Thompson
3.4.1 Purpose of Storage
Orderly marketing of perishable commodities often requires storage to balance day-to-day fluctuations between product harvest and sales; for a few products, long-termstorage is used to extend marketing beyond the end of harvest season. Long-term stor-age is feasible only if the product gains enough value during the storage period to payfor the cost of storage. To minimize product quality loss the storage must slow bio-logical activity of product by maintaining the lowest temperature that will not causefreezing or chilling injury and by controlling atmospheric composition; slow growthand spread of microorganisms by maintaining low temperatures and minimizing sur-face moisture on the product; reduce product moisture loss and the resulting wiltingand shrivel by reducing the difference between product and air temperatures and main-taining high humidity in the storage room; and reduce product susceptibility to damagefrom ethylene gas. With some commodities, the storage facility also may be used toapply special treatments. For example, potatoes and sweet potatoes are held at hightemperature and high relative humidity to cure wounds sustained during harvest, ta-ble grapes are fumigated with sulfur dioxide to minimizeBotrytis decay damage, andpears and peaches may be warmed and exposed to ethylene to ripen more quickly anduniformly. This section describes the equipment and techniques commonly used to con-trol temperature, relative humidity, and atmospheric composition in a storage facility[1, 2].
3.4.2 Storage Considerations
TemperatureThe temperature in a storage facility normally should be kept within about 1◦C of the
desired temperature for the commodities being stored. For storage very close to the freez-ing point, a narrower range may be needed. Temperatures below the optimum range fora given commodity may cause freezing or chilling injury; temperatures above it shortenstorage life. In addition, wide temperature fluctuations can result in water condensationon stored products and also more rapid water loss. Recommended temperatures andhumidities for long-term storage of horticultural products are shown in the Appendix,Table 3.A3. In many stores, particularly at wholesale and retail marketing, many productsare held in the same cold storage. Table 3.27 groups commodities into four temperatureand humidity groups for short-term storage.
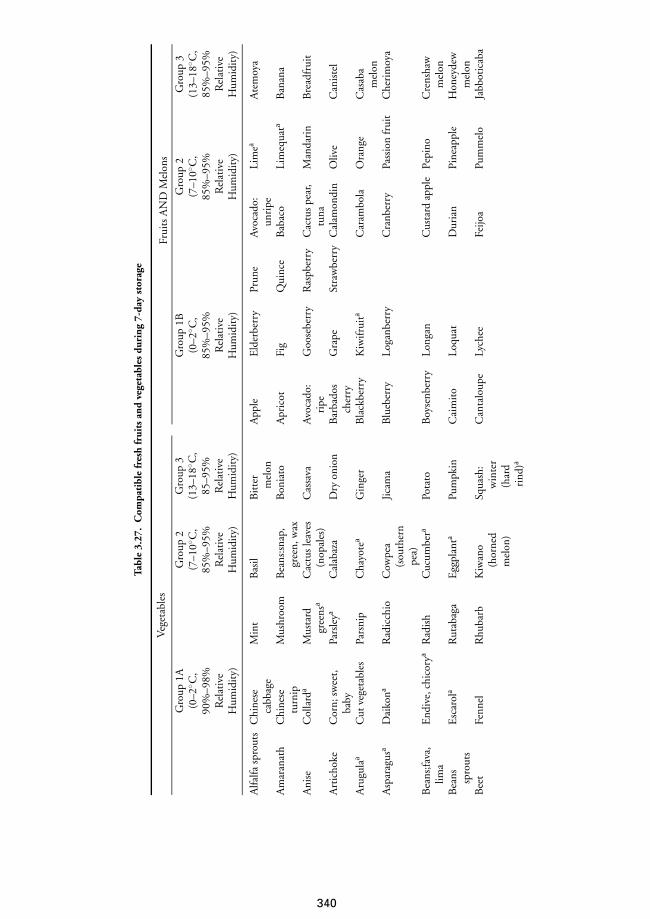
Tabl
e3.
27.
Com
pati
ble
fres
hfr
uits
and
vege
tabl
esdu
ring
7-da
yst
orag
e
Veg
etab
les
Frui
tsA
ND
Mel
ons
Gro
up1A
Gro
up2
Gro
up3
Gro
up1B
Gro
up2
Gro
up3
(0–2
◦ C,
(7–1
0◦ C,
(13–
18◦ C
,(0
–2◦ C
,(7
–10◦ C
,(1
3–18
◦ C,
90%
–98%
85%
–95%
85–9
5%85
%–9
5%85
%–9
5%85
%–9
5%R
elat
ive
Rel
ativ
eR
elat
ive
Rel
ativ
eR
elat
ive
Rel
ativ
eH
umid
ity)
Hum
idit
y)H
umid
ity)
Hum
idit
y)H
umid
ity)
Hum
idit
y)
Alfa
lfasp
rout
sC
hine
seM
int
Bas
ilB
itte
rA
pple
Eld
erbe
rry
Prun
eA
voca
do:
Lim
eaA
tem
oya
cabb
age
mel
onun
ripe
Am
aran
ath
Chi
nese
Mus
hroo
mB
eans
:sna
p,B
onia
toA
pric
otFi
gQ
uinc
eB
abac
oLi
meq
uata
Ban
ana
turn
ipgr
een,
wax
Ani
seC
olla
rda
Mus
tard
Cac
tus
leav
esC
assa
vaA
voca
do:
Goo
sebe
rry
Ras
pber
ryC
actu
spe
ar,
Man
dari
nB
read
frui
tgr
eens
a(n
opal
es)
ripe
tuna
Art
icho
keC
orn;
swee
t,Pa
rsle
yaC
alab
aza
Dry
onio
nB
arba
dos
Gra
peSt
raw
berr
yC
alam
ondi
nO
live
Can
iste
lba
bych
erry
Aru
gula
aC
utve
geta
bles
Pars
nip
Cha
yote
aG
inge
rB
lack
berr
yK
iwifr
uita
Car
ambo
laO
rang
eC
asab
am
elon
Asp
arag
usa
Dai
kona
Rad
icch
ioC
owpe
aJi
cam
aB
lueb
erry
Loga
nber
ryC
ranb
erry
Pass
ion
frui
tC
heri
moy
a(s
outh
ern
pea)
Bea
ns;fa
va,
End
ive,
chic
orya
Rad
ish
Cuc
umbe
raPo
tato
Boy
senb
erry
Long
anC
usta
rdap
ple
Pepi
noC
rens
haw
lima
mel
onB
eans
Esc
arol
aR
utab
aga
Egg
plan
taPu
mpk
inC
aim
ito
Loqu
atD
uria
nPi
neap
ple
Hon
eyde
wsp
rout
sm
elon
Bee
tFe
nnel
Rhu
barb
Kiw
ano
Squa
sh:
Can
talo
upe
Lych
eeFe
ijoa
Pum
mel
oJa
bbot
icab
a(h
orne
dw
inte
rm
elon
)(h
ard
rind
)a
340
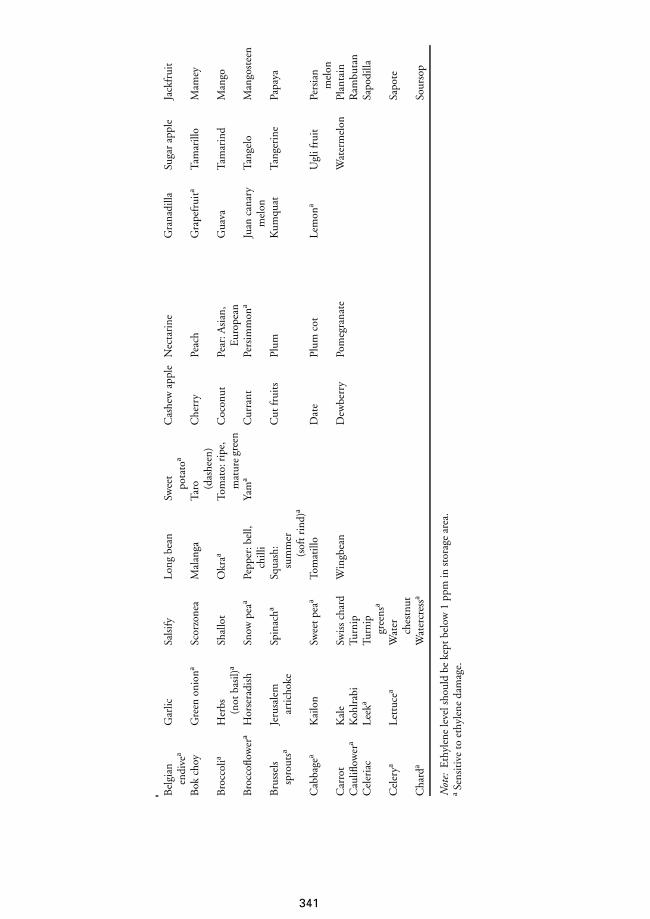
Bel
gian
Gar
licSa
lsify
Long
bean
Swee
tC
ashe
wap
ple
Nec
tari
neG
rana
dilla
Suga
rap
ple
Jack
frui
ten
dive
apo
tato
a
Bok
choy
Gre
enon
iona
Scor
zone
aM
alan
gaTa
roC
herr
yPe
ach
Gra
pefr
uita
Tam
arill
oM
amey
(das
heen
)B
rocc
olia
Her
bsSh
allo
tO
kraa
Tom
ato:
Coc
onut
Pear
:Asi
an,
Gua
vaTa
mar
ind
Man
go(n
otba
sil)
ari
pe,
Eur
opea
nm
atur
egr
een
Bro
ccofl
ower
aH
orse
radi
shSn
owpe
aaPe
pper
:bel
l,Ya
ma
Cur
rant
Pers
imm
ona
Juan
cana
ryTa
ngel
oM
ango
stee
nch
illi
mel
onB
russ
els
Jeru
sale
mSp
inac
haSq
uash
:C
utfr
uits
Plum
Kum
quat
Tang
erin
ePa
paya
spro
utsa
arti
chok
esu
mm
er(s
oftr
ind)
a
Cab
bage
aK
ailo
nSw
eetp
eaa
Tom
atill
oD
ate
Plum
cot
Lem
ona
Ugl
ifru
itPe
rsia
nm
elon
Car
rot
Kal
eSw
iss
char
dW
ingb
ean
Dew
berr
yPo
meg
rana
teW
ater
mel
onPl
anta
inC
aulifl
ower
aK
ohlr
abi
Turn
ipR
ambu
tan
Cel
eria
cLe
eka
Turn
ipSa
podi
llagr
eens
a
Cel
erya
Lett
ucea
Wat
erSa
pote
ches
tnut
Cha
rda
Wat
ercr
essa
Sour
sop
Not
e:E
thyl
ene
leve
lsho
uld
beke
ptbe
low
1pp
min
stor
age
area
.a
Sens
itiv
eto
ethy
lene
dam
age.
341
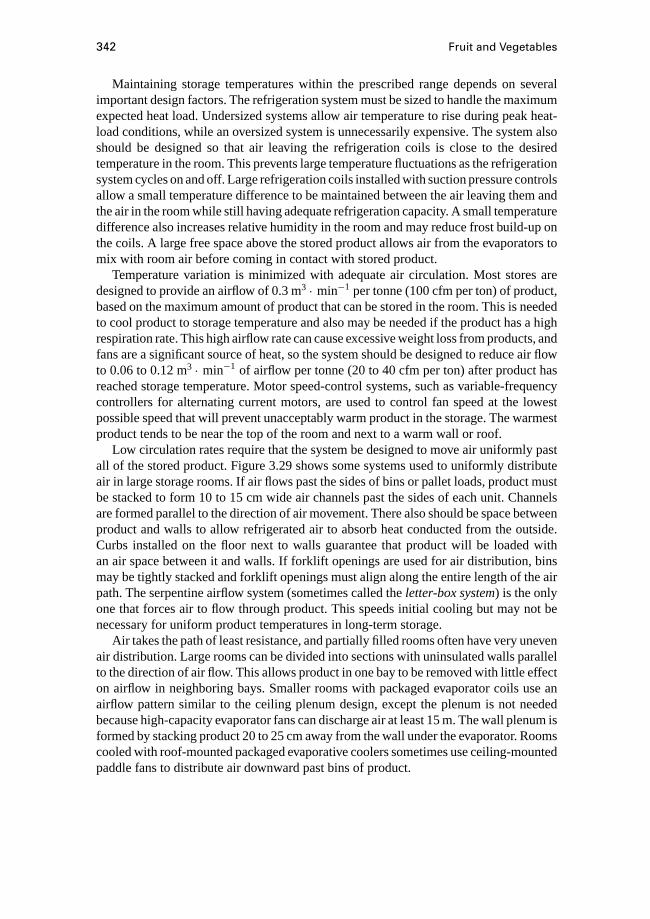
342 Fruit and Vegetables
Maintaining storage temperatures within the prescribed range depends on severalimportant design factors. The refrigeration system must be sized to handle the maximumexpected heat load. Undersized systems allow air temperature to rise during peak heat-load conditions, while an oversized system is unnecessarily expensive. The system alsoshould be designed so that air leaving the refrigeration coils is close to the desiredtemperature in the room. This prevents large temperature fluctuations as the refrigerationsystem cycles on and off. Large refrigeration coils installed with suction pressure controlsallow a small temperature difference to be maintained between the air leaving them andthe air in the room while still having adequate refrigeration capacity. A small temperaturedifference also increases relative humidity in the room and may reduce frost build-up onthe coils. A large free space above the stored product allows air from the evaporators tomix with room air before coming in contact with stored product.
Temperature variation is minimized with adequate air circulation. Most stores aredesigned to provide an airflow of 0.3 m3 · min−1 per tonne (100 cfm per ton) of product,based on the maximum amount of product that can be stored in the room. This is neededto cool product to storage temperature and also may be needed if the product has a highrespiration rate. This high airflow rate can cause excessive weight loss from products, andfans are a significant source of heat, so the system should be designed to reduce air flowto 0.06 to 0.12 m3 · min−1 of airflow per tonne (20 to 40 cfm per ton) after product hasreached storage temperature. Motor speed-control systems, such as variable-frequencycontrollers for alternating current motors, are used to control fan speed at the lowestpossible speed that will prevent unacceptably warm product in the storage. The warmestproduct tends to be near the top of the room and next to a warm wall or roof.
Low circulation rates require that the system be designed to move air uniformly pastall of the stored product. Figure 3.29 shows some systems used to uniformly distributeair in large storage rooms. If air flows past the sides of bins or pallet loads, product mustbe stacked to form 10 to 15 cm wide air channels past the sides of each unit. Channelsare formed parallel to the direction of air movement. There also should be space betweenproduct and walls to allow refrigerated air to absorb heat conducted from the outside.Curbs installed on the floor next to walls guarantee that product will be loaded withan air space between it and walls. If forklift openings are used for air distribution, binsmay be tightly stacked and forklift openings must align along the entire length of the airpath. The serpentine airflow system (sometimes called theletter-box system) is the onlyone that forces air to flow through product. This speeds initial cooling but may not benecessary for uniform product temperatures in long-term storage.
Air takes the path of least resistance, and partially filled rooms often have very unevenair distribution. Large rooms can be divided into sections with uninsulated walls parallelto the direction of air flow. This allows product in one bay to be removed with little effecton airflow in neighboring bays. Smaller rooms with packaged evaporator coils use anairflow pattern similar to the ceiling plenum design, except the plenum is not neededbecause high-capacity evaporator fans can discharge air at least 15 m. The wall plenum isformed by stacking product 20 to 25 cm away from the wall under the evaporator. Roomscooled with roof-mounted packaged evaporative coolers sometimes use ceiling-mountedpaddle fans to distribute air downward past bins of product.
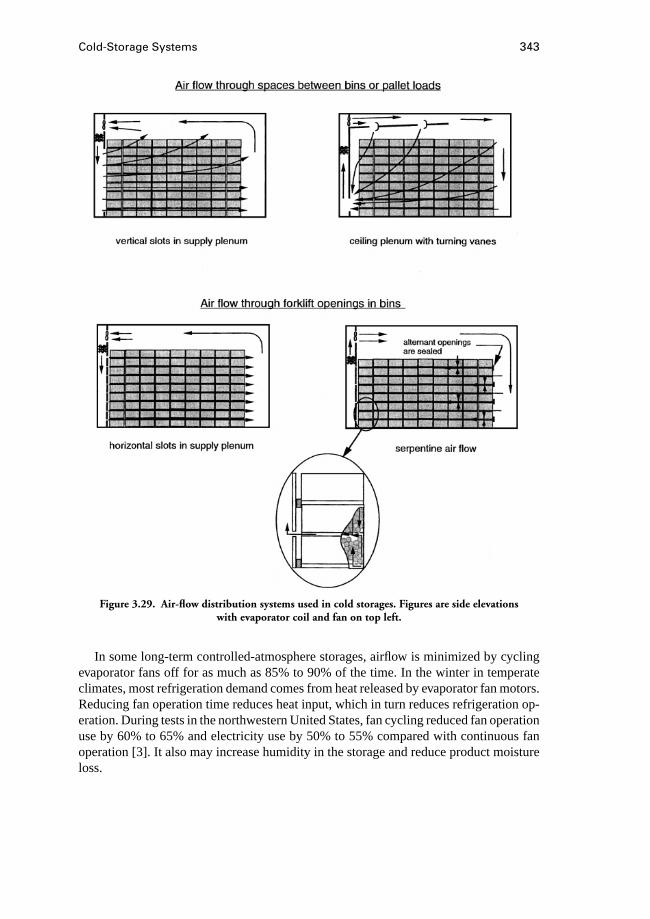
Cold-Storage Systems 343
Figure 3.29. Air-flow distribution systems used in cold storages. Figures are side elevationswith evaporator coil and fan on top left.
In some long-term controlled-atmosphere storages, airflow is minimized by cyclingevaporator fans off for as much as 85% to 90% of the time. In the winter in temperateclimates, most refrigeration demand comes from heat released by evaporator fan motors.Reducing fan operation time reduces heat input, which in turn reduces refrigeration op-eration. During tests in the northwestern United States, fan cycling reduced fan operationuse by 60% to 65% and electricity use by 50% to 55% compared with continuous fanoperation [3]. It also may increase humidity in the storage and reduce product moistureloss.

344 Fruit and Vegetables
Thermostat sensors are usually placed 1.5 m above the floor (for ease of checking)in representative locations in the room. They should not be placed near sources of heatsuch as doors or walls with an exterior surface. Nor should they be placed in a cold areasuch as near the air discharge of the refrigeration unit. A calibrated thermometer shouldbe used to periodically check the thermostat, because errors of only a few degrees cansignificantly affect product quality.
HumidityFor most perishable commodities, the relative humidity in a storage facility should
be kept at 90% to 100% (Appendix, Table 3.A3). Humidities below this range result inunacceptable moisture loss. However, humidities close to 100% may cause excessivegrowth of microorganisms and surface cracking on some products, although it is unusualfor a storage facility to have relative humidities that are too high.
Partially dried products such as garlic, ginger, and dry onion are held at 65% to75% humidity. Dried fruits and nuts should be held at 55% to 65% humidity. Corrugatedfiberboard or cardboard containers are weakened by prolonged exposure to high humidity.Typical corrugated fiberboard exposed to 95% humidity has half as much strength asthe same material exposed to 50% humidity. Storage-room humidity for perishables canbe lowered below recommended levels if the product is packaged in plastic bags or boxliners to maintain a high relative humidity around the product and prevent moisture loss.
Refrigeration equipment must be specially designed to maintain high relative humid-ity. In systems not designed for horticultural commodities, the evaporator coils (whichproduce cold air) operate with a refrigerant temperature at least 11◦C (20◦F) lower thanthe temperature of the air returning to the coil. This causes an excessive amount of mois-ture to condense on the coils and results in a low relative humidity in the storage room.Coils with a large surface area achieve the same refrigeration capacity as smaller coilsbut can operate at a higher temperature, thus reducing the moisture removed from theair. As a guide, the coils should be large enough so that the refrigerant is only 2.2 to4.4◦C colder than the air temperature returning to the coil [4].
Mechanical humidifiers or fog spray nozzles are sometimes used to add moistureto the storage room and reduce the drying effect of the evaporator coils. They are par-ticularly valuable if moisture must be added to wood or paper packaging to prevent itfrom absorbing moisture from the product. However, much of the moisture added bya humidifier is condensed on the evaporator, resulting in the need for more frequentdefrosting. Humidifiers also are needed in conditions under which the product is storedat a temperature warmer than the outside environment (cold winter locations) and heatis added to prevent chilling injury or freezing.
Some refrigeration systems use a wet-coil heat exchanger to maintain humidity. Inthis system, water is cooled to 0◦C, or a higher temperature if higher room temperaturesare desired. The water is sprayed down through a coil, and the storage area air is cooledand humidified to nearly 100% as it moves upward through the coil. However, as theair moves through the storage area it picks up heat, and the rise in temperature reducesrelative humidity. This system usually is limited to air temperatures above 0.2◦C, andit does not work well for commodities that are held close to or below 0◦C, without the
Cold-Storage Systems 345
use of compounds that depress freezing temperature (such as caustic soda or ethyleneglycol) in the water.
3.4.3 Refrigeration
Mechanical RefrigerationMost storage facilities use mechanical refrigeration to control storage temperature.
This system utilizes the fact that a liquid absorbs heat as it changes to a gas. The simplestmethod for using this effect is to allow a controlled release of liquid nitrogen or liquidcarbon dioxide in the storage area. As the refrigerant boils, it causes a cooling effect inthe storage area. However, this method requires a constant outside supply of refrigerantand is used only to a limited extent with highway vans and rail cars. The more commonmechanical refrigeration systems use a refrigerant such as ammonia or a variety ofhalocarbon fluids (sometimes referred to by the trade name Freon) whose vapor can berecaptured easily by a compressor and heat exchanger.
Figure 3.30 shows the components of a typical vapor-recompression (or mechanical)refrigeration system. The refrigerant fluid passes through the expansion valve, where thepressure drops and the liquid evaporates at temperatures low enough to be effective inremoving heat from the storage area. Heat from the material to be cooled is transferred tothe room air, which is then forced past the evaporator (cooling coil located in the room).This is usually a finned tube heat exchanger, which transfers the heat from the air to therefrigerant, causing it to evaporate. After fully changing to a gas, it is repressurized bythe compressor and then passes through a condenser, where it is cooled to a liquid. Thecondenser is located outside the storage area and releases heat. Liquid is stored in thereceiver and is metered out as needed for cooling.
Refrigerant Flow and Pressure ControlSmall mechanical refrigeration systems are controlled primarily by the expansion
valve, which regulates the pressure of the refrigerant in the evaporator. Low pressurescause the liquid refrigerant to evaporate at low temperatures. The valve also controls theflow of refrigerant, which affects the amount of refrigeration capacity available. Capil-lary tubes and thermostatic expansion valves are the most common types of expansionvalves.
The capillary tube is used with very small refrigeration equipment (less than 0.7 kW[1 hp]). It is a tube 0.6 to 6 m long with a verysmall inside diameter of 0.6 to 2.3 mm.The resistance of the liquid flowing through the tube creates the needed pressure dropbetween the low-pressure and high-pressure sides of the system and regulates the flowof refrigerant. A capillary is inexpensive and has no moving parts to maintain, but itcannot be adjusted, is subject to clogging, and requires a relatively constant weight ofrefrigerant in the system.
The thermostatic expansion valve regulates the flow of refrigerant to maintain a con-stant temperature difference between the evaporator inlet or evaporating temperature andthe coil outlet (it maintains a constant superheat of the refrigerant above its evaporationtemperature). It allows the evaporator pressure to vary, so that when high refrigeration
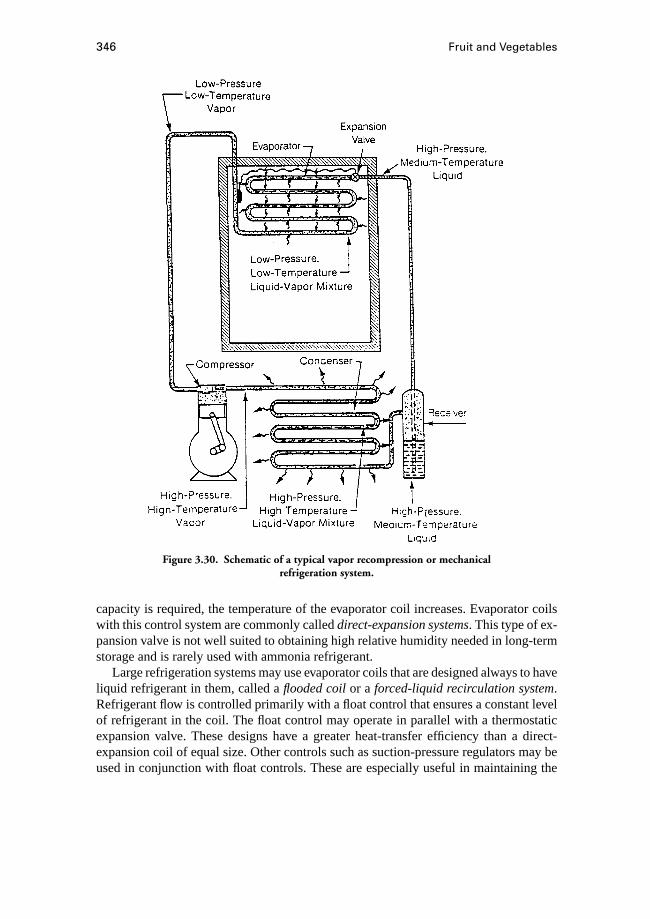
346 Fruit and Vegetables
Figure 3.30. Schematic of a typical vapor recompression or mechanicalrefrigeration system.
capacity is required, the temperature of the evaporator coil increases. Evaporator coilswith this control system are commonly calleddirect-expansion systems. This type of ex-pansion valve is not well suited to obtaining high relative humidity needed in long-termstorage and is rarely used with ammonia refrigerant.
Large refrigeration systems may use evaporator coils that are designed always to haveliquid refrigerant in them, called aflooded coilor a forced-liquid recirculation system.Refrigerant flow is controlled primarily with a float control that ensures a constant levelof refrigerant in the coil. The float control may operate in parallel with a thermostaticexpansion valve. These designs have a greater heat-transfer efficiency than a direct-expansion coil of equal size. Other controls such as suction-pressure regulators may beused in conjunction with float controls. These are especially useful in maintaining the
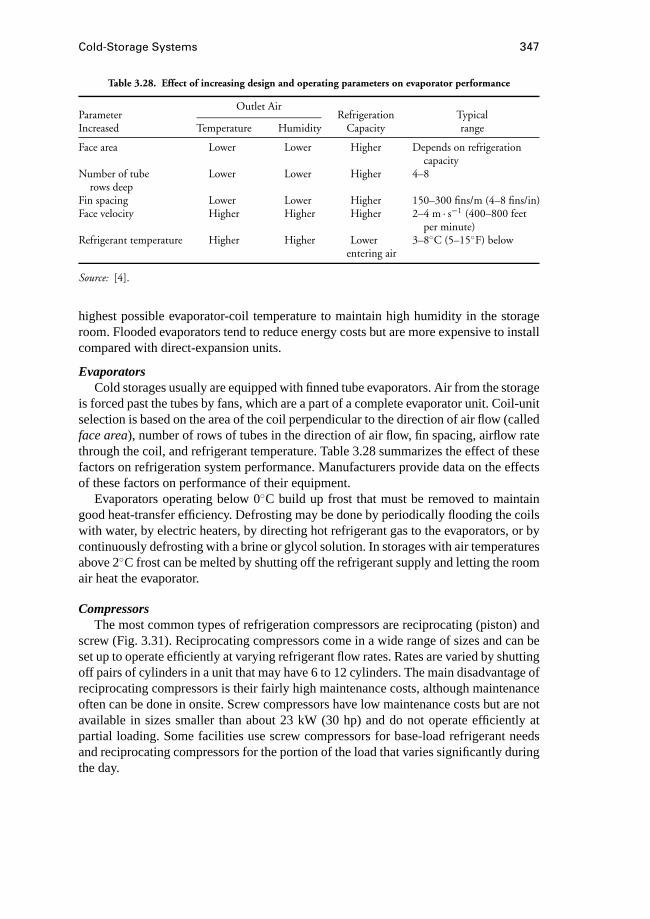
Cold-Storage Systems 347
Table 3.28. Effect of increasing design and operating parameters on evaporator performance
Outlet AirParameterIncreased Temperature Humidity
RefrigerationCapacity
Typicalrange
Face area Lower Lower Higher Depends on refrigerationcapacity
Number of tube Lower Lower Higher 4–8rows deep
Fin spacing Lower Lower Higher 150–300 fins/m (4–8 fins/in)Face velocity Higher Higher Higher 2–4 m · s−1 (400–800 feet
per minute)Refrigerant temperature Higher Higher Lower 3–8◦C (5–15◦F) below
entering air
Source: [4].
highest possible evaporator-coil temperature to maintain high humidity in the storageroom. Flooded evaporators tend to reduce energy costs but are more expensive to installcompared with direct-expansion units.
EvaporatorsCold storages usually are equipped with finned tube evaporators. Air from the storage
is forced past the tubes by fans, which are a part of a complete evaporator unit. Coil-unitselection is based on the area of the coil perpendicular to the direction of air flow (calledface area), number of rows of tubes in the direction of air flow, fin spacing, airflow ratethrough the coil, and refrigerant temperature. Table 3.28 summarizes the effect of thesefactors on refrigeration system performance. Manufacturers provide data on the effectsof these factors on performance of their equipment.
Evaporators operating below 0◦C build up frost that must be removed to maintaingood heat-transfer efficiency. Defrosting may be done by periodically flooding the coilswith water, by electric heaters, by directing hot refrigerant gas to the evaporators, or bycontinuously defrosting with a brine or glycol solution. In storages with air temperaturesabove 2◦C frost can be melted by shutting off the refrigerant supply and letting the roomair heat the evaporator.
CompressorsThe most common types of refrigeration compressors are reciprocating (piston) and
screw (Fig. 3.31). Reciprocating compressors come in a wide range of sizes and can beset up to operate efficiently at varying refrigerant flow rates. Rates are varied by shuttingoff pairs of cylinders in a unit that may have 6 to 12 cylinders. The main disadvantage ofreciprocating compressors is their fairly high maintenance costs, although maintenanceoften can be done in onsite. Screw compressors have low maintenance costs but are notavailable in sizes smaller than about 23 kW (30 hp) and do not operate efficiently atpartial loading. Some facilities use screw compressors for base-load refrigerant needsand reciprocating compressors for the portion of the load that varies significantly duringthe day.
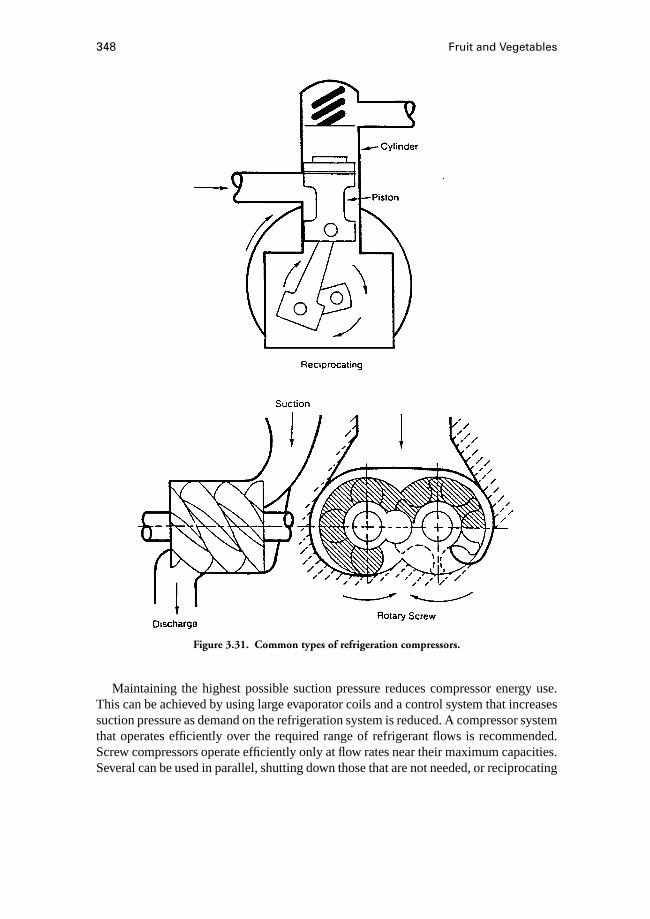
348 Fruit and Vegetables
Figure 3.31. Common types of refrigeration compressors.
Maintaining the highest possible suction pressure reduces compressor energy use.This can be achieved by using large evaporator coils and a control system that increasessuction pressure as demand on the refrigeration system is reduced. A compressor systemthat operates efficiently over the required range of refrigerant flows is recommended.Screw compressors operate efficiently only at flow rates near their maximum capacities.Several can be used in parallel, shutting down those that are not needed, or reciprocating

Cold-Storage Systems 349
Table 3.29. Comparison of Refrigerants
Latent FlowOzone- Heat at Leaving
Depletion 15◦C Evaporator Coefficient ofPotential Cost (kJ · kg−1) (L · s−1 · kW−1) Performance Flammability
R-12∗ 1.0 — — — — —R-22 0.55 Moderate 216 0.48 4.66 NoR-134a 0 High 208 0.82 4.60 NoR-507 0 Not available 175 0.45 4.31 Not availableR-717 Not- Very low 1313 0.46 4.77 Moderate(ammonia) available
∗ The properties are not listed because the refrigerant is no longer available.Source: [5].
compressors can be used for peak loads, because they operate efficiently over a largerange of refrigerant flows.
CondensersCondensers are categorized as air-cooled, water-cooled, or evaporative. Air-cooled
condensers are inexpensive and have low maintenance cost but often cause higher energyuse compared with the other choices. Small systems usually use an air-cooled unit. Manyhome refrigerators, for instance, have a coiled tube in the back that allows a natural draft ofair to flow past. Systems with a few kilowatts of motor power use a fan to provide airflowpast the condenser. Large condensers are more likely to be water-cooled. Water is a betterheat conductor than air, allowing water-cooled condensers to be smaller than forced-airunits of equal capacity. However, water-cooled units may require large quantities ofwater, which can be expensive to obtain and dispose of. Evaporative condensers reducewater consumption by recycling the heated condenser water; they require close attentionto water quality to maintain efficiency and to prevent damage to the heat exchanger.
Energy use is minimized by selecting a condenser that cools the refrigerant fluidto as low a temperature as possible. For example, a facility maintaining 0◦C and acondensing temperature of 52◦C requires 50% more power than one that operates ata condensing temperature of 35◦C. In warm areas, well water–cooled or evaporativelycooled condensers should be selected over air-cooled units.
RefrigerantsAmmonia and a number of halocarbon fluids are commonly used refrigerants. Some
of the properties of the most common refrigerants are listed in Table 3.29. Refrigerant12 (R-12) has been classified as an atmospheric ozone-depleting chemical and soon willbe unavailable.
The choice of which refrigerant to use in a vapor recompression system is based onthe following factors:
CostHalocarbon refrigerants are more expensive than ammonia, and R-134a is significantly
more costly than ammonia.
350 Fruit and Vegetables
EfficiencyUnder standard operating conditions ammonia is slightly more efficient than the
halocarbon refrigerants as measured by coefficient of performance. Its latent heat ismuch higher than the halocarbons, meaning that less pumping energy is required.
FlammabilityAmmonia is moderately flammable, and large systems must be designed to allow
good fire control. Refrigerants 22 and 134a are basically not flammable.
CompatibilityAmmonia cannot be used with metals that contain copper; halocarbon refrigerants
cannot be used with alloys containing more than 2% magnesium and may damage someelastomeric materials.
ToxicityAmmonia at very low concentrations can injure perishable commodities. It is toxic to
humans, and some governments require ammonia systems to have equipment to confineaccidental releases and a plan for protecting personnel and neighbors from an accidentalrelease.
Refrigerant Piping and VesselsPiping is used to transfer refrigeration liquid or vapor from one component to the
another. Piping size is based on the volume handled and the acceptable fluid velocity inthe pipe. For example, vapor piping is larger than piping for liquid refrigerant. A large-diameter pipe reduces fluid velocity and therefore reduces pressure drop and increasesplant efficiency, but it is more expensive than a smaller pipe. Pipe selection also mustallow for the need to transport oil and to permit or prevent liquid flow in a pipe that hasboth liquid and vapor. Vessels are needed in large operations to store liquid refrigerantand separate mixtures of liquid refrigerant and vapor.
Control SystemsA large refrigeration system requires a good control system and equipment for dis-
playing the system’s operating condition. At a minimum, panel lights should be installedto indicate the operating status of fans and compressors, and the fluid levels in surge andreceiver tanks. Controls should be set up to allow manual operation of motors.
Microcomputers and programmable controllers allow even more precise control oflarge refrigeration systems. They are especially valuable in reducing electricity useduring peak-rate periods. Defrost cycles can be programmed to take place at night,and unnecessary fans and compressor motors can be turned off during peak-rate periods.
3.4.4 Absorption Refrigeration
Absorption refrigeration is used in a few cold-storage operations. It differs frommechanical refrigeration in that the vapor is recovered through use primarily of heatrather than of mechanical power. It is less energy-efficient than mechanical refrigerationand usually is used only where an inexpensive source of heat is available. Processingfacilities with excess low-pressure steam are well suited to absorption refrigeration.

Cold-Storage Systems 351
3.4.5 Secondary Refrigerants
Some storages are cooled with a secondary coolant. A brine solution, either sodiumchloride, calcium chloride, or glycols (commonly propylene glycol or ethylene glycol),is cooled by a mechanical refrigeration system and pumped to heat exchangers in thecold storage. These systems are a little less energy-efficient than conventional systems,and brine solutions are corrosive, but they dramatically reduce the quantity of first-stage refrigerant needed and confine it to the compressor room. This is a great assetin dealing with the flammability and safety issues of ammonia. Secondary-refrigerantpiping does not need to withstand the pressure of primary refrigerants, and this mayallow plastic piping to be used. Heat-exchanger temperature can be controlled preciselywith a mixing valve. Brines and glycol solutions are corrosive; they must be used withcorrosion inhibitors and should never be in contact with zinc. Sodium chloride andpropylene glycol are food-grade materials.
3.4.6 Refrigeration Load Calculations
Information on peak heat load is needed to size refrigeration components. Thesecalculations are based on extreme heat-load assumptions so that equipment will depend-ably maintain temperature. Designers add about 10% to 20% extra refrigeration capacityabove their calculations to ensure that the equipment will perform well even under un-foreseen circumstances. In multiroom facilities, a calculation is done for each room toselect an evaporator and piping. Compressor and condenser capacities are based on peakload contribution from all rooms, which is usually less than the sum of the peak loads foreach individual room, because the rooms are not all exposed to peak loads at the sametime.
Heat-load calculations also can be used to estimate total energy use of the facility, per-haps for financial-planning purposes. These calculations are based on average conditionsduring each week or month of operation.
The heat load to which a refrigeration system is exposed is based on adding all the heatinputs to a storage area. These include heat conducted through walls, floor, and ceiling;field and respiration heat from the product; sensible and latent heat from air infiltration;defrost heat; and heat from personnel and equipment such as lights, fans, and forklifts.A typical range of refrigeration load for a produce storage is 9.9 to 13.7 kW per 1000 m3
(0.08 to 0.11 ton per ft3) and for a shipping dock is 13.7 to 25 kW per 1000 m3 (0.11 to0.20 ton per ft3) [5]. Procedures for detailed heat load calculations are given in refs. [2]and [5].
Refrigeration equipment for storage facilities usually is not designed to remove muchfield heat from the product because a large capacity is required; a separate cooling facilityusually is used for this purpose [6].
3.4.7 Alternative Refrigeration Sources
In many developing countries, where mechanical refrigeration is prohibitively ex-pensive to install, maintain, and operate, a number of other techniques can be used toproduce refrigeration. In some cases these can provide nearly the recommended storage
352 Fruit and Vegetables
conditions. In others, they are a compromise between proper storage conditions and costsfor equipment, capital, and operations.
Evaporative CoolingEvaporation of water requires heat. Evaporative-cooling systems extract this heat from
the product. Evaporative-cooling techniques are very energy-efficient and economical[7]. A well-designed evaporative cooler produces air with a relative humidity greaterthan 90%. Its main limitation is that it cools air only to the wet-bulb temperature ofthe outside air. During the harvest season in the United States, wet-bulb temperaturesvary from 10 to 25◦C depending on location, time of day, and weather conditions. Thistemperature range is acceptable for some chilling-sensitive commodities.
The water for cooling in the systems mentioned previously comes from domesticsources. It is also practical to cool by evaporating water from the commodity. Snapbeans have been cooled in transit by erecting an air scoop above the cab of the truck thatforces outside air through a bulk load of beans [8]. This system prevents heat build-upand keeps the beans at or below the outside air temperature. Using this system for anygreat length of time may result in excessive water loss.
Night CoolingIn some parts of the world, significant differences between night and day temperatures
allow nighttime ventilation to be a means of refrigeration. In dry Mediterranean or desertclimates the difference between daily maximum and minimum temperatures can be asgreat as 22◦C during the summer. Night cooling is commonly used for unrefrigeratedstorage of potatoes, onions, sweet potatoes, hard-rind squashes, and pumpkins. As arule, night ventilation effectively maintains a given product temperature if the outsideair temperature is below the desired product temperature for 5 to 7 hours per day.
Low nighttime temperatures can be used to reduce field heat simply by harvestingproduce during early-morning hours. Some growers in California use artificial lightingto allow night harvest.
It is theoretically possible to produce air temperatures below nighttime minimums byradiating heat to a clear sky. A clear night sky is very cold, and a good radiating surfacesuch as a black metal roof can cool air below ambient temperature. Simulations haveindicated that this method could cool air about 4◦C below night air temperatures. Thisconcept has not yet been used widely.
Well WaterIn some areas, well water can be an effective source of refrigeration. The temperature
of the ground more than about 2 m below the surface is equal to the average annual airtemperature. Well water is often very near this temperature.
Naturally Formed IceBefore the development of mechanical refrigeration, refrigeration was provided by
natural ice harvested from shallow ponds during the winter. The ice was stored in strawand hauled to cities as needed during spring and summer. Energy costs today makeit unfeasible to transport ice any significant distances. However, cooling facilities in

Cold-Storage Systems 353
appropriate climates can store ice nearby for summer use. In some cases, it may befeasible to transport perishable commodities to the ice for storage. This would be es-pecially practical where the ice is located between the sites of production and con-sumption.
High-Altitude CoolingHigh altitude also can be a source of cold. As a rule of thumb, air temperatures decrease
by 10◦C with every kilometer (5◦F per 1000 ft) increase in altitude. It is not possibleto bring this air down to ground level because it naturally heats by compression as itdrops in altitude. However, in some cases it may be possible to store commodities at highaltitudes in mountainous areas. For example, in California most perishable commoditiesare grown in the valley floors near sea level. However, much of the production is shippedeast across the Sierra Nevada over passes about 1800 m high. Air temperature has thepotential of being 18◦C cooler, and it may reduce energy costs to store perishables thererather than on the valley floor.
Underground StorageCaves, cellars, abandoned mines, and other underground spaces have been used for
centuries for storage of fruits and vegetables. As mentioned previously, undergroundtemperature is near the average annual air temperature. Underground spaces work wellfor storing already cooled produce but not for removing field heat. The soil has a poorability to transfer heat. Once the refrigeration effect is depleted from an area, it does notregenerate rapidly. This can be overcome by installing a network of buried pipes aroundthe storage. Cooled air is pumped from the pipes to the storage area, allowing the harvestof cooling capacity from a greater soil volume.
3.4.8 The Storage Building
SizeThe storage must be sized to handle peak amounts of product. The floor area can be
calculated knowing the volume of the produce and dividing by the maximum productstorage height and adding area for aisles, room for forklift maneuvering, and stagingareas. Maximum storage height can be increased by use of shelves or racks and forkliftswith suitable masts. Multistory structures generally are not used because of the difficultyand expense of moving the product between levels.
The building ideally should have a floor perimeter in the shape of a square. A rectangu-lar configuration has more wall area per unit of floor area, resulting in higher constructioncost and higher heat loss compared with a square configuration. Entrances, exits, andstorage areas should be arranged so that the product generally moves in one directionthrough the facility, especially if the storage facility is used in conjunction with a coolerto remove field heat.
Site SelectionGood utility service must be available for the facility. Extending roads and energy
utilities to a facility can be very expensive. Three-phase electrical power is needed to
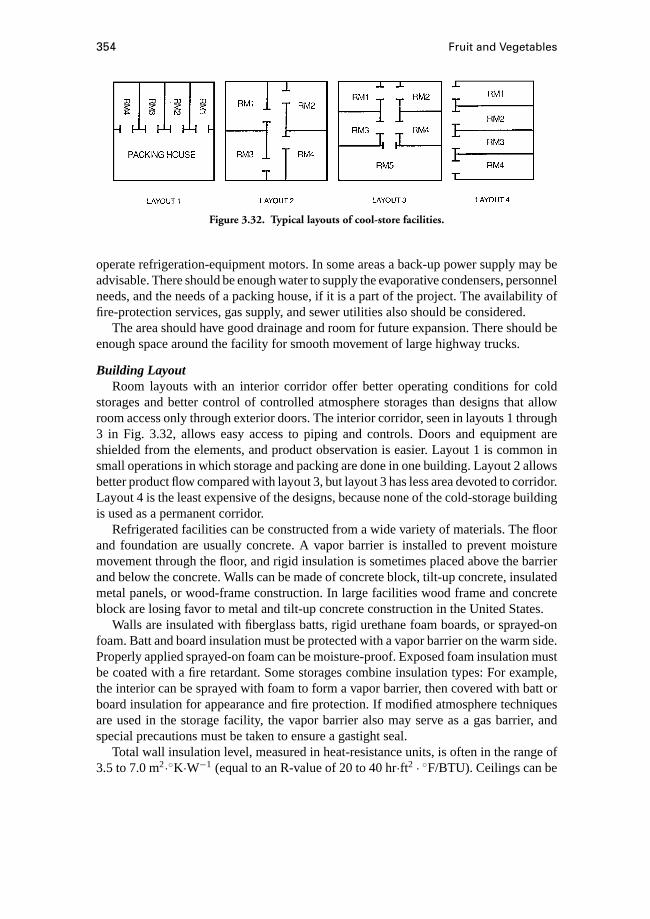
354 Fruit and Vegetables
Figure 3.32. Typical layouts of cool-store facilities.
operate refrigeration-equipment motors. In some areas a back-up power supply may beadvisable. There should be enough water to supply the evaporative condensers, personnelneeds, and the needs of a packing house, if it is a part of the project. The availability offire-protection services, gas supply, and sewer utilities also should be considered.
The area should have good drainage and room for future expansion. There should beenough space around the facility for smooth movement of large highway trucks.
Building LayoutRoom layouts with an interior corridor offer better operating conditions for cold
storages and better control of controlled atmosphere storages than designs that allowroom access only through exterior doors. The interior corridor, seen in layouts 1 through3 in Fig. 3.32, allows easy access to piping and controls. Doors and equipment areshielded from the elements, and product observation is easier. Layout 1 is common insmall operations in which storage and packing are done in one building. Layout 2 allowsbetter product flow compared with layout 3, but layout 3 has less area devoted to corridor.Layout 4 is the least expensive of the designs, because none of the cold-storage buildingis used as a permanent corridor.
Refrigerated facilities can be constructed from a wide variety of materials. The floorand foundation are usually concrete. A vapor barrier is installed to prevent moisturemovement through the floor, and rigid insulation is sometimes placed above the barrierand below the concrete. Walls can be made of concrete block, tilt-up concrete, insulatedmetal panels, or wood-frame construction. In large facilities wood frame and concreteblock are losing favor to metal and tilt-up concrete construction in the United States.
Walls are insulated with fiberglass batts, rigid urethane foam boards, or sprayed-onfoam. Batt and board insulation must be protected with a vapor barrier on the warm side.Properly applied sprayed-on foam can be moisture-proof. Exposed foam insulation mustbe coated with a fire retardant. Some storages combine insulation types: For example,the interior can be sprayed with foam to form a vapor barrier, then covered with batt orboard insulation for appearance and fire protection. If modified atmosphere techniquesare used in the storage facility, the vapor barrier also may serve as a gas barrier, andspecial precautions must be taken to ensure a gastight seal.
Total wall insulation level, measured in heat-resistance units, is often in the range of3.5 to 7.0 m2·◦K·W−1 (equal to an R-value of 20 to 40 hr·ft2 · ◦F/BTU). Ceilings can be
Cold-Storage Systems 355
insulated with rigid board or foam materials, or built separately from the roof and insu-lated with loose fill or batts. Ceiling heat resistance of at least 10.6 m2 · ◦K·W−1 (R60)is common in new construction. In general, it is advisable to build with more insulationthan utility costs presently may warrant, because energy costs are difficult to predictand it is much cheaper to install insulation during construction than after construction iscompleted.
Sun shining on walls and roof can dramatically increase the effective outside tem-perature of a wall, increasing heat flow into a storage facility. A dark, flat roof can be42◦C warmer than the outside air temperature. Painting a south-facing wall a light colorcan reduce the effective wall temperature by 11◦C compared with a dark wall. Walls androof of a cold-storage facility should be painted a light color or shaded from the directsun.
Warm outside air leaking into the cold storage room increases energy use. Plastic flapdoors reduce infiltration during loading and unloading. Sealant should be placed aroundopenings for pipes and electrical conduits. Loading docks for out-bound product shouldbe fitted with flexible bumpers that provide an airtight seal between the dock and thetruck.
High-efficiency lighting sources, such as metal halide lamps, reduce heat input to thecold storage, and turning off lights when not needed reduces unneccessary heat load.
3.4.9 Other Options for Small-Scale Cold Rooms
Cold rooms for small-scale operations can be purchased from commercial suppliers,self-built, or made from used refrigerated equipment such as rail cars, marine containers,or highway vans [9]. The choice of the best system is based on cost and availability ofequipment in the area and the amount of time available to invest in cold-room installation.
Rail CarsRefrigerated rail cars are sometimes available for farm use. They are very sturdy and
well insulated. Refrigeration is driven by an electric motor powered by a diesel generator.The generator set can be salvaged and the refrigeration connected to the farmer’s electricutility. Railcars in the United States have a 2.84 m–high ceiling, which limits the heightto which produce can be stacked. The most significant problem and greatest cost of usingrailcars is getting them from the railroad to the farm site.
Highway VansThe one unique advantage of highway vans is that they are portable if the wheels are
left on. The refrigeration system is powered directly with a diesel engine. This can bea benefit if utility electricity is not available at the site. In some areas, it may be lessexpensive to operate the refrigeration unit if it is converted to operate with an electricmotor, but a considerable conversion cost must be added to the project. Highway vansare built as light as possible to maximize the load they can carry; this often means thatused vans are in fairly poor condition. Their insulation, which is limited to begin with,may have deteriorated, and they may have poorly sealed doors that permit excess airleakage. Also, old vans often have fairly small fans that may not provide adequate aircirculation.
356 Fruit and Vegetables
Marine ContainersThese are available in lengths of 6.1, 7.3, and 12.2 m (20, 24, and 40 ft). Their built-in
refrigeration units are powered with 220- or 440-V, three-phase electricity, and they canbe plugged directly into utility power. They are usually well built and have deep T-beamfloors and sufficient fan capacity to provide good air circulation; in fact, air circulationis good enough to allow adequate room cooling.
A disadvantage of all transport vehicles is that their refrigeration systems usuallyare not designed to produce high relative humidity. Drying of the product due to lowhumidity results in weight loss and poor quality. This is particularly a problem if the coldroom is to be used for long-term storage. Drying can be reduced by keeping the floorand walls of the cold room wet, but this causes increased corrosion, reduced equipmentlife, and increased need for defrosting.
Refrigerated transport vehicles rarely have enough refrigeration capacity to cool pro-duce rapidly. If rapid cooling is needed, extra capacity must be added. Moreover, trans-portation vehicles are too narrow for the frequent product movement needed in a precool-ing facility. A separate self-constructed room is much more convenient for precoolingoperations.
Self-Constructed Cold RoomsFor many producers, a self-built cold room is the least expensive option. It usually is
built with a concrete or wood-frame floor. Walls and roof are of wood-frame constructionand insulated with fiberglass batts. Care must be taken to install a tight vapor barrieron the warm side of the insulation. Refrigeration is provided by a small mechanicalrefrigeration system. If the room is kept above 10◦C, it may be possible to use a roomair conditioner. These cost about half as much as a packaged refrigeration system.
3.4.10 Controlled-Atmosphere Storage
Controlled-atmosphere (CA) storage utilizes oxygen and carbon dioxide concentra-tions of about 1% to 5% for each gas. Normal room air has an oxygen concentration ofabout 21% and a carbon dioxide level near 0.03%. Low oxygen and high carbon dioxidelevels slow ripening processes, stop the development of some storage disorders (such asscald in apples), and slow the growth of decay organisms. All of these effects increasestorage life of fresh produce compared with refrigerated air storage. More details aboutthe potential benefits and hazards of CA storage are presented in Section 3.2. CA stor-age has all of the design requirements of conventional refrigerated storage plus gastightrooms, equipment to obtain the desired gas concentrations, and equipment to measureand control atmospheric composition [10].
Simple CA SystemThe simplest system for obtaining gastight storage uses a plastic tent inside a con-
ventional refrigerated storage room. The tent is made of 0.10- to 0.15-mm polyethylenesheeting supported by a wood framework. The sheeting is sealed to the concrete floorby pressing the plastic into a narrow trough and forcing tubing into the trough to keepthe plastic in place. A better gas barrier at the floor can be obtained by laying a sheetof plastic on the floor and protecting it with wood panels. A seal is obtained by joining
Cold-Storage Systems 357
the tent to the floor sheet. A fan inside the tent provides air circulation. The oxygenlevel is reduced initially by allowing fruit respiration to consume oxygen, or by usingCA generators. Oxygen is kept above the minimum by allowing a controlled amountof outside air to enter the tent. The CO2 level is maintained by placing bags of freshhydrated lime in the tent to absorb excess CO2.
Permanent CA FacilitiesPermanent facilities require that the storage plant be designed specifically for con-
trolled atmosphere storage. Usually a CA facility costs about 5% more to build than aconventional refrigerated storage facility. The extra cost is in building the storage roomsto be airtight and, in some cases, designing smaller individual rooms than are needed incommon refrigerated storage.
Individual rooms should be sized to allow them to be filled in a short time. Manyapple CA rooms are built to hold a week’s fruit harvest. If an operator wishes to userapid CA, the room should be small enough to be filled in 3 days. Many facilities haveseveral room sizes to allow for variations in incoming fruit volume, fruit varieties, andmarketing strategy.
Modern storages are single-story designs, with individual rooms often tall enough toallow fruit to be stacked 10 bins high, including enough height between the bins and theceiling for air from the evaporator coils to mix with the room air and to travel easily tothe far end of the room.
Gas-Tight ConstructionFloors and doors are designed to maintain gastightness. Three main types of interior
wall and ceiling construction are used in recently built CA storages.
Urethane SystemUrethane foam serves as a gas seal, insulation, and vapor barrier. But it is expensive,
primarily because the urethane must be covered with a fire barrier. Foamed-in-placeurethane can be applied directly to any type of masonry, wood, or primed metal. Itshould not be applied over rigid board insulation as the foam can distort the board,and board materials that are not tightly attached cause the gas seal to fail over time.Figure 3.33 shows a cross-section of a typical CA storage sealing system with urethane-foam insulation.
Plywood Cover Over Fiberglass InsulationThis is a common method of insulating and sealing CA storages. It is usually the least
expensive of the three gas-barrier systems. The plywood sheets are sealed with a butylrubber compound applied between the sheet and the wood framing. Sheets are separatedwith a 3-mm gap to allow for expansion. The gap is filled with butyl rubber and thejoint covered with fabric and an elastomeric sealer. If regular plywood is used, the wholeboard must be covered with the sealer. High-density plywood does not need to be treatedfor gastightness.
A vapor barrier usually is installed on the outside (warm side) of the insulation.However, an outside vapor barrier is not recommended with the plywood system, becausethere is already a gastight seal on the inside of the insulation. A vapor barrier on the
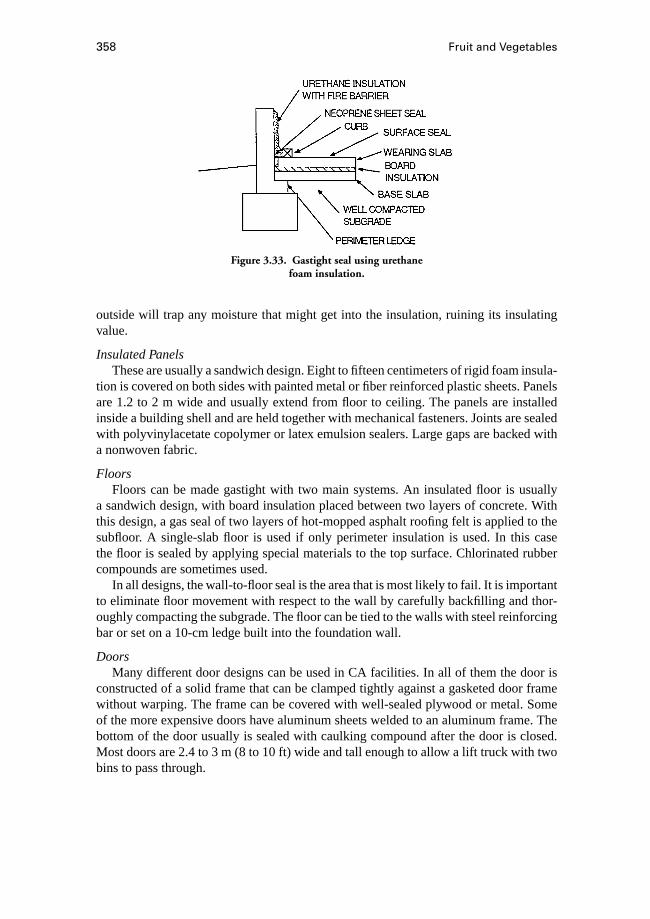
358 Fruit and Vegetables
Figure 3.33. Gastight seal using urethanefoam insulation.
outside will trap any moisture that might get into the insulation, ruining its insulatingvalue.
Insulated PanelsThese are usually a sandwich design. Eight to fifteen centimeters of rigid foam insula-
tion is covered on both sides with painted metal or fiber reinforced plastic sheets. Panelsare 1.2 to 2 m wide andusually extend from floor to ceiling. The panels are installedinside a building shell and are held together with mechanical fasteners. Joints are sealedwith polyvinylacetate copolymer or latex emulsion sealers. Large gaps are backed witha nonwoven fabric.
FloorsFloors can be made gastight with two main systems. An insulated floor is usually
a sandwich design, with board insulation placed between two layers of concrete. Withthis design, a gas seal of two layers of hot-mopped asphalt roofing felt is applied to thesubfloor. A single-slab floor is used if only perimeter insulation is used. In this casethe floor is sealed by applying special materials to the top surface. Chlorinated rubbercompounds are sometimes used.
In all designs, the wall-to-floor seal is the area that is most likely to fail. It is importantto eliminate floor movement with respect to the wall by carefully backfilling and thor-oughly compacting the subgrade. The floor can be tied to the walls with steel reinforcingbar or set on a 10-cm ledge built into the foundation wall.
DoorsMany different door designs can be used in CA facilities. In all of them the door is
constructed of a solid frame that can be clamped tightly against a gasketed door framewithout warping. The frame can be covered with well-sealed plywood or metal. Someof the more expensive doors have aluminum sheets welded to an aluminum frame. Thebottom of the door usually is sealed with caulking compound after the door is closed.Most doors are 2.4 to 3 m (8 to 10 ft) wide and tall enough to allow a lift truck with twobins to pass through.

Cold-Storage Systems 359
Figure 3.34. Schematic of water-trap pressure-relief system.
Each room also should have a 60 by 75 cm access door that allows for entry forchecking fruit and making repairs without opening the main door. Many storages alsohave a fixed, clear acrylic window near the top of a wall to observe fruit without enteringthe room. It usually has a concave shape, allowing all areas of the room to be seen.
Pressure ReliefA pressure difference between the cold room and the outside can develop because of
changes in weather or room temperature. This difference can damage gas seals or eventhe building structure if it is not relieved. A water trap as pictured in Fig. 3.34 is usuallyused to allow pressures to equalize. The trap is often filled with ethylene glycol to avoidproblems with water evaporation. A spring-loaded or weight-loaded check valve can beused, but these are much more expensive than a simple water trap. Vent area should be10 cm2 per 40 m3 of room volume (1 in2 per 1000 ft3).
Small changes in pressure can be relieved by using breather bags. These have theadvantage of capturing the gas mixture in the room and allowing it to reenter the roomat a later time. Bags should have 0.35 to 0.4 m3 of capacity per 100 m3 of room volume(3.5–4 ft3/1000 ft3), although some are designed with several times this capacity. If aCA room is so tightly sealed that air must be regularly bled into the room to maintainO2 level, breather bags are not necessary.
Pressure TestThe overall gastightness of a CA room is tested by pressurizing it and measuring the
rate of pressure drop. After all doors and openings are sealed, a small fan is used toincrease the static pressure in the room to 2.5 cm of water column. The fan then is turnedoff and sealed, and the tester determines how long it takes for the pressure to drop byhalf. If this takes 20 minutes or longer, it is considered tight enough for a CA system thatuses hydrated lime to maintain CO2 levels. At least 30 minutes are required for roomsthat use carbon or water scrubbers to control CO2. Some authorities believe that roomsshould be even more gastight than these standards and require 45 minutes to 2 hours forthe pressure to drop by half. Because gas seals deteriorate, new rooms should be muchtighter than prevailing standards.

360 Fruit and Vegetables
If the room does not meet the desired standard it is necessary to check for leaks.They are most common around doors, at the wall and floor junctions, near poorly sealedpenetrations, and at unsealed electrical boxes. Testing for leaks can be done by puttingthe room under a slight vacuum and listening for air leaking, or by spraying suspect areaswith soapy water and watching for bubbles. Smoke sticks or bee smokers can be used todetect streams of outside air entering the room.
3.4.11 Equipment for Atmospheric Modification
The least expensive but slowest method of changing the storage-room atmosphere isto let the product do it through natural respiration. Fruit and vegetables use oxygen andrelease carbon dioxide. The product in a sealed room eventually lowers the oxygen tothe level needed for CA storage; if oxygen drops too low, outside air can be added torestore it to the desired level. However, respiration usually causes carbon dioxide levelsto rise well above required levels. Bags of hydrated lime are used to absorb excess CO2.Lime requirements are 1 to 3 kg per 100 kg of product, depending on the product beingstored, storage time, surface area, and quality of the lime. Bags can be placed eitherin single layers in the CA room or in an adjacent lime room that is connected to theCA room with a fan and ductwork. Rooms should be sized to hold about 15 kg of limeper ton of product. Lime is very effective in producing the low levels of CO2 that areincreasingly used in apple storage.
Carbon dioxide levels also can be controlled with activated-carbon adsorption sys-tems, or molecular sieves. Molecular sieves tend to use more energy than activated-carbonsystems.
Relying on product respiration to remove oxygen is fairly slow, and the productstorage life can be increased if the oxygen is removed faster. Some operations purgethe CA room with nitrogen, purchased in liquid form or produced on site. One typeof nitrogen generator uses ammonia in a combustion process to consume oxygen andproduce nitrogen and water. Two other systems use a molecular-sieve process (pressure-swing adsorption system) or semipermeable membrane to remove oxygen. Machinesthat remove oxygen by combustion of natural gas or propane all produce carbon diox-ide, which must be removed by another process. Incomplete combustion in these ma-chines has caused explosions in CA rooms and carbon monoxide poisoning ofworkers.
3.4.12 Monitoring Equipment
Oxygen and carbon dioxide levels must be monitored daily to ensure that theyare within prescribed limits. Traditionally, operators have used a time-consuming wet-chemistry system. Automatic equipment now is used widely. It is more accurate thanthe traditional system, provides a log of the data, and can be connected to a controller tomaintain proper gas concentrations automatically.
Temperature also should be monitored regularly. A minimum of two calibrated dialthermometers should be installed in each room. One should be near eye level, with the
Cold-Storage Systems 361
dial located on the outside of the room. The other should be above the fruit and read-able through an observation window near the ceiling. Electronic thermometers alloweasier observation of room temperature, and the data can be printed out easily for apermanent record of operating conditions. Most new storages in the United States usefour probes (or more) per room. Some probes also can placed into bins to monitor fruittemperatures.
3.4.13 Safety Considerations
The atmosphere in CA rooms will not support human life, and people have diedof asphyxia while working in CA rooms without breathing apparatus. A danger signshould be posted on all doors. The access hatch in the door should be large enough toaccommodate a person equipped with breathing equipment. At least two people withbreathing equipment should work together at all times, one inside and one outside theroom watching the first person. The room must be thoroughly purged with outside airbefore entering without self-contained breathing apparatus.
3.4.14 Refrigeration Equipment
Refrigeration equipment for CA facilities is the same as for any other cold storageoperation. Most CA storages are designed to maintain 0◦C at 95% relative humidity.
References
1. Dellino, C. V. J., ed. 1990.Cold and Chilled Storage Technology. New York: VanNostrand Reinhold.
2. American Society of Heating, Refrigeration, and Air-Conditioning Engineers. 1986.ASHRAE Handbook Series(4 books). Atlanta, GA: Author.
3. Kroca, R. W., and M. L. Hellickson. 1993. Energy savings in evaporator fan-cycledapple storages.Appl. Engrg.9:553–560.
4. Stoecker, W. F. 1988.Industrial Refrigeration. Troy, MI: Business News.5. Stoecker, W. F. 1995.Industrial Refrigeration, vol II. Troy, MI: Business News.6. Thompson, J. F., F. G. Mitchell, T. R. Rumsey, R. F. Kasmire, and C. H. Crisosto.
1998. Commercial cooling of fruits, vegetables and cut flowers. University ofCalifornia DANR publication 21567.
7. Thompson, J. F., and R. F. Kasmire. 1981. An evaporative cooler for vegetable crops.Calif. Agric. 35(3&4):20–21.
8. Wilhelm, L. R. 1979. Forced ventilation cooling of commercial snap bean shipments.ASAE paper no. 79–6518, St. Joseph, MI: ASAE.
9. Thompson, J. F., and M. Spinogolio. 1996. Small-scale cold rooms for perish-able commodities. University of California Division of Agriculture and NaturalResources Leaflet 21449.
10. Waelti, H., and J. A. Bartsch, 1990. Controlled atmosphere storage facilities. InFoodPreservation by Modified Atmospheres, ed. M. Calderon and R. Barkai-Golan, pp.373–389. Boca Raton, FL: CRC Press.
362 Fruit and Vegetables
3.5 Processing of Fruit and VegetablesD. J. Hilton
3.5.1 Processing Options
A very wide range of techniques is applied to the processing of fruit and vegetables.Some commonly are used for many types of horticultural produce; a few techniques areunique to one or two types only. It must also be remembered that by various processes(sometimes integrated, sometimes not) one type of fruit or vegetable may yield manydifferent products. Thus mangoes can be canned, dried, frozen, or made into puree,sauce, chutney, pickles, concentrate, jam, edible “leather,” beverages, nectar, and panna.Papaya provides jam, pickles, chutney, nectar, toffee, pectin, and also papain, an im-portant protein-hydrolyzing enzyme used in the pharmaceutical, textile, paper-making,food, and animal-feed industries. Coconut can be processed to produce oil, milk, cream,desiccated coconut, pie fillers, soft cheese, meal, jam, soap, vinegar, nata de coco, toddy,and additives for lubricants and printing inks; the husk and shell can yield fiber andactivated charcoal. Because of the large number of products, there is insufficient spacehere for a comprehensive treatment. This section therefore describes briefly the morecommon processes and those processes that pertain to some of the more significantproducts.
3.5.2 Blanching and Lye-Solution Treatment
Blanching is a process that almost always is carried out prior to canning or freezingvegetables. It also is used for a few types of fruit. It involves dipping the vegetables orfruits into boiling water or suspending them in steam for 1.5 to 3 minutes. This processcan achieve a number of objectives. First, it kills microorganisms on the surface and inthe case of green vegetables destroys the catalase enzyme and inhibits the peroxidaseenzyme, both of which can produce off odors and flavors in storage. Second, it removesair from intercellular spaces (assisting in the formation of a head-space vacuum in cans)and softens tissues to facilitate filling containers. Sometimes, nutrient losses duringsteam blanching are reduced by a preconditioning (drying) process in which the food isexposed to warm air at 65◦C [1]. Blanching may or may not help to preserve the color ingreen vegetables. Sometimes, blanching should be done at temperatures below 100◦C.For instance, spinach blanched at 100◦C loses some color, but when it is blanched at77◦C for 6 minutes, its color is fixed and is retained even after subsequent heating to100◦C. Blanching also is used to crack and loosen the skins of tomatoes, sweet potatoes,and beets prior to peeling.
Boiling lye solution (0.5%–1.5% sodium hydroxide) is used as a more vigorousmeans of peeling and cracking skins. Prunes are prepared by dipping in lye solution for30 seconds to crack skins in order to facilitate drying. Peaches are peeled by immersionin lye solution for 1 to 2 minutes, while potatoes are immersed for 6 to 8 minutes. Inboth cases, this is followed by blanching.
Processing of Fruit and Vegetables 363
3.5.3 Canning
Almost every type of fruit and vegetable is canned somewhere in the world, andin industrialized societies the canning process is associated with processed fruit andvegetables perhaps more than any other. In the case of some crops a greater tonnage iscanned than is eaten fresh. For instance, in the United States over 50% of the peach andapricot crop is canned, and the same can be said of the bean crop in Europe. Most ofthe pineapple produced in a number of countries goes into cans. Canning is extremelyvaluable, because it enables fruit and vegetables of the customer’s choice to be consumedyear-round without the need for refrigeration. It also allows products to be exported thatcould not be exported in fresh form due to transport limitations or quarantine regulations.Because the can prevents the reentry of microorganisms completely, the life of the product(even at ambient temperature) can be several years, provided the integrity of the seal ismaintained. In addition to the packaging of the sliced or whole product, canning also isused as a means of packaging purees, nectars, juices, and beverages.
The canning process involves cutting, washing, blanching, and then hot-loading intothe can (which is usually made from tin-plated steel), which is then sealed. The can isthen held at a prescribed temperature for a given time to ensure that all microorganismsare killed, before being quickly cooled. Some products are semicooked before canning;others receive only the blanching or heat treatment to bring them up to the filling tem-perature for canning (typically 85◦C). After the can is sealed, it is heat-treated, usuallyby immersion in boiling water or in a pressurized steam retort [2].
3.5.4 Freezing
Freezing is a very popular and effective means of preserving many types of veg-etable and needs little description. Prior to freezing, vegetables are normally blanched.Although some cut and sliced fruits are frozen commercially (e.g., apricots), freezing isgenerally not very effective for cut fruit because the fruit is susceptible to browning andoxidation upon exposure to air. However, some whole fruits such as berries are frozensatisfactorily.
3.5.5 Dehydration and Desiccation
Drying and SulphuringDrying is one of the oldest food processing and preservation techniques known to
man. Dried fruits in particular constitute a large and growing industry worldwide. Theessential feature of the process is to reduce the moisture content to a point at whichenzymatic or microbial damage no longer occurs.
Fruits (e.g., apricots, peaches) are halved and pitted and then laid out by hand onwooden or plastic trays. Before they are placed in the sun to dry, or put into a high-temperature drier, many fruits are first treated with sulphur dioxide, a process known assulphuring. The SO2 taken up by the fruit displaces the air from the tissue, softens cellwalls so that drying occurs more easily, destroys enzymes that might darken the color,and actually produces some color enhancement. The SO2 usually is produced by burning
364 Fruit and Vegetables
sulphur at the inlet to a sulphuring chamber or cabinet in which the trays are stacked.Most countries prescribe legal limits for the level of SO2 in dried fruits, commonly 2000mg per kilogram (2000 ppm). With some varieties of plums, it is necessary to allow someinitial “wilting” in the shade before exposing them to strong sunlight, to avoid “boiling.”
In the case of solar drying, a moisture content of 15% normally has to be achievedbefore the product can be packed. High-temperature drying is an alternative, or a combi-nation of the two often is used. For instance, in the case of apricots, one day’s exposureto the sun prior to high temperature drying at 50 to 60◦C can be beneficial in impartinga sun-dried appearance.
To maintain maximum quality, dried fruits should preferably be stored at 10 to 15◦C.Prunes are one product that is stored in the dry condition and later rehydrated for sale.The prunes are immersed in boiling water and packed into sealed plastic pouches at atemperature not less than 82◦C before cooling.
Freeze-DryingIn freeze-drying, the product is first frozen and then placed in a vacuum-tight en-
closure and dehydrated under vacuum with careful application of heat, the pressurebeing kept substantially below 4.6 mm of Hg. The process has a number of advantages.First, there is no reduction in volume, and as a result little change of appearance com-pared with atmospheric drying. A further major advantage is that much more of thenonaqueous volatile constituents, flavors, and so forth are retained. Freeze-dried foodsalso rehydrate more rapidly than other dried foods. Although many vegetables can befreeze-dried, one disadvantage is that freeze-dried vegetables are more susceptible tooxidative deterioration than air-dried vegetables. A further disadvantage of this methodof drying is the capital cost of the equipment. The overall cost of freeze-drying is aroundfour times that of conventional drying [1]. Certain fruits have been freeze-dried, such aspapaya.
DesiccationDesiccated coconut is a major product used in the confectionary industry as a bulking
material. Fresh coconuts are shelled whole and the outer brown skin or testa pared offwith a knife. The coconut water is drained away and the flesh is cut and washed andthen sterilized in boiling water or in steam blanchers at 88◦C for 5 minutes [3]. Thepieces then are shredded into a fine wet meal in a hammer mill and dried to 25% to 30%moisture content in a steam-heated counterflow multistage drier at 77 to 82◦C for 40 to45 minutes. Finally, the product is size-graded and packed.
3.5.6 Controlled Ripening and Degreening
A number of climacteric fruits, notably bananas, mangoes, papaya, pears, tomatoes,and avocados are picked relatively green and are subsequently ripened by introducingethylene or acetylene gas, calcium carbide, or smoke. One advantage of this approach isthat it allows the fruit to be picked in the green mature state when it is less susceptibleto mechanical damage due to handling and transport. Controlled ripening also ensuresthat a particular batch of fruit is more even in ripeness and color. A third advantage of

Processing of Fruit and Vegetables 365
artificial ripening is that it can be done close to the market, ensuring that the fruit is sentto the retail outlet undamaged and at optimal ripeness.
The fruit to be ripened ideally is placed in an airtight ripening room maintained at aconstant temperature (18–21◦C for most fruits, but 29–31◦C in the case of mango). Thereare two methods of exposing the fruit to ethylene. The trickle method involves tricklingthe ethylene gas into the room so as to maintain a concentration of 10µL per liter,usually for a period of 24 hours. During this time relative humidity is maintained at 85%to 90%. The second method involves giving the room a single initial charge of ethyleneto a concentration of between 20 and 200µL per liter. The room then is ventilatedafter 24 hours to prevent carbon dioxide exceeding a 1% concentration, which wouldretard ripening. Rooms that are poorly sealed sometimes require a second charge after12 hours. In modern practice, the fruit are packed in vented cartons stacked on pallets,and fruit temperature is controlled by forced air circulation as in a cooling facility.
More traditional rural methods of ripening bananas and mangoes involve putting thefruit into a pit in the ground or into a heap on the surface and covering with a tarpaulin orbranches. In some cases ripening is induced by placing small sachets of calcium carbideamong the fruit, which in the humid atmosphere produces acetylene. Acetylene has asimilar effect to ethylene but is required in at least 100 times the concentration. Anotherfrequently used technique is to expose the fruit to smoke produced by burning leaves orwood. Ethylene thereby is produced as one of the products of incomplete combustion.However, product quality may be reduced by this procedure, especially if immature fruitis used.
Controlled degreening sometimes is carried out on citrus grown in the tropics. Manycitrus cultivars are mature before the green color disappears from the peel. The breakdownof chlorophyll and production of a rich orange color requires exposure to low temperatureduring maturation, and this explains why mature citrus frequently is sold green on marketsin the humid tropics, where even night temperatures may not drop much below 25◦C.Degreening is carried out in ripening rooms, with the same ethylene concentrations asabove. The process may take 2 to 3 days, and it is again necessary to ventilate daily toensure that carbon dioxide levels do not exceed 1%. The most rapid degreening occurs attemperatures of 25 to 30◦C but the best color (concentration of peel carotenoids) occursat 15 to 25◦C [4].
Ripening and degreening also may be carried out by spraying with or brief immersionin an ethylene-releasing compound, such as ethephon.
3.5.7 Processing into Purees, Pastes, and Edible Leathers
Fruits such as tomato and mango are first peeled, destoned, and sliced, and the slicespulped in a homogenizer. The pulp then is sterilized by raising the temperature to at least75◦C (mangoes). The puree is then canned or sealed in polythene pouches for long-termstorage and marketing.
Fruit “leathers” can be made by sun drying or forced-air dehydration of a puree layeron a thin plastic film. The dried product (typically from apricot or mango) has a brightappearance, good flavor, and a chewy texture. The end product is popular as a snack food.
366 Fruit and Vegetables
3.5.8 Processing into Flour
A number of vegetable and fruit crops are used to produce flour, two of the majorones being soybean and coconut. Approximately 95% of the soybean crop is grown forprocessing. Most of this production goes into oil and high-protein flour. These high-protein concentrates and isolates are used as additives for nutritional enhancement (theimportant component being lysine, a particularly valuable amino acid). The concentratesalso are processed further to produce soy milk and soy cheese and are extruded or spunto produce textured protein products for meat analogues.
Beans are first dried to 13% moisture content, cleaned, and then tempered by storingat 10% to 12% moisture content and 25◦C for 7 to 10 days. This causes shrinkage, whichassists in the subsequent cracking and dehulling stages. The dehulled beans then areconditioned by raising the temperature to 70◦C, thereby increasing the amount of oilthat can be extracted. The conditioned beans then are flaked by passing them throughrolls, which produce flakes having a thickness between 0.25 and 0.38 mm. Oil then isextracted by the solvent process using hexane in a 1:1 ratio, the liquid being percolatedthrough the bed of soy flakes. The flakes that are left contain 1% oil, 7% water, and35% hexane. The hexane is recovered by passing the flakes through steam. This alsoserves to destroy antinutritional factors that are found in soybean, such as trypsin in-hibitors. The flakes then are dried to 10% moisture content, toasted, and ground to a meal.Protein concentrates are prepared by removing the soluble carbohydrates by an aqueous-alcohol leaching process to give a product with 70% protein. Finally, isolates are pro-duced by removing the insoluble carbohydrates with dilute alkali, yielding 96% protein[5].
Coconut flour is made by a number of processes. In the Yenko process, the maturenut is comminuted, then dried in a chamber at 80 to 100◦C, and the oil removed in apress. The residual cake (at 1%–8% moisture) is ground into flour [3].
3.5.9 Juicing and Production of Nectars
Juicing is perhaps most typified by the citrus-processing industry, which producesjuice, concentrate, and citrus oil (the latter being derived from the peel). Citrus con-centrate is produced in very large quantities by many countries and is traded as aninternational commodity.
The juice first is removed by special extractors, being discharged with approximately11◦ Brix (refractive index test for soluble solids) and a pulp content of 20% to 25%by volume. Downstream finishers (horizontally mounted screen drums) reduce the pulpcontent to 10% to 12% by volume. Centrifuges then are used to remove the trub particlesto whatever extent the market requires. For the single-strength juice market, the resultantjuice is pasteurized and bottled. For the concentrate market, this preclarified juice ispassed through evaporators. It takes 10 to 12 ton of fresh fruit to produce 1 ton ofconcentrate with 65◦ Brix.
Frozen concentrate is considered to be a superior product, and it is made by concen-trating juice under vacuum at room temperature to 56◦ Brix. Then 10% fresh juice isadded and the liquid is quickly frozen to−20◦C. The resulting concentrate of 44◦ Brix,
Processing of Fruit and Vegetables 367
which retains the taste and aroma of fresh juice, can be kept for long periods and whenused is diluted with three parts water [6].
To produce nectars, the fruits (typically peaches and apricots) are halved, pitted,peeled, and then cooked and passed through a disintegrator or pulper. After adding syrupand citric acid, the product is passed through a deaerator to prevent loss of color andflavor. When canned, the cans are held at 88◦C for 3 minutes. If put into jars, the jars aresealed and pasteurized at 100◦C for 20 to 30 minutes.
3.5.10 Aseptic Processing and Packaging
In contrast to canning, where the hot-filling and postsealing heat treatments are usedto produce commercial sterility, in aseptic processing both the product and the packagingare made commercially sterile before the filling and sealing operations, and thereforeno postsealing heating is necessary. The objective is a product that is stable for 2 to 3months, and preferably for 6 months, without refrigeration.
Prior to packaging, the liquid or semiliquid product is heated quickly to a temperatureat which it is commercially sterile and then cooled. The packages (e.g., coated cartons)are subjected to a combination of chemical and heat treatment. Preformed cartons usu-ally receive a spray of hydrogen peroxide solution. Sometimes this is supplemented byultraviolet irradiation. With many aseptic filling machines, as part of the process the car-ton is formed continuously from coils of waxed-paper packaging tube. The packagingmaterial usually is dipped in a 35% hydrogen peroxide solution, and the surplus liquidblown off by a jet of hot air.
The economic advantages of asceptic processing and packaging lie in the use ofpackaging materials that are cheaper than metal cans and glass containers, the saving ofheat energy, and the preservation of flavors. With aseptic systems, there is continuous flowof the product. Thus, with appropriate heat-exchanger design it is possible to raise andlower the product temperature more rapidly, allowing sterilization at higher temperatures.The higher temperatures are more effective in killing off relatively heat-resistant bacteria,while the shorter exposure time results in reduced loss of flavor, color, and nutrients [7].This is sometimes known as high-temperature/short-time processing.
3.5.11 Minimal Processing for Retail and Fast-Food Outlets
Minimally processed fruits and vegetables are those that may have been cleaned,peeled, cut, sliced, and packaged in such a way as to retain their fresh appearance.They can be classed as “convenience foods,” typical examples being fruit slices, mixed-vegetable selections, coleslaw, shredded lettuce, and salads. Compared with other pro-cesses in which the product is made stable and is given a long shelf life, minimallyprocessed fruits and vegetables are highly perishable. They are vulnerable to enzymaticand bacteriological breakdown and are therefore a health risk if not prepared and storedproperly. Nevertheless there has been a growing demand for such products, with an an-nual market value of around US$4000 to 8000 million in the year 2000. In some casesin which importation of fruit is prevented due to fruit-fly infestation, the importation offruit segments may be possible, opening up a potentially large market.
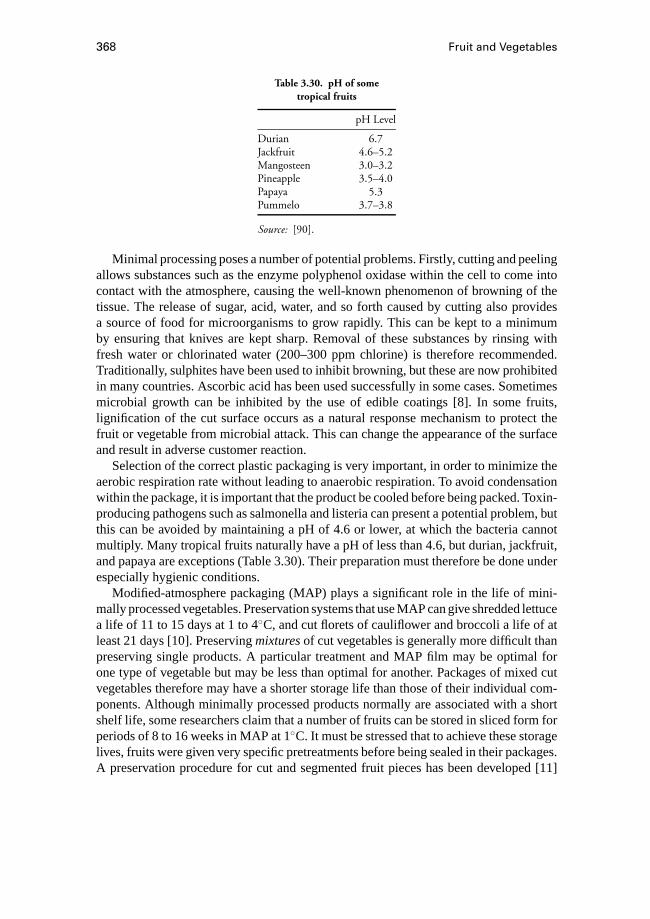
368 Fruit and Vegetables
Table 3.30. pH of sometropical fruits
pH Level
Durian 6.7Jackfruit 4.6–5.2Mangosteen 3.0–3.2Pineapple 3.5–4.0Papaya 5.3Pummelo 3.7–3.8
Source: [90].
Minimal processing poses a number of potential problems. Firstly, cutting and peelingallows substances such as the enzyme polyphenol oxidase within the cell to come intocontact with the atmosphere, causing the well-known phenomenon of browning of thetissue. The release of sugar, acid, water, and so forth caused by cutting also providesa source of food for microorganisms to grow rapidly. This can be kept to a minimumby ensuring that knives are kept sharp. Removal of these substances by rinsing withfresh water or chlorinated water (200–300 ppm chlorine) is therefore recommended.Traditionally, sulphites have been used to inhibit browning, but these are now prohibitedin many countries. Ascorbic acid has been used successfully in some cases. Sometimesmicrobial growth can be inhibited by the use of edible coatings [8]. In some fruits,lignification of the cut surface occurs as a natural response mechanism to protect thefruit or vegetable from microbial attack. This can change the appearance of the surfaceand result in adverse customer reaction.
Selection of the correct plastic packaging is very important, in order to minimize theaerobic respiration rate without leading to anaerobic respiration. To avoid condensationwithin the package, it is important that the product be cooled before being packed. Toxin-producing pathogens such as salmonella and listeria can present a potential problem, butthis can be avoided by maintaining a pH of 4.6 or lower, at which the bacteria cannotmultiply. Many tropical fruits naturally have a pH of less than 4.6, but durian, jackfruit,and papaya are exceptions (Table 3.30). Their preparation must therefore be done underespecially hygienic conditions.
Modified-atmosphere packaging (MAP) plays a significant role in the life of mini-mally processed vegetables. Preservation systems that use MAP can give shredded lettucea life of 11 to 15 days at 1 to 4◦C, and cut florets of cauliflower and broccoli a life of atleast 21 days [10]. Preservingmixturesof cut vegetables is generally more difficult thanpreserving single products. A particular treatment and MAP film may be optimal forone type of vegetable but may be less than optimal for another. Packages of mixed cutvegetables therefore may have a shorter storage life than those of their individual com-ponents. Although minimally processed products normally are associated with a shortshelf life, some researchers claim that a number of fruits can be stored in sliced form forperiods of 8 to 16 weeks in MAP at 1◦C. It must be stressed that to achieve these storagelives, fruits were given very specific pretreatments before being sealed in their packages.A preservation procedure for cut and segmented fruit pieces has been developed [11]
Processing of Fruit and Vegetables 369
that claims that sliced mango can be stored in MAP at 5 to 9◦C for up to 12 weeks andpapaya for up to 16 weeks—in the case of papaya, the fruit pieces were dipped in 5%citric acid and the package flushed with 15% to 20% oxygen and 3% helium balancedwith nitrogen before sealing. A range of single films and film combinations is availablefor MAP, and a range of techniques is associated with them [12].
In the tropics, certain of the larger fruits such as durian (2–4 kg per fruit) and jackfruit(5–20 kg per fruit) are difficult or messy to open, and so they are traditionally cut openby the retailer and the pulp or fruit segments sold individually or in small trays. In theabsence of MAP, durian pulp can be stored at 4◦C for up to 40 days [13], and it is claimedthat jackfruit segments can be stored successfully for up to 14 days at 5◦C [14].
3.5.12 Fermentation into Alcoholic Beverages, Vinegar, Sauces andOther Products
Fermentation occurs naturally in the presence of bacteria, yeasts, and molds. Bacteriaproduce acids, which tend to act as preservatives; yeasts produce alcohol, which is alsoa preservative.
In addition to wine production from grapes (covered in a subsequent section) manyfruits are fermented to produce alcoholic beverages, including apples (to produce cider),pears (to produce perry), bananas and a wide variety of berry fruits (to produce wines andliqueurs). Traditional alcoholic-beverage preparation relies on the naturally occurringyeasts and sugars to initiate the fermentation process. In commercial processing, theseyeasts and other microorganisms first are controlled by treatment with sulphur dioxide,and the juice then inoculated with a chosen, desirable yeast culture. Care is taken not toexpose the inoculated juice to the air during fermentation.
The most common type of vinegar produced from fruit material is cider vinegar. Applejuice is first fermented to form raw cider, after which it is clarified and allowed to stand forat least a month. Then in the acetification process, acetobacter bacteria and nutrient saltsare added to produce a second (acetous) fermentation yielding acetic acid. In North Amer-ica and the United Kingdom, the minimum legal strength for vinegars is 4% acetic acidw/v (weight in volume). Traditional methods of acetification employ the Quick packedgenerator, a container packed with beechwood shavings, providing a large surface area forthe acetobacter to cover. Air circulates upward through the shavings, while the cider trick-les down and is continuously recirculated. The conversion rate is about 1% every 24 hours.Faster production rates are achieved by employing a submerged culture fermenter (Fringstype or tower type), in which air is continuously bubbled up through the must by a vortexstirrer at a rate of 100 to 250 L/min per 100 L of liquid [15]. Feedstock is added continu-ously at the bottom of the container and vinegar is drawn off at the top, making it a contin-uous process. Throughput is roughly double that of the packed generator for the same size.The vinegar is then clarified by filtering, diluted with water to 5% acetic acid, and pas-teurized at 65 to 85◦C before hot-filling into bottles or cold-filling into plastic containers.
Fermentation of legumes and legume–rice mixtures has been practiced in Asia andparts of Africa for centuries. The fermentation breaks down the carbohydrate to acid. Oneof the effects of fermentation is to make more of the nutrients available for assimilationin the form of amino acids, thus improving the digestibility of the legume protein. This
370 Fruit and Vegetables
can make a significant difference to the adequacy of the diet for people who receive alow food intake.
In many countries, soybeans are inoculated with different types of bacteria, yeast, ormold cultures according to local tradition. Soy sauce (calledshoyuin Japan) is a verypopular sauce around the world but particularly in Asian countries. It is made by the initialfermentation of soybeans and wheat at fairly high salt levels for 72 hours, sometimes fol-lowed by a final slow fermentation over a 3-month period. In Indonesia, tempeh is madeby fermenting soybeans with the rhizopus fungus. For almost two thousand years, kojihas been made in China and Japan by fermenting soybeans with the aspergillus fungus.
3.5.13 Processing into Jams, Pickles, Chutneys, and Sauces
Four naturally occurring edible preservatives in very common use are sugar, vinegar,salt, and vegetable oil. Jams are made by boiling fruit in a sugar syrup until the liquidbecomes relatively stiff. Sometimes additional pectin is added to cause the jam to setto a stiffer consistency upon cooling. The jam is poured into clean, sterilized containerswhile hot, sealed airtight, and then cooled. In some cases it also is desirable to cover thesurface of the jam with a thin layer of wax.
Pickling of vegetables and unripe fruit (such as papaya and mango) usually involvessome heating with the addition of spices, sugar, and other flavorings, followed by immer-sion in vinegar (acetic acid) or oil in glass jars. Onions, beetroot, and raw papaya slicesusually are pickled in vinegar. Raw mango slices are pickled by first removing some ofthe moisture with salt, adding a partially ground mixture of spices such as coriander,fennel, cumin seeds, tumeric, garlic, and red chillis; and then putting them in jars andcovering them with mustard oil.
Chutney is essentially a spicy jam and can be made from a range of fruit and vegetables,such as papaya, mango, apple, raisins, tomato, and onion. The ingredients are boiledtogether with spices and sweeteners, and maize and starch thickeners are added to makethe product stiff upon cooling.
Powdered salt or brine is used to preserve some fruit and vegetables. Unpeeled rawmango slices can be kept in powdered salt in polyethylene pouches for 2 months, oralternatively in brine for 6 months.
3.5.14 Oil Production
Of the many types of oil that can be made from fruits, vegetables, and nuts, fiveare very significant in terms of world production and are traded as major commodities.In 1995 and 1996, of the nine major edible oils (in order: soybean, palm, rapeseed,sunflowerseed, cottonseed, peanut, coconut, palm kernel, and olive oil), soybean oilaccounted for 28% (20 million metric tons), palm oil accounted for 21.9% (15.5 millionmetric tons), coconut oil accounted for 4.3% (3 million metric tons), palm kernel oilaccounted for 3% (2.1 million metric tons), and olive oil accounted for 2.1% (1.5 millionmetric tons).
Soybeans are first processed as described previously to produce conditioned flakeshaving a large surface area. Oil then is extracted by the solvent process using hexane in a1:1 ratio, the liquid being percolated through the bed of soy flakes. Themiscella(oil and

Processing of Fruit and Vegetables 371
solvent), which leaves through a mesh screen, contains 25% to 30% oil. This is passedthrough a two-stage evaporator, where steam-heated tubes cause most of the hexane toevaporate and then steam removes any residual solvent. The final liquid is 99.8% crudesoybean oil. The oil then is passed through the further processing stages of degumming,neutralizing, bleaching, and hydrogenation to remove phosphatides, free fatty acids, iron,beta-carotene, and chlorophyll. Hydrogenation also improves the stability of the oil andraises the melting point, making it more suitable for the manufacture of margarine andshortening. The final stage is deodorization. In its simplest form, the process involvesbubbling low-pressure steam at 170 to 230◦C through the warm oil to remove volatiles.A more complex continuous process involves first deaerating the oil under vacuum andthen passing it into a column containing a cascade of trays heated to 250◦C by an upwardcountercurrent of steam. A steam ejector system maintains a pressure of 6 mm of mercuryto enhance volatilization and protect the quality of the oil [16].
In the case of palm oil, bunches of palm fruits are sterilized with steam under pressureat 130◦C in large horizontal tubular sterilisers for 40 to 60 minutes. The fruits then arestripped off the bunches in stripping machines of the beater-arm type or rotary-drumtype. They are put into a digester, where they are heated to 95◦C. About 50% of the oil isreleased at this stage and collected. The resulting mash leaves the digester and is passedthrough a screw press, which extracts the remainder of the oil. The crude oil is passedthrough screens, then through a heat exchanger that raises the temperature to 85 to 90◦C,and finally into a clarification tank, where the oil rises to the top and a sludge is removedlower down.
Coconut oil is produced by a number of both dry and wet processes [17]. On largecommercial scale, coconut oil is made from copra. Copra consists of large pieces ofcoconut meat dried down to a moisture content of about 6%. It usually is made locallyon or close to the plantation and then collected and transported to the processing factoryor exported for processing overseas. To make copra, fresh nuts or nuts harvested andstored for up to 4 weeks are dehusked and deshelled, either manually or by machine.They then are dried in one of several types of drier. Split into halves, they can be solar-dried or dried in a direct or indirect drier. In the direct drier, hot flue gases pass throughthe coconut, causing it to be smoked as well as dried. The smoke produces impurities inthe final product but assists in preventing the growth of molds that are responsible forproducing aflatoxins.
In large centralized oil mills, the copra is comminuted in a size reduction unit orhammer mill, heated, and then passed through a high-pressure single-screw or twin-screw expeller (pressure approximately 70 MPa). The extraction efficiency for the firstpressing is 55% to 70%. In some plants the cake is passed through the press a secondtime. The residual oil present in the cake is removed by a solvent-extraction process,using hexane. Finally the oil is deodorized and refined.
A number of smaller-scale processes are used that by-pass the copra phase. Traditionalmethods involve the grating of fresh coconut meat and squeezing it to produce cream (asuspension of oil in water). The oil then is obtained by boiling off the water. Anothermethod involves frying the grated meat on a hot plate to drive off the water beforesqueezing. More advanced biochemical methods involve the use of enzymes or bacteria
372 Fruit and Vegetables
that react with the grated meat, causing quality oil, water, and protein extract to separateout after 48 to 72 hours. Superior-quality oil (with less than 0.2% free fatty-acid content)can be produced by using a moisture-assisted process, in which fresh grated coconut isdried down to 10% moisture content and pressed at low pressure (2–3 MPa).
3.5.15 Soaking to Remove Toxic and Indigestible Substances
Many legumes (e.g., soybean) contain antinutritional substances such as trypsin in-hibitors, cyanogenic glucosides, alkaloids, saponins, and haemaglutinin which can causestomach disorders. Cassava (manioc) contains small quantities of the glucosides lina-marin and lotaustralin, which are converted to hydrocyanic acid (prussic acid) whenthey come into contact with the enzyme linamarase, which is released when the cells ofroots are ruptured. These undesirable chemicals are rendered inactive or leached out bysoaking in water, sometimes with the addition of heat.
3.5.16 Irradiation
Ionizing radiation treatment has four potential uses, namely the disinfestation of insectpests, extension of shelf life by retarding ripening and sprouting, inhibition of rotting,and disinfection of material affected by harmful organisms such as salmonella.
Although effective in dealing with insect pests, irradiation is not used for this pur-pose commercially on any significant scale, and it still is more expensive than alterna-tive chemical and heat treatments. Irradiation currently is used mainly for inhibition ofsprouting in potatoes and onions. At present Japan makes the widest use of irradiation forthese products. Sprouting is inhibited by a dose of 0.02 to 0.15 KGy, and at this level it haslittle effect on sugar level, flavor, or texture. Because of the high capital costs, the processstill is more expensive than inhibition using chemical treatments such as chlor prophamor maleic hydrazide. One unfortunate side effect in the case of potatoes is that irradiationat the levels used to inhibit sprouting also inhibits the light-dependent development ofchloroplasts in the outer cell layers of the tubers. This can represent a hazard for thecustomer, because potatoes exposed to light in transparent bags continue to produce theharmful substance solanine but give no indication of this by showing no signs of greening.
Attempts to inhibit rotting and ripening of fruit by the use of irradiation and therebyto increase shelf life have met with limited success. It is claimed that rotting can beprevented in strawberry, tomato, and fig, and that ripening can be extended in banana,mango, papaya, and apricot [18]. However, the effect of irradiation on fruits variesnot only among fruits but also from cultivar to cultivar. Irradiation extends the life ofsome cultivars of mango, for instance, but shortens the life of others. In some cultivars itprevents ripening altogether and can produce skin blemishes. Irradiation tends to producean overall softening of fruit that is different from the selective softening that occurs duringthe natural ripening process [19]. Irradiation is used on a significant commercial scalefor disinfection of a range of spices.
Health concerns, in particular the relatively unknown effects of free radicals and otherchemical changes produced by the irradiation process, will continue to put limits on theapplication of irradiation to foods. Use of plastic packaging materials that are irradiated
Processing of Fruit and Vegetables 373
at the same time as the product must be monitored carefully, because irradiation causessome plastics (e.g., PVC) to break down into toxic substances.
3.5.17 Equipment for Physical Processes (Unit Operations)
Size-Reduction UnitsChopping, cutting, slicing, dicing, julienning, and shredding are carried out with a
range of cutting elements. Slicing is done by rotating or reciprocating blades as theproduct passes beneath. In the dicing operation, the material is sliced and then cut intostrips by a series of rotating blades. The strips are then cut into cubes by a further setof knives acting in a perpendicular plane. Shredding is performed either by multiplerotating knives (in a machine similar to a hammer mill, but with the hammers replacedby knives) or in a squirrel-cage shredder, in which the product is made to pass betweentwo contrarotating cylindrical cages, both fitted with knives.
Homogenizers and Colloid MillsHomogenizers come in a number of designs. In pressure homogenizers, a high-
pressure pump operating at 10 to 70 MPa feeds the liquid through a poppet valve with thepoppet set to produce a gap of 300µm. The rapid drop in pressure and sudden changein velocity produces turbulence that reduces the globule size. In some equipment, thehigh-velocity jet is made to impinge on a breaker ring to achieve a better result. A secondtype of homogenizer (used for ice cream, salad creams, and essential oil emulsions) usesultrasonics. The dispersed and continuous phase of an emulsion are together pumpedthrough an orifice with a pressure of 0.3 to 1.4 MPa, where they impinge on a metalblade that is made to resonate at 18 to 30 kHz. Resonance of the blade can be caused bythe jet of fluid or by an electromechanical transducer.
Colloid mills are essentially disc mills, with one disc stationary and one disc rotatingat 3000 to 15000 revolutions per minute. The small clearance between them (0.05–1mm) produces high shearing rates and forces, as the fluid travels from the center to theouter periphery. Colloid mills are particularly suitable for high-viscosity liquids. Thediscs may be flat, conical, or corrugated or have other asperities on them that are suitedto processing a particular material.
Juice ExtractorsTwo types of juice extractors are used. The first is a mechanized and automatic version
of the standard kitchen lemon press, for which the fruit is cut in half and squeezed againsta ribbed hemisphere. In the second type, the whole fruit is held between a lower andan upper cup, while cutters in the center of both cups begin to cut plugs in the fruit.Pressure then increases on the fruit, forcing the material through the bottom plug andinto a prefinisher tube. The peel then is discharged between the upper cup and the cutter(see Fig. 3.35). The juice and juice sacks then pass through small holes in the finishertube, while larger particles are discharged through the bottom of the tube.
Centrifugal ClarifiersClarifiers are used to separate solids from liquids. The simplest form of clarifier is the
cylindrical-bowl type. The liquor to be clarified (usually with a maximum of 3% w/w
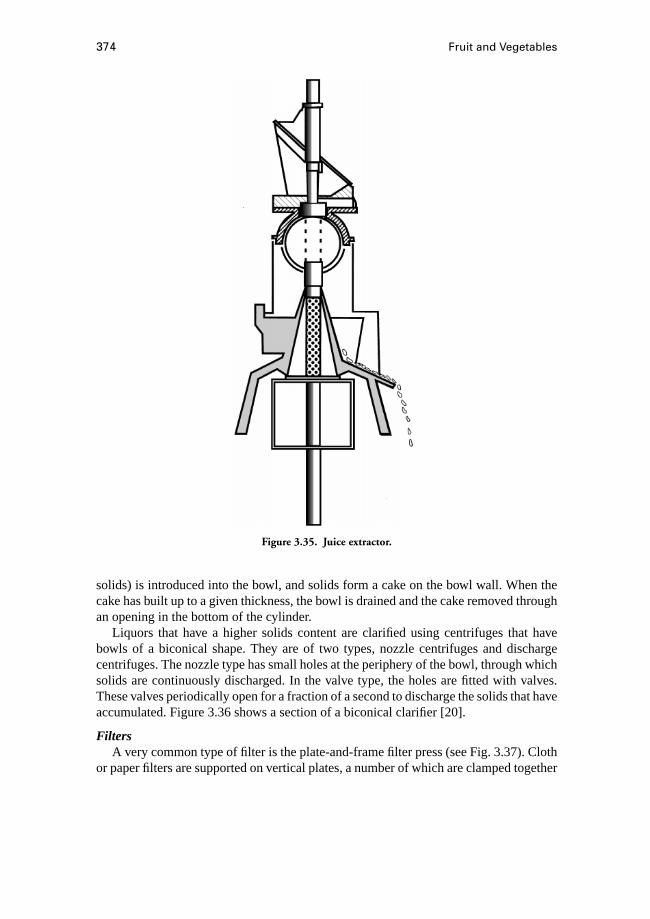
374 Fruit and Vegetables
Figure 3.35. Juice extractor.
solids) is introduced into the bowl, and solids form a cake on the bowl wall. When thecake has built up to a given thickness, the bowl is drained and the cake removed throughan opening in the bottom of the cylinder.
Liquors that have a higher solids content are clarified using centrifuges that havebowls of a biconical shape. They are of two types, nozzle centrifuges and dischargecentrifuges. The nozzle type has small holes at the periphery of the bowl, through whichsolids are continuously discharged. In the valve type, the holes are fitted with valves.These valves periodically open for a fraction of a second to discharge the solids that haveaccumulated. Figure 3.36 shows a section of a biconical clarifier [20].
FiltersA very common type of filter is the plate-and-frame filter press (see Fig. 3.37). Cloth
or paper filters are supported on vertical plates, a number of which are clamped together
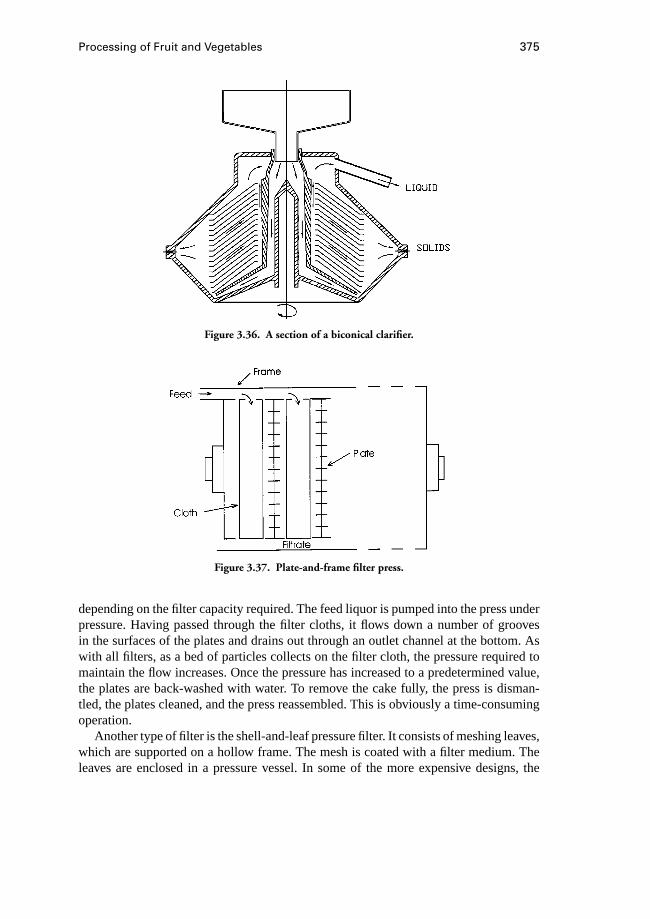
Processing of Fruit and Vegetables 375
Figure 3.36. A section of a biconical clarifier.
Figure 3.37. Plate-and-frame filter press.
depending on the filter capacity required. The feed liquor is pumped into the press underpressure. Having passed through the filter cloths, it flows down a number of groovesin the surfaces of the plates and drains out through an outlet channel at the bottom. Aswith all filters, as a bed of particles collects on the filter cloth, the pressure required tomaintain the flow increases. Once the pressure has increased to a predetermined value,the plates are back-washed with water. To remove the cake fully, the press is disman-tled, the plates cleaned, and the press reassembled. This is obviously a time-consumingoperation.
Another type of filter is the shell-and-leaf pressure filter. It consists of meshing leaves,which are supported on a hollow frame. The mesh is coated with a filter medium. Theleaves are enclosed in a pressure vessel. In some of the more expensive designs, the
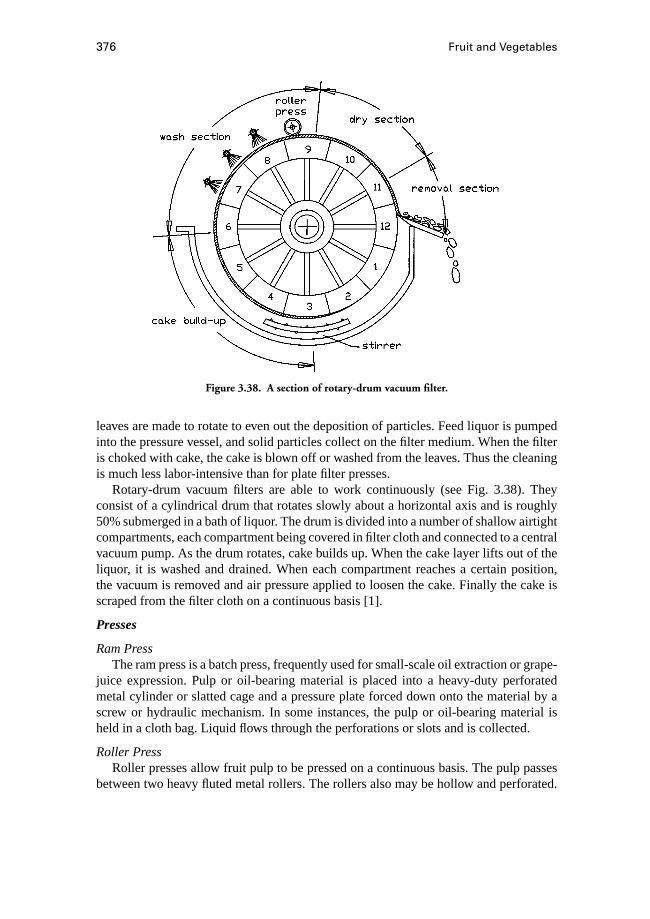
376 Fruit and Vegetables
Figure 3.38. A section of rotary-drum vacuum filter.
leaves are made to rotate to even out the deposition of particles. Feed liquor is pumpedinto the pressure vessel, and solid particles collect on the filter medium. When the filteris choked with cake, the cake is blown off or washed from the leaves. Thus the cleaningis much less labor-intensive than for plate filter presses.
Rotary-drum vacuum filters are able to work continuously (see Fig. 3.38). Theyconsist of a cylindrical drum that rotates slowly about a horizontal axis and is roughly50% submerged in a bath of liquor. The drum is divided into a number of shallow airtightcompartments, each compartment being covered in filter cloth and connected to a centralvacuum pump. As the drum rotates, cake builds up. When the cake layer lifts out of theliquor, it is washed and drained. When each compartment reaches a certain position,the vacuum is removed and air pressure applied to loosen the cake. Finally the cake isscraped from the filter cloth on a continuous basis [1].
Presses
Ram PressThe ram press is a batch press, frequently used for small-scale oil extraction or grape-
juice expression. Pulp or oil-bearing material is placed into a heavy-duty perforatedmetal cylinder or slatted cage and a pressure plate forced down onto the material by ascrew or hydraulic mechanism. In some instances, the pulp or oil-bearing material isheld in a cloth bag. Liquid flows through the perforations or slots and is collected.
Roller PressRoller presses allow fruit pulp to be pressed on a continuous basis. The pulp passes
between two heavy fluted metal rollers. The rollers also may be hollow and perforated.
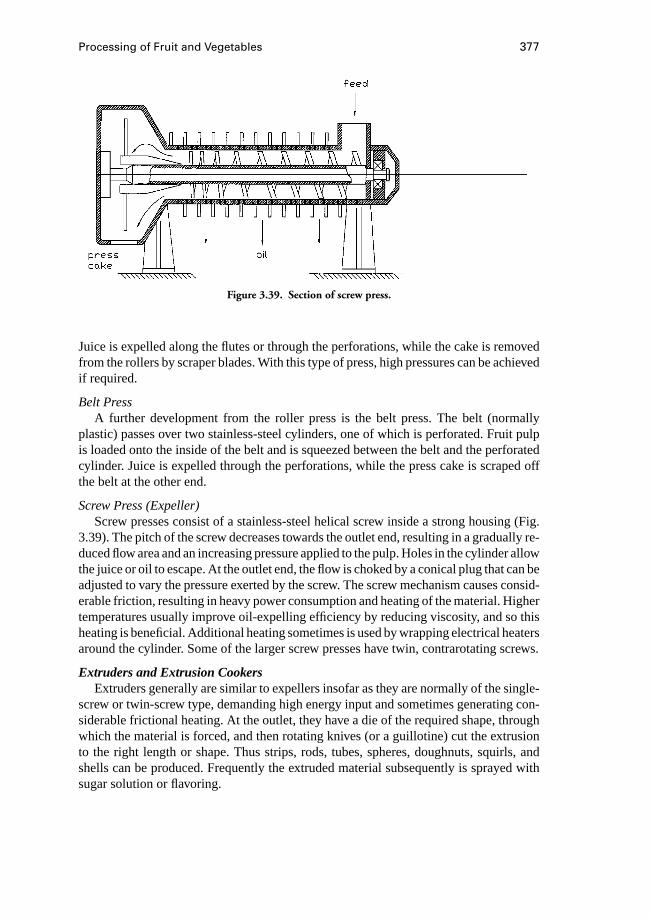
Processing of Fruit and Vegetables 377
Figure 3.39. Section of screw press.
Juice is expelled along the flutes or through the perforations, while the cake is removedfrom the rollers by scraper blades. With this type of press, high pressures can be achievedif required.
Belt PressA further development from the roller press is the belt press. The belt (normally
plastic) passes over two stainless-steel cylinders, one of which is perforated. Fruit pulpis loaded onto the inside of the belt and is squeezed between the belt and the perforatedcylinder. Juice is expelled through the perforations, while the press cake is scraped offthe belt at the other end.
Screw Press (Expeller)Screw presses consist of a stainless-steel helical screw inside a strong housing (Fig.
3.39). The pitch of the screw decreases towards the outlet end, resulting in a gradually re-duced flow area and an increasing pressure applied to the pulp. Holes in the cylinder allowthe juice or oil to escape. At the outlet end, the flow is choked by a conical plug that can beadjusted to vary the pressure exerted by the screw. The screw mechanism causes consid-erable friction, resulting in heavy power consumption and heating of the material. Highertemperatures usually improve oil-expelling efficiency by reducing viscosity, and so thisheating is beneficial. Additional heating sometimes is used by wrapping electrical heatersaround the cylinder. Some of the larger screw presses have twin, contrarotating screws.
Extruders and Extrusion CookersExtruders generally are similar to expellers insofar as they are normally of the single-
screw or twin-screw type, demanding high energy input and sometimes generating con-siderable frictional heating. At the outlet, they have a die of the required shape, throughwhich the material is forced, and then rotating knives (or a guillotine) cut the extrusionto the right length or shape. Thus strips, rods, tubes, spheres, doughnuts, squirls, andshells can be produced. Frequently the extruded material subsequently is sprayed withsugar solution or flavoring.
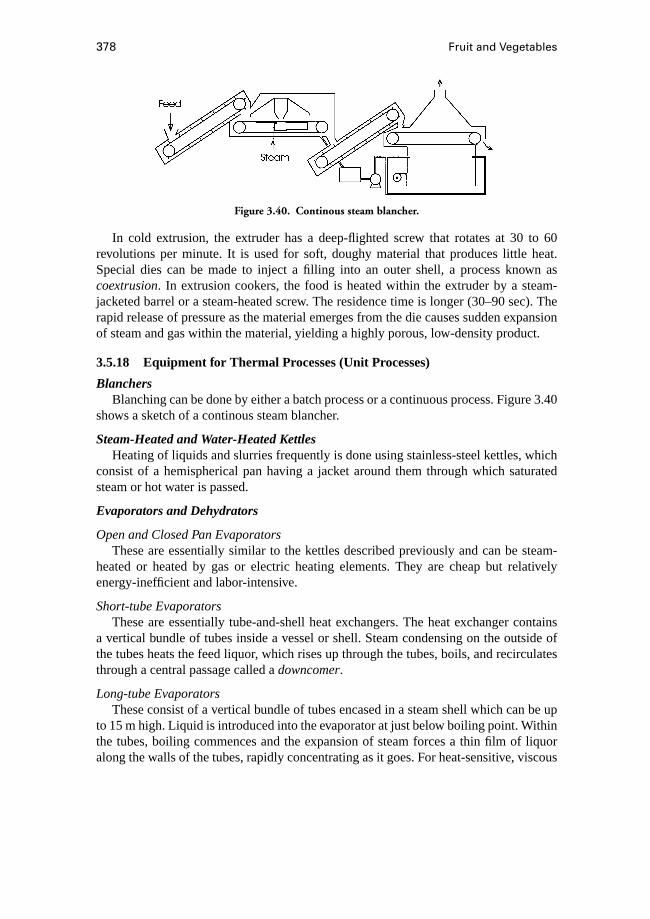
378 Fruit and Vegetables
Figure 3.40. Continous steam blancher.
In cold extrusion, the extruder has a deep-flighted screw that rotates at 30 to 60revolutions per minute. It is used for soft, doughy material that produces little heat.Special dies can be made to inject a filling into an outer shell, a process known ascoextrusion. In extrusion cookers, the food is heated within the extruder by a steam-jacketed barrel or a steam-heated screw. The residence time is longer (30–90 sec). Therapid release of pressure as the material emerges from the die causes sudden expansionof steam and gas within the material, yielding a highly porous, low-density product.
3.5.18 Equipment for Thermal Processes (Unit Processes)
BlanchersBlanching can be done by either a batch process or a continuous process. Figure 3.40
shows a sketch of a continous steam blancher.
Steam-Heated and Water-Heated KettlesHeating of liquids and slurries frequently is done using stainless-steel kettles, which
consist of a hemispherical pan having a jacket around them through which saturatedsteam or hot water is passed.
Evaporators and Dehydrators
Open and Closed Pan EvaporatorsThese are essentially similar to the kettles described previously and can be steam-
heated or heated by gas or electric heating elements. They are cheap but relativelyenergy-inefficient and labor-intensive.
Short-tube EvaporatorsThese are essentially tube-and-shell heat exchangers. The heat exchanger contains
a vertical bundle of tubes inside a vessel or shell. Steam condensing on the outside ofthe tubes heats the feed liquor, which rises up through the tubes, boils, and recirculatesthrough a central passage called adowncomer.
Long-tube EvaporatorsThese consist of a vertical bundle of tubes encased in a steam shell which can be up
to 15 m high. Liquid is introduced into the evaporator at just below boiling point. Withinthe tubes, boiling commences and the expansion of steam forces a thin film of liquoralong the walls of the tubes, rapidly concentrating as it goes. For heat-sensitive, viscous
Processing of Fruit and Vegetables 379
liquids the feed is introduced at the top of the tube bundle. This type of evaporator isrelatively energy-efficient, and it is widely used for citrus-fruit juices.
Other evaporator types include the external calandria type, forced-circulation type,plate type, expanding flow type, and mechanical thin-film evaporators [2].
Retorts and SterilizersRetorts are pressurized containers in which canned products are sterilized or heat
processed. With this batch process, the cans are loaded into the retort in a special cage,and the retort sealed with a gastight lid. Saturated steam is introduced into the retort, andas it condenses onto the outside of the cans the latent heat raises the temperature of thecontents rapidly. After heat treatment, cooling water is passed through the retort. Oncethe product temperature has dropped below 100◦C, the pressure is released and coolingcontinues to 40◦C.
Batch-type retorts havecertain advantages but are labor-intensive. Continuous-pressuresterilizers are in use with capacities well above 1000 cans per minute.
Heat Exchangers
Plate Heat ExchangersThese are widely used for pasteurization of low-viscosity liquids such as fruit juices.
They consist of a series of thin vertical stainless-steel plates held tightly in a rigidframe. The gaps between the plates form narrow channels, and alternate channels areconnected together in parallel. The liquid to be sterilized is passed through one set ofalternate channels, while the heating medium (steam or hot water) is passed in between.The inlets and outlets are arranged to form a counterflow pattern. Plates usually arecorrugated to cause fluid turbulence, thereby reducing the thickness of the boundarylayer and increasing the rate of heat exchange.
Shell-and-Tube Heat ExchangersThis type of heat exchanger frequently is used as an evaporator and is described in a
previous subsection.
References
1. Fellows P. 1988.Food Processing Technology: Principles and Practice, pp.201–209. VCH Publishers.
2. Brennan J. G., J. R. Butters, N. D. Cowell, and A. E. V. Lilly. 1990.Food EngineeringOperations, 3rd ed., pp. 264–278. Elsevier Applied Science.
3. De Leon, S. Y. 1990. InCoconut as Food, ed. J. A. Banzon, O. N. Gonzalez,S. Y. de Leon, and P. C. Sanchez, Philippines Coconut Research and DevelopmentFoundation.
4. Wills, R. B. H., W. B. McGlassen, D. Graham, T. H. Lee, and E. G. Hall. 1989.Postharvest: An Introduction to the Physiology and Handling of Fruit and Vegetables.New South Wales University Press, pp. 117–118.
5. Norman, A. G., ed. 1978.Soybean Physiology, Agronomy and Utilization.6. Salunkhe, D. K., and S. S. Kadam. 1995.Handbook of Fruit Science and Technology.
Marcel Dekker.
380 Fruit and Vegetables
7. Hotchkiss, J. H. 1989. Aseptic processing and packaging of apple juice. InProcessedApple Products, ed. D. L. Downing, pp. 189–212. Van Nostrand Reinhold.
8. Reyes, V. G., L. Somons, and C. Tran. 1995. Preservation of minimally processedcarrots by edible coating and acid treatment. Proceedings Australasian PostharvestHorticulture Conference, Melbourne, Australia, September 1995, pp. 451–456.
9. Siriphanich, J. 1993. Minimal processing of tropical fruits. Proceedings InternationalConference on Postharvest Handling of Tropical Fruits, Chiangmai, Thailand, July1993. Australian Centre for International Agricultural Research, Proceedings No.50, Canberra, pp. 127–137.
10. Reyes, V. G., and I. V. Gould. 1995. Improved processing and packaging of selectedminimally processed vegetables. Proceedings Australasian Postharvest HorticultureConference, Melbourne, Australia, September 1995, pp. 445–450.
11. Powrie, W. D., R. Chiu, H. Wu, and B. J. Skura. 1990. Preservation of cut andsegmented fresh fruit pieces. U.S. Patent No. 4,895,729.
12. Greengrass, J. 1993. Films for MAP of foods. InPrinciples and Applications ofModified Atmosphere Packaging of Food, ed. R. T. Parry. Blackie Academic &Professional.
13. Praditduang, S. 1986. Cold storage of durian.Kasetsart Journal20(1):44–49.14. Tonnanonta, M. 1992. Storage of jackfruit pulp. Undergraduate Special Problem,
Department of Horticulture, Kasetsart University, Bangkok.15. Downing, D. L. 1989. Apple cider. InProcessed Apple Products, ed. D. L. Downing,
pp. 169–187. Van Nostrand Reinhold.16. Robbelen G., R. K. Downey, and A. Ashri. 1989.Oil Crops of the World, pp. 254–
256. New York: McGraw-Hill.17. Chavan, J. K., and S. J. Jadhav. 1995. InHandbook of Fruit Science and Tech-
nology, ed. D. K. Salunkhe, and S. S. Kadam, pp. 485–507. New York: MarcelDekker.
18. Akamine, E. K., and J. H. Moy. 1983. InPreservation of Food by Ionising Radia-tion, ed. E. S. Josephson, and M. S. Peterson, pp. 129–158. Boca Raton, FL: CRCPress.
19. Murray, D. R. 1990.Biology of Food Irradiation, pp. 48–53. Research Studies Pressand John Wiley & Sons.
20. Bott, E. W., and S. Scottler. 1989. Centrifuges, decanters and processing lines forthe citrus industry. Technical-Scientific Documentation No. 14, Westfalia SeparatorAG, Oelde, Germany.
3.6 Fruit and Vegetable Postharvest Systems in the TropicsC. J. Studman
3.6.1 Relevance of Postharvest Engineering for Fruit and Vegetablesin the Tropics
Tropical countries can produce a wide range of food products that have the potentialto supply both their domestic and overseas market needs [1]. As we move into the 21stcentury, there is every opportunity for producers to take advantage of the increasing
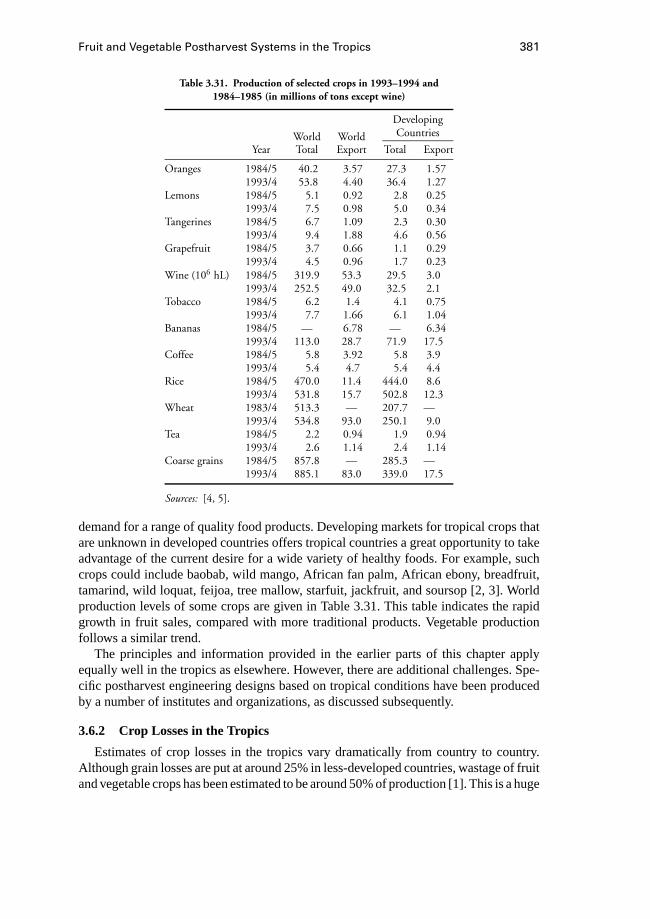
Fruit and Vegetable Postharvest Systems in the Tropics 381
Table 3.31. Production of selected crops in 1993–1994 and1984–1985 (in millions of tons except wine)
Developing
World World Countries
Year Total Export Total Export
Oranges 1984/5 40.2 3.57 27.3 1.571993/4 53.8 4.40 36.4 1.27
Lemons 1984/5 5.1 0.92 2.8 0.251993/4 7.5 0.98 5.0 0.34
Tangerines 1984/5 6.7 1.09 2.3 0.301993/4 9.4 1.88 4.6 0.56
Grapefruit 1984/5 3.7 0.66 1.1 0.291993/4 4.5 0.96 1.7 0.23
Wine (106 hL) 1984/5 319.9 53.3 29.5 3.01993/4 252.5 49.0 32.5 2.1
Tobacco 1984/5 6.2 1.4 4.1 0.751993/4 7.7 1.66 6.1 1.04
Bananas 1984/5 — 6.78 — 6.341993/4 113.0 28.7 71.9 17.5
Coffee 1984/5 5.8 3.92 5.8 3.91993/4 5.4 4.7 5.4 4.4
Rice 1984/5 470.0 11.4 444.0 8.61993/4 531.8 15.7 502.8 12.3
Wheat 1983/4 513.3 — 207.7 —1993/4 534.8 93.0 250.1 9.0
Tea 1984/5 2.2 0.94 1.9 0.941993/4 2.6 1.14 2.4 1.14
Coarse grains 1984/5 857.8 — 285.3 —1993/4 885.1 83.0 339.0 17.5
Sources: [4, 5].
demand for a range of quality food products. Developing markets for tropical crops thatare unknown in developed countries offers tropical countries a great opportunity to takeadvantage of the current desire for a wide variety of healthy foods. For example, suchcrops could include baobab, wild mango, African fan palm, African ebony, breadfruit,tamarind, wild loquat, feijoa, tree mallow, starfuit, jackfruit, and soursop [2, 3]. Worldproduction levels of some crops are given in Table 3.31. This table indicates the rapidgrowth in fruit sales, compared with more traditional products. Vegetable productionfollows a similar trend.
The principles and information provided in the earlier parts of this chapter applyequally well in the tropics as elsewhere. However, there are additional challenges. Spe-cific postharvest engineering designs based on tropical conditions have been producedby a number of institutes and organizations, as discussed subsequently.
3.6.2 Crop Losses in the Tropics
Estimates of crop losses in the tropics vary dramatically from country to country.Although grain losses are put at around 25% in less-developed countries, wastage of fruitand vegetable crops has been estimated to be around 50% of production [1]. This is a huge

382 Fruit and Vegetables
Table 3.32. Percentage crop lossesin developing countries
Estimated Loss ofTotal Crop
Apples 14Avocados 43Bananas 20–80Cabbage 37Carrots 44Cassava 10–25Cauliflower 49Citrus 20–95Grapes 27Lettuce 62Papayas 40–100Plantain 35–100Potatoes 5–40Onions 16–35Raisins 20–95Stone fruit 28Sweet potatoes 35–95Tomatoes 5–50Yams 10–60
Sources: [6, 7].
loss and represents an enormous waste of resources and opportunity. In contrast, losses indeveloped countries are generally around 10% to 25%. Examples are given in Table 3.32.
There can be many reasons for losses. The existence of and access to a suitablemarket outlet at an economic price, knowledge of postharvest principles, available storagefacilities, availability of labor, good handling systems, and good product managementare all essential components of the successful utilization of fruit and vegetables, andonly if all these factors are present can losses be reduced significantly. Good postharvestpractices can reduce losses substantially, but implementation requires good education,good systems, good management, and the availability of resources. Preharvest practicesare discussed elsewhere [6, 8].
3.6.3 Marketing Issues for Less-Developed Countries
Fruit and vegetables contain most of the mineral and vitamin needs for humans. Byreducing postharvest losses, there is the potential to almost double the nutritional supplywithout another green revolution, and without further additions of fertilizer, irrigation,or even land area.
However, political and sociological factors may determine whether a producer wishesto become involved in these markets. There is a considerable risk factor, and producersmust consider the balance between risk and return.
On the domestic market there are a number of challenges and pitfalls, particularlyin marketing quality products [9]. Projects involving government-fixed pricing, food
Fruit and Vegetable Postharvest Systems in the Tropics 383
processing of surpluses, mechanization, national grading standards, long-term storage,high-quality handling and packaging systems, and government-run operations all haveresulted in costly failures at times in less-developed countries [9]. Improving qualitywill be successful only if there is a potential market able to pay higher prices for qualityproducts. Local domestic markets may not recognize the nutritional value of fruits andvegetables [9–18]. Competitors may force prices down below economic levels.
In addition, the international marketplace is highly competitive, and returns in oneyear cannot be guaranteed the next year. Suppliers are dependent on the marketing in-frastructure in the overseas market, and this requires investment and expertise. Consumerpreferences can be affected by adverse advertising arising from relatively minor failuresof quality-control systems somewhere in the postharvest chain, and the failure may beoutside the control of the producer. Marketing chains require guaranteed supplies ofquality product, which is a challenging demand for any biological product for whichyield is related to uncontrollable factors such as climate, rainfall, pest incidence, and anyother disturbances to the production cycle, including political and sociological factors.Growers and producers normally must place the importance of providing quality productfor the international market above the needs of the domestic market. The local marketmay become the outlet for second-grade product. However, as the industry strives tomeet international standards, the overall quality of product has to improve, so domesticmarket quality also can benefit from international marketing.
3.6.4 Engineering Challenges to Postharvest Systems in the Tropics
TemperatureAs discussed earlier, temperature is one of the major factors in quality loss after
harvest. It is essential to cool fruit and vegetables as quickly as possible to the lowesttemperature they can sustain without chilling injury (see Section 3.2). Unfortunately,many tropical products begin to experience this physiological disorder at around 10to 13◦C, and so this sets a lower limit to the storage temperature. Values of recom-mended storage temperatures are listed in the Appendix, Table 3.A3. There has beensome evidence to suggest that in some fruits, chilling injury can be reduced by aninitial hot-water treatment (a few minutes in water at around 45◦C) [19, 20]. This mayenable storage of fruit at lower temperatures. For some products, particularly local cul-tivars of tropical fruit and vegetables, storage and handling requirements are unknown.
Where conventional refrigeration systems are available these should be used (seeSection 3.4). In some regions, cool stores may need to be designed to allow for lengthymains power failures. Back up power generation also may be needed. In many less-developed countries, most producers do not have access immediately to sufficient cool-storage space. Traditional home-storage methods should not be ignored, as these haveevolved from practical experience with the particular crop cultivars grown in the regionand are tuned to the local environmental conditions [2, 3, 18, 21–26]. However, thetreatments may be cultivar-specific, and modification may be necessary for new varieties.
Some vegetable crops (mainly root crops) have appreciable periods of dormancy be-fore the normal aging process continues. Yams, potatoes, beets, carrots, and onions canbe stored for lengthy periods without cool storage, although the extent depends on the
384 Fruit and Vegetables
cultivar. Some are best left in the soil, where temperatures are cooler, providing the soilis not too wet and the crops are protected from attack by animals. Onions and garlic canbe stored hung up using twine in shaded areas. Other vegetables, such as peas and beans,can be dried. Leafy vegetables, including brassicas, fruits, and other vegetables deteri-orate rapidly after harvest, and preservation processes such as sun drying or domesticprocessing using sugar, brine, or vinegar are effective. Fermentation processes also canbe used to preserve cabbage, breadfruit, radishes, cassava roots, taro, and green bananas.Some fruits can be sun-dried (e.g., coconut copra, herbs, and spices).
Options for reducing temperature without conventional refrigeration are described inthe following subsections.
Ventilated StoresSuitable for crops with long storage lives, these should be built where the night-time
air temperature is low during the storage period, and where the best breeze can be found.The building should be orientated to make use of the breeze as much as possible. If night-time temperatures are very low, hot-air in-flow during the day can be reduced with louvresor screens. The roof and walls should be well insulated: Grass thatch materials also canbe wetted to produce evaporative cooling. Alternatively, white paint on exterior surfacesreduces absorption of heat. Double-skinned walls also are better than single-layer walls.Ventilation between walls and roof and under the floor also is needed [24–26].
Root crops can be stored on the ground in simple clamps, consisting of a long triangularpile of the product 1 to 2 m wide, covered by straw and soil layers, and with adequateprovision for water run-off. Ventilation also is provided by making a triangular openchannel at the base of the pile in the center and running the length of the pile. Thiscentral duct may need vertical chimney vents at regular intervals (see Chapter 2).
Local FeaturesCaves can be used in regions in which they remain cool throughout the storage period.
Fruit and vegetables can be stored longer if they are kept in stores on high ground, whereair temperatures are lower. Cold running water also can be used to remove heat.
Postharvest ProceduresKeeping crops cool can be achieved by very simple means. If crops are harvested just
before the sunrise they will be at their coolest. Once harvested they should be kept out ofthe sun. Thus, in the field harvested products should be placed in the shade at all times.They should be covered during daytime transportation, and trucks should not be parkedin the direct sun. In the marketplace fruit and vegetables also should be shaded. Althoughobvious, these practices often are not followed. Products also require ventilation, as theygenerate heat internally, and unless this is removed continuously, the temperature willrise and deterioration will be accelerated.
Handling, Packaging, and TransportationThe same issues apply to tropical products as any other fruit or vegetable (see Section
3.3). Good packaging and careful handling increase the storage life of most crops andreduce damage. However, in less-developed countries problems can be exacerbated by
Fruit and Vegetable Postharvest Systems in the Tropics 385
ignorance and cost-cutting. Roads can be very rough and delays common. Distancescan be great and packaging minimal. In many markets it is considered uneconomicalor impractical to use packaging, and so a high level of damage is accepted. Packagingcan be produced from local biodegradable materials [6]. Options include bags, sacks,and woven baskets, but these offer little protection for the product. Wood boxes providesome protection but may not be acceptable on international markets. Cardboard or plasticcontainers also may be available (see Section 3.3). It also is possible to use secondhandcontainers if these are available locally.
Grading SystemsSimple off-floor grading systems are recommended for less-developed countries [8,
10]. In less-developed countries the majority of handling is likely to be done by hand, withlimited options for mechanized systems. Machinery for automatic sizing and weighingmay be appropriate, but because humans are generally better at sorting fresh produce forquality, low-cost labor can be an advantage.
Storage SystemsModern and traditional storage systems have a continuing role to play in the tropics.
Modified designs of traditional structures can greatly reduce losses due to vermin andother pests. For many fruits and vegetables drying adds to storage life, and stores canbe based on designs developed for cereals [21–28]. Pest management is a major issue[29–31].
Wholesale MarketsWholesale-market designs for less-developed countries have been discussed by the
United Nations Food and Agriculture Organisation [32]. In addition to the normal issuesthat arise in the design and siting of buildings, factors that may need special attentioninclude the following.
Roads and ParkingTable 3.33 gives guidelines for roads and parking suggested by the United Nations
Food and Agriculture Organisation.
Internal and External LightingThis should be at a high level internally (500–1000 lux), using fluorescent tubes to
minimize heat gain. Outside roads require only around 12 lux [32].
Mechanical Ventilation or Air-ConditioningThe environment inside a large wholesale market in the tropics can be very unpleasant.
Fruit and vegetables are respiring, and loading and unloading vehicles produce muchheat. Roof extractor fans and natural ventilation can reduce temperatures by 3 to 5◦C [32].
Waste-Disposal SystemAn allowance of 5% to 10% of product turnover is needed. Local domestic systems
may not be designed to cope with the volume involved, and so special arrangements areneeded. Interchangeable containers offer a convenient way of dealing with waste. The

386 Fruit and Vegetables
Table 3.33. Appropriate road-design criteria for wholesale markets
Length Width Radius Gradient(m) (m) (m) (%)
RoadsLane width 3.5 0.5–5Minimum width (1-way) 7.0 0.5–5Minimum width (2-way) 12.0 0.5–5Maneuvering distance 8.0Outside curb curve: minimum 10.5Outside curb curve: preferred 15.0Solid waste turning vehicle space 18.0Loading bays (end-on): minimum 8.0 3.75Loading bays (end-on): preferred 12.0 4.0
Access rampsUp ramp: minimum width and maximum slope 5.5 8.0Up/down ramp: minimum width and maximum 7.0 6.0
slopePreferred minimum width and maximum slope 7.0 5.0
Vehicle lengthsPick-up/minibus 5.0 2.0Standard truck 8.5 2.5Articulated truck 15.0 2.5Truck with trailer 18.5 2.5
Parking spacesPick-up 8.0 3.65Truck 11.0 3.65Small car (minimum) 4.8 2.4 2.0–5.0
Source: [32].
containers are placed at strategic locations and collected by truck when full, or at settimes, with an empty container delivered at the same time.
Water and SewerageRequirements for water and sewerage in markets are higher than in other buildings
due to the requirements for cleaning. For a 10,000-m2 market, a daily demand of 75,000L is likely. This includes some produce washing and a 10,000 L allowance for coolstorage. Sanitary requirements should be around 1 unit per 15 to 25 persons [32].
Roof CladdingThe cladding is likely to be a critical design component. It must be able to perform
under the conditions of high humidity and temperature. It should have a low U-value(e.g., less than 0.85 W·m−2 · ◦C−1) to prevent heating from the sun.
3.6.5 Role of the Agricultural Engineer
If a farmer wishes to retain a subsistence level of farming, then the agriculturalengineer’s role is to advise and develop systems that allow this level of operation to work
Fruit and Vegetable Postharvest Systems in the Tropics 387
in a totally sustainable fashion [14, 18]. As population density increases and land becomesmore scarce, the need for improved efficiency will grow. Packaging and storage studieswill need to focus on solutions that can be achieved on-farm with minimum externalinputs.
If the decision is made to develop and market produce, the agricultural engineermust use his or her expertise to aid the industry with its development. Quality, safety,and reliability of product supply must be assured if overseas markets are to be securedand developed. These are major issues that cannot be ignored. Agricultural engineersand scientists need to be aware of the challenges and then seek to find their own solutionsthat are best suited to the local culture and society. This may be far from the traditionalconcept of the designer and builder of machinery. He or she is also likely to be involvedin the following.
Quality Standards and ManagementEstablishing quality standards is a key component to any significant long-term im-
provement in the quality of products [33, 34]. Export standards can be the main drivingforce, although it is possible for local industries to establish their own grading standards(e.g., Appendix, Table 3.A1). Examples of standards include apple and kiwifruit qualitymanuals, which govern all aspects of fruit production including preharvest spraying,harvesting, time to cool after harvest, weight, and packaging requirements, as well asstandards relating to color, shape, and appearance [35, 36]. The United Nations Food andAgriculture Organisation has produced a series of manuals designed to assist govern-ments of developing countries to establish workable food control systems [16, 37–41].
Measurement TechniquesNew measures that are nondestructive but indicate quality are likely to have a profound
effect on the success of any crop (see Section 3.1).
Information TransferIn tropical countries the postharvest infrastructure for many important crops is depen-
dent on individual farmers and producers with limited resources. Even though postharvestresearchers are becoming increasingly aware of the requirements for successful storageof commercially important food products, all too often systems are poorly designedor fail as a result of economic constraints, lack of knowledge, or inadequate quality-management systems to ensure that standards are adhered to. New packaging systems,such as modified-atmosphere storage, introduce new opportunities for extending thestorage lifetime of products, but these require careful design and an understanding of thephysiological aspects of storage (see Sections 3.2 and 3.4).
Food ProcessingDevelopment of simple and advanced processing techniques reduces losses, enables
gluts to be managed without flooding markets with produce, and provides long-term foodstorage [2, 3, 16, 42–44]. In particular, Dauthy [42] has produced a manual of processingguidelines for less-developed countries.
388 Fruit and Vegetables
3.6.6 Future Prospects and Challenges
There is a large number of crops, especially in less-developed countries, that bear edi-ble fleshy parts or nuts of acceptable quality. These are largely harvested either from wildtrees or seedlings nurtured in small plantings [1, 18, 45–47]. The economic potential ofthese crops has been recognized, especially as traditional fruit crops come under severepressure due to increasing production and declining profits [48, 49]. Currently manysuch crops are produced only for domestic markets, where quality standards are oftenminimal or nonexistent [33]. In any country, poor quality-control standards for produceresult in unfavorable competition with foreign produce, even on the domestic market. Forexample, currently most less-developed countries suffer trade deficits on fruits and veg-etables [50]. The development and implementation of relevant quality standards wouldenable produce to be traded more competitively in international markets. It has been ar-gued that less-developed countries could increase their share of the world fresh-producemarket “if the necessary standards were met” [50, 51]. Among these, food safety will beincreasingly important in the future.
Numerous studies of the introduction of new technologies to a society show howdeeply interdependent are the technical, economic, political, social, and cultural factorsinvolved in the process of technical change. Transformations in society and technologyare at the same time cause-and-effect, and the ways in which societies adapt to thesetransformations are no more systematic than the technical system is static. Thus, theunderstanding and effective management of the process of technological change requiresan approach involving the expertise and analytical skills of several disciplines from theengineering to the social sciences. It is also important to emphasise that less-developedcountries should not be treated as a homogenous group, because particular strengths andweaknesses vary widely between countries.
Social IssuesThere have been renewed concerns in both developed and developing countries about
the introduction of technology into the third world on the one hand and the relativelylow success rate of many development programs on the other. Technology cannot simplybe transposed to developing countries: Too many socio-cultural and techno-economicfactors can affect the situation [52]. For example, the success or failure of development-assistance programes may depend on the level of trust created between the “donor” and“recipient” [53]. It now is generally agreed that those technologies most likely to beadopted by developing countries are those that are appropriate and acceptable. That is,in addition to operational and technical suitability, the technology must be profitable,affordable, and available [54], and sensitive towards cultural, social, and environmentalissues.
CultureCulture is the set of shared values, attitudes, and behaviors that characterize and guide
a group of people. As a rule, less-developed countries tend to have more rigid socialstructures, stronger religious influences, very distinct gender roles, and a high diversityof languages. Certain practical implementation issues also may affect the development,
Fruit and Vegetable Postharvest Systems in the Tropics 389
testing, evaluation, and application of quality-control practices in the fresh-produceindustry of developing countries. The cultivation of horticultural crops follows a well-defined gender line in most developing countries, with the men active in the productionand marketing of fruits, and the women predominantly engaged in vegetable production[51]. Similarly, religious beliefs cannot be ignored in determining the acceptability ofnew or improved technologies [17, 55]. The culture of the consumer also may not beunderstood by the supplier, so that the quality expectations of the overseas consumermay not be recognized or appreciated by the employee who is to grade the produce. Thismakes the training of staff and the adherence to quality standards particularly difficult.
LaborGenerally, skilled labor is scarce and unskilled abundant. Education levels are low in
many less-developed countries, although some have achieved nearly universal literacy.Training for quality control can be hampered by a lack of basic education and theinability to understand the need for quality standards. However, much grading of fruitand vegetable produce relies on the human eye; with abundant labor it should be easierto select, train, and employ people in less-developed countries.
InfrastructureThe efficiency of transportation systems has a major impact on quality-assurance
procedures. It is not uncommon to find that major roads are poorly maintained. Thereis often a high frequency of equipment breakdown due in part to unsuitable operatingconditions. Repair and maintenance facilities may be inadequate, and power suppliesmay be irregular. Village blacksmiths are often the repositories of knowledge on localraw materials and manufacture of spare parts. As much as possible, manufacture of someor all equipment should be carried out in the developing country. In addition to providingfor the participation of the population, local manufacture may further promote integratedsocial structure through the growth of industries associated with raw materials supplyand marketing.
Good information on domestic and foreign supply and demand, prices, and quality isimportant for the successful export of fresh produce. Marketing constraints include a lackof information concerning quality requirements and packaging, poor quality of produce,and inadequate quality standards. The managerial implication of a lack of infrastructureis that the export enterprise must take on the burden of providing or improving itsown infrastructure (e.g., establishing information networks, purchasing transportationsystems).
InstitutionsThe political fluidity of some less-developed countries weakens the institutions of
government. Bureaucracies are often technically weak and inefficient. They are fre-quently overstaffed, underpaid, and in some instances underqualified. The implicationsof this for postharvest quality are inefficient, slow, and costly government services thathave the task of approving export shipments. Centralization of governmental decisionmaking may prevent an export company from moving quickly in response to market
390 Fruit and Vegetables
demand. There also may be a lack of flexibility in some educational institutions, thatcould or should be key players in training staff.
Sometimes, a quality attribute becomes less important and another, more importantfactor arises due to consumer preference and other competitive pressures. Alternatively,new or revised government regulations may dictate changes in quality requirements[56]. Activities of political pressure groups in overseas markets also may lead to suddenchanges in quality specifications, particularly where a crop is perceived to affect envi-ronmental, health, or social structures. Structures and standards therefore must be ableto react rapidly to market changes.
Management StructuresBoth less-developed and developed countries need to ensure that there is a prod-
uct quality–management component in agricultural-development programs. Individualfarmers are unlikely to develop the grading, storage, and distribution systems for theirproduce that will be demanded by the international market. Cooperative systems maybe able to make progress towards introducing quality-assurance systems, but in gen-eral many less-developed country farmers have demonstrated an innate resistance toparticipate in co-operatives [11].
In order to meet existing international standards so as to compete favorably in thesophisticated “world market” of fresh fruits and vegetables, managers should be kept fullyaware of developments in international trading agreements and regulations. For examplethere may be considerable advantages in marketing by gaining ISO 9000 certificationfor quality-management procedures (see Section 3.1).
References
1. Acland, J. D. 1971.East African Crops. London: United Nations Food and Agricul-ture Organisation/Longman.
2. Lancaster, P. A., and D. G. Coursey. 1984. Traditional post-harvest technology ofperishable tropical staples. Agricultural Services Bulletin 59. Rome: United NationsFood and Agriculture Organisation.
3. Bencini, M. C., and J. P. Walston. 1991. Post-harvest and processing technologies ofAfrican staple foods: A technical compendium. Agricultural Services Bulletin 89.Rome: United Nations Food and Agriculture Organisation.
4. FAO. 1995. Commodity review and outlook 1994–5. Economic and Social Devel-opment series 53. Rome: United Nations Food and Agriculture Organisation.
5. FAO. 1985. Commodity review and outlook 1984–5. Economic and Social Devel-opment series. Rome: United Nations Food and Agriculture Organisation.
6. Thompson, A. K. , 1996.Postharvest Technology of Fruit and Vegetables. Oxford:Blackwell.
7. Post-harvest Food Losses in Developing Countries. 1978. Washington: NationalResearch Council, U.S. National Academy of Sciences.
8. Rice, R. P., L. W. Rice, and H. D. Tindall. 1987.Fruit and Vegetable Production inAfrica. London: Macmillan.
Fruit and Vegetable Postharvest Systems in the Tropics 391
9. Dixie, G. 1989. Horticultural marketing: A resource and training manual for exten-sion officers. Agricultural Services Bulletin 76. Rome: United Nations Food andAgriculture Organisation.
10. FAO. 1986.Improvement of Post-harvest Fresh Fruits and Vegetables Handling.Bangkok: United Nations Food and Agriculture Organisation.
11. Grierson, W. 1991. HortTechnology and the developing countries.Horttechnology(Oct/Dec):136–137.
12. Kader, A. A. 1983. Postharvest quality maintenance of fruits and vegetables indeveloping countries. InPostharvest Physiology and Crop Production, pp. 455–470. New York: Plenum.
13. Thomson, A., and N. Terpend. 1993. Promoting private sector involvement in agri-cultural marketing in Africa. Agricultural Services Bulletin 106. Rome: UnitedNations Food and Agriculture Organisation.
14. FAO. 1992. Agricultural engineering in development-training and education pro-grammes. Agricultural Services Bulletin 92. Rome: United Nations Food and Agri-culture Organisation.
15. FAO. 1989. Utilization of Tropical Foods. Food And Nutrition Bulletin 47 (No. 1cereals, 2 roots and tubers, 3 trees, 4 beans, 5 oil seeds, 6 spices, 7 fruit, 8 animalproducts). Rome: United Nations Food and Agriculture Organisation.
16. FAO. 1989. Quality control in fruit and vegetable processing. Food And NutritionBulletin 39. Rome: United Nations Food and Agriculture Organisation.
17. Solhjoo, K. 1994. Food technology and the Bahai Faith.Food Science and Technol-ogy Today, 8(1):2–3.
18. Amos, N. D., L. U. Opara, B. Ponter, C. J. Studman, and G. L. Wall. 1994. Techniquesto assist with meeting international standards for the export of fresh produce fromless developed countries. Proc. X11 CIGR World Congress, Milan, Italy, vol 2, pp.1587–1594.
19. Li, M., D. C. Slaughter, and J. F. Thompson. 1997. Quality of Kensington mangofruit following combined vapor heat disinfestation and hot water disease controltreatments.Postharvest Biology and Technology12:273–284.
20. Lay-Yee, M., and K. J. Rose. 1994. Quality of Fantasia nectarines following forced-air heat treatments for insect disinfestation.HortScience27:1254–1255.
21. Sode, O. 1990. Agricultural engineering in development: Design and constructionguidelines for village stores. Agricultural Services Bulletin 82. Rome: United Na-tions Food and Agriculture Organisation.
22. Bodholt, O. 1985. Construction of cribs for drying and storage of maize. AgriculturalServices Bulletin 66. Rome: United Nations Food and Agriculture Organisation.
23. de Lucia, M., and D. Assennato. 1994. Agricultural engineering in development:Post-harvest operations and management of foodgrains. Agricultural Services Bul-letin 93. Rome: United Nations Food and Agriculture Organisation.
24. Cruz, J. F., and A. Diop. 1989. Agricultural engineering in development: Ware-house technique. Agricultural Services Bulletin 74. Rome: United Nations Foodand Agriculture Organisation.
392 Fruit and Vegetables
25. Kat, J., and A. Diop. 1985. Manual on the establishment operation and managementof cereal banks. Agricultural Services Bulletin 64. Rome: United Nations Food andAgriculture Organisation.
26. FAO. 1985. Standardised designs for grain stores in hot dry climates. AgriculturalServices Bulletin 62. Rome: United Nations Food and Agriculture Organisation.
27. FAO. 1984. Agricultural engineering of cold stores in developing countries. Agri-cultural Service Bulletin 19/2. Rome: United Nations Food and Agriculture Organ-isation.
28. Farm Electric Centre. 1989.Grain Drying, Conditioning and Storage. Stoneleigh,UK: Electricity Council, Farm Electric Centre.
29. FAO. 1994. Rodent pest management in Eastern Africa. Plant protection and pro-duction paper 123. Rome: United Nations Food and Agriculture Organisation.
30. FAO. 1981. Food loss prevention in perishable crops. Agricultural Service Bulletin43. Rome: United Nations Food and Agriculture Organisation.
31. FAO. 1983. Food loss prevention in perishable crops. Agricultural Service Bulletin92. Rome: United Nations Food and Agriculture Organisation.
32. Tracey-White, J. D. 1991. Wholesale markets: Planning and design manual.Agricultural services bulletin 90. Rome: United Nations Food and AgricultureOrganisation.
33. Kader, A. A. 1983. Postharvest quality maintenance of fruits and vegetables indeveloping countries. InPostharvest Physiology and Crop Preservation, ed. M.Lieberman, pp. 520–536. New York: Plenum.
34. Kader, A. A. 1992. Postharvest technology of horticultural crops. Publication 3311,2nd ed., University of California, Davis.
35. Enzafruit. 1996. New Zealand apple quality standards manual. Hastings, NewZealand: New Zealand Apple and Pear Marketing Board (Enzafruit International).
36. New Zealand Kiwifruit Marketing Board. 1996.Kiwifruit Quality Standards Man-ual. Auckland, New Zealand: United Nations Food and Agriculture Organisation.
37. Martin, P. G. 1986. Manuals of food quality control: The food control laboratory.Food and nutrition paper 14/1 Rev.1. Rome: United Nations Food and AgricultureOrganisation.
38. Dhamija, O. P., and W. C. K. Hammer. 1990. Manual of food quality control: Foodfor export. Food and Nutrition Paper 14/6, Rev. 1. Rome: United Nations Food andAgriculture Organisation.
39. FAO. 1984. Manuals of food quality control: Food inspection. Food and NutritionPaper 14/5. Rome: United Nations Food and Agriculture Organisation.
40. FAO. 1991. Manual of food quality control: Quality assurance in the food controlmicrobiological laboratory. Food and Nutrition Paper 14/12. Rome: United NationsFood and Agriculture Organisation.
41. FAO. 1993. Manual of food quality control: Quality assurance in the food controlchemical laboratory. Food and Nutrition Paper 14/14. Rome: United Nations Foodand Agriculture Organisation.
42. Dauthy, M. E. 1995. Fruit and vegetable processing. Agricultural Services Bulletin119. Rome: United Nations Food and Agriculture Organisation.
Appendix 393
43. Werkhoven, J. 1974. Tea processing: 1974. Agricultural Services Bulletin 26. Rome:United Nations Food and Agriculture Organisation.
44. Russell, D. C. 1969. Cashew Nut Processing. Agricultural Services Bulletin 6. Rome:United Nations Food and Agriculture Organisation.
45. Wood, B. W., and J. A. Payne. 1991. Pecan: An emerging crop.Chronica Horticul-turae31(2):21–23.
46. Parmar, C. 1991. Some Himalayan wild fruits worth trial elsewhere.Chronica Hor-ticulturae31(2):19–20.
47. Harrison, P. 1987.The Greening of Africa. London: Grafton Books.48. Menini, U. G. 1991. Potential and issues for collaborative action on tropical fruit
research and development.Chronica Horticulturae31(3):38–39.49. Krezdorn, A. H. 1970. Teaching and research for tropical overseas horticulture.
Hortscience5(6):9–10.50. Hutabarat, B. 1989. Issues and strategies for developing Indonesian horticultural
subsector.IARD Journal11(1&2):5–13.51. Aubee, E. R. 1992. Prospects and constraints of Gambian horticulture.Chronica
Horticulturae32(4):59–60.52. Pollard, S., and J. Morris. 1978. Economic aspects of the introduction of small trac-
tors in developing countries: Towards a philosophy for small tractor development.Agricultural Engineer33(2):29–31.
53. Opara, L. U. 1994. Report on New Zealand Trade Conference, Massey University,Wellington, New Zealand.
54. Opara, L. U. 1989. Computer-aided model for selective agricultural mechanisa-tion in Nigeria, Nsukku. Proc. 13th Annual Conference of the Nigerian Society ofAgricultural Engineers Paper 89/FPM/08. Zaria, Nigeria: NSAE.
55. May, B. A. 1988. Agricultural engineering in third world countries 1938 to 1988(parts 1 and 2).Agricultural Engineer43(3):83–92, 43(4):112–126.
56. Kramer, A. 1973. Impact of changing quality requirements.Hortscience8(2):2–3.
Appendix
Tables 3.A1, 3.A2, 3.A3, and 3.A4 follow on next page.
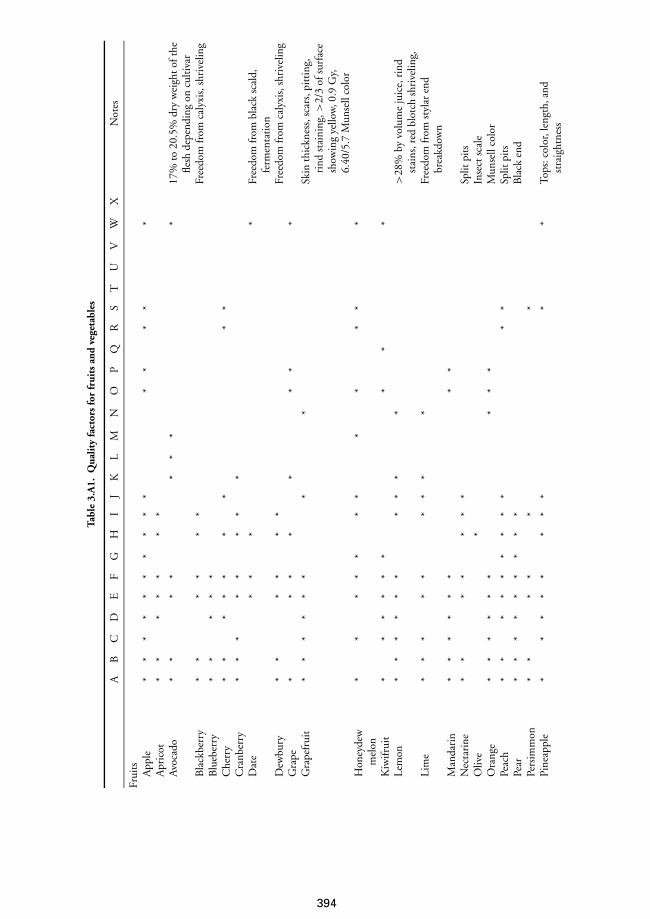
Tabl
e3.
A1.
Qua
lity
fact
ors
for
frui
tsan
dve
geta
bles
AB
CD
EF
GH
IJ
KL
MN
OP
QR
ST
UV
WX
Not
es
Frui
tsA
pple
**
**
**
**
**
**
**
*A
pric
ot*
**
**
**
Avo
cado
**
**
**
**
17%
to20
.5%
dry
wei
ghto
fthe
flesh
depe
ndin
gon
culti
var
Bla
ckbe
rry
**
**
**
Free
dom
from
caly
xis,
shri
velin
gB
lueb
erry
**
**
*C
herr
y*
**
**
**
**
Cra
nber
ry*
**
**
**
*D
ate
**
**
Free
dom
from
blac
ksc
ald,
ferm
enta
tion
Dew
bury
**
**
**
Free
dom
from
caly
xis,
shri
velin
gG
rape
**
**
**
**
Gra
pefr
uit
**
**
**
**
Skin
thic
knes
s,sc
ars,
pitt
ing,
rind
stai
ning
,>2/
3of
surf
ace
show
ing
yello
w,0
.9G
y,6.
40/5
.7M
unse
llco
lor
Hon
eyde
w*
**
**
**
**
**
*m
elon
Kiw
ifrui
t*
**
**
**
**
Lem
on*
**
**
**
**
*>
28%
byvo
lum
eju
ice,
rind
stai
ns,r
edbl
otch
shri
velin
g,Li
me
**
**
**
**
*Fr
eedo
mfr
omst
ylar
end
brea
kdow
nM
anda
rin
**
**
**
**
Nec
tari
ne*
**
**
**
Split
pits
Oliv
e*
Inse
ctsc
ale
Ora
nge
**
**
**
**
*M
unse
llco
lor
Peac
h*
**
**
**
**
**
Split
pits
Pear
**
**
**
**
*B
lack
end
Pers
imm
on*
**
**
*Pi
neap
ple
**
**
**
**
**
Tops
:col
or,l
engt
h,an
dst
raig
htne
ss
394
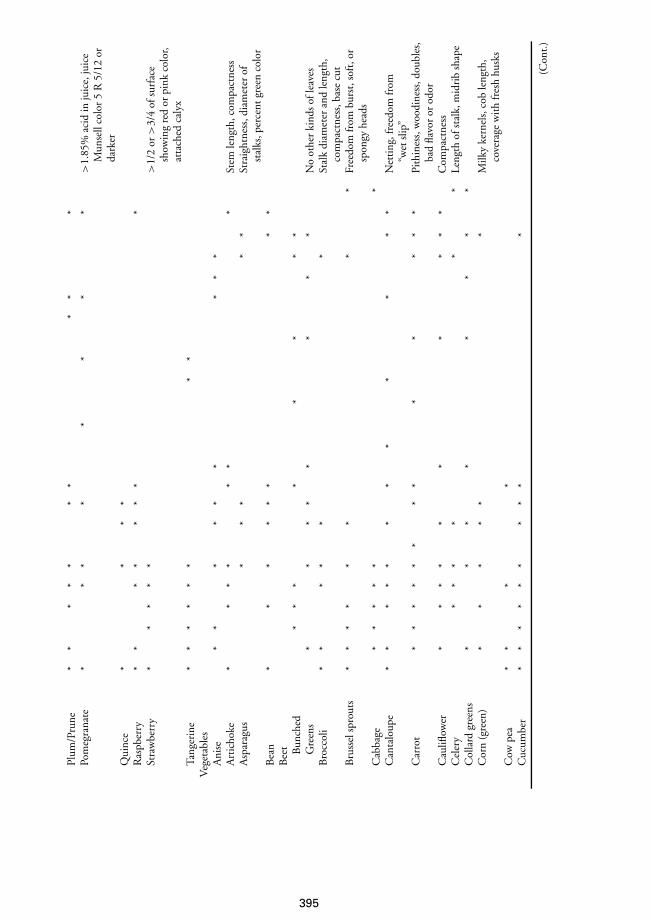
Plum
/Pru
ne*
**
**
**
**
*Po
meg
rana
te*
**
**
**
*>
1.85
%ac
idin
juic
e,ju
ice
Mun
sell
colo
r5
R5/
12or
dark
erQ
uinc
e*
**
*R
aspb
erry
**
**
**
**
Stra
wbe
rry
**
**
*>
1/2
or>
3/4
ofsu
rfac
esh
owin
gre
dor
pink
colo
r,at
tach
edca
lyx
Tang
erin
e*
**
**
**
*eg
etab
les
Ani
se*
**
**
**
**
Art
icho
ke*
**
**
**
Stem
leng
th,c
ompa
ctne
ssA
spar
agus
**
**
*St
raig
htne
ss,d
iam
eter
ofst
alks
,per
cent
gree
nco
lor
Bea
n*
**
**
**
*B
eet Bun
ched
**
**
**
**
Gre
ens
**
**
**
**
No
othe
rki
nds
ofle
aves
Bro
ccol
i*
**
**
*St
alk
diam
eter
and
leng
th,
com
pact
ness
,bas
ecu
tB
russ
elsp
rout
s*
**
**
**
*Fr
eedo
mfr
ombu
rst,
soft
,or
spon
gyhe
ads
Cab
bage
**
**
**
Can
talo
upe
**
**
**
**
**
**
Net
ting
,fre
edom
from
“wet
slip
”C
arro
t*
**
**
**
**
**
**
Pith
ines
s,w
oodi
ness
,dou
bles
,ba
dfla
vor
orod
orC
aulifl
ower
**
**
**
**
**
Com
pact
ness
Cel
ery
**
**
**
Leng
thof
stal
k,m
idri
bsh
ape
Col
lard
gree
ns*
**
**
**
*C
orn
(gre
en)
**
**
**
Milk
yke
rnel
s,co
ble
ngth
,co
vera
gew
ith
fres
hhu
sks
Cow
pea
**
**
Cuc
umbe
r*
**
**
**
**
*
(Con
t.)
V
395
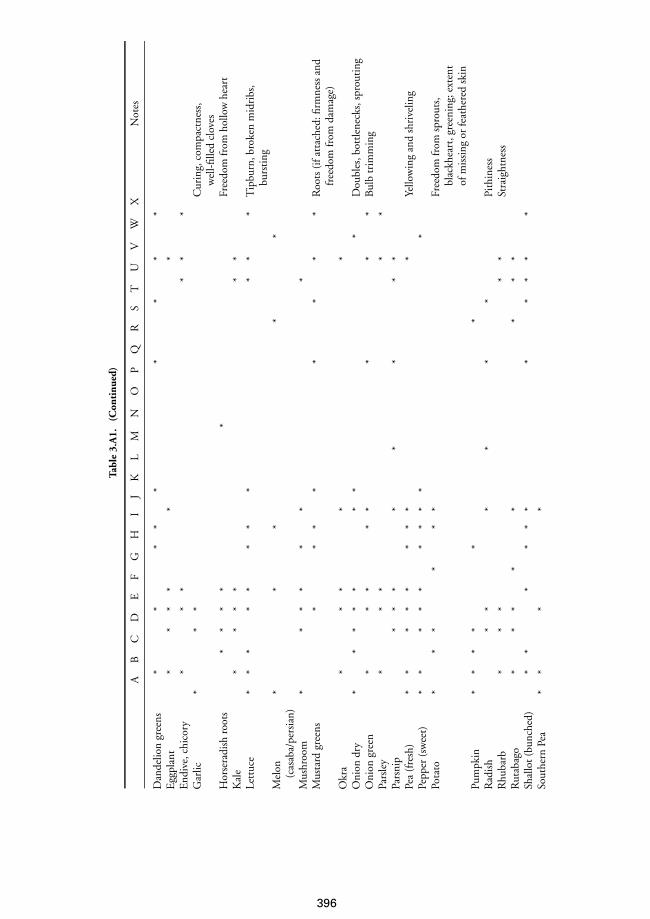
Dan
delio
ngr
eens
**
**
**
**
*E
ggpl
ant
**
**
**
End
ive,
chic
ory
**
**
**
Gar
lic*
**
Cur
ing,
com
pact
ness
,w
ell-
fille
dcl
oves
Hor
sera
dish
root
s*
**
**
Free
dom
from
hollo
whe
art
Kal
e*
**
**
*Le
ttuc
e*
**
**
**
**
**
Tip
burn
,bro
ken
mid
ribs
,bu
rsti
ngM
elon
**
**
*(c
asab
a/pe
rsia
n)M
ushr
oom
**
**
**
*M
usta
rdgr
eens
**
**
**
**
Roo
ts(i
fatt
ache
d:fir
mne
ssan
dfr
eedo
mfr
omda
mag
e)O
kra
**
**
*O
nion
dry
**
**
**
**
Dou
bles
,bot
tlene
cks,
spro
utin
gO
nion
gree
n*
**
**
**
*B
ulb
trim
min
gPa
rsle
y*
**
**
Pars
nip
**
**
**
**
Pea
(fre
sh)
**
**
**
**
*Ye
llow
ing
and
shri
velin
gPe
pper
(sw
eet)
**
**
**
**
**
Pota
to*
**
**
*Fr
eedo
mfr
omsp
rout
s,bl
ackh
eart
,gre
enin
g;ex
tent
ofm
issi
ngor
feat
here
dsk
inPu
mpk
in*
**
**
*R
adis
h*
**
**
*Pi
thin
ess
Rhu
barb
**
**
*St
raig
htne
ssR
utab
ago
**
**
**
**
Shal
lot(
bunc
hed)
**
**
**
**
**
*So
uthe
rnPe
a*
**
*
Tabl
e3.
A1.
AB
CD
EF
GH
IJ
KL
MN
OP
QR
ST
UV
WX
Not
es
(Con
tinu
ed)
396
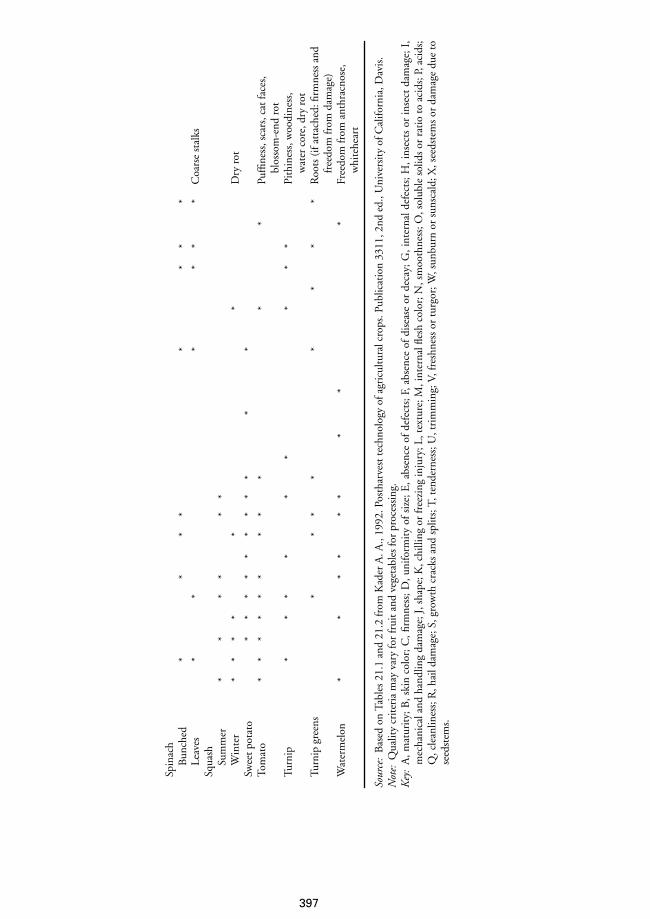
Leav
es*
**
**
*C
oars
est
alks
Squa
shSu
mm
er*
**
**
*W
inte
r*
**
**
*D
ryro
tSw
eetp
otat
o*
**
**
**
**
**
Tom
ato
**
**
**
**
**
*Pu
ffine
ss,s
cars
,cat
face
s,bl
osso
m-e
ndro
tTu
rnip
**
**
**
**
*Pi
thin
ess,
woo
dine
ss,
wat
erco
re,d
ryro
tTu
rnip
gree
ns*
**
**
**
*R
oots
(ifa
ttac
hed:
firm
ness
and
free
dom
from
dam
age)
Wat
erm
elon
**
**
**
**
*Fr
eedo
mfr
oman
thra
cnos
e,w
hite
hear
t
Sour
ce:
Bas
edon
Tabl
es21
.1an
d21
.2fr
omK
ader
A.A
.,19
92.P
osth
arve
stte
chno
logy
ofag
ricu
ltura
lcro
ps.P
ublic
atio
n33
11,2
nded
.,U
nive
rsit
yof
Cal
iforn
ia,D
avis
.N
ote:
Qua
lity
crit
eria
may
vary
for
frui
tand
vege
tabl
esfo
rpr
oces
sing
.K
ey:
A,m
atur
ity;
B,s
kin
colo
r;C
,firm
ness
;D,u
nifo
rmit
yof
size
;E,a
bsen
ceof
defe
cts;
F,ab
senc
eof
dise
ase
orde
cay;
G,i
nter
nald
efec
ts;H
,ins
ects
orin
sect
dam
age;
I,m
echa
nica
land
hand
ling
dam
age;
J,sh
ape;
K,c
hilli
ngor
free
zing
inju
ry;L
,tex
ture
;M,i
nter
nalfl
esh
colo
r;N
,sm
ooth
ness
;O,s
olub
leso
lids
orra
tio
toac
ids;
P,ac
ids;
Q,c
lean
lines
s;R
,hai
ldam
age;
S,gr
owth
crac
ksan
dsp
lits;
T,te
nder
ness
;U,t
rim
min
g;V,
fres
hnes
sor
turg
or;W
,sun
burn
orsu
nsca
ld;X
,see
dste
ms
orda
mag
edu
eto
seed
stem
s.
Spin
ach
Bun
ched
**
**
**
**
397
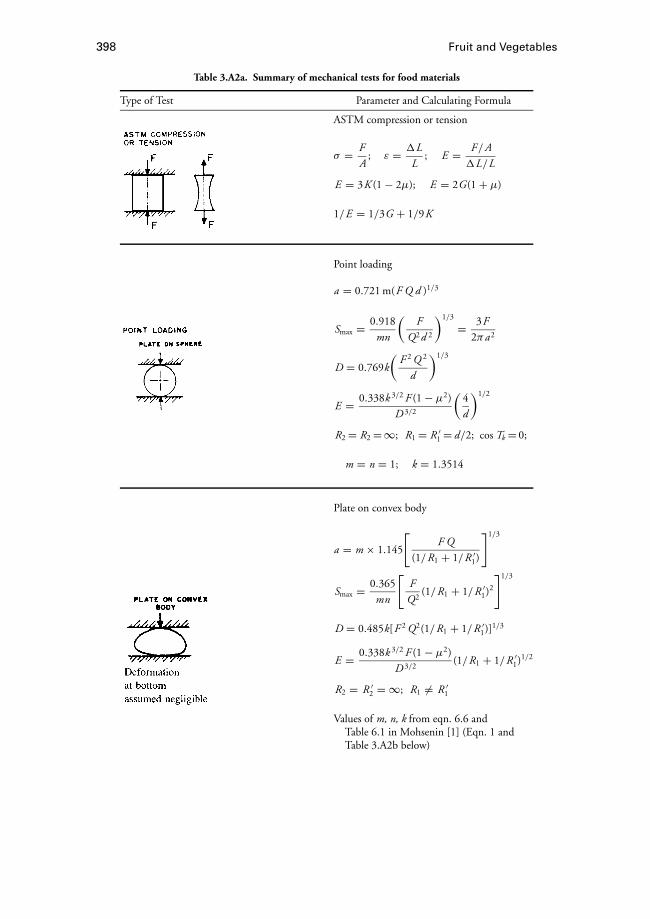
398 Fruit and Vegetables
Table 3.A2a. Summary of mechanical tests for food materials
Type of Test Parameter and Calculating Formula
ASTM compression or tension
σ = FA
; ε = 1LL
; E = F /A1L/L
E = 3K (1− 2µ); E = 2G(1+ µ)
1/E = 1/3G + 1/9K
Point loading
a = 0.721 m(F Q d )1/3
Smax = 0.918
mn
(F
Q2d 2
)1/3
= 3F2πa2
D = 0.769k(
F 2 Q 2
d
)1/3
E = 0.338k 3/2 F (1− µ2)
D 3/2
(4
d
)1/2
R2= R2=∞; R1= R ′1= d/2; cos Tk = 0;
m = n = 1; k = 1.3514
Plate on convex body
a = m × 1.145
[F Q
(1/R1 + 1/R ′1)
]1/3
Smax = 0.365
mn
[FQ2
(1/R1 + 1/R ′1)2
]1/3
D = 0.485k[F 2 Q2(1/R1 + 1/R ′1)]1/3
E = 0.338k 3/2 F (1− µ2)
D 3/2(1/R1 + 1/R ′1)1/2
R2 = R ′2 = ∞; R1 6= R ′1
Values of m, n, k from eqn. 6.6 andTable 6.1 in Mohsenin [1] (Eqn. 1 andTable 3.A2b below)
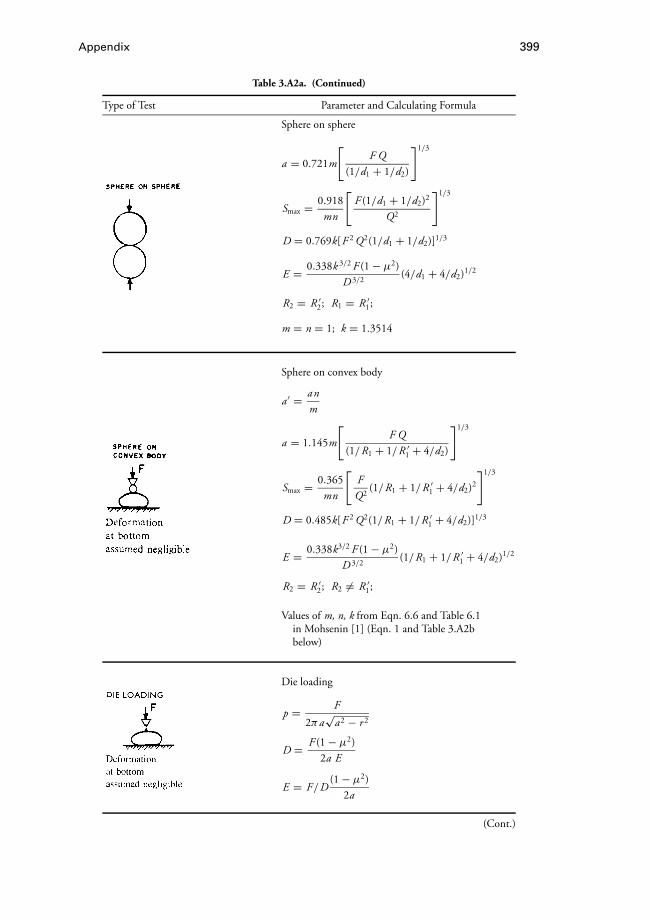
Appendix 399
Table 3.A2a. (Continued)
Type of Test Parameter and Calculating Formula
Sphere on sphere
a = 0.721m
[F Q
(1/d1 + 1/d2)
]1/3
Smax = 0.918
mn
[F (1/d1 + 1/d2)2
Q2
]1/3
D = 0.769k[F 2 Q2(1/d1 + 1/d2)]1/3
E = 0.338k 3/2 F (1− µ2)
D 3/2(4/d1 + 4/d2)1/2
R2 = R ′2; R1 = R ′1;
m = n = 1; k = 1.3514
Sphere on convex body
a ′ = anm
a = 1.145m
[F Q
(1/R1 + 1/R ′1 + 4/d2)
]1/3
Smax = 0.365
mn
[FQ2
(1/R1 + 1/R ′1 + 4/d2)2
]1/3
D = 0.485k[F 2 Q2(1/R1 + 1/R ′1 + 4/d2)]1/3
E = 0.338k3/2 F (1− µ2)
D 3/2(1/R1 + 1/R ′1 + 4/d2)1/2
R2 = R ′2; R2 6= R ′1;
Values of m, n, k from Eqn. 6.6 and Table 6.1in Mohsenin [1] (Eqn. 1 and Table 3.A2bbelow)
Die loading
p = F
2πa√
a2 − r 2
D = F (1− µ2)
2a E
E = F /D(1− µ2)
2a
(Cont.)

400 Fruit and Vegetables
Table 3.A2a. (Continued)
Type of Test Parameter and Calculating Formula
Punch shear
S = Fπ dtp
Double shear
S = F2A
Parallel shear
Ss = F /2A; εs = tan θ ; G = Ss /εs ;
E = 2G(1+ µ); 1/E = 1/3G + 1/9K
Plate shear
Ss max = ±3Ft2
p; εs = ± 3F
Gt2p
G = 3F u2
2Dt3p
; 50 > L/R > 25
R = radius of curvature at u
Torsion
Ss = 2Tπr 3
;
εs = r θL
;
G = 2T Lπr 4θ
θ1 = θ
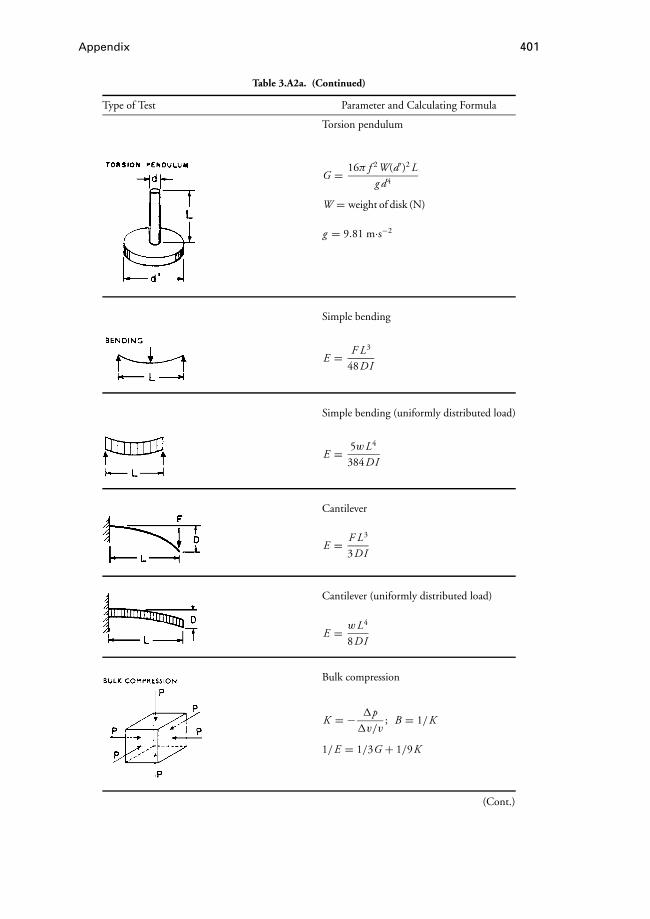
Appendix 401
Table 3.A2a. (Continued)
Type of Test Parameter and Calculating Formula
Torsion pendulum
G = 16π f 2W(d ′)2 Lg d4
W = weight of disk (N)
g = 9.81 m·s−2
Simple bending
E = F L3
48DI
Simple bending (uniformly distributed load)
E = 5wL4
384DI
Cantilever
E = F L3
3DI
Cantilever (uniformly distributed load)
E = wL4
8DI
Bulk compression
K = − 1p1v/v
; B = 1/K
1/E = 1/3G + 1/9K
(Cont.)
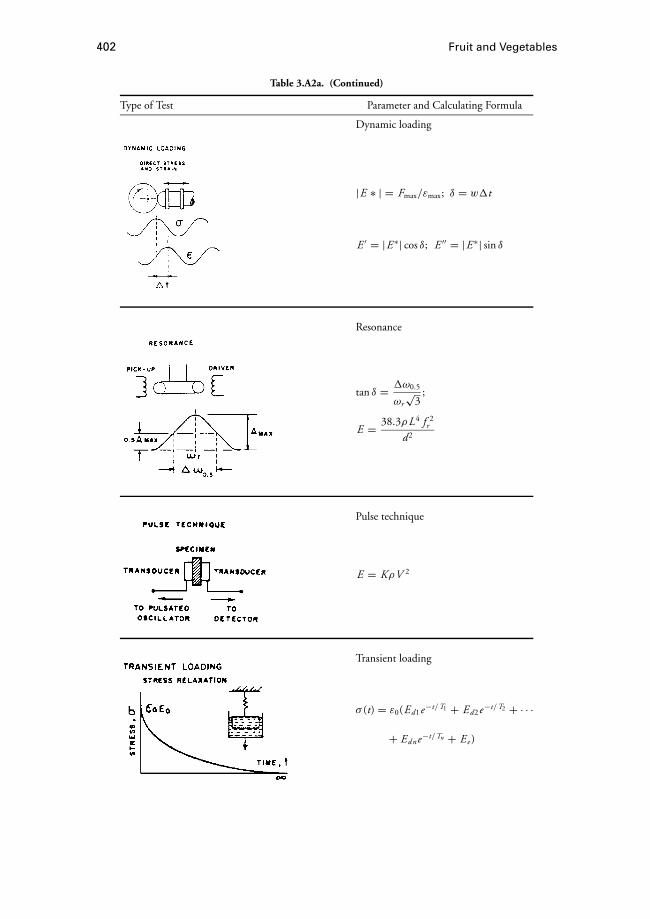
402 Fruit and Vegetables
Table 3.A2a. (Continued)
Type of Test Parameter and Calculating Formula
Dynamic loading
|E ∗ | = Fmax/εmax; δ = w1t
E ′ = |E ∗| cos δ; E ′′ = |E ∗| sin δ
Resonance
tan δ = 1ω0.5
ωr√
3;
E = 38.3ρL4 f 2r
d2
Pulse technique
E = KρV 2
Transient loading
σ (t) = ε0(Ed1e−t/T1 + Ed2e−t/T2 + · · ·
+ Edne−t/Tn + Ee )
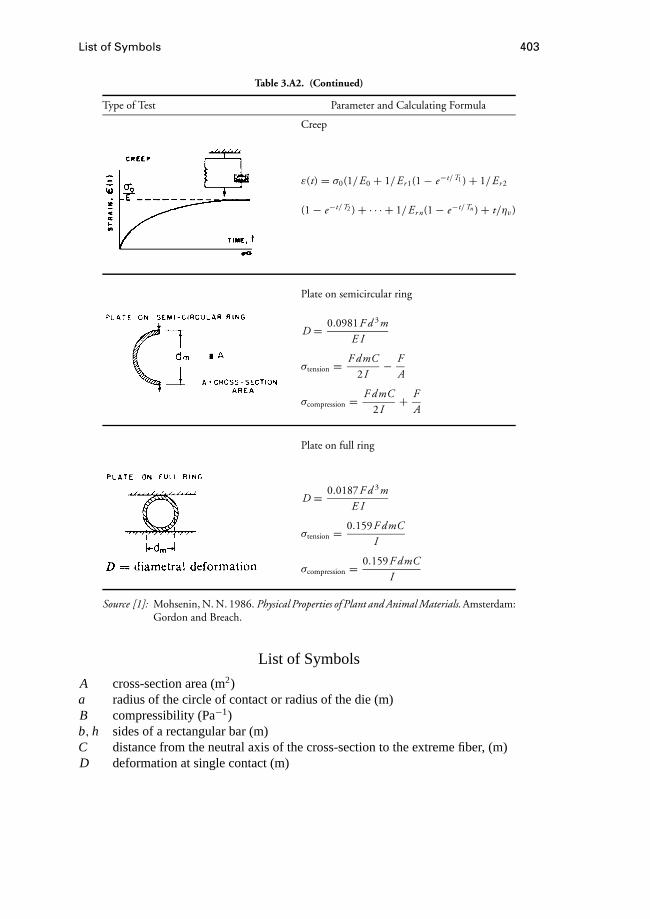
List of Symbols 403
Table 3.A2. (Continued)
Type of Test Parameter and Calculating Formula
Creep
ε(t) = σ0(1/E0 + 1/Er 1(1− e−t/T1 )+ 1/Er 2
(1− e−t/T2 )+ · · · + 1/Er n(1− e−t/Tn )+ t/ηv)
Plate on semicircular ring
D = 0.0981F d 3mE I
σtension = F dmC2I
− FA
σcompression = F dmC2I
+ FA
Plate on full ring
D = 0.0187F d 3mE I
σtension = 0.159F dmCI
σcompression = 0.159F dmCI
Source [1]: Mohsenin, N. N. 1986. Physical Properties of Plant and Animal Materials. Amsterdam:Gordon and Breach.
List of Symbols
A cross-section area (m2)a radius of the circle of contact or radius of the die (m)B compressibility (Pa−1)b, h sides of a rectangular bar (m)C distance from the neutral axis of the cross-section to the extreme fiber, (m)D deformation at single contact (m)
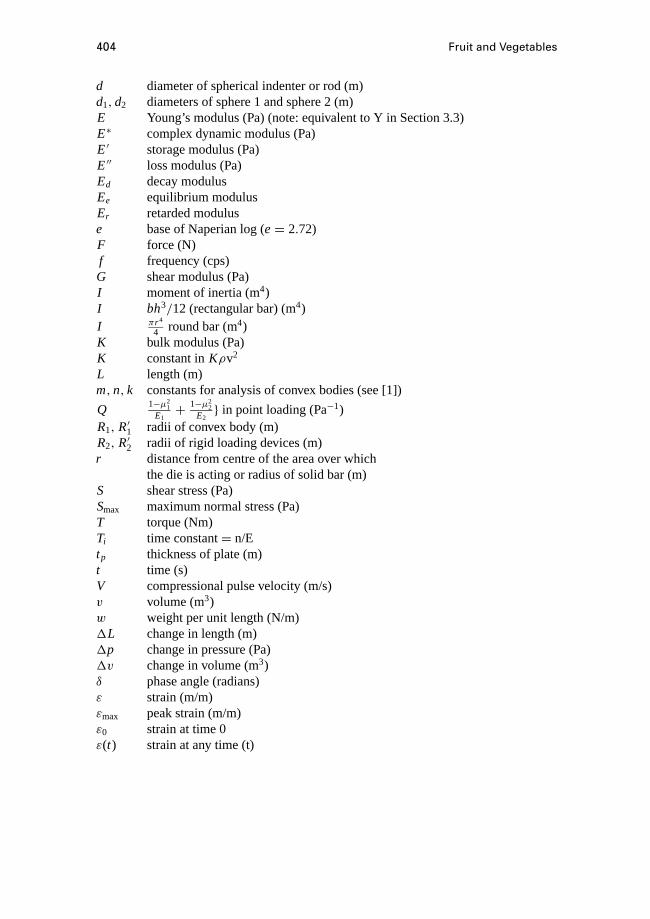
404 Fruit and Vegetables
d diameter of spherical indenter or rod (m)d1,d2 diameters of sphere 1 and sphere 2 (m)E Young’s modulus (Pa) (note: equivalent to Y in Section 3.3)E∗ complex dynamic modulus (Pa)E′ storage modulus (Pa)E′′ loss modulus (Pa)Ed decay modulusEe equilibrium modulusEr retarded moduluse base of Naperian log (e= 2.72)F force (N)f frequency (cps)G shear modulus (Pa)I moment of inertia (m4)I bh3/12 (rectangular bar) (m4)I πr 4
4 round bar (m4)K bulk modulus (Pa)K constant inKρv2
L length (m)m,n, k constants for analysis of convex bodies (see [1])
Q 1−µ21
E1+ 1−µ2
2E2} in point loading (Pa−1)
R1, R′1 radii of convex body (m)R2, R′2 radii of rigid loading devices (m)r distance from centre of the area over which
the die is acting or radius of solid bar (m)S shear stress (Pa)Smax maximum normal stress (Pa)T torque (Nm)Ti time constant= n/Etp thickness of plate (m)t time (s)V compressional pulse velocity (m/s)v volume (m3)w weight per unit length (N/m)1L change in length (m)1p change in pressure (Pa)1v change in volume (m3)δ phase angle (radians)ε strain (m/m)εmax peak strain (m/m)ε0 strain at time 0ε(t) strain at any time (t)
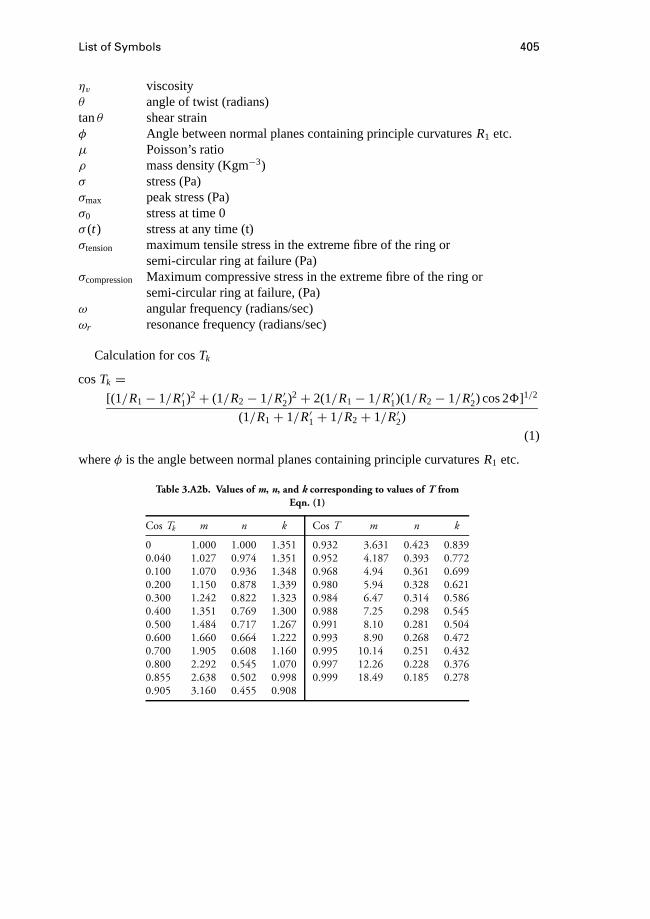
List of Symbols 405
ηv viscosityθ angle of twist (radians)tanθ shear strainφ Angle between normal planes containing principle curvaturesR1 etc.µ Poisson’s ratioρ mass density (Kgm−3)σ stress (Pa)σmax peak stress (Pa)σ0 stress at time 0σ (t) stress at any time (t)σtension maximum tensile stress in the extreme fibre of the ring or
semi-circular ring at failure (Pa)σcompression Maximum compressive stress in the extreme fibre of the ring or
semi-circular ring at failure, (Pa)ω angular frequency (radians/sec)ωr resonance frequency (radians/sec)
Calculation for cosTk
cosTk =[(1/R1− 1/R′1)2+ (1/R2− 1/R′2)2+ 2(1/R1− 1/R′1)(1/R2− 1/R′2) cos 28]1/2
(1/R1+ 1/R′1+ 1/R2+ 1/R′2)
(1)
whereφ is the angle between normal planes containing principle curvaturesR1 etc.
Table 3.A2b. Values of m, n, and k corresponding to values of T fromEqn. (1)
Cos Tk m n k Cos T m n k
0 1.000 1.000 1.351 0.932 3.631 0.423 0.8390.040 1.027 0.974 1.351 0.952 4.187 0.393 0.7720.100 1.070 0.936 1.348 0.968 4.94 0.361 0.6990.200 1.150 0.878 1.339 0.980 5.94 0.328 0.6210.300 1.242 0.822 1.323 0.984 6.47 0.314 0.5860.400 1.351 0.769 1.300 0.988 7.25 0.298 0.5450.500 1.484 0.717 1.267 0.991 8.10 0.281 0.5040.600 1.660 0.664 1.222 0.993 8.90 0.268 0.4720.700 1.905 0.608 1.160 0.995 10.14 0.251 0.4320.800 2.292 0.545 1.070 0.997 12.26 0.228 0.3760.855 2.638 0.502 0.998 0.999 18.49 0.185 0.2780.905 3.160 0.455 0.908
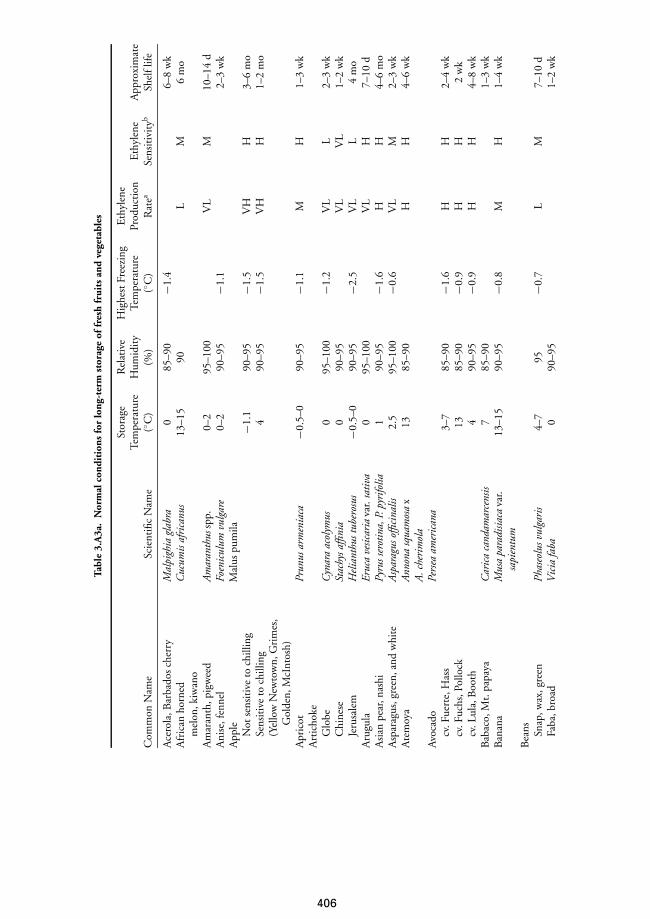
Tabl
e3.
A3a
.N
orm
alco
ndit
ions
for
long
-ter
mst
orag
eof
fres
hfr
uits
and
vege
tabl
es
Stor
age
Rel
ativ
eH
ighe
stFr
eezi
ngE
thyl
ene
Tem
pera
ture
Hum
idit
yTe
mpe
ratu
rePr
oduc
tion
Eth
ylen
eA
ppro
xim
ate
Com
mon
Nam
eSc
ient
ific
Nam
e(◦ C
)(%
)(◦ C
)R
atea
Sens
itiv
ityb
Shel
flife
Ace
rola
,Bar
bado
sch
erry
Mal
pigh
iagl
abra
085
–90
−1.4
6–8
wk
Afr
ican
horn
edC
ucum
isaf
rica
nus
13–1
590
LM
6m
om
elon
,kiw
ano
Am
aran
th,p
igw
eed
Am
aran
thus
spp.
0–2
95–1
00V
LM
10–1
4d
Ani
se,f
enne
lFo
enic
ulum
vulg
are
0–2
90–9
5−1
.12–
3w
kA
pple
Mal
uspu
mila
Not
sens
itiv
eto
chill
ing
−1.1
90–9
5−1
.5V
HH
3–6
mo
Sens
itiv
eto
chill
ing
490
–95
−1.5
VH
H1–
2m
o(Y
ello
wN
ewto
wn,
Gri
mes
,G
olde
n,M
cInt
osh)
Apr
icot
Prun
usar
men
iaca
−0.5
–090
–95
−1.1
MH
1–3
wk
Art
icho
keG
lobe
Cyn
ara
acol
ymus
095
–100
−1.2
VL
L2–
3w
kC
hine
seSt
achy
saffi
nia
090
–95
VL
VL
1–2
wk
Jeru
sale
mH
elia
nthu
stub
eros
us−0
.5–0
90–9
5−2
.5V
LL
4m
oA
rugu
laEr
uca
vesic
aria
var.
sativ
a0
95–1
00V
LH
7–10
dA
sian
pear
,nas
hiPy
russ
erot
ina,
P.py
rifo
lia1
90–9
5−1
.6H
H4–
6m
oA
spar
agus
,gre
en,a
ndw
hite
Asp
arag
usof
ficin
alis
2.5
95–1
00−0
.6V
LM
2–3
wk
Ate
moy
aA
nnon
asq
uam
osa
x13
85–9
0H
H4–
6w
kA
.che
rim
ola
Avo
cado
Pers
eaam
eric
ana
cv.F
uert
e,H
ass
3–7
85–9
0−1
.6H
H2–
4w
kcv
.Fuc
hs,P
ollo
ck13
85–9
0−0
.9H
H2
wk
cv.L
ula,
Boo
th4
90–9
5−0
.9H
H4–
8w
kB
abac
o,M
t.pa
paya
Car
ica
cand
amar
cens
is7
85–9
01–
3w
kB
anan
aM
usa
para
disia
cava
r.13
–15
90–9
5−0
.8M
H1–
4w
ksa
pien
tum
Bea
ns Snap
,wax
,gre
enPh
aseo
lusv
ulga
ris
4–7
95−0
.7L
M7–
10d
Faba
,bro
adV
icia
faba
090
–95
1–2
wk
406

Lim
aPh
aseo
lusl
unat
us5–
695
−0.6
LM
5–7
dW
inge
dPs
opho
carp
uste
trag
onol
obus
1090
4w
kLo
ng,y
ard-
long
Vig
nase
squi
peda
lis4–
790
–95
LM
7–10
dB
eet Bun
ched
Bet
avu
lgar
is0
98–1
00−0
.4V
LL
10–1
4da
ysTo
pped
098
–100
−0.9
VL
L4
mo
Ber
ries
Bla
ckbe
rry
Rubu
sspp
.−0
.5–0
90–9
5−0
.8L
L3–
6d
Blu
eber
ryVa
ccin
ium
cory
mbo
sum
−0.5
–090
–95
−1.3
LL
10–1
8d
Cra
nber
ryVa
ccin
ium
mac
rocr
pon
2–5
90–9
5−0
.9L
L8–
16w
kD
ewbe
rry
Rubu
sspp
.−0
.5–0
90–9
5−1
.3L
L2–
3d
Eld
erbe
rry
Rubu
sspp
.−0
.5–0
90–9
5−1
.1L
L5–
14d
Loga
nber
ryRu
buss
pp.
−0.5
–090
–95
−1.7
LL
2–3
dR
aspb
erry
Rubu
sida
eus
−0.5
–090
–95
−0.9
LL
3–6
dSt
raw
berr
yFr
agar
iasp
p.0
90–9
5−0
.8L
L7–
10d
Bit
term
elon
,bit
ter
gour
dM
omor
dica
char
antia
10–1
285
–90
LM
2–3
wk
Bla
cksa
lsify
,sco
rzon
era
Scor
zone
rahi
span
ica
0–1
95–9
8V
LL
6m
oB
okch
oyB
rassi
cach
inen
sis0
95–1
00V
LH
3w
kB
read
frui
tA
rtoc
arpu
salti
lis13
–15
85–9
02–
6w
kB
rocc
oli
B.o
lera
cea
var.
italic
a0
95-1
00−0
.6V
LH
10–1
4d
Bru
ssel
spro
uts
B.o
lera
cea
var.
gem
nife
ra0
95–1
00−0
.8V
LH
3–5
wk
Cab
bage
Chi
nese
,Nap
aB
rassi
caca
mpe
stris
var.
095
–100
−0.9
VL
H2–
3m
ope
kine
nsis
Com
mon
Ear
lycr
opB
.ole
race
ava
r.C
apita
ta0
98–1
00−0
.9V
LH
3–6
wk
Late
crop
B.o
lera
cea
var.
Cap
itata
095
–100
−0.9
VL
H5–
6m
oC
actu
sle
aves
,nop
alit
osO
punt
iasp
p.5–
1090
–95
VL
M2–
3w
kC
actu
sfr
uit,
pric
kly
pear
frui
tO
punt
iasp
p.5
85–9
0−1
.8V
LM
3w
kC
aram
bola
,sta
rfru
itAv
errh
oaca
ram
bola
9–10
85–9
0−1
.23–
4w
kC
arro
tsD
aucu
scar
ota
Topp
ed0
98–1
00−1
.4V
LH
6–8
mo
Bun
ched
,im
mat
ure
098
–100
−1.4
VL
H10
–14
d
(Con
t.)
407
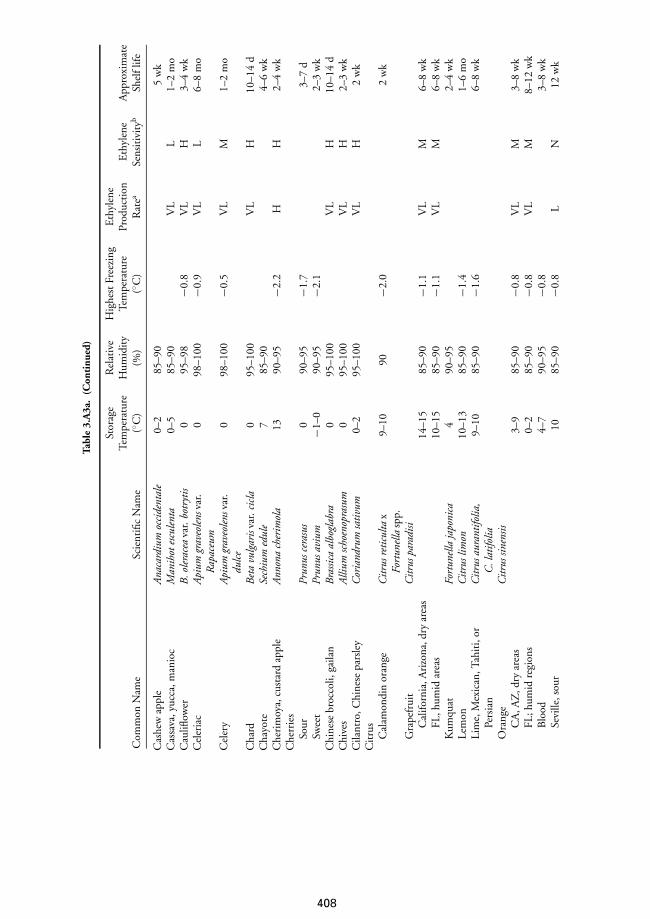
Cas
hew
appl
eA
naca
rdiu
moc
cide
ntal
e0–
285
–90
5w
kC
assa
va,y
ucca
,man
ioc
Man
ihot
escu
lent
a0–
585
–90
VL
L1–
2m
oC
aulifl
ower
B.o
lera
cea
var.
botr
ytis
095
–98
−0.8
VL
H3–
4w
kC
eler
iac
Api
umgr
aveo
lens
var.
098
–100
−0.9
VL
L6–
8m
oR
apac
eum
Cel
ery
Api
umgr
aveo
lens
var.
098
–100
−0.5
VL
M1–
2m
odu
lce
Cha
rdB
eta
vulg
aris
var.
cicl
a0
95–1
00V
LH
10–1
4d
Cha
yote
Sech
ium
edul
e7
85–9
04–
6w
kC
heri
moy
a,cu
star
dap
ple
Ann
ona
cher
imol
a13
90–9
5−2
.2H
H2–
4w
kC
herr
ies
Sour
Prun
usce
rasu
s0
90–9
5−1
.73–
7d
Swee
tPr
unus
aviu
m−1
–090
–95
−2.1
2–3
wk
Chi
nese
broc
coli,
gaila
nB
rassi
caal
bogl
abra
095
–100
VL
H10
–14
dC
hive
sA
llium
scho
enop
rasu
m0
95–1
00V
LH
2–3
wk
Cila
ntro
,Chi
nese
pars
ley
Cor
iand
rum
sativ
um0–
295
–100
VL
H2
wk
Cit
rus
Cal
amon
din
oran
geC
itrus
retic
ulta
x9–
1090
−2.0
2w
kFo
rtun
ella
spp.
Gra
pefr
uit
Citr
uspa
radi
siC
alifo
rnia
,Ari
zona
,dry
area
s14
–15
85–9
0−1
.1V
LM
6–8
wk
FL,h
umid
area
s10
–15
85–9
0−1
.1V
LM
6–8
wk
Kum
quat
Fort
unel
laja
poni
ca4
90–9
52–
4w
kLe
mon
Citr
uslim
on10
–13
85–9
0−1
.41–
6m
oLi
me,
Mex
ican
,Tah
iti,
orC
itrus
aura
ntifo
lia,
9–10
85–9
0−1
.66–
8w
kPe
rsia
nC
.lat
ifolia
Ora
nge
Citr
ussin
ensis
CA
,AZ
,dry
area
s3–
985
–90
−0.8
VL
M3–
8w
kFL
;hum
idre
gion
s0–
285
–90
−0.8
VL
M8–
12w
kB
lood
4–7
90–9
5−0
.83–
8w
kSe
ville
,sou
r10
85–9
0−0
.8L
N12
wk
Tabl
e3.
A3a
.(C
onti
nued
)
Stor
age
Rel
ativ
eH
ighe
stFr
eezi
ngE
thyl
ene
Tem
pera
ture
Hum
idit
yTe
mpe
ratu
rePr
oduc
tion
Eth
ylen
eA
ppro
xim
ate
Com
mon
Nam
eSc
ient
ific
Nam
e(◦ C
)(%
)(◦ C
)R
atea
Sens
itiv
ityb
Shel
flife
408
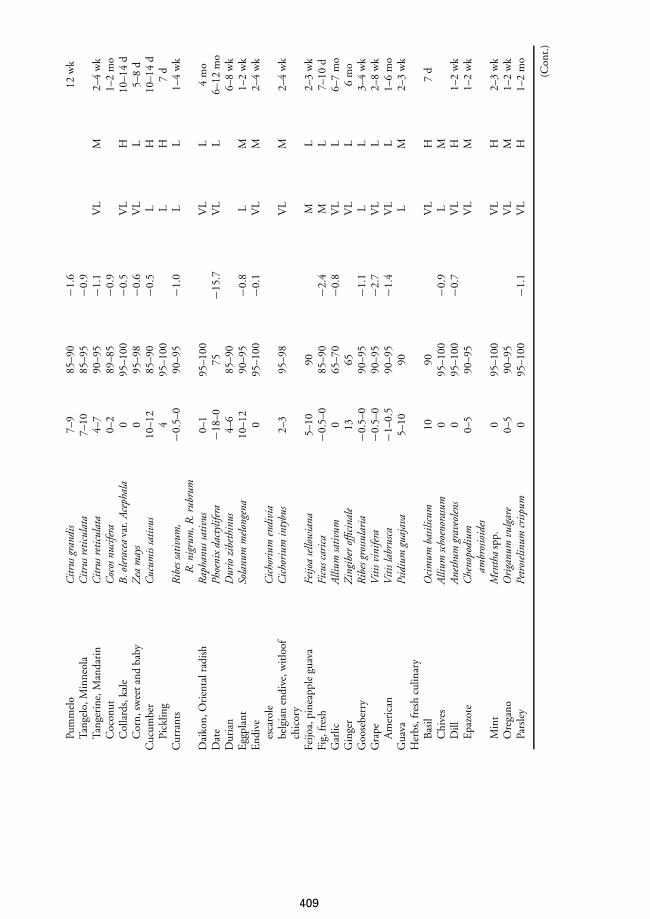
Pum
mel
oC
itrus
gran
dis
7–9
85–9
0−1
.612
wk
Tang
elo,
Min
neol
aC
itrus
retic
ulat
a7–
1085
–95
−0.9
Tang
erin
e,M
anda
rin
Citr
usre
ticul
ata
4–7
90–9
5−1
.1V
LM
2–4
wk
Coc
onut
Coc
osnu
cife
ra0–
289
–85
−0.9
1–2
mo
Col
lard
s,ka
leB
.ole
race
ava
r.A
ceph
ala
095
–100
−0.5
VL
H10
–14
dC
orn,
swee
tand
baby
Zea
may
s0
95–9
8−0
.6V
LL
5–8
dC
ucum
ber
Cuc
umis
sativ
us10
–12
85–9
0−0
.5L
H10
–14
dPi
cklin
g4
95–1
00L
H7
dC
urra
nts
Rib
essa
tivum
,−0
.5–0
90–9
5−1
.0L
L1–
4w
kR
.nig
rum
,R.r
ubru
mD
aiko
n,O
rien
talr
adis
hR
apha
nuss
ativ
us0–
195
–100
VL
L4
mo
Dat
ePh
oeni
xda
ctyl
ifera
−18–
075
−15.
7V
LL
6–12
mo
Dur
ian
Dur
iozi
beth
inus
4–6
85–9
06–
8w
kE
ggpl
ant
Sola
num
mel
onge
na10
–12
90–9
5−0
.8L
M1–
2w
kE
ndiv
e0
95–1
00−0
.1V
LM
2–4
wk
esca
role
Cic
hori
umen
divi
abe
lgia
nen
dive
,wit
loof
Cic
hori
umin
tybu
s2–
395
–98
VL
M2–
4w
kch
icor
yFe
ijoa,
pine
appl
egu
ava
Feijo
ase
llow
iana
5–10
90M
L2–
3w
kFi
g,fr
esh
Ficu
scar
ica
−0.5
–085
–90
−2.4
ML
7–10
dG
arlic
Alli
umsa
tivum
065
–70
−0.8
VL
L6–
7m
oG
inge
rZ
ingi
ber
offic
inal
e13
65V
LL
6m
oG
oose
berr
yR
ibes
gros
sula
ria
−0.5
–090
–95
−1.1
LL
3–4
wk
Gra
peV
itisv
inife
ra−0
.5–0
90–9
5−2
.7V
LL
2–8
wk
Am
eric
anV
itisl
abru
sca
−1–0
.590
–95
−1.4
VL
L1–
6m
oG
uava
Psid
ium
guaj
ava
5–10
90L
M2–
3w
kH
erbs
,fre
shcu
linar
yB
asil
Oci
mum
basil
icum
1090
VL
H7
dC
hive
sA
llium
scho
enor
asum
095
–100
−0.9
LM
Dill
Ane
thum
grav
eole
ns0
95–1
00−0
.7V
LH
1–2
wk
Epa
zote
Che
nopo
dium
0–5
90–9
5V
LM
1–2
wk
ambr
osio
ides
Min
tM
enth
asp
p.0
95–1
00V
LH
2–3
wk
Ore
gano
Ori
ganu
mvu
lgar
e0–
590
–95
VL
M1–
2w
kPa
rsle
yPe
tros
elin
umcr
ispum
095
–100
−1.1
VL
H1–
2m
o
(Con
t.)
409

Peri
lla,s
hiso
Peri
llafr
utes
cens
1095
VL
M7
dSa
geSa
lvia
offic
inal
is0
90–9
52–
3w
kT
hym
eT
hym
usvu
lgar
is0
90–9
52–
3w
kH
orse
radi
shA
rmor
acia
rusti
cana
−1–0
98–1
00−1
.8V
LL
10–1
2m
oJa
boti
caba
Myr
ciar
iaca
ulifl
ora
13–1
590
–95
2–3
d(E
ugen
iaca
ulifl
ora)
Jack
frui
tA
rtoc
arpu
shet
erop
hyllu
s13
85–9
0M
M2–
6w
kJi
cam
a,ya
mbe
anPa
chyr
rhiz
user
osus
13–1
885
–90
VL
L1–
2m
oJu
jube
,Chi
nese
date
Ziz
iphu
sjuj
uba
2.5–
1085
–90
−1.6
LM
1m
oK
ale
B.o
lera
cea
var.
acep
hala
095
–100
−0.5
VL
MK
iwifr
uit,
Act
inid
iach
inen
sis0
90–9
5−0
.9L
H3–
5m
oC
hine
sego
oseb
erry
Koh
lrab
iB
.ole
race
a0
98–1
00−1
.0V
LL
2–3
mo
var.
gong
ylod
esLa
ngsa
t,la
nzon
eA
glai
asp
p.,L
ansiu
msp
p.11
–14
85–9
02
wk
Leaf
ygr
eens
Coo
l-se
ason
Var
ious
gene
ra0
95–1
00−0
.6V
LH
10–1
4d
War
m-s
easo
nV
ario
usge
nera
7–10
95–1
00−0
.6V
LH
5–7
dLe
ekA
llium
porr
um0
95–1
00−0
.7V
LM
2m
oLe
ttuc
eLa
ctuc
asa
tiva
098
–100
−0.2
VL
H2–
3w
kLo
ngan
Dim
ocar
pusl
onga
n1–
290
–95
−2.4
3–5
wk
(Eup
hori
alo
ngan
)Lo
quat
Erio
botr
yaja
poni
ca0
90−1
.93
wk
Luff
a,C
hine
seok
raLu
ffasp
p.10
–12
90–9
5L
M1–
2w
kLy
chee
,lit
chi
Litc
hich
inen
sis1–
290
–95
MM
3–5
wk
Mal
anga
,tan
ia,n
ewco
coya
mX
anth
osom
a7
70–8
0V
LL
3m
osa
gitti
foliu
mM
ango
Man
gife
rain
dica
1385
–90
−1.4
MM
2–3
wk
Man
gost
een
Gar
cini
am
ango
stana
1385
–90
MH
2–4
wk
Mel
ons
Can
talo
upes
and
Cuc
urbi
tam
elo
2–5
95−1
.2H
M2–
3w
kot
her
nett
edm
elon
sva
r.re
ticul
atus
Tabl
e3.
A3a
.(C
onti
nued
)
Stor
age
Rel
ativ
eH
ighe
stFr
eezi
ngE
thyl
ene
Tem
pera
ture
Hum
idit
yTe
mpe
ratu
rePr
oduc
tion
Eth
ylen
eA
ppro
xim
ate
Com
mon
Nam
eSc
ient
ific
Nam
e(◦ C
)(%
)(◦ C
)R
atea
Sens
itiv
ityb
Shel
flife
410
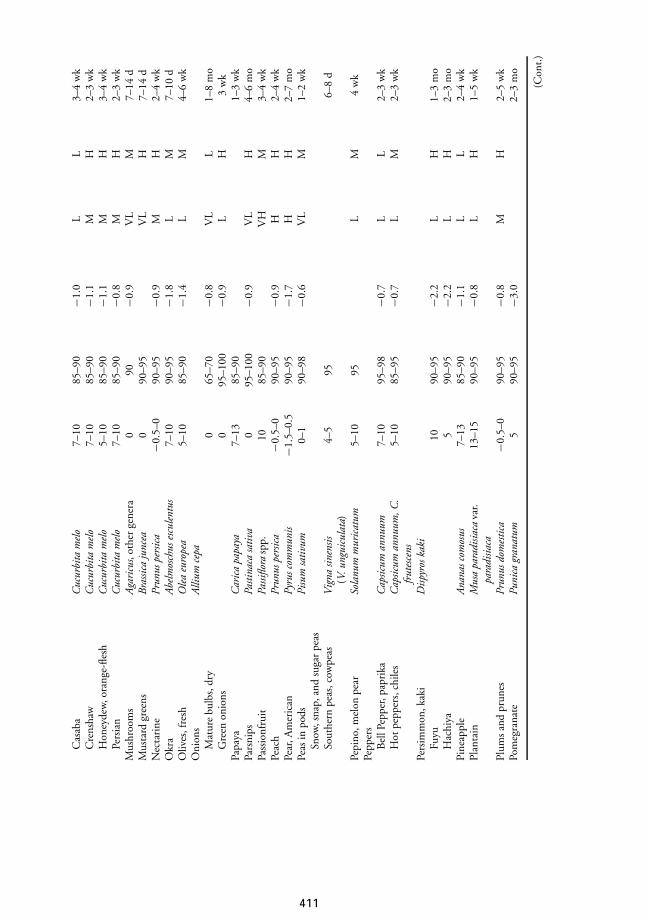
Cas
aba
Cuc
urbi
tam
elo
7–10
85–9
0−1
.0L
L3–
4w
kC
rens
haw
Cuc
urbi
tam
elo
7–10
85–9
0−1
.1M
H2–
3w
kH
oney
dew
,ora
nge-
flesh
Cuc
urbi
tam
elo
5–10
85–9
0−1
.1M
H3–
4w
kPe
rsia
nC
ucur
bita
mel
o7–
1085
–90
−0.8
MH
2–3
wk
Mus
hroo
ms
Aga
ricu
s,ot
her
gene
ra0
90−0
.9V
LM
7–14
dM
usta
rdgr
eens
Bra
ssica
junc
ea0
90–9
5V
LH
7–14
dN
ecta
rine
Prun
uspe
rsic
a−0
.5–0
90–9
5−0
.9M
H2–
4w
kO
kra
Abel
mos
chus
escu
lent
us7–
1090
–95
−1.8
LM
7–10
dO
lives
,fre
shO
lea
euro
pea
5–10
85–9
0−1
.4L
M4–
6w
kO
nion
sA
llium
cepa
Mat
ure
bulb
s,dr
y0
65–7
0−0
.8V
LL
1–8
mo
Gre
enon
ions
095
–100
−0.9
LH
3w
kPa
paya
Car
ica
papa
ya7–
1385
–90
1–3
wk
Pars
nips
Pasti
naca
sativ
a0
95–1
00−0
.9V
LH
4–6
mo
Pass
ionf
ruit
Passi
flora
spp.
1085
–90
VH
M3–
4w
kPe
ach
Prun
uspe
rsic
a−0
.5–0
90–9
5−0
.9H
H2–
4w
kPe
ar,A
mer
ican
Pyru
scom
mun
is−1
.5–0
.590
–95
−1.7
HH
2–7
mo
Peas
inpo
dsPi
sum
sativ
um0–
190
–98
−0.6
VL
M1–
2w
kSn
ow,s
nap,
and
suga
rpe
asSo
uthe
rnpe
as,c
owpe
asV
igna
sinen
sis4–
595
6–8
d(V
.ung
uicu
lata
)Pe
pino
,mel
onpe
arSo
lanu
mm
uric
atum
5–10
95L
M4
wk
Pepp
ers
Bel
lPep
per,
papr
ika
Cap
sicum
annu
um7–
1095
–98
−0.7
LL
2–3
wk
Hot
pepp
ers,
chile
sC
apsic
uman
nuum
,C.
5–10
85–9
5−0
.7L
M2–
3w
kfr
utes
cens
Pers
imm
on,k
aki
Disp
yros
kaki
Fuyu
1090
–95
−2.2
LH
1–3
mo
Hac
hiya
590
–95
−2.2
LH
2–3
mo
Pine
appl
eA
nana
scom
osus
7–13
85–9
0−1
.1L
L2–
4w
kPl
anta
inM
usa
para
disia
cava
r.13
–15
90–9
5−0
.8L
H1–
5w
kpa
radi
siaca
Plum
san
dpr
unes
Prun
usdo
mes
tica
−0.5
–090
–95
−0.8
MH
2–5
wk
Pom
egra
nate
Puni
cagr
anat
um5
90–9
5−3
.02–
3m
o
(Con
t.)
411
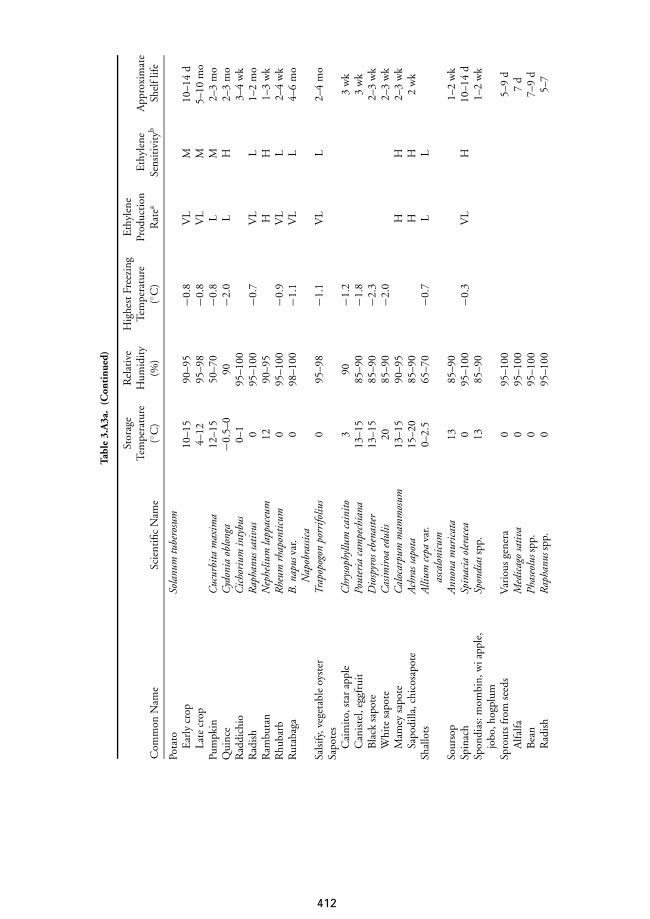
Pota
toSo
lanu
mtu
bero
sum
Ear
lycr
op10
–15
90–9
5−0
.8V
LM
10–1
4d
Late
crop
4–12
95–9
8−0
.8V
LM
5–10
mo
Pum
pkin
Cuc
urbi
tam
axim
a12
–15
50–7
0−0
.8L
M2–
3m
oQ
uinc
eC
ydon
iaob
long
a−0
.5–0
90−2
.0L
H2–
3m
oR
addi
chio
Cic
hori
umin
tybu
s0–
195
–100
3–4
wk
Rad
ish
Rap
hanu
ssat
ivus
095
–100
−0.7
VL
L1–
2m
oR
ambu
tan
Nep
heliu
mla
ppac
eum
1290
–95
HH
1–3
wk
Rhu
barb
Rhe
umrh
apon
ticum
095
–100
−0.9
VL
L2–
4w
kR
utab
aga
B.n
apus
var.
098
–100
−1.1
VL
L4–
6m
oN
apob
rassi
caSa
lsify
,veg
etab
leoy
ster
Trap
opog
onpo
rrifo
lius
095
–98
−1.1
VL
L2–
4m
oSa
pote
sC
aim
ito,
star
appl
eC
hrys
ophy
llum
cain
ito3
90−1
.23
wk
Can
iste
l,eg
gfru
itPo
uter
iaca
mpe
chia
na13
–15
85–9
0−1
.83
wk
Bla
cksa
pote
Dio
spyr
oseb
enas
ter
13–1
585
–90
−2.3
2–3
wk
Whi
tesa
pote
Cas
imir
oaed
ulis
2085
–90
−2.0
2–3
wk
Mam
eysa
pote
Cal
ocar
pum
mam
mos
um13
–15
90–9
5H
H2–
3w
kSa
podi
lla,c
hico
sapo
teA
chra
ssap
ota
15–2
085
–90
HH
2w
kSh
allo
tsA
llium
cepa
var.
0–2.
565
–70
−0.7
LL
asca
loni
cum
Sour
sop
Ann
ona
mur
icat
a13
85–9
01–
2w
kSp
inac
hSp
inac
iaol
erac
ea0
95–1
00−0
.3V
LH
10–1
4d
Spon
dias
:mom
bin,
wia
pple
,Sp
ondi
assp
p.13
85–9
01–
2w
kjo
bo,h
ogpl
umSp
rout
sfr
omse
eds
Var
ious
gene
ra0
95–1
005–
9d
Alfa
lfaM
edic
ago
sativ
a0
95–1
007
dB
ean
Phas
eolu
sspp
.0
95–1
007–
9d
Rad
ish
Rap
hanu
sspp
.0
95–1
005–
7
Tabl
e3.
A3a
.(C
onti
nued
)
Stor
age
Rel
ativ
eH
ighe
stFr
eezi
ngE
thyl
ene
Tem
pera
ture
Hum
idit
yTe
mpe
ratu
rePr
oduc
tion
Eth
ylen
eA
ppro
xim
ate
Com
mon
Nam
eSc
ient
ific
Nam
e(◦ C
)(%
)(◦ C
)R
atea
Sens
itiv
ityb
Shel
flife
412
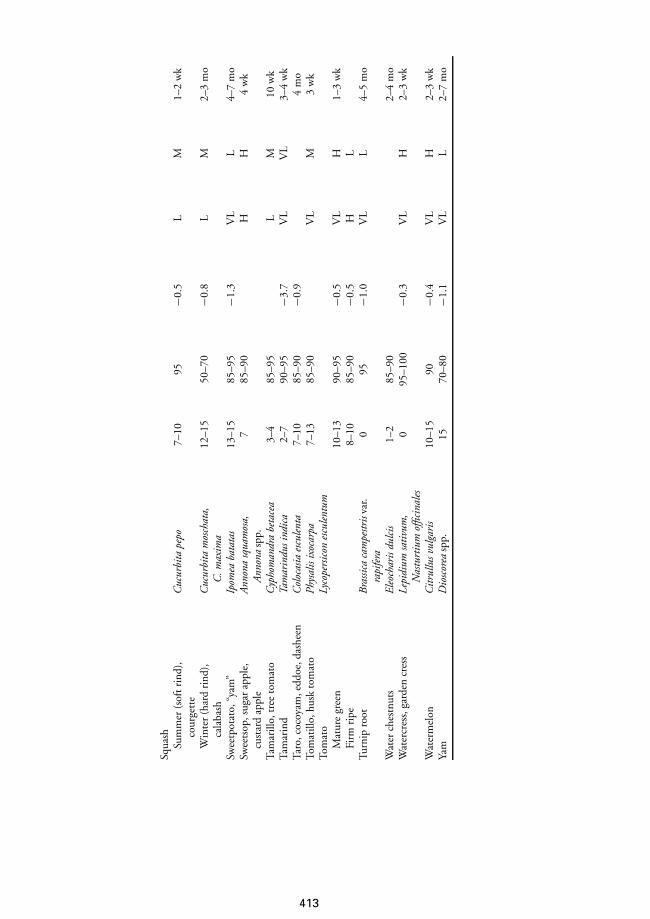
Squa
shSu
mm
er(s
oftr
ind)
,C
ucur
bita
pepo
7–10
95−0
.5L
M1–
2w
kco
urge
tte
Win
ter
(har
dri
nd),
Cuc
urbi
tam
osch
ata,
12–1
550
–70
−0.8
LM
2–3
mo
cala
bash
C.m
axim
aSw
eetp
otat
o,“y
am”
Ipom
eaba
tata
s13
–15
85–9
5−1
.3V
LL
4–7
mo
Swee
tsop
,sug
arap
ple,
Ann
ona
squa
mos
a,7
85–9
0H
H4
wk
cust
ard
appl
eA
nnon
asp
p.Ta
mar
illo,
tree
tom
ato
Cyp
hom
andr
abe
tace
a3–
485
–95
LM
10w
kTa
mar
ind
Tam
arin
dusi
ndic
a2–
790
–95
−3.7
VL
VL
3–4
wk
Taro
,coc
oyam
,edd
oe,d
ashe
enC
oloc
asia
escu
lent
a7–
1085
–90
−0.9
4m
oTo
mat
illo,
husk
tom
ato
Phys
alis
ixoc
arpa
7–13
85–9
0V
LM
3w
kTo
mat
oLy
cope
rsic
ones
cule
ntum
Mat
ure
gree
n10
–13
90–9
5−0
.5V
LH
1–3
wk
Firm
ripe
8–10
85–9
0−0
.5H
LTu
rnip
root
Bra
ssica
cam
pestr
isva
r.0
95−1
.0V
LL
4–5
mo
rapi
fera
Wat
erch
estn
uts
Eleo
char
isdu
lcis
1–2
85–9
02–
4m
oW
ater
cres
s,ga
rden
cres
sLe
pidi
umsa
tivum
,0
95–1
00−0
.3V
LH
2–3
wk
Nas
turt
ium
offic
inal
esW
ater
mel
onC
itrul
lusv
ulga
ris
10–1
590
−0.4
VL
H2–
3w
kYa
mD
iosc
orea
spp.
1570
–80
−1.1
VL
L2–
7m
o
413
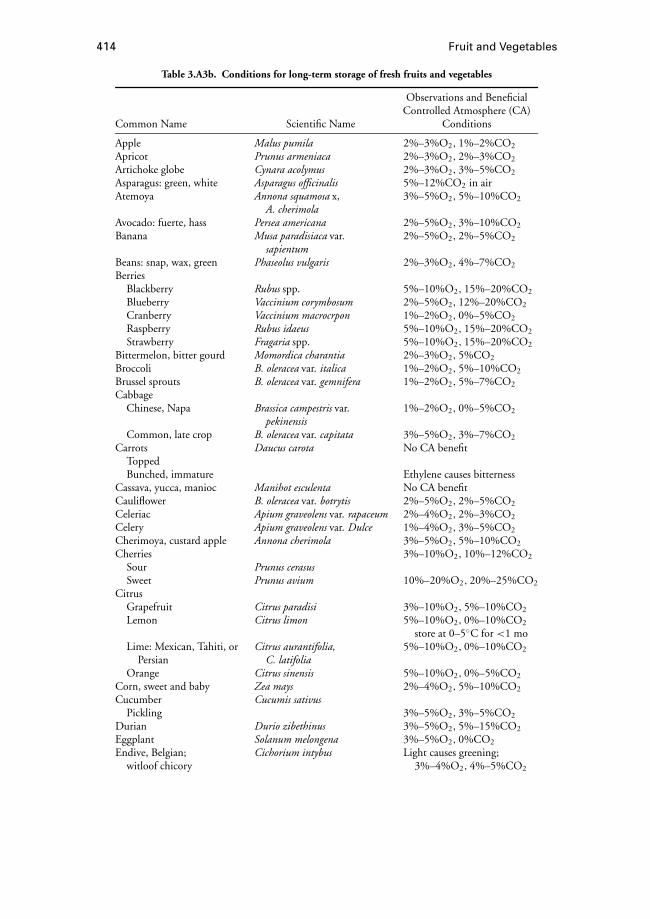
414 Fruit and Vegetables
Table 3.A3b. Conditions for long-term storage of fresh fruits and vegetables
Observations and BeneficialControlled Atmosphere (CA)
Common Name Scientific Name Conditions
Apple Malus pumila 2%–3%O2, 1%–2%CO2
Apricot Prunus armeniaca 2%–3%O2, 2%–3%CO2
Artichoke globe Cynara acolymus 2%–3%O2, 3%–5%CO2
Asparagus: green, white Asparagus officinalis 5%–12%CO2 in airAtemoya Annona squamosa x, 3%–5%O2, 5%–10%CO2
A. cherimolaAvocado: fuerte, hass Persea americana 2%–5%O2, 3%–10%CO2
Banana Musa paradisiaca var. 2%–5%O2, 2%–5%CO2
sapientumBeans: snap, wax, green Phaseolus vulgaris 2%–3%O2, 4%–7%CO2
BerriesBlackberry Rubus spp. 5%–10%O2, 15%–20%CO2
Blueberry Vaccinium corymbosum 2%–5%O2, 12%–20%CO2
Cranberry Vaccinium macrocrpon 1%–2%O2, 0%–5%CO2
Raspberry Rubus idaeus 5%–10%O2, 15%–20%CO2
Strawberry Fragaria spp. 5%–10%O2, 15%–20%CO2
Bittermelon, bitter gourd Momordica charantia 2%–3%O2, 5%CO2
Broccoli B. oleracea var. italica 1%–2%O2, 5%–10%CO2
Brussel sprouts B. oleracea var. gemnifera 1%–2%O2, 5%–7%CO2
CabbageChinese, Napa Brassica campestris var. 1%–2%O2, 0%–5%CO2
pekinensisCommon, late crop B. oleracea var. capitata 3%–5%O2, 3%–7%CO2
Carrots Daucus carota No CA benefitToppedBunched, immature Ethylene causes bitterness
Cassava, yucca, manioc Manihot esculenta No CA benefitCauliflower B. oleracea var. botrytis 2%–5%O2, 2%–5%CO2
Celeriac Apium graveolens var. rapaceum 2%–4%O2, 2%–3%CO2
Celery Apium graveolens var. Dulce 1%–4%O2, 3%–5%CO2
Cherimoya, custard apple Annona cherimola 3%–5%O2, 5%–10%CO2
Cherries 3%–10%O2, 10%–12%CO2
Sour Prunus cerasusSweet Prunus avium 10%–20%O2, 20%–25%CO2
CitrusGrapefruit Citrus paradisi 3%–10%O2, 5%–10%CO2
Lemon Citrus limon 5%–10%O2, 0%–10%CO2
store at 0–5◦C for <1 moLime: Mexican, Tahiti, or Citrus aurantifolia, 5%–10%O2, 0%–10%CO2
Persian C. latifoliaOrange Citrus sinensis 5%–10%O2, 0%–5%CO2
Corn, sweet and baby Zea mays 2%–4%O2, 5%–10%CO2
Cucumber Cucumis sativusPickling 3%–5%O2, 3%–5%CO2
Durian Durio zibethinus 3%–5%O2, 5%–15%CO2
Eggplant Solanum melongena 3%–5%O2, 0%CO2
Endive, Belgian; Cichorium intybus Light causes greening;witloof chicory 3%–4%O2, 4%–5%CO2
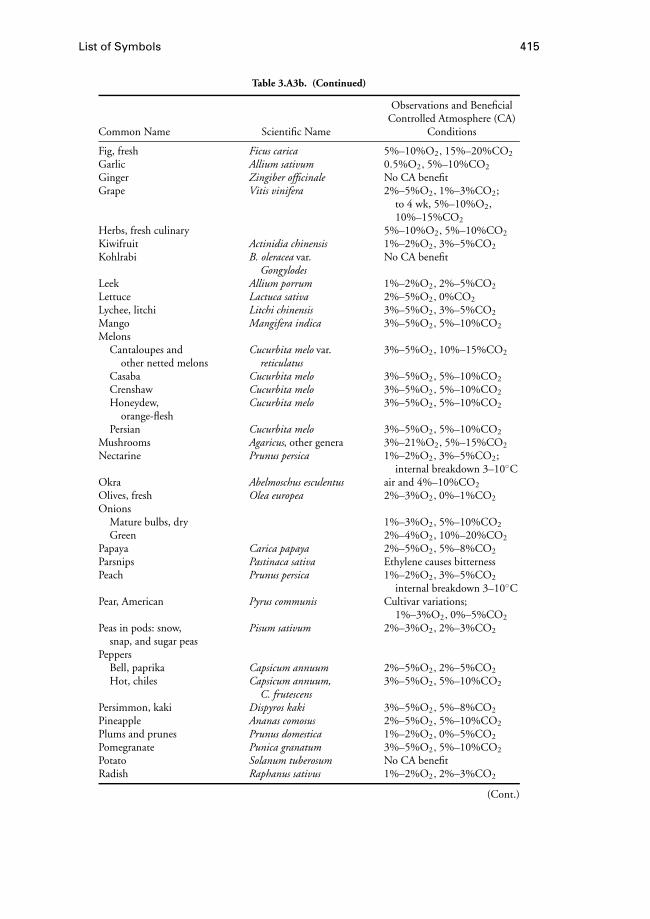
List of Symbols 415
Table 3.A3b. (Continued)
Observations and BeneficialControlled Atmosphere (CA)
Common Name Scientific Name Conditions
Fig, fresh Ficus carica 5%–10%O2, 15%–20%CO2
Garlic Allium sativum 0.5%O2, 5%–10%CO2
Ginger Zingiber officinale No CA benefitGrape Vitis vinifera 2%–5%O2, 1%–3%CO2;
to 4 wk, 5%–10%O2,10%–15%CO2
Herbs, fresh culinary 5%–10%O2, 5%–10%CO2
Kiwifruit Actinidia chinensis 1%–2%O2, 3%–5%CO2
Kohlrabi B. oleracea var. No CA benefitGongylodes
Leek Allium porrum 1%–2%O2, 2%–5%CO2
Lettuce Lactuca sativa 2%–5%O2, 0%CO2
Lychee, litchi Litchi chinensis 3%–5%O2, 3%–5%CO2
Mango Mangifera indica 3%–5%O2, 5%–10%CO2
MelonsCantaloupes and Cucurbita melo var. 3%–5%O2, 10%–15%CO2
other netted melons reticulatusCasaba Cucurbita melo 3%–5%O2, 5%–10%CO2
Crenshaw Cucurbita melo 3%–5%O2, 5%–10%CO2
Honeydew, Cucurbita melo 3%–5%O2, 5%–10%CO2
orange-fleshPersian Cucurbita melo 3%–5%O2, 5%–10%CO2
Mushrooms Agaricus, other genera 3%–21%O2, 5%–15%CO2
Nectarine Prunus persica 1%–2%O2, 3%–5%CO2;internal breakdown 3–10◦C
Okra Abelmoschus esculentus air and 4%–10%CO2
Olives, fresh Olea europea 2%–3%O2, 0%–1%CO2
OnionsMature bulbs, dry 1%–3%O2, 5%–10%CO2
Green 2%–4%O2, 10%–20%CO2
Papaya Carica papaya 2%–5%O2, 5%–8%CO2
Parsnips Pastinaca sativa Ethylene causes bitternessPeach Prunus persica 1%–2%O2, 3%–5%CO2
internal breakdown 3–10◦CPear, American Pyrus communis Cultivar variations;
1%–3%O2, 0%–5%CO2
Peas in pods: snow, Pisum sativum 2%–3%O2, 2%–3%CO2
snap, and sugar peasPeppers
Bell, paprika Capsicum annuum 2%–5%O2, 2%–5%CO2
Hot, chiles Capsicum annuum, 3%–5%O2, 5%–10%CO2
C. frutescensPersimmon, kaki Dispyros kaki 3%–5%O2, 5%–8%CO2
Pineapple Ananas comosus 2%–5%O2, 5%–10%CO2
Plums and prunes Prunus domestica 1%–2%O2, 0%–5%CO2
Pomegranate Punica granatum 3%–5%O2, 5%–10%CO2
Potato Solanum tuberosum No CA benefitRadish Raphanus sativus 1%–2%O2, 2%–3%CO2
(Cont.)
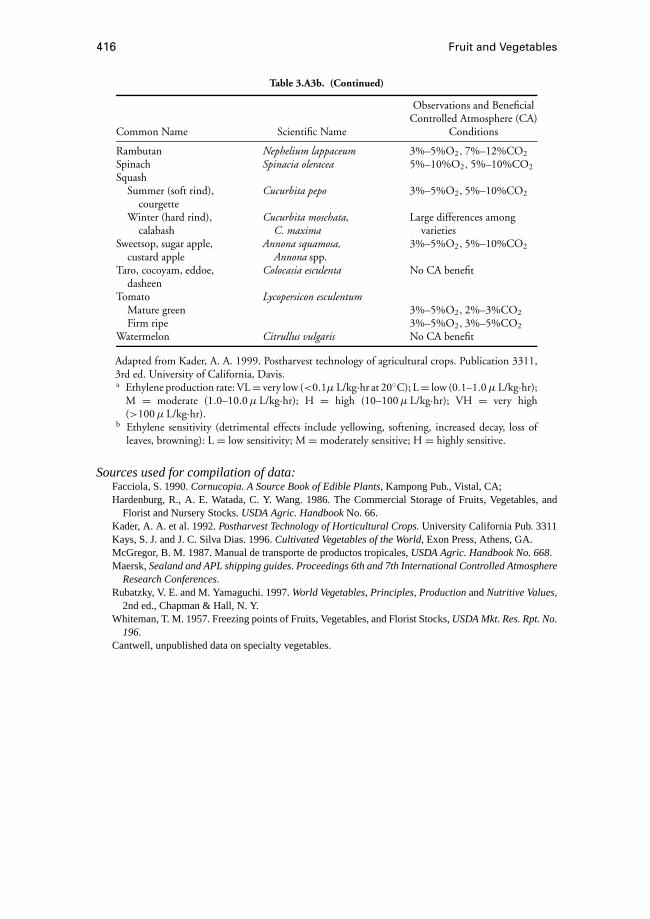
416 Fruit and Vegetables
Table 3.A3b. (Continued)
Observations and BeneficialControlled Atmosphere (CA)
Common Name Scientific Name Conditions
Rambutan Nephelium lappaceum 3%–5%O2, 7%–12%CO2
Spinach Spinacia oleracea 5%–10%O2, 5%–10%CO2
SquashSummer (soft rind), Cucurbita pepo 3%–5%O2, 5%–10%CO2
courgetteWinter (hard rind), Cucurbita moschata, Large differences among
calabash C. maxima varietiesSweetsop, sugar apple, Annona squamosa, 3%–5%O2, 5%–10%CO2
custard apple Annona spp.Taro, cocoyam, eddoe, Colocasia esculenta No CA benefit
dasheenTomato Lycopersicon esculentum
Mature green 3%–5%O2, 2%–3%CO2
Firm ripe 3%–5%O2, 3%–5%CO2
Watermelon Citrullus vulgaris No CA benefit
Adapted from Kader, A. A. 1999. Postharvest technology of agricultural crops. Publication 3311,3rd ed. University of California, Davis.a Ethylene production rate: VL= very low (<0.1µ L/kg·hr at 20◦C); L= low (0.1–1.0µ L/kg·hr);
M = moderate (1.0–10.0µ L/kg·hr); H = high (10–100µ L/kg·hr); VH = very high(>100µ L/kg·hr).
b Ethylene sensitivity (detrimental effects include yellowing, softening, increased decay, loss ofleaves, browning): L = low sensitivity; M = moderately sensitive; H = highly sensitive.
Sources used for compilation of data:Facciola, S. 1990.Cornucopia. A Source Book of Edible Plants, Kampong Pub., Vistal, CA;Hardenburg, R., A. E. Watada, C. Y. Wang. 1986. The Commercial Storage of Fruits, Vegetables, and
Florist and Nursery Stocks.USDA Agric. HandbookNo. 66.Kader, A. A. et al. 1992.Postharvest Technology of Horticultural Crops.University California Pub. 3311Kays, S. J. and J. C. Silva Dias. 1996.Cultivated Vegetables of the World, Exon Press, Athens, GA.McGregor, B. M. 1987. Manual de transporte de productos tropicales,USDA Agric. Handbook No. 668.Maersk,Sealand and APL shipping guides. Proceedings 6th and 7th International Controlled Atmosphere
Research Conferences.Rubatzky, V. E. and M. Yamaguchi. 1997.World Vegetables, Principles, ProductionandNutritive Values,
2nd ed., Chapman & Hall, N. Y.Whiteman, T. M. 1957. Freezing points of Fruits, Vegetables, and Florist Stocks,USDA Mkt. Res. Rpt. No.
196.Cantwell, unpublished data on specialty vegetables.
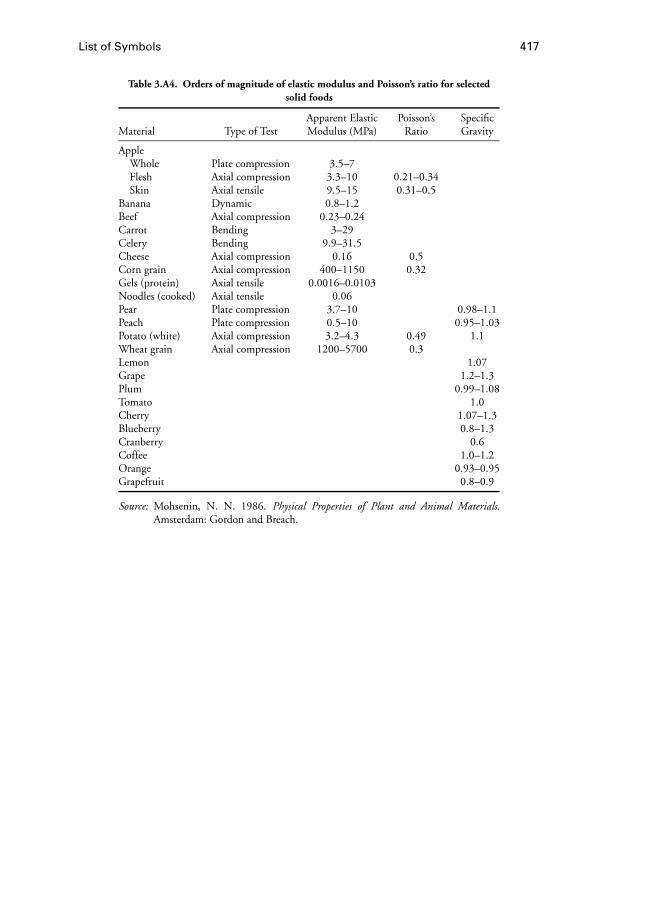
List of Symbols 417
Table 3.A4. Orders of magnitude of elastic modulus and Poisson’s ratio for selectedsolid foods
Apparent Elastic Poisson’s SpecificMaterial Type of Test Modulus (MPa) Ratio Gravity
AppleWhole Plate compression 3.5–7Flesh Axial compression 3.3–10 0.21–0.34Skin Axial tensile 9.5–15 0.31–0.5
Banana Dynamic 0.8–1.2Beef Axial compression 0.23–0.24Carrot Bending 3–29Celery Bending 9.9–31.5Cheese Axial compression 0.16 0.5Corn grain Axial compression 400–1150 0.32Gels (protein) Axial tensile 0.0016–0.0103Noodles (cooked) Axial tensile 0.06Pear Plate compression 3.7–10 0.98–1.1Peach Plate compression 0.5–10 0.95–1.03Potato (white) Axial compression 3.2–4.3 0.49 1.1Wheat grain Axial compression 1200–5700 0.3Lemon 1.07Grape 1.2–1.3Plum 0.99–1.08Tomato 1.0Cherry 1.07–1.3Blueberry 0.8–1.3Cranberry 0.6Coffee 1.0–1.2Orange 0.93–0.95Grapefruit 0.8–0.9
Source: Mohsenin, N. N. 1986. Physical Properties of Plant and Animal Materials.Amsterdam: Gordon and Breach.

418
4 Grapes, Olives, andCoffee
M. Ruiz-Altisent, Co-Editor
4.1 Wine ProcessingF. Ayuga
4.1.1 Industrial Process
It is not the intention of this handbook to make an exhaustive exposition of theindustrial elaboration process of wines. A more complete description can be seen inRefs. [1] and [2]. In this section, a description is made of the most important stagesfollowed, according to the type of wine to be obtained.
Types of WinesIn first place, the clear differences of existing types of wines must be indicated. White
or pink wines come from white grapes or a mixture with black grapes, but they acquireno color (white) or only a mild dye (pink) from the subsequent elaboration process. Redwines come from black grapes or a mixture of these with white, and they acquire thecharacteristic color from their elaboration process.
Processing OperationsIn Fig. 4.1 flowcharts that summarize the basic elaboration operations are shown. It
must be said that, within the two large groups into which wines have been divided, impor-tant different peculiarities may exist, according to the conscientiousness of manufactureand the existence or lack of intermediate operations intended to improve quality.
As can be appreciated, the difference between the elaboration systems is that thesecond makes the first fermentation from all the mass (husks, flesh, must and seeds, andpart of stem). This causes coloration of the liquid because of the existing pigments in thehusk of the black grape. The white- or pink-wine elaboration quickly separates the solidand the liquid phases. If the grape is white, white wine will be obtained, but if the wholeis black, or if black and white mixtures arrive at the winery, pink wine is with differenttonalities according to the proportion from each one and, above all, to the amount oftime during which must and husks stay without being separated, once the grapes havebeen crushed. “Claret” wines are those that are obtained from black and white grapesand whose fermentation is made partially in the presence of the residues of the blackgrape.
419
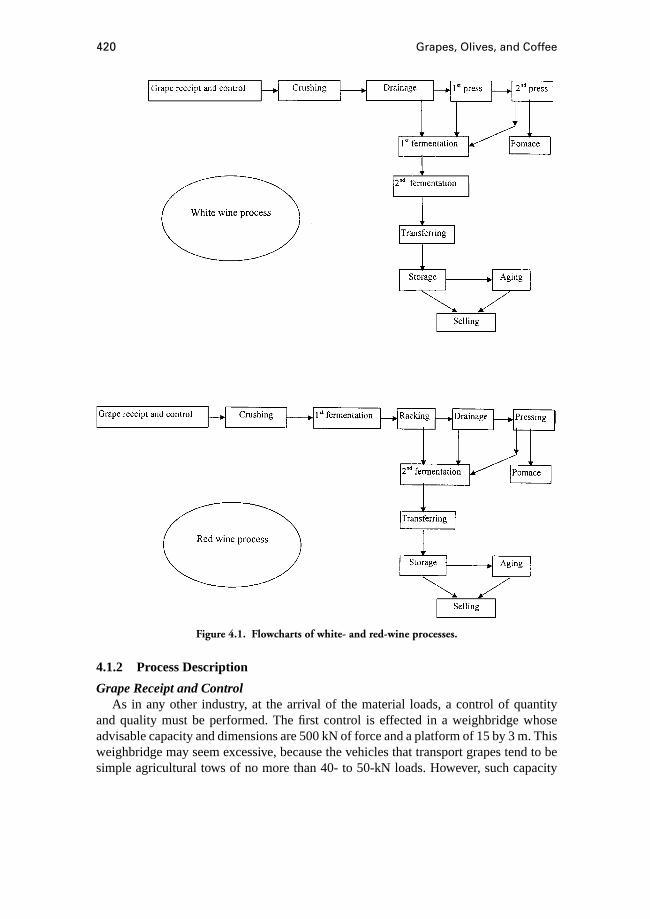
420 Grapes, Olives, and Coffee
Figure 4.1. Flowcharts of white- and red-wine processes.
4.1.2 Process Description
Grape Receipt and ControlAs in any other industry, at the arrival of the material loads, a control of quantity
and quality must be performed. The first control is effected in a weighbridge whoseadvisable capacity and dimensions are 500 kN of force and a platform of 15 by 3 m. Thisweighbridge may seem excessive, because the vehicles that transport grapes tend to besimple agricultural tows of no more than 40- to 50-kN loads. However, such capacity
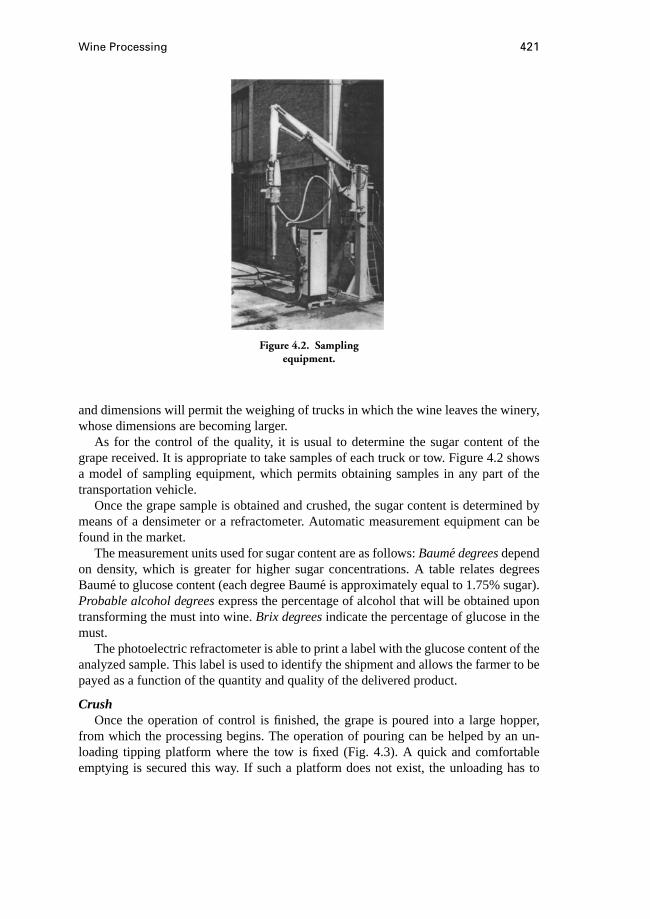
Wine Processing 421
Figure 4.2. Samplingequipment.
and dimensions will permit the weighing of trucks in which the wine leaves the winery,whose dimensions are becoming larger.
As for the control of the quality, it is usual to determine the sugar content of thegrape received. It is appropriate to take samples of each truck or tow. Figure 4.2 showsa model of sampling equipment, which permits obtaining samples in any part of thetransportation vehicle.
Once the grape sample is obtained and crushed, the sugar content is determined bymeans of a densimeter or a refractometer. Automatic measurement equipment can befound in the market.
The measurement units used for sugar content are as follows:Baume degreesdependon density, which is greater for higher sugar concentrations. A table relates degreesBaume to glucose content (each degree Baum´e is approximately equal to 1.75% sugar).Probable alcohol degreesexpress the percentage of alcohol that will be obtained upontransforming the must into wine.Brix degreesindicate the percentage of glucose in themust.
The photoelectric refractometer is able to print a label with the glucose content of theanalyzed sample. This label is used to identify the shipment and allows the farmer to bepayed as a function of the quantity and quality of the delivered product.
CrushOnce the operation of control is finished, the grape is poured into a large hopper,
from which the processing begins. The operation of pouring can be helped by an un-loading tipping platform where the tow is fixed (Fig. 4.3). A quick and comfortableemptying is secured this way. If such a platform does not exist, the unloading has to
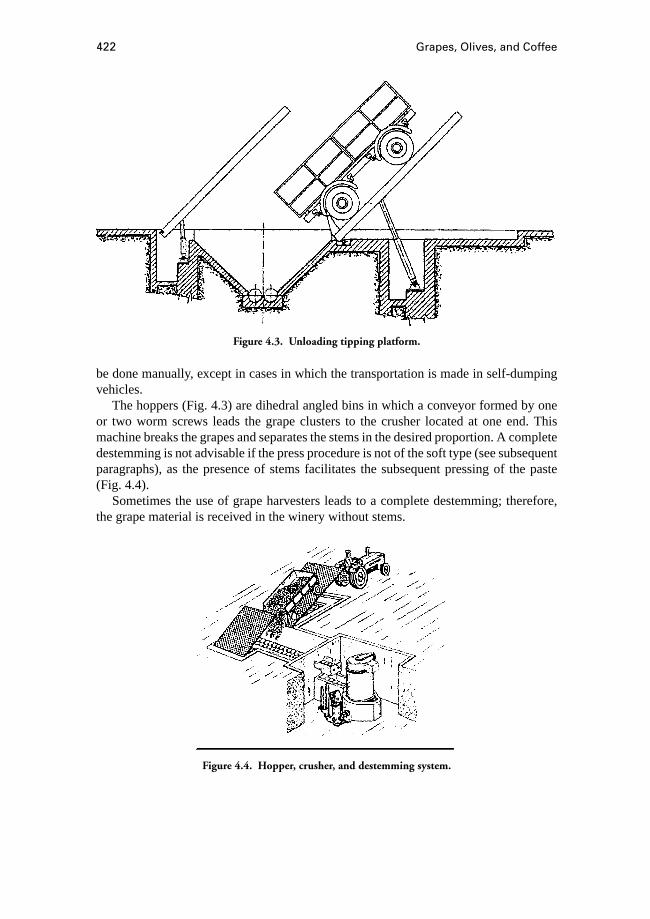
422 Grapes, Olives, and Coffee
Figure 4.3. Unloading tipping platform.
be done manually, except in cases in which the transportation is made in self-dumpingvehicles.
The hoppers (Fig. 4.3) are dihedral angled bins in which a conveyor formed by oneor two worm screws leads the grape clusters to the crusher located at one end. Thismachine breaks the grapes and separates the stems in the desired proportion. A completedestemming is not advisable if the press procedure is not of the soft type (see subsequentparagraphs), as the presence of stems facilitates the subsequent pressing of the paste(Fig. 4.4).
Sometimes the use of grape harvesters leads to a complete destemming; therefore,the grape material is received in the winery without stems.
Figure 4.4. Hopper, crusher, and destemming system.
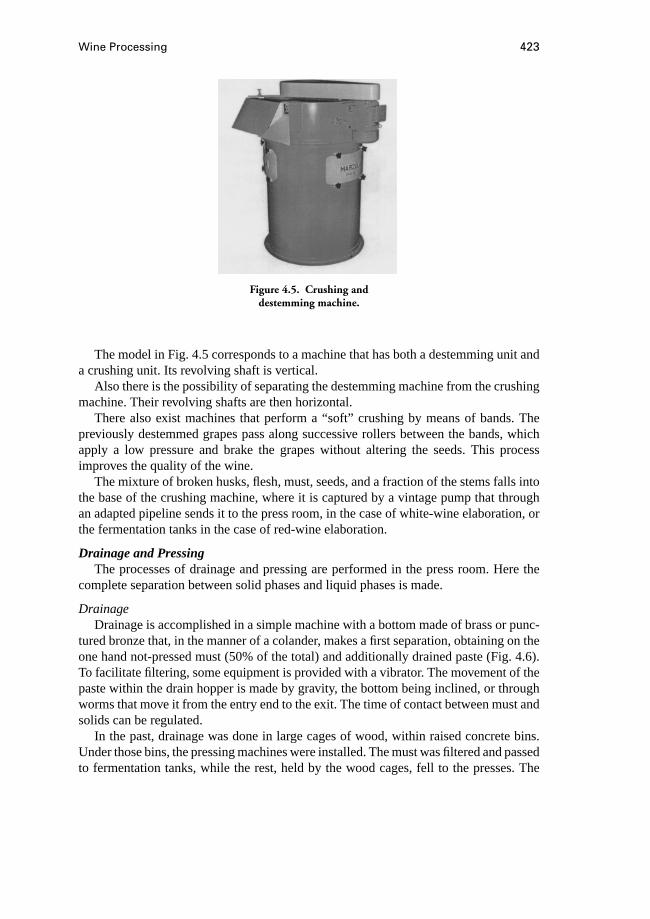
Wine Processing 423
Figure 4.5. Crushing anddestemming machine.
The model in Fig. 4.5 corresponds to a machine that has both a destemming unit anda crushing unit. Its revolving shaft is vertical.
Also there is the possibility of separating the destemming machine from the crushingmachine. Their revolving shafts are then horizontal.
There also exist machines that perform a “soft” crushing by means of bands. Thepreviously destemmed grapes pass along successive rollers between the bands, whichapply a low pressure and brake the grapes without altering the seeds. This processimproves the quality of the wine.
The mixture of broken husks, flesh, must, seeds, and a fraction of the stems falls intothe base of the crushing machine, where it is captured by a vintage pump that throughan adapted pipeline sends it to the press room, in the case of white-wine elaboration, orthe fermentation tanks in the case of red-wine elaboration.
Drainage and PressingThe processes of drainage and pressing are performed in the press room. Here the
complete separation between solid phases and liquid phases is made.
DrainageDrainage is accomplished in a simple machine with a bottom made of brass or punc-
tured bronze that, in the manner of a colander, makes a first separation, obtaining on theone hand not-pressed must (50% of the total) and additionally drained paste (Fig. 4.6).To facilitate filtering, some equipment is provided with a vibrator. The movement of thepaste within the drain hopper is made by gravity, the bottom being inclined, or throughworms that move it from the entry end to the exit. The time of contact between must andsolids can be regulated.
In the past, drainage was done in large cages of wood, within raised concrete bins.Under those bins, the pressing machines were installed. The must was filtered and passedto fermentation tanks, while the rest, held by the wood cages, fell to the presses. The
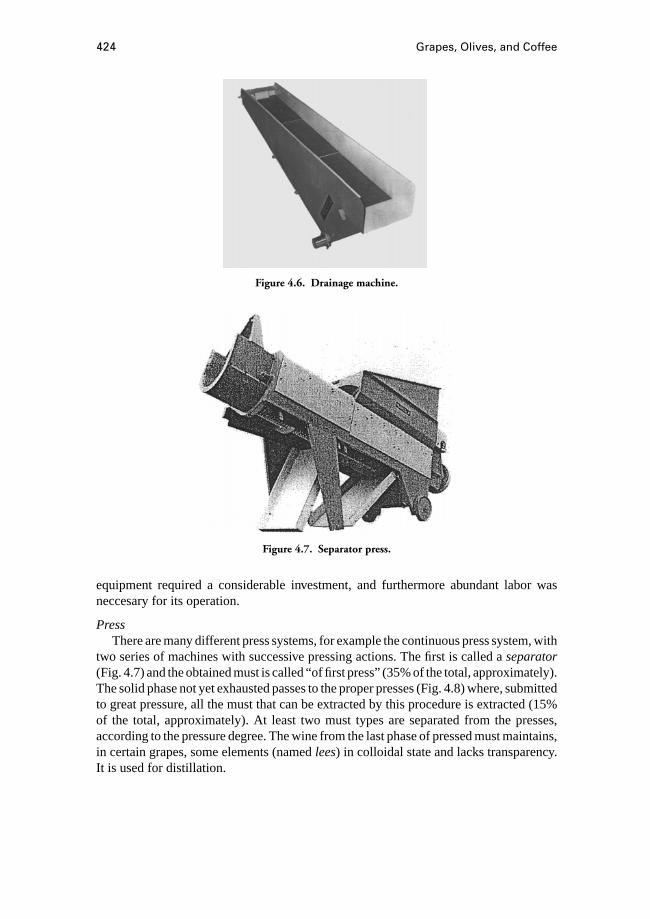
424 Grapes, Olives, and Coffee
Figure 4.6. Drainage machine.
Figure 4.7. Separator press.
equipment required a considerable investment, and furthermore abundant labor wasneccesary for its operation.
PressThere are many different press systems, for example the continuous press system, with
two series of machines with successive pressing actions. The first is called aseparator(Fig. 4.7) and the obtained must is called “of first press” (35% of the total, approximately).The solid phase not yet exhausted passes to the proper presses (Fig. 4.8) where, submittedto great pressure, all the must that can be extracted by this procedure is extracted (15%of the total, approximately). At least two must types are separated from the presses,according to the pressure degree. The wine from the last phase of pressed must maintains,in certain grapes, some elements (namedlees) in colloidal state and lacks transparency.It is used for distillation.

Wine Processing 425
Figure 4.8. Continuous press.
The solids, which subsequently are referred to aspomace, remain with a little quantityof must, and they are sent to bins. These can be simple steel hoppers, raised on pillarsso that a truck can pass below and collect the daily pomace production, or large binsin which pomace is stored well compacted, to get out the small amount of juice thatit yet possesses and mainly to avoid rottenness. In this case, pomace bins have enoughcapacity for the production of a whole season and pomace sale must not be agreed onand programmed previously as in the first case; investment in storage is much greater,however. Pomace serves as raw material for the distillation industry.
A softer press system is the discontinuous horizontal press. It was used years ago andis used today in some modern wineries that take extraordinary care with elaboration. Thepaste is forced to a lower pressure, and because of this the musts improve their quality.The inconvenience is that much labor is needed in the pressing process, as well as thatthe machines have a low work capacity compared with continuous presses.
Another type of press that is used in the elaboration of quality wines and whoseoperation is also discontinuous is the shell press. In Fig. 4.9 appears a model that uses
Figure 4.9. Shell press.
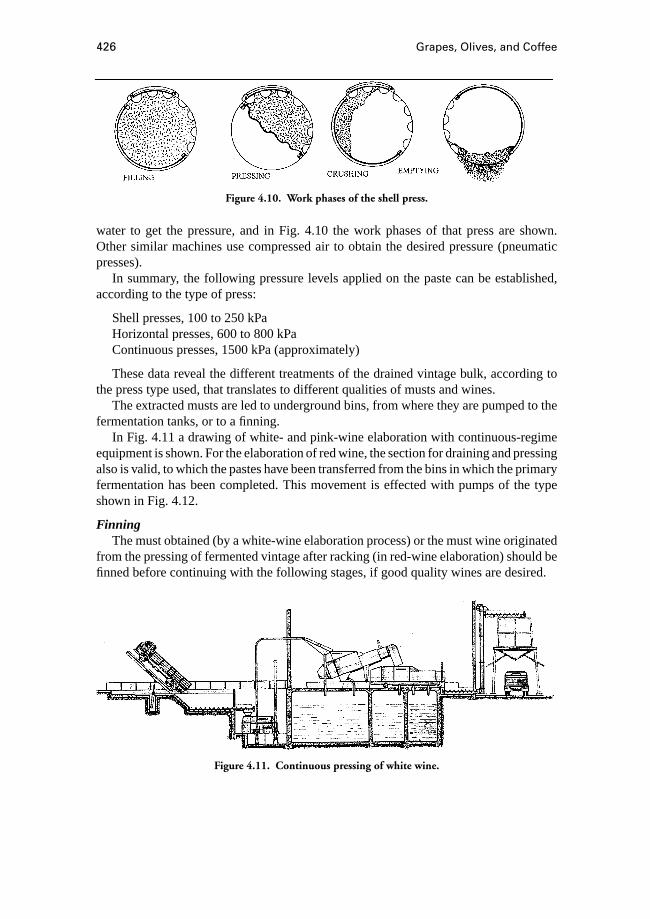
426 Grapes, Olives, and Coffee
Figure 4.10. Work phases of the shell press.
water to get the pressure, and in Fig. 4.10 the work phases of that press are shown.Other similar machines use compressed air to obtain the desired pressure (pneumaticpresses).
In summary, the following pressure levels applied on the paste can be established,according to the type of press:
Shell presses, 100 to 250 kPaHorizontal presses, 600 to 800 kPaContinuous presses, 1500 kPa (approximately)
These data reveal the different treatments of the drained vintage bulk, according tothe press type used, that translates to different qualities of musts and wines.
The extracted musts are led to underground bins, from where they are pumped to thefermentation tanks, or to a finning.
In Fig. 4.11 a drawing of white- and pink-wine elaboration with continuous-regimeequipment is shown. For the elaboration of red wine, the section for draining and pressingalso is valid, to which the pastes have been transferred from the bins in which the primaryfermentation has been completed. This movement is effected with pumps of the typeshown in Fig. 4.12.
FinningThe must obtained (by a white-wine elaboration process) or the must wine originated
from the pressing of fermented vintage after racking (in red-wine elaboration) should befinned before continuing with the following stages, if good quality wines are desired.
Figure 4.11. Continuous pressing of white wine.
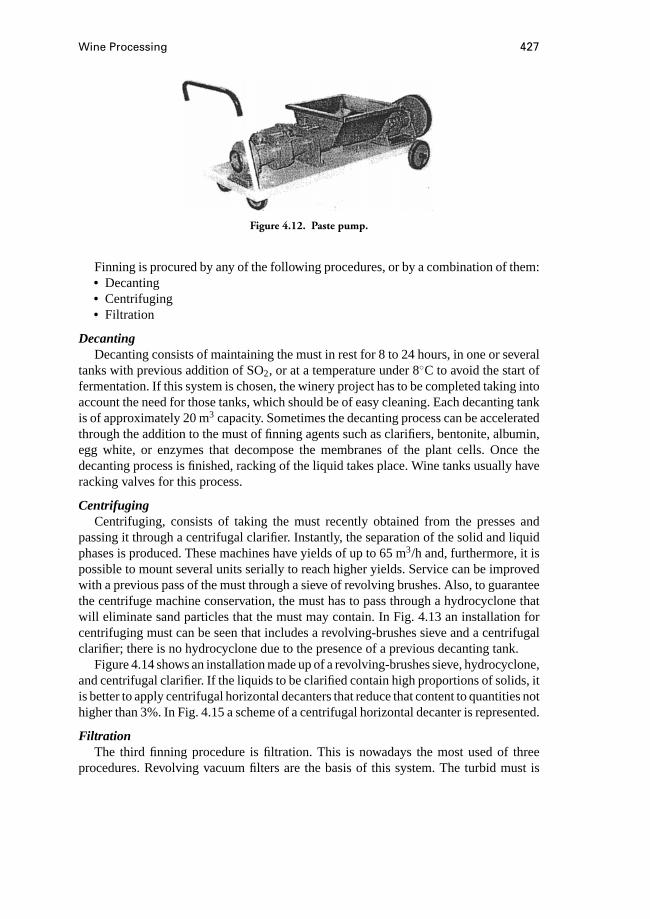
Wine Processing 427
Figure 4.12. Paste pump.
Finning is procured by any of the following procedures, or by a combination of them:• Decanting• Centrifuging• Filtration
DecantingDecanting consists of maintaining the must in rest for 8 to 24 hours, in one or several
tanks with previous addition of SO2, or at a temperature under 8◦C to avoid the start offermentation. If this system is chosen, the winery project has to be completed taking intoaccount the need for those tanks, which should be of easy cleaning. Each decanting tankis of approximately 20 m3 capacity. Sometimes the decanting process can be acceleratedthrough the addition to the must of finning agents such as clarifiers, bentonite, albumin,egg white, or enzymes that decompose the membranes of the plant cells. Once thedecanting process is finished, racking of the liquid takes place. Wine tanks usually haveracking valves for this process.
CentrifugingCentrifuging, consists of taking the must recently obtained from the presses and
passing it through a centrifugal clarifier. Instantly, the separation of the solid and liquidphases is produced. These machines have yields of up to 65 m3/h and, furthermore, it ispossible to mount several units serially to reach higher yields. Service can be improvedwith a previous pass of the must through a sieve of revolving brushes. Also, to guaranteethe centrifuge machine conservation, the must has to pass through a hydrocyclone thatwill eliminate sand particles that the must may contain. In Fig. 4.13 an installation forcentrifuging must can be seen that includes a revolving-brushes sieve and a centrifugalclarifier; there is no hydrocyclone due to the presence of a previous decanting tank.
Figure 4.14 shows an installation made up of a revolving-brushes sieve, hydrocyclone,and centrifugal clarifier. If the liquids to be clarified contain high proportions of solids, itis better to apply centrifugal horizontal decanters that reduce that content to quantities nothigher than 3%. In Fig. 4.15 a scheme of a centrifugal horizontal decanter is represented.
FiltrationThe third finning procedure is filtration. This is nowadays the most used of three
procedures. Revolving vacuum filters are the basis of this system. The turbid must is

428 Grapes, Olives, and Coffee
Figure 4.13. Installation for centrifuging must.
Figure 4.14. Installation of centrifugal clarifier.
forced to pass through a flour cap of diatomaceous earth, calledprecoat, which coats ahorizontal drum partially submerged in a tank containing the must or wine to filtrate.The drum surface is maintained under vacuum during the process. The precoat retainsthe solid materials, which are detached from the drum by a cleaver, and the filtered mustis channeled through the axial pipe. The yield of these filters is quite low, although itdepends on the solids content of the must. It is fixed at approximately 0.3 m3/h per m2
for musts with 4% of solids.There exist filters from 2 m2 to 40 m2 of surface. Their operation can be continuous
during 8 to 20 hours between successive precoat renovations.It is possible to combine the described separation systems to obtain a final maximum-
quality product.
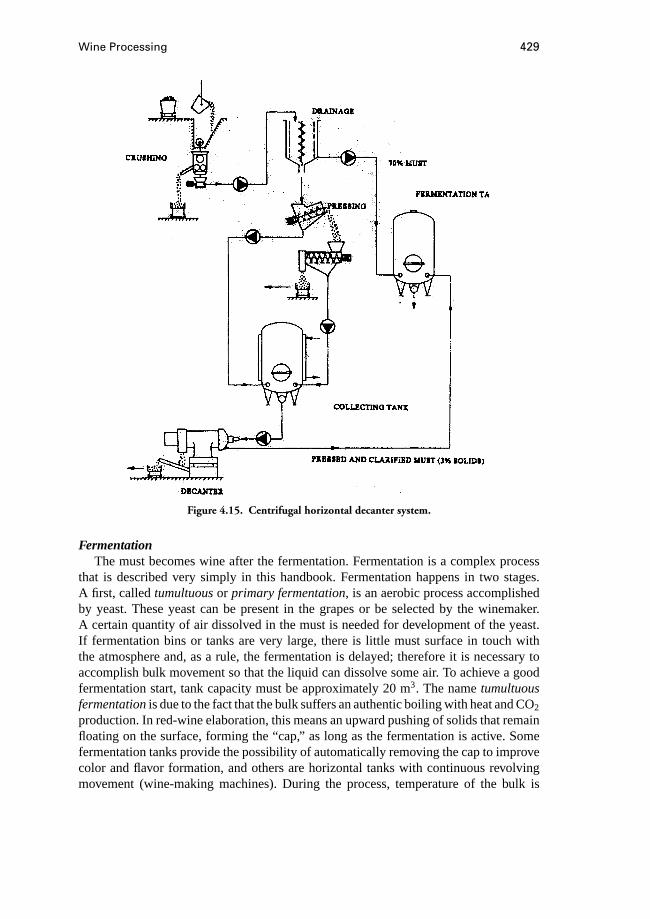
Wine Processing 429
Figure 4.15. Centrifugal horizontal decanter system.
FermentationThe must becomes wine after the fermentation. Fermentation is a complex process
that is described very simply in this handbook. Fermentation happens in two stages.A first, calledtumultuousor primary fermentation, is an aerobic process accomplishedby yeast. These yeast can be present in the grapes or be selected by the winemaker.A certain quantity of air dissolved in the must is needed for development of the yeast.If fermentation bins or tanks are very large, there is little must surface in touch withthe atmosphere and, as a rule, the fermentation is delayed; therefore it is necessary toaccomplish bulk movement so that the liquid can dissolve some air. To achieve a goodfermentation start, tank capacity must be approximately 20 m3. The nametumultuousfermentationis due to the fact that the bulk suffers an authentic boiling with heat and CO2
production. In red-wine elaboration, this means an upward pushing of solids that remainfloating on the surface, forming the “cap,” as long as the fermentation is active. Somefermentation tanks provide the possibility of automatically removing the cap to improvecolor and flavor formation, and others are horizontal tanks with continuous revolvingmovement (wine-making machines). During the process, temperature of the bulk is
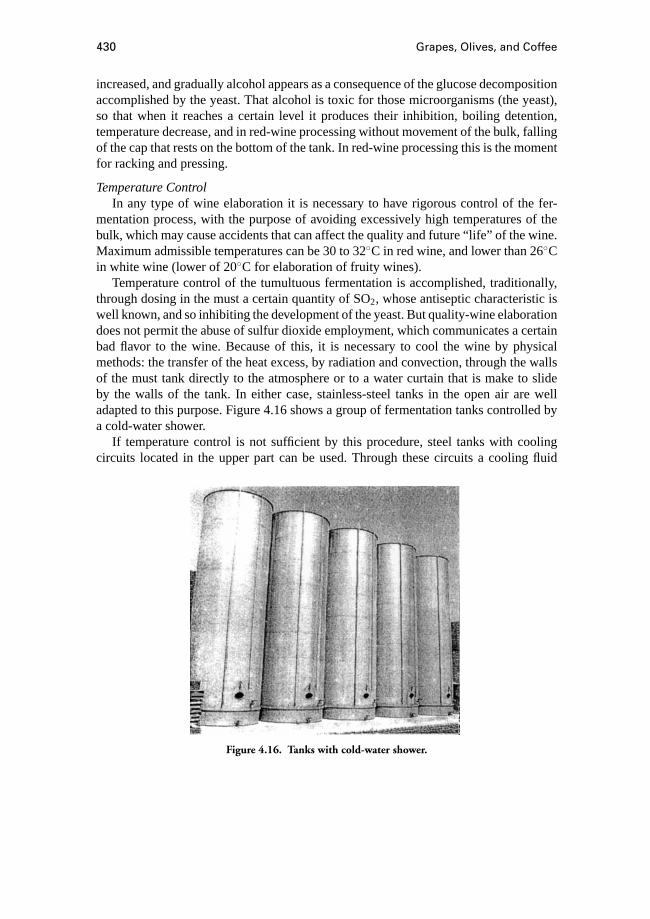
430 Grapes, Olives, and Coffee
increased, and gradually alcohol appears as a consequence of the glucose decompositionaccomplished by the yeast. That alcohol is toxic for those microorganisms (the yeast),so that when it reaches a certain level it produces their inhibition, boiling detention,temperature decrease, and in red-wine processing without movement of the bulk, fallingof the cap that rests on the bottom of the tank. In red-wine processing this is the momentfor racking and pressing.
Temperature ControlIn any type of wine elaboration it is necessary to have rigorous control of the fer-
mentation process, with the purpose of avoiding excessively high temperatures of thebulk, which may cause accidents that can affect the quality and future “life” of the wine.Maximum admissible temperatures can be 30 to 32◦C in red wine, and lower than 26◦Cin white wine (lower of 20◦C for elaboration of fruity wines).
Temperature control of the tumultuous fermentation is accomplished, traditionally,through dosing in the must a certain quantity of SO2, whose antiseptic characteristic iswell known, and so inhibiting the development of the yeast. But quality-wine elaborationdoes not permit the abuse of sulfur dioxide employment, which communicates a certainbad flavor to the wine. Because of this, it is necessary to cool the wine by physicalmethods: the transfer of the heat excess, by radiation and convection, through the wallsof the must tank directly to the atmosphere or to a water curtain that is make to slideby the walls of the tank. In either case, stainless-steel tanks in the open air are welladapted to this purpose. Figure 4.16 shows a group of fermentation tanks controlled bya cold-water shower.
If temperature control is not sufficient by this procedure, steel tanks with coolingcircuits located in the upper part can be used. Through these circuits a cooling fluid
Figure 4.16. Tanks with cold-water shower.
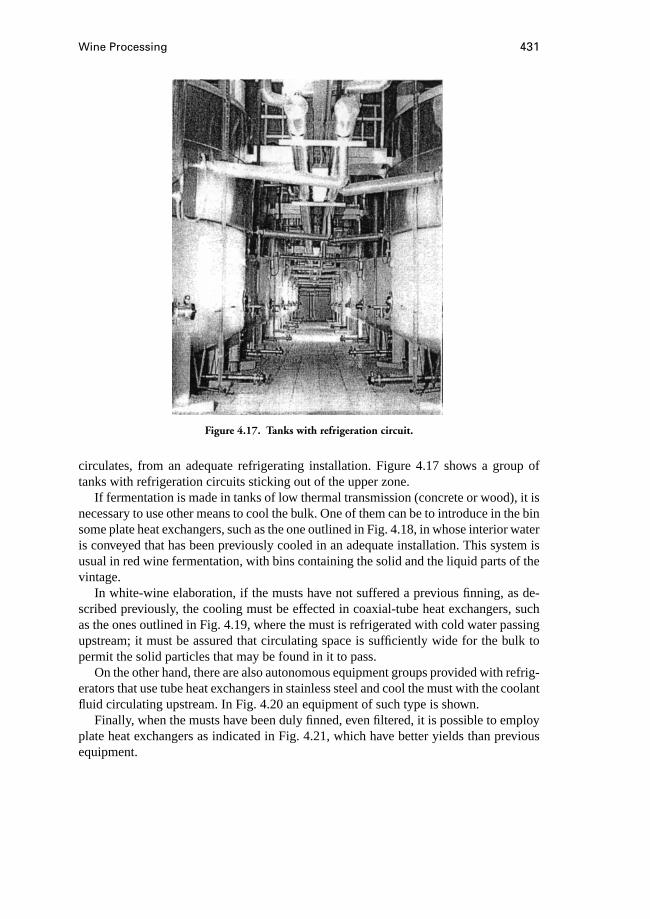
Wine Processing 431
Figure 4.17. Tanks with refrigeration circuit.
circulates, from an adequate refrigerating installation. Figure 4.17 shows a group oftanks with refrigeration circuits sticking out of the upper zone.
If fermentation is made in tanks of low thermal transmission (concrete or wood), it isnecessary to use other means to cool the bulk. One of them can be to introduce in the binsome plate heat exchangers, such as the one outlined in Fig. 4.18, in whose interior wateris conveyed that has been previously cooled in an adequate installation. This system isusual in red wine fermentation, with bins containing the solid and the liquid parts of thevintage.
In white-wine elaboration, if the musts have not suffered a previous finning, as de-scribed previously, the cooling must be effected in coaxial-tube heat exchangers, suchas the ones outlined in Fig. 4.19, where the must is refrigerated with cold water passingupstream; it must be assured that circulating space is sufficiently wide for the bulk topermit the solid particles that may be found in it to pass.
On the other hand, there are also autonomous equipment groups provided with refrig-erators that use tube heat exchangers in stainless steel and cool the must with the coolantfluid circulating upstream. In Fig. 4.20 an equipment of such type is shown.
Finally, when the musts have been duly finned, even filtered, it is possible to employplate heat exchangers as indicated in Fig. 4.21, which have better yields than previousequipment.
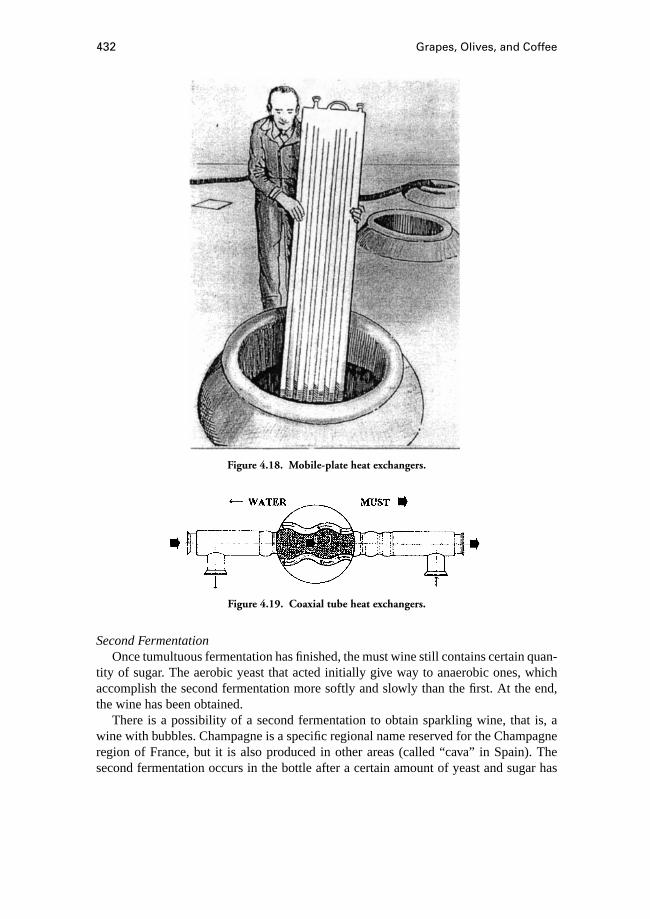
432 Grapes, Olives, and Coffee
Figure 4.18. Mobile-plate heat exchangers.
Figure 4.19. Coaxial tube heat exchangers.
Second FermentationOnce tumultuous fermentation has finished, the must wine still contains certain quan-
tity of sugar. The aerobic yeast that acted initially give way to anaerobic ones, whichaccomplish the second fermentation more softly and slowly than the first. At the end,the wine has been obtained.
There is a possibility of a second fermentation to obtain sparkling wine, that is, awine with bubbles. Champagne is a specific regional name reserved for the Champagneregion of France, but it is also produced in other areas (called “cava” in Spain). Thesecond fermentation occurs in the bottle after a certain amount of yeast and sugar has
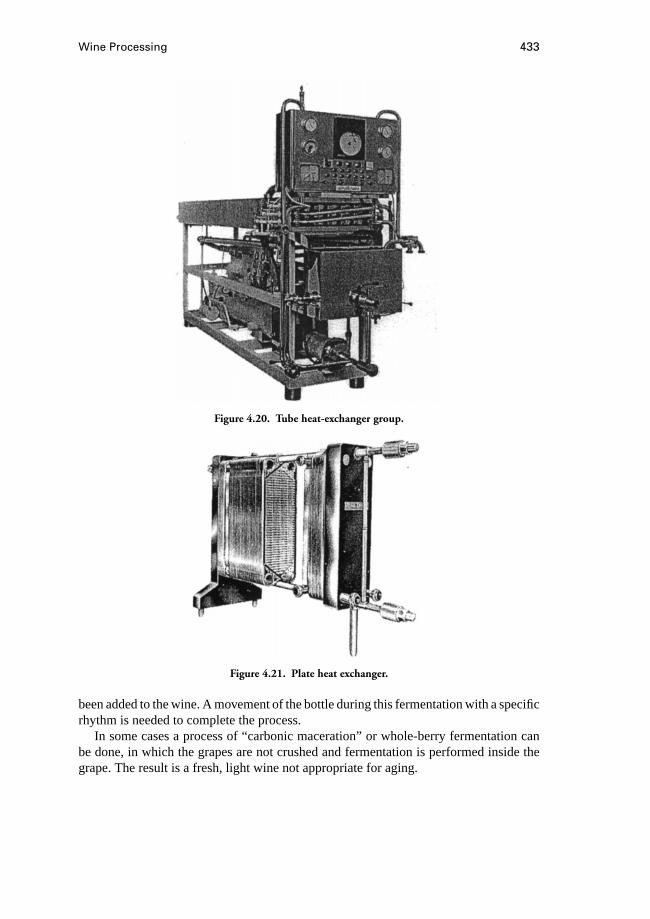
Wine Processing 433
Figure 4.20. Tube heat-exchanger group.
Figure 4.21. Plate heat exchanger.
been added to the wine. A movement of the bottle during this fermentation with a specificrhythm is needed to complete the process.
In some cases a process of “carbonic maceration” or whole-berry fermentation canbe done, in which the grapes are not crushed and fermentation is performed inside thegrape. The result is a fresh, light wine not appropriate for aging.
434 Grapes, Olives, and Coffee
Storage, Aging, and ExpeditionSome wineries are devoted to bulk wine production; others add the processes of
bottling and, eventually, aging of wine. The former ones only have to consider a need tostore the wine that may be solved in the same tanks used for fermentation or in differenttanks. It is very common to use large tanks outside the buildings, of 1000 m3 or more,to keep the wine until marketing and distribution.
In those premises in which aging of wine is accomplished, the first operation is totransfer the wine to barrels of oak wood (until that moment of the elaboration process,tanks are made of concrete or steel), so that it acquires the characteristic flavors of tannin,vanillin, and wood. There is also some kind of oxidation because of the permeabilityof wood to oxygen. In these oak barrels the wine stays for a period of 6 months to 5years, depending on type and final quality of the wine. During the time wine is in thebarrel, temperatures must be constantly low and humidity high; also, the wine must bemaintained resting quietly. This usually is done by maintaining it in underground cellars.Once the barrel aging is concluded, the wine is bottled and the aging process can go oninside the bottle. The aging in the bottle lasts more-or-less half of the time in the barrel(although there are exceptions such as Port wine, which can stay in the bottle more than10 years before being sold).
Wine without aging goes directly to consumption after it is stabilized through refrig-erating and filtering treatments, even pasteurized, and finally packed. Some wineries sellbulk wine to other wineries for blending, or to bottling industries or for distillation inalambic stills as a base for the manufacture of brandies.
At present, wines arrive to the consumer in packed form and, very rarely, in bulk form.Containers tend to be glass bottles for expensive wines, or carton bricks for cheaperwines. One way or another, it is required that previous treatments assure quality as wellas stability.
Cold Application in Wine StabilizationCold can be used for the regulation of the must fermentation, as well as to guarantee
the subsequent stability of the wine. In fact, the young wine contains certain substancesthat should be eliminated to assure its good quality. These substances are the following:• Colloids and sludge, which can be extracted by centrifuging or filtering• Pigments• Yeast and bacteria, which can be extracted by filtering or using membranes• Dissolved substances, which can be precipitated by variations in the wine temper-
ature (bitartrates).Bitartrates, which are dissolved at normal temperatures, can precipitate if the wine iscooled. This is the reason for eliminating these salts before bottling.
The best-known procedure for stabilization consists of submitting the wine to suc-cessive cold and filtration treatments. Cold treatments produce the tartrate crystals, andby filtration their elimination can be achieved. The system has many variants, accordingto the opinion of enologists. It is evident that the final wine quality depends as much onit as on the initial wine characteristics. In any case, it a process that lasts several daysand implies an installation of certain importance.

Wine Processing 435
Figure 4.22. Flowchart of wine-stabilization system.
In Fig. 4.22 the flowchart of a wine-stabilization system of a certain complexity isrepresented, previous to bottling. It can be seen that the cooling of near to freezingtemperature is the most important step to obtain precipitation bitartrates.
The process stages are as follow.
Blending and HomogenizingModern wines usually come from blends of two or more types, in adequate pro-
portions. This blending can be done in a stainless-steel or polyester tank with agitatorblenders and a minimum capacity of the daily volume of bottling. It is convenient to haveat least two tanks, so that one can be filled while the other is emptying. Another solutionis to have only one tank, but of double or triple the capacity of the daily treatment.
Diatomaceous Earth Filter.A filter is devoted to getting a first cleaning of the wine,extracting the sludge, colloids, and solid substances in suspension that may be contained.The yield of the filter must be at least the hourly bottling capacity (Fig. 4.23).
Three Days Rest.Some time of wine resting is advisable after filtering. Three daysis considered adequate. So five tanks should be used, each holding the daily bottlingcapacity, so that one is filling, three resting, and the fifth supplying wine to the followingstage.
Figure 4.23. Diatomaceous earth filter.
436 Grapes, Olives, and Coffee
Refrigeration. This is accomplished in two stages:• Recovery, from approximately 20 to 3.5◦C, in a plate heat exchanger passing up-
stream with wine already cooled. So, this phase means a thermal jump of 20−3.5=16.5◦C.
• Cooling, from 3.5◦C to temperature near freezing: for example,−5◦C. The winefreezing temperature is approximately:
t = (alcoholic degree− 1)/2
For example, a wine of 13 alcoholic degrees will be frozen to−6◦C, so it should not becooled below−5◦C. Consequently, the refrigerating power of the equipment must be:
q × 3.74 kJ/kg◦C× (3.5+ 5)= q × 31.79 kJ/h,
in whichq is cooled wine flow (m3/h), and the specific heat of the wine is 3.74 kJ/kg◦C.Note that the recovery cooling does not have an energy demand, because it is consid-
ered a simple heat exchange. For cooling, refrigerating equipment is necessary whosecondenser can be cooled by an air stream or by water. In the latter case, it is useful toinstall a recovery tower to save water.
Seven Days’ Isothermal Rest.The wine at−5◦C has to rest for easy bitartrate-crystalformation. This occurs in isothermal tanks, of stainless steel or polyester, with dailybottling capacity in each of them, of which there must be nine units (one being filled,seven in rest, and one being emptied).
Filtering. After the previous rest, once the bitartrate crystals are formed, wine is filteredto separate such crystals. A plate filter can be used with minimum yield for the bottlingcapacity.
Rise of Wine Temperature.The previous filtering has been made at−5◦C, the sametemperature at which the wine has stayed in the isothermal tanks. Now it has to returnto a normal temperature; this is done by passing wine upstream, allowing the wine thatenters to cool in the recovery section. If, for example, the final wine temperature has tobe 15◦C, the heat exchange will be:
3.74(15− [−5]) = 74.8 kJ/kg
higher than 3.74×16.5= 61.71 kJ/kg, necessary to cool the entering wine which yieldsa process efficiency of
61.71× 100/74.8= 82.5%.
Rest of 1 Day.This is accomplished in a tank with at least daily bottling capacity. Itserves, furthermore, as stream regulation previous to bottling.
Filtering. This is the last process before bottling. It uses the same kind of equipment asin the previous step. Its yield has to be at least the daily bottling capacity.

Wine Processing 437
Design Process of a WineryAn example of a real case is presented to illustrate the process of design. The case is
the design of the cold installation needed to supply a wine-bottling plant that works atthe rate of 10 m3 daily. Temperatures of the process would be those previously indicated.Requirements are as follow:
Treatment stream flow: for a shift of 5 working hours, 2 m3/hHomogenizing and blending tanks: for example, two units of 10 m3
Diatomaceous filter: one unit with minimum flow of 2 m3/hThree-day’s-rest tanks: five units of 10 m3
RefrigerationRecovery stage: plate heat exchangers; recovered cold: 2 m3/h×1 kg/m3×3.74 kJ/kg◦C× 16.5◦C= 123.4 kJ/hCooling step: equipment must be able to facilitate 2 m3/h×1 kg/m3×3.74 kJ/kg◦C× (3.5+ 5)◦C = 63.6 kJ/h; refrigerating power must be atleast 71 kJ/h, considering a 90% efficiency
Seven day’s isothermal rest: nine tanks of 10 m3 are neededPlate filter: minimum flow of 2 m3/hWine temperature raising: done in the recovery section; wine increases its
temperature from−5◦C to 15◦C, taking heat from the wine that is enteringin the section, whose temperature goes from 20◦C to 3.5◦C, varying16.5◦C; so, the heat exchange is 2 m3/h×1 kg/m3×3.74 kJ/kg◦C×20◦C=149.6 kJ/h, and the taken heat is 2 m3/h × 1 kg/m3 × 3.74 kJ/kg◦C ×16.5◦ C = 123.4 kJ/h, which implies an efficiency of 82.5%, as alreadyhad been calculated.
One day’s rest: one or two tanks of 10 m3
Filtering: plate filter of 2 m3/h flow is needed
Installation summary:• Tanks of 10 m3
• 2 units for homogenizing and blending• 5 units for 3 day’s rest• 9 units for isothermal rest• 2 units for 1 day’s rest• Total, 15 units• Filters of 2 m3/h of flow: 1 diatomaceous, 1 of plates after isothermal, 1 of plates
before bottling• Recovery section by heat exchange of 2 m3/h of flow and exchange capacity of 150
kJ/h• Cooling equipment of 71 kJ/h and 2 m3/h flow• Pumps, pipelines, valves, etc. necessary to move the wine
Figure 4.24 shows an installation similar to the one described.According to the previous text, stabilization process time is approximately 12 to 13
days. An important number of tanks and a large built space are required. In order toachieve a lower process time, as well as a reduction in the number of tanks, certain
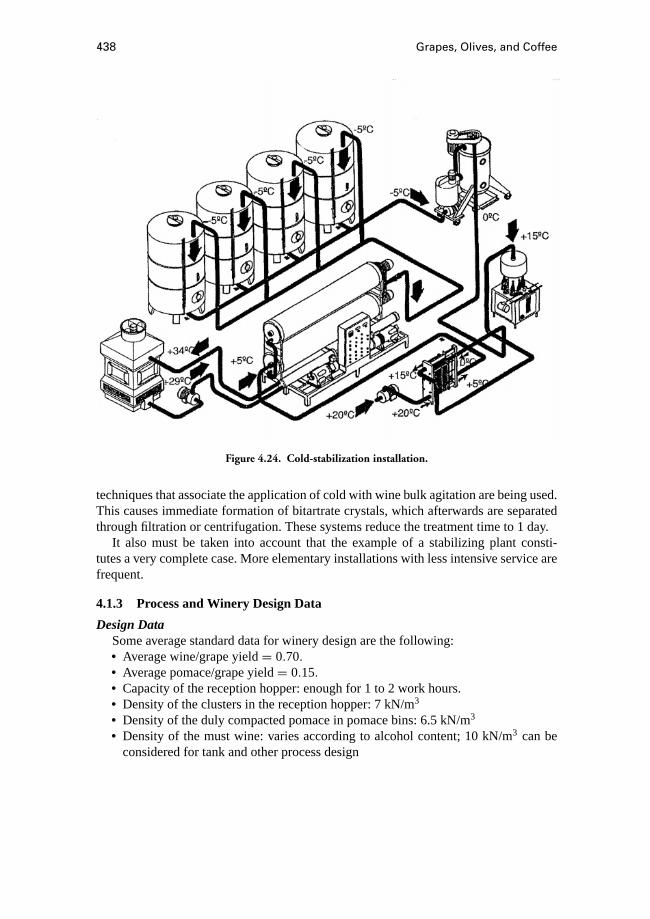
438 Grapes, Olives, and Coffee
Figure 4.24. Cold-stabilization installation.
techniques that associate the application of cold with wine bulk agitation are being used.This causes immediate formation of bitartrate crystals, which afterwards are separatedthrough filtration or centrifugation. These systems reduce the treatment time to 1 day.
It also must be taken into account that the example of a stabilizing plant consti-tutes a very complete case. More elementary installations with less intensive service arefrequent.
4.1.3 Process and Winery Design Data
Design DataSome average standard data for winery design are the following:• Average wine/grape yield= 0.70.• Average pomace/grape yield= 0.15.• Capacity of the reception hopper: enough for 1 to 2 work hours.• Density of the clusters in the reception hopper: 7 kN/m3
• Density of the duly compacted pomace in pomace bins: 6.5 kN/m3
• Density of the must wine: varies according to alcohol content; 10 kN/m3 can beconsidered for tank and other process design
Wine Processing 439
• Harvest duration: 15 days, more or less, unless special circumstances advise ex-tending it. Working hours in the field as well as in the winery tend to be longerthan 8 hours. These circumstances influence the capacity of processing machinery.Machinery capacities have to be selected taking into account these data, which maybe obtained from previous experience or by programming the harvest.
Grape-entry volume grows from the beginning of the vintage until the central days,to descend at the end of the season. Because of this, in order to calculate the size andcapacity of the elaboration machines, it can be assumed that on top days the intake is 20%to 25% larger than the season average. Finally, once the hourly processing capacity hasbeen obtained, machines that reach it or surpass it slightly will be chosen. On the otherhand, it is better to use two pieces of equipment instead of one alone, so a breakdownreduces production to half but it does not stop it entirely. Nevertheless, that solution issomewhat more expensive.
Fermentation TanksGood fermentation control needs tanks with capacity of approximately 20 m3,
although larger tanks are used in some wineries.
Storage tanksStorage and fermentation tanks are not differentiated in many wineries. But the exis-
tence of large tanks, not only for the annual campaign but also as interannual regulationof productions, is increasingly frequent. These are usually steel tanks, with capacitiesup to 1000 m3. The presence of these tanks is more frequent in nonaging wineries.
4.1.4 Design Example
A winery that is going to receive a 30,000 kN grape crop has the following require-ments:
Winery capacity: 30,000×0.7=21,000 kN= 2100 m3
Pomace volume: 30,000× 0.15= 4500 kN; 4500 kN/6.5 kN/m3 = 692 m3
Machinery design: average elaboration yield, 30,000 kN/15 d= 2000 kN/d;top days, 1.2×2000= 2400 kN/d; hourly capacity, 2400/8= 300 kN/h.
Process machinery can be selected with this capacity and also with 150 kN/h;therefore, it is possible to adopt a group of machines of 300 kN/h or twogroups of 150 kN/h
Fermentation and storage tanks:n = 2,100/20= 105 tanks; it is convenientto add a 5% more as safety margin—that is to say, 110 tanks of 20 m3 areneeded in the winery
Grape-reception hopper, triangular base section 5 m and depth 2.50 m: ca-pacity by meter of hopper, 0.5× 5× 2.50× 7 kN/m3 = 43.75 kN/m;for operation of the machinery between 1 and 2 hours, 1.5× 300 kN/hr/43.75 kN/m= 10–11 m of hopper length
Labor and costs: Labor needs for the example winery can be three permanentpeople, two for quality control and one more in the process section. Two
440 Grapes, Olives, and Coffee
more would be needed during the harvest time. Cost of machinery couldbe of US$300,000, varying greatly among different countries.
4.1.5 Winery Description
A more complete winery description can be seen in Ref. [3].
Reception HopperThis is usually built of concrete or reinforced concrete. The surfaces are polished or
covered with glazed tiles or better with stainless steel to facilitate the flow of the grapeclusters. The hopper walls project up from the soil 0.25 or 0.30 m to avoid entrance ofrainwater reflected by the contiguous pavement. The dihedral faces have equal slopesif two worm screws are used and unequal if only one. So, clusters vault and emptyoperation of worm screw will be avoided. In no case is wall slope less than 45 degrees.The set is covered with a roof whose supporting structure is located so that it does notblock vehicle circulation.
The use of this type of hopper implies that cluster dumping must be made by handor the use of self-dumping transportation vehicles. But in some areas grape transporta-tion is made by tows provided with canvas or plastic, on which clusters are loaded. So,it is very convenient to have mechanisms that facilitate dumping. Among them is theunloading tipping platform, as shown in Fig. 4.3, which consists of two pieces one afterthe other. The placement maneuver of the tow is thus simplified: One of the platformsis placed over the hopper and acts as bridge to get the tow pass over, until it is locatedon the other platform. Afterwards, both are lifted and the grape falls between them,just within the hopper. Also, hydraulic jacks can be found that incline the vehicles tofacilitate dumping, although damage can be caused to the tow if these are not properlyoperated.
Another solution consists of having a sole unloading tipping platform near the hopperthat is lifted parallel to it, which facilitates tow dumping by one of its sides. In somewineries with little space for vehicle movement, grape aspirators have been successfullyinstalled. The aspirator has a mobile mouth that can reach any point of a shipment locatedunder it. Such a mouth is fitted to a flexible pipeline that ends in a potent cyclone, whichabsorbs the clusters through the mouth and pipeline and exhausts them onto the crusher,located below, by the air expansion during entry in the container. Naturally with thisexhaust system the receipt hopper is not needed; therefore it can be adapted to winerieswith scarce space.
In most cases, the reception hoppers are built, with platforms as well as without them,isolated from the remaining buildings of the winery, so that they will be accessible fromeach of their sides.
The centrifugal crushers receive the clusters from the lower part; therefore, the place-ment of these machines requires a perfect alignment between the shaft of worm screwsand the shaft of the crusher’s orifice. In other models the grape is received by the upperpart, which makes it necessary to dig large pits to place the crusher. A building is made tolocate the crusher and the vintage pump, the dimensions of which are dictated by thosemachines.
Wine Processing 441
Press Room and Pomace BinsThe press room is designed in agreement with the drain and press machines. If there
are pomace bins, they are located adjacent to the press room so that the pomace passesdirectly from the presses to a by-pass that distributes it into different bins. Otherwise,if there are no pomace bins built, it can be designed a container or hopper elevated overthe flour. This hopper is loaded through a worm screw, which collects pomace fromthe press exit. Hopper emptying is done through openings in its base into by-producttransportation vehicles, which can pass under the hopper.
In wineries with red-wine elaboration it is convenient to have the press room nextto the storage building. So, according to what has been said, once the first fermentationhas finished the must wine passes to drain and press machines. Therefore, proximity oftanks to these machines is necessary.
If the elaboration is only of white and pink wines, the press room and pomace binscan be built separate of the other buildings. This facilitates access to all buildings andpossible winery amplifications.
The machines of the press room, one or several, are as follow:• Vibrator or static drain hopper• Separator presses• Presses• Pomace evacuator (in general a crusher, collector, elevator, and distributor)• Transferring pumpsAs has been shown, three or four must classes are obtained that it is advisable to sepa-
rate. For this reason underground sumps are built. To those sumps hoses from each one ofthe press machines are conducted. The whole capacity of the sumps must be equivalent tothe hourly must production, and their number depends on the selection degree made withmusts or wine. There are at least two units. Thereafter, the must is pumped separately tothe fermentation tanks in white-wine processing or to storage in red-wine processing.
Construction of Press RoomThe press room is of simple construction. Mass concrete or slightly reinforced concrete
is used in foundations, benches, and the ground floor. The floors are smooth with gooddrainage to avoid puddles. The structure is of reinforced concrete, steel, or any othermaterial adapted to the building dimensions. There are simple walls of conventionaltype, roof with thermal insulation of sufficient quality, metallic doors easy to handleand of dimensions adapted for installed machines, windows of concrete, metal, or PVCwith enough opening to guarantee ventilation; good light, natural as well as artificial(300–500 lux); and power take-off in accordance with the installed machines. Eventhe general switchboard of the winery could be installed in this room, with the propersecurity measures. Plenty of pressured water is needed in this room. The sewer systemis minimal, an inspection chamber for cleanliness of water being enough. Towards thisinspection chamber the floor inclination is directed.
Pomace BinsPomace bins are built of mass or reinforced concrete, with a depth not larger than
5 m to avoid difficulties in pomace extraction, or even smaller if a high water table is

442 Grapes, Olives, and Coffee
Figure 4.25. Press buildings.
present. Placement of bins in double string is advisable, because this permits locationof the pomace unloader in the central wall, so that it can unload to the right and left.Direct access from outside to the bin strings is necessary. If pomace bins are designedadjacent to a press-room wall or to a loading-wharf wall, it will not be possible to havethat arrangement, and only one string should be built. As a rule, bins are covered with alight roof; their lateral fa¸cades can remain open or be closed with simple walls with thenecessary openings.
In wineries that employ reduced-pressure presses, the pomace depletion does notbecome complete; therefore it is usual to have “purge sumps” in pomace bins in simpleinspection chambers in accessible corners, toward which is the inclination of the floor ofthe bin directed. So the fluids from the pomace remain isolated from solids and in contactwith the open air through a brick chimney. Two press-room models are represented inFig. 4.25. The first corresponds to a white-wine winery and, together with the pomacebins, forms a set of equipment isolated from the rest of the winery constructions. Thesecond belongs to a red-wine winery; the press room is near the storage room. At the sametime pomace bins are adjacent to both rooms. In both models pomace bins can be replacedby an elevated steel hopper in case of continuous pomace removal.
Storage RoomMust storage, fermentation and subsequent conservation of the wine can be effected
in a storage room, which can be a building or section of a building. In all cases thestorage room is full of tanks on the ground floor, and in some wineries underground binsas well. Storage-room dimensions are fixed according to the number of tanks and theircharacteristics. The storage room must have the following conditions.
InsulationThere must be good cover and wall insulation. Transmission coefficients should not
be higher than 2.9 and 4.15 kJ/m2·h·◦C, respectively.
Wine Processing 443
VentilationGood ventilation is necessary at all levels to facilitate the carbonice anhydride ex-
haust produced during the fermentation. This gas is heavier than air and will remainin the lowest parts of the room. Because of this, holes at that level are advisable and,eventually adequately situated air fans will have to be installed. Mobile fans that cansolve deficiencies in a wrongly projected ventilation system can be found.
TanksWith the on- and underground tanks there must exist a great bin, preferably under-
ground, intended for blends or “coupages.” Its capacity is more than five tanks. It islocated in an area of easy access to tankers for direct wine charge. It is also necessary tohave several small tanks whose added capacity is the same as one storage tank and thatare destined for withdrawal of wine excess during emptying of larger tanks.
Drain PipesAn adequate net of drainage pipelines for evacuation of cleaning waters must be de-
signed. However, if some or all of the surface is occupied with underground bins, pipelinetracing is hindered and the net is limited to one drain pipe located in a transverse senseand toward which the longitudinal channel opened over the top slabs of the undergroundbins is be directed. In small wineries the absence of a sewer net is frequent; a set ofinterior channeling that ends in an underground bin is enough. Washing the winery be-fore each elaboration, the foul waters are collected in that bin and pumped outside. Theunderground bin can be cleaned and prepared also to receive wine from overfilling orother tanks breaking.
Other Buildings and Facilities for StorageThe storage shed as well as the other winery buildings should have an adequate
distribution network of drinking water. Winery water needs are not very important,except in the cases of the bottling section and the consequent bottles washing.
In some wineries large outdoor steel tanks are built for partial storage, complementedwith a building for smaller tanks. All storage can be done in large tanks. In this case thereis not a storage building. An area for the manipulations previous to expedition is needed.
4.1.6 Tanks
Only descriptive aspects are mentioned here. Structural design of tanks can be seenin Ref. [3].
Wall MaterialsThe tanks can be constructed of ordinary steel with internal anticorrosive finish,
stainless steel, reinforced concrete, reinforced polyester, or oak wood.
Position and ConstructionIn relation to their position in the storage room, they can be on the ground, that is to
say built on the soil level; or underground, or built under the average level of the winery.As a rule, underground bins are reinforced concrete; on-ground tanks can be of con-
crete, steel, polyester, or wood. The last, the most expensive, mainly are used in wine orliquor aging. They are not used in the wineries that sell wine less than a year old.

444 Grapes, Olives, and Coffee
Tank construction, of any material and shape, is subject of a certain specialization;experts must be relied on for quality.
With respect to the most convenient material and shape of tanks, it can be said thatfor racking and first fermentation steel or reinforced concrete tanks are preferred, on theground and with low manholes that are used to extract the solids. Their capacity shouldnot be excessively large, for a better fermentation control, 20 m3 is adequate. Cylindricaltanks present the advantage of remaining isolated from each other by a space neversmaller than 0.5 m, which permits avoiding fermentation interaction between tanks.On the other hand, they demand larger building surface. Stainless-steel tanks, althoughsomewhat more expensive, are the most common because of their hygienic conditions.Prismatic tanks, generally of reinforced concrete, are built in sets of several units, sothat their walls are shared between two tanks. That circumstance makes it advisable toestablish insulation joints to create groups of units in contact, with a whole capacity ofnear daily must production. For example, if the mean elaboration of a winery is 200 m3
daily and fermentation tanks are 20 m3, the insulation joints should be created every 10tanks, so only tanks filled on the same day are in touch, in which fermentation processesare similar.
For secondary fermentation and wine storage any type of tank can be used.
Advantages and DisadvantagesAmong concrete tanks, cylindrical are more economical than prismatic. The first
require a greater space and the accomplishment of a high floor for manipulations. Thiscan be saved in the prismatic tanks; for this purpose the upper slab is used. However, thetotal investment is lower with cylindrical tanks because of lower structural loads.
As a rule, underground tanks are prismatic and of reinforced concrete. Their walls aredesigned to resist liquid and earth loads, as well as the loads exerted by the next foun-dations. Because of their underground placement they maintain a uniform temperaturethroughout the year; therefore, they are very recommendable for storage of wine thatstays in the winery during summer.
Steel tanks are usually cylindrical and can be of great capacity, which makes themvery adequate for storage. They can be installed in a vertical or horizontal position, whichis a very important facet of their design. The first arrangement takes better advantage ofthe space; the second permits installation in two or more levels, after adequate structureconstruction (Fig. 4.26). Stainless-steel tanks increase investment, although they providean extraordinary conservation guarantee of the content as well as of the tanks themselves.The advantages that steel tanks present for the fermentation control have been indicatedpreviously; they are a consequence of the high thermal transmission of their walls, whichallows shower refrigeration or refrigeration through a fixed cooling circuit, as well as, ifnecessary, a heating circuit to enhance the start of fermentation in cold zones.
Glass fiber–reinforced polyester tanks have been used increasingly for some yearsnow. This is a material resistant to nearly all chemical agents, easy to clean, and veryeconomical (Fig. 4.27).
If thermal insulation is required in steel or polyester tanks, they are lined with anadequate insulation material (polystyrene, polyurethane, mineral fibers, etc.) and also anexternal wrapper of steel or plastic.
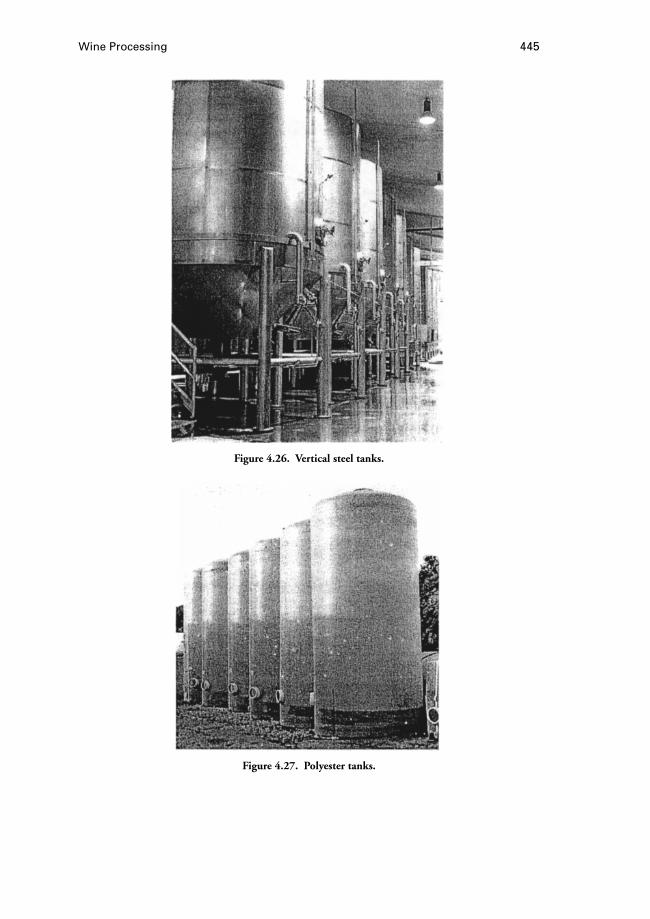
Wine Processing 445
Figure 4.26. Vertical steel tanks.
Figure 4.27. Polyester tanks.
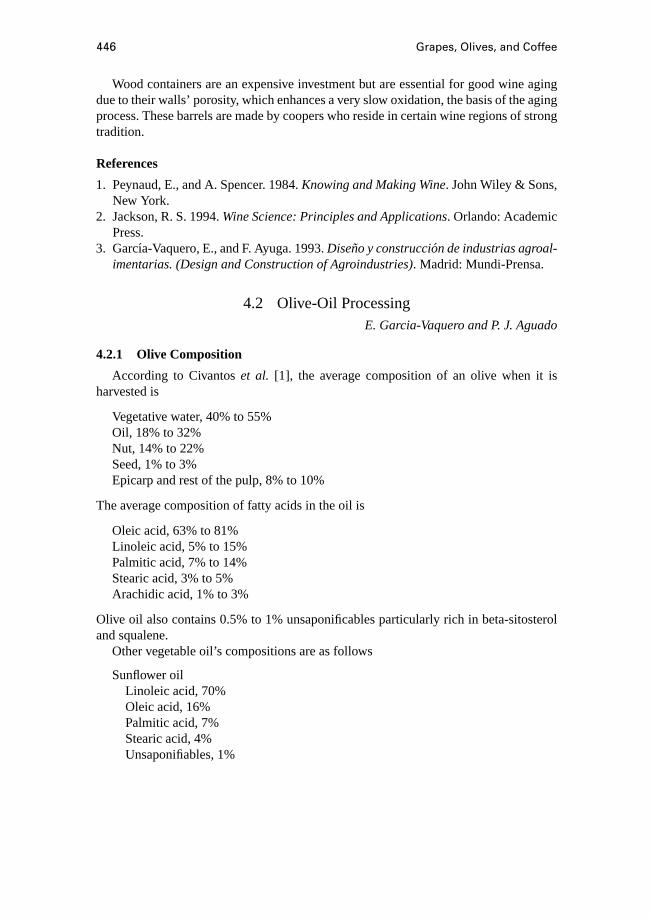
446 Grapes, Olives, and Coffee
Wood containers are an expensive investment but are essential for good wine agingdue to their walls’ porosity, which enhances a very slow oxidation, the basis of the agingprocess. These barrels are made by coopers who reside in certain wine regions of strongtradition.
References
1. Peynaud, E., and A. Spencer. 1984.Knowing and Making Wine. John Wiley & Sons,New York.
2. Jackson, R. S. 1994.Wine Science: Principles and Applications. Orlando: AcademicPress.
3. Garc´ıa-Vaquero, E., and F. Ayuga. 1993.Diseno y construccion de industrias agroal-imentarias. (Design and Construction of Agroindustries). Madrid: Mundi-Prensa.
4.2 Olive-Oil ProcessingE. Garcia-Vaquero and P. J. Aguado
4.2.1 Olive Composition
According to Civantoset al. [1], the average composition of an olive when it isharvested is
Vegetative water, 40% to 55%Oil, 18% to 32%Nut, 14% to 22%Seed, 1% to 3%Epicarp and rest of the pulp, 8% to 10%
The average composition of fatty acids in the oil is
Oleic acid, 63% to 81%Linoleic acid, 5% to 15%Palmitic acid, 7% to 14%Stearic acid, 3% to 5%Arachidic acid, 1% to 3%
Olive oil also contains 0.5% to 1% unsaponificables particularly rich in beta-sitosteroland squalene.
Other vegetable oil’s compositions are as follows
Sunflower oilLinoleic acid, 70%Oleic acid, 16%Palmitic acid, 7%Stearic acid, 4%Unsaponifiables, 1%
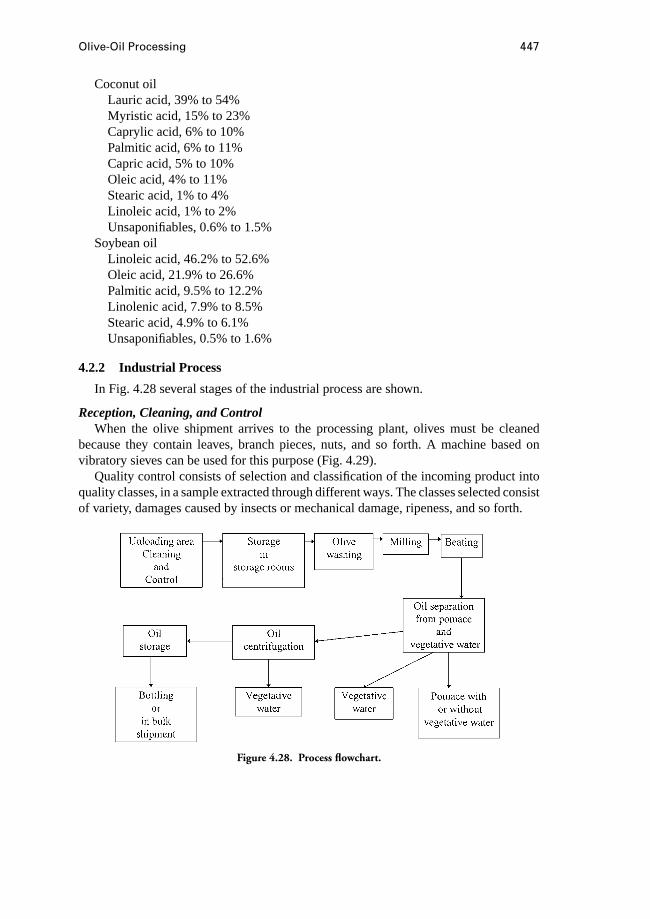
Olive-Oil Processing 447
Coconut oilLauric acid, 39% to 54%Myristic acid, 15% to 23%Caprylic acid, 6% to 10%Palmitic acid, 6% to 11%Capric acid, 5% to 10%Oleic acid, 4% to 11%Stearic acid, 1% to 4%Linoleic acid, 1% to 2%Unsaponifiables, 0.6% to 1.5%
Soybean oilLinoleic acid, 46.2% to 52.6%Oleic acid, 21.9% to 26.6%Palmitic acid, 9.5% to 12.2%Linolenic acid, 7.9% to 8.5%Stearic acid, 4.9% to 6.1%Unsaponifiables, 0.5% to 1.6%
4.2.2 Industrial Process
In Fig. 4.28 several stages of the industrial process are shown.
Reception, Cleaning, and ControlWhen the olive shipment arrives to the processing plant, olives must be cleaned
because they contain leaves, branch pieces, nuts, and so forth. A machine based onvibratory sieves can be used for this purpose (Fig. 4.29).
Quality control consists of selection and classification of the incoming product intoquality classes, in a sample extracted through different ways. The classes selected consistof variety, damages caused by insects or mechanical damage, ripeness, and so forth.
Figure 4.28. Process flowchart.

448 Grapes, Olives, and Coffee
Figure 4.29. Hural cleaner.
Each load has to be controlled by weighing it in a hopper scale. The hopper with acapacity for 1 or 2 tons is fixed on a platform that transmits the measured weight to thecontrol post at the entrance of the processing plant.
Olives are carried from the initial hopper to cleaning and control by rubber conveyorbelts with a suitable slope and length (Fig. 4.30).
Storage ContainersWhen the olives leave the hopper scale, they are carried by a conveyor belt to the
storage containers (Fig. 4.31). In the new industries, storage containers are large hoppersmade of steel sheets with enough capacity for the volume that the industry can process in2 or 3 days. In this way the production does not stop when olive shipments do not arrivedue to bad weather or other reasons. That is also a reason why during the oil-productionseason industries work 24 hours without interruption.
Olive WashingRecently harvested olives carry soil, mud, and other residues. Therefore they must be
washed before their elaboration.Olives are washed twice, first with water when olives are in the hopper of the washing
machine (Fig. 4.32), and second with a water bath. Finally, olives leave the machine ona wire-mesh conveyor to remove the water.
MillingMilling is done using a hammer mill (Fig. 4.33). The olives, after leaving the washing
machine, come into the milling chamber, where the hammers spin at high speed. Ham-mers throw the olives onto the perforated steel shell. Paste passing through the shell isdragged out by blades to ease the exit of the paste across the openings.
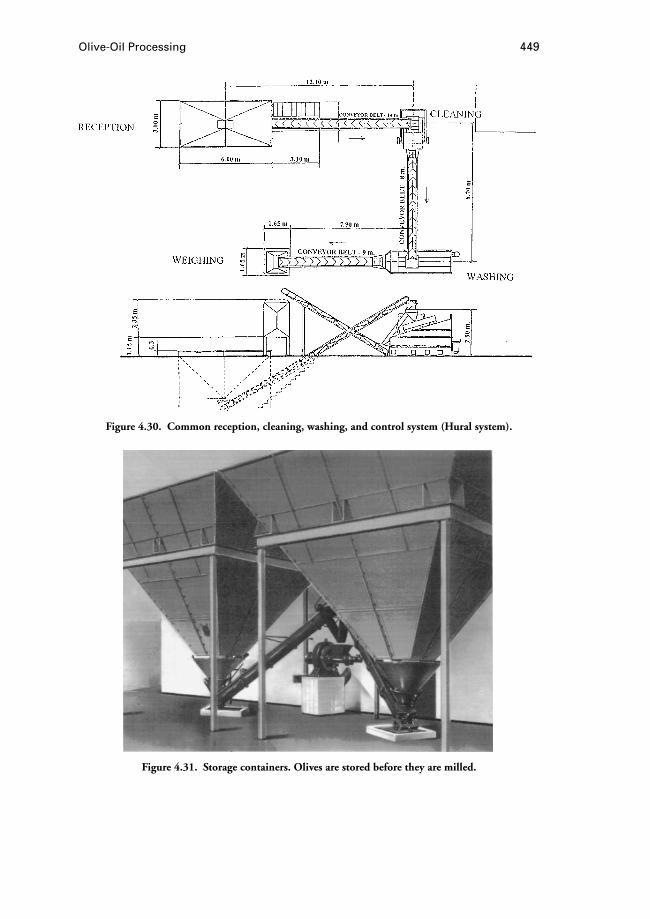
Olive-Oil Processing 449
Figure 4.30. Common reception, cleaning, washing, and control system (Hural system).
Figure 4.31. Storage containers. Olives are stored before they are milled.

450 Grapes, Olives, and Coffee
Figure 4.32. Pieralist olive washing machine.
Figure 4.33. Olive mill. This machine crushes the olives using blades with hammers.
The old “rulos” mills or stone rollers have been replaced by the hammer mills. Nowa-days few industries still use the first ones.
Heat BeatingVegetable fat must be reduced to facilitate the grouping of the oil drops and to enhance
the removal of the oil from the rest of the paste. Vertical and horizontal beaters are used(Figs. 4.34 and 4.35). Vertical beaters have a cylindrical shape with two concentric shells.Between these two shells hot water flows to heat the paste. Heat convection is increasedby small spinning shovels.
Horizontal beaters have a semicylindrical cross-section. They have also double-shelland spinning shovels to heat the paste. Two or three of these beaters can be placed in“cascade” to improve the yield.
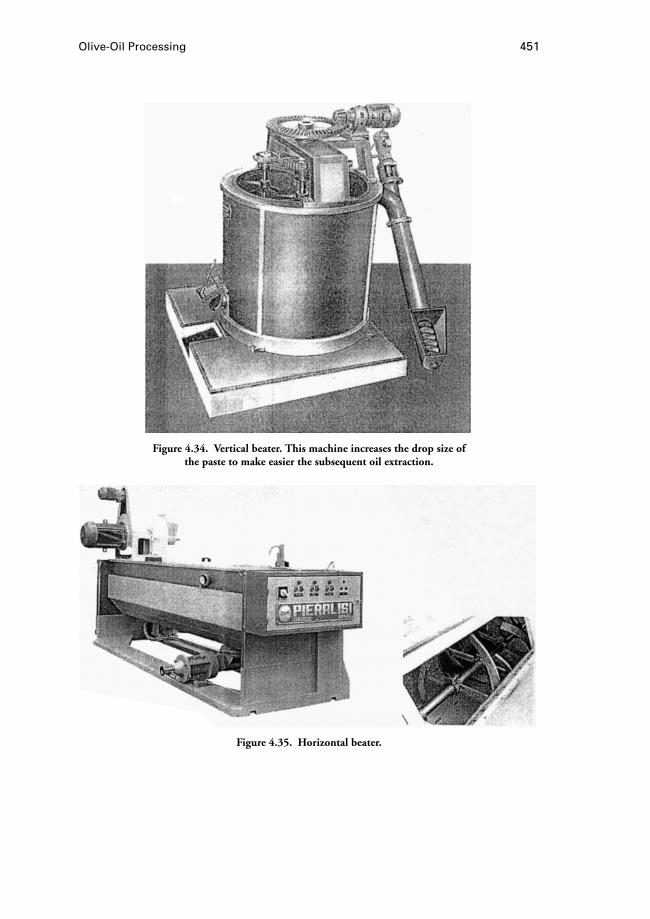
Olive-Oil Processing 451
Figure 4.34. Vertical beater. This machine increases the drop size ofthe paste to make easier the subsequent oil extraction.
Figure 4.35. Horizontal beater.
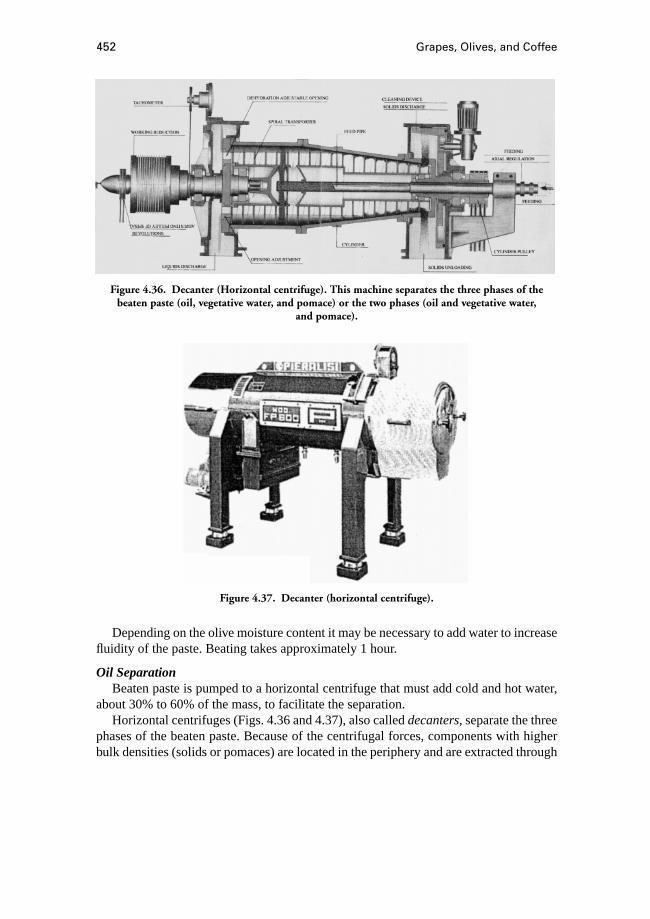
452 Grapes, Olives, and Coffee
Figure 4.36. Decanter (Horizontal centrifuge). This machine separates the three phases of thebeaten paste (oil, vegetative water, and pomace) or the two phases (oil and vegetative water,
and pomace).
Figure 4.37. Decanter (horizontal centrifuge).
Depending on the olive moisture content it may be necessary to add water to increasefluidity of the paste. Beating takes approximately 1 hour.
Oil SeparationBeaten paste is pumped to a horizontal centrifuge that must add cold and hot water,
about 30% to 60% of the mass, to facilitate the separation.Horizontal centrifuges (Figs. 4.36 and 4.37), also calleddecanters, separate the three
phases of the beaten paste. Because of the centrifugal forces, components with higherbulk densities (solids or pomaces) are located in the periphery and are extracted through
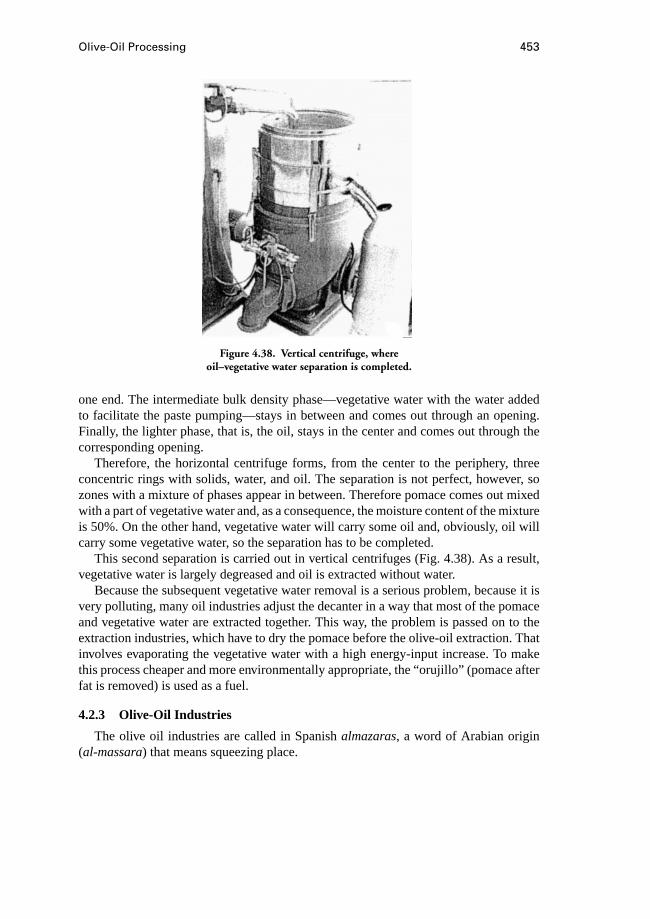
Olive-Oil Processing 453
Figure 4.38. Vertical centrifuge, whereoil–vegetative water separation is completed.
one end. The intermediate bulk density phase—vegetative water with the water addedto facilitate the paste pumping—stays in between and comes out through an opening.Finally, the lighter phase, that is, the oil, stays in the center and comes out through thecorresponding opening.
Therefore, the horizontal centrifuge forms, from the center to the periphery, threeconcentric rings with solids, water, and oil. The separation is not perfect, however, sozones with a mixture of phases appear in between. Therefore pomace comes out mixedwith a part of vegetative water and, as a consequence, the moisture content of the mixtureis 50%. On the other hand, vegetative water will carry some oil and, obviously, oil willcarry some vegetative water, so the separation has to be completed.
This second separation is carried out in vertical centrifuges (Fig. 4.38). As a result,vegetative water is largely degreased and oil is extracted without water.
Because the subsequent vegetative water removal is a serious problem, because it isvery polluting, many oil industries adjust the decanter in a way that most of the pomaceand vegetative water are extracted together. This way, the problem is passed on to theextraction industries, which have to dry the pomace before the olive-oil extraction. Thatinvolves evaporating the vegetative water with a high energy-input increase. To makethis process cheaper and more environmentally appropriate, the “orujillo” (pomace afterfat is removed) is used as a fuel.
4.2.3 Olive-Oil Industries
The olive oil industries are called in Spanishalmazaras, a word of Arabian origin(al-massara) that means squeezing place.
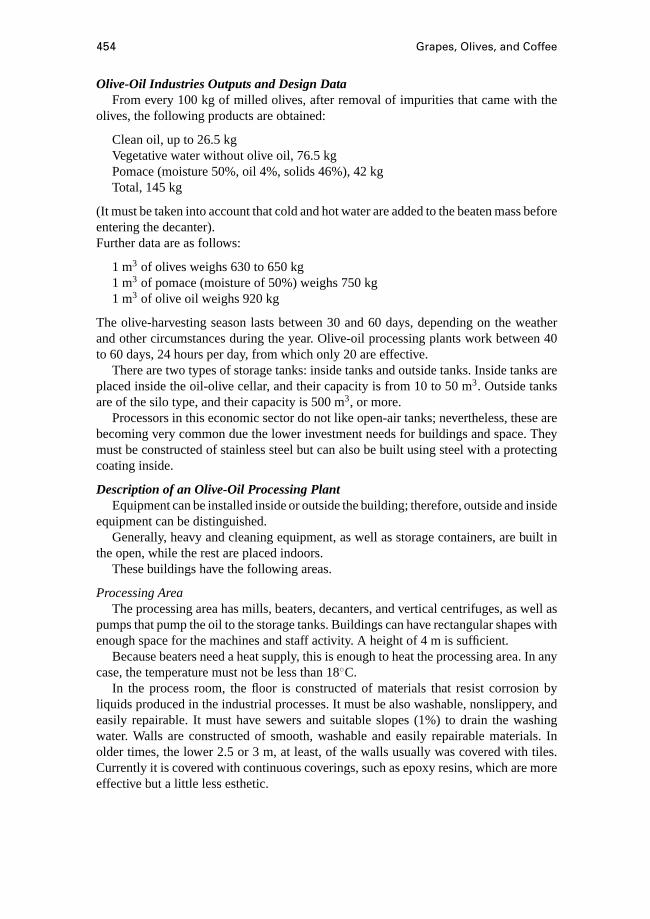
454 Grapes, Olives, and Coffee
Olive-Oil Industries Outputs and Design DataFrom every 100 kg of milled olives, after removal of impurities that came with the
olives, the following products are obtained:
Clean oil, up to 26.5 kgVegetative water without olive oil, 76.5 kgPomace (moisture 50%, oil 4%, solids 46%), 42 kgTotal, 145 kg
(It must be taken into account that cold and hot water are added to the beaten mass beforeentering the decanter).Further data are as follows:
1 m3 of olives weighs 630 to 650 kg1 m3 of pomace (moisture of 50%) weighs 750 kg1 m3 of olive oil weighs 920 kg
The olive-harvesting season lasts between 30 and 60 days, depending on the weatherand other circumstances during the year. Olive-oil processing plants work between 40to 60 days, 24 hours per day, from which only 20 are effective.
There are two types of storage tanks: inside tanks and outside tanks. Inside tanks areplaced inside the oil-olive cellar, and their capacity is from 10 to 50 m3. Outside tanksare of the silo type, and their capacity is 500 m3, or more.
Processors in this economic sector do not like open-air tanks; nevertheless, these arebecoming very common due the lower investment needs for buildings and space. Theymust be constructed of stainless steel but can also be built using steel with a protectingcoating inside.
Description of an Olive-Oil Processing PlantEquipment can be installed inside or outside the building; therefore, outside and inside
equipment can be distinguished.Generally, heavy and cleaning equipment, as well as storage containers, are built in
the open, while the rest are placed indoors.These buildings have the following areas.
Processing AreaThe processing area has mills, beaters, decanters, and vertical centrifuges, as well as
pumps that pump the oil to the storage tanks. Buildings can have rectangular shapes withenough space for the machines and staff activity. A height of 4 m is sufficient.
Because beaters need a heat supply, this is enough to heat the processing area. In anycase, the temperature must not be less than 18◦C.
In the process room, the floor is constructed of materials that resist corrosion byliquids produced in the industrial processes. It must be also washable, nonslippery, andeasily repairable. It must have sewers and suitable slopes (1%) to drain the washingwater. Walls are constructed of smooth, washable and easily repairable materials. Inolder times, the lower 2.5 or 3 m, at least, of the walls usually was covered with tiles.Currently it is covered with continuous coverings, such as epoxy resins, which are moreeffective but a little less esthetic.
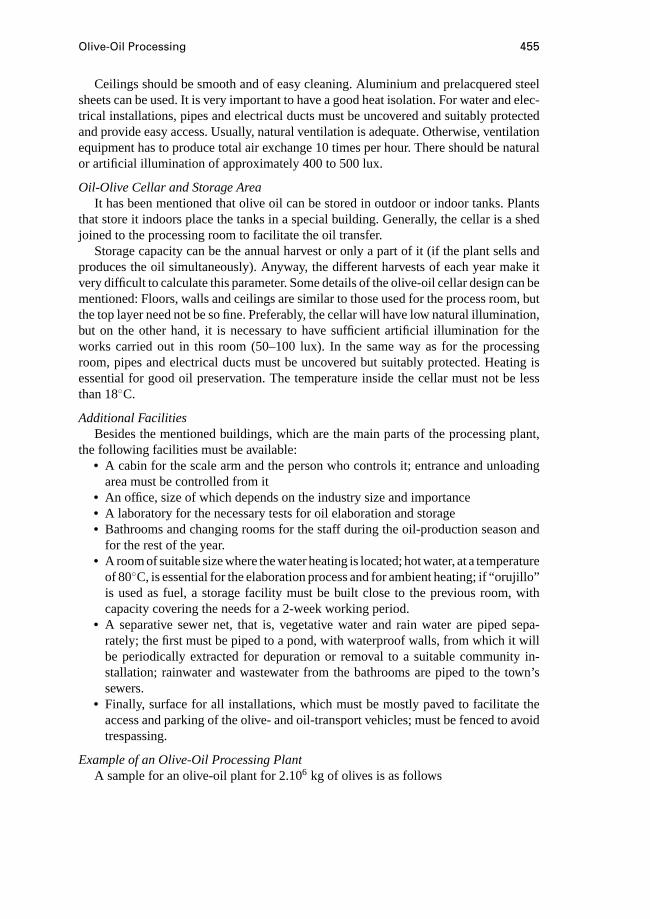
Olive-Oil Processing 455
Ceilings should be smooth and of easy cleaning. Aluminium and prelacquered steelsheets can be used. It is very important to have a good heat isolation. For water and elec-trical installations, pipes and electrical ducts must be uncovered and suitably protectedand provide easy access. Usually, natural ventilation is adequate. Otherwise, ventilationequipment has to produce total air exchange 10 times per hour. There should be naturalor artificial illumination of approximately 400 to 500 lux.
Oil-Olive Cellar and Storage AreaIt has been mentioned that olive oil can be stored in outdoor or indoor tanks. Plants
that store it indoors place the tanks in a special building. Generally, the cellar is a shedjoined to the processing room to facilitate the oil transfer.
Storage capacity can be the annual harvest or only a part of it (if the plant sells andproduces the oil simultaneously). Anyway, the different harvests of each year make itvery difficult to calculate this parameter. Some details of the olive-oil cellar design can bementioned: Floors, walls and ceilings are similar to those used for the process room, butthe top layer need not be so fine. Preferably, the cellar will have low natural illumination,but on the other hand, it is necessary to have sufficient artificial illumination for theworks carried out in this room (50–100 lux). In the same way as for the processingroom, pipes and electrical ducts must be uncovered but suitably protected. Heating isessential for good oil preservation. The temperature inside the cellar must not be lessthan 18◦C.
Additional FacilitiesBesides the mentioned buildings, which are the main parts of the processing plant,
the following facilities must be available:• A cabin for the scale arm and the person who controls it; entrance and unloading
area must be controlled from it• An office, size of which depends on the industry size and importance• A laboratory for the necessary tests for oil elaboration and storage• Bathrooms and changing rooms for the staff during the oil-production season and
for the rest of the year.• A room of suitable size where the water heating is located; hot water, at a temperature
of 80◦C, is essential for the elaboration process and for ambient heating; if “orujillo”is used as fuel, a storage facility must be built close to the previous room, withcapacity covering the needs for a 2-week working period.
• A separative sewer net, that is, vegetative water and rain water are piped sepa-rately; the first must be piped to a pond, with waterproof walls, from which it willbe periodically extracted for depuration or removal to a suitable community in-stallation; rainwater and wastewater from the bathrooms are piped to the town’ssewers.
• Finally, surface for all installations, which must be mostly paved to facilitate theaccess and parking of the olive- and oil-transport vehicles; must be fenced to avoidtrespassing.
Example of an Olive-Oil Processing PlantA sample for an olive-oil plant for 2.106 kg of olives is as follows

456 Grapes, Olives, and Coffee
i) Productions (three phases: oil, vegetative water and pomace):Oil - 2·106 × 0.265 (See 3.1)= 530,000 kgOil Bulk Density= 0.92 kg/lOil Volume= 530,000/0.92= 576,086 lVegetative water without olive oil= 2·106 × 0.765 (See 3.1)=1,530,000 kgPomace (moisture content of 50%)= 2·106 × 0.42 (See 3.1)= 840,000 kg
ii) Processing season length= 40 days.iii) Facilities:
Processing= 2·106 kg/40 days= 50,000 kg/dayMachinery performance (See 3.1)= 50,000 (kg/day)/20 (h/day)= 2,500 kg/hBoiler performance= 335,000 to 420,000 kJ/hEnergy requirements= 75 kWWater requirements= 50,000 (olives/day)× 0.002(m3/kg)= 100 m3/dayCellar tanks size= 50,000 l/unitNumber of cellar tanks= 576,086 (l)/50,000 (l/Units)= 12 tanks
iv) Investment for plot, access, fence, transformer, etc.Plot - 10,000 m2 × 5.2 ($/m2) = $52,000Access. . . . . . . . . . . . . . . . . = $25,800Transformer - 150 kVA . . . . = $38,700Other Investments- . . . . . . . = $13,000
Total . . . . . . . . . . . . . . = $129,500v) Investments for the reception area:
Buildings and facilities (plumbing, wiring, sewers, etc.)250 (m2) × 387 ($/m2) . . . . . = $96,750Machinery (cleaning, washing, weighting, transport andstorage). . . . . . . . . . . . . . . . .= $193,548
Total . . . . . . . . . . . . . . = $290,298Workforce= 2 shifts× 2 workers= 4 workers
vi) Investments for the processing area:Building and facilities (plumbing, wiring, sewers, etc.)300 (m2) × 645 ($/m2) . . . . . = $193,500Processing machinery. . . . . = $322,600
Total . . . . . . . . . . . . . . = $516,100Workforce= 3 shifts× 2 workers= 6 workers
vii) Investments for the storage area:Building and facilities (plumbing, wiring, sewers, etc.)240 (m2) × 323 ($/m2) . . . . . = $77,520Stainless steel tanks (50,000 l/unit) -12 (tanks)× 4830 ($/unit) . . .= $58,068
Total . . . . . . . . . . . . . . . = $135,588Workforce= 1 shift× 1 worker= 1 worker
viii) Investments for the “By product” area:Building and facilities (plumbing, wiring, sewers, etc.)150 (m2) × 258 ($/m2) . . . . . = $38,700Workforce= 0

Coffee Drying 457
ix) Investments for laboratory and offices:Building and facilities (plumbing, wiring, sewers, etc.)100 (m2) × 516 ($/m2) . . . . . .= $51,600Workforce= 1 shift× 3 employees= 3 employees
x) Investments Summary:Plot, access, fence, transformer= $129,500Reception area. . . . . . . . . . . . . .= $290,298Processing area. . . . . . . . . . . . .= $516,100Storage area.. . . . . . . . . . . . . . .= $135,588By products area. . . . . . . . . . . = $38,700Laboratory, offices. . . . . . . . . . = $51,600
Total . . . . . . . . . . . . . . . . = $1,161,786xi) Workforce Summary:
Plot, access, fence, transformer= 0Reception area. . . . . . . . . . . . . .= 4 WorkersProcessing area. . . . . . . . . . . . .= 6 WorkersStorage area.. . . . . . . . . . . . . . .= 1 WorkerBy products area. . . . . . . . . . . = 0Laboratory, offices. . . . . . . . . . = 3 Employees
Therefore the workforce required is eleven workers during the processing season andthree employees all the year.
References
1. Civantos, L., R. Contreras, and R. Grana. 1992. Obtenci´on del aceite de oliva virgen[Virgin olive oil extraction]. Madrid: Ed. Agr´ıcola Espa˜nola.
2. FUENTES CARDONA S. A. Ubeda - Jaen (Spain)3. HURAL S. A. (Spain)4. PIERALISI, S. A. Zaragoza (Spain)5. Garc´ıa-Vaquero, E., and F. Ayuga, 1993. Dise˜no y construcci´on de industrias agroal-
imentarias (Agrofood industries design and construction) Ed. Mundi Prensa S. A.pp. 438 Madrid .
4.3 Coffee DryingPedro Amorim Berbert and Juarez de Sousa e Silva
Coffee is a unique agricultural commodity. Because of the many successive layersenclosing the seed, its drying characteristics are different from those of other agriculturalproducts such as cereals and oilseeds. The outermost layer of a ripe coffee cherry is athin pericarp or skin, which covers the pulp or fibrous fruit flesh. Next there is a layer ofmucilage, approximately 0.8-mm thick, which is translucent and colorless. The mucilagehas no definite cellular structure and resembles an amorphous gel. Then, there is a thinyellowish parchment layer or endocarp and, finally, a silver skin covering the green coffeeseed [1]. Thus, the processes involving heat and mass transfer are different in coffee in
458 Grapes, Olives, and Coffee
the whole-fruit form than in other crops like wheat, soybeans, and maize, which haveremarkably different seed structures.
4.3.1 Natural Coffee
The factors that must be taken into account when deciding the method that shall beused to harvest and dry coffee are determined mainly by economics, climate, and rainfalldistribution. In large areas of Brazil, a long dry and warm period usually coincides withthe harvest season. This induces a very rapid passage from the ripe to the partially drystage, thus making it impossible to harvest a large portion as fresh ripe fruit. Cherriesthat are overripe and dried to the point of 45% (w.b.) moisture content or less cannot bepulped because the skin is hard. Consequently, it is necessary under these conditions todry the cherries as whole fruits, producing what is referred to asnaturalcoffee [2].
4.3.2 Washed Coffee
The drying of washed coffee is another drying method that should be consideredby producers who are contemplating opportunities to deliver a high-quality productto coffee processors. To prepare washed coffee, strip-picked cherries in various stagesof ripeness are subjected to water flotation to separate ripe cherries, which sink, fromgreen and partially dried fruits, which float. Next, the ripe-fruit portion is squeezed ina pulping machine, which removes most of the skin and pulp leaving a slippery layerof mucilage. Because this cannot be readily dispersed in water, it is removed by naturalfermentation or fermentation with added enzymes. The product is calledwashedcoffeebecause the dispersible fermented mucilage finally is removed by washing with water.After draining off the excess water, the coffee is dried to about 13% (w.b.) moisture eitherin high-temperature mechanical or fixed-bed dryers or under the sun on paved dryingterraces. Carefully prepared and handled washed coffee is generally clean in flavor andfree from undesirable elements, but it lacks in body or full-flavored richness comparedwith well-prepared natural coffee [1].
4.3.3 Pulped Coffee
Somewhat different from the method of preparing washed coffee is the processingmethod used to obtainpulpedcoffee. In this method, both pulping and partial removal ofmucilage are accomplished in a single operation, and the coffee subsequently is spreadon sun-drying terraces. The incomplete removal of mucilage increases the difficulty ofdrying for the first day or two because the seeds become very sticky and viscous, renderingthe coffee hard to handle; then, if favorable weather prevails, the surface becomes dryand the coffee may be handled in the usual way thereafter [1].
4.3.4 Coffee Quality
Good control of coffee quality is related to the time it has been exposed to hightemperatures during drying. As an approximate guide, coffee will tolerate temperaturesof 40◦C for a day or two, 50◦C for a few hours, and 60◦C for less than an hour withoutdamage. If these temperature–time limits are exceeded, damage to coffee quality may
Coffee Drying 459
be expected because overheating during drying produces sour or cooked flavors in thebrewed coffee [2]. Nonetheless, Castro [3] observed that, compared with the sun-dryingprocedure, the quality of the brew was not impaired when natural and washed coffeewere dried at 80◦C in a 0.5-m–deep fixed-bed dryer with a 3-hour stirring interval andan airflow rate of 12 m3·min−1·m−2.
Final moisture-content uniformity is one of the most important parameters definingcoffee quality. In cases in which drying is carried too far in order to achieve the set finalmean moisture content, bean moistures lower than 10% (w.b.) can result with markedloss in coffee quality. Upon storage, even if coffee beans reestablish their equilibriummoisture with the ambient air, the harm done to the coffee quality will not be corrected [2].
4.3.5 Coffee-Drying Methods
Due to their high moisture content at harvest, 60% to 70% (w.b.), ripe coffee cherriesdo not flow easily in handling equipment (gravity spouts, hoppers, bucket elevators,augers) and conventional mechanical dryers. Drum-type rotary dryers are an alternative,but they generally are criticized for having low efficiency. As a result of this, the typicalcoffee-drying process in Brazil consists of two different drying stages. In the first stage,freshly harvested whole coffee cherries are spread on paved terraces, where they areallowed to dry under the sun until they reach 35% to 30% moisture (w.b.), in the secondstage the coffee is dried in high-temperature mechanical or fixed-bed dryers down toabout 13% (w.b.) If the climate is such that dependable sunshine is available during theharvest season, the drying process may be conducted entirely in open air. In this case,the cherries are spread out on the drying terrace after harvesting and dried to about 13%(w.b.) in a single operation. Another alternative is the complete drying of whole coffeecherries in fixed-bed dryers. The principal drawbacks in utilizing mechanical dryers havebeen the fact that they are designed to dry other products than coffee, and their relativehigh cost. Despite the recent efforts to change this situation most of the commerciallyavailable dryers still are inefficient and thus far have been used mainly in large-scaleoperations.
Some innovative grain-drying methods generally applied to cereals and oilseeds havebeen introduced in coffee-drying facilities in the past few years in an effort to increasethe drying capacity and the energy efficiency of conventional coffee-drying installa-tions, and at the same time to maintain coffee quality. These methods include dryer-ation, reversed-direction airflow drying, and combination drying. Several other high-temperature, continuous-flow drying systems that traditionally have been used in eitherthe United States or Europe to dry cereal grains to safe moisture levels for long storageperiods have been adapted to dry natural, washed, and pulped coffee. These methodsinclude cross-flow, concurrent-flow, counterflow, and mixed-flow drying.
Sun DryingFreshly harvested natural coffee generally has a wide range of moisture contents
(70%–25% [w.b.]). On arrival at the drying facility the coffee is subjected to waterflotation to separate soft ripe cherries from green and partially dried hard cherries.These two groups are spread out in separate parts on the drying terrace using hand
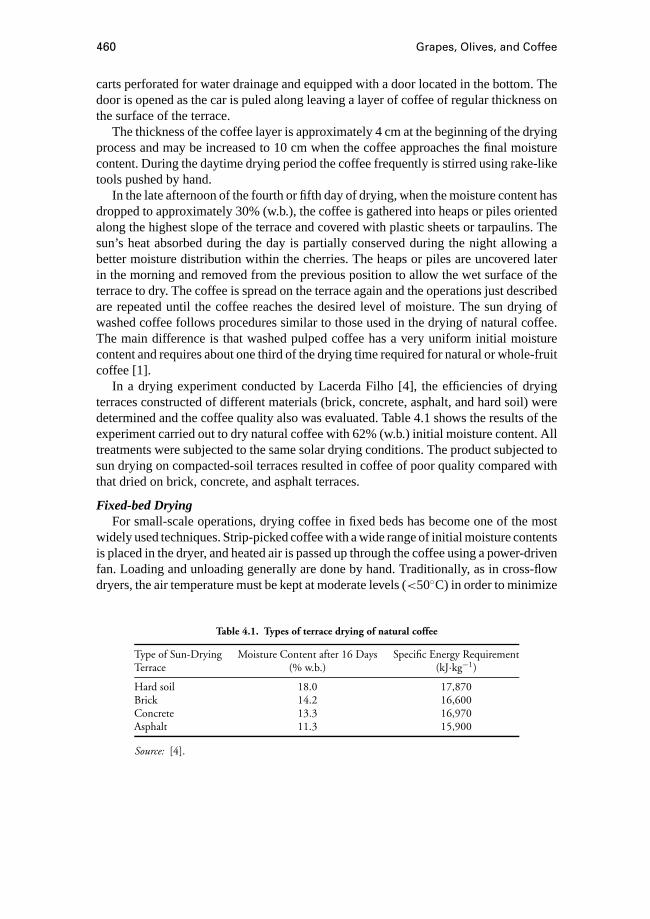
460 Grapes, Olives, and Coffee
carts perforated for water drainage and equipped with a door located in the bottom. Thedoor is opened as the car is puled along leaving a layer of coffee of regular thickness onthe surface of the terrace.
The thickness of the coffee layer is approximately 4 cm at the beginning of the dryingprocess and may be increased to 10 cm when the coffee approaches the final moisturecontent. During the daytime drying period the coffee frequently is stirred using rake-liketools pushed by hand.
In the late afternoon of the fourth or fifth day of drying, when the moisture content hasdropped to approximately 30% (w.b.), the coffee is gathered into heaps or piles orientedalong the highest slope of the terrace and covered with plastic sheets or tarpaulins. Thesun’s heat absorbed during the day is partially conserved during the night allowing abetter moisture distribution within the cherries. The heaps or piles are uncovered laterin the morning and removed from the previous position to allow the wet surface of theterrace to dry. The coffee is spread on the terrace again and the operations just describedare repeated until the coffee reaches the desired level of moisture. The sun drying ofwashed coffee follows procedures similar to those used in the drying of natural coffee.The main difference is that washed pulped coffee has a very uniform initial moisturecontent and requires about one third of the drying time required for natural or whole-fruitcoffee [1].
In a drying experiment conducted by Lacerda Filho [4], the efficiencies of dryingterraces constructed of different materials (brick, concrete, asphalt, and hard soil) weredetermined and the coffee quality also was evaluated. Table 4.1 shows the results of theexperiment carried out to dry natural coffee with 62% (w.b.) initial moisture content. Alltreatments were subjected to the same solar drying conditions. The product subjected tosun drying on compacted-soil terraces resulted in coffee of poor quality compared withthat dried on brick, concrete, and asphalt terraces.
Fixed-bed DryingFor small-scale operations, drying coffee in fixed beds has become one of the most
widely used techniques. Strip-picked coffee with a wide range of initial moisture contentsis placed in the dryer, and heated air is passed up through the coffee using a power-drivenfan. Loading and unloading generally are done by hand. Traditionally, as in cross-flowdryers, the air temperature must be kept at moderate levels (<50◦C) in order to minimize
Table 4.1. Types of terrace drying of natural coffee
Type of Sun-Drying Moisture Content after 16 Days Specific Energy RequirementTerrace (% w.b.) (kJ·kg−1)
Hard soil 18.0 17,870Brick 14.2 16,600Concrete 13.3 16,970Asphalt 11.3 15,900
Source: [4].
Coffee Drying 461
overdrying in those layers close to the input-air side of the dryer. Generally, the dryingis halted when the average moisture content of the whole bed has reached the requiredlevel for safe storage. At this time, the grain close to the exhaust air side of the dryer stillis underdried [5].
Even though exposing the operator to harsh conditions of air temperature and hu-midity, stirring the coffee manually is still a common practice adopted to break up thedrying zone and obtain a more uniformly dried product. So far very little research oncoffee-stirring devices has been done to determine the extent of mechanical damage tothe product. However, the introduction of stirring augers increases both the fixed andoperating costs of the dryer.
Silva and Lacerda Filho [6] designed and built a fixed-bed dryer to dry natural,washed, and pulped coffee. The dryer has been widely adopted by small- and medium-scale farmers and has been used to dry other agricultural products such as beans andcorn. The dryer is 5.0 m in diameter and is comprised of a 0.6 m–high plenum chamberand drying section resulting in a total height of 1.2 m. The walls consist of one bricklayer 0.15 m thick covered with plastering on both surfaces. Production of heat takesplace in one stage in a downdraft direct-combustion furnace using wood or coal as a fuelsource. The inside of the furnace is lined with insulating firebricks, and a paste of sand,molasses, and soil is plastered on to the exposed surfaces of the furnace wall.
The system is equipped with a cyclone chamber in which the ash is trapped and naturalair is blended with the flue gases to obtain the proper drying air temperature. The cyclonechamber is made of brick and consists of a cylinder having height and diameter of 1.2and 1.0 m, respectively. The blended gases are drawn through the same backward-curvedcentrifugal fan used to force air through the bed of coffee.
Drying runs have consistently shown that the fixed-bed dryer is capable of reducingthe moisture content of a 0.4 m–high layer of natural coffee from 60% to 12% (w.b.)in 32 hours, provided the drying air temperature is kept at 55◦C and the coffee bed isstirred in intervals of 2 hours.
The amount of energy (6630 kJ·kg−1) consumed during the drying of a 0.5m–deep natural-coffee bed is approximately 65% higher than the amount consumedduring the drying of washed coffee [3]. These values were obtained for coffee origi-nally at 52% (w.b.) and subsequently dried to about 14% (w.b.) with an airflow rate of12 m3·min−1·m−2, drying-air temperature of 60◦C, and a stirring interval of 3 hours.Dryer output increases from 9.8 (natural coffee) to 18.7 kg·h−1 ·m−2 (washed coffee)for those same drying conditions.
Counterflow DryingSilva [7] described the performance of an intermittent single-stage counterflow dryer
used in drying natural coffee from 30% down to 12% moisture. Table 4.2 summarizes theperformance evaluation of the dryer using an airflow rate of 18.5 m3 · min−1·m−2 anddrying air temperatures of 60, 80, and 100◦C. Notwithstanding the use of considerablyhigher drying-air temperatures compared with those normally used in conventional fixed-bed dryers, no quality deterioration was observed in the coffee after drying and roasting.
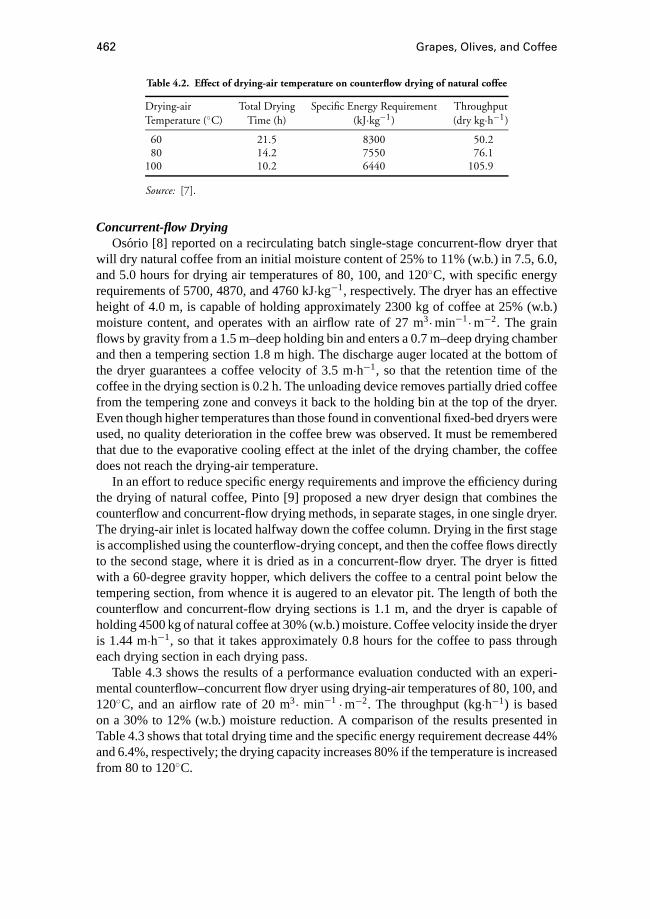
462 Grapes, Olives, and Coffee
Table 4.2. Effect of drying-air temperature on counterflow drying of natural coffee
Drying-air Total Drying Specific Energy Requirement ThroughputTemperature (◦C) Time (h) (kJ·kg−1) (dry kg·h−1)
60 21.5 8300 50.280 14.2 7550 76.1
100 10.2 6440 105.9
Source: [7].
Concurrent-flow DryingOsorio [8] reported on a recirculating batch single-stage concurrent-flow dryer that
will dry natural coffee from an initial moisture content of 25% to 11% (w.b.) in 7.5, 6.0,and 5.0 hours for drying air temperatures of 80, 100, and 120◦C, with specific energyrequirements of 5700, 4870, and 4760 kJ·kg−1, respectively. The dryer has an effectiveheight of 4.0 m, is capable of holding approximately 2300 kg of coffee at 25% (w.b.)moisture content, and operates with an airflow rate of 27 m3·min−1·m−2. The grainflows by gravity from a 1.5 m–deep holding bin and enters a 0.7 m–deep drying chamberand then a tempering section 1.8 m high. The discharge auger located at the bottom ofthe dryer guarantees a coffee velocity of 3.5 m·h−1, so that the retention time of thecoffee in the drying section is 0.2 h. The unloading device removes partially dried coffeefrom the tempering zone and conveys it back to the holding bin at the top of the dryer.Even though higher temperatures than those found in conventional fixed-bed dryers wereused, no quality deterioration in the coffee brew was observed. It must be rememberedthat due to the evaporative cooling effect at the inlet of the drying chamber, the coffeedoes not reach the drying-air temperature.
In an effort to reduce specific energy requirements and improve the efficiency duringthe drying of natural coffee, Pinto [9] proposed a new dryer design that combines thecounterflow and concurrent-flow drying methods, in separate stages, in one single dryer.The drying-air inlet is located halfway down the coffee column. Drying in the first stageis accomplished using the counterflow-drying concept, and then the coffee flows directlyto the second stage, where it is dried as in a concurrent-flow dryer. The dryer is fittedwith a 60-degree gravity hopper, which delivers the coffee to a central point below thetempering section, from whence it is augered to an elevator pit. The length of both thecounterflow and concurrent-flow drying sections is 1.1 m, and the dryer is capable ofholding 4500 kg of natural coffee at 30% (w.b.) moisture. Coffee velocity inside the dryeris 1.44 m·h−1, so that it takes approximately 0.8 hours for the coffee to pass througheach drying section in each drying pass.
Table 4.3 shows the results of a performance evaluation conducted with an experi-mental counterflow–concurrent flow dryer using drying-air temperatures of 80, 100, and120◦C, and an airflow rate of 20 m3· min−1 ·m−2. The throughput (kg·h−1) is basedon a 30% to 12% (w.b.) moisture reduction. A comparison of the results presented inTable 4.3 shows that total drying time and the specific energy requirement decrease 44%and 6.4%, respectively; the drying capacity increases 80% if the temperature is increasedfrom 80 to 120◦C.
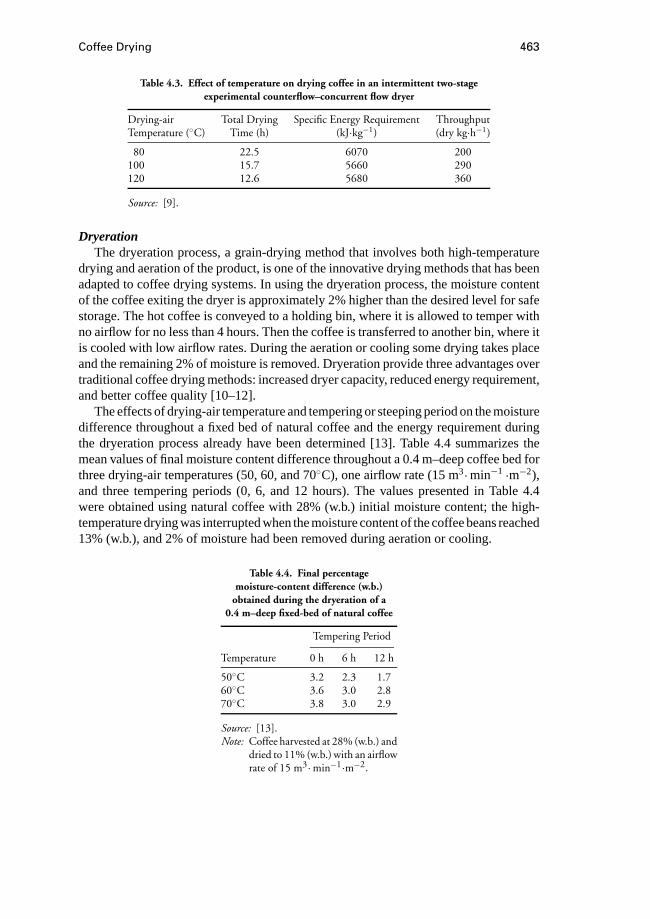
Coffee Drying 463
Table 4.3. Effect of temperature on drying coffee in an intermittent two-stageexperimental counterflow–concurrent flow dryer
Drying-air Total Drying Specific Energy Requirement ThroughputTemperature (◦C) Time (h) (kJ·kg−1) (dry kg·h−1)
80 22.5 6070 200100 15.7 5660 290120 12.6 5680 360
Source: [9].
DryerationThe dryeration process, a grain-drying method that involves both high-temperature
drying and aeration of the product, is one of the innovative drying methods that has beenadapted to coffee drying systems. In using the dryeration process, the moisture contentof the coffee exiting the dryer is approximately 2% higher than the desired level for safestorage. The hot coffee is conveyed to a holding bin, where it is allowed to temper withno airflow for no less than 4 hours. Then the coffee is transferred to another bin, where itis cooled with low airflow rates. During the aeration or cooling some drying takes placeand the remaining 2% of moisture is removed. Dryeration provide three advantages overtraditional coffee drying methods: increased dryer capacity, reduced energy requirement,and better coffee quality [10–12].
The effects of drying-air temperature and tempering or steeping period on the moisturedifference throughout a fixed bed of natural coffee and the energy requirement duringthe dryeration process already have been determined [13]. Table 4.4 summarizes themean values of final moisture content difference throughout a 0.4 m–deep coffee bed forthree drying-air temperatures (50, 60, and 70◦C), one airflow rate (15 m3·min−1 ·m−2),and three tempering periods (0, 6, and 12 hours). The values presented in Table 4.4were obtained using natural coffee with 28% (w.b.) initial moisture content; the high-temperature drying was interrupted when the moisture content of the coffee beans reached13% (w.b.), and 2% of moisture had been removed during aeration or cooling.
Table 4.4. Final percentagemoisture-content difference (w.b.)
obtained during the dryeration of a0.4 m–deep fixed-bed of natural coffee
Tempering Period
Temperature 0 h 6 h 12 h
50◦C 3.2 2.3 1.760◦C 3.6 3.0 2.870◦C 3.8 3.0 2.9
Source: [13].Note: Coffee harvested at 28% (w.b.) and
dried to 11% (w.b.) with an airflowrate of 15 m3·min−1·m−2.
464 Grapes, Olives, and Coffee
From the values presented in Table 4.4, it can be concluded that a drying-air tem-perature of 50◦C and 12 hours of tempering is the best dryeration treatment for naturalcoffee, for it results in a final moisture difference of 1.7%, almost 50% less than thedifference obtained with the conventional drying method.
It is appreciated that an airflow rate of 15 m3·min−1 ·m−2 significantly exceeds thevalues normally encountered in grain dryeration processes. However, coffee-storage binsgenerally are not equipped with perforated floors. Thus the aim is to use the fixed-beddryer as a tempering bin, so that the fixed costs are reduced by using the same fan forboth high-temperature drying and aeration.
Reversed-direction Air-Flow DryingReversing the airflow direction at regular intervals throughout the drying period of
coffee in a fixed bed is another method that has been proposed in an effort to achieveeven drying and, by minimizing the moisture difference throughout the bed depth, obtaina product of better final quality. Using this method the difference between the maximumand minimum moisture contents in the coffee can be greatly reduced as compared withthe conventional drying method. As a shortcoming, the drying efficiency is slightly lowerfor the reversed airflow dryer.
The concept of reversing airflow direction at regular intervals during drying of parch-ment coffee was introduced as early as 1952 by Fukunaga and Strohman, cited by Kinch[14], but no serious attempts were made then to analyze the influence of the several dry-ing parameters on final moisture-content difference and overall drying rate. It was onlyrecently that a comprehensive study of the reversed-direction airflow drying method hasbeen carried out and successfully applied to the drying of natural coffee [15].
Tables 4.5 and 4.6 summarize simulated performance evaluations of reversed-directionairflow drying versus conventional one-direction airflow drying for drying-air temper-atures of 50◦C and 70◦C, respectively. The mean ambient air temperature and relativehumidity used as input data for the simulation model were 15.8◦C and 82.0%, respec-tively. As for the product, the average conditions used as input data were 25% (w.b.)initial moisture content, 13% (w.b.) final moisture content, and 15.8◦C initial tempera-ture. Simulations were conducted using three reversing-time intervals, 3, 4, and 6 hours,and an airflow rate of 15 m3·min−1·m−2. This procedure aimed at analyzing the effect ofreversing-time interval, at each temperature, on the specific energy requirement and totaldrying time and identifying the set of conditions that would result in the most uniformmoisture-content profile throughout a 0.90 m–deep coffee bed. Comparative simulationswere performed using the conventional drying method. The uniformity index presentedin these tables is defined as the percentage of grain in the bed that contains moisturewithin the range 13%± 0.5% (w.b.).
The values shown in Tables 4.5 and 4.6 show that for the same drying tempera-ture, the specific energy requirement decreases with increasing reversing-time interval.Nonetheless, from an engineering point of view the increase in specific energy require-ment associated with the reversed-direction airflow drying method was considered to benegligible for all cases studied.

Coffee Drying 465
Table 4.5. Average drying parameters of the reversed-direction airflow drying methodversus the conventional one-direction airflow method at 50◦C
Reversed-direction Airflow
One-direction 3-h Reversal 4-h Reversal 6-h ReversalAirflow Interval Interval Interval
Specific energy 9150 9438 9360 9286requirement (kJ·kg−1)
Total drying time (h) 12.7 13.1 13.0 12.9Final moisture-content 3.1 0.9 1.2 1.0
difference (% w.b.)Uniformity index (%) 33 100 83 100
Source: [15].
Table 4.6. Average drying parameters of the reversed-direction airflow drying methodversus the conventional one-direction airflow method at 70◦C
Reversed-direction Airflow
One-direction 3-h Reversal 4-h Reversal 6-h ReversalAirflow Interval Interval Interval
Specific energy 7147 7408 7282 7166requirement (kJ·kg−1)
Total drying time (h) 6.2 6.5 6.4 6.3Final moisture content 5.4 1.8 2.5 5.2
difference (% w.b.)Uniformity index (%) 33 84 50 33
Source: [15].
From the experimental and simulated results obtained thus far it is evident that thereversed-direction airflow drying method is very effective in promoting a marked reduc-tion in the final moisture-content difference throughout the coffee bed as compared withthe conventional drying method. Reductions in final moisture-content difference rangingfrom 60% to 70% generally are observed by reversing the airflow direction for a drying-air temperature of 50◦C, as compared with the conventional drying method. For the lattermethod, increasing the temperature had no effect on the uniformity index. Nonetheless,the final moisture-content difference increased considerably as higher drying air temper-atures were used. For 70◦C, reversing the airflow direction every 3 hours resulted in ahigher uniformity index and a lower final moisture-content difference compared with theconventional drying method. Despite the reduction of 67% in the final moisture-contentdifference as compared with the conventional drying method, the nonuniformity of themoisture distribution still may jeopardize the quality of the product after roasting. If thebeans are not thoroughly mixed after drying or if they are not allowed to equalize theirmoisture content, beans with higher moisture content probably will not pyrolize, and theoverdried ones will scorch during roasting. The result will be an unpalatable product. For
466 Grapes, Olives, and Coffee
a drying air temperature of 70◦C, reversing the airflow every 6 hours has no significanteffect on the reduction of the final moisture difference, for the reversion occurs almostat the end of the drying period.
Lower drying air temperatures, up to 50◦C, are considered to be more suitable fordrying coffee in fixed beds by reversing the airflow direction either at 3- or 6-hourintervals. Periodic airflow reversal also prevents the build-up of harmful condensationin the top layers of the coffee bed.
In comparing this drying method with other techniques proposed to reduce the finalmoisture distribution throughout the bed, it is considered that reversing the airflow di-rection at regular intervals can be easily implemented in both cross-flow and fixed-bedcoffee dryers with minimum design changes and comparatively low additional costs.
Combination High-temperature Ambient-air DryingCombination drying is one of the latest concepts in coffee-drying technology. It is
the drying method in which both high-temperature processes and natural-air or low-temperature drying procedures are combined in an attempt to provide a high-qualityproduct as compared with using only high-temperature drying [11]. The high-temperaturedrying stage is used to reduce coffee moisture contents from approximately 60% to 25%(w.b.) or less, so that natural air drying can be used successfully to complement thedrying by further reducing the moisture content of the product to safe limits.
Unlike the dryeration process, in combination drying the hot coffee is transferreddirectly to the storage bin where the remaining moisture will be removed using ambientair or low temperature. In combination drying coffee is dried in the high-temperaturedryer to a moisture level ten to twelve percentage points above the value for a safestorage, with the result that the recommended minimum airflow rates for the aerationstage in combination drying are 15 to 25 times more than the maximum airflow rate usedin the cooling stage of the dryeration process [16].
Combination drying provides three advantages over typical high-temperature high-speed drying: increased drying capacity, reduced fuel requirement, and better coffeequality through reducing the final moisture difference throughout the coffee bed. Ascompared with the dryeration process, the main advantage of combination drying isthe elimination of the extra handling step associated with the tempering bin. The maindisadvantage of combination drying is the requirement of a relatively high level ofcapital investment and management in cases in which it is purchased as a unit becausetwo complete drying systems are included [11, 12, 17].
The usual procedure to dry natural coffee on the farm using the combination methodis as follows: Ripe cherries that have been strip-picked at moisture contents ranging from50% to 65% (w.b.) are separated from the rest by water flotation and screening and thendried in either two or three separate stages. Where three stages are used, the coffee isfirst dried on paved sun-drying terraces until it reaches approximately 35% (w.b.) Then,the partially dried fruits are conveyed to a high-temperature dryer, where their moisturecontent is further reduced to about 25% (w.b.) In the third stage the coffee is bin-dried toapproximately 13% (w.b.) moisture using natural air. In using two stages, the sun-dryingprocedure is eliminated and the moisture content at harvest is reduced to approximately
Coffee Drying 467
25% (w.b.) using the high-temperature dryer alone. Combination drying also is appliedto the drying of washed and pulped coffee, whereby the product is delivered directly tothe low-temperature drying bin after the sun-drying procedure or the high-temperaturedrying method.
The natural-air drying stage in combination drying has recommended airflow rates inthe (1:1 to 1:1/2) of the airflow range normally used in the high-temperature drying stage[12]. So airflow rates varying in the range from 7 to 15 m3 · min−1·m−2 generally areused. This is enough air to dry relatively wet coffee as a result of the drying capabilityof the natural air. The fan should be started as soon as the first lot of coffee is deliveredto the bin and switched off during periods of adverse drying weather or when the meanmoisture content of the coffee in the surface layer of the bed reaches the target moisturecontent. For natural-air drying systems, the total drying time depends on the initialmoisture content and climatic conditions.
Attempts to use high initial moisture content natural coffee in the low-temperaturestage of combination drying thus far have been unsuccessful [18]. For example, exper-imental drying runs have shown that due to high initial moisture contents, 27% to 30%(w.b.), excessive heating developed within the coffee bed after approximately 10 days offair weather conditions (0.0124 kg·kg−1 humidity ratio and temperature of 18◦C), andcareful inspections generally indicated invasion by fungi. In cases in which the dryingwas not interrupted it was observed that the ambient air was not generally cool enoughto serve as a deterrent to fungi development, and a strong musty odor generally devel-oped. The results obtained thus far suggest that drying high-moisture natural coffee inthe low-temperature stage of combination drying is a very hazardous procedure. How-ever, sufficient data are not yet available to condemn it as impossible. It can be reasonedthat better drying weather or the use of higher airflow rates might prove satisfactory inreducing the moisture content of relatively wet coffee to a level safe enough to preventfungi development, but the risks involved would still be high. Another alternative wouldbe the reduction of coffee-bed depth.
On the other hand, drying tests using high-moisture pulped coffee have been runsuccessfully [18]. It takes approximately 1050 hours to dry coffee initially at 37% (w.b.)to a mean moisture content of 13% (w.b.), a moisture extraction of 24 percentage points.The results obtained implies an average moisture extraction rate approximately fourtimes greater than that obtained with natural coffee, from which it can be seen thatthe low-temperature drying of pulped coffee is considerably more efficient than that ofnatural coffee.
Obtaining accurate knowledge of the temperature within the bed during natural-airdrying of relatively wet coffee is essential to identify hot spots and to avoid spoilagereaching an advanced stage in portions or in the whole bulk. Increases as high as 10◦Cabove ambient temperature have been observed within the coffee bed as a result of moldgrowth. When this happens, ambient-air temperature generally is below the temperaturewithin the coffee bed during the whole drying period, indicating high rates of respirationand that fungi are already present at the early stages of the process.
The mixing of different lots of coffee of markedly different moisture contents, a com-mon practice from the farm to the final product processor, should be avoided whenever

468 Grapes, Olives, and Coffee
possible. All tests carried out using mixed lots of coffee with different moisture contentsresulted in brews of poor cupping quality. It is believed that only when all coffee actuallyhas the same or similar moisture content prior to the mixing will it produce a brew withfull flavor development.
It is expected that one or a number of bad weather days will not adversely affectthe efficiency of low-temperature drying systems. Stopping the fan and waiting formore favorable weather fails to recognize that the first and foremost requirement inambient-air drying is to keep the grain cool and prevent heating [17]. However, it isa matter of common knowledge that keeping coffee at moisture contents over 15%(w.b.) for long periods of low-temperature drying or storage is unsafe because mold and,consequently, cup-quality deterioration may occur. But rewetting of dried coffee as aresult of continuous fan operation during periods of adverse weather is also a hazardousprocedure because the beans may become pale and bleached out in appearance, signifyingaroma and flavor deterioration. So unlimited fan operation during poor drying weatherconditions may be recommended as long as the moisture content of coffee is aboveapproximately 17% (w.b.)
In conclusion, combination drying of coffee offers a reliable alternative to farmerswho wish to deliver a high-quality product to coffee processors. However, its successdepends on good design, proper sizing and well-coordinated operation and manage-ment of the natural-air drying fan. Under appropriate weather conditions it is feasibleto dry natural coffee from approximately 25% down to 13% (w.b.) using an airflowrate of 8 m3·min−1·m−2 without providing significant supplemental heat to the dryingair. However, the drying of natural coffee with moisture contents above 26% (w.b.) isa very hazardous procedure and should not be recommended under poor weather con-ditions. On the other hand, studies [18] have shown that the natural-air drying stage isvery effective to dry pulped coffee fairly high in moisture (37% w.b.) to a safe storagelevel.
4.3.6 Coffee Storage
Green coffee in producing countries traditionally is stored in bags rather than in bulk.Pallet storage of bagged green coffee allows the segregation of lots, a very importantaspect considering that the product is priced according to cup flavor. Besides such con-siderations as accessibility to small lots, normal air circulation about the bags, easyinspection, and sampling are important factors to consider. Bagged coffee usually isstored in warehouses where 60-kg bags are piled, forming stacks, generally with littleor no control of the environmental conditions. In spite of this, it is possible to maintainthe product stored for relatively long periods (up to 5 years) without deterioration ascompared with cereals such as corn or wheat. Inside the warehouse, provision is madefor aisle space along walls for inspection and aisle space between stacks (3.8 m) formoving the product with forklift trucks. According to Sivetz and Foote [1] only twothirds to three quarters of the floor area is generally available for storage. The maindisadvantages of bagged storage of green coffee relate to the requirement of intensivelabor, the cost of bags, and difficulties associated with insect control. Discoloration ofthe product and reduction in bulk density are other problems related to the traditional
Coffee Drying 469
method of storing coffee in bags. Prices can suffer reductions of up to 40% accordingto the level of damage during storage. Finally, the following additional aspect should beconsidered during pallet storage of bagged coffee: The amount of light reaching the bagsmust be controlled carefully, for under a bright environment the beans may become paleand bleached out in appearance, signifying aroma and flavor deterioration.
Although not widespread in the producing countries, bulk storage of green coffee isa procedure that should be considered by producers or firms handling large quantitiesof relatively uniform beans. Bulking large quantities facilitates processing operationssuch as blending and roasting. Nowadays, bulk storage of green coffee is restricted toproducers who are able to deliver only less than a few hundred bags to coffee processorsand is usually carried out in wood frame constructions. Long-term storage requires botha forced-air circulation system to maintain grain equilibrium moisture content and atemperature monitoring system to detect hot spots before extensive damage occurs. Anobjection to in-bin bulk storage of green coffee is that accurate inventories are difficultto maintain as the level of beans is not even and the quantity assessed by visual estimatecan be quite a few bags in error [1]. Accurate inventories of the amout of product instorage are essential because coffee is considerably more expensive than cereal grains.The main advantage of bulk storage of green coffee is that the mechanization of theprocess allows a reduction of the labor required for handling the product as comparedwith the traditional method.
As stated previously, bulk storage of coffee is not a common practice in producingcountries. Indeed, information available in the literature on bulk storage of coffee is stillmeager. Jord˜ao et al. [19] compared the bulk storage of green coffee beans with thetraditional method, by which coffee is stored in bags. Average moisture content of greencoffee beans decreased from 10.4% to 9.6% (w.b.) after 5 years of storage in a metalbin equipped with a natural ventilation system, in an environment in which the averagetemperature and relative humidity were 24◦C and 70%, respectively. Moisture contentof the product, for the same environmental conditions, remained practically constantat 11% (w.b.) (pallet storage of bagged coffee) and 10% (w.b.) (bulk storage withoutventilation). The bulk density of the coffee stored in both ventilated and nonventilatedbins was reduced from 650 to 610 kg·m−3 during the 5-year period, whereas for theproduct stored in bags the level of reduction was more pronounced (from 650 to 540kg·m−3). Chemical analysis revealed that the green coffee suffered similar reactionsunder all three types of storage.
The color of the beans (bluish-green) did not alter during storage in bulk with naturalventilation. Nonetheless, some discoloration was observed in the beans stored in bags aswell as in bulk storage without ventilation. The critical evaluation of coffee aroma andtaste, that is, evaluation of cup quality orcupping, revealed that the three storage systemsare capable of producing coffee that can be classified ashard. This denotes an astringentflavor, one that causes puckering and a bitter impression. A hard coffee does not havethe full development of flavor and acidity characteristics of high-grown coffees but mayhave as much or more body. It has been concluded that it is feasible to store green coffeewith moisture contents in the range from 10% to 11% (w.b.) in bulk for periods up to 3years without quality loss.
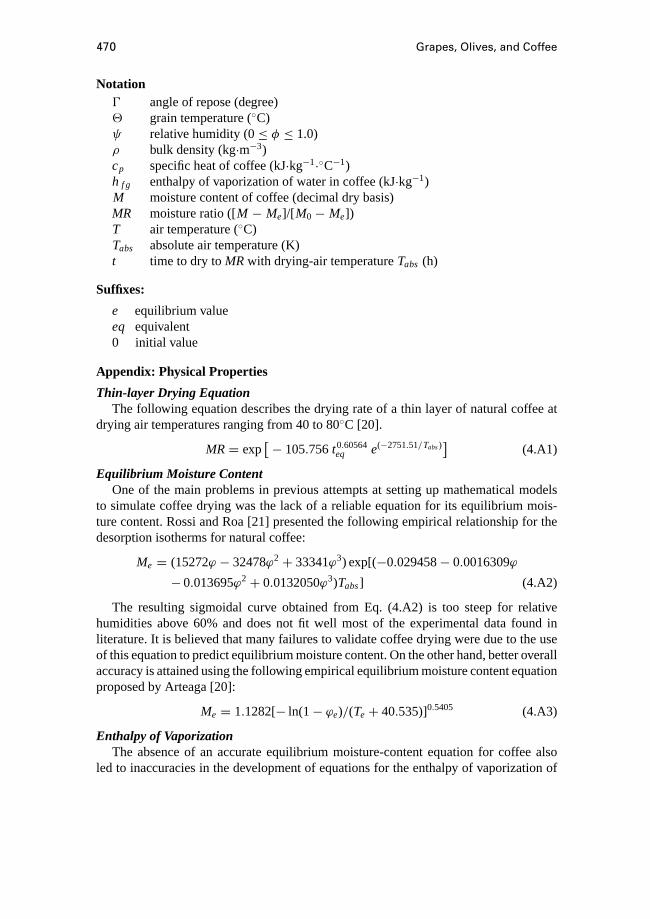
470 Grapes, Olives, and Coffee
Notation0 angle of repose (degree)2 grain temperature (◦C)ψ relative humidity (0≤ φ ≤ 1.0)ρ bulk density (kg·m−3)cp specific heat of coffee (kJ·kg−1·◦C−1)h f g enthalpy of vaporization of water in coffee (kJ·kg−1)M moisture content of coffee (decimal dry basis)MR moisture ratio ([M − Me]/[ M0− Me])T air temperature (◦C)Tabs absolute air temperature (K)t time to dry toMR with drying-air temperatureTabs (h)
Suffixes:
e equilibrium valueeq equivalent0 initial value
Appendix: Physical Properties
Thin-layer Drying EquationThe following equation describes the drying rate of a thin layer of natural coffee at
drying air temperatures ranging from 40 to 80◦C [20].
MR= exp[− 105.756t0.60564
eq e(−2751.51/Tabs)]
(4.A1)
Equilibrium Moisture ContentOne of the main problems in previous attempts at setting up mathematical models
to simulate coffee drying was the lack of a reliable equation for its equilibrium mois-ture content. Rossi and Roa [21] presented the following empirical relationship for thedesorption isotherms for natural coffee:
Me = (15272ϕ − 32478ϕ2+ 33341ϕ3) exp[(−0.029458− 0.0016309ϕ
−0.013695ϕ2+ 0.0132050ϕ3)Tabs] (4.A2)
The resulting sigmoidal curve obtained from Eq. (4.A2) is too steep for relativehumidities above 60% and does not fit well most of the experimental data found inliterature. It is believed that many failures to validate coffee drying were due to the useof this equation to predict equilibrium moisture content. On the other hand, better overallaccuracy is attained using the following empirical equilibrium moisture content equationproposed by Arteaga [20]:
Me = 1.1282[− ln(1− ϕe)/(Te+ 40.535)]0.5405 (4.A3)
Enthalpy of VaporizationThe absence of an accurate equilibrium moisture-content equation for coffee also
led to inaccuracies in the development of equations for the enthalpy of vaporization of

Coffee Drying 471
moisture in coffee beans. The following equation was developed by Berbert and Queiroz[22] and was based on the method of correlating vapor pressure and latent heat datapresented by Othmer [23]. It was developed using experimental data from Arteaga [20]in the 0.15 decimal d.b. to 0.25 decimal d.b. region.
h f g = (2501+ 1.7752)[1+ 1.872 exp(−20.601M)] (4.A4)
Specific HeatThe following equation developed by Villa and Roa [24] represents the specific heat
of coffee at constant pressure.
cp = 1.674+ 2.510[M/(1+ M)] (4.A5)
Bulk DensityThe effect of moisture content on bulk density of natural coffee is given by the
following equation developed by Silva [7]:
ρ = (396.48+ 224M)/(1+ M) (4.A6)
In a study conducted by Castro [3], the estimated bulk density of washed coffee as afunction of moisture content was defined as in the following equation:
ρ = 371.78+ 255.17M (4.A7)
Volume ReductionThe grain volume shrinkage generally is assumed to be negligible during simulation
studies of the drying processes. This is based on the assumption that the decrease inbed height is not substantial for most cereal grains in continuous-flow dryers [10]. How-ever, the assumption of negligible volume shrinkage for natural coffee during drying canimpose serious limitations in simulation accuracy. Kinch [14] reported a pronouncedreduction in the volume of parchment coffee during drying. Volume reduction of 24%was observed when drying from 55% to a final moisture content of 12% (w.b.). No correc-tion for bed-height variation due to volume reduction is applied to the coffee-simulationmodels because to date no really comprehensive study describing the phenomenon fornatural coffee has been undertaken.
Pressure DropGuimaraes [18] observed that the pressure drop in experimental drying tests run with
natural coffee was always smaller than 7.5 mm of water column per meter depth ofcoffee, whereas for pulped coffee this value was 10.0 mm H2O per meter depth. Directcomparison of these results with published data is rather difficult because of differencesin particle size, bed depth, porosity of the bed, and surface roughness. Also, the amountof reported data on the pressure drop through beds of coffee is meager. However, itis realized that a pressure drop of 7.5 mm of water column per meter depth of cleancoffee is smaller than those values normally found in practice where foreign materialwill occupy some of the free space between the cherries, hence apparently compactingthe bed and increasing the pressure drop. Afonso [25] made a series of measurementsof pressure drop through beds of coffee. For a bed depth of 1.75 m and an airflow rate

472 Grapes, Olives, and Coffee
of 10.0 m3·min−1·m−2, the pressure drops were 5.1 and 5.4 mm of water column permeter depth, for 23% and 14% (w.b.) moisture coffee, respectively.
Angle of ReposeThe angle of repose of pulped coffee, variety Catua´ı, containing 5% of foreign matter,
as a function of moisture content (0.12 d.b.≤ M ≤ 0.67 d.b.) at 20◦C is given by thefollowing equation (r 2 = 0.98):
0 = −31.72M2+ 39.30M + 36.06 (4.A8)
The equation for the angle of repose as a function of moisture content (0.11 d.b≤ M ≤ 0.42 d.b.) obtained for the same product but without the presence of foreignmatter is as follows (r 2 = 0.99):
0 = −96.66M2+ 70.65M + 28.54 (4.A9)
References
1. Sivetz, M., and H. E. Foote. 1963.Coffee Processing Technology, vol. I: Fruit—Green, Roast, and Soluble Coffee. Westport, CT: AVI Publishing.
2. Sivetz, M., and N. W. Desrosier. 1979.Coffee Technology. Westport, CT: AVI Pub-lishing.
3. Castro, L. H. 1991. Efeito do despolpamento, em secador de leito fixo sob altatemperatura, no consumo de energia e na qualidade do caf´e (Coffea arabicaL.)[Energy requirement during the drying of natural and washed coffee (Coffea arabicaL.) in a high-temperature fixed-bed dryer]. M.Sc. thesis, Universidade Federal deVi cosa, Brazil.
4. Lacerda Filho, A. F. 1986. Avalia¸cao de diferentes sistemas de secagem e suasinfluencias na qualidade do caf´e (Coffea arabicaL.) [Assessment of several differentdrying systems and their effect on coffee quality (Coffea arabicaL.)]. M.Sc. thesis,Universidade Federal de Vi¸cosa, Brazil.
5. Paulsen, M. R., and T. L. Thompson. 1973. Effects of reversing airflow in a crossflowgrain dryer.Transactions of the American Society of Agricultural Engineers16:541–544.
6. Silva, J. S., and Lacerda Filho, A. F. 1984. Constru¸cao de secador para produtosagrıcolas [Design and construction of a fixed bed dryer for agricultural products].Informe tecnico no. 41. Vi¸cosa, Brazil: Conselho de Extens˜ao da Universidade Fed-eral de Vicosa.
7. Silva, L. C. 1991. Desenvolvimento e avalia¸cao de um secador de caf´e (Coffea ara-bicaL.) intermitente de fluxos contra-correntes [Design and performance assessmentof an intermittent counterflow dryer for coffee (Coffea arabicaL.)]. M.Sc. thesis,Universidade Federal de Vi¸cosa, Brazil.
8. Osorio, A. G. S. 1982. Projeto e constru¸cao de um secador intermitente de fluxoconcorrente e sua avalia¸cao na secagem de caf´e [Design and construction of arecirculating-batch single-stage concurrent-flow dryer for natural coffee]. M.Sc.thesis, Universidade Federal de Vi¸cosa, Brazil.

Coffee Drying 473
9. Pinto, F. A. C. 1993. Projeto de um secador de fluxos contracorrentes/concorrentese analise de seu desempenho na secagem de caf´e (Coffea arabicaL.) [Design andperformance evaluation of a counterflow-concurrent flow dryer for natural coffee(Coffea arabicaL.)]. M.Sc. thesis, Universidade Federal de Vi¸cosa, Brazil.
10. Brooker, D. B., F. W. Bakker-Arkema, and C. W. Hall. 1974.Drying Cereal Grains.Westport, CT: AVI Publishing.
11. Loewer, O. J., T. C. Bridges, and R. A. Bucklin. 1994. On-farm drying and storagesystems. St. Joseph, MI: American Society of Agricultural Engineers.
12. Cloud, H. A., and R. V. Morey. 1980. Dryeration and in-storage cooling for corndrying. Agricultural Extension Service Report M-162. St. Paul, MN: University ofMinnesota.
13. Cordeiro, J. A. B. 1982. Influˆencia da temperatura e tempo de repouso na secagemde cafe (Coffea arabicaL.) em camada fixa [Influence of temperature and temper-ing time on the drying of coffee (Coffea arabicaL.) in fixed beds]. M.Sc. thesis,Universidade Federal de Vi¸cosa, Brazil.
14. Kinch, D. M. 1967. Design criteria for mechanical drying of coffee beans.Transac-tions of the American Society of Agricultural Engineers, 10:40–42.
15. Berbert, P. A. 1991. Secagem de caf´e (Coffea arabicaL.), em camada fixa, cominversao de sentido de fluxo de ar [Drying of coffee (Coffea arabicaL.) in afixed bed with airflow reversal]. M.Sc. thesis, Universidade Federal de Vi¸cosa,Brazil.
16. Navarro, S., and M. Calderon. 1982. Aeration of grain in subtropical climates. Agri-cultural Services Bulletin 52. Rome: FAO.
17. McKenzie, B. A. 1976. Operating grain dryers for capacity, fuel efficiency, and grainquality. West Lafayette, IN: Cooperative Extension Service, Purdue University.
18. Guimaraes, A. C. 1995. Secagem de caf´e (Coffea arabicaL.) combinando sistemasem altas e baixas temperaturas [Combination drying of coffee (Coffea arabicaL.).M.Sc. thesis, Universidade Federal de Vi¸cosa, Brazil.
19. Jordao, B. A., R. S. Garrutti, E. Angelucci, I. S. Tango, and Y. Tosello. 1969/1970. Ar-mazenamento de caf´e beneficiado a granel, em silo com ventila¸cao natural [Storageof green coffee in a bin with natural ventilation]. Campinas, Coletˆanea do Institutode Tecnologia de Alimentos 3:253–281.
20. Arteaga, M. S. 1986. Modelaci´on del proceso de secado [Modeling the drying pro-cess]. Seminario de secado solar, 2, 1986, Cusco, Peru, pp. 51–56. Lima: InstitutoGeneral de Investigaci´on.
21. Rossi, S. I., and G. Roa. 1980. Secagem e armazenamento de produtos agropecu´arioscom uso de energia solar e ar natural [Drying and storage of agricultural productsusing solar energy and air at ambient temperature]. Publica¸cao ACIESP no. 22.Secretaria da Ind´ustria, Com´ercio, Ciencia e Tecnologia. Academia de Ciˆencias doEstado de S˜ao Paulo, Brazil.
22. Berbert, P. A., and D. M. Queiroz. 1991. M´etodo para determina¸cao de uma equa¸caopara a entalpia de vaporiza¸cao daagua contida em gr˜aos de caf´e [A method todetermine an equation for the enthalpy of vaporization of moisture in coffee].En-genharia Rural2(1):1–17.

474 Grapes, Olives, and Coffee
23. Othmer, D. F. 1940. Correlating vapor pressure and latent heat data.Industrial andEngineering Chemistry32:841–856.
24. Villa, L. G., and G. Roa. 1978. Simula¸cao matem´atica de secagem de caf´e e ca-cau. [Mathematical simulation of the drying of coffee and cocoa beans]. Campinas,Departamento de Engenharia Agr´ıcola.
25. Afonso, A. D. L. 1994. Gradiente de press˜ao estatica em camadas de frutos de caf´e(Coffea arabicaL.) com diferentes teores de umidade [Static pressure drop in fixedbeds of coffee (Coffea arabicaL.) as affected by coffee moisture content]. M.Sc.thesis, Universidade Federal de Vi¸cosa, Brazil.
5 Effluent Treatment inAgroprocessing
P. Amirante, Co-Editor
5.1 Effluents in AgroprocessingP. Amirante
5.1.1 The Problem of Effluents
The protection of water from pollution is one of the aspects involved in the protectionand conservation of the environment in which we live [1]. This problem, therefore,should be considered not only in terms of the introduction of harmful substances intothe environment but also by means of analysis of human activity that can irreversiblymodify the habitat, particularly causing pollution and changes in the vital means for lifesubsistence on the earth, air, water, and soil [2].
Nature, generally, has always found the way to restore environmental equilibrium;however, the industrial civilization and the development of large urban areas have causedan increase and concentration of pollution sources. Moreover, technical progress usuallyhas resulted in an improvement in the standard of living that, added to population growth,has caused an increase in the waste to be disposed of [3].
Water-resource management thus implies reducing pollution and anything that causesalterations in the chemical, physical, or biological properties of water itself and sharplyreduces its value as vital resource.
Within water-resource management, in particular, the development of industrial activ-ities causes human pressure on land that has detrimental repercussions on the environmentand on the productive activities related to it [4].
Among the industrial activities, the agroindustrial ones have particularly complexissues [1], including: the polluting load of mostly organic effluents with high suspended-solids content; the production of seasonal effluents related to the product to be processed;the quantitative and qualitative characteristics of the effluent that are not constant evenin the short-run; and the low value added to the final product by the processing activity,which cannot cover the costs of effluent treatment and purification.
Nevertheless, in contrast with other industrial effluents, in those of agroprocessingboth pathogens and heavy metals are absent. This means that even though the suspendedor dissolved organic matter supplies a high polluting load according to the normal as-sessment parameters, it can be reused in agriculture as animal feed, after immediate
475
476 Effluent Treatment in Agroprocessing
separation (flotation, sedimentation). If, however, it is in the final stage of treatment, byextracting biomass from sludge (centrifugation, drying, or composting) it can be used asan organic fertilizer.
The problem of effluent treatment, viewed within the framework of recovery andreuse, is, therefore, a serious environmental problem in both industrialized and develop-ing countries. Each country, however, presents specific conditions in terms of technolo-gies and technical development that make the characteristics of the problem extremelydifferent. These aspects cause a great variability, within the same industry, that also isobserved at a national level.
Actually, agroindustrial processing shows a natural adaptability to the local environ-mental conditions, including the characteristics of treated products, the climate, the land,the available resources, the socioeconomic scenario, and the presence of an agroindustrialor industrial system with which some production-related services can be shared [5].
Effluent treatment should involve consideration of the control of the processed prod-ucts, the quantity of water utilized, the utilization of technologies for resource watersaving, and reduction in the use of chemical detergents and disinfectants. These as-pects are related to the management of the entire production process, which should beconsidered an integral part of effluent treatment [6].
The effluent treatment required to reduce or minimize the environmental impact entailsa cost without any direct benefit to revenue. The treatment system, therefore, shouldhave the following design characteristics: suitability for minimizing the polluting loadto within the prescribed limits, environmental and technological sustainability; ease inmanagement, and low investment and running costs [7].
5.1.2 Organic-Matter Cycle in Nature and Agriculture, andEffluent-Treatment Systems
In order to analyze the water-pollution mechanism one should start from different pro-cessing systems: they make use of raw materials, water, and air and, prior to processing,besides the final product gaseous, liquid, and solid waste may coexist.
Gaseous waste should be treated prior to being released into the atmosphere. Solidwaste is a mass that may be easily contained and handled in the long term, whereas liquidwaste usually is discharged into streams.
The working mechanism of polluting substances in a stream may be summarized asfollows [1]: excessive oxygen consumption, release of toxic or harmful substances, andchange in the water temperature. Pollution thus takes on different aspects according towhether it acts in flowing, stagnant, coastal, or ground waters.
In the case of agricultural and food industries, waste, generally, is characterized by ahigh organic biodegradable substance content. Such substances, in a stream, are trans-formed by microorganisms into more stable, nonpolluting, and low-energy substances.
If the process takes place in the presence of oxygen, organic substances are oxidizedand the transformation releases energy that is used by aerobic microorganisms to growand multiply themselves. If pollution consumes all the oxygen in the water, the anaerobicmicroorganisms use the oxygen contained in nitrates, sulphates, and phosphates andcombine it with the carbon contained in organic matter, producing carbon dioxide.

Effluents in Agroprocessing 477
When the oxygen in nitrates, sulphates, and phosphates is exhausted, the anaerobicbacteria combine carbon as well as the other elements directly with hydrogen, thusproducing methane, hydrogen sulphide, and ammonium phosphate [1].
During transformation, these high-energy products release a lower amount of energyfor the anaerobic microorganisms, which thus have a slower development than the aerobicones. Therefore, whereas the aerobic processes produce quite stable substances and ahumus that may even be used as biomass, the anaerobic processes produce combustiblegases and other substances that may be harmful to the stream and should be appropriatelyreused and treated. Moreover, permanent anaerobic conditions might develop in thewater, thus inhibiting the self-purification process.
Thus, considering the organic load concentration, effluents containing organic sub-stances, generally, cannot be discharged freely into streams; they need to be treated toprevent the so-called permanent anaerobic condition that causes a stable state of pollutionin the water [8].
In the choice of the treatment to be carried out, two priority conditions are necessaryto influence the technological cycle of the processing industry directly: identification ofthe required water volume, so as to minimize wastage and the water volume to be treated,and the presence of recoverable substances in the effluent.
Although the need to save water is discussed in the subsequent analysis of eachprocessing industry, it should be emphasized that if one takes the processing waste atthe initial stage, different by-products including useful substances for human and animalnutrition can be extracted, such as proteins and fats.
It is clear that the issues behind the choice of a water-treatment system are numerousand not easy to solve. Besides the obvious need to review the processing cycle, andto reduce water and energy waste, the choice is whether to use traditional treatmenttechniques for effluents or to foresee new technology for the use and extraction of theorganic by-products from water, treating effluents at the same time [9].
In order to use these technologies, careful experimental work should be carried outon a chemical-processing level to provide different solutions. Moreover, controls, withexpert guidance on whether the resulting by-products are economically extractable, alsoshould be carried out, taking into account the cost of the treatment plant as well.
On a preliminary basis it should be mentioned that the waste from productive estab-lishments may be released into surface or deep streams, into the sea, onto soil and evenused for agricultural purposes, or into public sewers. Whatever the outlet may be, efflu-ents should be adapted to the acceptability limits prescribed by the legislation in force.
Water purification uses different methodologies, taking into account the type of dis-charge, the size and location of the plant, and the presence of municipal or centralizedplants in loco.
Productive units may be equipped with single one treatment plants and may dischargetreated water into streams; otherwise, if several similar productive units are present inthe same area, they could install a centralized plant, with great technical and economicadvantages.
The presence of a municipal urban wastewater-treatment plant would make it nec-essary to perform pretreatment alone, which is designed to remove the pollutants that
478 Effluent Treatment in Agroprocessing
cannot be purified in the municipal plant or, in any case, to reduce the pollution rate towithin the acceptable limits of the plant.
Based on this, it seems obvious that for small and medium sized agroindustries it isvery difficult to have single treatment plants, and thus consortium plants would seemthe most logical approach. Therefore, before making a detailed analysis of the differentplants usable for each individual industry, it seems useful to briefly analyze the techniquesmost commonly applied in treatment plants [2].
A treatment facility consists of a combination of machines and equipment that,arranged in a preestablished sequence, is able to carry out some chemical, physical,chemical–physical and biological processes that can transform effluents according to thedesired requirements.
Treatment usually includes pretreatment operations (or mechanical treatment), bio-logical treatment, chemical treatment, physical treatment, and chemical–physical treat-ment.
Pretreatment Operations (Mechanical Treatment)Mechanical treatment consists of removing those substances that may interfere with
subsequent treatment from the water. It includes the following operations: screening,size reduction, removal of coarse materials, oil and fat separation, grinding, and primarysettling.
Biological TreatmentBiological treatment is generally the central and main part of a system; it permits
self-purification of water by means of either aerobic or anaerobic microorganisms.These processes only act on biodegradable (naturally degradable through biological
processes alone) substances and may be implemented through the following processes:filtration on percolating filters, activated sludge oxidation, or lagooning.
In the case of highly polluting waste and in energy-intensive industries (distilla-tion of grape pomace or olive-oil extraction), anaerobic treatment plants may be pro-posed.
Chemical TreatmentChemical treatment means the use of chemical reagents that act on some of the
substances contained in water in order to:• Oxidize or reduce some dangerous substances into nontoxic compounds (oxidation,
reduction)• Remove or eliminate the pathogens by chlorination, ozonation, and so on (disin-
fection)• Reduce the pH to within the allowable limits for discharge (neutralization)• Precipitate some pollutants dissolved in water as sludge, by means of chemical
substances (precipitation)• Use chemical reagents that eliminate repulsive electrical charges by acting on the
small flocs formed during precipitation, thus favoring the formation of larger flakesor constituting chains that tend to link flakes with each other (coagulation or floc-culation)

Effluents in Agroprocessing 479
Physical TreatmentPhysical treatment consists of water separation from coagulated or flocculated pre-
cipitates; it can be carried out• By natural sedimentation with the constitution of a compact mass of jelly-like sludge
(settling)• By separation of the solid from the liquid particles, using a porous medium able
to filter only liquid substances (filtration); this may be done both to remove thesuspended solids in the liquids and to compact sludge
• By separation of the solid from the liquid particles through truncated rotors equippedwith screw conveyors (centrifugation)
Chemical–Physical TreatmentWith the improvement in purification techniques, other mixed chemical–physical
treatment methods have enabled more advanced waste purification.The most common ones include: ionic exchange, adsorption, flotation, stripping,
evaporation, reverse osmosis and ultrafiltration.
Ionic ExchangeThe ionic-exchange method consists of using substances (ionic-exchange resins) char-
acterized by chemical structures that enable the polluting ions contained in water to befixed by exchanging them with other nonpolluting ions.
AdsorptionAdsorption is a chemical–physical process by means of which polluting substances
are retained on the surface of a finely ground solid, calledadsorbent.Among the adsorbing substances, the most common is activated carbon, which in
some cases, after saturation, may be regenerated to reuse.
FlotationFlotation is based on the principle that lower densities allow water-dissolved pollu-
tants to be brought to the surface. Such a process also is favored for heavier substancescontained in water, by means of tensioactive products and by air injection through dif-fusers located at the bases of containers.
StrippingStripping is a process that enables the elimination of either the gaseous substances
dissolved in water or some substances that may be transformed into readily volatileproducts. The process usually occurs in a tower filled with porous inert material, wherethe water to be treated falls as a fine rain from above and air or vapors are injected frombelow to eliminate volatile substances from the liquid.
EvaporationEvaporation is a process inverse to the processes normally used for purification: Water
is separated by evaporation and the effluent is concentrated until a sludge is obtained.The disadvantages of the system consist of the possibility that some volatile substancesmay be removed with the vapor, and the high cost of the fuel used for evaporation. Theadvantages include the possibility of recovering all water-dissolved substances.
480 Effluent Treatment in Agroprocessing
Reverse OsmosisReverse-osmosis treatment concerns the use of semipermeable membranes that tend
to balance the different dilution existing between two liquids (pure water and pollutedwater) present in two containers separated by the semipermeable diaphragm.
If higher pressure than the osmotic one is applied in the container in which the pollutedliquid is, there is an inverse outflow of water: The polluted water tends to concentratewith a mechanism similar to evaporation, although in evaporation, energy is supplied asheat, whereas in reverse osmosis energy is supplied as pressure.
Plant ConfigurationThe treatment plant of an agrofood factory usually contains a combination of the
above processes that is chosen according to the type of effluent to be treated, based onthe following effluent characteristics:• Flow-rate and volume• Physical and chemical properties• Quality required• Capital plant investment availability• Running and management costs• Plant site• Presence of specialized and available personnel• Presence of centralized treatment plants.A purification plant, designed on the basis of the above elements, involves three
subsequent stages:• Primary treatment, used to prepare the substances suspended in effluents, is per-
formed by mechanical processes.• Secondary treatment, intended to convert the biodegradable organic substances into
stable products, usually is performed by biological plants, after chemical–physicaltreatment.
• Tertiary treatment is aimed at improving the effluent, so as to make it suitable fordischarge. The third stage usually is implemented by chemical or physical processes(chlorination, activated carbons, ultraviolet rays).
The products coming out of the treatment plant include a treated effluent that, ac-cording to the specific process concerned, is suitable for discharge into streams or intomunicipal treatment plants; a stable sludge, which may be contained in ditches or tanks,is accumulated near the plants and should be reused or disposed of.
5.1.3 Composting with Reference to Plant Solutions
Composting, which originates from the need to have manure substitutes for organicsoil fertilization, may be carried out by facilities of different technological levels thatshould, in any case, give rise to an organically stable product in accordance with the law.
Facilities generally are constructed following technological solutions consistent withthe characteristics of the product to be treated, the degree of automation required, andplant costs in terms of operation and management [10].
However, for a rational conversion of the organic substance to stable humus, it is firstnecessary to check that the biomass used for mixing do not contain toxic or harmful
Effluents in Agroprocessing 481
products. The carbon:nitrogen ratio in the mass being oxidized should be close to 25,and moisture should be kept at around 65% [11].
It is to be pointed out that the conversion should be monitored carefully; duringthermophilic oxidation the control of temperature is very important: In the first oxidationhours, it should reach 60◦C, to decrease slowly during the subsequent stabilization period.
Temperature, therefore, should be adequately controlled by means of systems forthermal-energy removal or supply; such a control should be integrated with an oxygensupply adequate to prevent the onset of anaerobic conditions and with a periodic controlof moisture content to prevent a slowing down or even a break in the microbial activity[12].
The optimal values for mass aeration in static reactors range between 0.1 and 0.22dm3/m3s. If the air inflow is greater than 0.22 dm3/m3s the mass cooling is too high andoxidation processes are not carried out adequately, whereas if inflows are below 0.02dm3/m3s, the humic acids formed are poor and the product is not sanitized [13].
The exposure of the mass being oxidized to the air causes a moisture loss of 50% ofthe initial content in 14 days, 11 days, and 9 days respectively for air inflows of 0.02,0.1, and 0.22 dm3/m3s.
This moisture loss is necessary, because the mixture starts fermentation with 65% wa-ter content, whereas the final compost should have a water content below 30%. Neverthe-less it should take place progressively and along with the evolution of the organic-mattertransformation processes [13].
In open composting plants, the mixture of the materials to be oxidized is placed onimpermeabilized concrete aprons and drained into trapezoidal piles 3 to 5 m in widthand not exceeding 2.5 m in height.
In this system, the occupied area piles volume ratio is 0.5, considering that the pilesmay reach a length of 60 to 100 m, is 0.5 and a density of 1030 kg/m3. An adequatecontrol of the piles temperature is difficult using this system. The nonhomogeneousventilation of the product inside the piles, cause the formation of pockets that undergoabnormal fermentation and also may be affected by anaerobic processes [14].
In closed plants, fermentation takes place in a wholly controlled medium, usually inreactors. In horizontal-axis plants the material is distributed in piles not exceeding 3 m.
Horizontal reactors usually consist of an impermeabilized concrete bed adequatelyequipped with a draining system of percolation liquids. The area in which the materialis distributed is indicated on this by trenches [15].
Trenches may be either rectangular or elliptic. In both plant types, the management isusually dynamic in that the product is periodically turned and moved towards the outlet.
In these plants the aeration of the fermenting mass is provided by simple turning;in this case, although a disturbance of the microorganism’s activity is possible, there isno problem related to the excessive heat loss, because piles are localized in a protectedenvironment in which the greenhouse effect, produced by the transparent surfaces, causesan increase in environmental temperature and a quicker attainment of the heat levelsrequired to sanitize and activate the mass humification process.
Turning normally is carried out using appropriate turning machines that can greatlyreduce labor use and fully automate the system. The machines used for this purposegenerally are mounted on wheels sliding on rails or in tracks; the machine advance
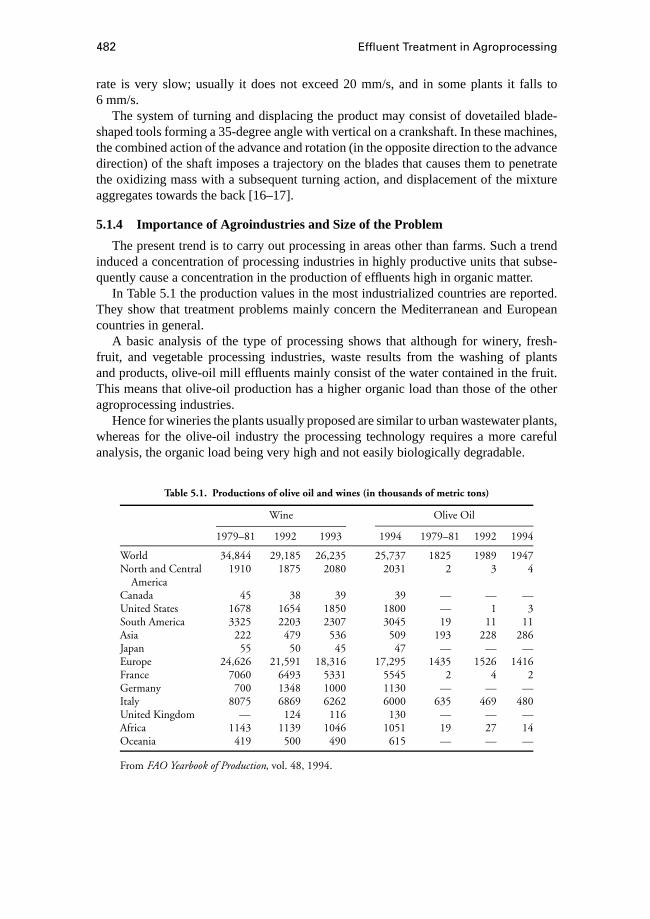
482 Effluent Treatment in Agroprocessing
rate is very slow; usually it does not exceed 20 mm/s, and in some plants it falls to6 mm/s.
The system of turning and displacing the product may consist of dovetailed blade-shaped tools forming a 35-degree angle with vertical on a crankshaft. In these machines,the combined action of the advance and rotation (in the opposite direction to the advancedirection) of the shaft imposes a trajectory on the blades that causes them to penetratethe oxidizing mass with a subsequent turning action, and displacement of the mixtureaggregates towards the back [16–17].
5.1.4 Importance of Agroindustries and Size of the Problem
The present trend is to carry out processing in areas other than farms. Such a trendinduced a concentration of processing industries in highly productive units that subse-quently cause a concentration in the production of effluents high in organic matter.
In Table 5.1 the production values in the most industrialized countries are reported.They show that treatment problems mainly concern the Mediterranean and Europeancountries in general.
A basic analysis of the type of processing shows that although for winery, fresh-fruit, and vegetable processing industries, waste results from the washing of plantsand products, olive-oil mill effluents mainly consist of the water contained in the fruit.This means that olive-oil production has a higher organic load than those of the otheragroprocessing industries.
Hence for wineries the plants usually proposed are similar to urban wastewater plants,whereas for the olive-oil industry the processing technology requires a more carefulanalysis, the organic load being very high and not easily biologically degradable.
Table 5.1. Productions of olive oil and wines (in thousands of metric tons)
Wine Olive Oil
1979–81 1992 1993 1994 1979–81 1992 1994
World 34,844 29,185 26,235 25,737 1825 1989 1947North and Central 1910 1875 2080 2031 2 3 4
AmericaCanada 45 38 39 39 — — —United States 1678 1654 1850 1800 — 1 3South America 3325 2203 2307 3045 19 11 11Asia 222 479 536 509 193 228 286Japan 55 50 45 47 — — —Europe 24,626 21,591 18,316 17,295 1435 1526 1416France 7060 6493 5331 5545 2 4 2Germany 700 1348 1000 1130 — — —Italy 8075 6869 6262 6000 635 469 480United Kingdom — 124 116 130 — — —Africa 1143 1139 1046 1051 19 27 14Oceania 419 500 490 615 — — —
From FAO Yearbook of Production, vol. 48, 1994.
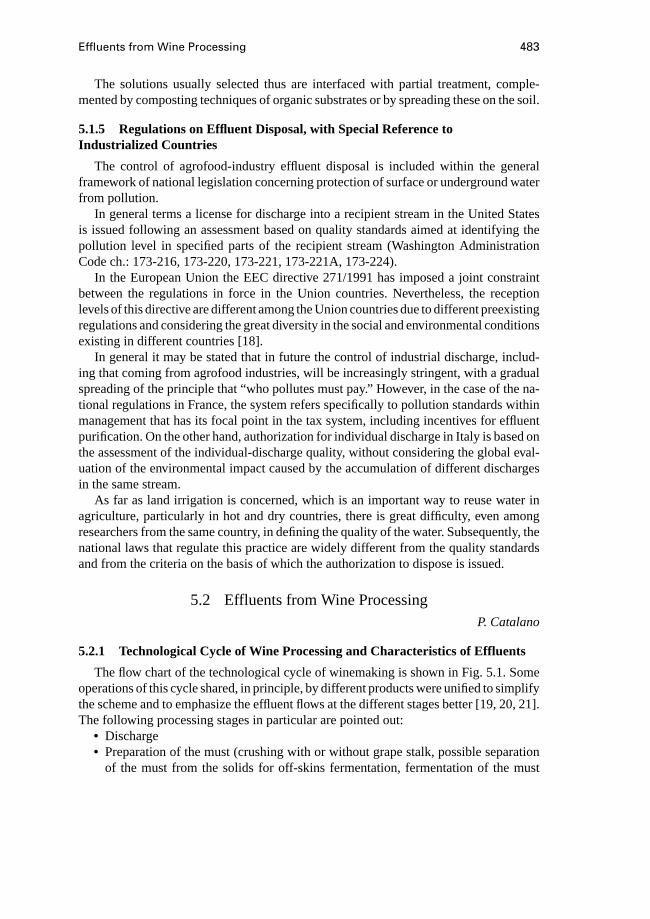
Effluents from Wine Processing 483
The solutions usually selected thus are interfaced with partial treatment, comple-mented by composting techniques of organic substrates or by spreading these on the soil.
5.1.5 Regulations on Effluent Disposal, with Special Reference toIndustrialized Countries
The control of agrofood-industry effluent disposal is included within the generalframework of national legislation concerning protection of surface or underground waterfrom pollution.
In general terms a license for discharge into a recipient stream in the United Statesis issued following an assessment based on quality standards aimed at identifying thepollution level in specified parts of the recipient stream (Washington AdministrationCode ch.: 173-216, 173-220, 173-221, 173-221A, 173-224).
In the European Union the EEC directive 271/1991 has imposed a joint constraintbetween the regulations in force in the Union countries. Nevertheless, the receptionlevels of this directive are different among the Union countries due to different preexistingregulations and considering the great diversity in the social and environmental conditionsexisting in different countries [18].
In general it may be stated that in future the control of industrial discharge, includ-ing that coming from agrofood industries, will be increasingly stringent, with a gradualspreading of the principle that “who pollutes must pay.” However, in the case of the na-tional regulations in France, the system refers specifically to pollution standards withinmanagement that has its focal point in the tax system, including incentives for effluentpurification. On the other hand, authorization for individual discharge in Italy is based onthe assessment of the individual-discharge quality, without considering the global eval-uation of the environmental impact caused by the accumulation of different dischargesin the same stream.
As far as land irrigation is concerned, which is an important way to reuse water inagriculture, particularly in hot and dry countries, there is great difficulty, even amongresearchers from the same country, in defining the quality of the water. Subsequently, thenational laws that regulate this practice are widely different from the quality standardsand from the criteria on the basis of which the authorization to dispose is issued.
5.2 Effluents from Wine ProcessingP. Catalano
5.2.1 Technological Cycle of Wine Processing and Characteristics of Effluents
The flow chart of the technological cycle of winemaking is shown in Fig. 5.1. Someoperations of this cycle shared, in principle, by different products were unified to simplifythe scheme and to emphasize the effluent flows at the different stages better [19, 20, 21].The following processing stages in particular are pointed out:• Discharge• Preparation of the must (crushing with or without grape stalk, possible separation
of the must from the solids for off-skins fermentation, fermentation of the must

484 Effluent Treatment in Agroprocessing
Figure 5.1. Vine making and effluents produced: block diagram.
in the tumultuous stage, settling and separation of the yeast biomass: lees fromfermentation, and pomace, in the case of the fermentation with maceration, to beexhausted by straining and/or pressing);
• Stabilization (spontaneous or caused by refrigeration and with fining treatments;settling of tartrates and colloidal substances);
• Conditioning (filtration treatment, bottling: washing of containers, corking, labelingand capsuling, possible thermal treatment of wine at the filling stage, use of SO2 asantiseptic).
The first two processing stages generally are shared by all wineries, although con-ditions among wineries vary. The former also depends on the different technologicalsolutions adopted. However, both water and pollution loads are greater in small plantsthan in larger ones.

Effluents from Wine Processing 485
Table 5.2. Average characteristics of winery effluents
BiologicalChemical OxigenOxigen Demand in
Suspended Demand five days PolyphenolsMatter (COD) BOD5 (Gallic Acid)
Origin of the Effluent pH (kg/m3) (kg/m3) (kg/m3) (g/m3) BOD5/COD
Wine making: vat-washing 3.8 12.80 11.50 7.50 59 0.7water (0.250 m3
per tank of 25 m3)Condensing water of must pans 4.0 0 22.08 12.36 160 0.6First racking: vat-washing water 3.7 17.50 15.17 9.73 119 0.6Second racking: vat-washing 3.7 3.46 16.33 9.32 185 0.6
waterOther wastewaters: vat-washing 4.4 0.52 4.91 2.51 70 0.5
water after the 3rd racking(0.150 m3 per tank of10.8 m3)
Vat-washing water after sale 5.8 0.16 2.47 0.95 24 0.4(0.150 m3 per tank of10.8 m3)
Vat-washing water of the rose 4.5 0.44 23.96 12.80 88 0.5wine after bentoniteclarification
Washing water of the diatomite 3.7 28.4 19.48 10.09 111 0.5filter
Washing water of the bottling 9.1 0.58 12.20 7.05 0 0.6plant
Because the water is mainly vat- and container-washing water, the surface area to bewashed per unit volume of the container becomes smaller if the size of the containers isincreased.
The characteristics of the effluents from these two stages to be considered in designingthe treatment plant are reported in Table 5.2 and mainly refer to the washing operationin the routine processing cycle [22, 23].
The effluents mainly consist of washing waters for squares, floors, platforms, andpreliminary processing equipment, such as hoppers, storage tanks, crushers, stemmers,presses, fermentation tanks, and must processing and separation machines, wine fromfermented pomace, and clarification of musts and racking [24, 25].
Wine bottling and must concentration, on the other hand, are present in wineries with acomplete processing cycle, and they differ considerably in terms of effluent type, becausethe first stage discharges effluents with a high amount of biodegradable detergents andsoda with a highly basic pH and residues of labels, glue, and so forth, whereas thesecond conditioning stage yields high amounts of water containing sulphur dioxide withconcentrations varying from 10 g/m3 to 100 g/m3 [26].
Therefore, in these two stages, specific pH-neutralization actions and a chemical-oxidation plant to reduce the SO2 are required.
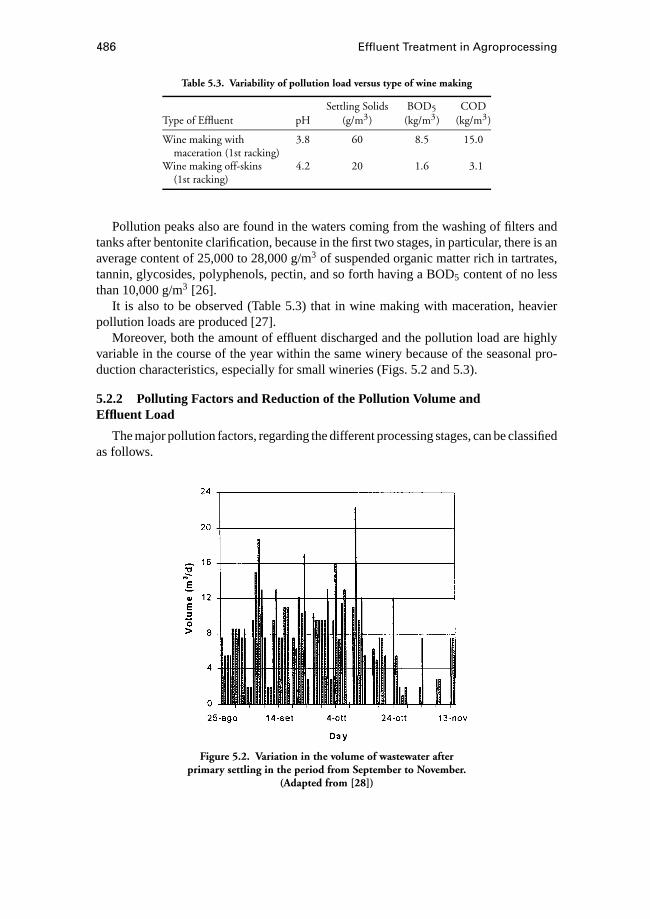
486 Effluent Treatment in Agroprocessing
Table 5.3. Variability of pollution load versus type of wine making
Settling Solids BOD5 CODType of Effluent pH (g/m3) (kg/m3) (kg/m3)
Wine making with 3.8 60 8.5 15.0maceration (1st racking)
Wine making off-skins 4.2 20 1.6 3.1(1st racking)
Pollution peaks also are found in the waters coming from the washing of filters andtanks after bentonite clarification, because in the first two stages, in particular, there is anaverage content of 25,000 to 28,000 g/m3 of suspended organic matter rich in tartrates,tannin, glycosides, polyphenols, pectin, and so forth having a BOD5 content of no lessthan 10,000 g/m3 [26].
It is also to be observed (Table 5.3) that in wine making with maceration, heavierpollution loads are produced [27].
Moreover, both the amount of effluent discharged and the pollution load are highlyvariable in the course of the year within the same winery because of the seasonal pro-duction characteristics, especially for small wineries (Figs. 5.2 and 5.3).
5.2.2 Polluting Factors and Reduction of the Pollution Volume andEffluent Load
The major pollution factors, regarding the different processing stages, can be classifiedas follows.
Figure 5.2. Variation in the volume of wastewater afterprimary settling in the period from September to November.
(Adapted from [28])
Effluents from Wine Processing 487
Figure 5.3. Variation in the pollution load in the periodfrom September to December. (Adapted from [29])
Coarse Solid ResiduesThese residues mainly consist of pomace, grape seeds, and stalks that can be separated
by means of mechanical treatment, such as screening or primary settling. The removal ofthese residues is, however, necessary mainly because of the large size of residues, whichcould cause significant damage to pipes and effluent-conveyance channels, as well as tothe pumping stations [30].
Sludge and LeesThese represent about 40% of the total pollution load. Spreading on the soil and
thickening by filtration are the types of treatment often associated with these stages. Inthe second case, in particular, filter presses or rotating filters [30] are used.
Potassium BitartrateThe removal of potassium bitartrate encrustation through washing of vats is a signifi-
cant source of pollution [31]. In this case, it is essential to adopt all possible precautionsto reduce the volume of discharged waters beforehand, permitting potassium bitartraterecovery at the same time.
Washing TechniquesUse of nozzles with adequate water-jet characteristics is necessary, so that the me-
chanical action exerted on the surface to be cleaned is adequately distributed (size anddistribution of drops of water, velocity and width of the opening angle of the jet, etc.).If possible, high-temperature vapor also could be used, thus saving a large amount ofwater; however, if the thermal action is increased considerably, the mechanical action isreduced strongly.
LiningThe adhesion force of encrustation (and thus the related detachment energy) is closely
connected to the roughness of the surface to be cleaned. For instance, the epoxy-resinlining of vats makes cleaning operations easier; the same is true for the electrolytically
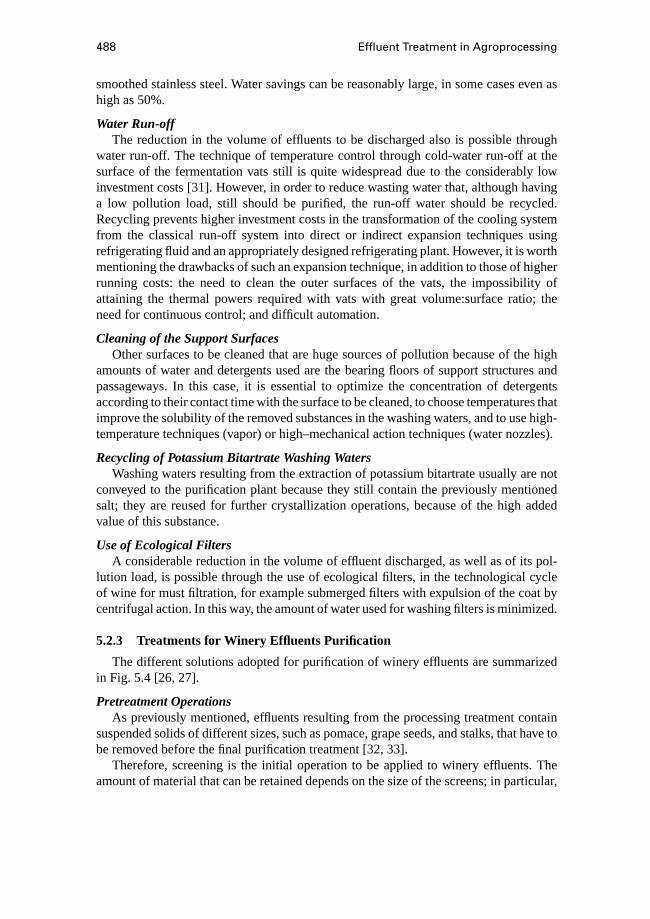
488 Effluent Treatment in Agroprocessing
smoothed stainless steel. Water savings can be reasonably large, in some cases even ashigh as 50%.
Water Run-offThe reduction in the volume of effluents to be discharged also is possible through
water run-off. The technique of temperature control through cold-water run-off at thesurface of the fermentation vats still is quite widespread due to the considerably lowinvestment costs [31]. However, in order to reduce wasting water that, although havinga low pollution load, still should be purified, the run-off water should be recycled.Recycling prevents higher investment costs in the transformation of the cooling systemfrom the classical run-off system into direct or indirect expansion techniques usingrefrigerating fluid and an appropriately designed refrigerating plant. However, it is worthmentioning the drawbacks of such an expansion technique, in addition to those of higherrunning costs: the need to clean the outer surfaces of the vats, the impossibility ofattaining the thermal powers required with vats with great volume:surface ratio; theneed for continuous control; and difficult automation.
Cleaning of the Support SurfacesOther surfaces to be cleaned that are huge sources of pollution because of the high
amounts of water and detergents used are the bearing floors of support structures andpassageways. In this case, it is essential to optimize the concentration of detergentsaccording to their contact time with the surface to be cleaned, to choose temperatures thatimprove the solubility of the removed substances in the washing waters, and to use high-temperature techniques (vapor) or high–mechanical action techniques (water nozzles).
Recycling of Potassium Bitartrate Washing WatersWashing waters resulting from the extraction of potassium bitartrate usually are not
conveyed to the purification plant because they still contain the previously mentionedsalt; they are reused for further crystallization operations, because of the high addedvalue of this substance.
Use of Ecological FiltersA considerable reduction in the volume of effluent discharged, as well as of its pol-
lution load, is possible through the use of ecological filters, in the technological cycleof wine for must filtration, for example submerged filters with expulsion of the coat bycentrifugal action. In this way, the amount of water used for washing filters is minimized.
5.2.3 Treatments for Winery Effluents Purification
The different solutions adopted for purification of winery effluents are summarizedin Fig. 5.4 [26, 27].
Pretreatment OperationsAs previously mentioned, effluents resulting from the processing treatment contain
suspended solids of different sizes, such as pomace, grape seeds, and stalks, that have tobe removed before the final purification treatment [32, 33].
Therefore, screening is the initial operation to be applied to winery effluents. Theamount of material that can be retained depends on the size of the screens; in particular,
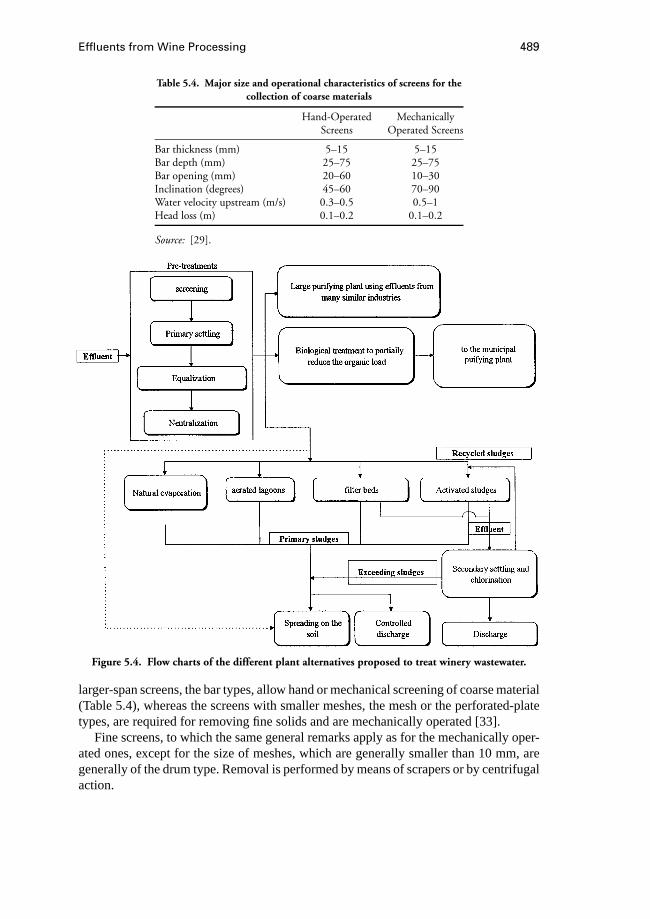
Effluents from Wine Processing 489
Table 5.4. Major size and operational characteristics of screens for thecollection of coarse materials
Hand-Operated MechanicallyScreens Operated Screens
Bar thickness (mm) 5–15 5–15Bar depth (mm) 25–75 25–75Bar opening (mm) 20–60 10–30Inclination (degrees) 45–60 70–90Water velocity upstream (m/s) 0.3–0.5 0.5–1Head loss (m) 0.1–0.2 0.1–0.2
Source: [29].
Figure 5.4. Flow charts of the different plant alternatives proposed to treat winery wastewater.
larger-span screens, the bar types, allow hand or mechanical screening of coarse material(Table 5.4), whereas the screens with smaller meshes, the mesh or the perforated-platetypes, are required for removing fine solids and are mechanically operated [33].
Fine screens, to which the same general remarks apply as for the mechanically oper-ated ones, except for the size of meshes, which are generally smaller than 10 mm, aregenerally of the drum type. Removal is performed by means of scrapers or by centrifugalaction.
490 Effluent Treatment in Agroprocessing
A primary settling tank then is installed to reduce the pollution load by eliminatingmost of the suspended solids that are not retained by screening. For subsequent treatment(autonomous or performed by other plants, either private or public) the pollution load isreduced by limiting both the design and the installation and running costs.
However, primary settling produces sludge that requires a subsequent stabilizationtreatment, which is too expensive to be applied to small plants for which the connectionwith the sewage network is more profitable.
The settling tanks [33, 34] consist of circular concrete or iron tanks, with the bottomslightly inclined towards the conveyance zone of the sludge settled by means of scrapers;these are not installed in small-sized plants and have quite deep tanks to allow thecollection of sludge in the middle.
The residence time in the settling tanks generally varies according to the type of bio-logical treatment envisaged for the effluent: 1.5 to 2 hours for the primary sedimentationmade upstream of the activated sludge oxidation plant, 3 to 4 hours upstream of the filterbeds.
In the case of plants close to the maximum size, the influence of wind on the velocityof the liquid in the tank also has to be considered; it might, therefore, be necessary toinstall a windbreak across the main wind direction.
The effluent of the settling tanks is accumulated in appropriate homogenization tanks[33, 35], in order to reduce both the discharge fluctuations and pollution load as much aspossible. They are constructed in such a way as to avoid undesirable recycling throughair insufflation (air flow variable from 1 to 2 m3/h per cubic meter of the tank dependingon the level of the liquid) or with floating-type surface turbines (supplied power variablefrom 20 to 40 W/m3 of tank capacity), in order to prevent anaerobic processes.
The volume of the equalization tanks has to be evaluated according to the volume ofdischarged effluent and the desired reduction in discharge and pollution-load fluctuationsof the effluent.
The effluent is subsequently neutralized by adding adequate doses of sulphuric acidor lime depending on the pH of the effluent. This process, which is required if additionalbiological treatment is envisaged, generally is carried out automatically by the real-timemeasurement of the pH by pH meters that control the opening and closing of electricvalves for the regulation and dosage of reagents [26].
Separate processing is carried out on the effluents resulting from the concentrationof musts that have to be subjected to the chemical oxidation process of SO2 beforemoving to the subsequent treatment. The plant generally consists of a waterproof reactorequipped with a mechanical stirrer to allow the best contact of the reagents with theeffluent. The oxidizing reagent most commonly used is sodium hypochlorite, which isinjected into the reactor, according to the measured pH, by means of adequate controlinstruments [26].
Finally, a technique that allows the volume of effluent moved to the secondary treat-ments to be considerably reduced consists of natural evaporation through evaporationpanels [36]. These are characterized by a large amount of evaporating surface comparedwith their sizes and allow about 50% of the effluent to be concentrated at low installationand management costs, especially if automated, with the same reduction in the finaltreatment costs [37].
Effluents from Wine Processing 491
This technique, however, has the typical disadvantage of lagooning, that is, the emis-sion of malodorous volatile substances, and thus the impossibility of having urban set-tlements in proximity to the plant, to be evaluated according to the different nationallaws. Also the low effluent discharges for each evaporation module (10 units are not nor-mally exceeded)—2 to 5 m3/d per module—could be a disadvantage of the evaporationplant.
Secondary Treatment OperationsThese treatments are recommended for large plants (autonomous treatment) or for
purification platforms to which the effluents from a number of plants are conveyed, notnecessarily from wineries, that are of an equally significant size.
Generally, in the case of wineries, aerobic biological systems are used (filter beds,lagooning, activated sludge) in which the organic matter is metabolized through aerobicmicroorganisms in the presence of oxygen and the possible addition of nutrients.
Secondary treatment can be made by means of an anaerobic process; however, thesemethods require a constant effluent discharge and high operating temperatures as wellas rather long residence times, leading to costs that are unacceptable for winery-effluentpurification.
For these reasons, the anaerobic purification methods are not recommended for wineryeffluents.
Filter BedsFilter beds [26, 33, 38] consist of basins or containers generally cylindrical in shape
with a large amount of contact-surface filtering material per unit volume of filter bed, ahigh degree of roughness to help the adhesion of the biological film, its long duration,and relatively low cost, on which the effluent is made to percolate through adequatedistributors arranged on revolving arms (Fig. 5.5).
The effluent-distribution system has to assure a uniform spraying of the bed with suchspecific discharges (referred to as the volume of the filter bed) to guarantee completewetting of the filling material.
In the case of traditional filling, intermittent distribution has to be applied: in thiscase, small feeding tanks equipped with siphons are installed. Their volume is equal tothe amount that can be supplied each time in order to guarantee complete wetting andfilling times equal to the average retention time of the effluent in the filter bed.
The arms, on which the nozzles are mounted, rotate at variable speed according tothe filter material and the bed depth, from 1 to 30 revolutions per hour.
Therefore, gravel is used (resulting from the breaking of nonflaking rocks, volcanicmaterial, blast-furnace slags, etc.) as a filling material for the traditional type filter bed.
The size of the filter bed should not be too great, to allow a high surface:volume ratio,nor too fine, to prevent clogging: the size of material generally used is between 0.05and 0.20 m (surface:volume ratio variable from 80 to 90 m2/m3, void fraction 50%, bulkdensity about 2500 kg/m3). It is also important for the material not to be too porous, toprevent shattering during sudden temperature changes.
The height of traditional filter beds depends on the possibility of having optimalventilation: for average sizes of 0.05 m, a height of 2 m is adopted, whereas for averagesizes of 0.08 m the height can be even 3 m or more if the filter is equipped with an

492 Effluent Treatment in Agroprocessing
Figure 5.5. Filter-bed plant: feeding pump (1), spreading system (2),section of the filter bed (3), cylinder containing the filter bed (4), aircirculation system (5), effluent recycling pump (6), settling tank (7).
adequate forced-ventilation system. Traditional filters are used if the polluting load ofthe effluent is not high, to avoid an excessive growth of the biomass that would causebed clogging.
For higher organic loads, preformed plastic components generally are used as fillingmaterial (Table 5.5), with vertical pipes having an inner honeycomb section, verticalslabs consisting of crossed undulated slabs to form parallelepiped blocks.
Table 5.5. Major characteristics of plastic filling materials
Specific SurfaceType of Filling Type of Material (m2/m3) Void (%)
With vertical pipes PVC 220 94With vertical slabs PVC 90–135 98With vertical slabs Polystyrene 89–189 94

Effluents from Wine Processing 493
Table 5.6. Operating characteristics of filters
Low-load Filters High-load Filters
Hydraulic load (m3/m2d) 1–4 8–40BOD5 (kg/m3d) 0.08–0.4 0.4–4.8Effluent recycling ratio (%) 0–50 100–400Required electrical power (W/m3) 2–4 6–20Purification efficiency 90–95 60–70
(% of removed BOD5)Film detachment Intermittent ContinuousType of supply Intervals not greater than 5 min ContinuousNitrification Complete ModerateCharacteristics of the Black, highly oxidized Dark, not completely oxidized,
sludge obtained tendency to septicity
Filter beds are classified into two categories, low-load filters (BOD5< 500 g/m3) andhigh-load filters. Operating characteristics are reported in Table 5.6.
A modified version of filter beds is the biodisk [38], in which the biological filmsupport surfaces consist of a set of disks (8=2–3 m) half-dipped in the effluent containedin a horizontal semicylindrical tank. By rotating (n = 2–5 rpm) around the axis of theshaft on which they are dovetailed, they oxygenate the liquid film during the stage ofcontact with water that adheres to them during dipping.
Activated SludgeOxidation of organic load with the help of activated sludge [33, 39] occurs in a
tank in which oxygen is supplied by insufflation of air and dispersed in the liquid massby submerged turbines or porous porcelain or plastic diffusers or through mechanicalaerators (Fig. 5.6).
In the tank, the biological mass (activated sludge) is regenerated continuously byrecycling a part of the sludge separated in the subsequent secondary settling.
The concentration of the organic load generally is kept around 2.5 kg/m3 and neverexceeds 4.5 kg/m3 in any case.
The efficiency in removing the pollution load is between 85% and 92%, with aretention time of between 4 and 6 hours. To achieve reductions in the region of 99%,much longer aeration times are required (for total oxidation processes) of about 24 hours[33, 40].
Figure 5.6. Activated sludge plant: homogenization tank (1), oxidation tank (2), settling tank (3).
494 Effluent Treatment in Agroprocessing
The shape of the oxidation tanks depends on the aeration system used. In the caseof diffused-air aeration, long and narrow tanks are used in which the width:height ratiois 1 to 2 for diffusers installed along one of the longest sides, whereas higher val-ues may be possible in the case of diffusers uniformly spread on the bottom of thetank.
In the case of mechanical aeration, the tanks are circular in small plants or rectangular(almost square) in other plants, where the width (or diameter):height ratio varies from1.5 to 5 with increasing turbine size. Moreover, especially in small plants, or sometimesin large units with subsequent oxidizing treatment, combined (or single-basin) plants areused in which the aeration tank and the secondary settling tank are merged [26].
The level of the liquid is maintained almost constant within an interval of about 0.10m by regulating weirs through which the aerated mixture passes via the conveyancepipes to the secondary settling tank. This type of regulation becomes essential if fixedmechanical aerators are used.
The main parameters characterizing the activated sludge-purification process are(Table 5.7):• Retention time, τr (h), in the aerated tank:
τr = 24 · VV
(5.1)
whereV (m3) is the volume of the tank andV the effluent delivery (m3/d)• Biomass concentration, MLSS (mixed liquor suspended solids, g/m3) and MLVSS
(mixed liquor volatile suspended solids, g/m3) in the aerated tank• Organic load, U , referring to the unit mass of biomass (g BOD5/g MLSS):
U = 24 · BODi5
τr ·MLSS(5.2)
where BODi5 is the organic load of the effluent reaching the aerated tank
• Organic load, Cv, referring to the unit volume of the aerated tank (g BOD5/m3):
CV = BODi5
V(5.3)
• Recycled sludge ratio, R (%):
R=100Vr
V(5.4)
whereVr (m3/d) is the recycled sludge delivery• BOD5 removal efficiency, η (%):
η = 100BODi
5− BODo5
BODi5
(5.5)
where BODo5 is the organic load of the effluent leaving the secondary settling tank.
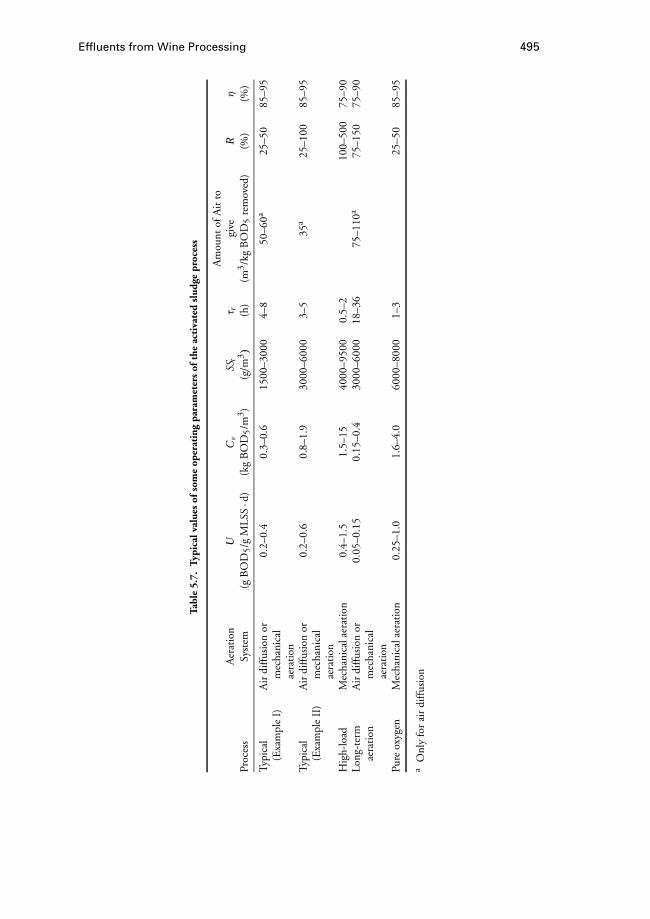
Effluents from Wine Processing 495
Tabl
e5.
7.Ty
pica
lval
ues
ofso
me
oper
atin
gpa
ram
eter
sof
the
acti
vate
dsl
udge
proc
ess
Am
ount
ofA
irto
Aer
atio
nU
Cv
SSt
τη
rgi
veR
Proc
ess
Syst
em(g
BO
D5/g
MLS
S·d
)(k
gB
OD
5/m
3 )(g
/m3)
(h)
(m3/k
gB
OD
5re
mov
ed)
(%)
(%)
Typi
cal
Air
diff
usio
nor
0.2–
0.4
0.3–
0.6
1500
–300
04–
850
–60a
25–5
085
–95
(Exa
mpl
eI)
mec
hani
cal
aera
tion
Typi
cal
Air
diff
usio
nor
0.2–
0.6
0.8–
1.9
3000
–600
03–
535
a25
–100
85–9
5(E
xam
ple
II)
mec
hani
cal
aera
tion
Hig
h-lo
adM
echa
nica
laer
atio
n0.
4–1.
51.
5–15
4000
–950
00.
5–2
100–
500
75–9
0Lo
ng-t
erm
Air
diff
usio
nor
0.05
–0.1
50.
15–0
.430
00–6
000
18–3
675
–110
a75
–150
75–9
0ae
rati
onm
echa
nica
lae
rati
onPu
reox
ygen
Mec
hani
cala
erat
ion
0.25
–1.0
1.6–
4.0
6000
–800
01–
325
–50
85–9
5
aO
nly
for
air
diff
usio
n

496 Effluent Treatment in Agroprocessing
Table 5.8. Operational characteristics of aerated lagoons
Depth of the basin (m) 1.8–6Range of allowable temperature (◦C) 0–40Range of allowable pH 6.5–8.0Hydraulic residence timea (d) 3–10Concentration of suspended solids 80–250
in the effluentb (g/m3)Purification efficiency of BOD5 (%) 80–95
a Coincides with the age of sludges because recycling is zero.b Including algae, microorganisms, and suspended solids,
residues of the influent.
Aerated LagooningUnlike the activated-sludge oxidation process, in aerated lagoons the concentration
of microorganisms is not controlled by the recycling of sludge; they are exclusivelyproduced by the degradation of the biological substrate entering with the fluid [26, 33].
Generally, aerated basins are made of earth and impermeabilized. They supply theoxygen required to maintain the aerobic conditions through floating turbines or diffusedaeration.
Therefore, in the aerated lagooning, energy consumption can be attributed mainlyto the mixing energy of the mass, because of the low total-solid content resulting fromthe lack of sludge recycling. On the contrary, in activated sludge plants main energyconsumption comes from the oxygen transfer required for the biological process.
Aerated lagooning, thus, has the advantages of having a low level of sludge pro-duction and not being affected by the variation in load and discharge. However, themain disadvantages include the large area of land occupied and sanitary problems (mal-odorous lagoons). In Table 5.8 the operational characteristics of aerated lagoons aregiven.
Land DistributionIn addition to the previously mentioned possibilities, soil spreading also should be
mentioned [30, 41]. There are two solutions currently adopted for direct spreading ofeffluents on the ground: transportation and spreading by means of tank wagons and landdistribution. In both cases the conditions that have to be respected in order to avoid soilsystem damage are the absence, in the land subjected to spreading, of water-loggingsites or infiltration to the groundwater; uniform distribution of the effluent on the wholesurface affected by spreading; and an amount not exceeding 1000 to 1500 m3/ha.
When spreading by the tank wagon, it is particularly necessary to equip the winerywith an aerated basin of a sufficient capacity to contain the effluent produced in about 30days at full capacity. It is also necessary to determine the capacity of the tank dependingon the total area available, on the overall amount of effluent to be distributed, and on thetime required for the operation.
If spreading on land, the irrigation network has to be adequately designed accordingto the previously mentioned parameters, as well as to the type of emitter used, thepossibility of real automation depending on the effective daily (or hourly) load, and also
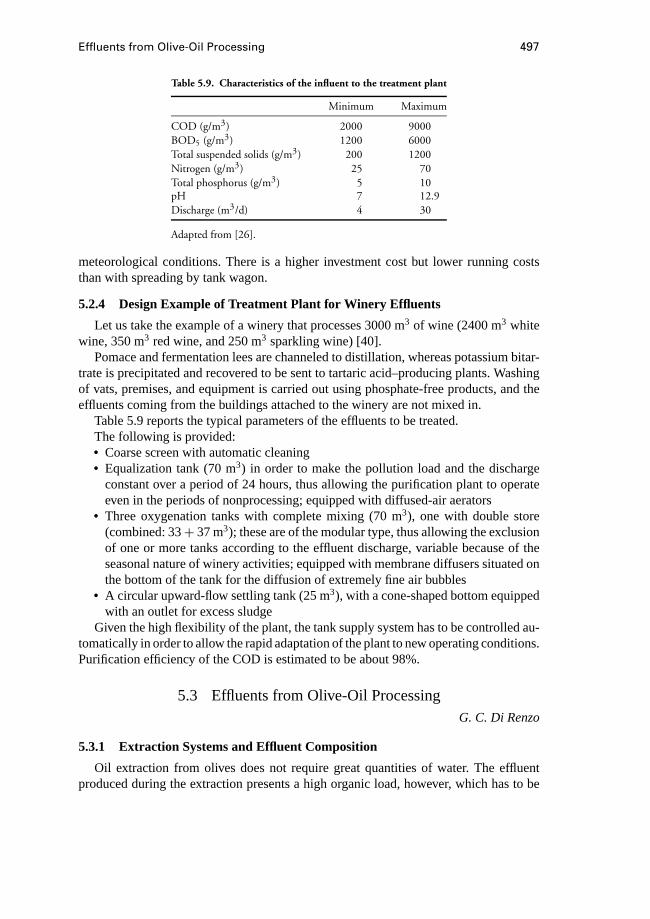
Effluents from Olive-Oil Processing 497
Table 5.9. Characteristics of the influent to the treatment plant
Minimum Maximum
COD (g/m3) 2000 9000BOD5 (g/m3) 1200 6000Total suspended solids (g/m3) 200 1200Nitrogen (g/m3) 25 70Total phosphorus (g/m3) 5 10pH 7 12.9Discharge (m3/d) 4 30
Adapted from [26].
meteorological conditions. There is a higher investment cost but lower running coststhan with spreading by tank wagon.
5.2.4 Design Example of Treatment Plant for Winery Effluents
Let us take the example of a winery that processes 3000 m3 of wine (2400 m3 whitewine, 350 m3 red wine, and 250 m3 sparkling wine) [40].
Pomace and fermentation lees are channeled to distillation, whereas potassium bitar-trate is precipitated and recovered to be sent to tartaric acid–producing plants. Washingof vats, premises, and equipment is carried out using phosphate-free products, and theeffluents coming from the buildings attached to the winery are not mixed in.
Table 5.9 reports the typical parameters of the effluents to be treated.The following is provided:• Coarse screen with automatic cleaning• Equalization tank (70 m3) in order to make the pollution load and the discharge
constant over a period of 24 hours, thus allowing the purification plant to operateeven in the periods of nonprocessing; equipped with diffused-air aerators
• Three oxygenation tanks with complete mixing (70 m3), one with double store(combined: 33+ 37 m3); these are of the modular type, thus allowing the exclusionof one or more tanks according to the effluent discharge, variable because of theseasonal nature of winery activities; equipped with membrane diffusers situated onthe bottom of the tank for the diffusion of extremely fine air bubbles
• A circular upward-flow settling tank (25 m3), with a cone-shaped bottom equippedwith an outlet for excess sludge
Given the high flexibility of the plant, the tank supply system has to be controlled au-tomatically in order to allow the rapid adaptation of the plant to new operating conditions.Purification efficiency of the COD is estimated to be about 98%.
5.3 Effluents from Olive-Oil ProcessingG. C. Di Renzo
5.3.1 Extraction Systems and Effluent Composition
Oil extraction from olives does not require great quantities of water. The effluentproduced during the extraction presents a high organic load, however, which has to be
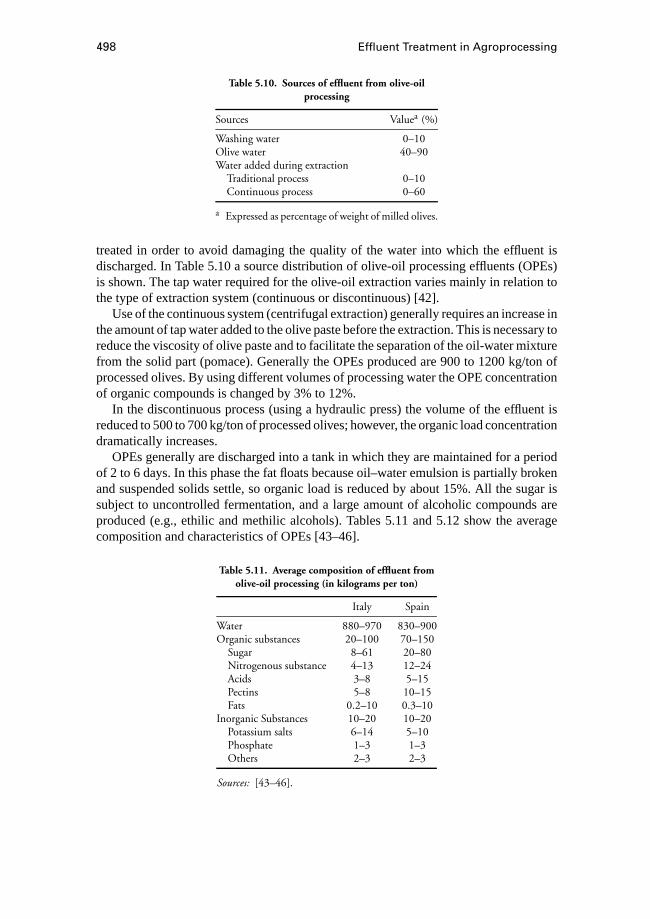
498 Effluent Treatment in Agroprocessing
Table 5.10. Sources of effluent from olive-oilprocessing
Sources Valuea (%)
Washing water 0–10Olive water 40–90Water added during extraction
Traditional process 0–10Continuous process 0–60
a Expressed as percentage of weight of milled olives.
treated in order to avoid damaging the quality of the water into which the effluent isdischarged. In Table 5.10 a source distribution of olive-oil processing effluents (OPEs)is shown. The tap water required for the olive-oil extraction varies mainly in relation tothe type of extraction system (continuous or discontinuous) [42].
Use of the continuous system (centrifugal extraction) generally requires an increase inthe amount of tap water added to the olive paste before the extraction. This is necessary toreduce the viscosity of olive paste and to facilitate the separation of the oil-water mixturefrom the solid part (pomace). Generally the OPEs produced are 900 to 1200 kg/ton ofprocessed olives. By using different volumes of processing water the OPE concentrationof organic compounds is changed by 3% to 12%.
In the discontinuous process (using a hydraulic press) the volume of the effluent isreduced to 500 to 700 kg/ton of processed olives; however, the organic load concentrationdramatically increases.
OPEs generally are discharged into a tank in which they are maintained for a periodof 2 to 6 days. In this phase the fat floats because oil–water emulsion is partially brokenand suspended solids settle, so organic load is reduced by about 15%. All the sugar issubject to uncontrolled fermentation, and a large amount of alcoholic compounds areproduced (e.g., ethilic and methilic alcohols). Tables 5.11 and 5.12 show the averagecomposition and characteristics of OPEs [43–46].
Table 5.11. Average composition of effluent fromolive-oil processing (in kilograms per ton)
Italy Spain
Water 880–970 830–900Organic substances 20–100 70–150
Sugar 8–61 20–80Nitrogenous substance 4–13 12–24Acids 3–8 5–15Pectins 5–8 10–15Fats 0.2–10 0.3–10
Inorganic Substances 10–20 10–20Potassium salts 6–14 5–10Phosphate 1–3 1–3Others 2–3 2–3
Sources: [43–46].
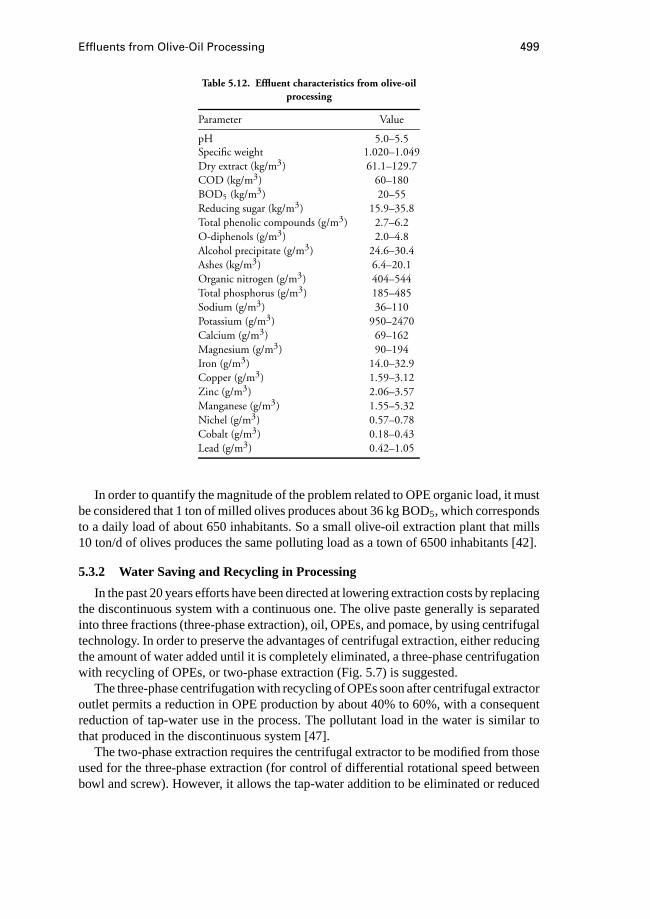
Effluents from Olive-Oil Processing 499
Table 5.12. Effluent characteristics from olive-oilprocessing
Parameter Value
pH 5.0–5.5Specific weight 1.020–1.049Dry extract (kg/m3) 61.1–129.7COD (kg/m3) 60–180BOD5 (kg/m3) 20–55Reducing sugar (kg/m3) 15.9–35.8Total phenolic compounds (g/m3) 2.7–6.2O-diphenols (g/m3) 2.0–4.8Alcohol precipitate (g/m3) 24.6–30.4Ashes (kg/m3) 6.4–20.1Organic nitrogen (g/m3) 404–544Total phosphorus (g/m3) 185–485Sodium (g/m3) 36–110Potassium (g/m3) 950–2470Calcium (g/m3) 69–162Magnesium (g/m3) 90–194Iron (g/m3) 14.0–32.9Copper (g/m3) 1.59–3.12Zinc (g/m3) 2.06–3.57Manganese (g/m3) 1.55–5.32Nichel (g/m3) 0.57–0.78Cobalt (g/m3) 0.18–0.43Lead (g/m3) 0.42–1.05
In order to quantify the magnitude of the problem related to OPE organic load, it mustbe considered that 1 ton of milled olives produces about 36 kg BOD5, which correspondsto a daily load of about 650 inhabitants. So a small olive-oil extraction plant that mills10 ton/d of olives produces the same polluting load as a town of 6500 inhabitants [42].
5.3.2 Water Saving and Recycling in Processing
In the past 20 years efforts have been directed at lowering extraction costs by replacingthe discontinuous system with a continuous one. The olive paste generally is separatedinto three fractions (three-phase extraction), oil, OPEs, and pomace, by using centrifugaltechnology. In order to preserve the advantages of centrifugal extraction, either reducingthe amount of water added until it is completely eliminated, a three-phase centrifugationwith recycling of OPEs, or two-phase extraction (Fig. 5.7) is suggested.
The three-phase centrifugation with recycling of OPEs soon after centrifugal extractoroutlet permits a reduction in OPE production by about 40% to 60%, with a consequentreduction of tap-water use in the process. The pollutant load in the water is similar tothat produced in the discontinuous system [47].
The two-phase extraction requires the centrifugal extractor to be modified from thoseused for the three-phase extraction (for control of differential rotational speed betweenbowl and screw). However, it allows the tap-water addition to be eliminated or reduced
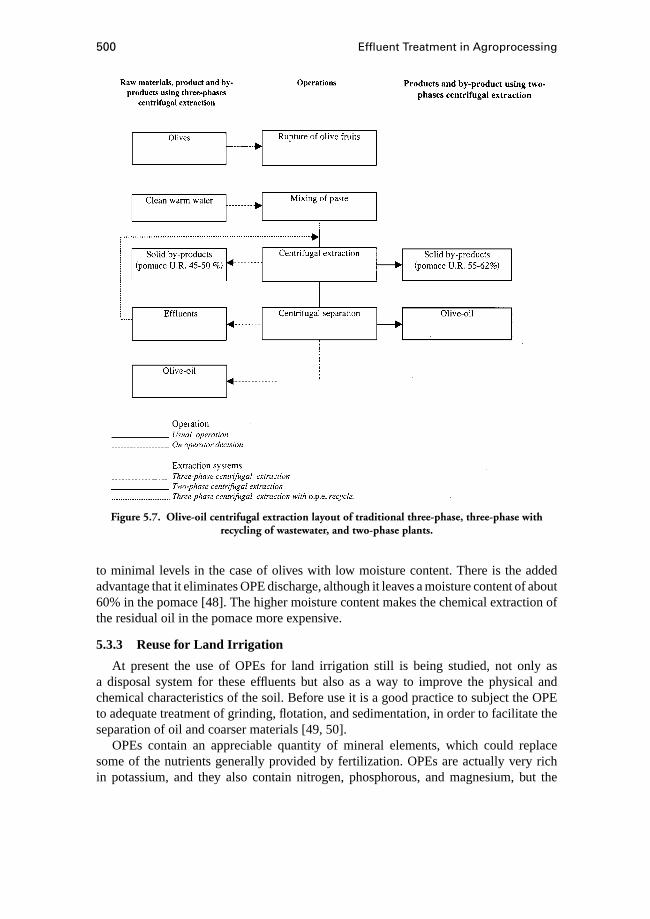
500 Effluent Treatment in Agroprocessing
Figure 5.7. Olive-oil centrifugal extraction layout of traditional three-phase, three-phase withrecycling of wastewater, and two-phase plants.
to minimal levels in the case of olives with low moisture content. There is the addedadvantage that it eliminates OPE discharge, although it leaves a moisture content of about60% in the pomace [48]. The higher moisture content makes the chemical extraction ofthe residual oil in the pomace more expensive.
5.3.3 Reuse for Land Irrigation
At present the use of OPEs for land irrigation still is being studied, not only asa disposal system for these effluents but also as a way to improve the physical andchemical characteristics of the soil. Before use it is a good practice to subject the OPEto adequate treatment of grinding, flotation, and sedimentation, in order to facilitate theseparation of oil and coarser materials [49, 50].
OPEs contain an appreciable quantity of mineral elements, which could replacesome of the nutrients generally provided by fertilization. OPEs are actually very richin potassium, and they also contain nitrogen, phosphorous, and magnesium, but the

Effluents from Olive-Oil Processing 501
most important component is organic matter that could improve soil structure and soilmicrobial population development [51].
The positive effect could be reduced by the following characteristics:• Salinity, which could reach a high concentration in the soil and produce flocculation
of the clayey soil fraction [52, 53]• High acidity, i.e., a low pH of about 4.9 for OPEs produced from traditional plants;
a pH of about 5.6 for OPEs produced from centrifugal extraction• Abundance of poliphenols, which present a notable phytotoxic effect on crops [44]The literature on OPE utilization for land irrigation is quite recent. It presents different
conclusions about the appropriateness of performing this operation. Negative consider-ations are based on the presence of a high organic load in the OPEs and on the presenceof poliphenols, which have a notable phytotoxic effect on seed germination and cropgrowth [52–54].
Table 5.13 shows the different results obtained by several authors regarding volumeand condition for distributing OPEs on fallow land [55, 56], land planted with olive trees[44, 45, 57, 58], or land before planting and in presence of vegetable crops [59, 60]. Insome cases the positive results have been obtained by neutralizing the acidity of OPEswith lime before application on different crops [44].
Table 5.13. Volumes and periods of olive-oil processing effluents connected to field irrigation advisedfor different crops
Volume Period Notes Ref.
Olive <100 m3/ha 41>400 m3/ha 51<800 m3/ha
100–200 dm3/tree Neutralizing the 40>100 m3/ha acidity 54<150 m3/ha
Vine (var.verdeca, <150 m3/ha Increase production 54var. montepulciano) and sugar content
Salad <200 m3/ha Distributed until 10 d 41before transplanting
Rye-grass >200 m3/ha Distributed until 45 d Trials executed in pot 41(Lolium italicum) <800 m3/ha before seeding and greenhouseWheat >20 m3/ha During the bunching 55
<320 m3/ha phaseWheat >20 m3/ha Distributed until 30 d 56
<100 m3/ha before seedingCorn >20 m3/ha 40–50 d before seeding 55
<320 m3/haCorn >20 m3/ha Distributed until 20 d 56
<100 m3/ha before seedingBarley >20 m3/ha During the bunching 55
<320 m3/ha phaseSunflower >20 m3/ha 40–50 d before seeding 55
<320 m3/ha
502 Effluent Treatment in Agroprocessing
Fiestas [44] points out the need to perform the distribution considering the crop pheno-logical phase, especially in terms of germination for the vegetable crops and the vegetativeactivity renewal for arboreal ones, which must be changed from around 2 to 3 weeks.
Bonari [59] concludes from field trials that distributing up to 320 m3/ha of OPEsduring the heading phase on wheat or barley, and on uncultivated soil before corn andsunflower seeding, does not produce negative effects on the crops’ biological cycles or ontheir productions. However, he points out the necessity of extending the experimentationto different season courses and for a large number of years.
Catalano et al. [58, 61] verify that the organic components of the OPEs are decomposedin a short time and that in soil subjected to distribution there is shown to be an increasein the nitrogen, phosphorous, and potassium contents. The utilization of OPEs causesa phytotoxic effect on the potato and almost all weeds. It also results in a vine- andolive-production increase in terms of quantity and quality.
5.3.4 OPE-Treatment Systems
Regarding the high organic load of OPEs, generally the treatment system is not asingle operation but a sequence of interrelated operations. Collection, screening, equal-ization of effluent flow, and sedimentation are treatment steps preceding biological orphysical treatment. The following solutions have been proposed after considering thisdifficulty [42]:• Large plants, designed to process a large amount of urban and agroindustry effluents.
These plants treat effluents produced by different industries; they allow optimizationof the treatment, recovery of the by-products, and the use of a more rational man-agement process. The running costs are reduced, but these plants require additionaltransport cost for effluents.
• Small plants, designed to process the effluents produced by a single olive-oil pro-cessing industry. These plants have a lower cost than the large ones. The treatmentsystem is simplified, and generally by-products are not recovered. Often the energycosts are higher than those of the large plant, but they can be reduced by usingrenewable fuels.
Biological Treatment SystemsIn the biological treatment systems, the organic matter is transferred to the biomasses
by interfacial contact and associated adsorption. The efficiency and the speed of thisbiological process depend on the extension (related to a concentration gradient of thesubstances to be removed from one phase to the other) and the quality (related to theoxidation of organic matter and synthesis of new cells) of the interface between waterand biomass [62].
Organic substances concentrated at the surface are absorbed by the biomass. Absorbedsubstances are decomposed during the metabolic activity of microorganisms and are usedfor cell growth and multiplication. End products of decomposition are released into thewater, and the gases escape if the partial pressure in the contiguous atmosphere is lowerthan that inside the water [62].
Effluents from Olive-Oil Processing 503
The low biodegradability of OPEs makes the use of traditional biological systemsalone more difficult. Those systems are not adequate to stabilize the organic load in ashort detention period [63, 64]. For this reason they generally are diluted with urbaneffluents or preceded by treatment for reducing the poliphenol content.
Activated-Sludge SystemIn the activated-sludge system, the purification process is controlled by regulating
sludge waste and return. Generally the sludge is recirculated for a few days. In thissystem the floc suspension and activity depend on the flocs’ dimensions. Too-large ortoo-heavy flocs tend to become inactive and anaerobic [62].
Temperature and availability of oxygen and essential minerals are the most importantparameters influencing biomass activity and floc growth [65].
The minimum mineral requirement is a ratio of BOD5: N:P equal to 100:5:1. In OPEsthe ratio of BOD5:N:P is 100:1:0.5; large amounts of minerals are required in order tocreate the best growing conditions for the active biomass [65].
The presence of substances that inhibit biomass growth requires preliminary treatmentof OPEs for the degradation of phenolic compounds, thyrosol, and hydroxythyrosol thatoccur in the highest proportion and are the main antibacterial compounds present in theOPEs.
Martinez-Nietoet al.[66] report that by usingAspergillus terreusin aerobic conditions69% of total phenol content can be degraded. COD and BOD5 degradation are 53% and67% respectively.
Due to the high pollutant load in OPEs and the low BOD5:COD ratio (0.30–0.35),aerobic treatment on untreated OPEs requires an elevated energy cost for oxygenation.Moreover, the long treatment time required by OPEs makes it necessary to constructexpensive large volume tanks.
Treatment of the activated-sludge type on OPEs has been carried out as follows:• As the final purification treatment on effluents produced in other purification systems
(anaerobic treatment and concentration treatment) (Fig. 5.8)• In a mixture with urban wastewater [63–65]; good results are reported in refs. [67]
and [68] with the OPE:urban wastewater ratio of 0.033 as volume and 2.7 as BOD5.The efficiency of BOD5 removal is 75% with a projected BOD5:suspended solidratio of 0.5 (Fig. 5.9).
Anaerobic Digestion SystemAnaerobic purification of effluents normally is carried out at a slower rate than aerobic
purification [70]. During the anaerobic purification, gases are released and foul-smellingintermediate substances are produced [62]. Subsequent treatment of the effluent by aer-obic biological processes is required.
Before carrying out anaerobic digestion, dilution or pretreatment is required becauseof the organic load of OPEs. Pretreatment generally is based on microorganism inoc-ulation that operates in aerobic conditions. Borjaet al. [71] find that inoculation withGeotrichum candidumprovides a partially purified effluent that is subject to a fasteranaerobic process than the original OPE [71].
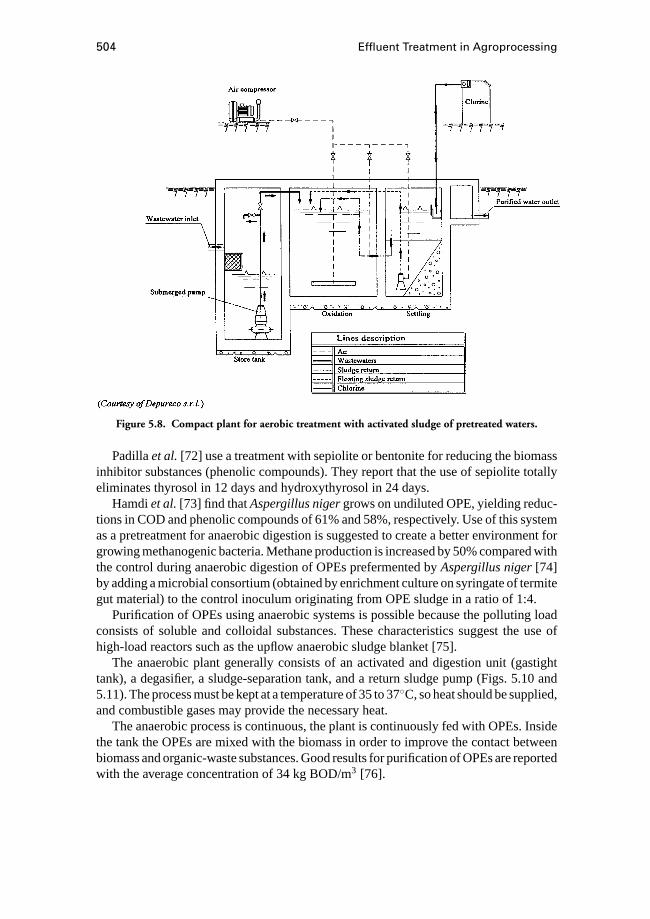
504 Effluent Treatment in Agroprocessing
Figure 5.8. Compact plant for aerobic treatment with activated sludge of pretreated waters.
Padillaet al.[72] use a treatment with sepiolite or bentonite for reducing the biomassinhibitor substances (phenolic compounds). They report that the use of sepiolite totallyeliminates thyrosol in 12 days and hydroxythyrosol in 24 days.
Hamdiet al.[73] find thatAspergillus nigergrows on undiluted OPE, yielding reduc-tions in COD and phenolic compounds of 61% and 58%, respectively. Use of this systemas a pretreatment for anaerobic digestion is suggested to create a better environment forgrowing methanogenic bacteria. Methane production is increased by 50% compared withthe control during anaerobic digestion of OPEs prefermented byAspergillus niger[74]by adding a microbial consortium (obtained by enrichment culture on syringate of termitegut material) to the control inoculum originating from OPE sludge in a ratio of 1:4.
Purification of OPEs using anaerobic systems is possible because the polluting loadconsists of soluble and colloidal substances. These characteristics suggest the use ofhigh-load reactors such as the upflow anaerobic sludge blanket [75].
The anaerobic plant generally consists of an activated and digestion unit (gastighttank), a degasifier, a sludge-separation tank, and a return sludge pump (Figs. 5.10 and5.11). The process must be kept at a temperature of 35 to 37◦C, so heat should be supplied,and combustible gases may provide the necessary heat.
The anaerobic process is continuous, the plant is continuously fed with OPEs. Insidethe tank the OPEs are mixed with the biomass in order to improve the contact betweenbiomass and organic-waste substances. Good results for purification of OPEs are reportedwith the average concentration of 34 kg BOD/m3 [76].
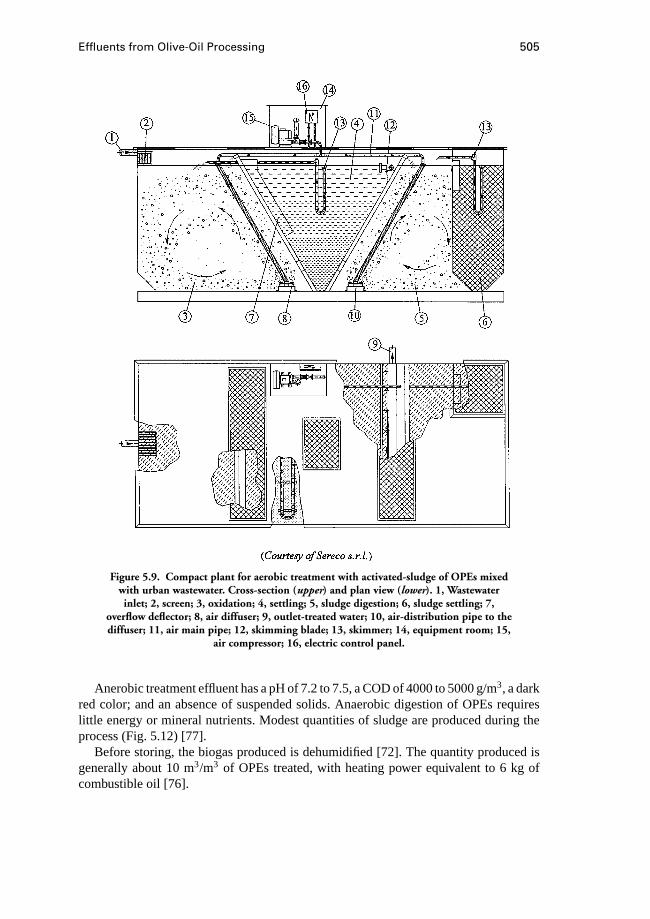
Effluents from Olive-Oil Processing 505
Figure 5.9. Compact plant for aerobic treatment with activated-sludge of OPEs mixedwith urban wastewater. Cross-section (upper) and plan view (lower). 1, Wastewaterinlet; 2, screen; 3, oxidation; 4, settling; 5, sludge digestion; 6, sludge settling; 7,
overflow deflector; 8, air diffuser; 9, outlet-treated water; 10, air-distribution pipe to thediffuser; 11, air main pipe; 12, skimming blade; 13, skimmer; 14, equipment room; 15,
air compressor; 16, electric control panel.
Anerobic treatment effluent has a pH of 7.2 to 7.5, a COD of 4000 to 5000 g/m3, a darkred color; and an absence of suspended solids. Anaerobic digestion of OPEs requireslittle energy or mineral nutrients. Modest quantities of sludge are produced during theprocess (Fig. 5.12) [77].
Before storing, the biogas produced is dehumidified [72]. The quantity produced isgenerally about 10 m3/m3 of OPEs treated, with heating power equivalent to 6 kg ofcombustible oil [76].

506 Effluent Treatment in Agroprocessing
Figure 5.10. Anaerobic plant layout. 1, Screen and store tank with lime addition for pHneutralization; 2, boiler for warm-water production; 3, anaerobic digester; 4, biogas tank;
5, plant for aerobic treatment with activated sludge; 6, sludge settling.
Figure 5.11. Anaerobic digester. 1, Digester; 2, OPE inlet; 3, recirculated sludge inlet; 4,bottom sludge outlet; 5, middle sludge outlet; 6, pipe to feed sludge to heat exchanger; 7,telescoping valves; 8, biogas outlet; 9, temperature-measuring device; 10, insulation; 11,
sample access; 12, bottom manhole; 13, top manhole.
Figure 5.12. Mass balance in anerobic treatment. (Adapted from [70])
Effluents from Olive-Oil Processing 507
The seasonal nature of OPE production (generally no longer than 100 days) is compati-ble with anaerobic digestion because of the reduced decay of microorganisms responsiblefor the process during the period of inactivity [76].
The use of a reactor with microorganisms immobilized on clay supports (sepiolite)improves the methane-production rate [71, 78].
In order to operate the plant year-round and to avoid the start-up period (requiredafter several months of plant inactivity), anaerobic codigestion may be carried out byoperating on swine effluents mixed with OPEs or dairy effluents depending on theiravailability. An organic loading rate of 3.84 kg COD/m3d was found to be safe for adigester operating on a year-round basis [79].
Borja and Gonzalez [80], comparing an anaerobic filter reactor (AFR) and an anaer-obic contact reactor (ACR) for OPE purification find that a steady state is reached morequickly using the ACR process than with the AFR process. The daily methane productionand COD removal measured with the AFR were greater than those measured with theACR. The application of ACR and AFR results in yields, respectively, of 0.18 and 0.34m3 methane/kg COD. The AFR yields a biogas with a higher percentage of methaneand effluents with lower volatile fatty-acid and solid contents than the ACR. Additionaladvantages of the AFR over the ACR include the elimination of mechanical mixing andsludge settling and return.
Georgacakis and Dalis [81] describe a mesophilic anaerobic digestion of supernatantand sludge obtained from OPEs after 10 days of settling in fixed bed– and plug flow–type anaerobic digesters. The biogas produced is about 2.28 m3/m3 of digester volume,the chemical oxygen demand reduction is 94%, and a final effluent COD is 4 kg/m3
[81].
Concentration by Evaporation SystemsConcentration by evaporation systems consists of separation of the OPEs into two
fractions, water and sludge. The major fraction of organic-waste substances remain inthe sludge. Generally the evaporated water still requires biological treatment in order todecompose organic compounds evaporated with water. The sludge is treated in compost-ing plants or used in a burner with combustible oil for heat production [82]. Concentrationcan be carried out in batch evaporators or continuous evaporators.
The batch evaporators are short vertical tube evaporators that contain a heating ele-ment. They normally have a large central downtake and vertical tubes from 0.9 to 1.5 m inlength. The effluent’s movement through the heat exchanger is controlled by an internalor external circulating pump. The pressure inside the evaporator can be reduced to 0.7bar in order to improve the distillation process.
The sludge remains in the batch evaporator until the concentrate reaches the estab-lished concentration; then it is discharged into a second tank for storing. The vaporseparated from OPEs is aspirated by a vacuum pump, condensed, cooled, and then trans-ferred to the biological treatment system (Fig. 5.13).
Continuous evaporators are generally multistage flash evaporators. These are usuallylong vertical tube machines. Effluents are heated in a surface heat exchanger and flashed
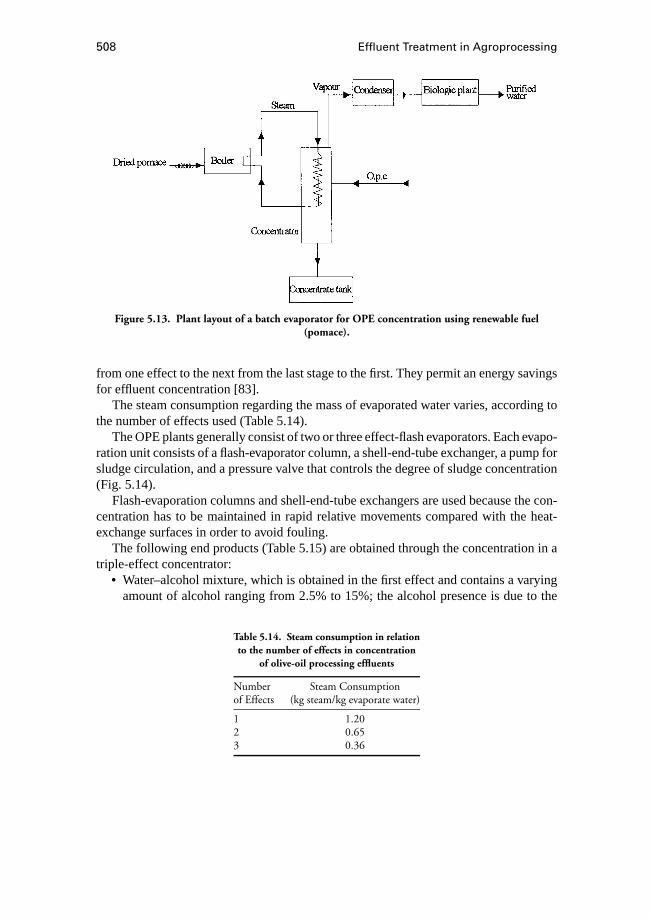
508 Effluent Treatment in Agroprocessing
Figure 5.13. Plant layout of a batch evaporator for OPE concentration using renewable fuel(pomace).
from one effect to the next from the last stage to the first. They permit an energy savingsfor effluent concentration [83].
The steam consumption regarding the mass of evaporated water varies, according tothe number of effects used (Table 5.14).
The OPE plants generally consist of two or three effect-flash evaporators. Each evapo-ration unit consists of a flash-evaporator column, a shell-end-tube exchanger, a pump forsludge circulation, and a pressure valve that controls the degree of sludge concentration(Fig. 5.14).
Flash-evaporation columns and shell-end-tube exchangers are used because the con-centration has to be maintained in rapid relative movements compared with the heat-exchange surfaces in order to avoid fouling.
The following end products (Table 5.15) are obtained through the concentration in atriple-effect concentrator:• Water–alcohol mixture, which is obtained in the first effect and contains a varying
amount of alcohol ranging from 2.5% to 15%; the alcohol presence is due to the
Table 5.14. Steam consumption in relationto the number of effects in concentration
of olive-oil processing effluents
Number Steam Consumptionof Effects (kg steam/kg evaporate water)
1 1.202 0.653 0.36
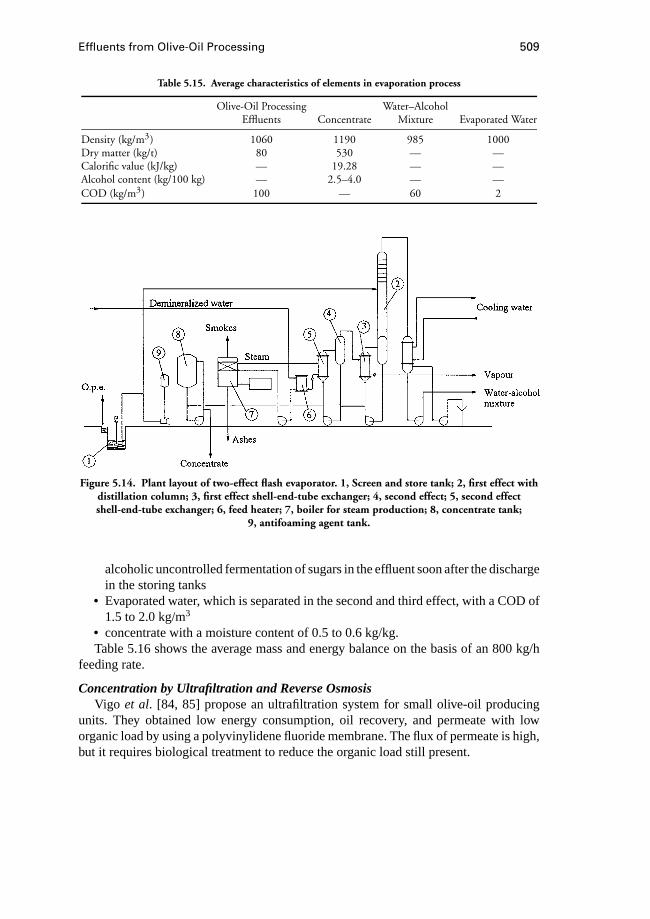
Effluents from Olive-Oil Processing 509
Table 5.15. Average characteristics of elements in evaporation process
Olive-Oil Processing Water–AlcoholEffluents Concentrate Mixture Evaporated Water
Density (kg/m3) 1060 1190 985 1000Dry matter (kg/t) 80 530 — —Calorific value (kJ/kg) — 19.28 — —Alcohol content (kg/100 kg) — 2.5–4.0 — —COD (kg/m3) 100 — 60 2
Figure 5.14. Plant layout of two-effect flash evaporator. 1, Screen and store tank; 2, first effect withdistillation column; 3, first effect shell-end-tube exchanger; 4, second effect; 5, second effectshell-end-tube exchanger; 6, feed heater; 7, boiler for steam production; 8, concentrate tank;
9, antifoaming agent tank.
alcoholic uncontrolled fermentation of sugars in the effluent soon after the dischargein the storing tanks
• Evaporated water, which is separated in the second and third effect, with a COD of1.5 to 2.0 kg/m3
• concentrate with a moisture content of 0.5 to 0.6 kg/kg.Table 5.16 shows the average mass and energy balance on the basis of an 800 kg/h
feeding rate.
Concentration by Ultrafiltration and Reverse OsmosisVigo et al. [84, 85] propose an ultrafiltration system for small olive-oil producing
units. They obtained low energy consumption, oil recovery, and permeate with loworganic load by using a polyvinylidene fluoride membrane. The flux of permeate is high,but it requires biological treatment to reduce the organic load still present.
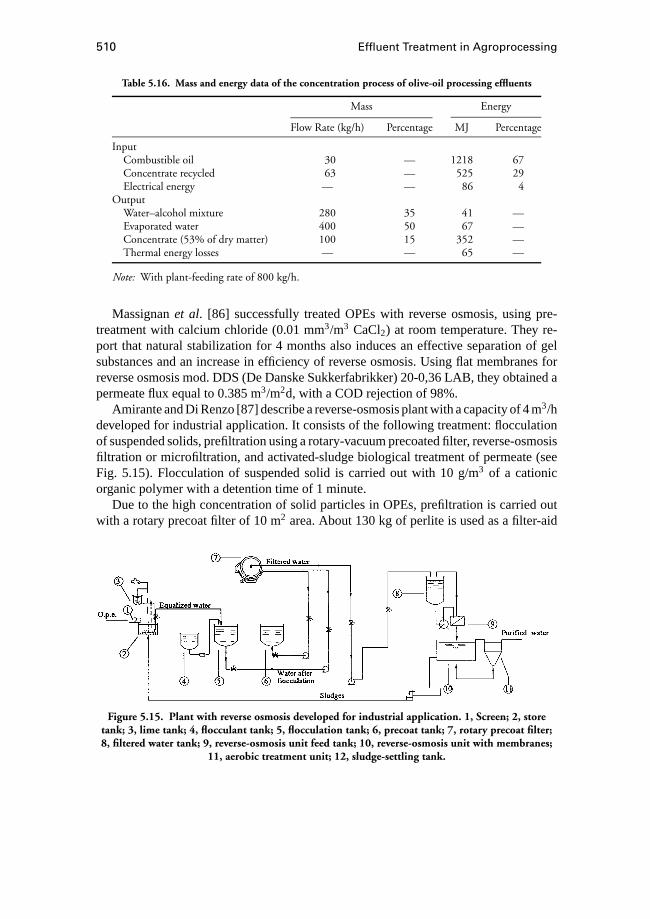
510 Effluent Treatment in Agroprocessing
Table 5.16. Mass and energy data of the concentration process of olive-oil processing effluents
Mass Energy
Flow Rate (kg/h) Percentage MJ Percentage
InputCombustible oil 30 — 1218 67Concentrate recycled 63 — 525 29Electrical energy — — 86 4
OutputWater–alcohol mixture 280 35 41 —Evaporated water 400 50 67 —Concentrate (53% of dry matter) 100 15 352 —Thermal energy losses — — 65 —
Note: With plant-feeding rate of 800 kg/h.
Massignanet al. [86] successfully treated OPEs with reverse osmosis, using pre-treatment with calcium chloride (0.01 mm3/m3 CaCl2) at room temperature. They re-port that natural stabilization for 4 months also induces an effective separation of gelsubstances and an increase in efficiency of reverse osmosis. Using flat membranes forreverse osmosis mod. DDS (De Danske Sukkerfabrikker) 20-0,36 LAB, they obtained apermeate flux equal to 0.385 m3/m2d, with a COD rejection of 98%.
Amirante and Di Renzo [87] describe a reverse-osmosis plant with a capacity of 4 m3/hdeveloped for industrial application. It consists of the following treatment: flocculationof suspended solids, prefiltration using a rotary-vacuum precoated filter, reverse-osmosisfiltration or microfiltration, and activated-sludge biological treatment of permeate (seeFig. 5.15). Flocculation of suspended solid is carried out with 10 g/m3 of a cationicorganic polymer with a detention time of 1 minute.
Due to the high concentration of solid particles in OPEs, prefiltration is carried outwith a rotary precoat filter of 10 m2 area. About 130 kg of perlite is used as a filter-aid
Figure 5.15. Plant with reverse osmosis developed for industrial application. 1, Screen; 2, storetank; 3, lime tank; 4, flocculant tank; 5, flocculation tank; 6, precoat tank; 7, rotary precoat filter;8, filtered water tank; 9, reverse-osmosis unit feed tank; 10, reverse-osmosis unit with membranes;
11, aerobic treatment unit; 12, sludge-settling tank.

Effluents from Olive-Oil Processing 511
Table 5.17. Average operating data offiltration treatment of olive-oil processing
effluents with 3% of dry matter
Characteristic Value
Drum rotation speed (rpm) 1.6Blade advancing speed (µm/s) 4.5Prefiltered permeate flow rate (m3/h) 3Specific flow rate (m3/h·m2) 0.3Drum vacuum pressure (MPa) 0.06Dry-matter filtered effluent (%) 2
precoat. It is spread on the surface and produces a 60 mm–thick coat applied to the filterdrum. This cake, mixed with the solid particles deposited on the surface, is dressed bythe knife blade microadvancing to expose the cylindrical surface of the clean filter aid.Filtration is finished when the blade has removed all of the panel. The time requiredranges from 3 to 6 hours, with dry matter in the OPEs ranging between 2% to 10%. Thedata on filtration is reported in Table 5.17 using OPEs with 3% dry matter.
Operating with a higher dry-matter content (8%) of OPEs, a specific flow-rate valueof 0.15 m3/h·m2 has been measured. The COD removed in this operation ranged between30% and 80% depending on the concentration of organic load in treated OPEs.
The reverse-osmosis unit consists of three cellulose acetate spiral-wound modules ina fiberglass shell, mounted in sequence, working at a pressure of 5.8 MPa. The permeaterate measured was 0.060 m3/h·m2, recycling the concentrate with prefiltered permeate.The membrane-cleaning cycle is required after 8 hours of running.
Permeate presents COD equal to 1 to 2 kg/m3 and requires additional treatment in anactivated-sludge biological plant (Table 5.18).
OPE DryingIn order to dry OPEs, they are sprayed on the pomace and dried in a rotary drier. A
direct-fired combustion furnace (fed with dried pomace) directly connected to the driersupplies hot combustion gas to the drier. A cyclone recovers the dust from the exhaustgas. The amount of dried pomace burned in the furnace per ton of olives processed rangesfrom 80 to 200 kg (about 30%–60% of the pomace produced) depending on the volumeof OPEs produced and the final pomace moisture content required [88].
Table 5.18. Characteristics of the reverse osmosis process
Olive-oil Processing Permeate after BiologicalEffluents Filtrate Permeate Treatment
pH 5.30 5.2 3.6 7.2COD (kg/m3) 100 35 1.2 0.2BOD (kg/m3) 36 10 0.05 0.025Dry solids (%) 6 2 0.05 0.05Fat (%) 0.04 0 0 0
512 Effluent Treatment in Agroprocessing
Table 5.19. Comparison of requirements of olive-oil processing effluent treatment systems
Labor Construction OperatingLand Energy Labor Qualification Cost Cost
Land distributiona******** ** ***** * ** **
Activated sludgeb**** ** ** ** * **
Anaerobic digestion **** *c
** **** *** **Concentration by ** ****** ** ****** ******** *****
evaporation systemsConcentration by ** ******** ** ******** ****** *******
reverse osmosisDrying * **** ** ** ***** ****
Sources: [61, 63, 79, 83–85] and information from others’ and author’s experience.Note: ** low; ***** medium; ******** high.a Evaluation include machines for transport and distribution in field.b Olive-oil processing effluents mixed with urban wastewater.c Recycling the biogas or the pomace in the process.
5.3.5 Comparison of Treatment Systems
OPEs can be treated by different systems. In industrialized countries the limitingfactors are generally national regulations on purified water standards and disposal andoperating costs, especially in terms of personnel. In developing countries high plantcosts, labor qualification, plant-management difficulties, and availability of spare partsrepresent important aspects that have to be evaluated when choosing a treatment system.Table 5.19 shows the author’s evaluated scores for the various requirements regardingdifferent OPE treatment systems, considering the reference source indicated.
The comparison of the different systems in relation to the OPE composition led tothe conclusion that it is difficult to define the best solution and design for OPE treatmentand purification. All the systems described can be effectively used to treat OPEs, but asystem must be chosen and adapted by analyzing the local situation and managementqualification [89, 90]. Only in this way it is possible to design and build an efficient plant.
References
1. Amirante, P. 1980. Impianti di depurazione nelle industrie di trasformazione deiprodotti agricoli [Effluents treatment plants for agro-food industries]. Proceeding ofseminary: Effluents Treatment for Agrofood Industries, Bari, pp. 9–35.
2. Amirante, P., and B. Bianchi. 1992. Purification of agrofood industries waste water inrelation to organic substance recovering. Proceeding of the International Conferenceof the VI Setct. of CIGR. on Treatment and Re-utilization of Farm Effluents andSludges, Lecce, pp. 1–15.
3. Sequi, P. 1983. Il ruolo della sostanza organica nel terreno agrario e i problemidell’agricoltura moderna [The importance of the organic substance in the soil].Proceeding of the International Symposium on Biologica Reclamation and LandUtilization of Urban Waste, Napoli.
4. Susmel, L. 1988. Principi di ecologia [Ecology principles]. CLEUP Ed., Padova,pp. 29–79.
Effluents from Olive-Oil Processing 513
5. Indelicato, S. 1992. Treatment and re-utilization of farm effluents and sludge. Pro-ceeding of the International Conference of the VI Setct. of CIGR on Treatment andRe-utilization of Farm Effluents And sludges, Lecce, pp. 159–174.
6. Garvaska, S. M. 1992. Tha sludge from the purification stations for waste water:Characteristics and utilization related on the environment. Proceeding of the Inter-national Conference of the VI Setct. of CIGR on Treatment and Re-utilization ofFarm Effluents and Sludges, Lecce, pp. 523–527.
7. Sendic, M. V. 1995. Strategies in agroindustrial waste treatment.Water ScienceTechnology. 32(12):113–120.
8. Price, R. 1985. The use of wastes as a source of energy. Proceeding of the Interna-tional Conference on Biomass, Venice, pp. 214–221.
9. Amirante, P., and P. Catalano. 1994. Valutazione dei prodotti agricoli in relazione aiconsumi di energia ed alle risorse impiegate [Evaluation of agricultural products withrespect to energy consumption and used resources]. Proceeding of the InternationalConference on Energy and Landscape, Campobasso, pp. 3–19.
10. Sequi, P. 1991. Criteri di qualit`a del compost: la maturazione della sostanza organica:Riciclo di biomasse di rifiuto e di scarto e fertilizzazione organica del suolo [compostquality criteria: Waste biomasses re-use and soil organic fertilization]. P`atron Ed.,Bologna, pp. 13–18.
11. Amirante, P., G. C. Di Renzo, and P. Catalano. 1992. Experimental trials for com-post production from by-products of slaughter poultry industry. Proceeding of theInternational Conference of the VI Setct. of CIGR on Treatment and Re-utilizationof Farm Effluents and Sludges, Lecce, pp. 249–260.
12. Amirante, R. 1992. Composting of by-products of olive oil extraction: Legislative,technological aspects and experimental results. Proceeding of the International Con-ference of the VI Setct. of CIGR on Treatment and Re-utilization of Farm Effluentsand Sludges, Lecce, pp. 287–321.
13. De Bertoldi, M. 1992. Microbiological features of sludges and by-products com-posting. Proceeding of the International Conference of the VI Setct. of CIGR onTreatment and Re-utilization of Farm Effluents and Sludges, Lecce, pp. 119–127.
14. Stentiford, E. J. 1986. Recent developments in composting. Proceeding of theInternational Symposium on Compost: Production, Quality and Use, Udine, pp.52–60.
15. Stentiford, E. J. 1992. Composting of sludges: trends and process constraints. Pro-ceeding of the International Conference of the VI Setct. of CIGR on Treatment andRe-utilization of Farm Effluents and Sludges, Lecce, pp. 395–405.
16. Amirante, P., and G. C. Di Renzo. 1991. Tecnologie ed impianti per il riciclo dellebiomasse di rifiuto e di scarto [Tecnologies and plants for by-products re-use].Riciclo di biomasse di rifiuto e di scarto e fertilizzazione organica del suolo [wastebiomasses re-use and soil organic fertilization]. P`atron Ed., Bologna(I), pp.221–230.
17. Pudelski, T. 1986. Horticultural use of compost. Proceeding of the InternationalSymposium on Compost: Production, Quality and Use, Udine, pp. 20–29.
18. Salgot, M. 1996. Existing guidelines and regulations in Spain on wastewater recla-mation and reuse.Water Science Technology34(11):261–267.
514 Effluent Treatment in Agroprocessing
19. Mourgues, J., and J. Maugenet, 1972. Les eaux r´esiduares des caves de vinification[Effluents from wineries].Industries Alimentaires et Agricoles, 3:261–273.
20. Cochet, P. 1988. D´epollution des activit´es de vinification et d’´elevage des vins[Winerie effluents purification and improvement of wine].Revue des Oenologues50:11–14.
21. Rambaud, A., J. Bontoux. 1974. Les effluents de l’industrie vinicole [Effluents fromwine making].Techniques de l’Eau et de l’Assainissement, 324(3):17–20.
22. Sanna, M. 1975. L’inquinamento e l’enologia [Pollution and enology].Vini d’Italia98:425–431.
23. Racault, Y., and A. Lenoir. 1995. Evolution des charges polluantes de deux cavesvinicoles du Sud-Ouest de la France sur un cycle annuel [Evolution of pollutionload of two wineries in the south of France during one year]. Revue Fran¸caised’Oenologie 152(Mai/juin):16–18.
24. Picot, B. 1992. Pollution egendr´ee par les ´etabilissements vinicoles: Nature, crit`eresd’evaluation et caract´eristiques [Wineries pollution: Nature, evaluation criteria andcharacteristics].Revue Franc¸aise d’Oenologie134(janv):5–10.
25. De Stefano, G., and V. Sciancalepore. 1992. Dry matter treatments of refluent ofwine lees processing. Proc. of the Int. Conf. of the VI Setct. of CIGR. on Treatmentand Re-utilization of Farm Effluents and Sludges, Lecce, pp. 89–95.
26. Amirante, P., and G. Scarascia Mugnozza. 1982. Impianti di depurazione delle acquereflue degli stabilimenti enologici [Purifying plants for winery’s effluents].Vignevini(5):27–40.
27. Farolfi, S. 1995. La gestione dei reflui enologici sul territorio: Analisi e strumenti[Winery’s effluents management: Analysis and means]. Avenue Media Ed., Bologna.
28. Torrijos, M., R. Moletta. 1997. Winery wastewater depollution by sequencing batchreactor.Water Science Technology35(1):249–257.
29. Chudoba, P., and R. Pujol. 1996. Activated sludge plant facing grape harvest period:A case study.Water Science Technology34(11):25–32.
30. Marchetti, R. 1994. Agricultural utilization of effluents and solid wastes producedfrom enological plants.Industrie delle Bevande23(Dec):11–20.
31. Rochard, J. 1992. Reduction de la charge polluante et du volume des rejets dansles caves vinicoles [Pollution load and amount reduction of the wineries’ effluents].Revue Franc¸aise d’Oenologie134 (Janv):583–588.
32. Conti, F. 1994. Available techologies for the enological effluent treatment, accordingto the plant production capacity.Industrie delle Bevande23(Dec):583–594.
33. Passino, R. 1980. La conduzione degli impianti di depurazione delle acque di scarico[effluent purifying plants management]. Ed. Sci. A. Cremonese, Roma.
34. Eckenfelder, W. W. 1982.Principles of Water quality Management. Boston: CBIPublishing Company.
35. Novotny, V., and A. J. England. 1974. Equalization design techniques for conserva-tive substances in waste water treatment systems.Water Research8:325–331.
36. Bianchi, B., and P. Catalano. 1992. Experimental trials on olive oil waste waterpurifying by means of evaporative panels. Proceeding of the CIGR VI Tech.
Effluents from Olive-Oil Processing 515
Section on Treatment and Re-utilization of Farm Effluents and Sludges, Lecce,pp. 49–62.
37. Moletta, R., and J. Raynal. 1992. Procedes de depollution innovants et recherchesactuelles dans le domaine vinicole [New purifying processes and actual research forwineries’ effluents].Revue Franc¸aise d’Oenologie134 (Janv):37–43.
38. Martin, G. 1982. Point sur l’epuration et le traitement des effluents, vol.1, LavoisierEd., Paris.
39. Gonard, B. 1992. Les traitements del la pollution par procedes biologiques [Biolog-ical processes for effluents treatment].Revue Franc¸aise d’Oenologie134(Janv):29–35.
40. Fumi, M. D., and G. Parodi. 1992. Messa a punto di un impianto ad aerazione prol-ungata per il trattamento biologico in cantina [Optimization of long-term activatedsludge treatment of winery waste waters].Industrie delle Bevande23:305–310.
41. Dornier, N. 1992. Traitement des rejets en cave vinicole:Eepandage - ´eevaporation- raccordement `a la station communale [Wineries’ effluents treatment: Spreadingon soil, evaporation, discharge to a consortia plant].Revue Franc¸aise d’Oenologie134(Janv):21–25.
42. Amirante, P., and G. C. Di Renzo. 1989. Tecnologie e Impianti disponibili per ladepurazione delle acque di vegetazione [Plants and technology for olive oil milleffluents]. Proceedings of International Seminary on Olive Oil Mill Effluents Purifi-cation, Lecce, pp. 24–57.
43. del Valle, L. J. 1980. Contaminaci´on de les aguas por el alpech´ın y posibles solu-ciones al problema [Water pollution by waste-waters from olive-oil plants and pos-sible ways for resolution of the problem].Grasas y Aceites31(4):273–279.
44. Fiestas, J. A. 1977. Depuracion de aguas residuales en las industrias de aceitunas yaceites de oliva [Wastewater treatment from olives and oli oils industries].Grasas yAceites28:113–121.
45. Morisot, A. 1979. Utilisasion des margines par ´epandage.L’Olivier 19:8–13.46. Shammas, N. K. 1984. Olive oil extraction waste treatment in Lebanon.Effluent and
Water Treatment Journal24(10):388–392.47. Amirante, P., G. C. Di Renzo, and L. Di Giovacchino. 1993. Prove sperimentali su
nuovi impianti di estrazione centrifuga dell’olio di oliva [Evaluation of new plantsfor olive-oil centrifugal extraction]. Proceeding of Vth A.I.G.R. National Meeting5:265–272.
48. Amirante, P., G. C. Di Renzo, L. Di Giovacchino, B. Bianchi, and P. Catalano. 1993.Evoluzione tecnologica degli impianti di estrazione dell’olio d’oliva [Technologicaldevelopment of olive-oil plant].Olivae48:43–53.
49. Testini, C. 1980. Problemi connessi all’ulizzazione agricola delle acque reflue [Prob-lems related to reuse of wastewater in agriculture].Acqua-Aria2:241–245.
50. Sequi, P. 1980. L’acqua, la fertilita del terreno e l’impiego delle acque reflue [Water,soil fertility and wastewater re-use].Acqua-Aria2:231–240.
51. Perrone, S. 1989. Lo smaltimento delle acque di vegetazione delle olive [Purificationsystem for olive oil mill effluents].Inquinamento6:42–45.
516 Effluent Treatment in Agroprocessing
52. Pompei, C., and F. Codovilli. 1974. Risultati preliminari sul trattamento di depu-razione delle acque di vegetazione delle olive per osmosi inversa [First results ofreverse osmosis treatment of olive-oil mill effluents].Scienza E Tecnologia degliAlimenti4:363–364.
53. Ielmini, M., M. Sanna, and N. Pelosi. 1976. Indagine sulle acque di rifiuto deglistabilimenti di produzione olearia in provincia di Roma:Possibilit`a di depurazione[Olive-oil processing effluents evaluation in Rome province: Purification opportu-nity]. Industrie Alimentari, 11:123–131.
54. Potenz, D., E. Righetti, A. Bellettieri, F. Girardi, P. Antonacci, L. Calianno, and G.Pergolesi. 1985. Evoluzione della fitotossicit`a in un terreno trattato con acque refluedi frantoi oleari [Development of phytotossicity in soil treated with olive-oil millwastewater].Inquinamento5:48–35.
55. Marsilio, V., L. Di Giovacchino, M. Solinas, N. Lombardo, and C. Briccoli Bati.1990. First observations on the disposal of olive oil mills vegetation waters oncultivated soil.Acta Horticolturae Olive Growing286:492.
56. Flouri, F., I. Chatjipavlidis, and C. Balis. 1989. Effect of olive oil mills liquid wasteson soil fertilıty. Proceedings of Internationa Seminar on Olive Oil Mill EffluentsPurification, Lecce, pp. 233–250.
57. Proietti, P., A. Catechini, and A. Tombesi. 1988. Influenza delle acque reflue difrantoi oleari su olivi in vaso e in campo.Informatore Agrario45:87–91.
58. Catalano, M., T. Gomes, M. De Felice, and T. De Leonardis. 1985. Smaltimentodelle acque di vegetazione dei frantoi oleari: Quali altenative alla depurazione? [Fielddistribution of olive-oil mill wastewater: What are the alternatives to purification?]Inquinamento2:87–90.
59. Bonari, E., and L. Ceccarini. 1991. Spargirnento delle acque di vegetazione dei fran-toi sul terreno agrario [Field distribution of olive-oil mill wastewater].L’InformatoreAgrario 13:49–57.
60. Di Giovacchino, L., and L. Seghetti. 1990. Lo smaltimento delle acque di vegetazionedelle olive su terreno agrario destinato alla coltivazione di grano e mais [vegetablewaters distribution on soil dedicated to wheat and corn].L’informatore Agrario45:58–62.
61. Catalano, M., and M. De Felice. 1989. Utilizzazione delle acque reflue come fertil-izzante [Use of olive-oil mill wastewater as fertilizer]. Proceedings of InternationaSeminar on Olive Oil Mill Effluents Purification, Lecce, pp. 251–261.
62. Fair, G. M., J. C. Geyer, and D. A. Okun. 1968.Water and Wastewater Engineering.New York: Wiley & Sons.
63. Bianucci, G., and E. Bianucci. 1992. Il trattamento delle acque residue industrialie agricole [Agro-industry and agricultural wastewater treatment]. Hoepli, Milanpp. 316–318.
64. Sanna, M.1982. Antinquinamento nelle industrie alimentari [Antipollution in foodindustry]. AEB, Brescia (I), pp. 207–224.
65. Masotti, L. 1991.Depurazione delle acque[Water Purification]. Bologna:Calderini.66. Martinez-Nieto, L., S. E. Garrido-Hoyos, F. Camacho-Rubio, M. P. Garcia-Pareja,
and A. Ramos-Cormenzana. 1993. The biological purification of waste productsfrom olive oil extraction 43(3):215–219.
Effluents from Olive-Oil Processing 517
67. Giorgio, L., C. Andreazza, and G. Rotunno. 1981. Esperienze sul funzionamento diun impianto di depurazione per acque di scarico civili e di oleifici [Experimentaltrials on combined treatments of urban and olive mill effluents].Ingegneria Sanitaria5:296–315.
68. Boari, G., and I. M. Mancini. 1990. Combined treatments of urban and olive milleffluents in Apulia, Italy.Water Science Technology22(6):235–240.
69. Mascolo, A., A. Cucurachi, L. di Giovacchino, and A. Ranalli 1990. Disposal ofwaste water from olive oil production, by means of activated sludge plants fortreatment of urban sewage.Annali dell’Istituto Sperimentale per la Elaiotecnica9:107–120.
70. Hamdi, M. 1992. Toxicity and biodegradability of olive mill wastewaters in batchanaerobic digestion.Applied Biochemistry and Biotechnology37(2):155–163.
71. Borja, R, A. Martin, R. Maestro, J. Alba, and J. A. Fiestas. 1992. Enhancement of theanaerobic digestion of olive mill wastewater by the removal of phenolic inhibitors.Process-Biochemistry27(4):231–237.
72. Padilla, R. B., A. Martin, J. A. Fiestas, J. M. Olias, and M. M. Duran. 1992. Usodi sepiolite e bentonite per la degradazione di composti fenolici negli scarichi dioleifici [Use of sepiolite and bentonite for phenolic compound decay of olive oilmill effluents].Inquinamento3:114–117.
73. Hamdi, M., and J. L. Garcia. 1993. Anaerobic digestion of olive mill wastewa-ters after detoxification by prior culture of Aspergillus niger.Process-Biochemistry28(3):155–159.
74. Hamdi, M., A. Brauman, and J. L. Garcia. 1992. Effect of an anaerobic bacterialconsortium isolated from termites on the degradation of olive-mill waste-water.Applied Microbiology and Biotechnology37:408–410.
75. Lettiga, G., and A. F. M. Van Velsen, S. W. Hobma, W. De Zeeuw, and A. Klap-wijk. 1980. Use of the upflow sludge balnket (USB) reactor concept for biologi-cal wastewater treatment, especially for anaerobic treatment.Biotech. Bioeng. 222:699–734.
76. Boari, G., A. Brunetti, R. Passino, and A. Rozzi. 1984. Anaerobic digestion of olivemill wastewater.Agricultural Wastes10:161–175.
77. Fiestas, J. A., R. Navarro Gamero, R. L. Cabello, A. J. Garcia Buendia, and G. M.Maestojuan Saez de Jauregui. 1982. Depuracion anaerobia del alpechin como fuentede energia [Anaerobic treatment of olive mill wastewater as energy source].Grasasy Aceites33:165–270.
78. Martin, A., R. Borja, I. Garcia, and J. A. Fiestas. 1991. Kinetics of methane produc-tion from olive mill wastewater.Process-Biochemistry26(2):101–107.
79. Gavala, H. N., I. V. Skiadas, N. A. Bozinis, and G. Lyberatos. 1996. Anaerobiccodigestion of agricultural industries wastewater.Water Science Technology34(11):67–75.
80. Borja, R., and A. Gonzalez. 1994. Comparison of anaerobic filter and anaerobiccontact process for olive mill wastewater previously fermented withGeotrichumcandidum. Process-Biochemistry29(2):139–144.
81. Georgacakis, D., and D. Dalis. 1993. Controlled anaerobic digestion of settled olive-oil wastewater.Bioresource-Technology46(3):221–226.
518 Effluent Treatment in Agroprocessing
82. Annesini, M. C., A. R. Giona, F. Gironi, and F. Pochetti. 1983. Treatment of oliveoil wastes by distillation.Effluent and Water Treatment Journal23(6):245
83. Amirante, P., and G. C. Di Renzo 1989. Impianti di concentrazione termicadelle acque reflue [Concentration plants for olive oil mill effluents]. Proceed-ings of International Seminar on Olive Oil Mill Effluents Purification, Lecce, pp.95–119.
84. Vigo, F., M. Giordani, and C. Campanelli. 1981. Ultrafiltrazione di acque di vege-tazione dei frantoi di olive [Olive oil mill effluents ultrafiltration].Rivista Italianadelle Sostanze Grasse2:70–73
85. Vigo, F., M. De Paz, and L. Avalle. 1983. Ultrafiltrazione di acque di vegetazionedi frantoi di Olive: Esperienza gestionale in impianto pilota. [Olive oil mill efflu-ents ultrafiltration: Management experiences on a pilot plant].Rivista Italiana delleSostanze Grasse5:267–271.
86. Massignan, L., P. De Leo, and C. Carrieri. 1985. Depurazione mediante osmosiinversa di acque reflue da oleifici [Purification of wastewater from olive oil mill,using reverse osmosis].Riv. Italiana di Scienze dell’Alimentazione14:421–428.
87. Amirante, P., and G. C. Di Renzo. 1989. Trattamenti di osmosi inversa e ultrafil-trazione [Reverse osmosis plants for olive oil mill effluents]. Proceedings of Inter-national Seminar on Olive Oil Mill Effluents Purification, Lecce, pp. 165–184.
88. Pieralisi, G. 1989. Impianti di concentrazione termica (Thermal concentration plantsfor OPE). Proceedings of International Seminar on Olive Oil Mill Effluents Purifi-cation, Lecce, pp. 121–145.
89. von Sperling, M. 1996. Comparison among the most frequently used system forwaste water treatments in developing countries.Water Science Technology33(3):59–72.
90. Iannelli, G. 1974. Il costo degli impianti di depurazione [Cost of the wastewatertreatment plants].Ingegneria Ambientale3:270–288.
Index
abscission, 256absorption refrigeration, 350acetylene, 364acidity, 501, 502acoustic-response, 262activated sludge, 478, 490, 491, 493, 494, 496,
510, 511adsorption, 479, 502aerated lagooning, 496aeration, 51–4
channels,seeductdouble-layer, 97, 98single-layer, 97, 98systems, 151
aeration controller, 53aerobic, 368aerobic processes, 477aflatoxin, 5aging, 434agroprocessing and utilization, 227, 228air
conditioned stores, 148conditioning, 109, 117–21outdoor, 101–2preheated, 101speed in channels, 112
air distribution system, 109, 111, 112, 113,114, 115, 117
airflow, 25, 61rate, 78, 461–3, 467–8resistance, 113–17uniform distribution of, 117
air velocity, 115air-flow distribution, 343aminocyclopropane carboxylic acid (acc), 284ammonium phosphate, 477anaerobic, 368anaerobic compensation point (acp), 281angle of repose, 472anthropometric data, 297aperture ratio, 117, 119apple, 369, 370apricot, 363–5, 367, 372aroma, 265Arrhenius-type equation, 73aseptic processing, 367Aspergillus Flavus, 5atmospheric modification (MA and CA
storage), 360auger, 14
axial-flow fan, 27avocados, 364
bacteria, 275bag storage, 46–7bags, 99baking quality, 105, 122, 123bananas, 364, 365, 369, 372, 381batch-evaporators, 507Baume degrees, 421beans, 366beetroot, 370belt conveyor, 12–13belt press, 377berry fruits, 369bin-batch dryer, 35biodegradable, 476, 478, 480, 485biological treatment, 478, 490, 502, 507, 509,
510biosensors, 265black spots, 97, 102, 104, 122blanching, 362, 363, 377, 378blending, 435blue vein, 163blush, 264BOD5, 486, 493, 494, 499, 503breakage susceptibility, 4brix degrees, 421brix degrees refractive index, 261broccoli, 368browning, 278, 307, 311, 368bruise susceptibility, 310, 331bruising, 247, 309bucket elevator, 16–17bulb damage, 131bulb size and shape, 131, 132bulk compression, 401bulk density, 2–3, 12, 67, 471bulk storage, 47–54, 96, 112–13bulk stores
loading, 120risks with, 97
by-products, 477, 502
CA storage,seecontrolled atmosphere storagecacao seeds, 6cacao-bean drying, 65–6calcium, 286calcium carbide, 364canning, 362, 363, 367
519
520 Index
cantilever, 401capacitative measurements, 259carbon-dioxide, 75, 102, 476
production by potatoes, 103carbon/nitrogen, 481carrots, 70carton strength, 325cascade sorter, 301cassava, 372cassava-flour, 166, 167cauliflower, 368caves, 353, 384cell loader, 120cell packs, 323centrifugal fan, 27centrifugation, 476, 479, 499centrifuging, 427CFD, 87channels,seeductschemical composition, 82, 217, 218, 219chemical detergents, 476chemical treatment, 478, 479, 480chemical residues, 5–6, 247, 259chemical tests, 259chilled storage, 50–1chilling injury, 227, 275, 339, 383, 394–7chlorination, 478, 480chlorophyll, 264chutney, 370CIAT, 157cider, 369CIPC, 104citrus, 365–6claret wine, 419clarifiers, 373–4climacteric fruits, 283, 364closed plants, 481coagulation, 478coarse, 381coconut, 362, 364, 366, 370–1coconut oil, 370–1COD, 497, 503, 504, 505, 507, 509, 510, 511codlin moth, 247coefficient of restitution, 315coffee drying methods, 381, 458, 459–68coffee quality, 381, 458–9coffee storage, 381, 458, 468–70colloid mills, 373color index number, 105, 122, 257, 265, 394–7color sorters, 257, 263, 297, 394–7coloring
black, 122internal, 122
combination drying, 36, 466commercial maturity, 274complex-shaped products, 82composition, 498, 512
of major fruits, 245compost, 481compression loading, 314, 325compressive stress, 405compressor, 347computer
aided design, 83vision, 83
concentrate, 366concrete silos, 48concurrent-flow dryer, 38, 42condensation, 102, 108, 118
prevention of, 99, 120condensers, 347, 349conservation factors, 95consumer, 249contact area, 314contaminants, 244continuous-evaporators, 507control
actuators, 109differential, 109of diseases and pests, 193–5manual, 109minimum/maximum, 109postharvest diseases, 143process computer, 109thermostat, 109
control and design, 83controlled
atmosphere, 139, 140atmosphere storage, 49, 191, 281, 282, 342,
343, 356, 414, 416controlled ripening, 364–5convection, 106, 107convective mass transfer coefficient, 78conveyors, 11cookers, 377cool-down, 102–3, 110cooling, 82, 102, 103, 305, 351
installations, 102systems, 83unit, 118,seeequipment
coolstorage, 305cosmetic appearance, 247cottonseed, 370counterflow drying, 461, 462crates, 97crates stores, loading, 121

Index 521
creep, 403crib storage, 46crop losses, 291cross-flow dryers, 38, 39–40cross-sectional area, 112–3, 115crush, 421–3crushing, 421, 440cultural factors, 249, 388curing, 102, 126, 161, 188, 189, 220, 222, 287cushioning, 323cutting, 373cyanide, 166, 178cyclone chamber, 461
damage, 309, 316, 330Darcy’s law, 88degreening, 364–5decanting, 427decay, 394–7degree-day calculations, 265dehydratation, 80dehydrators, 378delayed light emission, 264density, 417desiccation, 363–4destemming, 422destructive tests, 251deterioration, 60, 61developing countries, 351, 381, 476, 512die, 399discharge coefficient, 114diseases and disorders, 226, 227disinfectants, 476dockage tester, 3dormancy, 104, 126, 127double shear, 400drainage, 423drenching, 295dry-bulb temperature, 21dryer control, 42dryeration, 35, 463–4drying, 65, 101, 363–4
and curing, 132drying models, 32drying rate, 29–31duct
airspeed in, 112, 113, 115aperture ratio, 117, 119design, 112–13, 115friction factor, 115half-round corrugated steel, 112triangular, 112
durian, 368–9
dunnage, 47dynamic loading, 402dynamic low pressure indenters, 262
eating quality, 274edible coatings, 368edible leathers, 365elastic modulus, 315, 416electrical conductivity, 258, 265electromagnetic radiation, 264electronic fruit, 332emissivity, 81energy, 461
loss, 103energy costs, 502engineering properties, 177ensiling process, 231enthalpy, 21, 102environmental conditions, 476, 483equal pressure channels, 112enzyme, 363, 368, 371–2equilibrium moisture content, 21–5, 470equipment, 109–20, 373–8
air-conditioning, 109, 117–20cell loader, 120cooling unit, 118fans, 109–11heaters, 117–18humidifiers, 118mixing valves, 109sensors, 109, 120transport line, 120
ergonomic factors, 264Ergun equation, 88, 116, 117ethephon, 365ethylene, 75, 190, 279, 280, 283, 339, 364ethylene production rate:, 416evaporation, 76, 108, 118, 479, 480, 490, 491,
507, 508evaporative cooling, 352evaporator, 346, 347, 371, 378, 379expansion valve, 346expeller, 371, 377extruder, 377–8extrusion cookers, 377–8
fan,seeequipmentspecific power consumption, 110working point, 110–11
feedstuff evaluation, 231fermentation, 369–70, 419, 429, 431, 432,
439, 458fiberglass insulation, 357

522 Index
field molds, 55fig, 372filter, 374–6filter beds, 490, 491, 493filtering, 436filtration, 478, 479, 484, 487, 488, 510, 511finite-element method, 82, 105finning, 426firmness, 79, 251, 394–7fixed-bed dryers, 63flavor, 252flocculation, 478, 501, 510floor
channels,seeductsfully slatted, 112
flotation, 476, 479, 500flour, 366flow
characteristic, 113resistance, 114–17resistance coefficient, 114–15
flow-along system, 97–9flow-through system, 97–9food safety, 244, 252forced convection, 84Fourier equation, 81fractional analysis, 232freeze-drying, 364freezing, 281, 362, 363freezing injury, 394–7freezing temperature, 416fresh tuber storage, 189, 190friction factor, 115friction losses, 112frost damage, 122frozen concentrate, 366fruit fly, 247, 320, 367fumigation, 58fungi, 275furnace, 461
gamma rays, 264gap stations, 115gari, 166, 167gas chromatographs, 259gas composition, 74–6gas exchange, 72genetic manipulation, 288geometrical model, 83glassiness, 123grade standard, 6–11
grading, grading machines (see alsosorting),297, 330, 385
grain, 381grain chiller, 50grain cleaner, 57grain deterioration, 60grain drying, 20grain handling, 11–20grain pests, 54–8grain quality, 1–11, 38grain storage, 46–58grain toxins, 5grains, 1grape, 369, 419grape pomace, 478grapefruit, 381gum production, 234
hail damage, 394–7halocarbon, 349handling, 127, 161handling damage, 306harvest index, 161harvesting, 127, 131, 160, 186, 187, 219, 273,
287, 291head gases, 265head yield, 4heat, 102
balance, 105capacity, 81, 86, 102, 106production by potatoes, 103–4, 107transfer, 80–3, 84, 107transfer coefficient, 81, 107transfer in potato stack, 106
heat exchanger, 367, 379heat load, 351heat and mass transfer, 84heat treatment, 363heater,seeequipmentheating phase, 104heavy metals, 475Hertz, 314high temperature/short time (htst) processing,
367high-altitude cooling, 353high-temperature dryer, 37, 62high-temperature storage, 139highway vans, 355history, 92–3holding period, 103–4homogenizers, 373horizontal storage, 48–9
Index 523
homogenizing, 435humidifiers,seeequipmenthumidity, 325, 343humidity ratio, 21hunter lab, 257hydrocooling, 280hydrogen sulphide, 477hygiene, 244
ice, 352IITA, 157illumination, 300image analysis, 303impact, 262, 306, 310, 312, 318, 323impact loading, 314in-bin counterflow dryer, 36in-bin dryer control, 37in-store drying, 33–7inductive measurements, 259information transfer, 387insects, 56–8insect damage, 394–7in-store drying, 33instrumented sphere, 332insulation, 354
thermal, 99iodine, 259iodine affinity, 234ionic exchange, 479ionizing radiation, 372irradiation, 193, 371–2iso 9000, 243, 266
jackfruit, 368–9jam, 370juice contents, 259juice extractors, 373juicing, 366jumble pack, 320
kernal damage, 3kettles, 378
labor, 389labor qualification, 512lagooning, 478, 491, 496latent damage, 307latent heat, 81layer drying, 34leather, 362legume, 369, 372lemons, 381
less-developed countries (ldc’s), 292, 382lettuce, 367, 368lighting, 264, 355, 385listeria, 368long-term storage, 103low pressure indenters, 262low-cost structures, 222low-temperature drying, 34–5, 60low-temperature storage, 138Lye-solution treatment, 362
machine vision, 264magnetic resonance imaging, 265maize, 7management, 387mango, 362, 364, 365, 369, 370, 372marine containers, 356mass transfer, 76, 84, 108mass transfer coefficient, 78maturation, 274maturity, 127, 186, 219, 249, 265, 394–7mechanically ventilated, 96mechanical damage, 127, 159mechanical humidifiers, 344metabolic activity, 126methane, 477, 507microbial contamination, 247microorganisms, 362, 369, 476, 478, 502, 507milling, 448milling quality, 6minerals, 243minimal processing, 367–9minor constituents, 125mixed-flow dryer, 38, 40–42mixing valves, 109mixing room, 118modeling, 84–7modified atmosphere (MA), 281, 359modified atmosphere packages, 288, 367moisture, 76
balance, 106conductivity, 80content, 1, 72, 167, 229, 230, 260loss, 103, 108, 481
moisture ratio, 45mold, 5, 55, 56morphology, 157, 204must, 423, 431, 441mycotoxins, 5, 55, 56
natural air drying, 467natural coffee, 458, 460
524 Index
natural convection dryer, 63–5near-infrared reflectance (NIR), 264nectars, 367night cooling, 352nitrates, 476, 477non-climacteric, 283non-destructive testing methods (NDT), 261nuclear magnetic resonance, 265nutritional properties, 170, 174, 200, 203nutritional value, 125, 159, 216, 217, 218, 219nysius, 247
oil, 366, 370, 371, 372, 376olive, 446olive oil, 370, 446olive-oil processing, 498onions, 71, 370, 372oranges, 381organic fertiliser, 476organic load, 477, 482, 492, 493, 494, 497,
498, 501, 502, 503, 507, 509, 511organic matter, 475, 476, 481, 482, 485, 486,
491, 501, 502osmotic potential, 79oxygen, 74, 102, 476, 477, 481, 491, 493, 496,
503, 507ozonation, 478ozone, 349
packaging, 131, 133, 134, 161, 188, 189, 318,323, 362, 367, 378, 372, 384
packed bed, 88packhouse, 221packing shed, 293palletization, 305, 329pallets, 325palm oil, 370, 371papaya, 362, 364, 368, 369, 370, 372paper pulp trays, 320, 321parallel shear, 400partial differential equations, 86particle size distribution, 207pastes, 365pathogens, 260, 475, 478pathological effects, 275pattern packing, 320pea tenderometer, 254peanut, 370peach, 362, 363, 367pears, 364, 369peg tray, 320penetrometer, 253, 318, 359
permeabilityκ, 88pests and diseases, 194pH, 478, 485, 490, 501, 505phases, 100phloem, 71phosphates, 476, 477physicochemical properties, 170, 174, 201,
203physiological maturity, 274pickles, 370pineapple, 363pink wine, 419plant costs, 480, 512plate heat exchanges, 379plate shear, 400pneumatic conveyors, 17–19poi, 228poisson’s ratio, 417poliphenols, 501polyphenol oxidase, 307, 368polyvinyl chloride, 135pomace, 420, 425, 441, 447, 452, 453porosity, 78, 85
of potato stack, 106porous media, 87postharvest decay, 227postharvest diseases, 143postharvest handling, 188postharvest losses, 159, 160, 185, 217, 224,
291, 382potato, 92–3, 96, 362, 372
baking color index, 122conservation factors, 95defects in, 122density, 106dormancy, 103, 104glassiness, 122heat capacity, 106heat production, 103–104, 105history of, 92internal coloring, 122main food crop, 92product groups, 93production, 93, 94, 95, 107quality, 97, 105, 121–3quality loss, 93, 102, 104storage,seestorageunderwater weight, 123yield, 94–5
powder burn, 122precooling, 295pre-sorting, 297
Index 525
pre-treatment operations, 478precipitation, 478preharvest factors, 286prepacks, 136press, pressing, 424, 426, 375, 376pressure drop, 471–2pressure
dynamic, 113, 115loss, 112static, 110, 115static gain, 115
pressure test,seepenetrometer, 359primary settling tank, 490processed food, 228processing equipment, 175processing into jams, pickles, chutneys and
sauces, 369protein quality, 217proximate composition, 179prunes, 23, 24, 362, 364psychrometrics, 20psychrometrics chart, 22pulping, pulped coffee, 458pulse technique, 402punch, 400purees, 365
Q10-value, 73quality control, 267, 304quality factors, 249, 394quality index, 122quality loss, 93, 102, 103, 104, 383quality loss,seepotato quality lossquality standards, 89–90, 127, 387quality-assurance, 266quality-inspection, 121–3quarantine, 244quasi static loading, 313quasi static low-pressure indenters, 262
racking, 444radiation, 81rail cars, 355ram press, 376rapeseed, 370reconditioning, 105recycled sludge ratio, 494recycling, 490, 493, 496, 499, 511red wine, 419, 429, 430, 431refractometer, 258refrigerant, 345, 349refrigerated storage, 224, 225, 227
refrigeration, 344, 431, 436refrigeration load calculations, 351relative humidity, 21, 79, 416removal of free water, 101–2renewable energy source, 234resistance coefficient, 114–15resonance, 402, 405respiration, 71–6, 103
heat, 102–3rates, 126, 127, 201, 203, 265, 279, 281
retailing, 305retention time, 491, 493retorts, 379reverse osmosis, 479, 480, 509, 510reversed-direction air-flow drying, 464–6Reynolds number, 88rheological properties, 170, 174, 205, 207,
209, 210rice, 8, 381rigid containers, 135ripeness, ripening, 274, 364rodents, 58roller press, 376–7rolling resistance, 176roof bin-batch dryer, 36roof cladding, 386room
mixing, 105, 118pressure, 105, 113, 118storage, 105
roots crop quality, 69–90roots maturity, 160rotary-drier, 511round bins, 48rubbing, 320
safety, 361salinity, 501salmonella, 367sauces, 369–70scabies, 122screens, 488, 489screw conveyor, 14–16screw press, 377seed potato, 97senescence, 278sensors,seeequipment, 109, 120–21, 344
placing of, 120sensory attributes, 252shear, 400shell-and-tube heat exchangers, 379shredding, 373

526 Index
shriveling, 319silos, 48simultaneous heat and mass transfer, 81singulating, 301, 330size-reduction units, 373sizing, 385skin resistance, 76slicing, 373sludge, 476, 478, 479, 480, 490, 491, 493,
494, 496, 497, 503, 504, 505, 507, 508,510, 511
soaking, 372soft-sense, 262solanum, 92solar, 459solar drying, 364solar heat load, 99soluble solids, 258, 394–7solvent 366, 371sonic tomography, 263sorting and grading, 133, 297, 302soybeans, 9, 366, 370, 372soybean oil, 371sparkling wine, 432specific energy requirement, 462–3, 465specific gravity, 417specific heat, 66–7, 471specific power consumption, 110specific volume, 21sphere, 399spinach, 362spray certificates, 295sprout control, 122sprout inhibitors, 102–4sprouting, 104, 126, 143, 190, 191, 192, 222stabilization, 434stack porosity, 85stack resistance, 116stacking, 136staff training, 330stake treatment, 164standards, 266starch, 261starch grains, 175, 228starch test, 259static pressure, 26–7, 110static gain, 115steam consumption for concentration, 508sterilizers, 379stir drying, 34stirring interval, 64
stolon, 92storage in bags, 99storage, 69, 279, 339, 384, 385
behavior, 70conditions, 102design, 69, 99, 100, 112disorders and diseases, 141, 163, 191environments, 162, 189equipment,seeequipmentlosses, 130, 224objectives of, 93of root crops, 69phases in, 100, 104–5structures, 144, 165, 195systems, 96
storage building, 353storage of fresh fruits and vegetables, 406storage molds, 55storage temperature, 383, 416storage in crates, 113strain, 404strawberry, 372stress, 405stress cracks, 4stripping, 479suberization, 102sugars, reducing, 123sulphates, 476, 477sulphur dioxide, 485sun drying, 32–3, 60–2, 459–60sunburn, 394–7sunflower seed, 370sweet potato, 71sweetening, 105swelling capacity, 178swelling power, 207, 208syrup production, 234system curve, 27
tangerine, 381tare, 122taste panel, 249, 266tea, 381temperature, 73–4, 339, 383, 476, 481, 487,
488, 491, 504, 510temperature sensors, 120tempering, 37, 42tenderness, 394–7terace filling, 120tertiary treatment, 480test weight, 2
Index 527
texture, 76, 247, 248, 394–7texture analysers, 254, 262thermal conductivity, 66, 67, 81, 82thermal diffusivity, 67thermal insulation, 99thermophysical properties, 151, 170, 174,
205thin-layer drying equation, 33, 67, 470tobacco, 381tomato, 364, 365, 370, 372torsion, 400torsion pendulum, 401total quality management, 268toxic and indigestible substances - removal,
372toxins, 246transient loading, 402transition temperature, 206transmittance, 264transpiration, 76–8transport line, 120transportation, 293, 305, 320, 323trench silo, 230tropical fruits, 368tuber, 71, 92tuber dormancy, 191tuber geometry, 176tuber yield, 188turgor, 331, 394–7turgor potential, 79twist tester, 255
U-value, 99ultrafiltration, 479, 509underground storage, 353underground structures, 197underwater weight,seepotatounit operations, 169, 373–8urethane foam, 357
vacuum cooling, 280vapor
barrier, 99, 357pressure-deficit, 101
vascular streaking, 163ventilated
storage, 224stores, 146, 384
ventilationefficiency ratio, 110horizontal, 96mechanical, 96natural, 96, 111rate, required, 110vertical, 96wall, 113
vertical storage, 47viability, 4vibrational characteristics of fruits and
vegetables, 263vibrations, 324vinegar, 369, 370viscosity, 208, 210vitamins, 243, 382volume reduction, 471
Warner Bratzler tester, 256washing, 296washed coffee, 458waste, 381, 475, 476, 477, 478, 479, 482, 503,
504, 507waste-disposal, 385wastewater, 247water dump, 296water loss, 76–80, 126water saving, 487waxing, 296weight loss, 159, 185, 190, 203, 205, 311well water, 352wet-coil heat exchanger, 344wet-bulb temperature, 21wheat, 10, 381white wine, 419, 430, 431windrowing, 133wine, 381, 419wine tanks, 443wounding, 73wound healing, 102wrapping, 319
x-rays, 264xylem, 71
yam barn, 196yam flake, 200yeast, 430