Embed Size (px)
DESCRIPTION
Reconvergent Fanout Analysis of Bounded Gate Delay Faults. Master’s Defense. Hillary Grimes. Thesis Advisor: Dr. Vishwani D. Agrawal. Thesis Committee: Dr. Victor P. Nelson and Dr. Charles E. Stroud. Dept. of ECE, Auburn University Auburn, AL 36849. Outline. Background - PowerPoint PPT Presentation
Citation preview
1
Reconvergent Fanout Analysis of Bounded Gate
Delay Faults
Dept. of ECE, Auburn University
Auburn, AL 36849
Master’s DefenseHillary Grimes
Thesis Advisor: Dr. Vishwani D. AgrawalThesis Committee: Dr. Victor P. Nelson and Dr. Charles E. Stroud

2
Outline
• Background
• Problem Statement
• Ambiguity Lists
Fault-Free Circuit Simulation
Detection Threshold Evaluation
• Experimental Setup
• Results and Discussion
• Conclusions
3
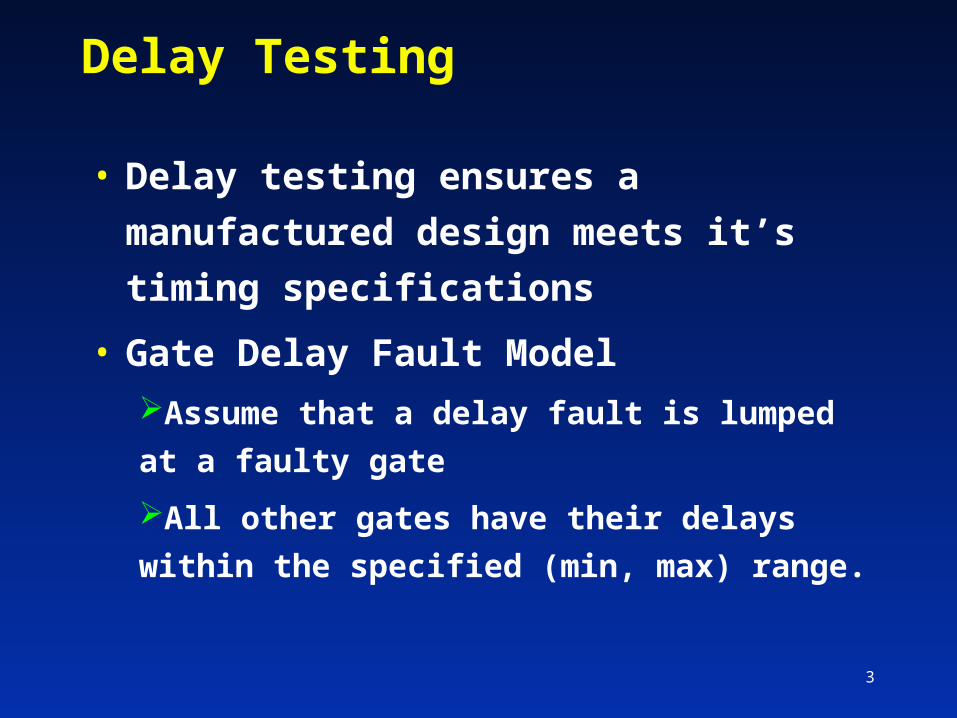
Delay Testing
• Delay testing ensures a manufactured
design meets it’s timing specifications
• Gate Delay Fault Model
Assume that a delay fault is lumped at a faulty
gate
All other gates have their delays within the
specified (min, max) range.

4
A Gate Delay Test
• A delay test consists of a vector pair
First vector (V1) initializes the circuit
Second vector (V2) produces the required
transitions
• For a slow-to-rise gate delay fault:
V1 – places a logic 0 at the fault site
V2 – stuck-at-0 test for the same fault site
5
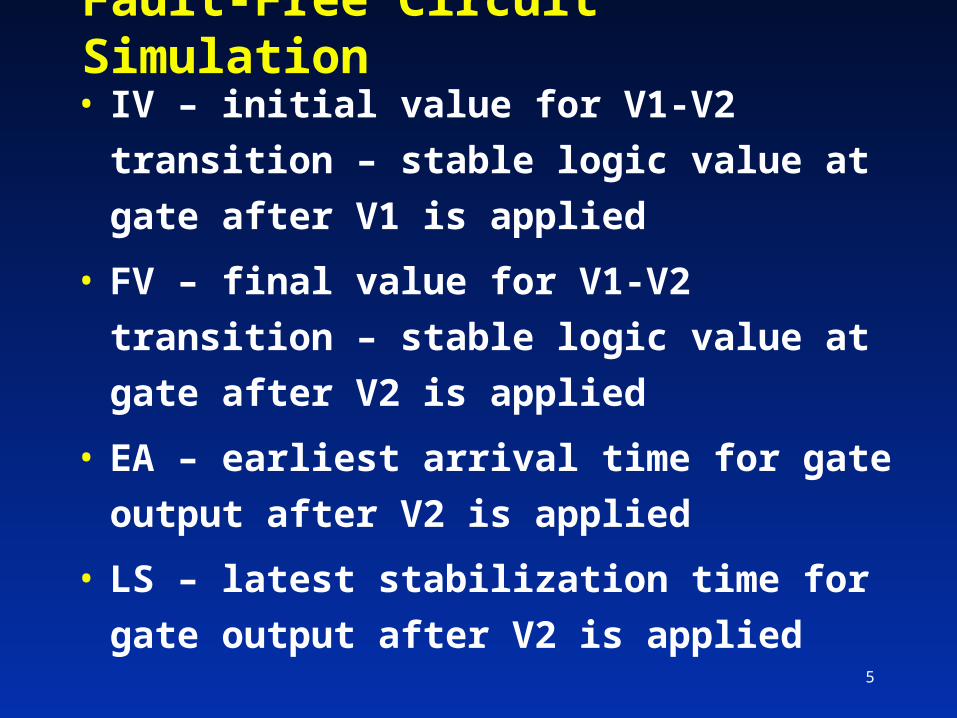
Fault-Free Circuit Simulation
• IV – initial value for V1-V2 transition – stable
logic value at gate after V1 is applied
• FV – final value for V1-V2 transition – stable
logic value at gate after V2 is applied
• EA – earliest arrival time for gate output
after V2 is applied
• LS – latest stabilization time for gate output
after V2 is applied

6
Fault-Free Circuit Simulation
1,31,31,3
1,31,31,3
1,2 1,2
1,2
3,4
1 3
2 5
3 5
5 9
4 11
0
1 1
EA = 5 LS = 9
IV = 1
FV = 0
EA = ∞LS = -∞
EA = 0LS = 0

7
Faulty Waveforms
• Faulty Propagating Value - FPV
Signal’s logic value in the presence of a stuck-
at-IV fault at the fault site
• Propagates the fault’s logic effect through
the circuit
• Used to determine whether or not a delay
fault of any size (transition fault) is
detected
8
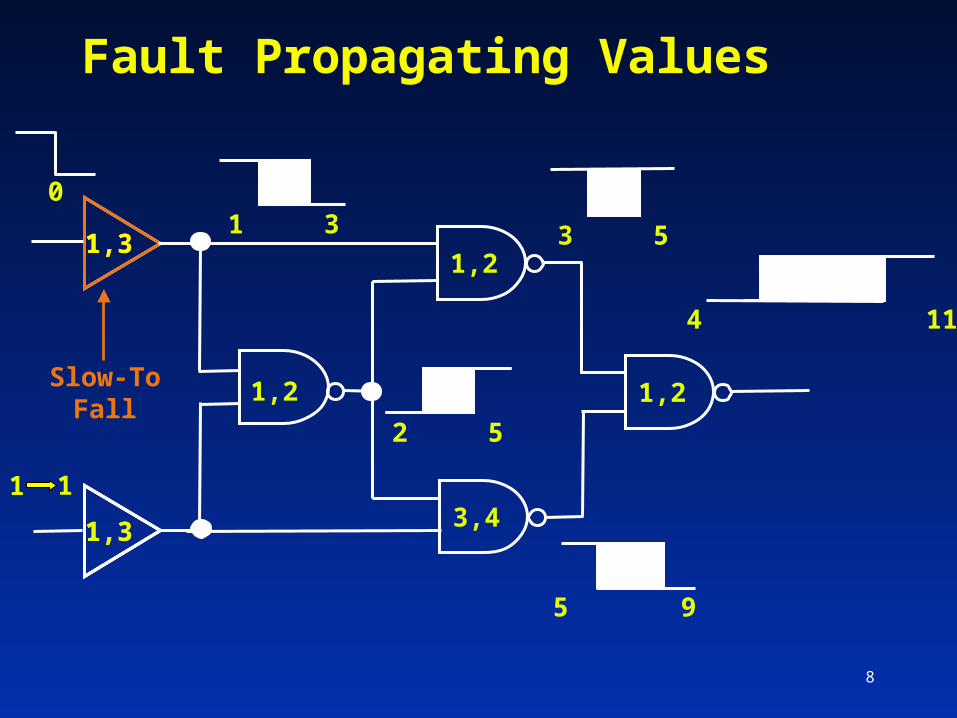
Fault Propagating Values
1,31,31,3
1,31,31,3
1,2 1,2
1,2
3,4
2 5
3 5
5 9
4 11
0
1 1
Slow-ToFall
1 3

9
Fault Propagating Values
1,31,31,3
1,31,31,3
1,2 1,2
1,2
3,4
1 3
2 5
3 5
5 9
4 11
0
1 1
FPV = 0
FPV = 1
FPV = 1
FPV = 1
FPV = 1
FPV = 0
FPV ≠ FV
Assuming the delayfault size is large
enough, it is detected
10
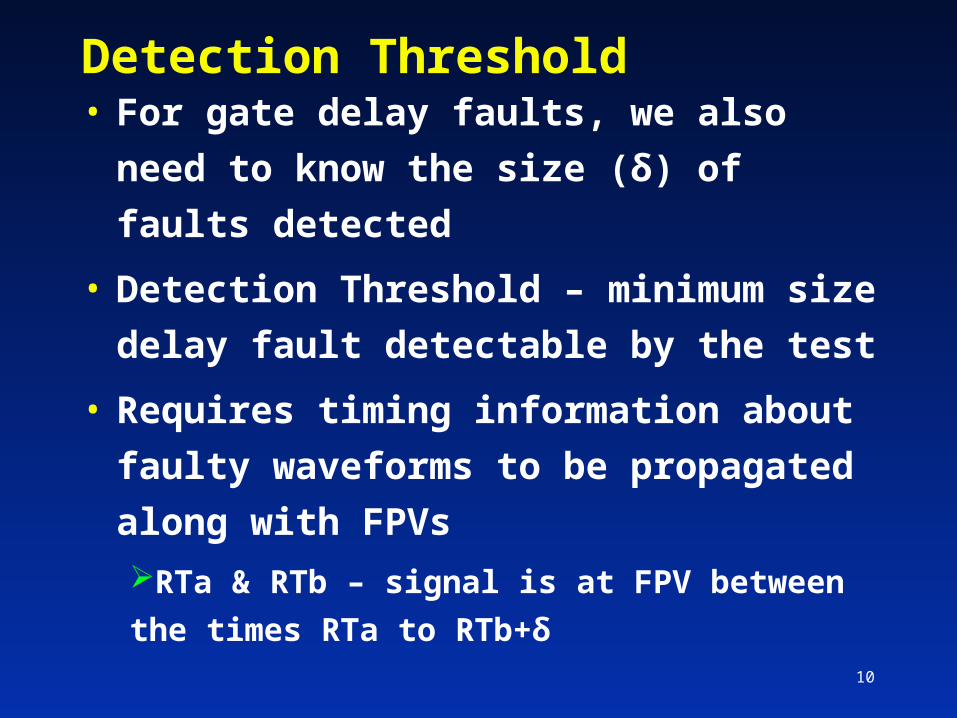
Detection Threshold
• For gate delay faults, we also need to
know the size (δ) of faults detected
• Detection Threshold – minimum size delay
fault detectable by the test
• Requires timing information about faulty
waveforms to be propagated along with
FPVs
RTa & RTb – signal is at FPV between the times
RTa to RTb+δ
11
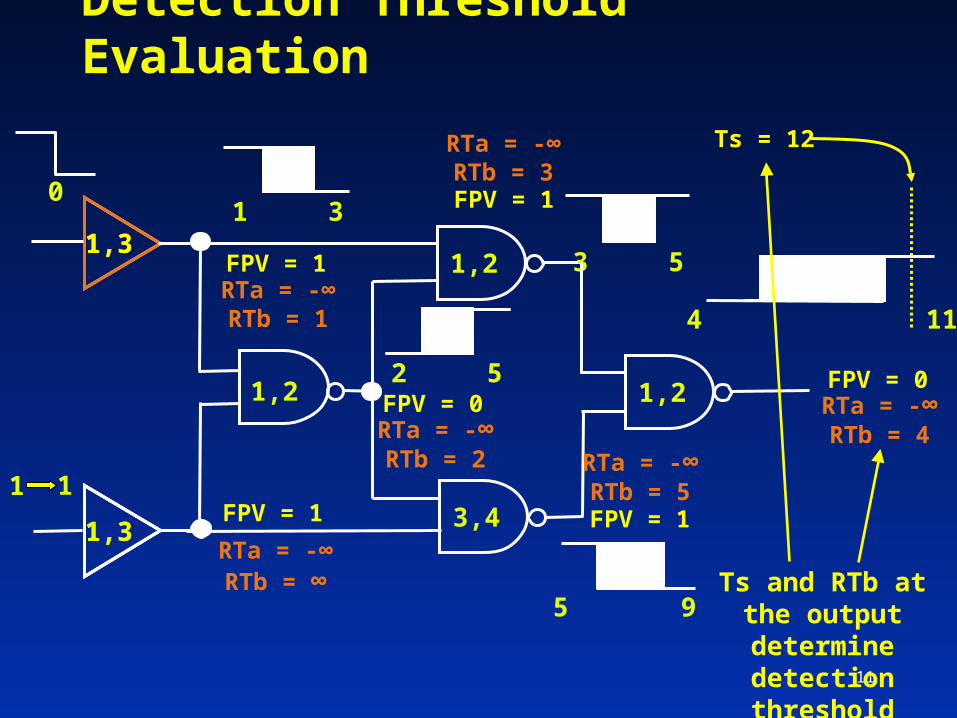
Detection Threshold Evaluation
1,31,31,3
1,31,31,3
1,2 1,2
1,2
3,4
1 3
2 5
3 5
5 9
4 11
0
1 1
FPV = 1
FPV = 1
FPV = 0
FPV = 1
FPV = 1
FPV = 0
Ts = 12
RTa = -∞RTb = 1
RTa = -∞RTb = ∞
RTa = -∞RTb = 2
RTa = -∞RTb = 3
RTa = -∞RTb = 5
RTa = -∞RTb = 4
Ts and RTb at the output determine
detection threshold

12
Detection Threshold Evaluation
FPV = 0RTa = -∞RTb = 4
4 11
Ts = 12
Detection Threshold = 8
• The output signal is at FPV between times
RTa (RTb+δ): -∞ (4+δ)
• Detection Threshold is Ts – RTb: (12-4)=8
Fault detected if it’s size is greater than 8:
δ > 8
13
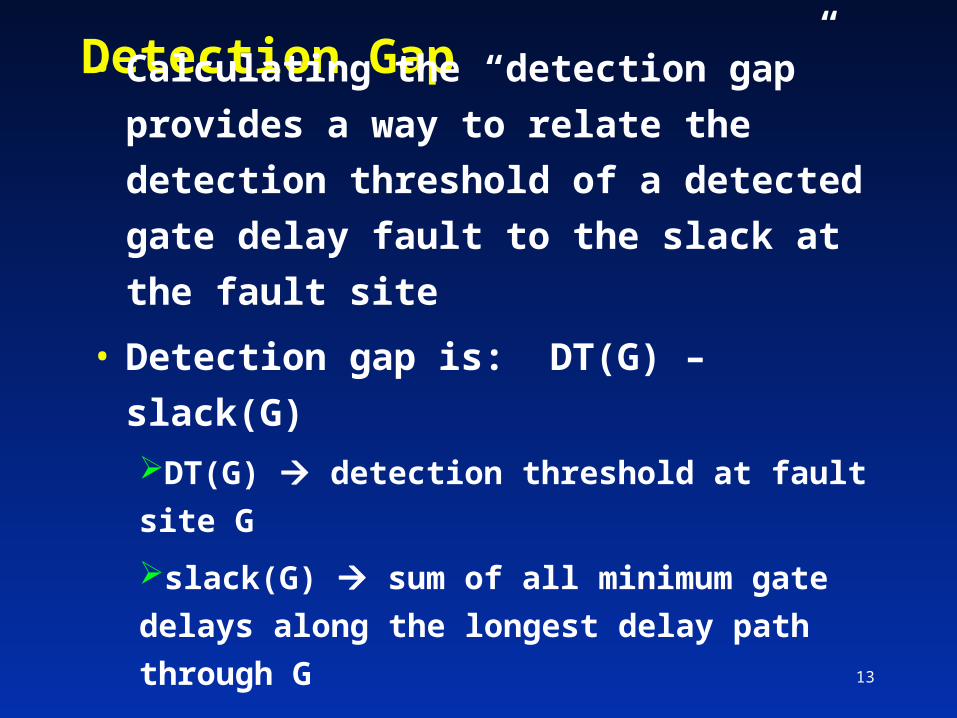
Detection Gap
• Calculating the “detection gap” provides a
way to relate the detection threshold of a
detected gate delay fault to the slack at
the fault site
• Detection gap is: DT(G) – slack(G)
DT(G) detection threshold at fault site G
slack(G) sum of all minimum gate delays
along the longest delay path through G

14
Detection Gap
• The smaller the detection gaps are for a
set of vectors, the better quality that set
provides for detecting gate delay faults
• If a test detects a fault with gap = 0:
The smallest possible gate delay fault has been
detected
• If detection gap > 0:
There is a possibility a better test exists to
detect the fault with a smaller threshold
15
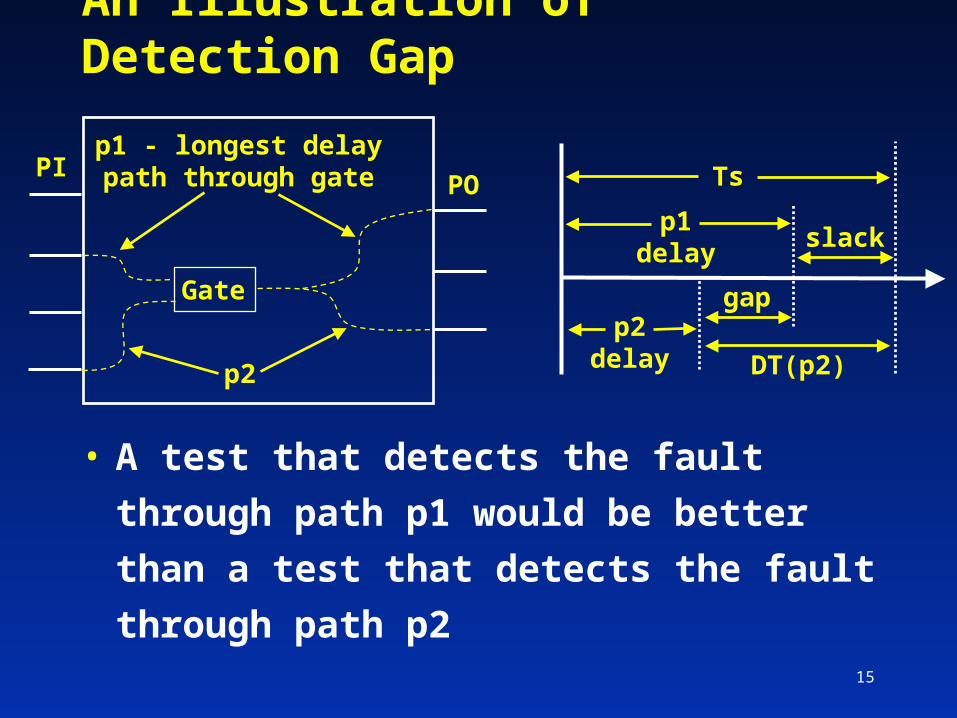
An Illustration of Detection Gap
• A test that detects the fault through path
p1 would be better than a test that detects
the fault through path p2
PIPO
p1 - longest delaypath through gate
p2
Gate
Ts
p1delay
p2delay
gap
DT(p2)
slack
16
Problem Statement
• When signals produced by a common
fanout point reconverge, the inputs to the
reconvergent gate are correlated
• Conventional simulation ignores this
correlation when bounded gate delays are
used
Produces pessimistic results in both bounded
delay simulation and gate delay fault simulation
17
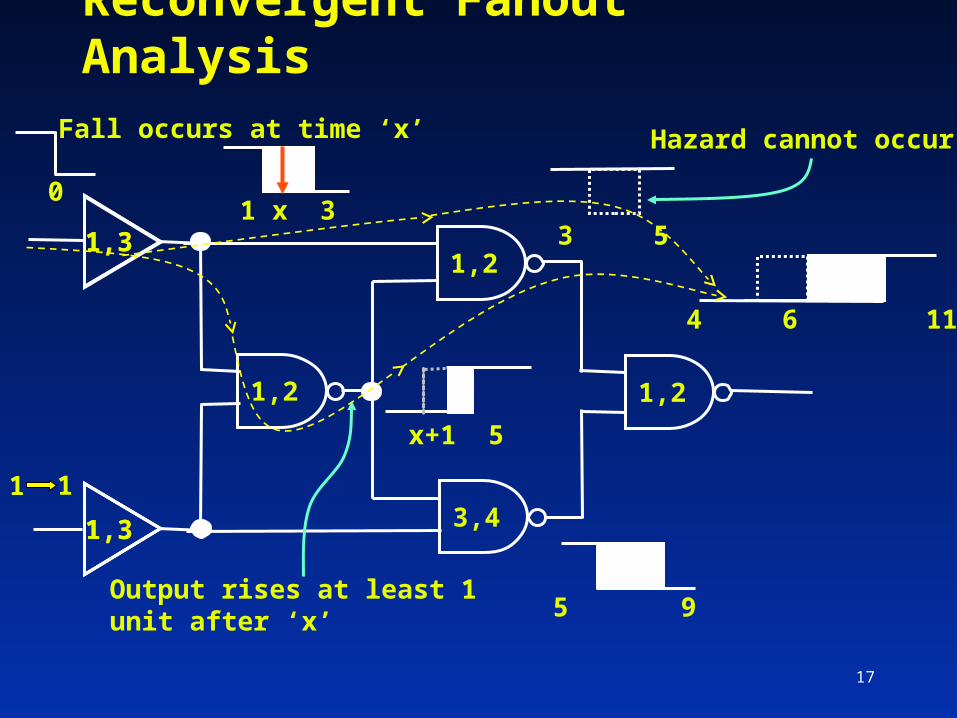
Reconvergent Fanout Analysis
1,31,31,3
1,31,31,3
1,2 1,2
1,2
3,4
1 x 33 5
5 9
4 6 11
Fall occurs at time ‘x’
x+1 5
Output rises at least 1 unit after ‘x’
Hazard cannot occur
0
1 1

18
Correct Detection Threshold
FPV = 0RTa = - ∞RTb = 6
Ts = 12
Detection Threshold = 6
• The output signal is at FPV between times
RTa to RTb+δ
• In an accurate analysis, RTb=6, not 4
Fault detected if it’s size is greater than 6:
δ > 6
4 6 11
19
Ambiguity Lists
• Ambiguity Lists generated at fanout points
contain
originating fanout name
ambiguity interval – min and max delays from
fanout to gate
• Ambiguity lists at the inputs of a
reconvergent gate help determine its output
20
Ambiguity Lists
• List propagation is similar to fault list
propagation in concurrent fault simulation
• For accurate detection threshold evaluation,
ambiguity lists are propagated during both
fault-free and faulty waveform calculations
21
Ambiguity Lists – Fault-Free Circuit
• Ambiguity lists propagated through all
gates during fault-free circuit simulation
• If signal correlations are such that no
hazard can occur, the hazard is
suppressed: (EA = ∞) & (LS = -∞)
• Otherwise, the ambiguity lists are
propagated to the gate’s output, and
ambiguity intervals are updated

22
Fault-Free Circuit Simulation
1,31,31,3
1,31,31,3
1,2 1,2
1,2
3,4
1 3
2 5
5 9
0
1 1
EA = 1LS = 3
EA = ∞LS = -∞
EA = 2LS = 5
EA = 5LS = 9
EA = 6LS = 11
EA = 0LS = 0
EA = ∞LS = -∞
3 5
4 6 11
EA = ∞LS = -∞
23
Ambiguity Lists – Detection Threshold Evaluation
• Ambiguity lists propagated through
downcone of the fault site
• If signal correlations are such that no
hazard can occur, the hazard is
suppressed: (RTa = -∞) & (RTb = ∞)
• Otherwise, the hazard lists are propagated
to the gate’s output, and ambiguity
intervals are updated
24
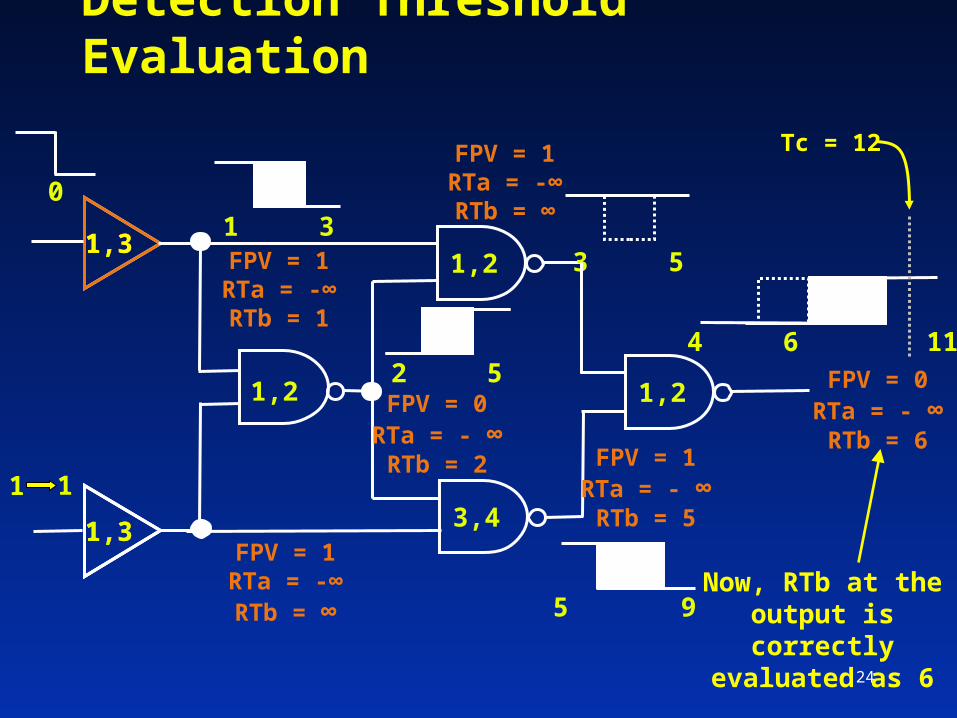
Detection Threshold Evaluation
1,31,31,3
1,31,31,3
1,2 1,2
1,2
3,4
1 3
2 5
3 5
5 9
0
1 1
FPV = 1RTa = -∞RTb = 1
FPV = 1RTa = -∞RTb = ∞
FPV = 0RTa = - ∞RTb = 2 FPV = 1
RTa = - ∞RTb = 5
FPV = 1RTa = -∞RTb = ∞
FPV = 0RTa = - ∞RTb = 6
4 6 11
Tc = 12
Now, RTb at the output is correctly
evaluated as 6
25
Experimental Setup• C program implemented to perform gate
delay fault simulation on combinational
circuits
• Simple wireload model used for gate
delays
Bounded delays set to (3.5n ± 14%), where n is
the number of fanouts
Program can accept any available gate delay
data, which may be normally available from
process technology characterization

26
Experimental Setup
• Program inputs
Netlist in bench format
Vector file
• Program outputs for vector set
Average detection gap of detected gate delay
faults
Fault coverage of faults detected with gap ≤ 3.5
27
Experiment A
• Gate delay fault simulation 1,000
vectors
• Ambiguity lists propagated during faulty
waveform calculations only
• Average detection gap and fault coverage
of faults detected with gap ≤ 3.5 (nominal
gate delay) recorded
28
Experiment A
• For fault coverage, faults are counted as
detected if they are detected:
though the longest path through the gate
through a path which is less than the longest
path by only one gate delay

29
Results: Experiment A
Without Reconvergent
Fanout Analysis
With Reconvergent
Fanout Analysis
Circuit
Average
Detection
Gap
Faults
Detected with
Gap ≤ 3.5
Average
Detection
Gap
Faults
Detected with
Gap ≤ 3.5
c432 99.7 8.83% 98.0 8.83%
c499 36.5 5.69% 35.4 5.69%
c880 19.3 43.69% 17.0 43.92%
c1355 51.3 3.80% 47.8 6.31%
c1908 57.0 15.85% 51.9 17.66%
c2670 40.5 28.78% 29.9 31.70%
c3540 54.1 20.07% 49.1 17.49%
c5315 24.8 42.59% 8.2 46.79%
c7552 41.0 11.46% 24.8 20.26%
30
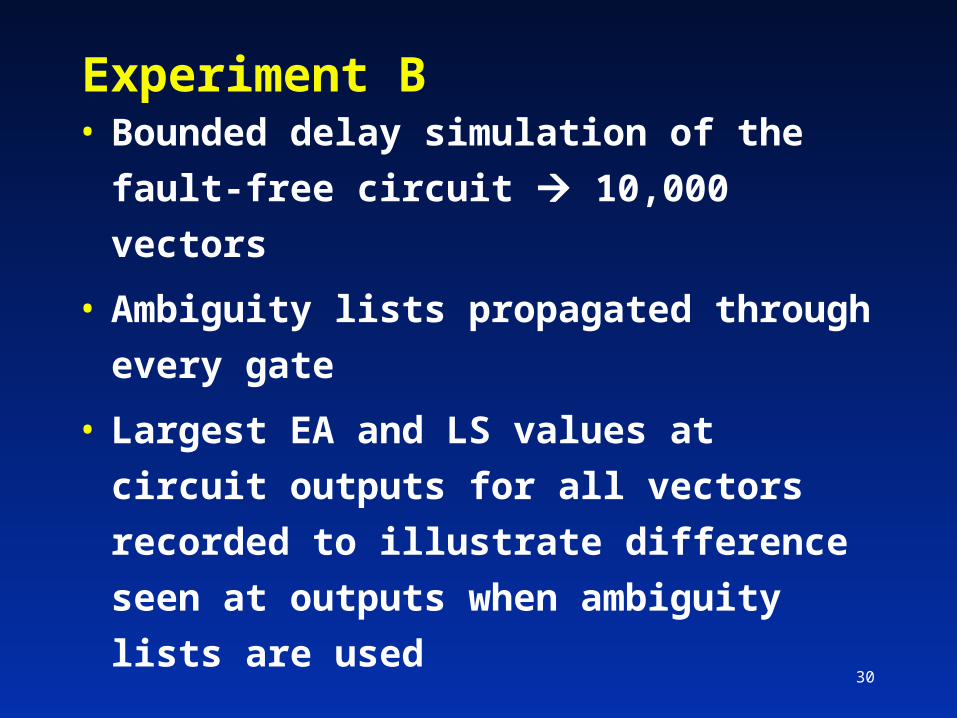
Experiment B
• Bounded delay simulation of the fault-free
circuit 10,000 vectors
• Ambiguity lists propagated through every
gate
• Largest EA and LS values at circuit
outputs for all vectors recorded to
illustrate difference seen at outputs when
ambiguity lists are used

31
Results: Experiment B
Without Reconvergent
Fanout Analysis
With Reconvergent
Fanout Analysis
Circuit Largest EA Largest LS Largest EA Largest LS
c3540 96.0 204.0 121.6 196.8
C5315 76.8 204.0 91.2 194.4
C6288 158.4 576.0 236.8 504.0
C7552 91.2 204.0 104.0 201.6
• Using reconvergent fanout analysis generally
results in larger EA and smaller LS values at
outputs
• More apparent for circuits that contain a large
number of reconvergent fanouts, such as in
multiplier circuit c6288
32
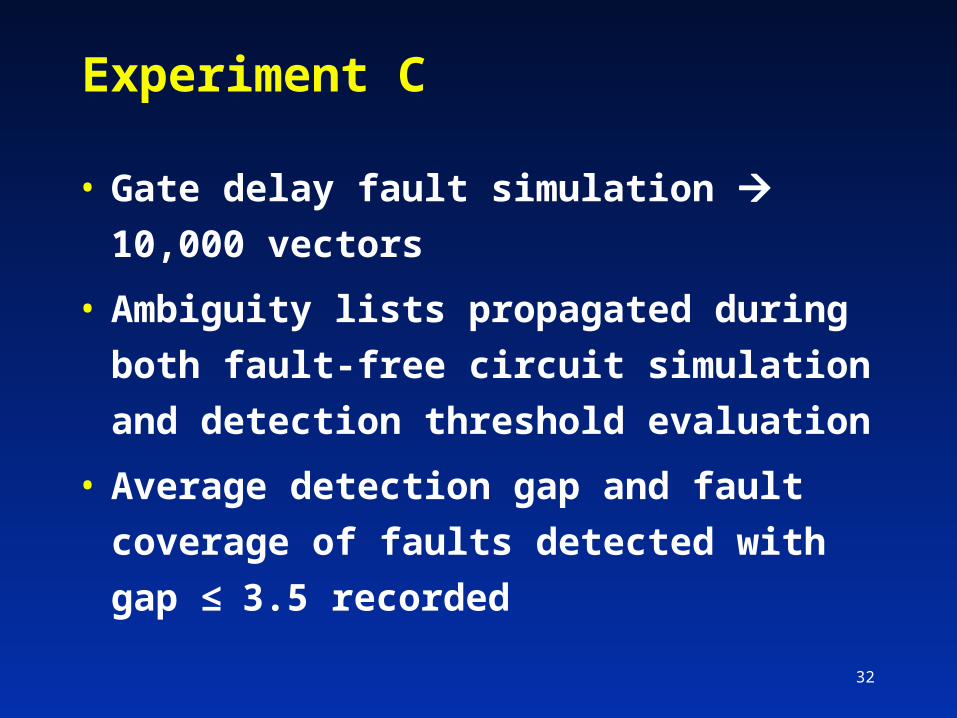
Experiment C
• Gate delay fault simulation 10,000
vectors
• Ambiguity lists propagated during both
fault-free circuit simulation and detection
threshold evaluation
• Average detection gap and fault coverage
of faults detected with gap ≤ 3.5 recorded
33
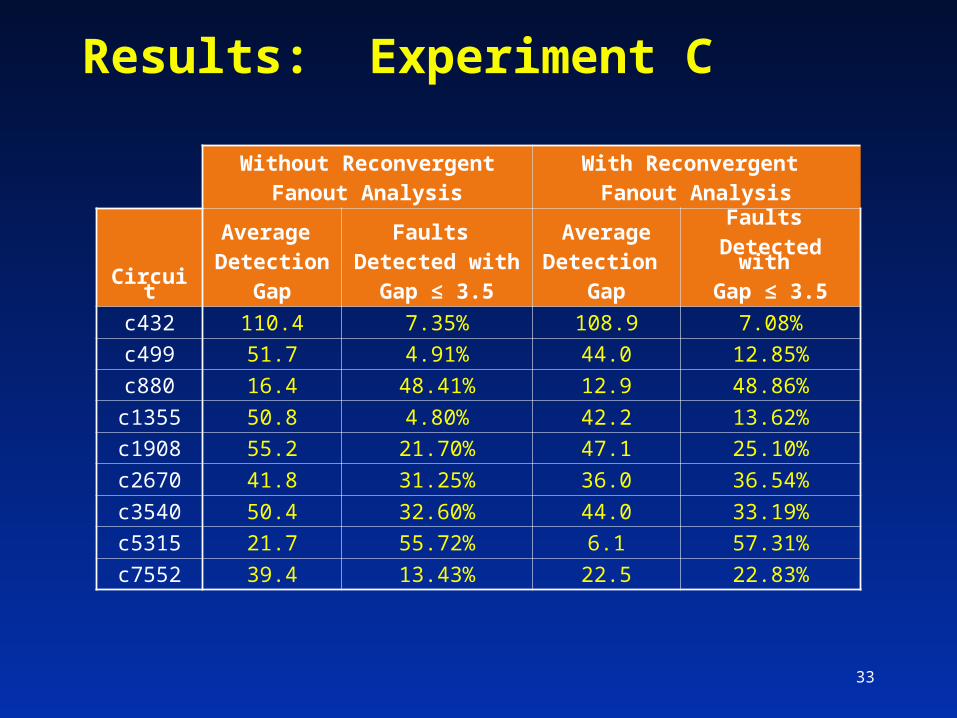
Results: Experiment C
Without Reconvergent
Fanout Analysis
With Reconvergent
Fanout Analysis
Circuit
Average
Detection
Gap
Faults
Detected with
Gap ≤ 3.5
Average
Detection
Gap
Faults
Detected with
Gap ≤ 3.5
c432 110.4 7.35% 108.9 7.08%
c499 51.7 4.91% 44.0 12.85%
c880 16.4 48.41% 12.9 48.86%
c1355 50.8 4.80% 42.2 13.62%
c1908 55.2 21.70% 47.1 25.10%
c2670 41.8 31.25% 36.0 36.54%
c3540 50.4 32.60% 44.0 33.19%
c5315 21.7 55.72% 6.1 57.31%
c7552 39.4 13.43% 22.5 22.83%

34
Discussion
• When reconvergent fanout analysis is
used, the average detection gap is smaller
and more faults are detected with smaller
gaps
• To accurately evaluate detection
thresholds, signal correlations must be
considered in both fault-free waveform
and faulty waveform calculations
35
Conclusion
• Propagating ambiguity lists during simulation
provides useful information about signal
correlations due to reconvergent fanouts
• The use of this information during both fault-
free and faulty waveform calculations
produces more accurate results for gate delay
fault simulation
• This min-max delay simulator has found
application in hazard-free delay test generation
36
Future Work
• During simulation, ambiguity lists can grow
quite large
Efficiency in list propagation needs to be
improved
• Can information provided by propagating
ambiguity lists help reduce pessimism in
static timing analysis?
37
Publications related to this work
• S. Bose, H. Grimes and V. D. Agrawal, “Delay Fault
Simulation with Bounded Gate Delay Model”, in Proc.
IEEE International Test Conference, paper 26.3, 2007.
• H. Grimes and V. D. Agrawal, “Analyzing Reconvergent
Fanouts in Gate Delay Fault Simulation”, in Proc. 17th
IEEE North Atlantic Test Workshop, May 2008.

38
Thank You