Embed Size (px)
Citation preview

Reasoning with Concept Diagrams aboutAntipatterns in Ontologies⋆
Zohreh Shams1, Mateja Jamnik1, Gem Stapleton2, and Yuri Sato2
1 Computer Laboratory, University of Cambridge, Cambridge, UK{zohreh.shams, mateja.jamnik}@cl.cam.ac.uk
2 Visual Modelling Group, University of Brighton, Brighton, UK{g.e.stapleton, y.sato}@brighton.ac.uk
Abstract. Ontologies are notoriously hard to define, express and reasonabout. Many tools have been developed to ease the ontology debuggingand reasoning, however they often lack accessibility and formalisation. Avisual representation language, concept diagrams, was developed for ex-pressing ontologies, which has been empirically proven to be cognitivelymore accessible to ontology users. In this paper we answer the questionof “How can concept diagrams be used to reason about inconsistenciesand incoherence of ontologies?”. We do so by formalising a set of infer-ence rules for concept diagrams that enables stepwise verification of theinconsistency and incoherence of a set of ontology axioms. The designof inference rules is driven by empirical evidence that concise (merged)diagrams are easier to comprehend for users than a set of lower leveldiagrams that are a one-to-one translation from OWL ontology axioms.We prove that our inference rules are sound, and exemplify how they canbe used to reason about inconsistencies and incoherence.
1 Introduction
Ontologies are sets of statements that represent individuals, classes and theirproperties, typically expressed using symbolic notations such as description log-ics (DL) [3] and OWL [1]. Although ontologies are widely used for knowledgerepresentation in domains involving diverse stakeholders, the languages they areexpressed in are often inaccessible to those unfamiliar with mathematical nota-tions. To address this shortcoming some ontology editors, such as Protege [2],provide visualisation facilities. Instead of using diagrams as an auxiliary toolto aid comprehension and accessibility, like in Protege, some have taken onestep further by using a logic that is fundamentally diagrammatic (e.g., [4, 7]).However, these diagrammatic notations are either informal [4] or do not fullyexploit the potential of formal diagrammatic notations (e.g., [7]). The design ofconcept diagrams [14] for expressing ontologies is based on cognitive theories ofwhat makes a diagrammatic notation accessible, in particular to novice users [5].Concept diagrams are extensions of Euler diagrams and, in addition to closedcurves for set representation, they use dots (spiders) and arrows for individualsand properties, respectively.
⋆ This research was funded by a Leverhulme Trust Research Project Grant (RPG-2016-082) for the project entitled Accessible Reasoning with Diagrams.

Similar to traditional logical systems, concept diagrams are equipped withinference rules which are used for specifying, reasoning and evaluating ontologies.Evaluating ontologies involves debugging them of inconsistencies and incoher-ence [12] before they can be published. These, so-called antipatterns, capture theunintended model-instances of an ontology [6, 9]. An inconsistent ontology is onethat cannot have any model and, so, entails anything [11], whereas an incoherentontology is one that entails an unsatisfiable (i.e., empty) class or property. Inother words, from an incoherent ontology we can infer that there exists a classor a property that is unsatisfiable (i.e., empty).
Empirical evidence proves that for incoherence checking, novice users notonly perform significantly better with concept diagrams than with OWL [1] orDL [3], but also that merging concept diagrams (corresponding to each ontologyaxiom) into a single diagram makes them easier for humans to reason with [13].This result coincides with cognitive evidence [18] that humans often mentallymerge the representations of axioms into one when checking for inconsistencyand incoherence.
In this paper, we formalise the use of concept diagrams for reasoning aboutinconsistencies and incoherence in ontologies by defining inference rules thatmerge axioms into a concise and cognitively more accessible concept diagram.We base our design of inference rules on empirical evidence that concise (merged)diagrams are easier to comprehend for users than a set of lower level diagramsthat express equivalent information [13]. We prove that our concept diagrams in-ference rules are sound and exemplify how they can be used to spot inconsistencyand incoherence.
This paper is organised as follows. In Section 2 we give an overview of thesyntax and semantics of concept diagrams, followed by Section 3 that introduceshow concept diagrams are reasoned with. In Section 4 we review the relatedwork and finally, we conclude in Section 5.
2 Concept Diagrams
This section presents the syntax and semantics of concept diagrams [19]. We startwith an example in Figure 1. This concept diagram has the following syntax andsemantic interpretation:– One dot – called a spider – which represents a named individual, Sara;– Two boundary rectangles (represented by ◻) each of which represents the
universal set.– Eight curves, representing eight sets, six of which have labels (e.g., People).
The two curves without labels represent anonymous sets. The spatial rela-tionships between curves and spiders within a boundary rectangle conveysemantics. For example, the syntax within the LHS rectangle says that Sarais in the set Children; Children is a subset of People; the sets Poeple andDrinks are disjoint; and Alcoholic drink set is a subset of Drinks.
– Shading (e.g., intersection of Alcoholic and the unlabelled curve inside Drink)which is used to place upper bounds on set cardinality: in a shaded region,all elements are represented by spiders. Since there are no element in thisparticular shaded region, the region is empty.
– Two arrows, one of which is solid and the other one is dashed. Arrows areused to convey semantics about binary relations, using their sources and

People
Sara
drinks
Drinks
AlcoholicChildren has 1
Ingredients
Sugar
Fig. 1: A concept diagram.
targets. A solid arrow asserts that things in arrow’s source are only relatedto things in arrow’s target under a certain relation (e.g., Children only drinkDrinks and only thoes Drinks that are not Alcoholic.). A dased arrow assertsthat things in arrow’s source relate to things in arrow’s target amongst otherthings. The dashed arrow here, is sourced on Drinks and targets an unlabelledcurve. This unlabelled curve, say c, represents a subset of Ingredients (whichcould be Sugar or some other Ingredients) to which members of Drinks arerelated under has relation. The dashed arrow’s annotation, ≥ 1, places aconstraint on set Drinks: all elements of Drinks must be related to at leastone element of c under has Relation.
2.1 Syntax
When using concept diagrams for ontology representation, ontology classes, indi-viduals in classes, and object properties, are respectively represented by curves,spiders and arrows. These require labels. Therefore, we start by defining threepairwise disjoint sets, LS (for identifying particular individuals), LC (for par-ticular classes), and LA (for object properties), which are, respectively, sets ofnames for spiders, curves and arrows. Informally, in concretely drawn diagrams(as opposed to their sentential abstract representation), spiders and curves areallowed to be unlabelled, as seen in Figure 1. Formally, however, these unla-belled entities act as variables. As such, we define two further pairwise disjoint,countably infinite sets (also disjoint from the former three), VS (for anonymousindividuals), VC (for anonymous classes) which are variables for spiders andcurves respectively. In drawn concept diagram, we typically omit labels for vari-ables to avoid clutter. However, if the same anonymous spider or curve appearsmore than once, so that the variable label is used on more than one spider orcurve, then this label must be drawn. Further, we define LA− = {op− ∶ op ∈ LA},allowing us to denote inverse properties.
At the abstract level, concept diagrams include a set of spiders that arechosen from a countably infinite set, S. In a drawn diagram, each spider is a treewhose nodes are placed in distinct zones (i.e., dots connected by lines placedin ‘minimal’ regions in the diagram). Any two spiders may be joined by ÔÔ, toassert that two individuals are the same. For example, if s in Figure 1 was joinedto, say s′ (i.e., s ÔÔ s′), they would be the same individual. Also, ÔÔ may
be annotated with ? (i.e.,?ÔÔ) to indicate uncertainty about equality: the two
spiders may represent either equal or distinct individuals.Concept diagrams also include closed curves, selected from a countably infi-
nite set, C. The closed curves give rise to zones that are regions inside some ornone of the curves. Formally, a zone is a pair of finite, disjoint sets of curves,(in,C/in), where C ⊆ C is a finite set of curves. Intuitively, (in,C/in) is inside
every curve of in ⊆ C and outside every curve of C/in. For example, in Figure 1,both LHS and RHS diagram components have five zones.
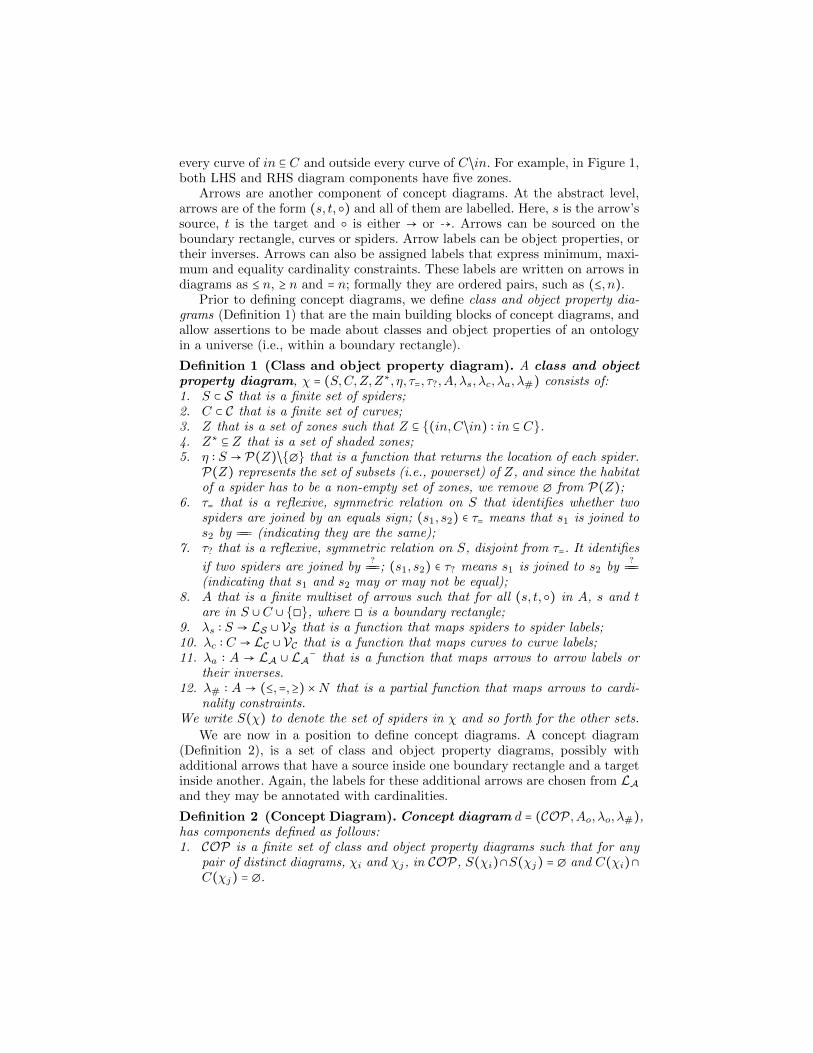
Arrows are another component of concept diagrams. At the abstract level,arrows are of the form (s, t, ○) and all of them are labelled. Here, s is the arrow’ssource, t is the target and ○ is either → or ⇢. Arrows can be sourced on theboundary rectangle, curves or spiders. Arrow labels can be object properties, ortheir inverses. Arrows can also be assigned labels that express minimum, maxi-mum and equality cardinality constraints. These labels are written on arrows indiagrams as ≤ n, ≥ n and = n; formally they are ordered pairs, such as (≤, n).
Prior to defining concept diagrams, we define class and object property dia-grams (Definition 1) that are the main building blocks of concept diagrams, andallow assertions to be made about classes and object properties of an ontologyin a universe (i.e., within a boundary rectangle).
Definition 1 (Class and object property diagram). A class and objectproperty diagram, χ = (S,C,Z,Z∗, η, τ=, τ?,A, λs, λc, λa, λ#) consists of:1. S ⊂ S that is a finite set of spiders;2. C ⊂ C that is a finite set of curves;3. Z that is a set of zones such that Z ⊆ {(in,C/in) ∶ in ⊆ C}.4. Z∗ ⊆ Z that is a set of shaded zones;5. η ∶ S → P(Z)/{∅} that is a function that returns the location of each spider.P(Z) represents the set of subsets (i.e., powerset) of Z, and since the habitatof a spider has to be a non-empty set of zones, we remove ∅ from P(Z);
6. τ= that is a reflexive, symmetric relation on S that identifies whether twospiders are joined by an equals sign; (s1, s2) ∈ τ= means that s1 is joined tos2 by ÔÔ (indicating they are the same);
7. τ? that is a reflexive, symmetric relation on S, disjoint from τ=. It identifies
if two spiders are joined by?ÔÔ; (s1, s2) ∈ τ? means s1 is joined to s2 by
?ÔÔ
(indicating that s1 and s2 may or may not be equal);8. A that is a finite multiset of arrows such that for all (s, t, ○) in A, s and t
are in S ∪C ∪ {◻}, where ◻ is a boundary rectangle;9. λs ∶ S → LS ∪ VS that is a function that maps spiders to spider labels;10. λc ∶ C → LC ∪ VC that is a function that maps curves to curve labels;11. λa ∶ A → LA ∪ LA− that is a function that maps arrows to arrow labels or
their inverses.12. λ# ∶ A → (≤,=,≥) ×N that is a partial function that maps arrows to cardi-
nality constraints.We write S(χ) to denote the set of spiders in χ and so forth for the other sets.
We are now in a position to define concept diagrams. A concept diagram(Definition 2), is a set of class and object property diagrams, possibly withadditional arrows that have a source inside one boundary rectangle and a targetinside another. Again, the labels for these additional arrows are chosen from LAand they may be annotated with cardinalities.
Definition 2 (Concept Diagram). Concept diagram d = (COP,Ao, λo, λ#),has components defined as follows:1. COP is a finite set of class and object property diagrams such that for any
pair of distinct diagrams, χi and χj, in COP, S(χi)∩S(χj) = ∅ and C(χi)∩C(χj) = ∅.

2. Ao is a finite multiset of arrows such that for all (s, t, ○) in Ao,(a) s ∈ ⋃
χ∈COPS(χ)∪C(χ)∪({◻}×COP) and t ∈ ⋃
χ∈COPS(χ)∪C(χ)∪({◻}×
COP), and(b) for all diagrams, χ, in COP it is not the case that s ∈ S(χ) ∪ C(χ) ∪{(◻, χ)} and t ∈ S(χ) ∪C(χ) ∪ {(◻, χ)},
3. λo ∶ Ao → LA ∪ LA− is a function that maps arrows to object property andtheir inverses,
4. λ# ∶ Ao → {≤,=,≥} ×N is a partial function that maps arrows to cardinalityconstraints.
Note that, item 2 of this definition guarantees that the set of arrows in Aohave their source and targets in two different rectangles (e.g., has in Figure 1).In other words, these arrows are different from the set A in class and objectproperty diagrams, when the source and target of the arrows are within thesame rectangle (e.g., drinks in Figure 1).
2.2 Semantics
We take a standard approach to defining the semantics of concept diagrams.First, the vocabulary over which the logic is defined is interpreted appropriately(Definition 3), which is the basis for our definition of a model for a conceptdiagram (Definition 5).
Definition 3 (Interpretation). An interpretation is a pair, I = (U, .I),where– U is a non-empty set, called the universal set,– for each element i in LS , iI is an element of U ,– for each element c in LC, cI is a subset of U ,– for each element op in LA, opI is a binary relation on U .
We also need to interpret the variables and zones in class and object propertydiagrams. To do so, we first extend interpretations to variables.
Definition 4 (Extended Interpretation). Given an interpretation, I = (U, .I),an extended interpretation is a pair, I ′ = (U, .I′), such that
– for each element x in VS , xI′
is an element of U , and
– for each element X in VC, XI′ is a subset of U .
Definition 5 (Model). 3 Let d = (COP,Ao, λo, λ#) be a concept diagram andlet I = (U, .I) be an interpretation. I is a model for d if there exists an extended
interpretation, I ′ = (U, .I′), such that1. for each class and object property diagram χi, in COP
(a) the union of the sets represented by the zones in χ is U , that is ⋃z∈Z(χ)
zI′ =
U , where each zone z = (in,C/in) represents the set zI′ = ( ⋂
κ∈inλc(κ)I
′)/
( ⋃κ∈C/in
λc(κ)I′);
3 For simplicity and succinctness, we treat single elements as singleton sets (e.g. aspider represents an element via its label, but we treat it as a singleton set).
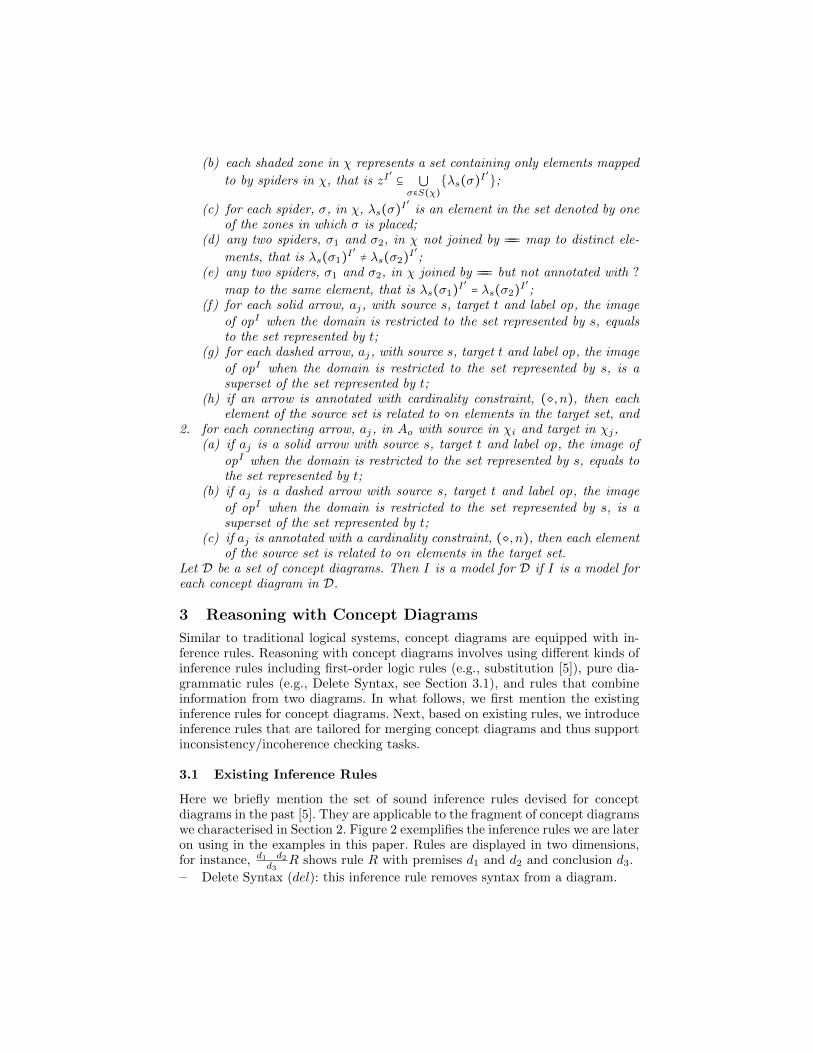
(b) each shaded zone in χ represents a set containing only elements mapped
to by spiders in χ, that is zI′ ⊆ ⋃
σ∈S(χ){λs(σ)I
′};
(c) for each spider, σ, in χ, λs(σ)I′
is an element in the set denoted by oneof the zones in which σ is placed;
(d) any two spiders, σ1 and σ2, in χ not joined by ÔÔ map to distinct ele-
ments, that is λs(σ1)I′ ≠ λs(σ2)I
′
;(e) any two spiders, σ1 and σ2, in χ joined by ÔÔ but not annotated with ?
map to the same element, that is λs(σ1)I′ = λs(σ2)I
′
;(f) for each solid arrow, aj, with source s, target t and label op, the image
of opI when the domain is restricted to the set represented by s, equalsto the set represented by t;
(g) for each dashed arrow, aj, with source s, target t and label op, the imageof opI when the domain is restricted to the set represented by s, is asuperset of the set represented by t;
(h) if an arrow is annotated with cardinality constraint, (◇, n), then eachelement of the source set is related to ◇n elements in the target set, and
2. for each connecting arrow, aj, in Ao with source in χi and target in χj,(a) if aj is a solid arrow with source s, target t and label op, the image of
opI when the domain is restricted to the set represented by s, equals tothe set represented by t;
(b) if aj is a dashed arrow with source s, target t and label op, the imageof opI when the domain is restricted to the set represented by s, is asuperset of the set represented by t;
(c) if aj is annotated with a cardinality constraint, (◇, n), then each elementof the source set is related to ◇n elements in the target set.
Let D be a set of concept diagrams. Then I is a model for D if I is a model foreach concept diagram in D.
3 Reasoning with Concept Diagrams
Similar to traditional logical systems, concept diagrams are equipped with in-ference rules. Reasoning with concept diagrams involves using different kinds ofinference rules including first-order logic rules (e.g., substitution [5]), pure dia-grammatic rules (e.g., Delete Syntax, see Section 3.1), and rules that combineinformation from two diagrams. In what follows, we first mention the existinginference rules for concept diagrams. Next, based on existing rules, we introduceinference rules that are tailored for merging concept diagrams and thus supportinconsistency/incoherence checking tasks.
3.1 Existing Inference Rules
Here we briefly mention the set of sound inference rules devised for conceptdiagrams in the past [5]. They are applicable to the fragment of concept diagramswe characterised in Section 2. Figure 2 exemplifies the inference rules we are lateron using in the examples in this paper. Rules are displayed in two dimensions,for instance, d1 d2
d3R shows rule R with premises d1 and d2 and conclusion d3.
– Delete Syntax (del): this inference rule removes syntax from a diagram.
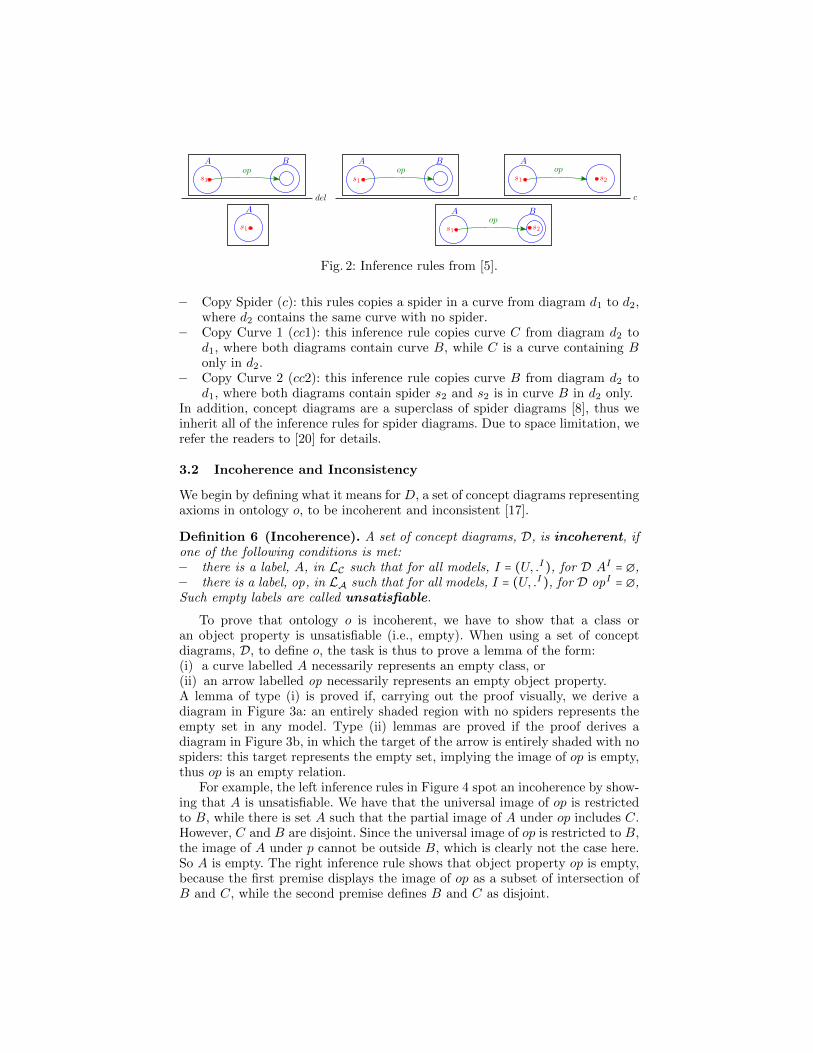
Fig. 2: Inference rules from [5].
– Copy Spider (c): this rules copies a spider in a curve from diagram d1 to d2,where d2 contains the same curve with no spider.
– Copy Curve 1 (cc1): this inference rule copies curve C from diagram d2 tod1, where both diagrams contain curve B, while C is a curve containing Bonly in d2.
– Copy Curve 2 (cc2): this inference rule copies curve B from diagram d2 tod1, where both diagrams contain spider s2 and s2 is in curve B in d2 only.
In addition, concept diagrams are a superclass of spider diagrams [8], thus weinherit all of the inference rules for spider diagrams. Due to space limitation, werefer the readers to [20] for details.
3.2 Incoherence and Inconsistency
We begin by defining what it means for D, a set of concept diagrams representingaxioms in ontology o, to be incoherent and inconsistent [17].
Definition 6 (Incoherence). A set of concept diagrams, D, is incoherent, ifone of the following conditions is met:– there is a label, A, in LC such that for all models, I = (U, .I), for D AI = ∅,– there is a label, op, in LA such that for all models, I = (U, .I), for D opI = ∅,Such empty labels are called unsatisfiable.
To prove that ontology o is incoherent, we have to show that a class oran object property is unsatisfiable (i.e., empty). When using a set of conceptdiagrams, D, to define o, the task is thus to prove a lemma of the form:(i) a curve labelled A necessarily represents an empty class, or(ii) an arrow labelled op necessarily represents an empty object property.A lemma of type (i) is proved if, carrying out the proof visually, we derive adiagram in Figure 3a: an entirely shaded region with no spiders represents theempty set in any model. Type (ii) lemmas are proved if the proof derives adiagram in Figure 3b, in which the target of the arrow is entirely shaded with nospiders: this target represents the empty set, implying the image of op is empty,thus op is an empty relation.
For example, the left inference rules in Figure 4 spot an incoherence by show-ing that A is unsatisfiable. We have that the universal image of op is restrictedto B, while there is set A such that the partial image of A under op includes C.However, C and B are disjoint. Since the universal image of op is restricted to B,the image of A under p cannot be outside B, which is clearly not the case here.So A is empty. The right inference rule shows that object property op is empty,because the first premise displays the image of op as a subset of intersection ofB and C, while the second premise defines B and C as disjoint.
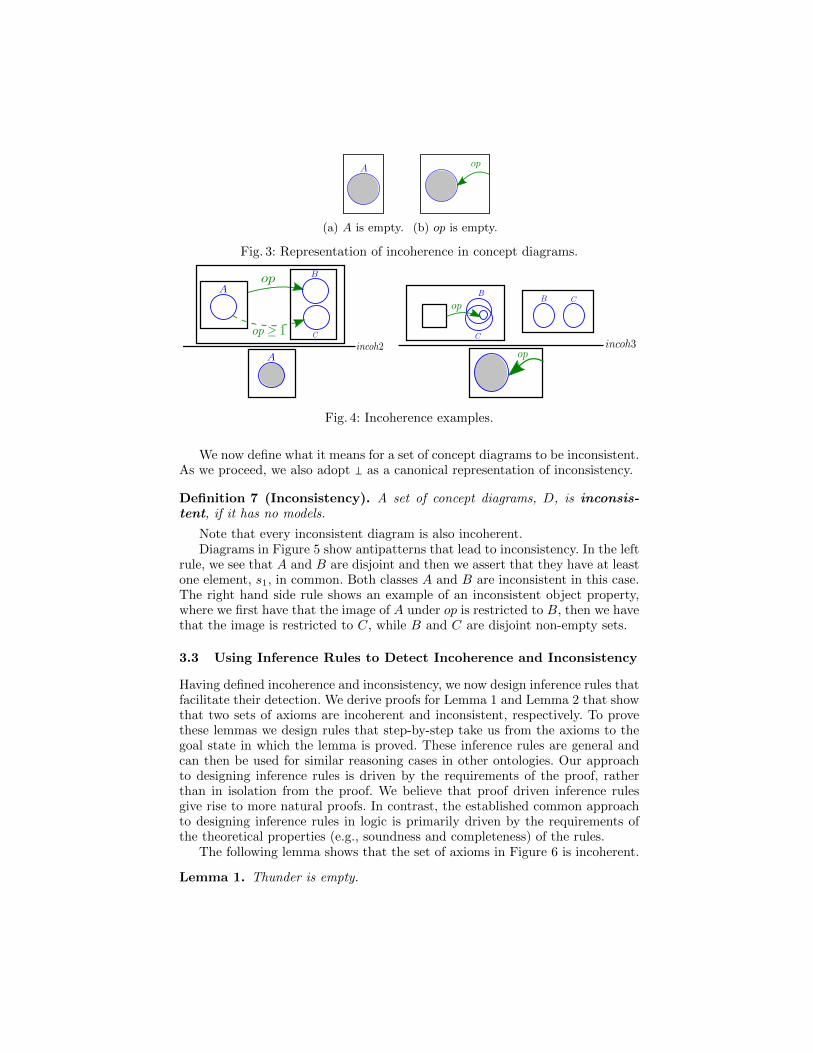
(a) A is empty. (b) op is empty.
Fig. 3: Representation of incoherence in concept diagrams.
Fig. 4: Incoherence examples.
We now define what it means for a set of concept diagrams to be inconsistent.As we proceed, we also adopt ⊥ as a canonical representation of inconsistency.
Definition 7 (Inconsistency). A set of concept diagrams, D, is inconsis-tent, if it has no models.
Note that every inconsistent diagram is also incoherent.Diagrams in Figure 5 show antipatterns that lead to inconsistency. In the left
rule, we see that A and B are disjoint and then we assert that they have at leastone element, s1, in common. Both classes A and B are inconsistent in this case.The right hand side rule shows an example of an inconsistent object property,where we first have that the image of A under op is restricted to B, then we havethat the image is restricted to C, while B and C are disjoint non-empty sets.
3.3 Using Inference Rules to Detect Incoherence and Inconsistency
Having defined incoherence and inconsistency, we now design inference rules thatfacilitate their detection. We derive proofs for Lemma 1 and Lemma 2 that showthat two sets of axioms are incoherent and inconsistent, respectively. To provethese lemmas we design rules that step-by-step take us from the axioms to thegoal state in which the lemma is proved. These inference rules are general andcan then be used for similar reasoning cases in other ontologies. Our approachto designing inference rules is driven by the requirements of the proof, ratherthan in isolation from the proof. We believe that proof driven inference rulesgive rise to more natural proofs. In contrast, the established common approachto designing inference rules in logic is primarily driven by the requirements ofthe theoretical properties (e.g., soundness and completeness) of the rules.
The following lemma shows that the set of axioms in Figure 6 is incoherent.
Lemma 1. Thunder is empty.

Fig. 5: Inconsistency examples.
(a) (b)
(c) (d)
isEnhancedBy 1SuperPower
isEnhancedByThunder GodDevice
SuperPower
GodDevice
Device
Fig. 6: A set of incoherent axioms.
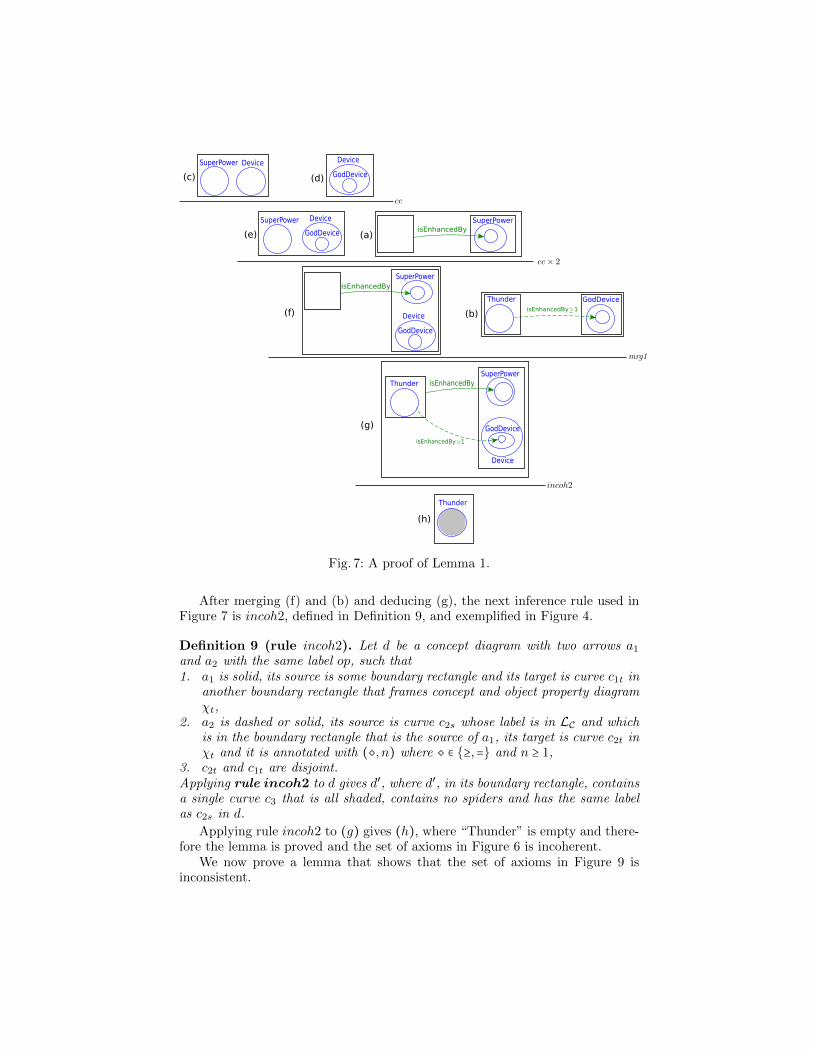
Proof. Figure 7 shows the proof.
In this proof (Figure 7), we aim to establish that “Thunder” is empty fromaxioms in Figure 6. First, Axioms (c) and (d) are merged by using inference rulecc. cc is one of existing rules for spider diagrams [8] and stands for copy contour(contours in spider diagrams are equivalent to curves in concept diagrams) and isintroduced in [20]. Applying cc to diagram d copies the curve labelled “GodDe-vice” from diagram (d) to diagram (c), giving diagram (e) as conclusion. In thenext step (e) and (a) are merged using cc twice in a row. “SuperPower” alreadyexists in (a), so the two curves being copied from (e) to (a), are “Device” and“GodDevice”. The result of merging (e) and (a) gives (f). Next, (f) and (b) aremerged using rule mrg1 . This rule is formally defined in Definition 8.
Definition 8 (rule mrg1 ). Let d1 and d2 be two concept diagrams, each con-taining an arrow, a1 and a2 respectively, labelled op such that1. a1 is solid, its source is some boundary rectangle, ◻, and its target is a curve,
c1t in χ1t, which is an object and class property diagram;2. a2 is dashed or solid and its source and target are curves c2s and c2t in χ2s
and χ2t, respectively, while c2t is properly contained in c3.Also let χ1t in d1 contain curve c4 disjoint from c1t, such that c4 has the samelabel as c3 in d2. Now let d3 be a concept diagram such that d3 is a copy of d1with a new arrow, a3, and two new curves, c5, and c6 as follows:1. c5 is added to the boundary rectangle that is the source of a1 in d1,2. c5 has the same label as c2s in d2,3. c6 is added inside c4 from d1,4. c6 has the same label as c2t in d2,5. a3 is sourced on c5 and targets c6, and6. a3 has the same shape (dashed or solid), label and cardinality as a2 in d2.Then diagrams d1 and d2 can be merged to form diagram d3 using rule mrg1 .
mrg1 is exemplified in Figure 8, where in the left hand premise c1t and c4are represented by curves labelled A and B. On the right, c2s, c3, and c2t arerepresented by curves labelled C, B, and D. In the conclusion, c5,and c6 arerepresented by curves C and D.
isEnhancedBy
isEnhancedBy 1
(c) (d)
SuperPower
GodDevice
Device
(e)
SuperPower
(a)
SuperPowerisEnhancedBy
(f)
isEnhancedBy
(b)isEnhancedBy 1
Thunder GodDevice
(g)
(h)
Device
GodDevice
Device
GodDevice
Device
SuperPower
Thunder
Thunder
GodDevice
Device
SuperPower
Fig. 7: A proof of Lemma 1.
After merging (f) and (b) and deducing (g), the next inference rule used inFigure 7 is incoh2, defined in Definition 9, and exemplified in Figure 4.
Definition 9 (rule incoh2). Let d be a concept diagram with two arrows a1and a2 with the same label op, such that1. a1 is solid, its source is some boundary rectangle and its target is curve c1t in
another boundary rectangle that frames concept and object property diagramχt,
2. a2 is dashed or solid, its source is curve c2s whose label is in LC and whichis in the boundary rectangle that is the source of a1, its target is curve c2t inχt and it is annotated with (◇, n) where ◇ ∈ {≥,=} and n ≥ 1,
3. c2t and c1t are disjoint.Applying rule incoh2 to d gives d′, where d′, in its boundary rectangle, containsa single curve c3 that is all shaded, contains no spiders and has the same labelas c2s in d.
Applying rule incoh2 to (g) gives (h), where “Thunder” is empty and there-fore the lemma is proved and the set of axioms in Figure 6 is incoherent.
We now prove a lemma that shows that the set of axioms in Figure 9 isinconsistent.
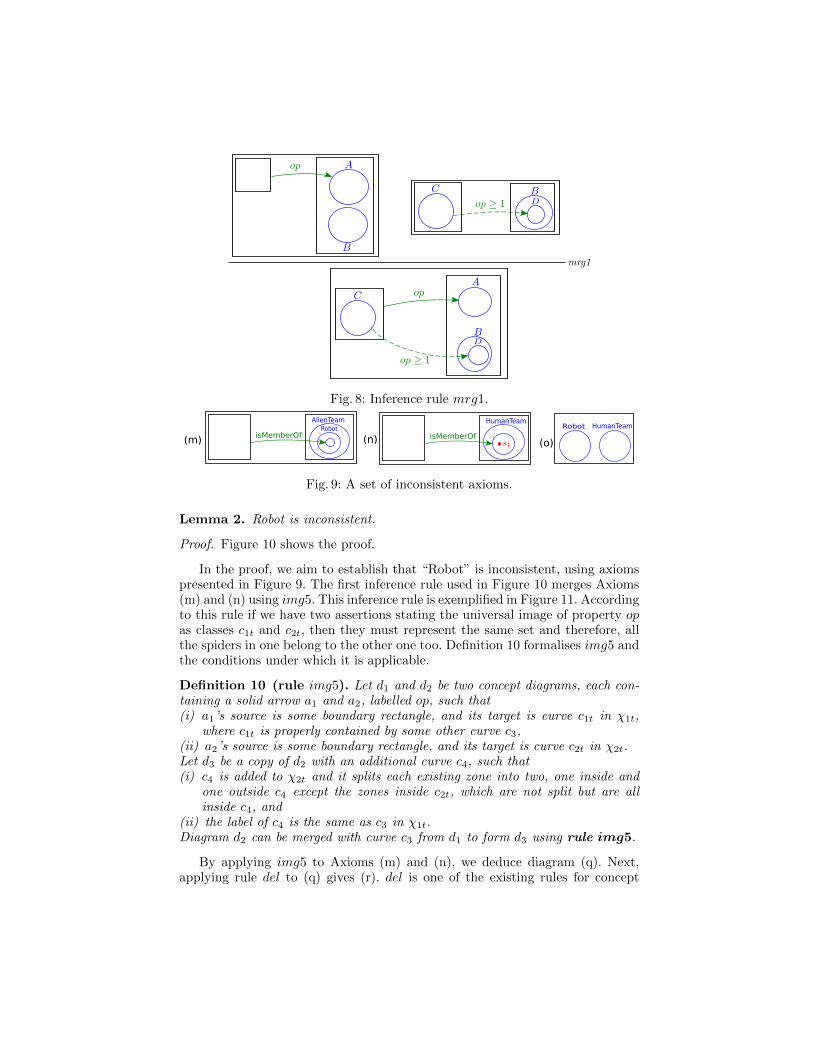
Fig. 8: Inference rule mrg1.
(m) (n) (o)isMemberOf
AlienTeamRobot
isMemberOf
HumanTeamHumanTeamRobot
Fig. 9: A set of inconsistent axioms.
Lemma 2. Robot is inconsistent.
Proof. Figure 10 shows the proof.
In the proof, we aim to establish that “Robot” is inconsistent, using axiomspresented in Figure 9. The first inference rule used in Figure 10 merges Axioms(m) and (n) using img5. This inference rule is exemplified in Figure 11. Accordingto this rule if we have two assertions stating the universal image of property opas classes c1t and c2t, then they must represent the same set and therefore, allthe spiders in one belong to the other one too. Definition 10 formalises img5 andthe conditions under which it is applicable.
Definition 10 (rule img5). Let d1 and d2 be two concept diagrams, each con-taining a solid arrow a1 and a2, labelled op, such that(i) a1’s source is some boundary rectangle, and its target is curve c1t in χ1t,
where c1t is properly contained by some other curve c3,(ii) a2’s source is some boundary rectangle, and its target is curve c2t in χ2t.Let d3 be a copy of d2 with an additional curve c4, such that(i) c4 is added to χ2t and it splits each existing zone into two, one inside and
one outside c4 except the zones inside c2t, which are not split but are allinside c4, and
(ii) the label of c4 is the same as c3 in χ1t.Diagram d2 can be merged with curve c3 from d1 to form d3 using rule img5.
By applying img5 to Axioms (m) and (n), we deduce diagram (q). Next,applying rule del to (q) gives (r). del is one of the existing rules for concept

(m) isMemberOf
AlienTeamRobot
(n) isMemberOf
HumanTeam
AlienTeamRobot
HumanTeam
isMemberOf
(o)
HumanTeamRobot
(q)
Robot
HumanTeam
(r)
Fig. 10: A proof of Lemma 2.
diagrams that was explained in Section 3.1. Merging (r) with Axiom (o) is doneusing inference rule incons1 (exemplified in Figure 5), that is described in Defi-nition 11.
Definition 11 (rule incons1). Let d1 and d2 be two concept diagrams such thatthere are two curves in d1, say c1 and c2, that are disjoint, while d2 containstwo curves c3 and c4 with at least one spider in their intersection. If c1 and c2in d1 have the same labels as c3 and c4 in d2, respectively, rule incons1 spotsthe inconsistency and concludes false (�).
By applying incons1 to r and o, we deduce false, and spot the inconsistency of“Robot” and hence the inconsistency of the set of axioms presented in Figure 9.
3.4 Correctness
Here, we investigate the soundness and completeness of the inference rules in-troduced. Rules used in proofs of Lemma 1 and Lemma 2 are cc, mrg1, incoh2,img5, del and incons1. cc and del are proved sound in [5] and [20], respectively.Due to space limitation, below we only prove the soundness of rule incoh2. Otherrules can be proven sound in a similar manner.
Theorem 1. Rule incoh2 (Definition 9) is sound.
Proof. (Sketch) We need to show that any model for the premise (d), is also amodel for the conclusion (d′). Let I = (U, .I) be an interpretation such that there
exists an extension, I ′ = (U, .I′) that shows I is a model for d. Then for the solid
arrow a1, the image of opI′
equals λc(c1t)I′
. Due to the cardinality constraint,
(◇, n), on a2, each element of λc(c2s)I′
is related to at least one element of
λc(c2t)I′
under opI′
. Suppose, for proof by contradiction, that λc(c2s)I′ ≠ ∅.
Let e ∈ λc(c2s)I′
and let e′ be an element in λc(c2t)I′
that e is related to under
opI′
. Then e′ is an element of λc(c1t)I′
. So λc(c1t)I′ ∩ λc(c2t)I
′ ≠ ∅. On the

Fig. 11: Inference rule img5.
other hand, since I is a model for d, and c1t and c2t are disjoint in d, we have
λc(c1t)I′ ∩ λc(c2t)I
′ = ∅. Therefore the assumption that λc(c2s)I′ ≠ ∅ is false.
Consider now the only curve, c3, in d′. Since λc(c) is a label in LC , any extension,
I ′′, of I clearly ensures λc(c3)I′′ = ∅. Since c3 is entirely shaded, I satisfies d′.
Hence, I is a model for d′, as required.
Ensuring completeness in most logical systems is hard. For a diagrammaticlogic for ontologies based on concept diagrams, the difficulty is caused by (i) theexistence of several syntactic elements for concept diagrams (e.g., spiders, curves,shading, etc.); and (ii) the constant need to devise new rules to capture the infer-ence required when reasoning about ontologies representing different domains.We conjecture that concept diagrams, as defined here, correspond to a fragmentof second-order logic with one and two place predicates. One-place and two-placepredicates arise due to the use of labelled curves and arrows respectively. Second-order (existential) quantification occurs through the use of unlabelled curves.Although concept diagrams do not contain quantifiers in their syntax, an equiv-alent fragment of SOL would need to do so. For instance, two non-overlappinglabelled curves, A and B say, give rise to (first-order) universal quantificationand express ∀x ¬(A(x)∧B(x)). Due to the restricted way in which second-orderquantification arises, finding a complete set of inference rules should be possible.Compleness is a desirable property that we leave for future work (non-trivial).Proving it involves considering and formalising variants of inference rules in allcombinations of all syntatic elements of concept diagrams. Consider inferencerule img5 presented in Figure 11. The variants of this rule can be defined forother combination of arrows, when the target and source of arrows are variouscombination of spiders, curves and boundary rectangles.
4 Related Work and Discussion
Debugging ontologies is a challenging task. A variety of tools, in particular vi-sualisation tools [15, 16], have been developed to help ontology engineers withthe debugging process. Similar to these efforts, concept diagrams attempt to aiddebugging ontologies through visualisations. However, we argue that in additionto having cognitive advantages over DL and OWL [13], concept diagrams arecognitively more accessible than ontology visualisation methods based on node-link diagrams (e.g., SOVA [15] and VOWL [16]). This can naturally be explainedby referring to better well-matchedness [10] of concept diagrams to ontologies.

Well-matchedness of a notation is assessed based on how well its syntax and se-mantics mirror each other. Concept diagrams use syntactic spatial relationships(e.g., curve containment) to reflect the corresponding semantics (e.g., subset re-lation). In node-link diagrams classes and properties are represented as nodes,while different arrow-like connectors are used to capture the relation betweenthe nodes. In contrast to concept diagrams, node-link diagrams use topologicalrelations to convey semantics (e.g., subset superset relation is expressed usingan arrow with a hollow end). The lack of well-matchedness in tools like [15, 16]suggests that they may not be as cognitively effective as concept diagrams. Inaddition to cognitive advantages, concept diagrams are fully formalised, whichis not the case for several ontology visualisation tools (e.g., UML diagrams [4]).As a formalised logical system, concept diagrams can be used not only as a vi-sualisation tool, but also as a reasoning tool, as it was highlighted in this paper.
Similar to our work, concept diagrams have recently been used for the de-tection and justification of antipatterns [13]. However, in [13] the focus is on thespecification and representation of incoherence using concept diagrams ratherthan the inference rules and the reasoning mechanism that checks incoherence.In contrast, our goal is to design inference rules for reasoning. Moreover, we usethese inference rules for reasoning about both incoherence and inconsistency.
5 Conclusion and Future Work
In this paper we described how to reason about inconsistency and incoherencein ontologies using concept diagrams. Unlike, many visual tools for ontologyengineering [15, 16], concept diagrams are designed to be formal, yet accessible,evidenced by empirical studies [13]. There are two alternatives to use conceptdiagrams as ontology debugging tool, namely (i) to prove a one to one translationof ontology axioms in concept diagrams; and (ii) to merge ontology axioms in asingle concept diagram.We focused on the latter. This choice was informed byexisting cognitive empirical evaluations [18, 13] and resulted in proposing a setof sound inference rules for merging concept diagrams.
We conjecture that concept diagrams used in this paper (Section 2) are asexpressive as a fragment of second-order logic with one and two place predicates.In the future we will extend the set of inference rules for this fragment with theaim of achieving completeness.
We will use concept diagrams and their inference rules in building the firstmechanised reasoning system for concept diagrams and reasoning about ontolo-gies. An exciting aspect of the future work from this perspective is the empiricalstudies that we have outlined to inform the intuitiveness of the inference ruleswe are implementing. We believe that the intuitiveness of the inference rules cansignificantly contribute to a more accessible reasoner for ontology engineering.
References
1. The OWL2 web ontology language. https://www.w3.org/TR/owl2-direct-semantics/, Dec. 2016.
2. Protege: A free, open-source ontology editor. http://protege.stanford.edu, Decem-ber 2016.

3. Franz Baader, Ian Horrocks, and Ulrike Sattler. Description logics. In Handbookon Ontologies, pages 21–43. 2009.
4. Saartje Brockmans, Raphael Volz, Andreas Eberhart, and Peter Loffler. Visualmodeling of OWL DL ontologies using UML. In The Semantic Web, volume 3298of Lecture Notes in Computer Science, pages 198–213. Springer, 2004.
5. Peter Chapman, Gem Stapleton, John Howse, and Ian Oliver. Deriving sound in-ference rules for concept diagrams. In 2011 IEEE Symposium on Visual Languagesand Human-Centric Computing, VL/HCC 2011, pages 87–94. IEEE, 2011.
6. Oscar Corcho, Catherine Roussey, Luis Manuel Vilches Blazquez, and Ivan Perez.Pattern-based OWL ontology debugging guidelines. In Proceedings of the Work-shop on Ontology Patterns (WOP 2009), volume 516 of CEUR Workshop Proceed-ings. CEUR-WS.org, 2009.
7. Frithjof Dau and Peter W. Eklund. A diagrammatic reasoning system for thedescription logic ACL. Journal of Visual Languages and Computing, 19(5):539–573, 2008.
8. Joseph Gil, John Howse, and Stuart Kent. Formalizing spider diagrams. In IEEESymposium on Visual Languages, pages 130–137. IEEE Computer Society, 1999.
9. Giancarlo Guizzardi and Tiago Prince Sales. Detection, simulation and eliminationof semantic anti-patterns in ontology-driven conceptual models. In ConceptualModeling, pages 363–376. Springer International Publishing, 2014.
10. Corin Gurr. Effective diagrammatic communication: Syntactic, semantic and prag-matic issues. Journal of Visual Languages and Computing, 10(4):317–342, 1999.
11. Matthew Horridge, Bijan Parsia, and Ulrike Sattler. Explaining inconsistenciesin OWL ontologies. In Scalable Uncertainty Management, volume 5785 of LectureNotes in Computer Science, pages 124–137. Springer, 2009.
12. Ian Horrocks, Peter F. Patel-Schneider, and Frank van Harmelen. From SHIQ andRDF to OWL: the making of a web ontology language. Journal of Web Semantics,1(1):7–26, 2003.
13. Tie Hou, Peter Chapman, and Andrew Blake. Antipattern comprehension: Anempirical evaluation. In Formal Ontology in Information Systems, volume 283 ofFrontiers in Artificial Intelligence, pages 211–224. IOS Press, 2016.
14. J. Howse, G. Stapleton, K. Taylor, and P. Chapman. Visualizing ontologies: A casestudy. In International Semantic Web Conference, pages 257–272. Springer, 2011.
15. Nili Itzik and Iris Reinhartz-Berger. SOVA - A tool for semantic and ontologicalvariability analysis. In Joint Proceedings of the CAiSE 2014 Forum and CAiSE2014 Doctoral Consortium, volume 1164, pages 177–184. CEUR-WS.org, 2014.
16. Steffen Lohmann, Stefan Negru, Florian Haag, and Thomas Ertl. Visualizing on-tologies with VOWL. Semantic Web, 7(4):399–419, 2016.
17. Guilin Qi and Anthony Hunter. Measuring incoherence in description logic-basedontologies. In International Semantic Web Conference, volume 4825 of LectureNotes in Computer Science, pages 381–394. Springer, 2007.
18. Marco Ragni, Sangeet Khemlani, and P. N. Johnson-Laird. The evaluation of theconsistency of quantified assertions. Memory & Cognition, 42(1):53–66, 2014.
19. Gem Stapleton, John Howse, Peter Chapman, Aidan Delaney, Jim Burton, andIan Oliver. Formalizing Concept Diagrams. In Visual Languages and Computing,pages 182–187. Knowledge Systems Institute, 2013.
20. Matej Urbas, Mateja Jamnik, and Gem Stapleton. Speedith: A reasoner for spiderdiagrams. Journal of Logic, Language and Information, 24(4):487–540, 2015.