Embed Size (px)
Citation preview

Florida International UniversityFIU Digital Commons
FIU Electronic Theses and Dissertations University Graduate School
3-5-2010
Realization of Differentiated Quality of Service forWideband Code Division Multiple Access CoreNetworkYechang FangFlorida International University, [email protected]
Follow this and additional works at: http://digitalcommons.fiu.edu/etd
This work is brought to you for free and open access by the University Graduate School at FIU Digital Commons. It has been accepted for inclusion inFIU Electronic Theses and Dissertations by an authorized administrator of FIU Digital Commons. For more information, please contact [email protected].
Recommended CitationFang, Yechang, "Realization of Differentiated Quality of Service for Wideband Code Division Multiple Access Core Network" (2010).FIU Electronic Theses and Dissertations. Paper 244.http://digitalcommons.fiu.edu/etd/244
FLORIDA INTERNATIONAL UNIVERSITY
Miami, Florida
REALIZATION OF DIFFERENTIATED QUALITY OF SERVICE FOR WIDEBAND
CODE DIVISION MULTIPLE ACCESS CORE NETWORK
A dissertation submitted in partial fulfillment of the
requirements for the degree of
DOCTOR OF PHILOSOPHY
in
ELECTRICAL ENGINEERING
by
Yechang Fang
2010

To: Dean Amir Mirmiran College of Engineering and Computing This dissertation, written by Yechang Fang, and entitled Realization of Differentiated Quality of Service for Wideband Code Division Multiple Access Core Network, having been approved in respect to style and intellectual content, is referred to you for judgment. We have read this dissertation and recommend that it be approved.
_______________________________ Jean H. Andrian
_______________________________
Deng Pan
_______________________________ Yimin Zhu
_______________________________
Kang K. Yen, Major Professor Date of Defense: March 5, 2010 This dissertation of Yechang Fang is approved.
_______________________________ Dean Amir Mirmiran
College of Engineering and Computing
_______________________________ Interim Dean Kevin O’Shea University Graduate School
Florida International University, 2010
ii

Copyright 2010 by Yechang Fang
All rights reserved
iii

DEDICATION
I dedicate this thesis to my wife, parents and parents-in-law. Without their
patience, understanding, support, and most of all love, the completion of this work would
not have been possible.
iv
ACKNOWLEDGMENTS
I wish to thank my advisor, Dr. Kang Yen, for his support, patience, and good
humor. His gentle but firm direction has been most appreciated. His interest in sense of
telecommunication was the impetus for my proposal. From the beginning, he had
confidence in my abilities to not only complete a degree, but to complete it with
excellence. I extend my gratitude to my committee members Dr. Jean Andrian, Dr. Deng
Pan and Dr. Yimin Zhu for their valuable input.
I have found my coursework throughout the curriculum and instruction program
at FIU to be stimulating, providing me with the tools with which to explore both past and
present ideas and research issues.
The research infrastructure of the System Dynamic Lab and the financial support
provided by the Presidential Fellowship and the Dissertation Year Fellowship made of
this research endeavor a successful one.
v

ABSTRACT OF THE DISSERTATION
REALIZATION OF DIFFERENTIATED QUALITY OF SERVICE FOR WIDEBAND
CODE DIVISION MULTIPLE ACCESS CORE NETWORK
by
Yechang Fang
Florida International University, 2010
Miami, Florida
Professor Kang K. Yen, Major Professor
The development of 3G (the 3rd generation telecommunication) value-added
services brings higher requirements of Quality of Service (QoS). Wideband Code
Division Multiple Access (WCDMA) is one of three 3G standards, and enhancement of
QoS for WCDMA Core Network (CN) becomes more and more important for users and
carriers. The dissertation focuses on enhancement of QoS for WCDMA CN. The purpose
is to realize the DiffServ (Differentiated Services) model of QoS for WCDMA CN.
Based on the parallelism characteristic of Network Processors (NPs), the NP
programming model is classified as Pool of Threads (POTs) and Hyper Task Chaining
(HTC). In this study, an integrated programming model that combines both of the two
models was designed. This model has highly efficient and flexible features, and also
solves the problems of sharing conflicts and packet ordering. We used this model as the
programming model to realize DiffServ QoS for WCDMA CN.
The realization mechanism of the DiffServ model mainly consists of buffer
management, packet scheduling and packet classification algorithms based on NPs. First,
vi

we proposed an adaptive buffer management algorithm called Packet Adaptive Fair
Dropping (PAFD), which takes into consideration of both fairness and throughput, and
has smooth service curves. Then, an improved packet scheduling algorithm called
Priority-based Weighted Fair Queuing (PWFQ) was introduced to ensure the fairness of
packet scheduling and reduce queue time of data packets. At the same time, the delay and
jitter are also maintained in a small range. Thirdly, a multi-dimensional packet
classification algorithm called Classification Based on Network Processors (CBNPs) was
designed. It effectively reduces the memory access and storage space, and provides less
time and space complexity.
Lastly, an integrated hardware and software system of the DiffServ model of QoS
for WCDMA CN was proposed. It was implemented on the NP IXP2400. According to
the corresponding experiment results, the proposed system significantly enhanced QoS
for WCDMA CN. It extensively improves consistent response time, display distortion
and sound image synchronization, and thus increases network efficiency and saves
network resource.
vii

TABLE OF CONTENTS
CHAPTER PAGE
CHAPTER 1 INTRODUCTION .........................................................................................1 1.1 General Statement of the Problem Area.................................................................... 1 1.2 Significance of the Study .......................................................................................... 3 1.3 Research Premise ...................................................................................................... 4 1.4 Research Methodology.............................................................................................. 6 1.5 Organization .............................................................................................................. 7
CHAPTER 2 REALIZATION MECHANISM OF DIFFERSEV QOS FOR WCDMA CN ....................................................................................................................................9 2.1 Introduction ............................................................................................................... 9 2.2 WCDMA QoS Architecture .................................................................................... 11 2.3 DiffServ QoS Model ............................................................................................... 13
2.3.1 DiffServ Architecture.............................................................................. 13 2.3.2 DiffServ Features and Advantages.......................................................... 15
2.4 DiffServ QOS Realization Mechanism ................................................................... 17 2.4.1 DiffServ Realization Framework ............................................................ 17 2.4.2 DiffServ Realization Mechanism............................................................ 18
2.5 Summary ................................................................................................................. 22 CHAPTER 3 HARDWARE PLATFORM AND PROGRAMMING MODEL OF
DIFFSERV QOS FOR WCDMA CN.............................................................................23 3.1 IXP2400 NP Overview............................................................................................ 23 3.2 IXP2400 Functional Modules ................................................................................. 25 3.3 Advantages of Using IXP2400 to Achieve DiffServ QoS ...................................... 28 3.4 IXP2400 Programming Models ............................................................................. 29
3.4.1 The HTC Model ...................................................................................... 30 3.4.2 The POTs Model ..................................................................................... 32
3.5 Development of the Comprehensive Programming Model .................................... 33 3.6 Summary ................................................................................................................. 36
CHAPTER 4 QUEUE MANAGEMENT ALGORITHM DESIGN .................................37
4.1 Queue Management Overview................................................................................ 37 4.2 Existing Buffer Management Algorithms ............................................................... 37 4.3 Development of the PAFD Algorithm .................................................................... 39
4.3.1 Algorithm Description............................................................................. 40 4.3.2 DiffServ Support ..................................................................................... 45
4.4 PAFD Simulation Results ....................................................................................... 48 4.4.1 Simulation for Commen Services ........................................................... 48 4.4.2 Simulation for DiffServ........................................................................... 51
4.5 Existing Packet Scheduling Algorithms.................................................................. 53 4.6 Development of the PWFQ Algorithm ................................................................... 56
viii

4.6.1 Algorithm Description............................................................................. 57 4.6.2 Performance Analysis ............................................................................. 59
4.7 PWFQ Simulation Results ...................................................................................... 62 4.8 Summary ................................................................................................................. 64
CHAPTER 5 PACKET CLASSIFICATION ALGORITHM DESIGN...........................65
5.1 Introduction ............................................................................................................. 65 5.2 Existing Packet Classification Algorithms.............................................................. 65 5.3 CBNPs Algorithm ................................................................................................... 67
5.3.1 Algorithm Description............................................................................. 67 5.3.2 Performance Analysis ............................................................................. 68 5.3.3 Algorithm Implementation and Optimization ......................................... 70
5.4 Simulation Results................................................................................................... 72 5.5 Summary ................................................................................................................. 74
CHAPTER 6 REALIZATION OF DIFFSERV QOS FOR WCDMA CN.......................75
6.1 Introduction ............................................................................................................. 75 6.2 Hardware Design of WCDMA QoS Based on IXP2400 ........................................ 76 6.3 Software Design of WCDMA QoS Based on IXP2400.......................................... 78 6.4 Simulation Results................................................................................................... 83
6.4.1 DiffServ Test ........................................................................................... 83 6.4.2 System Test ............................................................................................. 92
6.5 Summary ................................................................................................................. 98 CHAPTER 7 CONCLUSION............................................................................................99
7.1 Major Outcomes.................................................................................................... 100 7.2 Prospective Research Endeavors........................................................................... 101
LIST OF REFERENCES.................................................................................................103 VITA................................................................................................................................108
ix
LIST OF TABLES
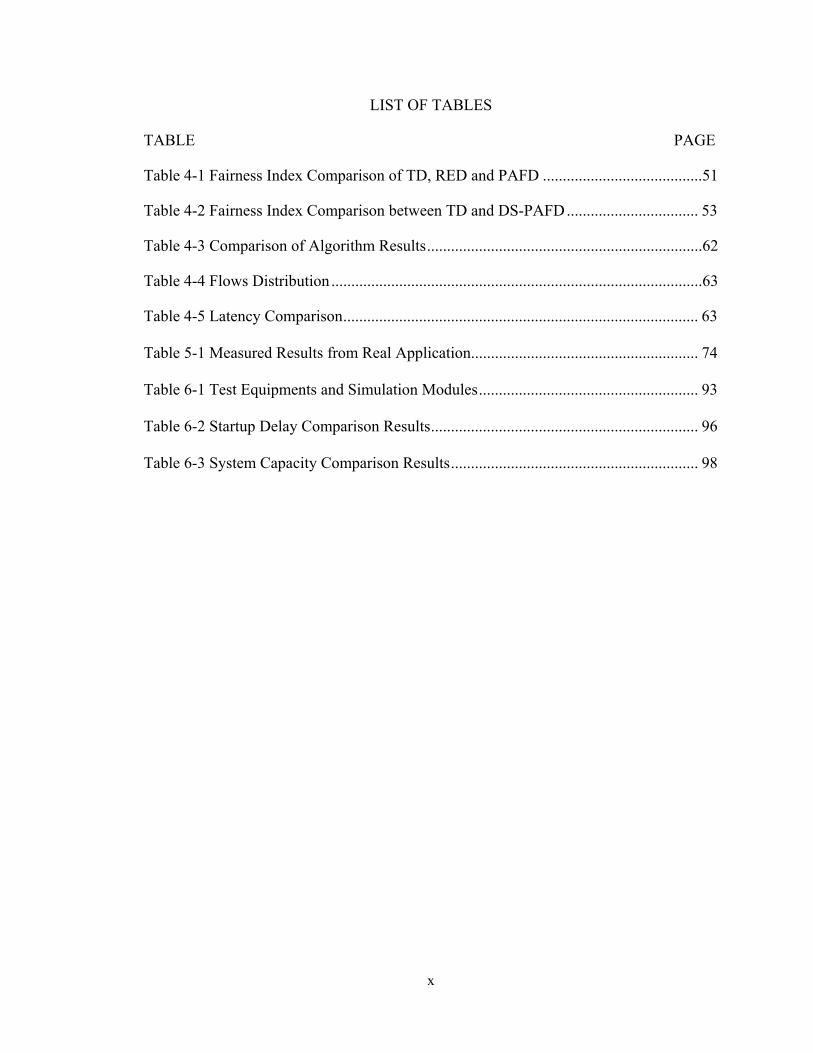
TABLE PAGE Table 4-1 Fairness Index Comparison of TD, RED and PAFD ........................................51 Table 4-2 Fairness Index Comparison between TD and DS-PAFD................................. 53 Table 4-3 Comparison of Algorithm Results.....................................................................62 Table 4-4 Flows Distribution.............................................................................................63 Table 4-5 Latency Comparison......................................................................................... 63 Table 5-1 Measured Results from Real Application......................................................... 74 Table 6-1 Test Equipments and Simulation Modules....................................................... 93 Table 6-2 Startup Delay Comparison Results................................................................... 96 Table 6-3 System Capacity Comparison Results.............................................................. 98
x
LIST OF FIGURES FIGURE PAGE Figure 2-1 WCDMA QoS Structure ................................................................................ 11
Figure 2-2 Control Information Interactive Process ......................................................... 21
Figure 3-1 IXP2400 Main Functional Units ..................................................................... 26
Figure 3-2 POTs Model Structure......................................................................................32
Figure 3-3 Comprehensive Programming Model Structure.............................................. 35
Figure 4-1 An Adaptive Curve of Parameter α................................................................. 45
Figure 4-2 Values of Parameter α for Different Priority Services.....................................46
Figure 4-3 Values of Parameter for Different Priority Services.................................... 47
Figure 4-4 Throughput Comparison between RED and PAFD ....................................... 49
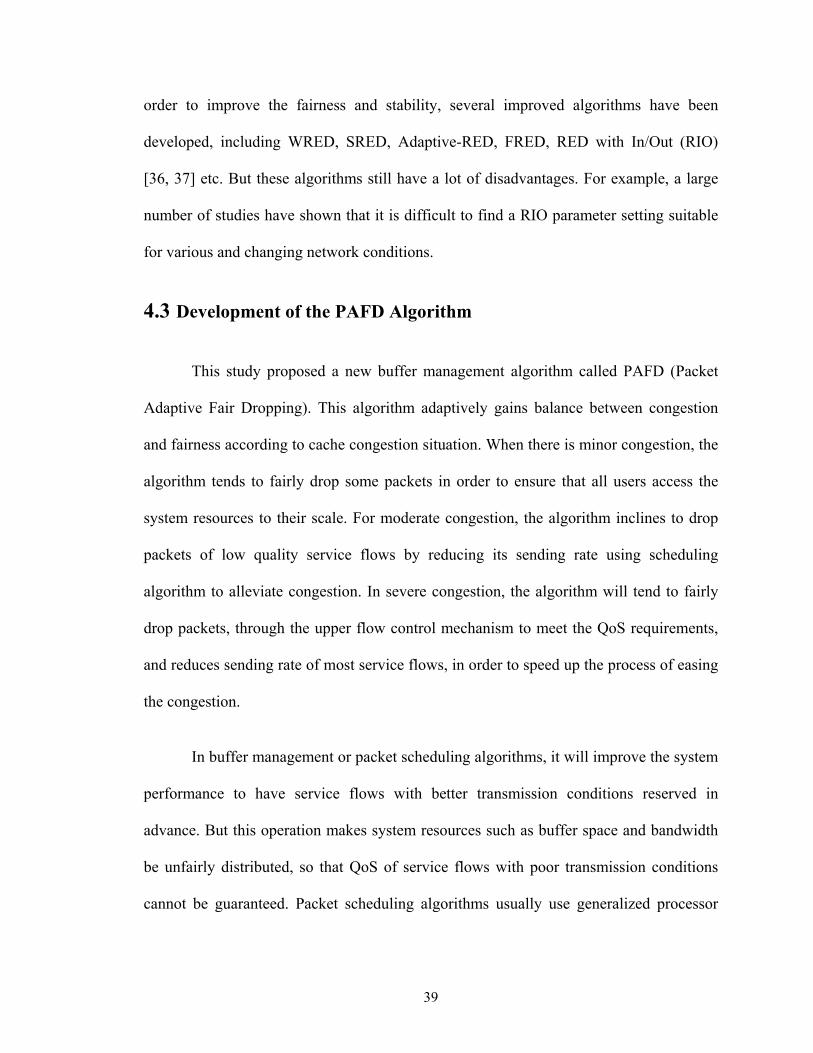
Figure 4-5 Comparison of Average Queuing Delay for TD, RED and PAFD................. 50
Figure 4-6 Throughput Comparison between RED and DS-PAFD.................................. 52
Figure 4-7 Comparison of Average Queuing Delay for RED and DS-PAFD ................. 52
Figure 4-8 A Typical Packet Scheduling System ............................................................. 54
Figure 6-1 Positions of QoS Switching in a Network....................................................... 76
Figure 6-2 Hardware Architecture of DiffServ QoS..........................................................77
Figure 6-3 Software Architecture of DiffServ QoS.......................................................... 79
Figure 6-4 DiffServ Test Structure .................................................................................. 83
Figure 6-5 (a) K1297-G20 Signaling Analyzer (b) The Interface of K1297.................... 84
Figure 6-6 K1297-G20 System Configration Status......................................................... 85
Figure 6-7 (a) Test Type Options (b) Data Flow Setup .....................................................86
xi

xii
Figure 6-8 Delay for Test Case 1...................................................................................... 88
Figure 6-9 Throughput for Test Case 1............................................................................. 89
Figure 6-10 Delay for Test Case 2.................................................................................... 90
Figure 6-11 Throughput for Test Case 2........................................................................... 90
Figure 6-12 Delay for Test Case 3.................................................................................... 91
Figure 6-13 Throughput for Test Case 3........................................................................... 91
Figure 6-14 System Test Structure ................................................................................... 93
Figure 6-15 Startup Delay Comparison Diagram ............................................................. 96
Figure 6-16 System Capacity Comparison Diagram ........................................................ 97

CHAPTER 1
INTRODUCTION
1.1 General Statement of Problem Area
As the development of 3G, 3G QoS has become the research focus of the network
carriers. Wireless communication systems based on switch circuits will eventually evolve
into an end-to-end all-IP network, which uses IP networks as the core, and wireless
networks as the access approach. It also provides voice, video and multimedia operations
with QoS assurance mechanisms [1]. QoS is a kind of measurement for desired
performance and priorities of a communication system, which is designed to apply to
downlink and uplink connections. As the main model of 3G, Wideband Code Division
Multiple Access (WCDMA) has become mature after years of development. It uses a
similar structure as Global System for Mobile Communications (GSM) including the
Core Network (CN) and the Radio Access Network (RAN) [2-3]. The CN processes
voice and data services, and has the capability of switching and routing to external
networks. WCDMA CN and all-IP networks are the trend of 3G development [4-5], and
the problem of QoS for WCDMA CN is the extension in mobile communication
networks [6].
The QoS assurance provided in IP networks is the development trend of the next
generation network (NGN) [7]. IP QoS research aims at providing an effective end-to-
end QoS control or assurance. A lot of service models and mechanisms, offering different
1

levels of QoS assurance for IP networks, have been recommended and standardized, in
which the most common ones are IntServ/RSVP (Integrated Services/Resource
Reservation Protocol) and DiffServ (Differentiated Services). Compared to the IntServ
model, the DiffServ model has better scalability, and can better adapt to the mobile
wireless environment, especially suitable for large-scale backhaul networks. Koodli [8]
pointed out that the DiffServ model is the most effective method to provide WCDMA CN
with QoS guarantee under the current technical condition.
Compared with GSM CN, WCDMA network is committed to providing different
types of service with QoS. To achieve the smooth transition of the CN from GSM to
WCDMA, the General Packet Radio Service (GPRS) was introduced. GPRS adds packet
switching to circuit-switched mode. The Non-Access Stratum (NAS) of WCDMA is
horizontally divided into two sub-layers, i.e. mobility management sub-layer and
connection management sub-layer. GPRS vertically belongs to two surfaces, i.e. control
surface and user surface. Control surface is used for data transmission and processing,
while the user surface is for the transmission of user data. The entities which complete
the packet-switched service belong to the packet domain. In order to support packet-
based operations, two network entities are added. They are Service GPRS Support Node
(SGSN) and Gateway GPRS Support Node (GGSN). GGSN uses router architecture that
based on NPs. SGSN uses an architecture that includes Asynchronous Transfer Mode
(ATM) switches and NP forwarding board. Therefore, the realization of QoS function for
WCDMA CN depends on the research and application of NPs. The NP will be the core
2

technology promoting the next generation high-performance networks. A lot of current
research concentrating on its structure and applications has become a hot topic.
In the WCDMA system, communications between user nodes and internet hosts
must be transmitted via the CN. The quality of WCDMA CN services directly impacts
user’s perceivable feeling. Recently, a lot of QoS realization mechanisms of mobile
communication networks have been proposed [9-10], which are constrained in the RAN.
Research on QoS for WCDMA CN is still limited. Furthermore, designs of fixed network
QoS mechanisms are valuable [11-12], but they do not meet service structures and QoS
requirements of WCDMA CN. For various types of QoS operation requirements of
WCDMA CN, it is necessary to study the corresponding system models and realization
mechanisms.
1.2 Significance of the Study
Compared with the previous mobile communication technology, one of the
advantages of 3G is that it gives the carriers more freedom in managing QoS. So that
QoS becomes a network management mechanism with strict quantitative definition from
a vague concept. From service carriers’ perspective, carriers can improve the
competitiveness by providing high value-added services in a network, in which an
effective control and monitoring of QoS can be carried out. They can also develop
different operating strategies for different user services, so the resource utilization can be
improved. Since the end-users experience the end-to-end QoS, the carriers are most
concerned about how to ensure end-to-end QoS in WCDMA networks.
3
To provide differenciated QoS will definitely become the trend of future networks,
based on the facts below:
- The diversity of 3G shifts the attention from price to value.
- The emergence of multimedia services makes people concern more about
business experience.
- 3G service diversity makes business model and resource allocation model
more complex.
- The diversity in services of 3G makes the design of 3G networks novel, and
more complex.
Enhancement of QoS for WCDMA CN definitely improves consistent response
time, display distortion and sound image synchronization to increase network efficiency
and save network resource.
1.3 Research Premise
The main purpose of this study is to implement the DiffServ model of QoS for
WCDMA CN. In WCDMA CN, the main network nodes in Packet Switched (PS)
domain come from NPs. Due to this characteristic, this research mainly introduced
programming models of NPs and key mechanisms to realize the DiffServ model of QoS
for WCDMA CN. Based on the proposed programming model and algorithms, an
integrated system is designed to realize the DiffServ model of QoS for WCDMA CN.
1) Programming models of NPs:
4

- A comprehensive programming model which combines existing programming
models will be designed.
- A solution will be proposed to solve packet ordering and resources exclusive
issues.
2) Key realization mechanisms of DiffServ QoS for WCDMA CN:
- The buffer management algorithm: According to the QoS features of
WCDMA, a novel algorithm which supports DiffServ will be designed. This
algorithm can take consideration of both fairness and throughput, with smooth
service curves, and it can also be adjusted in accordance with network traffic.
- The packet scheduling algorithm: By analyzing QoS characteristics of
different WCDMA service types, this dissertation will introduce an improved
algorithm, which can ensure the fairness of packet scheduling, and reduce
queue time of data packets. The algorithm can also keep the delay and wobble
within a minimum range, and its performance can be evaluated through a
mathematical model of WCDMA packet data.
- The packet classification algorithm: Based on packet compress, rule merger
and other algorithms, a new algorithm will be proposed to improve the lookup
efficiency, gain desired time and space complexity.
3) Based on a comprehensive programming model and three algorithms proposed
in this study, an integrated hardware and software system will be realized on GGSN and
5

SGSN equipment based on IXP2400. The effectiveness and performance of the proposed
system will be tested by simulations which consist of DiffServ test and system test.
1.4 Research Methodology
WCDMA CN is an IP network which provides the CN bearer services and the
associated QoS guarantees. It consists of GGSN and SGSN nodes, and uses tunneling
technology to forward packets. In order to use the DiffServ model for QoS control in
WCDMA CN, the following issues need to be solved:
1) Appropriate access control schemes must be involved in the design of QoS
management functions in the control plane.
2) A variety of WCDMA services must be mapped to Per Hop Behaviors (PHBs)
of the DiffServ domain in the design of QoS management functions in the data plane.
Many papers have thoroughly done studies on QoS management in the control
plane. However, this study mainly focuses on QoS management in the data plane, which
consists of buffer management, packet scheduling and packet classification schemes.
In this dissertation, we used the research method of comparing and empirical
study. Firstly, we analyzed and compared the traditional NP programming models, queue
management and packet classification algorithms, and pointed out the existing
shortcomings. Then, we designed new programming models and algorithms; significance
and efficiency of the new algorithms were also tested carefully for the feasibility. Finally,
based on the new programming model and algorithms, an integrated hardware and
6

software system of DiffServ QoS for WCDMA CN was realized on IXP2400. The
research is based on Intel IXA framework and development tool SDK3.0, and the
simulation was carried out on K1297-G20 Protocol Tester, Microsoft Visual C++ 6.0
and Microsoft Media Server.
1.5 Organization
The study is mainly conducted on QoS for WCDMA CN. Based on summarizing
and analyzing the existing research works, a comprehensive programming model for the
NP and several new algorithms for QoS control in WCDMA CN were proposed. An
integrated system of DiffServ QoS for WCDMA was designed. The main contents of this
dissertation are as follows:
Chapter 1 summarized the development of 3G CN and the structure of CN
equipment. The DiffServ model of QoS for WCDMA CN was proposed. This chapter
also concludes that the NP is an ideal hardware platform to achieve DiffServ QoS for
WCDMA CN.
Chapter 2 analyzed the QoS structure of WCDMA CN. Compared with the
IntServ model, the advantages of the DiffServ model are outstanding. Realization
mechanism of DiffServ QoS was also introduced.
Chapter 3 introduced the research on the NP architecture. In-depth description is
carried out on the parallel feature and programming models of NPs. Solutions were
proposed to solve sharing conflicts and packet ordering problems that are encountered in
7

applications. A comprehensive programming model was proposed as the implementation
model of DiffServ QoS for WCDMA CN.
In Chapter 4, Queue management is divided into two aspects, buffer management
and packet scheduling. A new buffer management algorithm called PAFD and an
improved packet scheduling algorithms called PWFQ were proposed. Theoretical
analysis and experiments showed that the algorithms had the following characteristics:
(1) to guarantee fair bandwidth allocation, (2) to provide determined upper bound of the
delay, (3) to offer less computational complexity, and (4) to take full advantage of the
hardware features of network processing.
Chapter 5 proposed a fast packet classification algorithm called CBNPs by using
regulation compression and parallel tuple search technology. This algorithm reduces the
number of classification rules and classification domain width to accelerate the
classification process. It also has high-speed, multi-dimensional and scalable features.
In Chapter 6, based on the programming model and all algorithms proposed in
this study, an integrated hardware and software design of DiffServ QoS for WCDMA CN
was introduced. The simulation results showed that the proposed system has much better
performance than others.
Chapter 7 summarized the research work performed in this dissertation and
proposed further research directions.
8

CHAPTER 2
REALIZATION MECHANISM OF DIFFERSEV QOS FOR
WCDMA CN
2.1 Introduction
WCDMA networks allow us to provide a variety of communications services in
service networks and home environments. The objective of them is to provide a single
integrated system. Users can access this system using standard method in a variety of
environments. WCDMA defines a number of architectures consisting of logic
components with specific functions. An end-to-end WCDMA system includes User
Equipment (UE), Universal Mobile Telecommunications System (UMTS) Terrestrial
Radio Access Network (UTRAN), the CN as well as external networks. WCDMA
UTRAN is formed by a group of Radio Network Subsystems (RNS), which are access
part of UE in the PS domain. It is responsible for achieving the majority of air interface.
WCDMA CN is an IP network which can provide the CN bearer service and the
associated QoS assurance [13]. It consists of GGSN and SGSN nodes, and handles all
calls, bearing service support and controls related functions. SGSN implements the
mobility management, security management, access control and routing functions. GGSN
is responsible for providing interface of GPRS to the outer packet data network. It also
provides necessary inter-network security mechanisms, such as firewall.
9

The QoS problem in WCDMA networks is more complex than that of general IP
networks. Restriction of wireless interface must be taken into account when QoS services
are implemented. The complex QoS mechanisms in the fixed network [14] are often
unable to adapt to the high error rate at wireless interface. Due to the constraints and
robustness of wireless interface, the 3rd Generation Partnership Project (3GPP) [15]
defines four types of QoS for WCDMA: Conversation Class, Stream Class, Interaction
Class and Background Class. These classifications are based on the delay sensitivity of
different operations [16].
WCDMA CN supports services of different QoS levels. Each service is described
by a group of QoS parameters. This set of parameters determines the scope of WCDMA
bearer services that users can have, and describes the property of users' WCDMA bearer
services, which includes the maximum transmission rate, guaranteed transmission rate,
transmission order, the largest service data unit, service data unit format, service data unit
error ratio, residual error ratio, transmission of the error service data unit, transmission
delay, and service process priorities. By treating service types as attributes, WCDMA can
first assume the source of a service operation, and then optimizes the transmission of this
service.
WCDMA is capable of providing voice, data and multimedia with end-to-end
QoS support. Because characteristics of various types of services are significantly
different, they require different load-bearing characteristics. 3G network should adopt the
appropriate control mechanisms to meet the QoS requirements of different services. For
10

the WCDMA network which is based on packet switching, it is particularly important to
develop a reliable QoS management mechanism to meet the demand of 3G services.
2.2 WCDMA QoS Architecture
3GPP proposed a hierarchical structure shown in Figure 2-1, which supports end-
to-end QoS assurance. In order to achieve QoS in WCDMA networks, between the start
and the end of service, bearer services whose properties and functions are clearly defined
must be established.
Figure 2-1 WCDMA QoS Structure
In WCDMA networks, the end-to-end service can be decomposed into the
terminal equipment/mobile terminal (TE/MT), the local bearer service, WCDMA bearer
services and the external bearer service. During the delivery of a service flow from one
TE to another TE, the flow must go through different network bearer services. TE/MT
11
local bearer service is responsible for the communication between various components of
a mobile station (MS). These components can be MTs, and one or multiple of the
connected TE. The MT is responsible for physical connection of air interface to
WCDMA UTRAN. The TE is connected to the WCDMA network through the MT. The
end-to-end services in the application layer uses the underlying network bearer services
to provide various services to achieve WCDMA QoS [13]. The external bearer services
are responsible for connections between the CN and external network terminals.
WCDMA bearer services are realized by the Radio Access Bearer (RAB) services
and the CN bearer services. These two services reflect an optimized method to achieve
WCDMA bearer services in their respective network topology. Factors to be optimized
include the mobility and mobile user properties. The RAB services can provide
confidential delivery of signals and user data between the MT and CN Iu edge node, and
also satisfy the negotiated QoS of WCDMA bearer services or the default QoS of signals.
The CN bearer services connect the CN Iu edge node and the CN gateway to the outside
network to effectively control and use the backhaul network to provide the corresponding
WCDMA bearer services. WCDMA CN can support various backhaul network bearer
services with different QoS requirements.
The CN bearer services use the common backhaul network services, including the
functions of the first and second layers of the network. These functions can be chosen
according to the needs of network carriers to meet QoS requirements of the CN bearer
services. WCDMA does not define the backhaul services, so it can take advantage of the
12

existing standards. For example, the WCDMA R99 version uses the ATM standard
directly, while the bearer services of the IP-based CN use the IETF IP protocol instead.
2.3 DiffServ QoS Model
2.3.1 DiffServ Architecture
DiffServ uses the classification standard of IntServ. However, it removes the
complex admission control algorithms and end-to-end resource reservation protocol. The
scalability of DiffServ is improved by classifying and marking the traffic at the edge
routers. Moreover, DiffServ does not need complex signaling, so it is particularly suitable
for large-scale backhaul networks.
At the edge of the network, DiffServ classifies and forms the single flows entering
the network into different flow aggregations. They are then mapped to pre-defined
categories. Only a small number of these categories are saved at the core of the network.
The router treats the categories of flows differently by using different buffer management
and queue scheduling algorithms, and the different treatments brings different service
levels. First of all, users and network carriers have to sign a Service Level Agreement
(SLA), which defines performance indicators and user flow characterizations. Users pay
for data within the scope described in SLA, and the network provides the data with QoS
assurance. For the data not specified in the SLA, the network does not provide QoS
assurance, or the service level will be reduced.
13
When the user traffic enters the network, an edge router measures and classifies
the traffic. The user's flows are aggregated into a flow aggregation. The aggregated
information is stored in each IP header code point, which is used to tag flow aggregation
belonging to IP packets. DiffServ Code Point (DSCP) is located in Types of Service
(TOS) at IPv4 header or in Categories of Service (COS) at IPv6 header. Network core
equipment conducts scheduling and forwarding according to DSCP, and its external
characteristic is called PHB. Overall, the corresponding, forwarding and scheduling
behaviors of PHBs are the division of priority. Virtually every PHB corresponds to a
priority level. The parameters of each priority specify different requirements on delay,
jitter, and packet loss rate. The essence of PHB is the method of resources allocation of
each router in DiffServ area for specific flow aggregation. The current standardized PHB
includes the default type Best Effort (BE), Class Selector (CS), Expedited Forwarding
(EF) [17], and Assured Forwarding (AF) [18]. AF consists of four PHBs. Each Internet
Service Provider (ISP) can define different TOS according to their actual needs, such as
reward service through EF and Olympic service through AF.
The DiffServ model uses a hierarchical structure in different ISP networks for
coordination. A single ISP network constitutes a DiffServ (DS) domain, and multiple DS
domains constitute one DS zone. In a DS domain, the behaviors of DiffServ scheduling
forwarding are consistent. DS domains in the same DS zone have to be connected
through the edge routers. By using Traffic Condition Agreement (TCA), DS domains
provide the cross-DS domain services to ensure consistency in the provision of services
to users.
14

2.3.2 DiffServ Features and Advantages
By studying the DiffServ model, we can summarize the main features of the
DiffServ model:
1) There is a sharp distinction between functions of edge routers, core routers and
hosts. In the DiffServ model, the routers are further divided into edge routers and core
routers. Edge routers keep the per-flow state, SLA information, packet classification, and
marking. Core routers do not hold per-flow information, but only keeps a small number
of classified information. The core routers also provide different types of packet with
different priority treatments.
2) There is a clear contractual relationship between hosts and networks. SLA
describes the services that user can expect and the user flow specifications. Difference
between SLA and FLOWSPEC which is a list of parameters in IntServ is that SLA is a
long-term, static service specification, and the later expresses the exact description for the
flow specification of a specific QoS request.
3) Core routers provide different levels of services. In the DiffServ model, the
core routers in the backhaul network have only a small number of queues, and flows are
converged to a coarse-grained flow aggregation, so that the network can maintain high
statistical multiplexing features.
4) The DiffServ model offers a variety of levels of services. According to
different bandwidth and delay requirements, DiffServ can provide multiple levels of
15
services through different PHBs. From an architectural point of view, DiffServ has the
advantages of both IntServ and the traditional Best Effort model. This model maintains
the good statistical multiplexing characteristics of the Best Effort model, and has good
scalability.
DiffServ is an ideal QoS implementation mechanism in WCDMA CN under the
current technology, because
1) The DiffServ architecture and WCDMA CN structures have a certain similarity,
therefore the renovation cost is relatively low. SGSN in WCDMA CN is equivalent to the
entrance router in DiffServ, so mapping the WCDMA QoS to DiffServ DSCP to achieve
the corresponding PHB is all the works. GGSN is similar to the edge router which can
improve the flow control function, achieve the inter-regional differential services, and
ensure the consistency of QoS.
2) DiffServ does not need complex control signaling, and its good scalability
makes it suitable for wireless communications, especially as the QoS control mechanisms
in large-scale backhaul networks such as WCDMA CN.
3) Due to the high error rate of wireless interface and heterogeneous network
compatibility, WCDMA does not define precise QoS requirements for different TOS.
Thereby, this property perfectly matches the characteristic of DiffServ, which does not
perform fine granularity QoS control based on the flow aggregation.
16

2.4 DiffServ QOS Realization Mechanism
2.4.1 DiffServ Realization Framework
Different from the IntServ model, the core switch in the DiffServ model forwards
and schedules the data packets based on a limited number of COS, rather than the specific
circumstances of a session streaming. This requires an important QoS mapping process at
the terminal. The physical framework of QoS mapping is different based on different
DiffServ implementations. However, a key mapping link in always there. The data
packets are mapped into the appropriate COS based on the Relative Priority Index (RPI).
In order to satisfy different applications and reduce the edge exchange process, these
mapping processes are implemented at the end systems. QoS mapping is an important
technology in the implementation of DiffServ. The network edge router provides the
services and QoS assurance based on the service category in the specific data packet
header. The client can request an overall consideration of QoS requirements and service
charges, and map the packets into different service categories, so that the data packets
have the corresponding QoS guarantee in the network. Overall the QoS mapping is the
basic scheme for DiffServ.
In the DiffServ model, the services are sorted into i categories based on the
parameters of QoS, and COS is a set of related QoS parameters. The DiffServ model is
reflected as follows: If data packets request category i, the edge router provides services
according to the standard specified by the QoS parameter set of category i. COS is a
carrier that transmits QoS information between the terminal and network. According to
17

whether the defined type of services has global consistency, DiffServ implementation is
divided into two types: absolute implementation and relative implementation. Absolute
implementation can provide a more secure end-to-end QoS, but its structure is more
complex, and the flexibility and scalability are poor. When the sender conducts adaptive
coding and the network edge routers are more intelligent, relative implementation is more
flexible and efficient than absolute implementation. In order to separate the encoding
details and the network self-adaptive function, we need to define an appropriate
evaluation criterion by which each packet is marked with one RPI to correctly represent
the importance of the packet in the flow and integrate a variety of factors. An important
part to achieve DiffServ QoS is to determine the corresponding DiffServ COS based on
the RPI of each data packet, which is so called QoS mapping.
2.4.2 DiffServ Realization Mechanism
The DiffServ architecture provides theoretical principles and framework basis for
implementation of QoS guarantee mechanism in the IP backhaul network. The specific
usage strategies and the corresponding realization of the mechanism are decided by
different manufactures. QoS realization mechanism in the DiffServ model is the key to
provide QoS guarantee for users. It mainly consists of buffer management, packet
scheduling and packet classification mechanism [19-20].
1) Buffer management mechanism is designed to solve the packet-discard
problem, when network congestion happens. If the network congestion occurs at the
output port, the router buffers must discard some packets to improve the output flow of
18

the buffer queue. How to reasonably drop some packets is mainly determined by the
buffer management algorithm.
2) Packet scheduling mechanism is the queuing and regulation methods used on
data flows to prevent congestion at the network output ports. This mechanism determines
how a router selects the next packet from one or more buffer areas and forwards it. Main
performance indicators for an efficient packet scheduling algorithm include fairness,
delay characteristics, isolation capacity of malicious traffic flow, link bandwidth
utilization, and complexity.
3) Packet classification mechanism is mainly used in classifiers and regulators in
the DiffServ model. This mechanism ensures that input data flows accord with the Traffic
Conditioning Agreement (TCA) and classifies the flows to a certain behavior aggregate,
and then tags them as packets correspondingly. The classifier follows the specific rules in
TCA to assign packets to a category according to the fields in header such as the DSCP
value or the five-factor group of MF, and then hands this category over to the appropriate
regulator module for further processing.
In the DiffServ model, EF PHB provides low packet loss rate, delay, and jitter to
guarantee bandwidth services. AF PHB is responsible for providing a flow range in the
DiffServ domain. The packets within the flow range can receive ensured QoS, and those
beyond the range cannot receive guaranteed QoS. AF PHB provides four independent
forwarding AF categories, and each category has three different packet loss priorities. BE
is suitable for the traditional Internet service, but does not guarantee QoS.
19

According to 3GPP requirements, UE makes the request of QoS by mapping QoS
requirements in the end application layer to the Packet Data Protocol (PDP) parameters
via an application layer protocol such as the Session Description Protocol (SDP). The
management function of WCDMA QoS decides whether to accept the request based on
the resource utilization in the UTRAN, SGSN and GGSN. Once the request is allowed,
the DiffServ edge node defines the classifier settings and maps different QoS COS to
different PHBs based on the DiffServ framework in IP networks. Downlink WCDMA
QoS is controlled by a remote host to the GGSN. Then GGSN uses the DiffServ edge
function to re-classify the data flow by re-encoding DSCP, and assigns the data to
different PDP through DSCP. UE is responsible for controlling PDP content in the
process, while GGSN is responsible for providing interaction between the PDP content
and DiffServ. The control range of PDP flows is limited to access network part of the
WCDMA system between UE and GGSN.
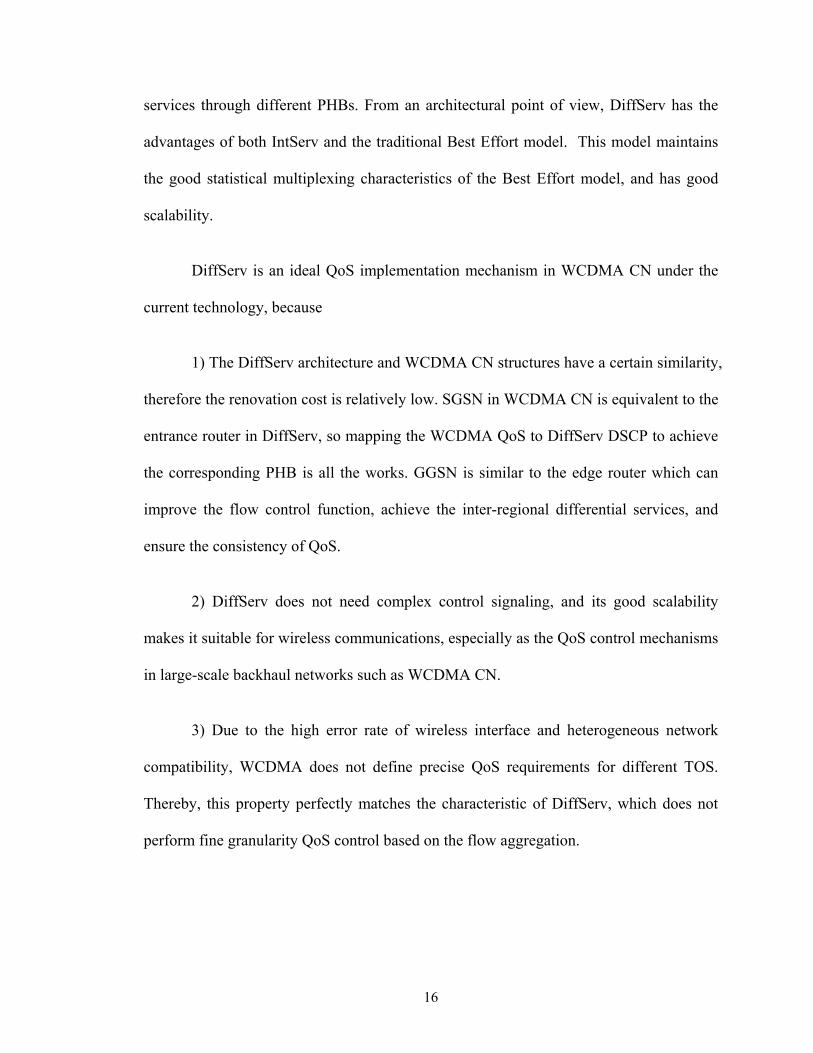
Figure 2-2 shows the detailed interactive flow of QoS control information, in
which RAP is the remote access point, and RUE means the remote UE. GGSN completes
the conversion from PDP to DiffServ in the uplink, while in the downlink the Flow
Template (TFT) completes the conversion from DiffServ to the PDP flow through the
TFT filters.
20
Figure 2-2 Control Information Interactive Process
In the WCDMA COS, the conversation and stream classes which are delay-
sensitive are mapped to EF and AF1 PHB, respectively, while the interaction and
background classes are mapped to AF2 and BE PHB, respectively. Each type of AF PHB
can be divided into different sub-types. For example, the interaction services with
different QoS requirements can be mapped to AF2 subtypes such as AF21, AF22 and
AF23. The mapping from different WCDMA COS to DiffServ PHBs is not unique. It
mainly reflects the different QoS requirements of various COS. The QoS control of these
service flows is directly determined by queue management algorithms, which include
buffer management and packet scheduling algorithms.
21
2.5 Summary
In this chapter, the WCDMA QoS requirements in 3GPP agreement were
analyzed. It is pointed out that the QoS problem in the CN is an extension of QoS
problem in IP networks. By studying on the DiffServ structure, we find that the DiffServ
model is more suitable to achieve QoS for WCDMA CN than IntServ. There was also an
in-depth analysis of the QoS mapping approach in the DiffServ model and of the
realization mechanism in this chapter. The DiffServ model of QoS is mainly
implemented in the data planes of GGSN and SGSN which are the main entities of
WCDMA CN.
22

CHAPTER 3
HARDWARE PLATFORM AND PROGRAMMING MODEL
OF DIFFSERV QOS FOR WCDMA CN
3.1 IXP2400 NP Overview
As the network scale and interface speed are both increasing, network equipment
based on a common Reduction Instruction Set Chip (RISC) technology cannot meet the
performance requirements of line-speed processing. On the other hand, new network
communication protocols and standards are emerging and changing, and the user's
demand is also constantly evolving. As a result, the product cycle of data communication
products is greatly shortened. In this background, an NP with both high-speed processing
and flexible programming capability provides a flexible solution for design of the next
generation communication products [21-23].
An NP is a general purpose chip that dedicates to network communication
equipment, which supports an open, diverse, and programmable development
environment. In the NP environment, different equipment vendors can use the same chip
to create their own network equipment with different functions and features. An NP
combines the advantages of RISC and Application Specific Integrated Circuit (ASIC).
Just as RISC, an NP is programmable and provides sufficient flexibility to adapt to the
fast development of data communication market. It also has high performance as ASIC,
but does not take a very long development period. An NP takes into account both
23

flexibility of RISC and implementation efficiency of ASIC, and also provides good
support for the second-layer to the seventh-layer applications. By downloading different
programs, the same hardware platform can support Virtual Local Area Network (VLAN)
switches, routers, broadband remote access servers, NAT, firewall, WEB switches and so
on. It supports all speeds of Ethernet, ATM, POS and other interfaces, so it is very
convenient for upgrading [21].
An NP has a typical multi-core RISC parallel real-time processing architecture. It
carries out real-time tasks of packet processing and network bandwidth management. An
NP usually consists of a general-purpose processor and multiple parallel or pipelined data
packets Processing Engines (PEs) and each internal PE supports multiple threads. Intel's
IXP2400 is an NP launched after IXP1200. This NP is based on Intel Exchange
Architecture (IXA) [22], and supports 2.5Gbps applications, with eight 600MHz micro-
engines and a 600MHz processing core XScale. One double-data-rate (DDR) SDRAM
and two quad-data-rate (QDR) SRAMs can be added to it. IXP2400 also supports
standard Media and Switch Fabric (MSF) interface standard SPI-3 or CSIX-L l. Its
Micro-engine processing power is suitable for data packet forwarding and other
functions. Eight micro-engines can forward three million packets in Layer 3 per second.
The XScale processor can be used to handle complex tasks, such as address learning,
establishing and maintaining forward table, and network management. IXP2400 provides
high-performance parallel processing capability, with various levels of scalability.
Combining the XScale microprocessor with eight separate 32-bit RISC micro packets
forwarding engines, as well as hardware multi-threading support, IXP2400 can achieve
24
5.4G operations per second to support a wide variety of WAN and LAN applications. By
improving the micro-engine architecture, IXP2400 achieves high performance and
scalability. These improvements include multi-threading allocation and high-speed cache
which gives the software pipeline feature.
3.2 IXP2400 Functional Modules
IXP2400 contains eight programmable 32-bit RISC processors which are called
micro-engines [23]. The micro-engines are dedicated to handling network traffic. Each
micro-engine has eight program counters for eight threads such that we can execute ALU
and shift operations in one clock period. Micro-engine instruction set is a data type
designed to quickly and efficiently forward packets for networking and communications
applications. The set includes bits, bytes and long words.
Micro-engine uses the multi-threading feature, so no extra clock time is needed
for thread switching overhead. Each thread has its own thread ID, allowing for the visit
results to be returned directly to the requesting thread. When a thread of micro-engines
sends a fetch request, this thread switches itself out to let other threads run. It waits for
the results from memory and then switches back to run. Thread-switching does not
require interrupt mechanism, but is under the control of the micro instructions. This
thread switching mechanism can take full advantage of the visit deposit gaps, to improve
the micro-engine utilization and throughput.
25

Figure 3-1 IXP2400 Main Functional Units
Figure 3-1 shows a simplified block diagram of IXP2400 main functional units,
and the functions of these units are described as below [24].
1) XScale core: It is a complete 32-bit RISC processor with high-performance,
low power consumption and compact layout features. It comes with an integrated cache
which can be used to achieve management functions, running routing protocols,
exception handling and other functions. This unit is applicable to be integrated with other
specific operational units in a single chip.
2) Eight micro-engines: These highly efficient RISC engines can be used on any
demand for quick detection, data processing, and transmission of packet contents. They
are fully programmable 32-bit engines with 5 levels of large pipelined register groups.
These micro-engines are multi-threading, and can conduct fast context switching in
context-sensitive register windows.
26

3) Peripheral Component Interconnect (PCI) bus interface module: This module is
a standard interface, which provides possible connection to other PCI devices or other
host processors. The PCI interface can reach speed of 133MHz, but this maximum
available speed is limited by the PCI bus protocol and bandwidth. There is no internal
direct connection between the PCI unit and micro-engines, so PCI is not the primary
means of IXP2400 data access.
4) SDRAM, SRAM and Scratchpad RAM modules: The SDRAM module is a
shared, intelligent memory interface, which can be accessed by the XScale core, micro-
engines and equipment on the PCI bus. The SRAM module is also a shared intelligent
interface, which can be accessed from the XScale and the micro-engine. Scratchpad
RAM has small space in IXP2400, and its delay is also very short. It is often used in
internal communications, and for shared semaphore and counters. These three storage
resources SRAM, SDRAM, and Scratchpad RAM are different in capacity and
bandwidth. The benefits of having all three types of storage are that each of these
memory operations can be carried out in parallel, and programmers can also select
different storage resources based on the requirements of performance. For example,
SDRAM memory is suitable for data packets storage and extra large tables, and SRAM
memory is for lookup table with shorter delay.
6) MSF interface module: The interface is used to connect IXP2400 to a physical
layer device (PHY) and/or to a Switch Fabric. The MSF consists of separate receive and
transmit interfaces, which are unidirectional and independent of each other.
27
3.3 Advantages of Using IXP2400 to Achieve DiffServ QoS
To accelerate the delivery ability of new network services, Intel is providing
network equipment vendors and network service providers with the latest second-
generation Intel IXA NPs. Each NP family is optimized to meet the requirements of
target network segments, and is complemented by software tools and development
platforms to reduce development cost. We choose IXP2400 as the hardware platform to
achieve DIFFSERV QoS for WCDMA CN based on the following reasons:
1) Multi-micro-engine and multi-threading technologies: Each micro-engine is a
fully programmable, multi-threaded RISC processor subsystem. It enables high-
performance packet processing in the data plane. When the system is running, each
micro-engine deals with only one task. During the thread switching, there is no need for
protection. This is because each thread has its own register. So the switching speed is
very fast.
2) XScale technology: Intel XScale core is designed to control the application
processing and for low-layer communications. It manages and updates the data structure
shared by routing tables and micro-engines, and establishes and controls the
communication media and switching devices. Because the XScale micro-architecture
uses the hyper-pipeline technology, it can achieve a relatively high performance. The
multi-process and efficient instruction-layer processing pipeline architecture makes the
reaction time be reduced to the minimum, and the clock speed is also selected to achieve
ultra-low energy consumption.
28
3) IXA mobile architecture technology: As described above, Intel IXA mobile
architecture provides us with advanced design architecture, so that we can develop
products quickly and efficiently.
3.4 IXP2400 Programming Models
In general, the data packet processing tasks in practical applications tend to be
more complex, so they require multiple micro-engines to work in parallel. This involves
how to distribute complex and arduous data tasks among a number of micro-engines, that
is, what kind of method can be adopted to map the packet processing tasks to the specific
micro-engines. Micro-engine programming model problem is a macro level strategic
issue [25], and the study of this problem focuses on how to distribute the data packets
among multiple micro-engines in order to obtain the highest processing performance.
Micro-engine programming model is universal, not only applicable to eight micro
engines in IXP2400, but also to sixteen micro-engines in IXP2800 and the future NPs
with more micro-engines.
Packet processing tasks in most applications are complex and diverse, while the
micro-engines are fully programmable, so the micro-engine programming models are
varied, and are also more flexible choices according to the actual situation. In the
following, we introduce two micro-engine programming models. One is known as the
super-task chain model such as HTC (Hyper Task Chaining) [26], and the other one is the
thread pool model such as POTs (Pool of Threads) [27]. No matter what kind of
programming model is chosen, the model must effectively solve two important problems
29

in the packet processing. One is maintaining packet ordering, and the other is the thread
mutual exclusion problem when multi-threads need to access the same data structure. In
mutual exclusion, when a thread is using a data structure for operation, the data structure
should be locked to prohibit the use by other threads in order to avoid undermining the
integrity of the data. This problem is divided into two situations including inside micro-
engine and among multi-micro-engines. In this chapter, we mainly discuss mutual
exclusion encountered in the multi-micro-engine parallel processing problems and the
corresponding solutions. Some applications require IXP2400 to maintain the order of
packets during the process, and let the data packets leave the IXP2400 according to the
arriving order. For example, when dealing with the compressed IPv6 packets, the current
data is compressed based on the previous packet, therefore only after the previous packet
is processed, the current data packet can be processed. In a word, data packets should be
processed in order, which is the so-called packet ordering problem.
3.4.1 The HTC Model
HTC is a pipeline style packet processing model [26, 27]. In this model, the
duration of each data packet processing time is relatively fixed, and pre-calculated.
Therefore, HTC model is commonly used in the situation that most of the data packets
are similar (mainly refers to the case that the packet processing complexity and
processing time are basically the same), as well as the situation that data packets belong
to the same data flow. In the latter case, we can use the LM, Q-Array, CAM and other
hardware structures to quick-fix mutual exclusion problem. In general, using the HTC
model for data packet processing can achieve relatively certain processing performance.
30
HTC divides a large data packet processing task into several small data packet
processing sub-tasks, namely, Network Function = Task l + Task 2 + Task 3 + ... + Task
n, Each sub-task can be organized and combined to get another large data packet
processing task. There are two combination models as follows:
1) Function Chaining: By using time-division, multiple packet processing tasks
are combined in a micro-engine to form a large data packet processing task. To enhance
the parallel processing capability, we use multiple micro-engines to run the same packet
processing program to process multiple packets. The Function Chaining method is
generally suitable for the situation in which multiple processing and substantial changes
need to be made for data packets
2) Context Chaining: This model allocates multiple sub-tasks to multiple micro-
engines by using space-division, and then these micro-engines are combined together to
form one large data packet processing task. Context Chaining is only used on
implementation of single processing and minor modifications for packets.
In general, a series of data packet processing tasks get involved between receiving
data packets and adding them into a queue. We can use Function Chaining to link a series
of data packet processing tasks together and process them on one micro-engine. For a
single micro-engine, packet processing tasks are very heavy, thus the execution speed of
Function Chaining is slower than that of Context Chaining. However, we can use
multiple micro-engines to work in parallel to improve overall system processing speed. In
Context Chaining, one micro-engine is responsible for one packet processing sub-task,
31
and unlike the Function Chaining in which one micro-engine is responsible for multiple
data packet processing sub-tasks. Therefore, Context Chaining is much simpler than the
Function Chaining. This is because that the mutual exclusion problem among multiple
micro-engines is not considered.
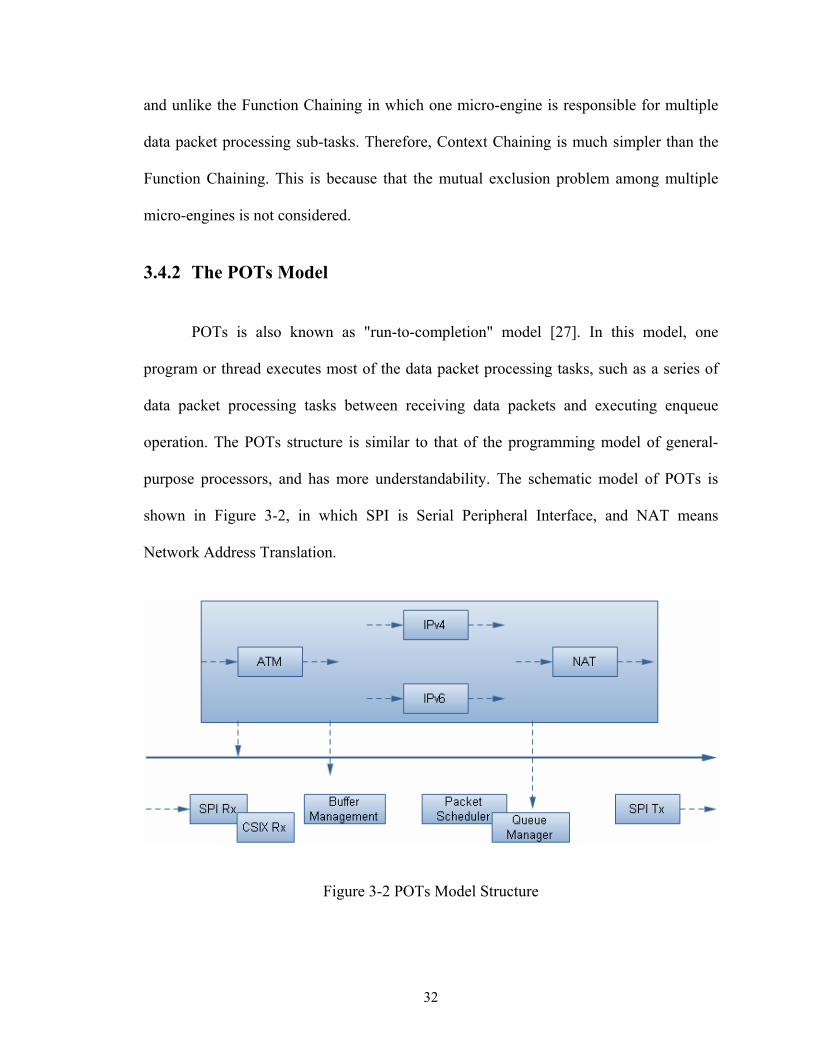
3.4.2 The POTs Model
POTs is also known as "run-to-completion" model [27]. In this model, one
program or thread executes most of the data packet processing tasks, such as a series of
data packet processing tasks between receiving data packets and executing enqueue
operation. The POTs structure is similar to that of the programming model of general-
purpose processors, and has more understandability. The schematic model of POTs is
shown in Figure 3-2, in which SPI is Serial Peripheral Interface, and NAT means
Network Address Translation.
Figure 3-2 POTs Model Structure
32
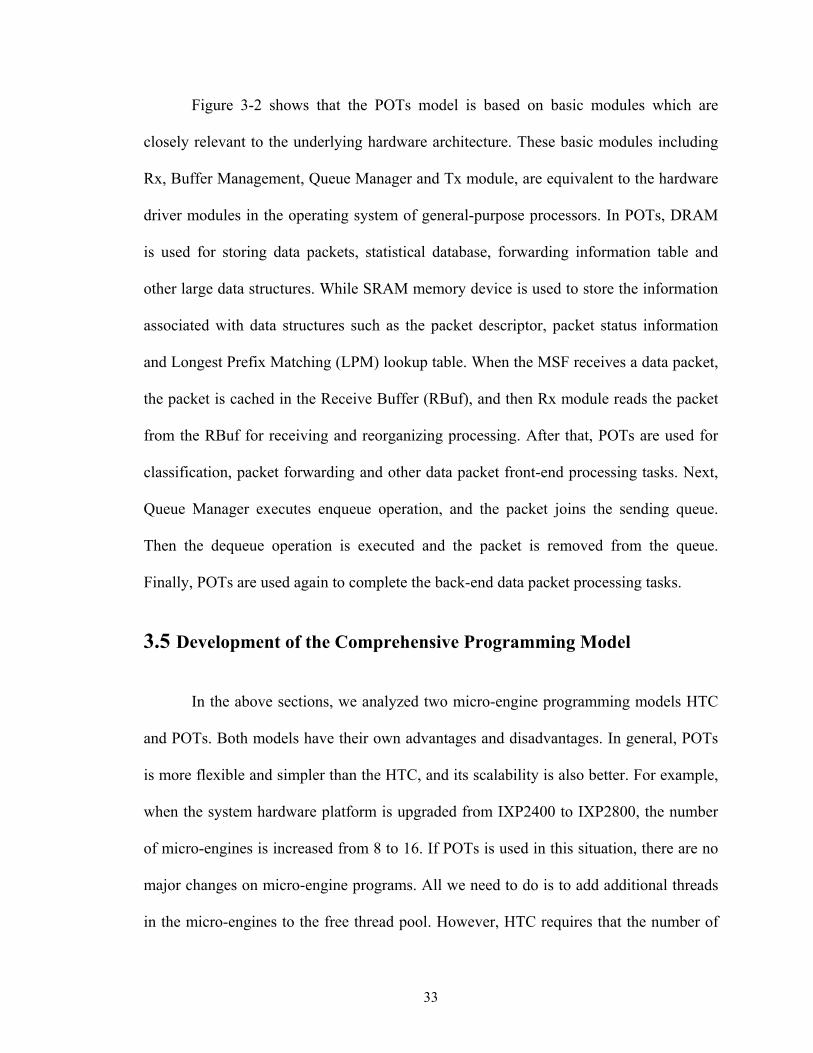
Figure 3-2 shows that the POTs model is based on basic modules which are
closely relevant to the underlying hardware architecture. These basic modules including
Rx, Buffer Management, Queue Manager and Tx module, are equivalent to the hardware
driver modules in the operating system of general-purpose processors. In POTs, DRAM
is used for storing data packets, statistical database, forwarding information table and
other large data structures. While SRAM memory device is used to store the information
associated with data structures such as the packet descriptor, packet status information
and Longest Prefix Matching (LPM) lookup table. When the MSF receives a data packet,
the packet is cached in the Receive Buffer (RBuf), and then Rx module reads the packet
from the RBuf for receiving and reorganizing processing. After that, POTs are used for
classification, packet forwarding and other data packet front-end processing tasks. Next,
Queue Manager executes enqueue operation, and the packet joins the sending queue.
Then the dequeue operation is executed and the packet is removed from the queue.
Finally, POTs are used again to complete the back-end data packet processing tasks.
3.5 Development of the Comprehensive Programming Model
In the above sections, we analyzed two micro-engine programming models HTC
and POTs. Both models have their own advantages and disadvantages. In general, POTs
is more flexible and simpler than the HTC, and its scalability is also better. For example,
when the system hardware platform is upgraded from IXP2400 to IXP2800, the number
of micro-engines is increased from 8 to 16. If POTs is used in this situation, there are no
major changes on micro-engine programs. All we need to do is to add additional threads
in the micro-engines to the free thread pool. However, HTC requires that the number of
33

packet processing sub-tasks equals to that of micro-engines, which means that we need to
re-design the data packet processing procedures and re-divide the data packet processing
tasks [28].
Assume that most of the data packets are basically the same, and the processing
time are roughly equal, HTC is more efficient than POTs during serial processing.
Because in HTC model, distributed cache such as CAM and LM can be used to quickly
solve the mutual exclusion problem, and the Inter-Threading-Signal mechanism is
relatively simple to solve the packet ordering problem. Conversely, POTs is more
efficient than HTC if differences of the processing time among data packets are relatively
significant. In this case, due to strict synchronization constraint between various threads
of HTC, those threads that process packets with relatively short processing time are idle,
and wait for other threads taking longer processing time. This results in waste of
resources and decline in processing speed. While threads in POTs run independently,
there are no strict synchronization requirements.
The comparison between HTC and POTs depends on the actual situation. As
described above, if the majority of the data packet and their processing time are basically
the same, we can use HTC module for fast processing of data packets. If the differences
are relatively large, POTs model can be used for effective processing. In addition, if we
take into account simplicity of program development and scalability of the corresponding
platform, POTs is a more suitable micro-engine programming model.
34
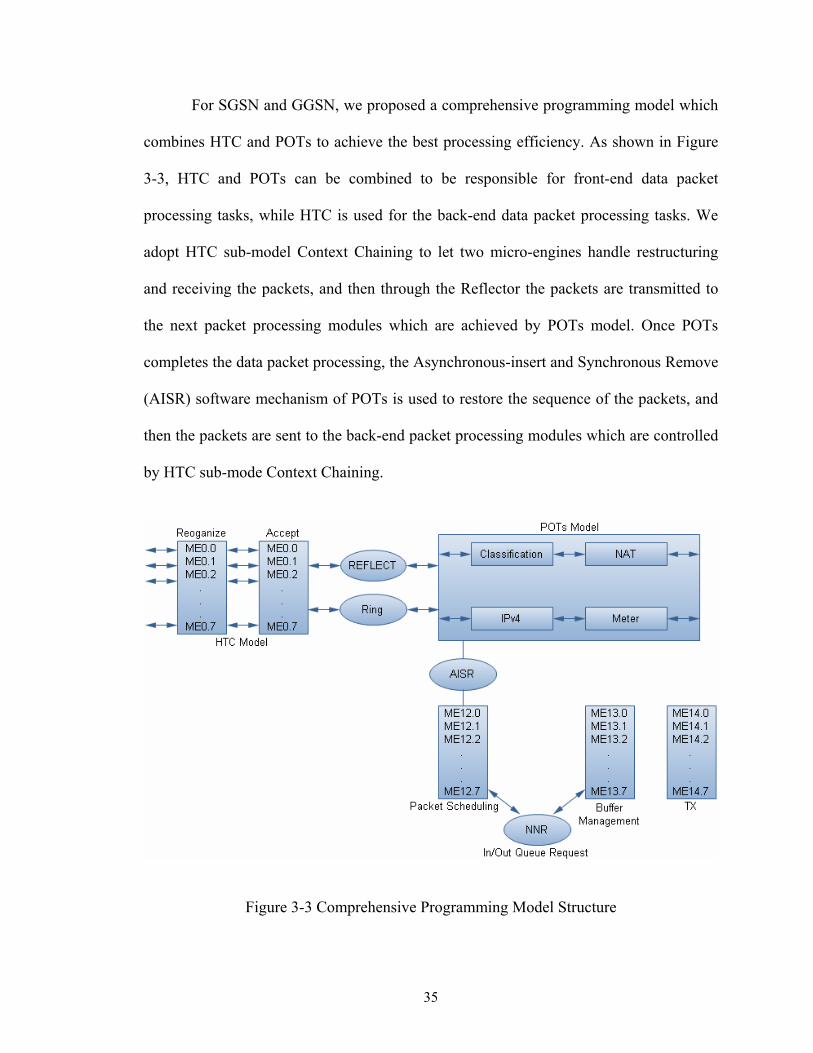
For SGSN and GGSN, we proposed a comprehensive programming model which
combines HTC and POTs to achieve the best processing efficiency. As shown in Figure
3-3, HTC and POTs can be combined to be responsible for front-end data packet
processing tasks, while HTC is used for the back-end data packet processing tasks. We
adopt HTC sub-model Context Chaining to let two micro-engines handle restructuring
and receiving the packets, and then through the Reflector the packets are transmitted to
the next packet processing modules which are achieved by POTs model. Once POTs
completes the data packet processing, the Asynchronous-insert and Synchronous Remove
(AISR) software mechanism of POTs is used to restore the sequence of the packets, and
then the packets are sent to the back-end packet processing modules which are controlled
by HTC sub-mode Context Chaining.
Figure 3-3 Comprehensive Programming Model Structure
35
3.6 Summary
WCDMA QoS must be implemented on the CN element nodes GGSN and SGSN,
and the data planes of SGSN and GGSN are implemented on forwarding board based on
NPs. An NP has high-speed processing and flexible programming capabilities, and it is
an ideal hardware platform to achieve DiffServ QoS for WCDMA CN. In gerenal, an NP
is different from a general-purpose processor in its operations and development methods,
so we need to better understand it in order to efficiently achieve the differentiated QoS
for WCDMA CN.
In this chapter, we presented in-depth analysis of two existing programming
models HTC and POTs. A comprehensive programming model was put forward to solve
the sharing conflicts and packets ordering problem. This model combines HTC and POTs
and maps them to different QoS management modules. This model gets the advantages of
the two existing models, and is highly efficient and flexible. We use this programming
model to implement DiffServ QoS for WCDMA CN.
36
CHAPTER 4
QUEUE MANAGEMENT ALGORITHM DESIGN
4.1 Queue Management Overview
Queue management plays a significant role in the control of network
transmission. It is the core mechanism to control network QoS, and the key method to
solve the network congestion problem. Queue management consists of buffer
management and packet scheduling. Generally the buffer management is applied at the
front of a queue and cooperates with the packet scheduling to complete the queue
operation [29, 30]. When a packet arrives at the front of a queue, the buffer management
decides whether to allow the packet to come into the buffer queue. From another point of
view, the buffer management determines whether to drop the packet or not, so it is also
known as dropping control.
4.2 Existing Buffer Management Algorithms
In recent years, the buffer management mechanism is a hot research area. A
number of schemes have been introduced in this area. These designs adopt different
control schemes for various situations. Based on basic principles of the buffer
management control, the control schemes of the buffer management can be analyzed
from two levels, data flow and data packet. In the data flow level if we view it from the
aspect of system resource management, the buffer management needs to adopt certain
resource management schemes to make a fair and effective allocation of queue buffer
37

resources among flows through the network nodes. In the data packet level and viewed
from the aspect of packet dropping control, the buffer management needs to adopt certain
drop control schemes to decide that under what kind of circumstances a packet should be
dropped, and which packet will be dropped. Considering congestion control response in
an end-to-end system, the transient effects for dropping different packets may vary
greatly. However, statistics of the long-term operation results indicates that the transient
effect gap is minimal, and this gap can be negligible in majority of cases. In some
specific circumstances, the completely shared resource management scheme can
cooperate with drop schemes such as tail-drop and head-drop to reach effective control.
However, in most cases, interaction between these two schemes is very large. So the
design of buffer management algorithms should consider both of the two schemes to
obtain better control effects [31, 32].
The RED algorithm [33] was proposed for active queue management (AQM)
mechanism [34] and was standardized as a recommendation from IETF [35]. RED
introduces congestion control to the router's queue operations, and uses early random
drop scheme to smooth packet dropping in time. This algorithm can effectively reduce or
even avoid the congestion in network, and solve the TCP protocol global synchronization
problem. However, one concern of the RED algorithm is the stability problem, i.e., the
performance of the algorithm is very sensitive to the control parameters and changes in
network traffic load. During heavy flow circumstances, the performance of RED drops
drastically. Since RED algorithm is based on best-effort service model, which does not
consider different levels of services and different user flows, it cannot provide fairness. In
38
order to improve the fairness and stability, several improved algorithms have been
developed, including WRED, SRED, Adaptive-RED, FRED, RED with In/Out (RIO)
[36, 37] etc. But these algorithms still have a lot of disadvantages. For example, a large
number of studies have shown that it is difficult to find a RIO parameter setting suitable
for various and changing network conditions.
4.3 Development of the PAFD Algorithm
This study proposed a new buffer management algorithm called PAFD (Packet
Adaptive Fair Dropping). This algorithm adaptively gains balance between congestion
and fairness according to cache congestion situation. When there is minor congestion, the
algorithm tends to fairly drop some packets in order to ensure that all users access the
system resources to their scale. For moderate congestion, the algorithm inclines to drop
packets of low quality service flows by reducing its sending rate using scheduling
algorithm to alleviate congestion. In severe congestion, the algorithm will tend to fairly
drop packets, through the upper flow control mechanism to meet the QoS requirements,
and reduces sending rate of most service flows, in order to speed up the process of easing
the congestion.
In buffer management or packet scheduling algorithms, it will improve the system
performance to have service flows with better transmission conditions reserved in
advance. But this operation makes system resources such as buffer space and bandwidth
be unfairly distributed, so that QoS of service flows with poor transmission conditions
cannot be guaranteed. Packet scheduling algorithms usually use generalized processor
39

sharing (GPS) as a comparative model of fairness. During the process of realization of
packet scheduling algorithms based on GPS, each service flow will be assigned a static
weight to show their QoS. The weight i actually expresses the percentage of the service
flow i in the entire bandwidth B. i does not change with packet scheduling algorithms,
and meets
11
N
ii
(4-1)
where N expresses the number of service flows in the link. And the service volume is
described by
inc ii
jj B
g B
(4-2)
where i, j denotes two different service flows. In GPS based algorithms, the bandwidth
allocation of different service flows meets the requirement Bi/i = Bj/j, where Bi is the
allocated bandwidth of the service flow i. By assigning a smaller weight low to an
unimportant background service flow, the weight of service flow with high priority high
is much larger than low, so that the majority of the bandwidth is accessed by high-priority
service flows.
4.3.1 Algorithm Description
In buffer management algorithms, how to control the buffer space occupation is
very important [38]. Here we define
40

j
j
i
i
W
C
W
C
(4-3)
where Ci is the buffer space occupation, and Wi expresses the synthetic weight of the
service flow i. When the cache is full, the service flow with the largest value of Ci /Wi
will be dropped in order to guarantee fairness. Here the fairness is reflected in packets
with different queue length [39-40]. Assume that ui is the weight, and vi is the current
queue length of the service flow i. The synthetic weight Wi can be calculated as described
by
(1 )i iW u iv (4-4)
where α is the adjust parameter of the two weighting coefficients ui and vi . The parameter
α can be pre-assigned, or determined in accordance with usage of the cache. The weight
ui is related to the service flow itself, and different service flows are assigned with
different weight values. As long as the service flow is active, this factor remains
unchanged. But vi is time varying, which reflects dropping situation of the current service
flow.
Suppose a new packet T arrives, then the PAFD algorithm process is described as
follows:
Step 1: Check whether the remaining cache space can accommodate the packet T,
if the remaining space is more than or equal to the length of T, add T into the cache
queue. Otherwise, drop some packets from the cache to free enough storage space. The
41

decision on which packet will be dropped is given in the following steps.
Step 2: Calculate the weighting coefficients u and v for each service flow, and the
value of the parameter α. Then find the values of new synthetic weights W for each flow
according to (4-4).
Step 3: Choose the service flow with the largest weighted buffer space occupation
(Ci/Wi). If the service flow associated to the packet T has the same value as it, then drop T
at the probability P and returns. Otherwise, drop the head packet of the service flow with
the largest weighted buffer space occupation at probability 1P, and add T into the cache
queue. Here Probability P is a random number generated by the system to ensure the
smoothness and stability of the process.
Step 4: Check whether the remaining space can accommodate another new
packet, If the answer is yes, the packet will be transmitted into the cache. Otherwise,
return to Step 3 to continuously choose and drop packets until there is sufficient space.
If all packet lengths are the same, the algorithm only needs one cycle to compare
and select the service flow with the largest weighted buffer space occupation. Therefore,
the time complexity of the algorithm is O(N). In this case, we also need additional 4N
storage space to store the weights. Taking into account the limited capacity of wireless
network, N is usually less than 100. So in general the algorithm's overhead on time and
space complexity are not large. On the other hand, if packet lengths are different, then it
is necessary to cycle Step 3 and Step 4 until the cache has enough space to accommodate
the new packet. The largest cycling times is related to the ratio between the longest and
42

the shortest packets. At this moment, the time complexity overhead is still small based on
practices.
In Step 2, α, a function of shared buffer, is a parameter for adjusting proportion of
the two weighting coefficients u and v. For a large value of α, the PAFD algorithm tends
to fairly select and drops packets according to the synthetic weight W. Otherwise, the
algorithm tends to select and drop the service flow with large queue length. A reasonable
value for α can be used to balance between fairness and performance. Here we introduce
an adaptive method to determine the value of α based on the congestion situation of the
cache, and this process does not require manual intervention.
When there is a minor congestion, the congestion can be relieved by reducing the
sending rate of a small number of service flows. The number of service flows in wireless
network nodes is not as many as that in the wired network. So the minor congestion can
be relieved by reducing the sending rate of any one of service flows. We hope this choice
is fair, to ensure that all user access to the system resources according to their weights.
When there is a moderate congestion, the congestion cannot be relieved by
reducing the sending rate of any one of service flows. Reducing the rate of different
service flows will produce different results. We hope to reduce the rate of service flows
which are most effective to the relief of congestion. That is, the service flow which
current queue length is the longest (The time that these service flow occupied the cache is
also the longest). This not only improves system throughput, but also made to speeds up
the congestion relief.
43

When there is a severe congestion, it is obvious that reducing the sending rate of a
small portion of the service flows cannot achieve the congestion relief. We may need to
reduce the rate of a lot of service flows. Since the TCP has a characteristic of additive
increase multiplicative decrease (AIMD), continuous drop packets from one service flow
to reduce the sending rate would adversely affect the performance of the TCP flow.
While the effect on relieving system congestion becomes smaller, we gradually increase
the values of parameters, and the algorithm will choose service flows to drop packet
fairly. On one hand, at this point the "fairness" can bring the same benefits as in the
minor congestion system; on the other hand this is to avoid continuously dropping the
longer queue service flow.
Congestion is measured by the system buffer space occupation rate. α is a
parameter relevant to system congestion status and its value is between 0 to 1. Assume
that the current buffer space occupation rate is denoted by Buffercur, and Buffermedium,
Buffermin, and Buffermax represent threshold value of the buffer space occupation rate for
moderate, minor, and severe congestion, respectively.
When Buffercur is close to Buffermin, the system enters a state of minor congestion.
The system is in a state of severe congestion when Buffercur reaches Buffermax. The value
of α can be determined by using linear approach, then the system will have a dramatic
oscillation. Instead we use high order nonlinear or index reduction to get smooth curve of
α as shown in Figure 4-1.
44

Figure 4-1 An Adaptive Curve of Parameter α
The value of α can be calculated from
2 2
2 22 2
2 2
2 2
0, if <
1 , if
1, if <
cur min
cur minmin cur max
max min
cur max
Buffer Buffer
Buffer BufferBuffer Buffer Buffer
Buffer Buffer
Buffer Buffer
2
(4-5)
4.3.2 DiffServ Support
In the PAFD algorithm, we can adopt the DiffServ model to simplify the service
flows by dividing them into high-priority services such as assurance services and low-
priority services such as best-effort services. We use the queuing method for the shared
cache to set and manage the cache. When a new packet arrives at the cache, first the
service flow is checked to see whether it matches the service level agreement (SLA). If it
does, then this new packet enters the corresponding queue. Otherwise, the packet is
assigned to low-priority services, and then enters the low-priority queue.
45

In the DiffServ model, we retain the implement process of PAFD, and only
modify (4-4) into
))1(( iii vuW (4-6)
where β is a new parameter used to adjust the fairness among service flows of different
service levels.
As mentioned above, we can set the value of parameter α different from that
shown in Figure 4-1 to satisfy different requirements. For high-priority services, the
curve in Figure 4-1 is reasonable. The fairness is able to guarantee the QoS for different
service flows, and is required to relief congestion quickly. For high-priority services
which have no delay constraints and high fairness requirements, a higher throughput is
more practical. Therefore, we can get the value of the parameter α for low-priority
services, which is slightly less than that for high-priority services as shown in Figure 4-2.
(a) The Value Curve for the Best Effort Model
46

(b) The Value Curve for the Assurance Model
Figure 4-2 Values of Parameter α for Different Priority Services
Now we check effects of the parameter β. For high-priority services, β is a
constant with value 1. For low-priority services, the β is less than 1, and influenced by the
network load. When network load is low, β equals to 1. In this case, different level
service flows have the same priority to share the network resources. As network load
increases, in order to guarantee the QoS of high-priority services, low-priority services
gradually give up some transmission opportunities, so the value of β decreases. The
higher network load is, the smaller the values of β and W are. Therefore, the probability
of a low-priority packet being dropped is higher. Values of β are shown below.
Figure 4-3 Values of Parameter for Different Priority Services
47

4.4 PAFD Simulation Results
4.4.1 Simulation for Commen Services
We compare the PAFD algorithm with two commonly used buffer management
algorithms RED and tail drop (TD). We choose two common packet scheduling
algorithms Best Channel First (BCF) and Longest Queue First (LQF) to work with
PAFD, RED and TD. Here the LQF uses the weighted queue length for packet
scheduling. So there are 6 queue management algorithm combinations, which are PAFD-
BCF, PAFD-LQF, RED-BCF, RED-LQF, TD-BCF, and TD-LQF. The performance
comparisons of these algorithms are carried out with respect to throughput effectiveness,
average queuing delay, and fairness.
We use K1297-G20 signaling analyzer to simulate packet sending, and the
operation system for K1297-G20 is Windows NT 4.0. ADLINK 6240 is used as the NP
blade. Based on the simulation configuration, there are 8 different packet length
configurations for the data source. They are fixed length of 64 bytes, fixed length of 65
bytes, fixed length of 128 byte, fixed length of 129 bytes, fixed length of 256 bytes,
random length of 64-128 bytes, random length of 64-256 bytes, and random length of 64-
1500 bytes.
Figure 4-4 shows that all the algorithms have similar throughputs for low network
load. When the load increases, the throughput effectiveness of BCF is higher than that of
other scheduling algorithms. This figure shows that PAFD-BCF provides significant
48

higher throughput than the other algorithms. PAFD does not randomly drop or simply tail
drop packets, but fully considers fairness and transmission conditions. In this way,
service flows under poor transmission condition receive high probability of packet
dropping, thus a relatively short virtual queue. When BCF is working with PAFD, the
service flow under better channel transmission condition will give higher priority and
result effective throughput.
Figure 4-4 Throughputs Comparison between RED and PAFD
From Figure 4-5, we find that RED has better performance on the average
queuing delay due to the early detection capability of congestion and its drop mechanism.
BCF has better performance on queuing delay than that of LQF. As the load increases,
the average queuing delay of PAFD first increases, then decreases. This is because PAFD
does not use tail drop, and instead searches a service flow with the largest weighted
buffer space occupation to drop the head packet to reduce average queuing time.
49
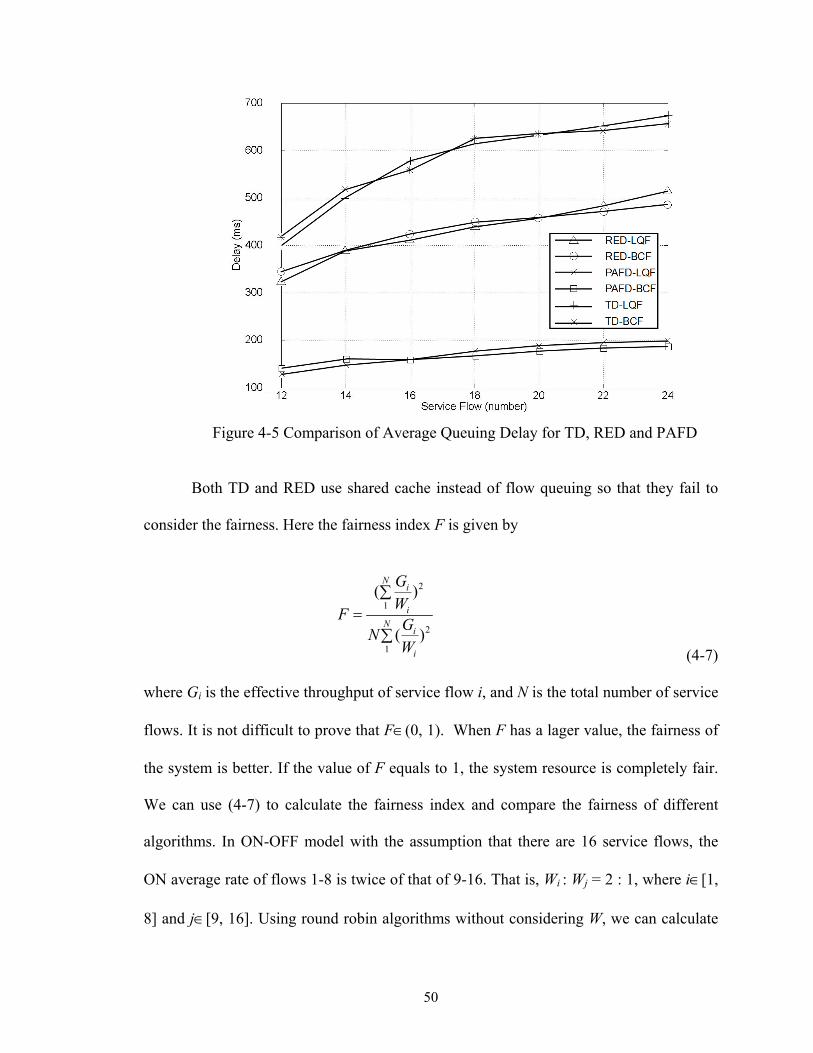
Figure 4-5 Comparison of Average Queuing Delay for TD, RED and PAFD
Both TD and RED use shared cache instead of flow queuing so that they fail to
consider the fairness. Here the fairness index F is given by
2
1
2
1
( )
( )
Ni
i
Ni
i
GW
FG
NW
(4-7)
where Gi is the effective throughput of service flow i, and N is the total number of service
flows. It is not difficult to prove that F(0, 1). When F has a lager value, the fairness of
the system is better. If the value of F equals to 1, the system resource is completely fair.
We can use (4-7) to calculate the fairness index and compare the fairness of different
algorithms. In ON-OFF model with the assumption that there are 16 service flows, the
ON average rate of flows 1-8 is twice of that of 9-16. That is, Wi : Wj = 2 : 1, where i[1,
8] and j[9, 16]. Using round robin algorithms without considering W, we can calculate
50

the reference value of fairness index F = 0.9. Table 4-1 gives the fairness index of TD,
RED and PAFD which are combined with packet scheduling algorithms.
Table 4-1 Fairness Index Comparison of TD, RED and PAFD
Algorithms Fairness TD-BCF 0.8208 TD-LQF 0.9169
RED-BCF 0.8839 RED-LQF 0.9968
PAFD-BCF 0.8915 PAFD-LQF 0.9992
This table indicates that the fairness index of BCF is lower when combined with
TD and RED. Since PAFD takes the fairness into consideration, the fairness index of
PAFD is higher than that of TD when there are congestions. The combination of PAFD
and LQF has higher throughput and more fair distribution of cache and bandwidth
resources. By changing the value of α, we can conveniently balance the system
performance and fairness based on the requirements.
4.4.2 Simulation for DiffServ
In this section we adopted the same environment as described in the previous
section to test the PAFD performance based on the DiffServ model. The only difference
is that half of the services are set to high-priority, and another half to low-priority.
Figures 4-6 and 4-7 show the throughput and average queuing delay of those
algorithms. The only difference in these two tests is that the value of α for half of the
51

service flows used in the latter is slightly lower than the one in the former. So the curves
in Figures 4-6 and 4-7 are very similar to those shown in Figures 4-4 and 4-5.
Figure 4-6 Throughputs Comparison between RED and DS-PAFD
Figure 4-7 Comparison of Average Queuing Delay of RED and DS-PAFD
52

Table 4-2 gives the comparison of fairness index of theses algorithms. Comparing
these numbers with those shown in Table 4-1, we can draw a similar conclusion.
However, the difference in values is that the fairness index of low-priority services is
slightly lower than that of high-priority services as a result of different values of α.
Table 4-2 Fairness Index Comparison between TD and DS-PAFD
TD-BCF TD-LQF Flow 0.8355 0.9271
DSPAFD-BCF DSPAFD-LQF High-priority Service Flow 0.8826 0.9937
DSPAFD-BCF DSPAFD-LQF Low-priority Service Flow 0.8342 0.9497
As shown in Figures 4-2, 4-3, 4-6 and 4-7, when network load is light, the
throughputs are similar for different priority services. This means different priority
services have the same priority to share network resources. As network load increases,
the throughput gradually decreases. However, even in the case of heavy load, the PAFD
algorithm still allocates small portion of resources to low-priority services to meet the
fairness requirement. And this operation will prevent high-priority services from fully
occupying the network resources.
4.5 Existing Packet Scheduling Algorithms
Packet scheduling mechanism is the most important module in DiffServ
agreement to implement QoS. It is also an active research area in DiffServ. It is of great
practical significance to design appropriate packet scheduling mechanisms according to
53
the different QoS requirements for applications. This has been the most concern for
network equipment manufacturers and carriers.
Scheduling is one of the key schemes of system resource management. It is an
effective mean to solve multiple services resources sharing problems. Network system
resources generally consist of three parts: buffers, link bandwidth, and processor
resources. The buffer management has been fully considered in hardware perspective of
NPs. Link bandwidth management by packet scheduling means determining which
packet is to be selected from the waiting queue and sent according to certain rules to
provide better and timely services for high priority packets, so that all input service flows
can follow a predetermined way to share the output link bandwidth. The main
performance parameters are bandwidth allocation, latency, packet loss rate, latency jitter
and so on. Figure 4-8 is a typical packet scheduling system.
Figure 4-8 A Typical Packet Scheduling System
There is only a single queue at each output link interface for the traditional
network switching equipment. As long as the underlying link has the capacity of
transmitting the data, it fetches the packet from the queue as soon as possible. However,
54

network environments supporting QoS require that each scheduler of switching
equipment can schedule multiple queues at the same time and these queues share the
output link capacity. When and how frequently to fetch the packet from each queue for
transmission depends on what packet scheduling algorithms the scheduler runs. When
packets in a queue are scheduled to be sent, the rest of the queues must wait. Within each
queue, first-come first-served (FCFS) method can be used, and services of a packet
cannot be interrupted. The basic process in packet scheduling is to make judgments based
on certain queue information, and to control the frequency of various queues occupying
link bandwidth, thereby affecting the latency, loss and other parameters. In general, more
information is considered, more effective the algorithm is, but the complexity is also
higher. Advanced service scheduling algorithms store the packets in different queues, and
then compute their dynamic priorities as the control parameters.
Research on packet scheduling algorithms has been a hot topic. So far, dozens of
algorithms have been proposed. They have different services rules, control objectives,
and complexity. According to the working principle and control objectives, they can be
divided into two groups: general processor sharing (GPS) based scheduling and round-
robin-based scheduling algorithms. Currently the GPS-based scheduling algorithms
mainly are weighted fair queuing (WFQ) [41], packet fairness queuing (PFQ) [42], self-
clocking fair queuing (SCFQ) [43], and virtual clock (VC). These algorithms can provide
better fairness, latency characteristics, and isolation of malicious flows. However, the
larger the number of queues is, the more complex these algorithms are to be
implemented. Round-robin-based algorithms mainly have Weighted Round Robin
55

(WRR) [44], Deficit Round Robin (DRR) [45], etc. These algorithms are to serve each
divided group in turn, and the implementation is relatively simple, but they cannot
provide latency guarantee on the service flow.
By analyzing some typical network applications, we can tell an appropriate
scheduling algorithm should meet the following criterions: to have smaller average
latency and maximum latency for low throughput applications (audio, TELNET); to
provide fairness for variable bit rates (VBR) video so that its packet loss rate is within an
acceptable range; to provide fairness under the changes of server processing capacity
circumstances for the throughput-sensitive and flow-controlled data applications.
4.6 Development of the PWFQ Algorithm
The most significant characteristics that NPs differ from the general-purpose
processors are multi-CPU and multi-threaded. The traditional packet scheduling
algorithms cannot use these powerful parallel features, and only consider fairness of the
bandwidth, rather than fairness of processor resource scheduling. Therefore, in this study
a WFQ based packet scheduling algorithm called PWFQ was introduced, which can
provide appropriate system guarantees on fairness, latency, and bandwidth utilization.
Since WFQ algorithm cannot be directly used for processor resource scheduling and a
variety of resource allocations, we design a new system virtual time function and system
processing time calculation scheme in the PWFQ algorithm in order to maintain balance
between bandwidth and CPU resources.
56

4.6.1 Algorithm Description
Based on single exponential smooth (SES) forecasting method, the packet
processing time is given below.
ttt FaaXF 11 (4-8)
where Ft+1 is the predictive value of the next moment; Xt is the actual value of the present
moment; Ft is the forecasted value of current time and a is a user-defined smooth
coefficient 0 < a < 1.
Packet processing includes packet head processing and payload processing.
Packet head processing has nothing to do with the length of the packet, and payload
processing is associated with the packet length. Therefore, we introduce a packet
processing parameter SF to characterized different packet processing.
t
t
L
LSF 11
(4-9)
where Lt is packet length at t moment. We synthesize (4-8) and (4-9) to get:
ttt FaaXSFF 11 (4-10)
57

where Lt+1 is packet length at t+1 moment. If the packet length changes at next moment,
we introduce r to represent the change of packet length. In the WFQ algorithm, the
system virtual time is given by
...3,2)()(
0)0(
111 jttr
tVtV
V
jjjj
(4-11)
The algorithm PWFQ takes into account the weight of CPU, and can be defined
as
BW
rLEPSF
L
LSF
aPPSFEP
aVFS
tPPaaPtPP
tsumtVtV
tSum
ibw
iki
icpu
kik
ik
i
pi
ki
i
kiii
ki
ki
ki
ki
it
ii
w
tBi
ibw
icpuw
6
1
10
)(
)(,max
)()1()(
)()()(
)(
(4-12)
where and - the CPU bandwidth and weight, B(t) - set of active flows, Sumw(t) -
the sum of bandwidth and CPU resources weight, V(t)- system virtual time, Pit - actual
packet processing consumes at time t, PPi(t) - processing consumption of packet k from
the flow i at time t, Sik and V(ai
k) - virtual start time and the virtual system time of packet
icpu i
bw
58
k from the flow i, PPi(aik) - estimated processing consumption of packet k from the flow i,
Fik-1- virtual end time of packet k from the flow i, EPi
k - estimated processing time of
packet k from the flow i in seconds, SFi - packet head processing parameter, Lik - packet
length of packet k from the flow i, Lip - the length of the last processed packet, τ - time
difference between the two updates, a - SES parameter usually with value of 0.4, ri-
packet length change parameter, BW- sending bandwidth (MBPS).
The scheduler maintains scheduling information of each flow such as ri, PPi(t)
and so on. After the start of scheduling, V(t) and PPi(t) in all flows are set to 0. When a
new packet arrives, the scheduler updates the system virtual time, using (4-12) to
calculate the packet virtual end time and add the packet to the corresponding flow at the
same time. When an out queue request is received, the scheduler finds the packet with the
smallest virtual end time and outputs it according to the head packets in each active
queue. At the same time the virtual end time is updated according to (4-12).
4.6.2 Performance Analysis
Theorem 1: The computational complexity of PWFQ is O(logN).
PWFQ computing time mostly focuses on two tasks: computing system virtual
time V(t) and choosing the next first completed packet for transmission. The first task
needs to sort the virtual start time of the head packet in all packets accumulation, in order
to select the packet (i.e., a qualified packet). The second task needs to sort the virtual end
time for all qualified packets and to select the first service packet in the actual system. In
the worst case, N connections are all active, at this time the computational complexity of
59
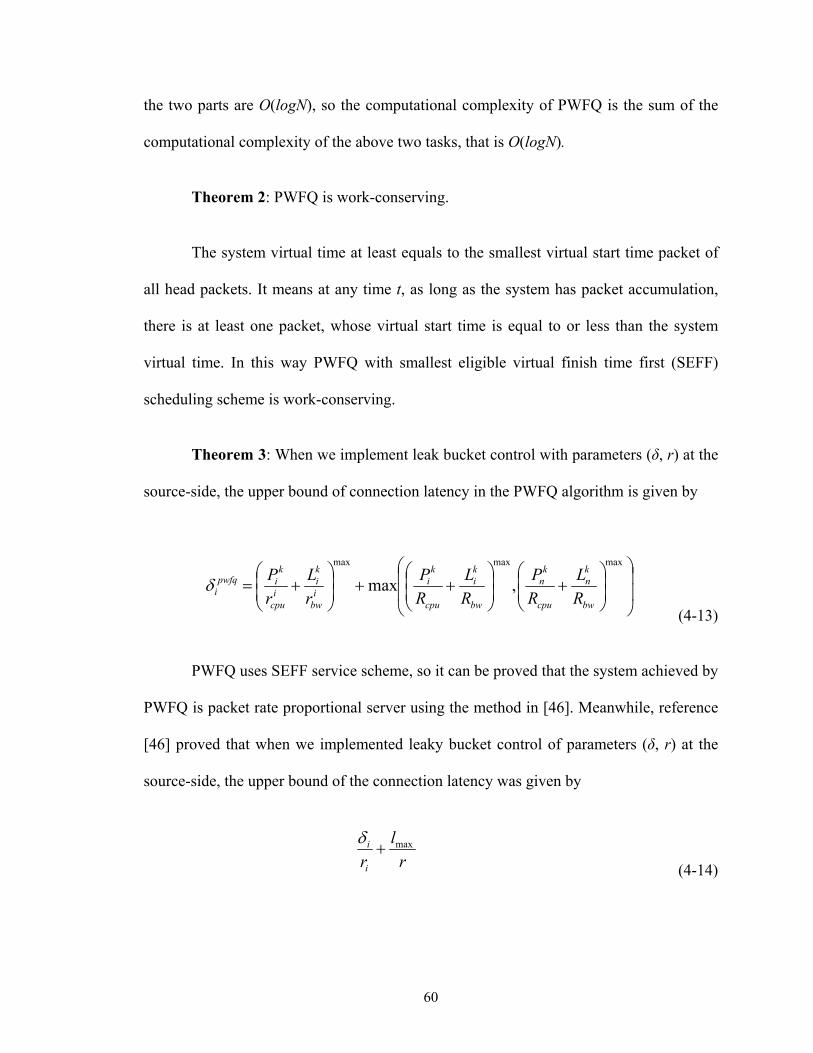
the two parts are O(logN), so the computational complexity of PWFQ is the sum of the
computational complexity of the above two tasks, that is O(logN).
Theorem 2: PWFQ is work-conserving.
The system virtual time at least equals to the smallest virtual start time packet of
all head packets. It means at any time t, as long as the system has packet accumulation,
there is at least one packet, whose virtual start time is equal to or less than the system
virtual time. In this way PWFQ with smallest eligible virtual finish time first (SEFF)
scheduling scheme is work-conserving.
Theorem 3: When we implement leak bucket control with parameters (δ, r) at the
source-side, the upper bound of connection latency in the PWFQ algorithm is given by
maxmaxmax
,maxbw
kn
cpu
kn
bw
ki
cpu
ki
ibw
ki
icpu
kipwfq
i R
L
R
P
R
L
R
P
r
L
r
P
(4-13)
PWFQ uses SEFF service scheme, so it can be proved that the system achieved by
PWFQ is packet rate proportional server using the method in [46]. Meanwhile, reference
[46] proved that when we implemented leaky bucket control of parameters (δ, r) at the
source-side, the upper bound of the connection latency was given by
r
l
ri
i max
(4-14)
60

Theorem 4: In the worst case, the fairness index of PWFQ algorithm in
connection i is described by
r
l
r
l
r
lc i
i
ikpwfqi
maxmaxmax
, (4-15)
Proof is given as follows:
r
l
r
l
r
l
r
aQ
r
l
r
lr
raQ
r
l
r
lr
raQ
r
l
r
aQ
r
l
r
aQad
r
lad
r
ladad
i
i
i
i
ki
kpwfqi
i
iik
ik
pwfqi
i
iik
ik
pwfqi
i
ki
kgpsi
i
ki
kgpsik
ikgpsi
ki
kpwfqi
ki
kgpsi
ki
kpwfqi
maxmaxmax
,max
max,
max
max,
max,
max,,
max,
max,,
1
1
(4-16)
where , represent arrival time and departure time of packet k in the connection
i, respectively.
kpwfqid ,
kia
[47] defined WFQ latency specifications. WFQ algorithm is used for CPU
scheduling and packet scheduling, respectively. The latency is the sum of both.
bwi
bw
i
cpui
cpu
iwfqi R
L
r
L
R
P
r
P maxmax
maxmax
(4-17)
where - sum of latency of scheduling CPU and bandwidth, Pimax - maximum
processing consumption of each packet in flow i, ricpu and ri
bw - reserved resources of
wfqi
61

CPU and bandwidth, Pmax - maximum processing consumption of all flows, Rbw and Rcpu -
system bandwidth and CPU resources, Limax - maximum packet length of flow i, Lmax -
maximum packet length of all flows.
Compared with PWFQ latency defined in (4-13), it can be seen that .
The PWFQ algorithm has better latency characteristics than the WFQ. Here we can use a
practical example to verify this. We assume that there are two flows: packet length of
flow 1 is 100Byte and takes 9 million CPU clocks to process. Packet length of flow 2 is
900Byte and needs 1 million CPU clocks to process. The processing capacity of a
communication node is 500Mbyte, and sending link is 400Kbyte. It can be shown that the
flow 1 retained 90% of the CPU capacity and 10% of the bandwidth, while flow 2
retained 10% of the CPU capacity and 90% of the bandwidth. From the comparison of
the results shown in Table 4-3, we can see the latency of PWFQ is better than WFQ.
wfqi
pwfqi
Table 4-3 Comparison of Algorithm Results
Flow Pi Li ricpu ri
bw pwfqi wfq
i
1 9M 100B 450B 40 60 76 2 1M 900B 50B 360 60 76
4.7 PWFQ Simulation Results
We use 16 different flows to test the algorithm developed in this study. These
flows require different CPU processing time. Simulation is carried out with
TRANSCTOR of IXAWORKBENCH 3.0. The transmission rate is set to 50Mbps.
SRAM frequency is 200MHz. DRAM frequency is 150MHz. PLL frequency is set to
62

1200MHz. We use WORKBENCH packet generator to simulate the sending packets. The
results are shown in the tables below.
Table 4-4 Flows Distribution
Flow Number
CPU Requirements
Bandwidth Requirements
CPU Demand Instruction Cycles
Packet Length
1,5,9,13 HIGH LOW 2400-3600 43-48 2,6,10,14 LOW HIGH 78-134 120-127
7,16 MEDIUM MEDIUM 1200-1800 80-88 3,8,12 LOW LOW 78-134 42-48 4,11,15 HIGH HIGH 2400-3600 120-127
Table 4-5 Latency Comparison
Mode
PWFQ Max
Latency
PWFQ Average Latency
PWFQ Variance
WFQ Max
Latency
WFQ Average Latency
WFQ Variance
High CPU High Bandwidth
1.05 0.68 0.13 1.1 0.79 0.13
High CPU Low Bandwidth
1.02 0.69 0.13 1.1 0.77 0.15
Low CPU High Bandwidth
0.82 0.58 0.1 1.09 0.70 0.13
Low CPU Low Bandwidth
0.79 0.55 0.09 1.0 0.68 0.13
Medium CPU Medium Bandwidth
0.96 0.68 0.12 1.08 0.79 0.13
From these two tables, we can see that the latency of PWFQ has obvious
improvement over WFQ. In an average case, i.e., the high CPU and high bandwidth, the
latency reduction is 13%; for the low bandwidth and high CPU, the latency decreases by
12%; for the low-bandwidth and low CPU, the latency is reduced by 21%.
63

The PWFQ algorithm also has smaller variance, because the consumption of
comprehensive scheduling of packets in the flow is less than or equals to that of
scheduling them separately.
4.8 Summary
Queue management algorithm is the key scheme to achieve network QoS control.
It is an important element of network resources management. By controlling different
types of packets access and use the link bandwidth, different data flows get different
levels of services. It is necessary to ensure high speed scheduling, latency QoS and fair
access guarantee. It is also very important to consider the comprehensive performance of
the algorithms while pursuing simplicity and easy implementation.
In this chapter we discussed the queue management algorithms from the buffer
management and packet scheduling aspects. Based on the hardware features of NPs,
PAFD and PWFQ algorithms were proposed. The PAFD algorithm takes into account the
impact of packet transmission environment. It can adaptively gain balance between the
congestion and fairness based on the congestion status of cache. The experiment results
showed that the system achieved better balance between throughput and fairness after
applying the algorithm. Packet scheduling algorithm PWFQ gives full consideration of
the characteristics of NPs. It adds CPU scheduling based on the traditional WFQ
scheduling algorithm. The simulation measurements showed that this algorithm achieved
better latency guarantee than the WFQ.
64
CHAPTER 5
PACKET CLASSIFICATION ALGORITHM DESIGN
5.1 Introduction
Packet classification mechanism is mainly used in classifiers and the regulators of
NPs [48]. Its role is to ensure that input data flows accords with the TCA. This
mechanism classifies the flows to certain behavior aggregate, and tags them
correspondingly as packets. The classifier follows the rules specified in TCA and assigns
packets to different classes in the group according to some domains in header. Then they
will be handed over to the appropriate regulator module for further processing.
Generally the classification process is carried out at the communications sub-
network nodes or routers. The routers are divided into either flow or non-flow
identification routers. Flow identification routers track the transmission and conduct
similar processing on the packets of the same flow. Non-flow identification routers
process each incoming packet separately. Main processing steps on each packet in the
flow identification router are: routing table lookup, packet classification, packets special
treatment such as discarding unauthorized packets, and exchange scheduling.
5.2 Existing Packet Classification Algorithms
With in-depth research of network service traffic characteristics, the
implementation of regulator has become more mature. The usual practice is to use token
65
bucket and the leaky bucket algorithms, and other appropriate combination such as the
single rate Three Color Marker (srTCM) and two rate Three Color Marker (trTCM) [49].
Recently a time sliding window based algorithm called time sliding window Three Color
Marker (tswTCM) has been proposed. This algorithm uses the rate estimator to measure
the average rate in the time sliding window, and then uses this rate as the basis of marker
[50].
From the implementation point of view, these algorithms can be divided into two
kinds. One is hardware based algorithm that can be fully implemented by hardware, and
the other is software based algorithm for software implementation. Hardware based
algorithms such as ternary CAMs algorithm [51], use the parallelism feature of hardware
to conduct packet classification. By doing so, the classification process is fast, but the
available dimension is small, the scalability is poor, and the cost is high. Also some
operators cannot be directly supported. And the utilization of the memory array may not
be very efficient. They are not practical for PC-based routers. On the other hand, software
based algorithms generally provide specific dimension classification capability,
especially the common one-dimensional and two-dimensional classification algorithms.
For example, set pruning tries, grid of tree [52], and Area-based quad-tree (AQT)
algorithms [53] are two-dimensional classification algorithms. However, algorithms that
can provide support for high-dimensional classification may not well meet the
requirements on space complexity and time complexity. For example, hierarchical
cuttings algorithm [54] require large space in the worst case, and for some other
algorithms, such as bit vector search algorithm [55] and back tracking algorithm, the
66
classifying speed is slower. Cache-based [56] approach also does not work very well in
practice due to the low hit rate and smaller flow duration.
5.3 Development of the CBNPs Algorithm
Most of the current packet classification algorithms are based on tree structure,
but the programming of IXP2400 does not support recursive calls, and access of the tree
structure is very complex. So we proposed a multidimensional packet classification
algorithm called CBNPs which uses linear data structure.
5.3.1 Algorithm Description
The CBNPs algorithm includes two parts: preprocessing and classification. The
preprocessing is mainly preparations for simplifying and accelerating the classification
operation. The main function of classification is fast index processing on sorting fields
mapped by packets.
Given the rules database RD, assuming it has n of K-dimensional (in the case K
= 3) rules, represented as r1, ..., rn, respectively. Here ri,j represents the value of j-
dimensional field of the rule ri. The preprocessing of CBNPs algorithm is as follows:
1) According to the definition of tuple space, we can find the corresponding tuple
to the n-rule set. Assume that there are m tuples in total, and 1<m<n. Then t1, ..., tn
represent the rules contained in the tuple t which are stored in the hash table.
2) Mapping ri,j to the j-axis to form 2n+1 disjoint intervals on the j-axis.
67
3) For each interval e (1<e<2n+1) on the j-axis, we assign an m-bit vector Be.
Each bit in the vector represents one tuple. These bits are sorted by tuple priority. If and
only if there exists rti and the projection of r on the j-axis coveres e, we can set the bit
corresponding to t in Be to 1, otherwise it is 0.
Suppose a packet P arrives, then the classification process through the rule
search is as follows:
1) First, in each dimension j, we use binary search or other search algorithms to
find the interval corresponding to P, and thus get the bit vector Bj corresponding to P in
the j-dimension.
2) For all the bit vectors B1, ..., Bn, we can get the tuple corresponding to the bit
with the first value of 1 in B. And this tuple is the tuple t with the highest priority
including the packet P.
3) In the hash table corresponding to the tuple t, we get the rule r matched with P
by a memory access.
5.3.2 Performance Analysis
In the preprocessing of the CBNPs algorithm, we assume that there are a total of n
rules and m corresponding tuples. In a general case, m << n, which means the space
occupation of bit vectors is very low. Since hundreds of rules are in the rule base of NPs,
if we use tuples instead of the rule bases, space occupation reduction of each bit vector is
considerable.
68

5.3.2.1 Space Complexity Analysis
As discussed before, n rules projection on the j-axis produce a maximum of 2n+1
mutual non-covered intervals. If an m-bit vector is assigned to each interval, we have the
following relation
mnKCs )12( (5-1)
where Cs is the space used by all bit vectors, and K represents the dimension. Space
complexity of the CBNPs algorithm is O (mn), which is the same as that of the parallel
algorithm. In the worst case, m = n. But m << n on the average, this greatly reduces
space complexity.
The concept of tuple space is derived through the observation of actual rule
bases. It is a heuristic solution to solve packet classification issues by using the tuple
space. This solution can guarantee less space complexity in the average conditions, so
space complexity of the CBNPs algorithm is much less severe than the parallel algorithm.
5.3.2.2 Time Complexity Analysis
If the number of bits in a bit vector is reduced, the amount of memory access
required to read the vector will also be reduced. Here we have
wmKCt / (5-2)
69

where Ct represents the required times for memory accesses if all bit vectors are read, and
w is the word length of one memory access. In the CBNPs algorithm, vectors can be read
on each dimension in parallel, the same as bit parallel algorithms. In addition, one
memory access is required to access the corresponding hash tables to find the matching
rules, but this access time can be ignored. Therefore, the total time complexity is
O(t+mn/w). Again, the worst case happens when m = n, and this indicates the time
complexity of the CBNPs is the same as that of parallel algorithms. Since in most cases
the CBNPs algorithm satisfies the condition of m/w << n/w, the time complexity of the
CBNPs algorithm is greatly improved over parallel algorithms.
5.3.3 Algorithm Implementation and Optimization
From the classification process, it can be seen that when the number of partial
matching or field matching is 1, the classification process is completed. So we conduct a
direct matching operation to make sure the rule r really matches the packet P. In fact,
with the assumption that the number of part matching or fields matching rules is k, if the
cost to directly match the k rules is less than the cost to search the rest of the rules, then
we can conduct direct k times of matching operations. In this way, the classification
process can be accomplished faster. Here's a how to determine the maximum value K that
satisfies the above criteria k. Upper bound of K is hardware-related. The value of K may
be different if the algorithm is running on different NPs. The CPU instructions used in
this algorithm are mainly the following: access memory operation including SRAM
access and SDRAM access where accessing time is set to Msram and Msdram; comparison
operation where the cost is set to C; logic operation where the cost is set to A; testing
70
instructions of location where the first bit is 1 in a 16-bit word, for which the cost is set to
findset. If k filtering rules are left after searching a number of sorting databases, whether
to conduct direct matching or continue to search depends on the following inequality:
)54(4)54( CMfindsetAMCMK sramsdramsram (5-3)
where 4Msram means using four SRAM memory accesses to fetch a rule r, and 5C
expresses using five times operations to compare the five fields. Msdram uses one SDRAM
access to fetch the index which matches the packet fields. A is the new preparation set
matching the new fields by performing bitwise operation to the previous preparation set.
The term 4findset represents using four instructions to find the first bit corresponding to
the rule r matched by the fields in the original rule base. The term 4Msram+5C determines
whether the rule r really matches the packet P. Here we can rewrite (5-3) into (5-4).
)54(
)54(4
CM
CMfindsetAMK
sram
sramsdram
(5-4)
Once a machine is decided to run the algorithm, the cost of executing each
instruction in the formula can be determined. So is the value of K. When the number of
rules matched with the entered packets is less than or equals to K, the matching operation
can be directly conducted without further search operation. This will accelerate the
classification process.
71

5.4 Simulation Results
The micro engines of IXP2400 provide chained SDRAM memory accesses to
ensure continuous high-speed access to SDRAM. And the bus arbiter gives higher
priority to memory accesses from chained SDRAM than other micro-engines to ensure
that instructions are continuously sent to the SDRAM unit. SDRAM chained access is
completed by adding chain-ref options to the SDRAM instructions. The instruction
parameter settings are determined based on the number of rules when the program is run.
If the number of rules is less than or equals to 64, we can run the SDRAM
instructions without parameters while taking a certain field from the fields sorting library.
The format is as follows: sdram [sdram_cmd, $$sdram_xfer-reg, source-opl, source-opt],
where [sdram_cmd] means the instruction operations; [$$sdram_xfer-reg] is the name of
register which stores the read data; [source-opl] and [source-opt] calculate the memory
start address where SDRAM is read and written. By default, one memory word can be
read each time, so 64 rules can be taken each time.
When the number of rules is between 65 and 256, we need to add ref-count
parameter into the SDRAM instructions. This parameter represents how many 4-word
length storage units are continuously accessed during each memory access. The SDRAM
instructions set ref-count value between 1 and 4, so the number of rules is between 65
and 256.
When the number of rules is greater than 256, the SDRAM instructions with
indirect-ref parameter conduct continuous access of the SDRAM. In the edge routers, the
72

rules are few in the rule base. Only about 0.7% of the rule bases have more than 1000
rules, and the average number of rules in most cases is about 50 [50].
In this simulation, we adopt K1297 signaling analyzer to simulate packet sending,
and the operation system for K1297-G20 is Windows NT 4.0. We use 128 rules to
implement this algorithm on Intel IXP2400, and randomly generate these rules according
to the following strategies:
1) 25% of the rules belong to the same prefix. For example, 166.111.*.* is used to
simulate the LAN environment.
2) 50% of the rules are based on TCP, and 45% of the rules are based on UDP,
because most of the rules are for TCP / UDP protocol.
3) 40% of the rules are for port 80 (WWW), and 20% of the rules are for ports 20
and 21 (FTP).
In the simulation, we randomly produce 1000 different types of data flows with
100% hits. Each packet length is 64-byte. The rule set has a total of 397 rules, in which
source or destination address field of 126 rules are non-precise bit-string. We have four
defined non-precise bit strings, which are intranet, extranet and two regions. We also
define 24 types of services, including a definition of the source port number, and two
definitions of a particular destination port number within the range. In addition, to test the
algorithm performance of cases with even larger rule set, we randomly generate 2,000,
73

10,000, 20,000, 30,000, 50,000 and 100,000 rules. Evaluation results have been listed in
Table 5-1, which shows the average results obtained from 16 times of program running.
Table 5-1 Measured Results from Real Application
Number of Rules Throughput(Rule/ms) 397 3,660
2,000 3,660 10,000 3,620 20,000 3,540 30,000 3,440 50,000 3,300 100,000 3,200
From the results, it can be seen that the algorithm fully shows the parallel nature
of NPs. It is better than the existing packet classification algorithms in code complexity
and overall performance.
5.5 Summary
This chapter analyzed the existing packet classification algorithms and compared
their performances. Combined with the characteristics of all kinds of classification rules,
a new multi-dimensional packet classification algorithm based on the NP IXP2400 was
proposed, namely CBNPs. This algorithm reduces the number of classification rules and
classification domain width to accelerate the classification and it also use parallel tuple
search technology to accelerate the speed of classification. Especially, it uses the multi-
threaded concurrency features of NPs. The algorithm has high-speed, multi-dimensional
and scalable features. The comprehensive performance of this algorithm is better than the
existing packet classification algorithms.
74
CHAPTER 6
REALIZATION OF DIFFSERV QOS FOR WCDMA CN
6.1 Introduction
According to the rate of flow, QoS can be divided into edge and core QoS
switching. Edge QoS switching is complex, and its basic functions are packet
reorganization, packet classification, flow regulation, queue scheduling, buffer
management, routing and switching, storage and forwarding. These complex processes
need gigabit switching speed. Therefore, we use two IXP2400 NPs in our design. In
addition, we equip appropriate Ethernet interface hardware at the input and output of
IXP2400, and set up memory such as SDRAM and SRAM for the storage external
interface controller. How much memory space is needed depends on complexity of the
application. Core QoS switching is relatively simple, and it only needs to perform simple
tasks such as switching routing, queue scheduling and shaping instead of complex
classification and aggregation.
In WCDMA CN, GGSN is the edge switching equipment, and SGSN is the core
switching equipment. We mainly expounds the QoS switching technology on GGSN, and
this edge QoS switching can still be used in the core switching. However, it is more
effective when used in the edge switching. The QoS switching topology diagram in the
network is shown in Figure 6-1.
75

Figure 6-1 Positions of QoS Switching in a Network
From Figure 6-1, we can see that in the same DS domain, when the edge GGSN
receives IP data packets, it executes packet classification and flow shaping on these data
packets at the edge, and then sent them to the SGSN core switches. In WCDMA CN,
these classified IP packets are aggregated, forwarded, and then sent to the QoS switch at
the other end through other bearer network, and then forwarded to the clients. If two
clients in different DS domains are switching data, the end-to-end QoS cannot be
guaranteed. In this case, we need a QoS standard which can be established by a third
party, thereby to form a unified QoS. The situations beyond the DS domain are not
discussed here. Based on the programming model and algorithms proposed in the
previous chapters, we have the following hardware and software design.
6.2 Hardware Design of WCDMA QoS Based on IXP2400
Because IXP2400 is the second-generation NP developed by Intel, its hardware
design implementation is relatively simple. The hardware architecture diagram is shown
in Figure 6-2.
76

Figure 6-2 Hardware Architecture of DiffServ QoS
Figure 6-2 is a hardware configuration of SGSN switching structure. It can be
seen that we use two IXP2400 NPs and a number of external devices. This hardware
architecture adopts store-forward method to forward data packets, and uses queues
technologies to achieve QoS. After the processing of Ingress and Egress processors, the
classified and reorganized data packets are forwarded. The design and implementation of
the major hardware modules are as follows:
1) Ingress IXP2400 and Egress IXP2400: We assign different tasks to each
hardware thread. These tasks can be various functional modules such as packet
reorganization, packet classification, flow regulation and queue management. Based on
this design, the Ingresses in the two IXP2400 NPs are used to process the Ethernet IP
packets which enter the switch, and the Egresses are used to process CSIX packets
transmitted from Switch Fabric Interface.
2) Switch Fabric Interface: This interface is a high-speed data switching platform
and sub-port which connects several devices. It directly forwards data packets coming
77
from a certain port to another specified port without any processing. The supported
protocols and standards include CSIX-LIB, SPI3, POS-2, Utopia Layer 1/2/3 devices, as
well as providing an interface for flow control.
3) Quad 1G Ethernet Cards: They support 4 Ethernet cards with the speed of
1Gbps. And also provide Ethernet input and output for NPs.
4) SRAM and DRAM: Their role is providing the data received from interfaces
with storage space so that they can be used by micro-engines and other modules.
5) Control Plane Processor: Generally the entire QoS system layer architecture is
divided into data, control and management plane. Data plane provides high-speed
forwarding and general data packets processing. In IXP2400, data plane consists of fast
path such as micro-engines which process most of packets and slow path such as Intel
Xscale core which deals with a small amount of exceptions packets. Control plane
processes the protocol messages. It is also responsible for setting up, configuring and
updating the routing tables and data set in data plane. Management plane is responsible
for system configuration, collection, reporting status, stop and start the input or message
of user application. Generally management plane is implemented in a graphical interface
to display and access information from the users.
6.3 Software Design of WCDMA QoS Based on IXP2400
Based on the above hardware architecture, we design the software architecture
diagram as below:
78
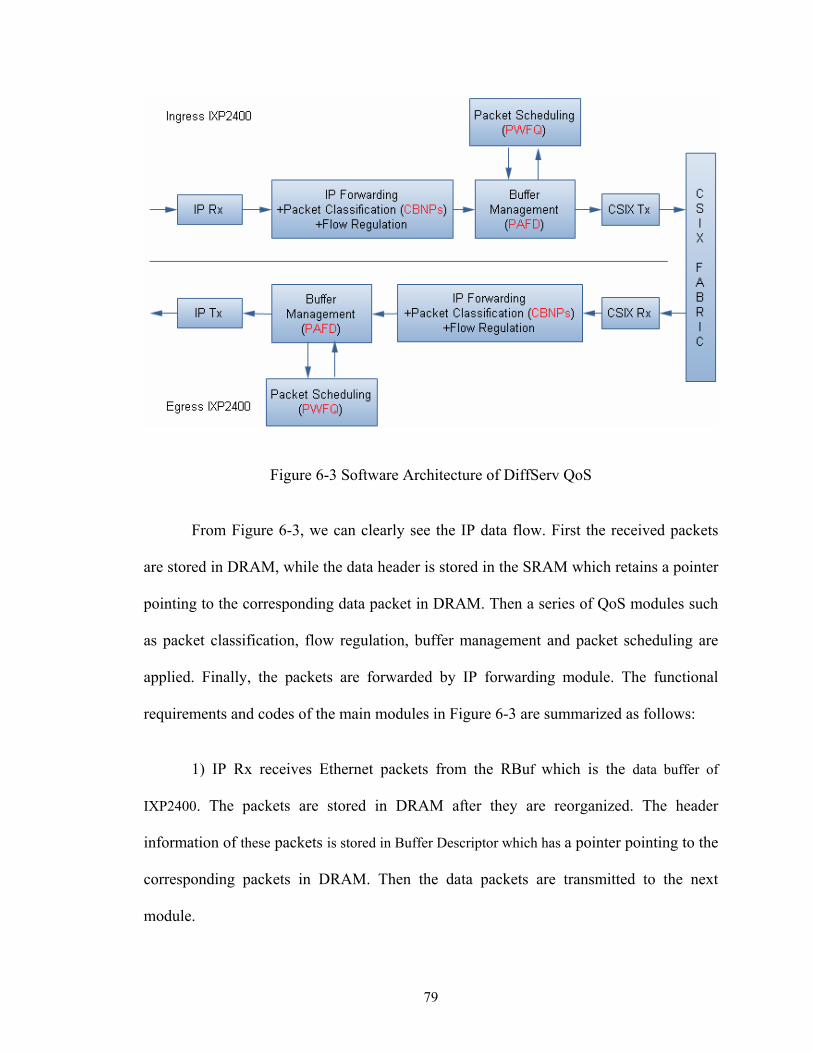
Figure 6-3 Software Architecture of DiffServ QoS
From Figure 6-3, we can clearly see the IP data flow. First the received packets
are stored in DRAM, while the data header is stored in the SRAM which retains a pointer
pointing to the corresponding data packet in DRAM. Then a series of QoS modules such
as packet classification, flow regulation, buffer management and packet scheduling are
applied. Finally, the packets are forwarded by IP forwarding module. The functional
requirements and codes of the main modules in Figure 6-3 are summarized as follows:
1) IP Rx receives Ethernet packets from the RBuf which is the data buffer of
IXP2400. The packets are stored in DRAM after they are reorganized. The header
information of these packets is stored in Buffer Descriptor which has a pointer pointing to the
corresponding packets in DRAM. Then the data packets are transmitted to the next
module.
79

The code of the Rx module (file: rx.uc) is below:
#macro rx_init[]
#macro xbuf_alloc[str_xbuf_name, NUMBER_OF_REGS, RW_INDICATOR]
#macro pkt_rx[]
#macro dl_sink[wxfer_prefix, req_sig, sig_nask]
#macro xbuf_free(str_xbuf_name]
2) IP forwarding + Packet classification + Flow regulation module receives
packets from IP Rx module, and then forward them after classification and regulation.
The code of this module (file: fwder_classify.uc) is
#macro dl_iphdr_cache_init[]
#macro init_meta_cache_to_zero[]
#macro_dl_eop_buf_handle_init[]
#macro_ipv4_fwder_init[]
#macro_ipv4_fwder_kick_start[]
#macro_ipv4_fwder[out_result,out_ip,in_ip,IPHDR_WR_START_BYTE,IPHDR_RD_START_BYTE]
#macro_ipv4_classify[out_result,in_ip]
#macro_ipv4_wred[]
#macro dl_set_exception[block_id, exception_code]
#macro dl_qm_sink[sig_mask, sig_scr, wxfer]
#macro dl_source[THREAD_ORDER, sig_mask]
#macro dl_iphdr_cache_fini[]
80

3) Buffer management and packet scheduling module is also known as queue
management module. First packet scheduling module receives the information from the
previous module, and then informs buffer management module to do enqueue processing
which adopts PAFD algorithm. When the CSIX module is idle, packet scheduling module
informs buffer management module execute dequeue processing which uses PWFQ
algorithm. The buffer management code (file: qm_code_in.uc and qm_code_out.uc) is
#macro queue_manager[]
#macro_qm_enqueue[in_enqueue_message_0, in_enqueue_message_1, in_qarray_entry]
#macro_qm_dequeue[in_qarray_entry, out_qarray_message]
#macro_qm_cam_check[in_queue_id, in_hit_label, inout_qarray_entry,
out_qd_array, in_qa_signal, in_lmnum]
#macro_qm_send_sched_message[in_message]
#macro_qm_dropq_deq_handler[in_deq_queue_num, in_qarray_message]
#macro_qm_send_sched_message[in_message]
And the packet scheduling code (file: Scheduler_in. uc and Scheduler_out. uc) is
#macro Scheduler[ring, DeqMessage, minusTwo, queueLmBase,
groupMask, deqSignal, waitSignal]
#macro QM_MessageHandler[]
#macro HandleFlowControl[]
#macro ReadTbufsTransmitted[]
#macro GetCreditIncrement[CreditIncrement, QueueId]
81

4) CSIX Tx adds the related information including classification and Buffer
handle in the DRAM to the dequeue packets from queue management module and sends
them to CSIX Fabric to enter the next IXP2400. CSIX Rx receives the packets and other
information from CSIX Fabric through RBuf and sends them to the Egress IXP2400. It is
the reverse process of CSIX Tx. The code of CSIX Tx and CSIX Rx (file: csix_tx.uc and
csix_rx.uc) is given below:
#macro csix_tx_init[]
#macro csix_tx[]
#macro localmem_set_address[in_lmaddr, in addr_offset, LM_HANDLE]
#macro_csix_tx_get_extension_header[ex_header, tx_request0]
#macro_csix_tx_get_next_tbuf[addr_of_tbuf, addr_of_tx_control]
#macro csix_rx_init[]
#macro_check_rsw_error[tmp_err, rswl]
#macro_send_next_thrd_sig[sig_gpr]
#macro_csix_rx_sep_proc[rtn_label]
#macro_csix_rx_sop_proc[rtn_label]
#macro_csix_rx_eop_proc[rtn_label]
#macro_csix_rx_mop_proc[rtn_label]
#macro_csix_rx__err_proc[rm_label]
#macro_csix_rx_buf_zero__proc[rtn_label]
5) IP Tx executes the reverse process of receiving IP data packets, and the
realization method is similar to IP Rx. The IP Tx Module code (file: tx.uc) is listed below:
82

tx_init[]
tx[]
6.4 Simulation Results
In this session, we used different simulation environments to test the DiffServ
model and the proposed system, respectively.
6.4.1 DiffServ Test
We adopt the following network structure to test the DiffServ model,
Figure 6-4 DiffServ Test Structure
In order to verify the QoS assurance mechanism of WCDMA based on the
DiffServ model, we tested the CN of the entire network, to obtain the differences of QoS
assurance for different service flows using the DiffServ model.
83
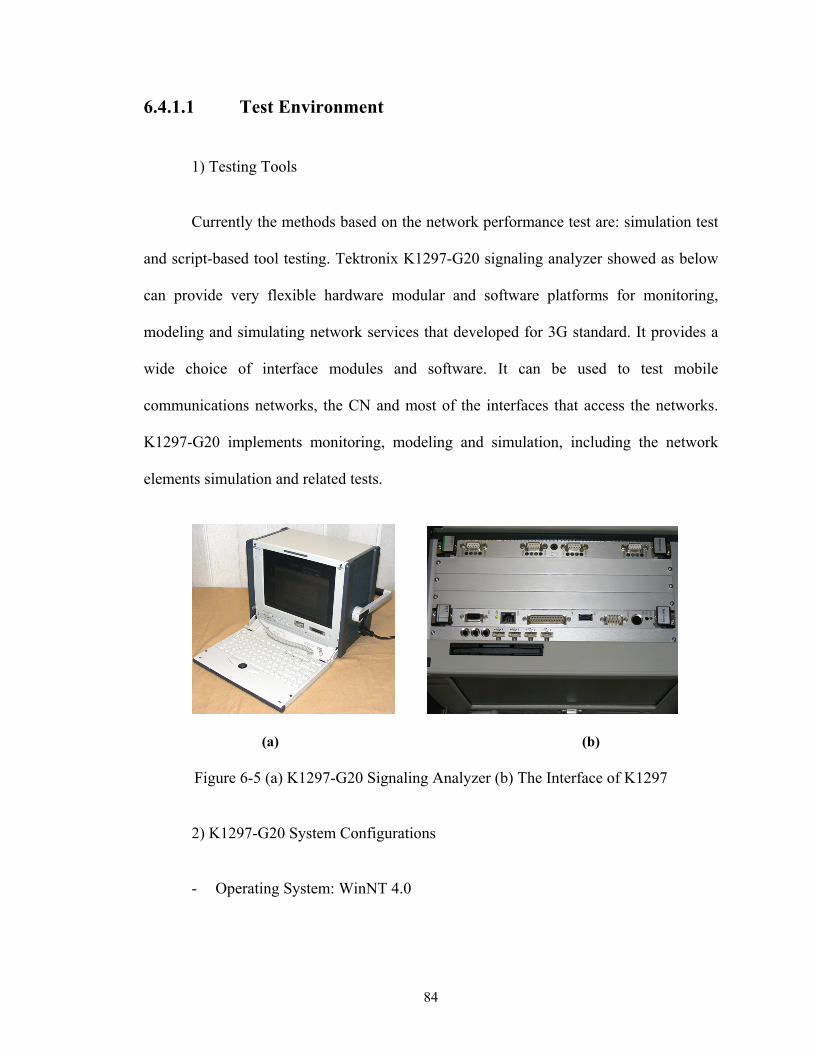
6.4.1.1 Test Environment
1) Testing Tools
Currently the methods based on the network performance test are: simulation test
and script-based tool testing. Tektronix K1297-G20 signaling analyzer showed as below
can provide very flexible hardware modular and software platforms for monitoring,
modeling and simulating network services that developed for 3G standard. It provides a
wide choice of interface modules and software. It can be used to test mobile
communications networks, the CN and most of the interfaces that access the networks.
K1297-G20 implements monitoring, modeling and simulation, including the network
elements simulation and related tests.
(a) (b)
Figure 6-5 (a) K1297-G20 Signaling Analyzer (b) The Interface of K1297
2) K1297-G20 System Configurations
- Operating System: WinNT 4.0
84
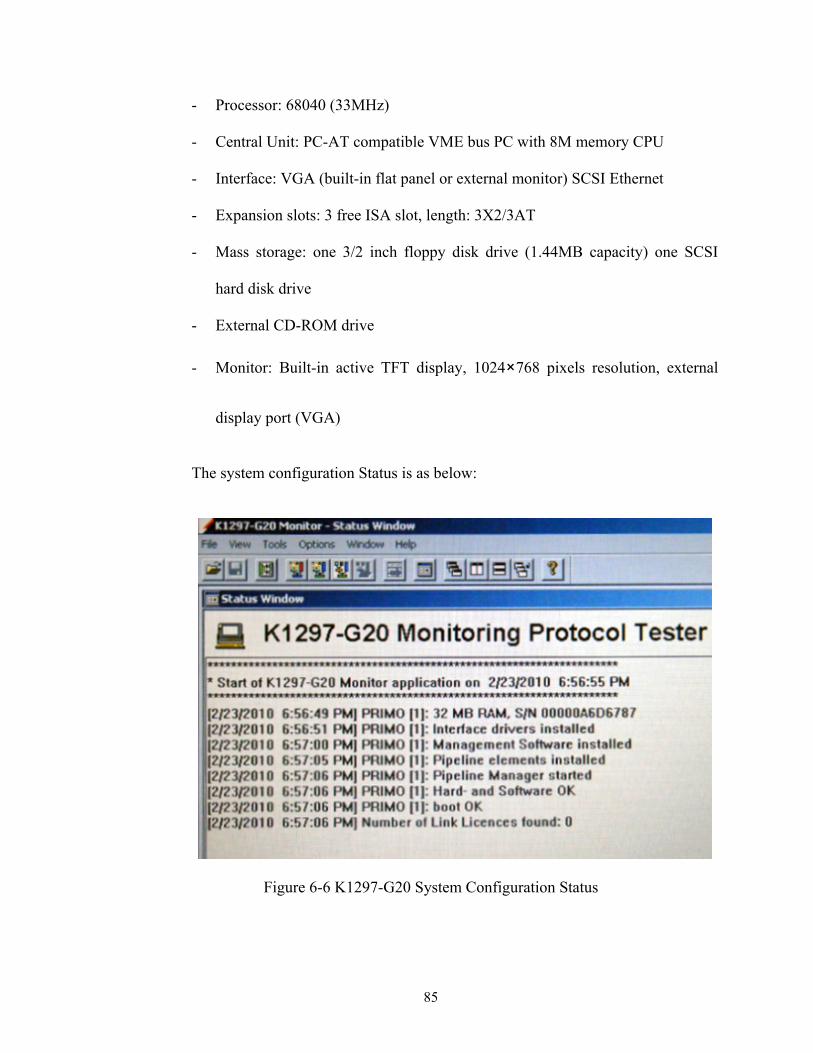
- Processor: 68040 (33MHz)
- Central Unit: PC-AT compatible VME bus PC with 8M memory CPU
- Interface: VGA (built-in flat panel or external monitor) SCSI Ethernet
- Expansion slots: 3 free ISA slot, length: 3X2/3AT
- Mass storage: one 3/2 inch floppy disk drive (1.44MB capacity) one SCSI
hard disk drive
- External CD-ROM drive
- Monitor: Built-in active TFT display, 1024×768 pixels resolution, external
display port (VGA)
The system configuration Status is as below:
Figure 6-6 K1297-G20 System Configuration Status
85

3) Test Design
The network topology used in the test process is shown in Figure 6-5. In the test
process, K1297-G20 is used to simulate the users and all kinds of service flows sent by
the wireless access part. As showed in Figure 6-7, we can choose UMTS/WCDMA type
to test the DiffServ model. The service flow types can be set in the K1297-G20 simulated
user messages. i.e. the traffic class option can be set to one of the conversation, stream,
interaction, and background type according to its encoding rules. In the test process the
first K1297-G20 is used to send the FTP service flow of background type. The second
K1297-G20 is used to send traffic flows of conversation type which is also called Voice
over IP (VOIP). We choose 6240 blade of Adlink Technology as the NP blade.
(a) (b)
Figure 6-7 (a) Test Type Options (b) Data Flow Setup
The test is mainly for the following two parameters:
- Delay time: This parameter reflects the QoS. The shorter the time delay is, the
better QoS to the user requests is.
86
- Throughput: This parameter best reflects the performance of mobile networks.
The larger the throughput is, the more user requests are accepted and serviced
in a unit time.
6.4.1.2 Test Cases
In the network architecture built for this test, according to the set proportion, FTP
data flow is added to the first K1297-G20, the other three kinds of WCDMA service
flows are added to the second K1297-G20 in turns. Then slowly increase the network
traffic of the second K1297-G20, and observe the delay time for this service flow. Then
the proportion of the service flows through the two K1297-G20 analyzers are changed to
observe the influence of the background and the other three WCDMA service flows
under different proportions. In this dissertation the comparison result of VOIP and FTP
are given.
1) Test Case 1
- VOIP traffic is set to 10Mbps;
- FTP flow is set to l0Mbps;
- VOIP traffic: FTP flow = 5: 5;
- Objective: To test the delay and throughput in the case that no differentiated
services are applied.
2) Test Case 2
- VOTP flow is set to 2Mbps;
87

- FTP flow is set to l0Mbps;
- VOIP traffic: FTP flow = 1: 5;
- Objective: To test the delay and throughput.
3) Test Case 3
- VOIP traffic is set to 10Mbps;
- FTP traffic is set to 10Mbps;
- VOIP traffic: FTP flow = 1: 1;
- Objective: To test the delay and throughput.
6.4.1.3 Test Results and Analysis
Figure 6-8 Delay for Test Case 1
88
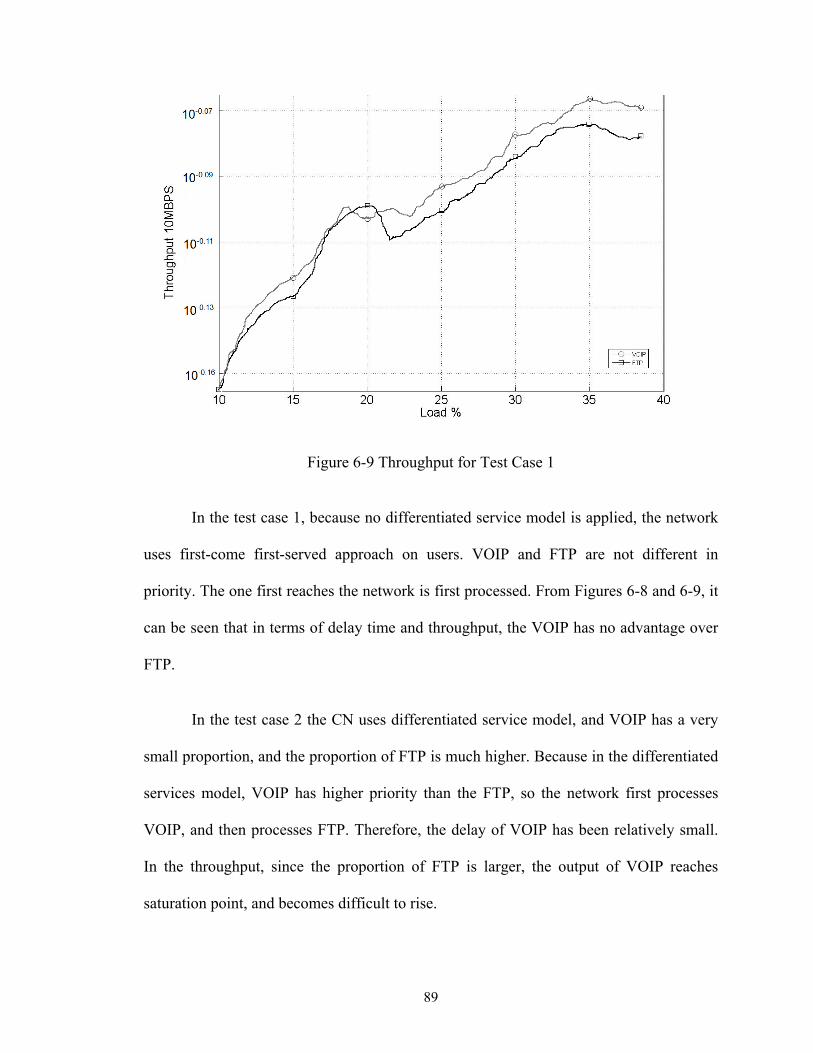
Figure 6-9 Throughput for Test Case 1
In the test case 1, because no differentiated service model is applied, the network
uses first-come first-served approach on users. VOIP and FTP are not different in
priority. The one first reaches the network is first processed. From Figures 6-8 and 6-9, it
can be seen that in terms of delay time and throughput, the VOIP has no advantage over
FTP.
In the test case 2 the CN uses differentiated service model, and VOIP has a very
small proportion, and the proportion of FTP is much higher. Because in the differentiated
services model, VOIP has higher priority than the FTP, so the network first processes
VOIP, and then processes FTP. Therefore, the delay of VOIP has been relatively small.
In the throughput, since the proportion of FTP is larger, the output of VOIP reaches
saturation point, and becomes difficult to rise.
89

Figure 6-10 Delay for Test Case 2
Figure 6-11 Throughput for Test Case 2
90
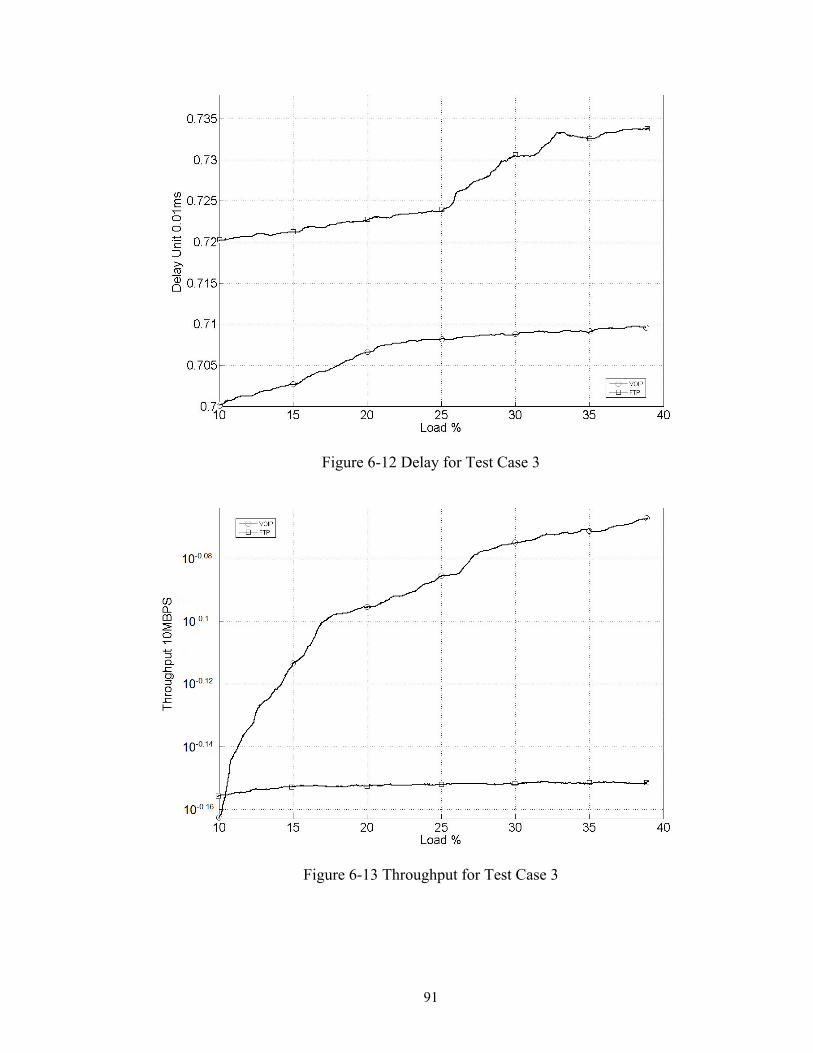
Figure 6-12 Delay for Test Case 3
Figure 6-13 Throughput for Test Case 3
91
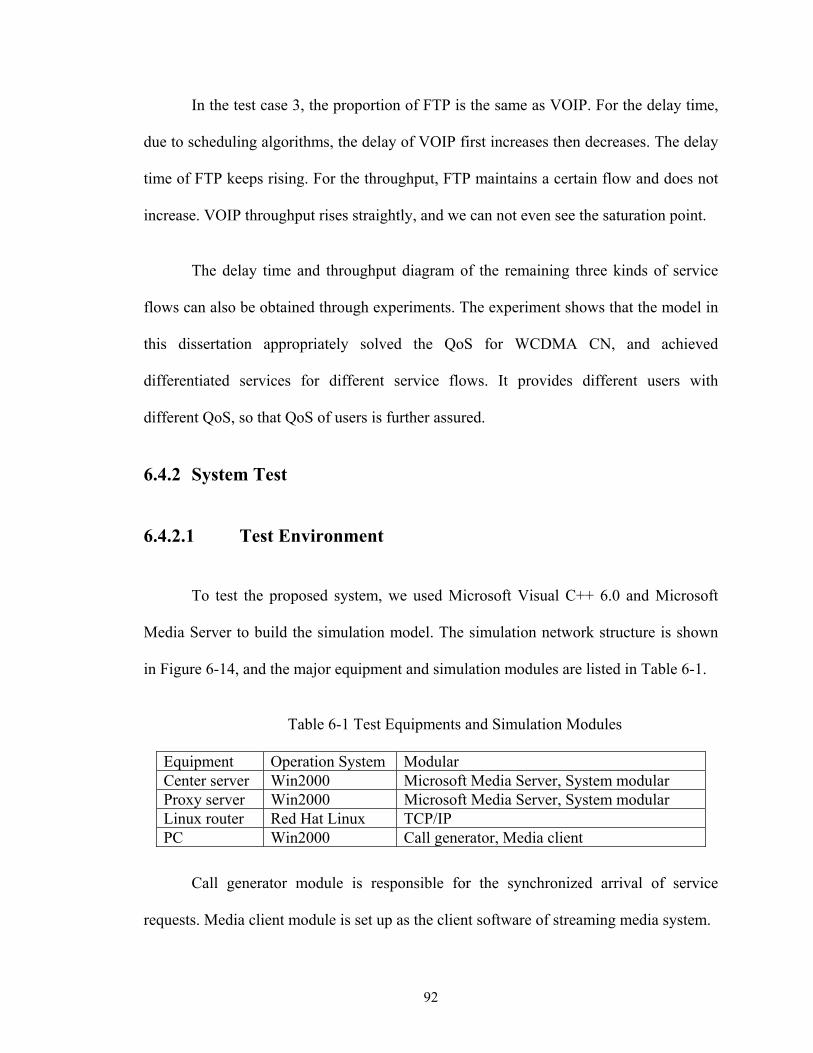
In the test case 3, the proportion of FTP is the same as VOIP. For the delay time,
due to scheduling algorithms, the delay of VOIP first increases then decreases. The delay
time of FTP keeps rising. For the throughput, FTP maintains a certain flow and does not
increase. VOIP throughput rises straightly, and we can not even see the saturation point.
The delay time and throughput diagram of the remaining three kinds of service
flows can also be obtained through experiments. The experiment shows that the model in
this dissertation appropriately solved the QoS for WCDMA CN, and achieved
differentiated services for different service flows. It provides different users with
different QoS, so that QoS of users is further assured.
6.4.2 System Test
6.4.2.1 Test Environment
To test the proposed system, we used Microsoft Visual C++ 6.0 and Microsoft
Media Server to build the simulation model. The simulation network structure is shown
in Figure 6-14, and the major equipment and simulation modules are listed in Table 6-1.
Table 6-1 Test Equipments and Simulation Modules
Equipment Operation System Modular Center server Win2000 Microsoft Media Server, System modular Proxy server Win2000 Microsoft Media Server, System modular Linux router Red Hat Linux TCP/IP PC Win2000 Call generator, Media client
Call generator module is responsible for the synchronized arrival of service
requests. Media client module is set up as the client software of streaming media system.
92
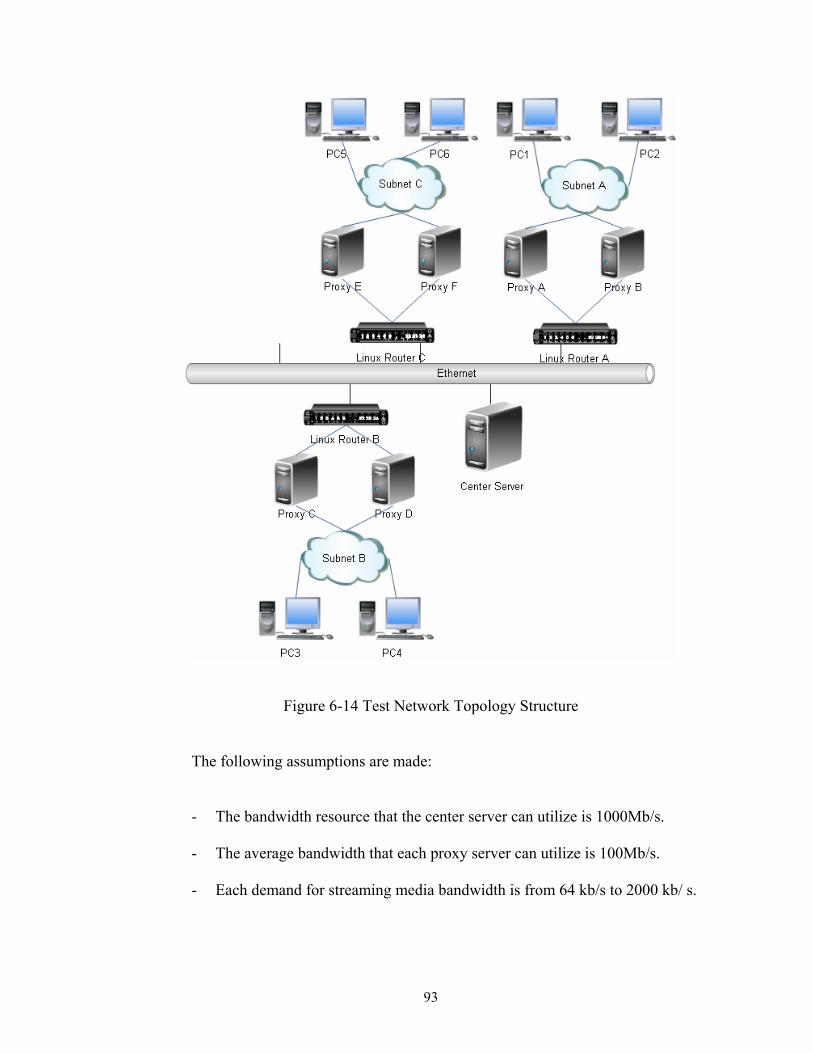
Figure 6-14 Test Network Topology Structure
The following assumptions are made:
- The bandwidth resource that the center server can utilize is 1000Mb/s.
- The average bandwidth that each proxy server can utilize is 100Mb/s.
- Each demand for streaming media bandwidth is from 64 kb/s to 2000 kb/ s.
93
6.4.2.2 Test Cases
The continuing growth of broadband multimedia communication services such as
images, broadband video and audio bring about a higher demand for the mobile
networks. There are significant differences between multimedia and traditional services.
The traditional data services have no strict requirements on QoS assurance. They allow
data loss, and can tolerate delay and jitter for a certain period. However, multimedia
services cannot tolerate data loss, and have strict requirements on data transmission delay
and jitter. In this section, we test the system performance in streaming media
environment.
[57] proposed a wireless video-on-demand streaming media system. We use
CSBS to represent this type of system. CSBS has the following outstanding features: 1) it
can accommodate a large number of clients at the same time; 2) it provides a range of
video on demand so that the interaction is improved. In this system, there is no core
network operations involved. Therefore, the access delay is smaller. So each media
stream only needs a smaller proxy server buffer to complete the functions. In the
traditional streaming media system, there is only one-way operation between the server
and the client. Because the contents provide by streaming media system are only audio
and video data, and there is no two-way interactive data.
In [58-59], the authors designed an interactive streaming system based on MPEG4
coding system, which can be represented as MP4SI. In order to provide efficient MPEG4
streaming, MP4SI adopts a number of suitable network layer and transport layer
94

protocols. For IOD, BIFS, OD, and some media data such as static JPEG image that is
sensitive to packet loss rate, MP4SI uses the TCP to protect the transmission quality. For
those real-time media data, MP4SI uses RTP as the transport layer protocol. In the next
generation all IP network, providing high quality streaming services to the client and
maximizing system capacity are two contradictions. A good streaming media system
must balance between them.
[60] designed a QoS-oriented dynamic streaming media system to transmit
streaming data; we use QOAS to express the system. In QOAS, the central server
dynamically adjusts the service rate between the server and the clients according to the
feedback information of streaming media QoS provided by the clients. [54] also uses
simulation results to show that QOAS can efficiently provide QoS.
6.4.2.3 Test Results and Analysis
In the simulation, we calculate the service startup delay according to the
following equation:
Ts=T2 - T1 (6-1)
where Ts represents a service start-up delay, T2 represents the time when the server start
sending media streams to the client, while Tl is the time when the client sends the service
request. We compare service startup delay of several systems as below.
95
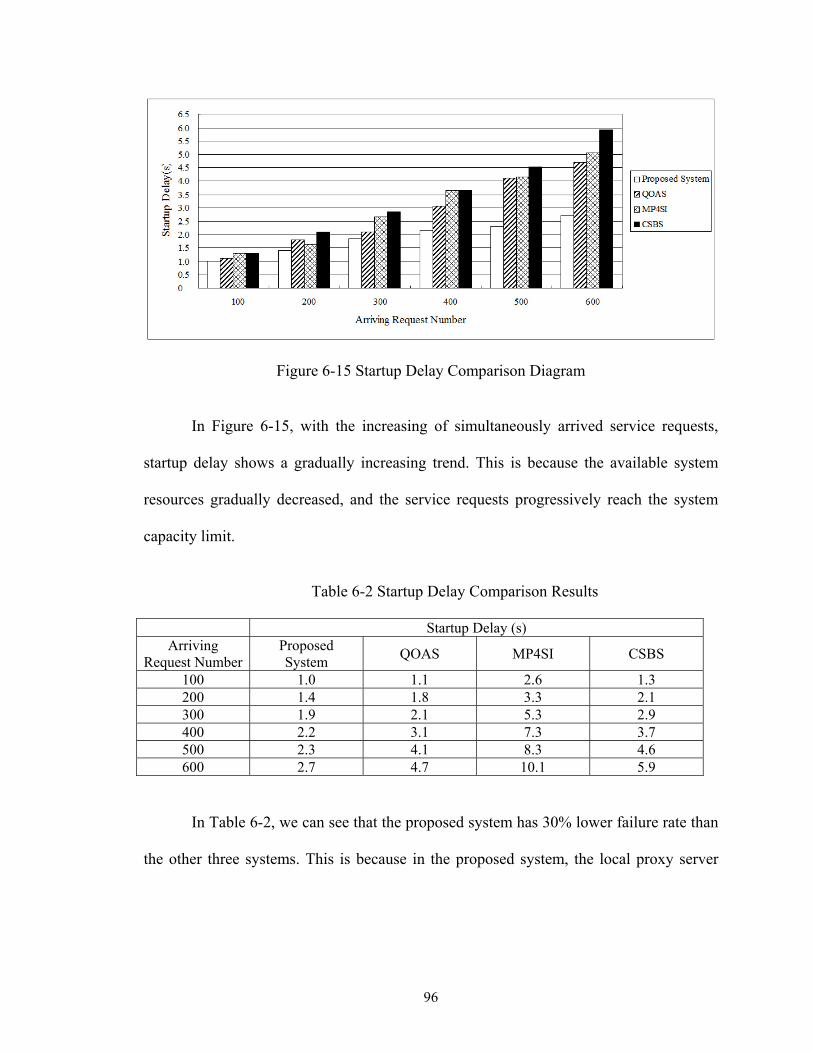
Figure 6-15 Startup Delay Comparison Diagram
In Figure 6-15, with the increasing of simultaneously arrived service requests,
startup delay shows a gradually increasing trend. This is because the available system
resources gradually decreased, and the service requests progressively reach the system
capacity limit.
Table 6-2 Startup Delay Comparison Results
Startup Delay (s) Arriving
Request Number Proposed System
QOAS MP4SI CSBS
100 1.0 1.1 2.6 1.3 200 1.4 1.8 3.3 2.1 300 1.9 2.1 5.3 2.9 400 2.2 3.1 7.3 3.7 500 2.3 4.1 8.3 4.6 600 2.7 4.7 10.1 5.9
In Table 6-2, we can see that the proposed system has 30% lower failure rate than
the other three systems. This is because in the proposed system, the local proxy server
96
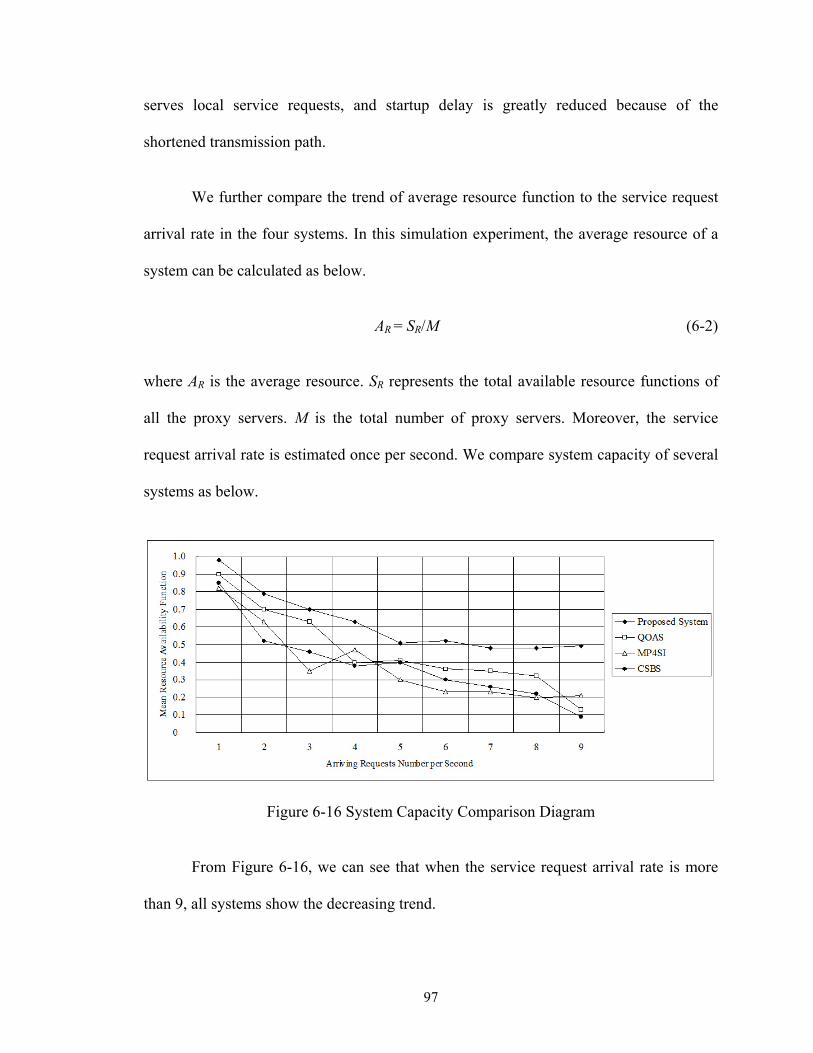
serves local service requests, and startup delay is greatly reduced because of the
shortened transmission path.
We further compare the trend of average resource function to the service request
arrival rate in the four systems. In this simulation experiment, the average resource of a
system can be calculated as below.
AR = SR/M (6-2)
where AR is the average resource. SR represents the total available resource functions of
all the proxy servers. M is the total number of proxy servers. Moreover, the service
request arrival rate is estimated once per second. We compare system capacity of several
systems as below.
Figure 6-16 System Capacity Comparison Diagram
From Figure 6-16, we can see that when the service request arrival rate is more
than 9, all systems show the decreasing trend.
97

Table 6-3 System Capacity Comparison Results
Arriving Request Number per second
Proposed System QOAS MP4SI CSBS
1 0.98 0.90 0.82 0.85 2 0.79 0.70 0.63 0.52 3 0.70 0.63 0.35 0.46 4 0.63 0.40 0.47 0.38 5 0.51 0.41 0.30 0.40 6 0.52 0.36 0.23 0.30 7 0.48 0.35 0.23 0.26 8 0.48 0.32 0.20 0.22 9 0.49 0.13 0.21 0.09
From Table 6-3, it is seen that the proposed system is 20% higher than the other
three systems. Therefore, the proposed system can simultaneously serve more users, and
it achieved DiffServ QoS for WCDMA CN.
6.5 Summary
In this chapter, we put forward a complete system including hardware and
software design based on IXP2400 to realize QoS DiffServ model for WCDMA CN.
According to the proposed programming model in Chapter 3, the system maps the
proposed buffer management algorithm PAFD, the packet scheduling algorithm PWFQ
and the packet classification algorithm CBNPs to different micro-engines, respectively.
Compared to current systems, the simulation results show that startup delay of the
proposed system is 30% lower than that of the other three systems, and system capacity
of the proposed system is also 20% higher than that of the other three systems. Therefore,
the proposed system achieves differentiated QoS for WCDMA CN.
98
CHAPTER 7
CONCLUSIONS
At present, the development of wireless communication networks is at the stage
of 3G evolution. Circuit-switched based wireless communication systems will eventually
evolve into end-to-end all IP networks. WCDMA CN and all-IP are the trend of 3G
development. The QoS problem in WCDMA is an extension of the IP QoS problem in
mobile communication networks, but QoS in WCDMA networks is more complex than
that in general IP networks. DiffServ model does not need complex control signals. It has
good scalability and is more suitable for wireless communications, especially for QoS
control schemes in large-scale backhaul networks.
An NP is a new System-on-Chip (SoC). It will replace the traditional ASIC chip
and become the development direction of future network equipment. The future high-
speed network equipment will use NPs as hardware platforms. At present, network
research is mainly based on general-purpose processor platforms and simulation
environments. A lot of features of NPs are different from ones of general-purpose
processors, so lots of algorithms for general-purpose processors cannot be applied to NPs.
This dissertation showed some useful attempts on developing algorithms which fully
considers the characteristics of NPs. Also, according to different QoS requirements of
various services in WCDMA CN, this study mainly studied the implementation schemes
of QoS DiffServ model based on NPs.
99
7.1 Major Outcomes
1) Based on the study on the existing programming models of NPs, the
comprehensive programming model that combines HTC and POTs was designed. The
solution to solve the packet ordering and resource mutual exclusion problems was also
proposed.
2) Buffer management algorithm: According to QoS features in WCDMA, the
PAFD algorithm that supports DiffServ was proposed. This algorithm takes into
consideration of both fairness and throughput. It has a smooth service curve, and is also
self-adaptive to network flows.
3) Packet scheduling algorithm: According to the analysis of QoS characteristics
of different service categories in WCDMA, we introduced the PWFQ algorithm which is
improved based on WFQ algorithm. In PWFQ algorithm, the fairness of packet
scheduling is ensured, and the queue time of packets is reduced. The delay and jitter are
also maintained within a small range.
4) Packet classification algorithm: Based on packet compression, rules
combination, and tuple lookup algorithms, the CBNPs algorithm was proposed. This
algorithm enhances search efficiency and achieves desired time and space complexity.
5) An integrated system supporting DiffServ QoS for WCDMA CN was
proposed. The system is implemented with GGSN, SGSN devices based on IXP2400. In
the system, differentiated QoS is mapped to different PHBs by using CBNPs algorithm.
100

Packet dropping and queue scheduling scheme adopts PAFD and PWFQ algorithm,
respectively. Finally, the efficiency and performance of the proposed system was tested
in the simulation.
7.2 Prospective Research Endeavors
The performance analysis of NPs can be quantitated to optimize the programming
model. The network calculus approach which adopts service curve and arrival curve
concepts can be adopted for data channel modeling of NPs. Based on this approach,
performance of various mapping methods can be analyzed to find the most appropriate
resource allocation method. These will be the direction of future research.
The buffer management algorithms studied in this dissertation always concern
about the allocation of system buffer resources, while the allocation of bandwidth is
given to the packet scheduling algorithms. From the perspective of the entire queue
management, buffer management and packet scheduling algorithms are related. They
should work together to obtain optimal control effect. Implementation of Joint Buffer
Management and Scheduling algorithms (JoBS) on NPs will be a future direction. JoBS
provide different levels of services based on bandwidth allocation and adjustment, and
optimize the queue operation according to QoS requirements between different service
levels. The optimization objective of JoBS is to maintain a static rate allocation and no
packet loss. JoBS can provide absolute and relative QoS guarantees, and their
performance does not rely on traffic of arrived data flows. In addition, JoBS introduce the
rate allocation to the design of buffer management algorithm. This enhances coordination
101

with scheduling algorithms and further improves the operation efficiency of the entire
system.
Packet classification algorithms are another research area following routing
searching algorithms. The study on packet classification references point positioning and
other related knowledge in the computational geometry. Recently a lot of packet
classification algorithms were proposed, and some of them are quite outstanding.
However, they are all based on the TRY tree structure. Because of the special code space
of NPs like IXP2400, the tree structure access is very difficult. The tree structure must be
converted into a linear structure to facilitate micro-engines searching. Converting various
TRY tree structure into reasonable linear structures and finding the fastest access method
will be the future research direction of packet classification algorithms.
With the development of 3G network, the CN will develop into all-IP network.
Multiple protocol Label Switching (MPLS) technology has significant expansion in flow
control and QoS support for IP networks. MPLS divides network elements into the core
and edges, and completes complex processing tasks on edges of the network, which is
called edge intelligence. MPLS exactly matches the forwarding packets based on fixed-
length short-labels. This simplifies the forwarding scheme and is conducive to fast-
forward packet in CN. The research on implementation of MPLS QoS on NP will be the
future direction.
102

LIST OF REFERENCES
1 A. Jamalipoura, P. Lorenz, “End-to-end QoS support for IP and multimedia traffic in heterogeneous mobile networks”, Computer Communications, Vol.29, pp.671-682, 2006.
2 3GPP TSG, TS 23. 922. Architecture for an All IP Network, March 2003.
3 3GPP TSG, TS 24. 008. Mobile Radio Interface Layer 3 Specification, Core Network Protocols, March 2003.
4 K. Peng, Y. Lu, “The Research of the Implement of UMTS QoS DiffServ on IXP2400”, Proc. of IEEE International Conference on Wireless Communication, Networking and Mobile Computing, pp. 840-843, September 23-26, 2005.
5 K. Peng, Y. Lu, “Research of UMTS Core Network Firewall Based on IXP1200”, Proc. of the 3rd International Conference on Mechatronics and Information Technology, Vol. v6041September 20-23, 2005.
6 F. Siddiqui, S. Zeadally, “Mobility Management across Hybrid Wireless Networks-trends and Challenges”, Computer Communications, Vol.29, pp.1363-1385, 2006.
7 V. G. Ozianyi, N. Ventura, “A Novel Pricing Approach for QoS Enabled 3G Networks”, Proceedings of the IEEE LCN Conference, pp.578–586, 2005.
8 R. Koodli, M. Puuskar, “Supporting Packet-data QoS in Next-Generation Cellular Networks”, IEEE Communication Magazine, Vol.39, No.2, pp.180-188, 2001.
9 V. G. Ozianyi, N. Ventura and E. Golovins, “A Novel Pricing Approach to Support QoS in 3G networks”, Computer Networks, Vol.52, pp.1433-1450, 2008.
10 H. Chaskar, R. Koodli, “MPTS and DiffServ for UMTS QoS in GPRS Core Network Architecture”, Proceedings of NET, pp.244-249, Stockholm, 2001.
11 S. Maniatis, “QoS Issues in the Converged 3G Wireless and Wired Network”, IEEE Communications Magazine, Vol.40, No.8, pp.44-53, 2002.
12 V. Marques, R. Aguiar and P. Pacyna, “An Architecture Supporting End-to-end QoS with User Mobility for Systems beyond 3rd Generation”, 1st Mobile & Wireless Telecommunications Summit, pp.858-862, Thessaloniki, 2002.
13 K. Peng, Y. Lu, “A Novel QoS DiffServ Model of WCDMA Research and Implement on Network Processor”, Proc. of 2005 Global Mobile Congress, pp.265-270, October 10-12, 2005.
103

14 T. Hoßfeld, A. Binzenhofer, “Analysis of Skype VoIP Traffic in UMTS: End-to-end QoS and QoE Measurements”, Computer Networks, Vol.52, pp.650-666, 2008.
15 F. Zaraia, N. Boudrigaa and M. S. Obaidatb, “Performance Evaluation of A Novel Scheme for QoS Provision in UTRA TDD”, Computer Communications, Vol.29, pp.969-982, 2006.
16 F. Palmieri, “A MPLS-based Architecture for Scalable QoS and Traffic Engineering in Converged Multi-service Mobile IP Networks”, Computer Networks, Vol.47, pp.257-269, 2005.
17 J. Diederich, L. Wolf and M. Zitterbart, “A Mobile Differentiated Services QoS Model”, Computer Communications, 2004.
18 S. Andersen, A. Duric, H. Astrom, R. Hagen, W. Kleijn and J. Linden, “RFC 3951: internet Low Bit Rate Codec (iLBC)”, 2004.
19 H. Shimonishi, T. Murase, “A Network Processor Architecture for Flexible QoS Control in Very High-speed Line Interfaces”, Proceedings of the 2001 IEEE Workshop on High Performance Switching & Routing, pp.402-406, Dallas, 2001.
20 Mäder A., Wagner B., Hoßfeld T., Staehle D. and Barth H., “Measurements in A Laboratory UMTS Network with Time-varying Loads and Different Admission Control Strategies”, Proceedings of IPS-MoMe, Salzburg, Austria, 2006.
21 Intel Corporation, Development Tools User’s Guide, 2003.
22 Intel Corporation, IXA Portability Framework Developer’s Manual, 2003.
23 Intel Corporation, Intel IXP2400 Network Processor Hardware Reference Manual, 2003.
24 Intel Corporation, Intel IXP2400 Network Processor-2nd Generation Intel NPU, 2002.
25 Global IP Sound, iSAC, http://www.globalipsound.com/datasheets/iSAC.pdf, 2006.
26 J. Erik and R. Aaron, IXP2400/2800 Programming, Intel Press, 2004.
27 M. Labrecque, Towards a Compilation Infrastructure for Network Processors, Master’s Thesis, University of Toronto, pp.7-11, 2006.
28 L. Thiele, S. Chakraborty, M. Gries, A. Maxiaguine and J. Greutert, “Embedded Software in Network Processors Models and Algorithms”, Proceedings of the 1st
104
Workshop on Embedded Software, Lecture Notes in Computer Science, Lake Tahoe, CA, 2001.
29 F. Buccafurri et. al., “Analysis of QoS in Cooperative Services for Real-time Applications”, Data & Knowledge Engineering, Vol.67, No.3, 2008.
30 Y. Ito, S. Tasaka, “Feasibility of QoS control based on QoS Mapping over IP Networks”, Computer Communications, Vol.31, No.10, 2008.
31 A. Tiwaria and A. Sahoo, “Providing QoS in OSPF based Best Effort Network Using Load Sensitive Routing”, Simulation Modelling Practice and Theory, Vol.15, No.4, 2007.
32 D. A. Menascéa, H. Ruana, and H. Gomaa, “QoS Management in Service-oriented Architectures”, Performance Evaluation, Vol.64, No.7, 2007.
33 S. Floyd, V. Jacobson, “Random Early Detection Gateways for Congestion Avoidance”, IEEE/ACM Transactions on Networking (TON), August, 1993.
34 N. Masayoshi, “Improving the Performance of Active Buffer Management with Per-flow Information”, IEEE Communications Letters, Vol.6, No.7, July, 2002.
35 RFC: Recommendations on Queue Management and Congestion Avoidance in the Internet.
36 W. Feng, K. G. Shin, D. D. Kandlur, and D. Saha, “The Blue Active Queue Management Algorithms”, IEEE/ACM Transactions on Networking Vol.10, No.4, pp.513-528, 2002.
37 C.V. Hollot, V. Misra, D. Towsley, and W. Gong, “Analysis and Design of Controllers for AQM Routers Supporting TCP Flows”, IEEE Transactions on Automatic Control, Vol.47, No.6, pp.945-959, 2002.
38 M. Ghaderi and R. Boutaba, “Call Admission Control for Voice/data Integration in Broadband Wireless Networks”, IEEE Transactions on Mobile Computing, Vol.5, No.3, 2006.
39 G. Ascia, V. Catania, D. Panno, “An Efficient Buffer Management Policy Based On an Integrated Fuzzy-Ga Approach”, Proc. of IEEE INFOCOM 2002, New York, USA, Jun. 23-27, 2002.
40 E. L. Hahne, A. K. Choudhury, “Dynamic Queue Length Thresholds for Multiple Loss Priorities”, IEEE/ACM Transactions on Networking, Vol.10, No.3, June 2002.
41 A. Demers, S. Keshav, and S. Shenker, “Analysis and Simulation of a Fair Queuing Algorithm”, Proceedings of ACM SIGCOMM, pp.1-12, Sep. 1989.
105

42 L. Zhang, “VirtualClock: A New Traffic Control Algorithm for Packet Switching Network”, Proceeding of ACM SIGCOMM’90, pp.19-29, August, 1990.
43 V. Srinivasan, G. Varghese, “Fast IP Lookups Using Controlled Prefix Expansion”, ACM, Trans. on Computer Systems, Vol.17, No.1, pp.1-40, 1999.
44 Wikipedia, http://en.wikipedia.org/wiki/Weighted_round_robin.
45 M. Shreedhar, G. Varghese, “Efficient Fair Queuing Using Deficit Round Robin”, ACM SIGCOMM Computer Communication Review, Vol.25, No.4, pp.231, October, 1995.
46 A. K. Parekh, G. R. Gallager, “A Generalized Processor Sharing Approach to Flow Control in Integrated Services Networks: The Multiple Node Access”, IEEE/ACM Trans. on Networking, Vol.2, No.2, pp.137-150, 1994.
47 V. G. Ozianyi, A Novel Pricing Approach to Support QoS in 3G Networks, Master’s Thesis, University of Cape Town, Private Bag, 7701 Rondebosch, South Africa, 2006.
48 K. Peng, Y. Lu, “A Novel Packet Classification Algorithm for Information Security Firewall”, Proc. of International Conference on Space Information Technology, Vol. v5985 part1, November 19-20, 2005.
49 Texas Instruments, OMAP3430, http://focus.ti.com/, 2006.
50 W. Fang, N. Seddigh, and B. Nandy, A Time Sliding Window Three Color Marker (tswTCM), RFC2859, June, 2000.
51 J. V. Lunteren, A. P. J. Engbersen, “Multi-field Packet Classification Using Ternary CAM”, Electronics Letters, Vol.38, No.1, pp.21-23, 2002.
52 V. Srinivasan, G. Varghese, and S. Suri, “Fast and Scalable Layer Four Switching”, ACM SIGCOMM Computer Communication Review, Vol.28, No.4, pp.191-202, 1998.
53 M. Buddhikot, S. Suri, and M. Waldvogel, “Space Decomposition Techniques for Fast Layer-4 Switching”, Proc. of Conf. on Protocols for High Speed Networks, Salem, MA, USA, pp.25-41, 1999.
54 P. Gupta, N. McKeown, “Packet Classification Using Hierarchical Intelligent Cuttings”, IEEE Micro, Vol.20, No.1, pp.34-41, 2000.
55 A. Brodnik, S. Carlsson, M. Degermark, et. al., “Small Forwarding Tables for Fast Routing Lookup”, Proc. of ACM SIGCOMM, Cannes, France, 1997.
106

56 J. Xu, M. Singhal, and J. Degroat, “A Novel Cache Architecture to Support Layer-four Packet Classification at Memory Access Speeds”, Proc. of INFOCOM, Tel Aviv, Israel, 2000.
57 Y. W. Leung, T. K. C. Chan, “Design of an Interactive Video-on-demand System”, IEEE Transactions on Multimedia, Vol.5, No. l, pp.130-140, Mar. 2003.
58 H. C. Kim, K. Kim and S. Min, “Design and Implementation of Streaming System of MPEG- 4 based Interactive Contents over IP Networks”, Proc. of Digital and Computational Video 2002, pp.100-107, Nov. 14-15, 2002.
59 H. C. Kim, J. M. Ieong and K. Kim, “Development of Interactive Contents Streaming System based on MPEG-4”, Proc. of the 6th International Conference on Advanced Communication Technology, Vol.2, pp.751-755, Feb.2004.
60 G. M. Muntean, P. Perry and L. Murphy, “A New Adaptive Multimedia Streaming System of All-IP Multi-service Networks”, IEEE Transactions on Broadcasting, Vol. 50, No. l, pp. l-10, March 2004.
107
VITA
YECHANG FANG
June 10, 1981 Born, Puyang, Henan, China
2000 - 2004 B.S., Telecommunication Engineering
Beihang University Beijing, China
2004 - 2005 Program Coordinator Software College, Beihang University Beijing, China
2005 - 2006 M.S., Electrical Engineering Florida International University Miami, FL
2006 - 2007 Client Representative IBM China Beijing, China
2007 - 2010 Doctoral Candidate in Electrical Engineering Florida International University Miami, FL
PUBLICATIONS AND PRESENTATIONS
1. Y. Fang, K. Yen, A. Caballero, Wu, N. “A Multidimensional Packet Classification Algorithm Based on Network Processors”, Proceedings of the 12th WSEAS International Conference on Automatic Control, Modeling and Simulation (ACMOS’10), pp. 231-234, Catania, Italy, May 29-31, 2010.
2. A. Caballero, K. Yen, Y. Fang, J. L. Abreu, “Method for Classification in
Interval-Valued Information Systems (Plenary Lecture)”, Proceedings of the 12th WSEAS International Conference on Automatic control, Modeling and Simulation (ACMOS’10), pp. 242-247, Catania, Italy, May 29-31,2010.
3. Y. Du, Y. Fang, N. Wu and K. K. Yen, “Performance Analysis for Complex
FastICA Algorithms in MIMO OFDM Systems”, Proc. of the 2nd International Conference on Future Computer and Communication, Wuhan, May 21-24, 2010.
108
109
4. Y. Fang, K. Yen, D. Pan, and Z. Shun, “Buffer Management Algorithm Design and Implementation Based on Network Processors”, International Journal of Computer Science and Information Security, vol. 8, no. 1, pp 1-8, April 2010.
5. N. WU, Y. FANG, Y. DU, and K. K. YEN, “Mutiuser Scheduling Schemes for
MIMO-OFDM Systems”, Proc. of the 74th Florida Academy of Sciences Annual Meeting, Fort Pierce, Florida, USA, March 19-20, 2010.
6. Y. DU, N. WU, Y. FANG, and K. K. YEN, “A Comparison of Different Contrast
Functions of FastICA Algorithms in a MIMO-OFDM System”, Proc. of the 74th Florida Academy of Sciences Annual Meeting, Fort Pierce, Florida, USA, March 19-20, 2010.
7. Y. Fang, K. Yen, A. Caballero, N. Wu, “Design and Realization of Transportation
Information Acquisition System Based on 3G and DSP”, Journal of E-business Technology and Strategy, vol. 6, no. 1, pp 61-69, January–March 2010.
8. A. Caballero, K. Yen, Y. Fang, “Analysis of Classification in Interval-Valued
Information Systems: A Case Study”, Proc. of the 5th Int’l Conf. on Information, Kyoto, Japan, November 6-9, 2009.
9. Y. Fang, K. Yen, A. Caballero, Nansong Wu, “Design of a New Transportation
Information Acquisition System Based on 3rd Generation Mobile Communication Technology”, Proc. of the 5th Int’l Conf. on Information, Kyoto, Japan, November 6-9, 2009.
10. Y. Fang, N. Wu, Y. Du, K. Yen, “A Queue Management Algorithm Based on
Network Processors”, Proc. of the 8th Int’l Conf. on Information and Management Sciences, pp. 289-293, Kunming, China, July 20-28, 2009.
11. M. Zhang, L. Sun, Y. Fang, S. Yang, “iGridMedia: The system to provide low
delay peer-to-peer live streaming service over internet”, Peer-to-Peer Networking and Applications, Springer, June 2009.
12. K. Yen, A. Caballero, Y. Fang, “Iris Classification Using Rough Sets and Fuzzy
Pattern Classification Techniques”, Proc. of the 7th Int’l Conf. on Information and Management Sciences, pp. 464-468, Urumchi, China, August 12-19, 2008.
13. A. Caballero, K. Yen, Y. Fang, “Classification with Diffuse or Incomplete
Information”, WSEAS Trans. on Systems and Control, vol. 3, no. 6, pp 617-626, June 2008.

![Ethernet QoS, Timing, and Synchronization Requirements · Ethernet QoS, Timing, and Synchronization Requirements Geoffrey M. Garner SAIT / SAMSUNG Electronics ... WCDMA FDD [5] WCDMA](https://img.dokumen.tips/doc/110x75/5e9fadd64cf17269197f5528/ethernet-qos-timing-and-synchronization-requirements-ethernet-qos-timing-and.jpg)


![w(Level3)-Wcdma Rno Qos in Umts Network-20041217-A-1[1].0](https://img.dokumen.tips/doc/110x75/552c41e35503464e1e8b46fb/wlevel3-wcdma-rno-qos-in-umts-network-20041217-a-110.jpg)