Embed Size (px)
Citation preview

REAL TIME GAS MONITORING USING WIRELESS SENSOR NETWORK
Varsha Chandravanshi
Department of Mining Engineering
National Institute of Technology Rourkela

Real Time Gas Monitoring
System Using Wireless Sensor
Network
Thesis submitted to the
National Institute of Technology Rourkela
in partial fulfillment of the requirements
of the degree of
Master of Technology
in
Mining Engineering
by
Varsha Chandravanshi
(Roll Number: 214MN1509)
under the supervision of
Prof. B. K. Pal
May 2016
Department of Mining Engineering

Department of Computer Science and Engineering
National Institute of Technology Rourkela Prof. B. K. Pal Professor
May 31, 2016
Supervisors’ Certificate
This is to certify that the work presented in the dissertation entitled Guidelines for
Real time gas monitoring system using wireless sensor network submitted by
Varsha Chandravanshi, Roll Number 214MN1509, is a record of original research
carried out by him under our supervision and guidance in partial fulfillment of the
requirements of the degree of Master of Technology in Mining Engineering. Neither
this dissertation nor any part of it has been submitted earlier for any degree or
diploma to any institute or university in India or abroad.
Dr. B. K. Pal Professor

Dedication
Dedicated to my Parents.
Signature

i
ACKNOWLEDGEMENT
I am thankful to my guide Dr. B.K. Pal who motivated me during the journey of my research
work by his support, infusion, encouragement and with positive criticism. I express my deep
regard to him for the successful completion of this work. His ideas and suggestions were helpful
for timely accomplishment of the target aimed. His heart being a great ocean of compassion
and love not only created a friendly environment during my work but also enlightened my soul.
I am grateful to Prof. Gurudadhwaj Hota, Department of Chemistry, National Institute of
Technology, Rourkela, for providing me facilities to carry out my thesis work in his
Department and provided inputs when needed.
I want to extend my gratitude to all the teachers and staff of our department for their affection
and support. I am also very thankful to all my classmates and friends who always encouraged
me and provided me with suggestions for various steps in completion of this work.
I render my admiration to all my family members and my well-wishers for giving me mental
support and inspiration for carrying out my research work. At last my gratitude to the Almighty
for having given the blessings on me to finish this work.
VARSHA CHANDRAVANSHI
ROLL NO. 214MN1509
ii
ABSTRACT
Miner’s safety is the main issue in the present era. Miner’s health is affected by many means
which includes unstable and cumbersome underground activities and awkward loads, heavy
tools and equipment, exposure to toxic dust and chemicals, gas or dust explosions, improper
use of explosives, gas intoxications, collapsing of mine structures, electrical burn, fires,
flooding, rock falls from roofs and side walls workers stumbling/slipping/falling, or errors from
malfunctioning or improperly used mining equipment.
In earlier days for detection of gases canary and small animals are used but they didn’t provide
the exact condition of the mines so safety in mine in not guaranteed. Hence there is a need of
monitoring system which utilized the ZigBee wireless sensor network technology.
There are two units of the monitoring system Sensor unit and Monitoring unit. Sensor unit will
be placed in the underground section and Monitoring unit will be placed in the above the mines
from where monitoring is done.
Firstly, the Sensor unit is placed in the underground section of the mine. Where input is taken
from the sensors in terms of Methane (CH4) i.e. MQ-2 sensor, Hydrogen Sulphide (H2S) i.e.
MQ-136 sensor, and Natural Gases i.e. MQ-5 sensor. Then they are compared with their
threshold value by the Microcontroller Module and if the value is above the threshold value,
the Buzzer starts ringing meanwhile data is displayed in the Display module and sent to the
Wireless Communication Module of the Monitor unit i.e. end device or coordinator through
the Wireless Communication Module of the Sensor unit i.e. router.
In this way the study can help the miners get relief from any casualty and ultimately save their
lives. The device encompasses a large range of networking. The data can also be stored for
future investigation. The device is also durable and cost effective with a price of approx. Rs.
6,500 to 7,000/-.
Keywords: ZigBee Technology; Wireless Sensor Network; Sensor Unit; Monitoring Unit;
Mine Safety; Microcontroller Module; Data Acquisition Module

iii
ACRONYMS
WSN Wireless Sensor Network
XBee ZigBee
MAC Media Access Control
ADO Active Data Object
CAN Controller Area Network
ARM Advanced Risk Machine
CPU Central Processing Unit
ASK Amplitude Shift Keying
F-ASK Frequency Amplitude Shift Keying
D-ASK Digital Amplitude Shift Keying
IC Integrated Circuit
IR infra-red
GSM Global System for Mobile Communication
GPRS General Packet Radio Service
RF Radio Frequency
A Ampere
V Volt
KW Kilo Watt
PPM Parts Per Millions
PPB Parts Per Billions
USART Universal Synchronous Asynchronous Receiver and Transmitter
KB Kilo Byte
TTL Transistor Transistor Logic
LCD Liquid Crystal Unit
IDE Integrated Development Environment

iv
CONTENTS
Sl. No. Title Page No.
Acknowledgement i
Abstract ii
Acronyms iii
List of Figures vii
List of Tables ix
Chapter-1
INTRODUCTION 1-7
1.1 Introduction 2
1.2 Background and Motivation for the Present Research Work 3
1.3 Objectives of the Project 6
1.4 Layout of the Thesis 7
1.5 Conclusion 7
Chapter-2
LITERATURE REVIEW 8-14
2.1 Introduction 9
2.2 Overview of Previous Research Work 9
2.3 Conclusion 14
Chapter-3
MINE GASES AND THEIR IMPACT
15-24
3.1 Introduction 16
3.2 Coal Mine Gases 16
3.2.1 Natural Gases 17
3.2.2 Methane (CH4) 18
3.2.3 Hydrogen Sulfide (H2S) 19
3.2.4 Carbon Monoxide (CO) 20
3.2.5 Carbon Dioxide (CO2) 22
3.3 Conclusion 24

v
Chapter-4
DESIGN METHODOLOGY 25-49
4.1 Introduction 26
4.2 Methodology 26
4.3 Algorithm 26
4.4 Block Diagrams 27
4.5 Flow Charts 28
4.6 System Hardware Design 29
4.6.1 Arduino 29
4.6.2 ZigBee PRO SB 34
4.6.3 XBee USB interfacing Board 35
4.6.4 Hydrogen Sulphide Sensor (MQ-136) 36
4.6.5 Methane Sensor (MQ-2) 39
4.6.6 Natural Gas Sensor (MQ-5) 41
4.6.7 LCD Display Unit 44
4.7 Hardware Implemenntation 46
4.8 Software Implementation 47
4.9 Conclusion 49
Chapter-5
EXPERIMENT RESULT AND DISCUSSION 50-54
5.1 Introduction 51
5.2 Testing of the Module 51
5.2.1 Testing of H2S Gas 51
5.2.2 Testing for Natural Gas 52
5.2.3 Testing for CH4 Gas 53
5.3 Conclusion 54
Chapter-6
CONCLUSION AND FUTURE SCOPE
55-56
6.1 Conclusion 56

vi
6.2 Future Scope 56
REFERENCES 57

vii
LIST OF FIGURES
Sl. No. Figure No. Figure Description Page No.
1 1.1 Wireless Sensor Network 6
2 4.1 Block Diagram of Sensor Unit 27
3 4.2 Block Diagram of Monitor Unit 27
4 4.3 Flow Chart of Sensor Unit 28
5 4.4 Flow Chart of Monitor Unit 29
6 4.5 Arduino UNO Board 31
7 4.6 Block Diagram of Arduino UNO 32
8 4.7 Pin Diagram of Arduino with their Function 33
9 4.8 XBee PRO SB Series 34
10 4.9 Pin Specification of XBee PRO 35
11 4.10 XBee USB interfacing board 36
12 4.11 MQ-136 Sensor and MQ-136 Module 36
13 4.12 Structure and Configuration of MQ-136 38
14 4.13 MQ-136 Test Circuit 38
15 4.14 MQ-136 sensitivity characteristics for several gases 39
16 4.15 MQ-136 characteristic for temperature and humidity 39
17 4.16 MQ-2 Sensor and MQ-2 Module 40
18 4.17 MQ-2 Sensor Wiring Circuit 40
19 4.18 The MQ-2 sensitivity characteristics for several gases 40
20 4.19 Typical dependence curve on temperature and humidity of the
MQ-2
41
21 4.20 MQ-5 Sensor and MQ-5 module 42
22 4.21 Structure of MQ-5 sensor 42
23 4.22 The typical sensitivity characteristics curve of the MQ-5 for
different gases
43
24 4.23 The typical dependency curve on temperature and humidity of the
MQ-5
43
25 4.24 Pin Diagram of LCD 44
26 4.25 Pin Description and Connection Diagram of 16x2 LCD 45
27 4.26 Sensor Unit of Monitoring System in Bread board 46
28 4.27 Final design of Monitoring System 47

viii
29 4.28 Configuration of Coordinator on XCTU 48
30 4.29 Configuration of Coordinator on XCTU 48
31 5.1 MQ-136 value given by Arduino IDE software 51
32 5.2 Comparison of atmospheric Natural gas and Sensor output 52
33 5.3 MQ-5 value given by Arduino IDE software 52
34 5.4 Comparison of atmospheric H2S and Sensor output 53
35 5.5 MQ-2 value given by Arduino IDE software 53
36 5.6 Comparison of atmospheric Methane and Sensor output 54

ix
LIST OF TABLES
Sl. No. Table No. Table Description Page No.
1 1.1 Statics of Accidents 2
2 3.1 Concentration of H2S in the air with their Health Effect and
Category
20
3 3.2 Concentration of CO in the air with their Health Effect and
Category
21
4 3.3 Concentration of CO2 in the air with their Health Effect and
Category
23
5 3.4 Concentration of Different Gases in the air with their Source,
Route of Entry, TLV and Toxic Health Effect
23
6 4.1 Technical specification of Arduino UNO 31
7 4.2 Technical Parameters of MQ-136 37
8 4.3 Technical Parameters of MQ-2 41
9 4.4 Pin No. of LCD along with their Name and Function 45

VARSHA CHANDRAVANSHI 214MN1509 1 | P a g e
Chapter 1
INTRODUCTION

VARSHA CHANDRAVANSHI 214MN1509 2 | P a g e
1.1 INTRODUCTION
The extraction of minerals has been going ahead since ancient time, in numerous parts of the
world. Today, mining exists in many nations and incorporates investigation for minerals,
extraction of minerals, and planning, including pulverizing, crushing, focus or washing of the
separated material.
The conventional picture of the working conditions in mining and quarrying is that the work
is physically requiring and risky because of unstable underground, cumbersome and awkward
loads, heavy tools and equipment, exposure to toxic dust and chemicals, gas and dust
explosions, inappropriate use of explosives, gas intoxications, subsiding of mine structures
,electrical burn, fires, flooding, rock falls from roofs and side walls workers
stumbling/slipping/falling, or errors from failing or inappropriately used mining apparatus.
The safety society in mine activities demands serious action. Education to workers to do their
job in protected way, but however supported devices and safe guidelines also important
aspects of the safety society.
Table 1.1: Statistics of Accidents [25]
Sr. no. Date of Accident Name of Mines Fatalities Cause
1. 14/03/1954 Damra 10 Explosion of Fire Damp
2. 05/02/1955 Amlabad 52 Explosion of Fire Damp
3. 19/02/1958 Chinakuri 175 Explosion of Fire Damp
4. 28/05/1965 Dhori 268 Coal Dust Explosion
5. 18/03/1973 Jitpur 48 Explosion of Fire Damp
6. 04/10/1976 Suhamdih 43 Explosion of Fire Damp
7. 04/10/1976 Baragolai 16 Ignition of Fire Damp
8. 24/08/1981 Jagannath 10 Water Gas Explosion
9. 25/01/1994 New Kenda 55 Fire / Suffocation by Gases

VARSHA CHANDRAVANSHI 214MN1509 3 | P a g e
In coal mines major no. of accidents occur due to gas explosion. With the knowing of the
exact gas concentration these accidents would have been avoided.in Dhori colliery (1965)
Dhanbad (India), 375 miners died due to firedamp and coal dust explosion and in Chasnala
(1975) colliery Dhanbad, 372 people died because of coal dust explosion under the deep
mine. Statistics of accident due to gas explosion is shown in the above table. So the designed
Real Time Monitoring System provide the concentration of gases more precisely.
1.2 BACKGROUND AND MOTIVATION FOR THE
PRESENT RESEARCH WORK
Underground mine ventilation gives a discharge of air to the underground workings of a mine
of adequate volume to mitigate and expel dust and toxic gasses (commonly NOx, methane,
SO2, CO2, and CO) and to adjust the temperature. The origins of these gasses are apparatus
that runs on diesel motors and blasting with explosives and the ore body itself. The biggest
part of the operating expense for mine ventilation is power to control the ventilation fans,
which may represent 33% of a run of the mill underground mine's whole electrical force cost.
Early days, miners convey animals like a bird or canaries with him while he comes under the
mine. The miners will plainly comprehend the circumstance of mine, for ex. Gas spillage by
the method for the feeling of the smell from animals. Now a day’s Gas detection
instrumentation is utilized, for example, gas monitor, atmospheric monitoring system, hand-
held gas indicator, and so on. The handheld gas detector is currently used by a few
mineworkers to make intermittent estimations of gases in the working surface, but the
hypothetically explosive of gases is cannot be avoidable. Since it is not viable placing gas
monitors in all regions where miners may travel or work. Handheld gas monitors are
commonly just utilized by a few miners for occasional estimations of gases close to the
working surface.
Regarding monitoring, we have two type of monitoring i.e. online monitoring and Real-time
monitoring. Real-time monitoring is advantageous over online monitoring. Real-time data
monitoring (RTDM) is a procedure through which an administrator can survey, assess and
change the expansion, erasure, alteration and utilization of information on programming, a
database or a system. It empowers information managers to audit the general procedures and
capacities performed on the information progressively, or as it happens, through graphical
outlines and bars on a focal interface/dashboard.

VARSHA CHANDRAVANSHI 214MN1509 4 | P a g e
Environment monitoring in underground mining (which are typically long and narrow, with
lengths of many kilometres and widths of a few meters) has been a vital task to assure safety
of the working circumstances in coal mines where numerous environmental factors, including
the measure of water, gas and dust, should be monitored. And to attain a monitoring of the
mine surroundings, test information should be gathered at various places. A rigorous
background summary requires a high testing thickness, which includes a huge number of
devices. Existing strategies for coal mine surroundings observing are usually led in a short
and manual way, because of the absence of relating methods for designing a programme
enormous scale sensing system.
Using wires to associate detecting focuses to the preparing server requires a significant
number of cable deployments, which are ardours on account of high maintenance costs and
poor working conditions in underground. Also, the wired communication system makes
system less versatile; as tunnel propels, all the detecting device should be conveyed. In this
circumstance, wireless monitoring exploits advantageous furthermore, adaptable
modification. Because of the unpredictable interference brought about by the concurrence of
working equipment and excavators. However, it is usually impractical to continue direct
wireless communication channels among the processing server and sensing device. With the
type of tunnels make wireless communications directly impossible too.
A wireless network, which utilizes high-frequency radio waves as a replacement for wires to
communicate between nodes, is an another choice for corporate or home networking.
Organizations can use this option to extends their existing wired network or to go totally
wireless. Wireless takes into consideration for devices to be shared without networking wire
which expands mobility, however, decreases range. There are two primary short of wireless
networking; infrastructure and peer to peer or ad-hoc.
A sensor network encompasses of different detection stations called as sensor node, each of
which is lightweight, small and adaptable. Each sensor node is outfitted with a
microcomputer, transceiver, transducer and power source. The sensor creates electrical
signals given detected physical effects. The microcomputer processes and stores sensor yield.
The transceiver gets the summons from a central PC and transmits information to that PC.
The power for each sensor node is given by a battery. Wireless system has advantage over
wired system in terms of Installation, Visibility Node to Node, Visibility Network to Network,

VARSHA CHANDRAVANSHI 214MN1509 5 | P a g e
Time to Installation, Cost, User Connectivity, Mobility, Reliability, Speed and, Bandwidth Cables
Ethernet, Hubs and Switches, Security, Types Local Area Network(LAN), Standards, Signal Loss and
fading, Interference Less, Connection Setup time, Quality of Service. In WSNs, the quantity of
nodes is much greater than any conventional wireless network. Contingent upon the
application, nodes may be in an order of millions. In this manner, it requires a particularly
adaptable solution to ensure sensor network operation with no interruption.
WSNs have a collection of sensor nodes because this location is not allowed to them. Rather
than address-centric sensor networks are information-centric. Operations of sensor systems
are concentrated on information rather than individual sensor node. In this manner, sensor
nodes need cooperative endeavours. Most of the conventional wireless networks utilizes
point-to-point communication while sensor network uses telecast communications. Sensor
node is much cheaper than nodes in ad-hoc network. WSNs are environment-drive or event-
driven. Sensor networks create or gather data when any event happens on the other hand
environment changes while human produces data in conventional systems. Thus, activity
pattern changes with time.
Mobile ad-hoc Networks (MANETs) are intended for distributed processing while sensor
networks are mostly used to accumulate data. Information collected from neighbouring
sensor nodes is exceedingly connected. It has additionally been observed that ecological
quantities changes gradually and some successive readings, detected from sensor nodes are
correlated. And it is a one of kind of sensor networks, which give a chance to develop
proficient energy protocol for transmitting and collection.
This protocol lessens redundant and traffic information in the network and draw out network
lifetime.
Wireless communication has the accompanying points of interest:
I. Communication has upgraded to pass on the data quickly.
II. Working experts can work and get to Internet anyplace and at whatever time without
conveying links or wires wherever they go. This additionally helps to finish the work
on time and enhances the efficiency.
III. Urgent circumstance can be cautioned through wireless correspondence.
IV. Wireless systems are less expensive to introduce and keep up.

VARSHA CHANDRAVANSHI 214MN1509 6 | P a g e
Figure 1.1: wireless system network [26]
ZigBee, a wireless communications protocol, with a safe, reliable and short distance, one can
use ZigBee for collecting the several parameters of the station transmitted to a sensor, and
then use wired data transmission on the ground principal control computer, and from
computer observation and the comparison of the data for examination the security situation
under the Mines. To accomplish the objective area underground, ecological and other
constraints of the remote accumulation can give exploratory premise to relief. Underground
mine environment, interference immunity, the difficulty of the power utilization, and thus has
more rigorous requirements. Consequently, based on ZigBee innovation, mine security
observing framework has an exceptionally vital criticalness.
1.3 OBJECTIVES OF THE PROJECT
The main objective of the project was to design monitoring equipment which can senses and
monitor some gases and take action accordingly.
The research investigations were accomplished with the following objectives:
Create an Arduino, ZigBee-based real-time monitoring system for improving the
safety of the mine.
Detection of various toxic gases inside mining environment.
Trigger the alarm according to the data if data crosses the specified dangerous level.
Gather the data from the ground node and send it to monitoring node using ZigBee.

VARSHA CHANDRAVANSHI 214MN1509 7 | P a g e
1.4 LAYOUT OF THE THESIS
1.5 CONCLUSION
1.5 CONCLUSION
This chapter gives the brief review of the research work, motivation & background for
research work, motivation & background for the work, objective, analysis & organization of
the thesis.
Chapter-1: Gives the brief review of the research work, motivation & background for
research work, motivation & background for the work, objective, analysis & organization of
thesis.
Chapter-2: Involves the literature review for comprehensive analysis of ideas associated
with the design of WSNS.
Chapter-3: Give details about different gas present in mine environment and their impacts.
Chapter-4: Consists of detail idea about methodology & implementation of WSN, with a
brief discussion of each component associated with it.
Chapter-5: Shows the results acquire from the measuring & monitoring under the mine
environment.
Chapter-6: Concludes with the results of the study & suggest the future scope of work.

VARSHA CHANDRAVANSHI 214MN1509 8 | P a g e
Chapter 2
LITERATURE
REVIEW
VARSHA CHANDRAVANSHI 214MN1509 9 | P a g e
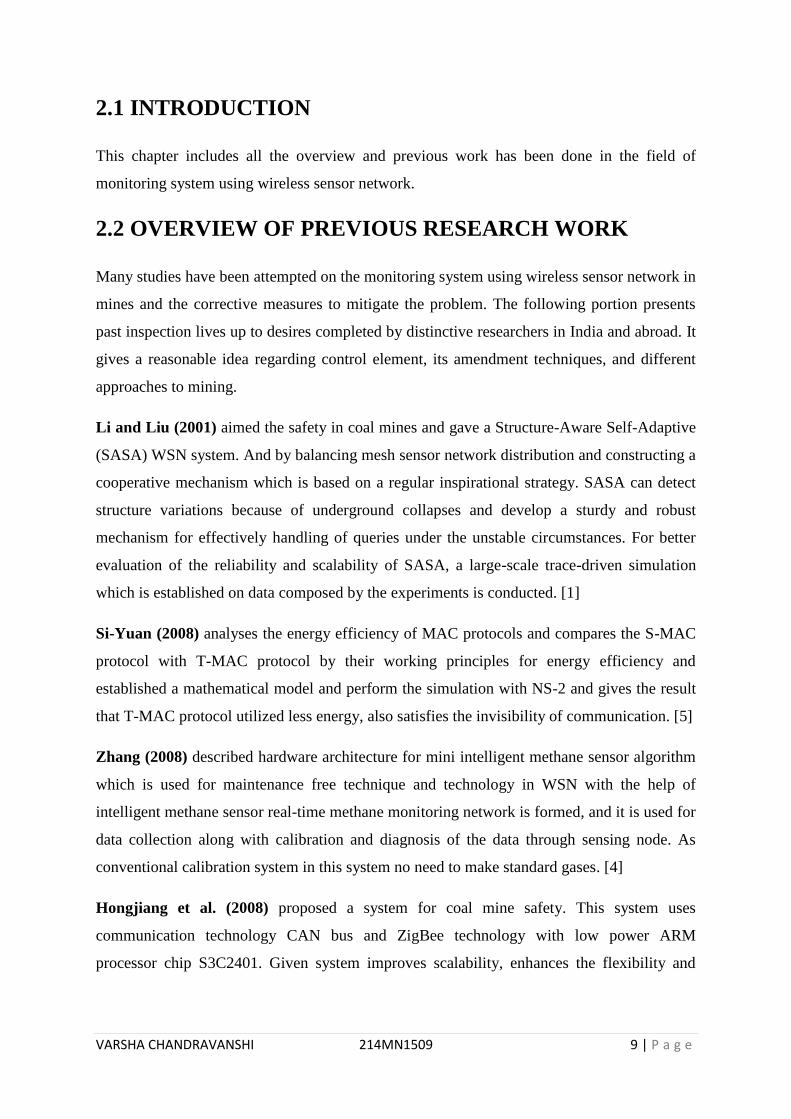
2.1 INTRODUCTION
This chapter includes all the overview and previous work has been done in the field of
monitoring system using wireless sensor network.
2.2 OVERVIEW OF PREVIOUS RESEARCH WORK
Many studies have been attempted on the monitoring system using wireless sensor network in
mines and the corrective measures to mitigate the problem. The following portion presents
past inspection lives up to desires completed by distinctive researchers in India and abroad. It
gives a reasonable idea regarding control element, its amendment techniques, and different
approaches to mining.
Li and Liu (2001) aimed the safety in coal mines and gave a Structure-Aware Self-Adaptive
(SASA) WSN system. And by balancing mesh sensor network distribution and constructing a
cooperative mechanism which is based on a regular inspirational strategy. SASA can detect
structure variations because of underground collapses and develop a sturdy and robust
mechanism for effectively handling of queries under the unstable circumstances. For better
evaluation of the reliability and scalability of SASA, a large-scale trace-driven simulation
which is established on data composed by the experiments is conducted. [1]
Si-Yuan (2008) analyses the energy efficiency of MAC protocols and compares the S-MAC
protocol with T-MAC protocol by their working principles for energy efficiency and
established a mathematical model and perform the simulation with NS-2 and gives the result
that T-MAC protocol utilized less energy, also satisfies the invisibility of communication. [5]
Zhang (2008) described hardware architecture for mini intelligent methane sensor algorithm
which is used for maintenance free technique and technology in WSN with the help of
intelligent methane sensor real-time methane monitoring network is formed, and it is used for
data collection along with calibration and diagnosis of the data through sensing node. As
conventional calibration system in this system no need to make standard gases. [4]
Hongjiang et al. (2008) proposed a system for coal mine safety. This system uses
communication technology CAN bus and ZigBee technology with low power ARM
processor chip S3C2401. Given system improves scalability, enhances the flexibility and

VARSHA CHANDRAVANSHI 214MN1509 10 | P a g e
reduces the cost. This paper gives knowing about ZigBee standard topology (Star, Mesh,
Cluster). [3]
Wenge et al. (2009) proposed a mine safety system on the principle of B/S and C/S mixed
mode by use of the network technology, virtual instrument technology and data base
technology. The system has the underground substation, sensors, ground monitoring center
for remote clients, throughout internet explorer. Client can check the data such as (wind
speed, gas, carbon monoxide etc.). Data is stored in the system by ADO in LabVIEW for web
application interface ASP technology is used. [6]
Wei and Li Li-Li (2009) designed a multipara meter WSN monitoring system which works
on the ZigBee technology for the coal mine. This system gives real-time monitoring for
underground mine and production parameter, warning by the variety of sensors and WSN.
This system utilized the RS-285 communication protocol and hardware modular. This is the
expansion of wired coal mine security system. [8]
Weng et al. (2009) presented a Mine-Auxiliary Sensor System (MASS) that system monitors
all situation in mines which is named as Real-Time Mine Auxiliary Monitoring System
(RMAMS)and for communication D-ASK and D-FSK is used. This system has Mine
Auxiliary Sensor System (MASS) in which System Main Control Computer (SMCC),
System Control Interface Unit(SCIU) are there. MASS involved CPU, RF transceiver IC, a
gas sensor (water check sensor, a microphone sensor, pressure sensor), rechargeable battery,
LED, AC to DC converter, a mercury switch, speaker, active sensor, and repeater.
Comparison for various communication protocol standard is done i.e. for Wi-Fi. D-ASK,
ZigBee, Bluetooth, and D-FSK in terms of speed, band, distance, consumption, capacity and
cost and application. As for mine system real time monitoring and power system play the
important role. So RMAMA D-ASK is used in these system as it spends less power and cost.
[6]
Bin and Huizong (2011) elaborated a method of Mine Safety Monitoring System depend on
ZigBee, and the hardware outline of the ZigBee sensor node and software system design
takes up. The self-organizing routing algorithm for ZigBee systems and the gateway
configuration and systems integration are also studied. ZigBee-based Mine Safety Observing
System can accomplish an assortment of wellbeing variables of creation, and underground
environment, (for example, gas, temperature, moistness and other natural markers) for
observing, controlling mine generation, safety administration for providing a good source for
decision creating. [11]
VARSHA CHANDRAVANSHI 214MN1509 11 | P a g e
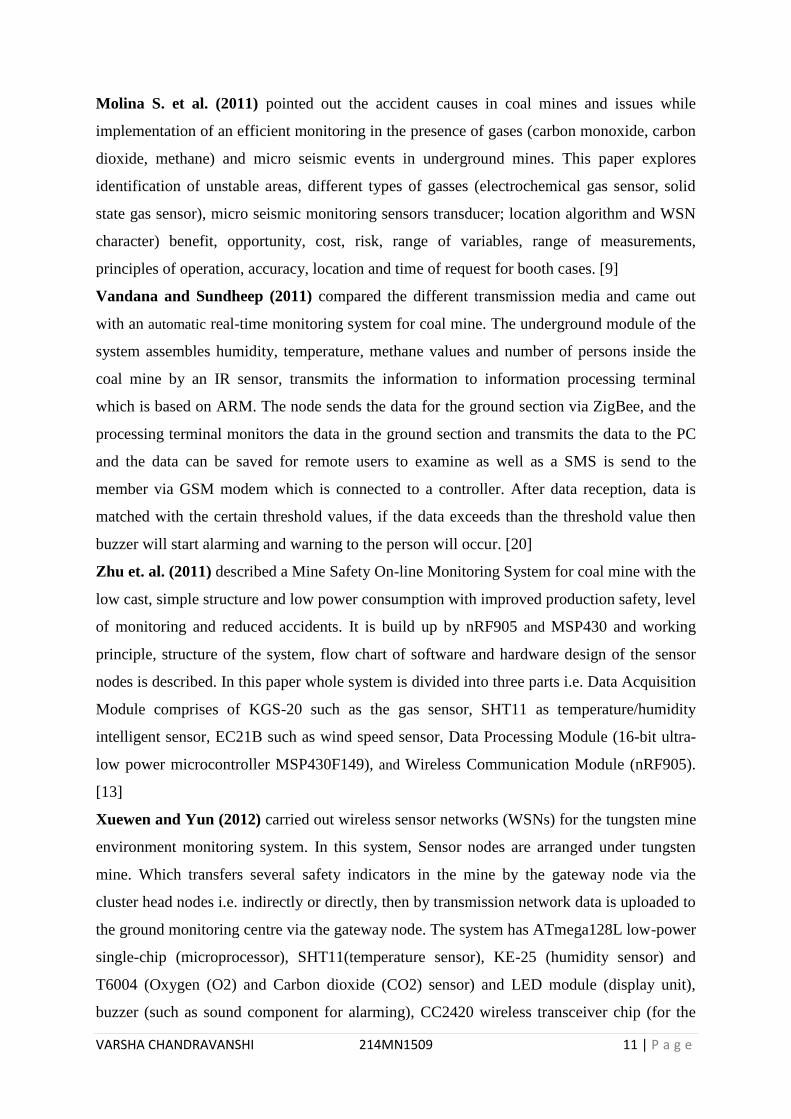
Molina S. et al. (2011) pointed out the accident causes in coal mines and issues while
implementation of an efficient monitoring in the presence of gases (carbon monoxide, carbon
dioxide, methane) and micro seismic events in underground mines. This paper explores
identification of unstable areas, different types of gasses (electrochemical gas sensor, solid
state gas sensor), micro seismic monitoring sensors transducer; location algorithm and WSN
character) benefit, opportunity, cost, risk, range of variables, range of measurements,
principles of operation, accuracy, location and time of request for booth cases. [9]
Vandana and Sundheep (2011) compared the different transmission media and came out
with an automatic real-time monitoring system for coal mine. The underground module of the
system assembles humidity, temperature, methane values and number of persons inside the
coal mine by an IR sensor, transmits the information to information processing terminal
which is based on ARM. The node sends the data for the ground section via ZigBee, and the
processing terminal monitors the data in the ground section and transmits the data to the PC
and the data can be saved for remote users to examine as well as a SMS is send to the
member via GSM modem which is connected to a controller. After data reception, data is
matched with the certain threshold values, if the data exceeds than the threshold value then
buzzer will start alarming and warning to the person will occur. [20]
Zhu et. al. (2011) described a Mine Safety On-line Monitoring System for coal mine with the
low cast, simple structure and low power consumption with improved production safety, level
of monitoring and reduced accidents. It is build up by nRF905 and MSP430 and working
principle, structure of the system, flow chart of software and hardware design of the sensor
nodes is described. In this paper whole system is divided into three parts i.e. Data Acquisition
Module comprises of KGS-20 such as the gas sensor, SHT11 as temperature/humidity
intelligent sensor, EC21B such as wind speed sensor, Data Processing Module (16-bit ultra-
low power microcontroller MSP430F149), and Wireless Communication Module (nRF905).
[13]
Xuewen and Yun (2012) carried out wireless sensor networks (WSNs) for the tungsten mine
environment monitoring system. In this system, Sensor nodes are arranged under tungsten
mine. Which transfers several safety indicators in the mine by the gateway node via the
cluster head nodes i.e. indirectly or directly, then by transmission network data is uploaded to
the ground monitoring centre via the gateway node. The system has ATmega128L low-power
single-chip (microprocessor), SHT11(temperature sensor), KE-25 (humidity sensor) and
T6004 (Oxygen (O2) and Carbon dioxide (CO2) sensor) and LED module (display unit),
buzzer (such as sound component for alarming), CC2420 wireless transceiver chip (for the

VARSHA CHANDRAVANSHI 214MN1509 12 | P a g e
core in the communication module), AA batteries. It efficiently took used of the
microcontroller that has the characteristics of strong function, high assimilation, low power
consumption, small capacity, reliable performance, and sending and the monitoring of thedata
via WSNs. [14]
“Bo et.al. (2012) gave a RESTful Web services mashup enhanced coal mine safety monitoring
and control automation system using ZigBee WSN, which can collect the underground
humidity, temperature, methane values and position via sensor nodes inside the coal mine and
then implementation of a RESTful Application Programming Interface (API) for sensor
nodes to avail access to sensors and actuators, allowing them to be easily combined with
other information resources which are based on the success of the mashup applications. three
different conditions for RESTful Web service mashups showing for coal mine safety
monitoring and the control automation. [15] ”
Yi-Bing (2012) offered a computer-controlled monitoring system for coal mines. The system
integrated three subsystems that are monitoring subsystem, communication subsystem, and
control subsystem. Monitoring subsystem is consisting of wind speed, gas, temperature and
negative pressure sensors, which are present in the mine and used for developing a real-time
monitoring. The communication subsystem composed of Coordinator node, Router node and
End node for performing wireless communication. communication subsystem and monitoring
subsystem enact a network with a central controlled computer which is located on the surface
via CAN buses. The system simultaneously transmits real-time data to the host computer
which is located in the management centre and the mobile phone of the authorized employees
via GPRS module, when the data exceeded by the limited values, buzzer will ring. It reduces
maintenance difficulties, venture on underground lines-laying and ensures accurate,
appropriate and rapid transmission of information in all underground mining zones and
improves the productivity of the system with powerful function, easy building up, good-
extendibility and high-reliability etc. [18]
Garde and Kotgire (2013) provided a better solution of safety system in the coalmines using
ZigBee WSN. The proposed system assembles humidity, temperature, and methane values in
an underground section of the coal mine by ZigBee sensor nodes and then sends the same
data to the receiver, present at the ground section of a coal mine. If the received value crosses
the threshold level, then buzzer starts alarming, and the same data will be display on the LCD
screen, present at both underground and ground section. [14]
Dange and Patil (2013) explored critical situations in the coal mine. For reducing the cost
and improving the productivity with product quality the automation in the coal mine is
VARSHA CHANDRAVANSHI 214MN1509 13 | P a g e
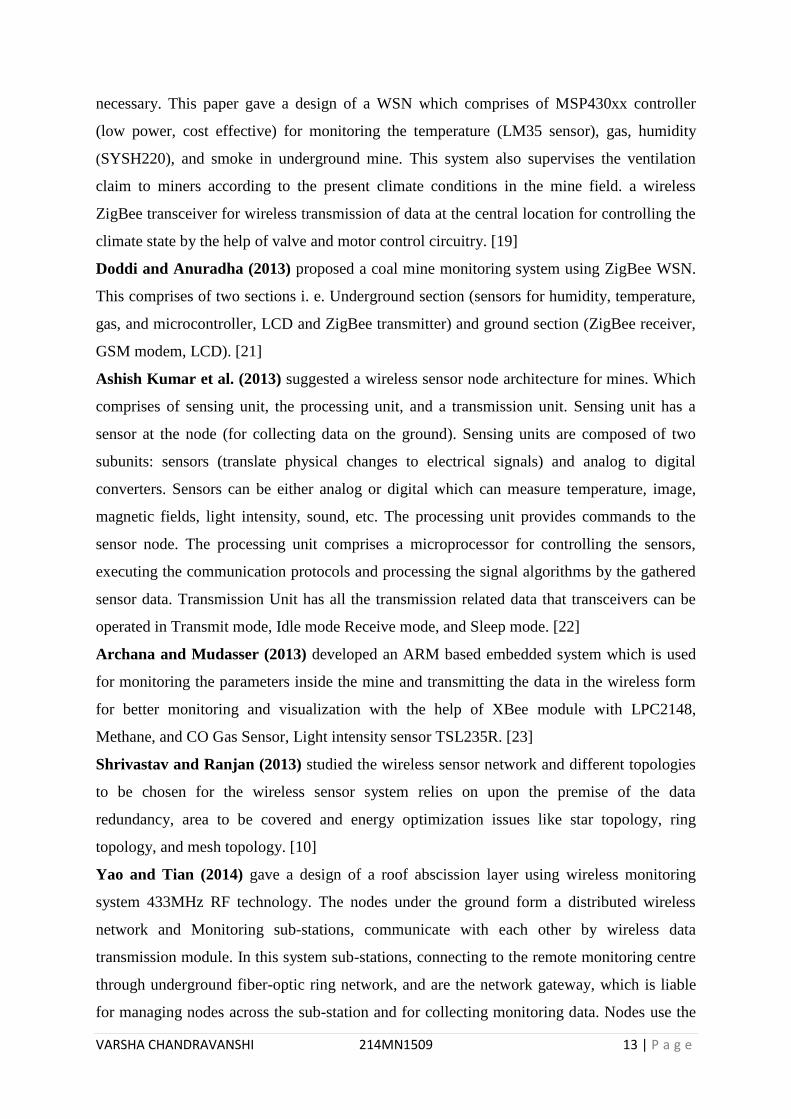
necessary. This paper gave a design of a WSN which comprises of MSP430xx controller
(low power, cost effective) for monitoring the temperature (LM35 sensor), gas, humidity
(SYSH220), and smoke in underground mine. This system also supervises the ventilation
claim to miners according to the present climate conditions in the mine field. a wireless
ZigBee transceiver for wireless transmission of data at the central location for controlling the
climate state by the help of valve and motor control circuitry. [19]
Doddi and Anuradha (2013) proposed a coal mine monitoring system using ZigBee WSN.
This comprises of two sections i. e. Underground section (sensors for humidity, temperature,
gas, and microcontroller, LCD and ZigBee transmitter) and ground section (ZigBee receiver,
GSM modem, LCD). [21]
Ashish Kumar et al. (2013) suggested a wireless sensor node architecture for mines. Which
comprises of sensing unit, the processing unit, and a transmission unit. Sensing unit has a
sensor at the node (for collecting data on the ground). Sensing units are composed of two
subunits: sensors (translate physical changes to electrical signals) and analog to digital
converters. Sensors can be either analog or digital which can measure temperature, image,
magnetic fields, light intensity, sound, etc. The processing unit provides commands to the
sensor node. The processing unit comprises a microprocessor for controlling the sensors,
executing the communication protocols and processing the signal algorithms by the gathered
sensor data. Transmission Unit has all the transmission related data that transceivers can be
operated in Transmit mode, Idle mode Receive mode, and Sleep mode. [22]
Archana and Mudasser (2013) developed an ARM based embedded system which is used
for monitoring the parameters inside the mine and transmitting the data in the wireless form
for better monitoring and visualization with the help of XBee module with LPC2148,
Methane, and CO Gas Sensor, Light intensity sensor TSL235R. [23]
Shrivastav and Ranjan (2013) studied the wireless sensor network and different topologies
to be chosen for the wireless sensor system relies on upon the premise of the data
redundancy, area to be covered and energy optimization issues like star topology, ring
topology, and mesh topology. [10]
Yao and Tian (2014) gave a design of a roof abscission layer using wireless monitoring
system 433MHz RF technology. The nodes under the ground form a distributed wireless
network and Monitoring sub-stations, communicate with each other by wireless data
transmission module. In this system sub-stations, connecting to the remote monitoring centre
through underground fiber-optic ring network, and are the network gateway, which is liable
for managing nodes across the sub-station and for collecting monitoring data. Nodes use the

VARSHA CHANDRAVANSHI 214MN1509 14 | P a g e
displacement sensor for monitoring the roof separation displacement data and MSP430 chip
as a microprocessor which has an auto sleep function, low power, and several ways to wake
up characteristic. It monitors the roof separation displacement information in real-time as
well as send the warning message and but reduces the installation and maintenance cost. [16]
2.3 CONCLUSION
The chapter clarifies all of the previous work done related to the monitoring of mine safety.
The different analysts have done their work in this field and came out with their particular
systems of reconnaissance for the mine gases. By referring their study, the accompanying
work is a spontaneous creation on the ongoing checking of the real-time monitoring system
with wireless system technology of data transmission.
VARSHA CHANDRAVANSHI 214MN1509 15 | P a g e
Chapter 3
MINE GASES WITH
THEIR IMPACT

VARSHA CHANDRAVANSHI 214MN1509 16 | P a g e
3.1 INTRODUCTION
The air in Earth's atmosphere is composed of the mixture of different gases and each gas has
its inheritance. The mixture comprises gases of constant concentrations and variable
concentrations of both time as well as space.
3.2 COAL MINE GASES
Mine gases are the harmful vapours that are produced during mining operations. At the same
time, this released gas is 30% diluted with the environmental air and changes the mine
environment. The impurity is formed as the result of repeatedly blasting of hard rock with
explosives, drilling, burning of light, gases are given off from strata, underground fire and
barring, the underground mine becomes restricted and dangerous owing to the presence of
noxious and poisonous explosive gases.
There is certain mining term for explosive mixture and are frequently called as damps.
They are generally differentiated into the following categories:
Fire damp is synonyms for an inflammable gas in coal mine specially for methane. It
also has the small amount of ethane and propane.
After damp is the toxic combination of gases left in the mine after an explosion
caused by coal dust and firedamp. This leads to black damp. It consists of carbon
monoxide carbon dioxide, and nitrogen.
Black damp, is also known as "choke damp" or "stythe" when the high concentration
of carbon dioxide is mixed with nitrogen then black damp is generated and is an
atmosphere in which a flame lamp will not burn. Their mixture in the air can cause
physical effects or death by suffocation by taking place of environmental oxygen but
it is neither poisonous nor combustible by itself.
White damp is a noxious composite of gases given off by the combustion of coal, in
an enclosed environment like the coal mine. Mainly used for carbon monoxide(CO)
and is an illuminating gas, very poisonous and supports combustion.
Stink damp is usually referred for hydrogen sulphide (H2S).
Source of toxic gasses in mining can be divided into five categorise as follows:
1. Gases by Blasting:

VARSHA CHANDRAVANSHI 214MN1509 17 | P a g e
Blasting operations yield both poisonous and nontoxic gases; the poisonous gases consist
of most part the oxides of nitrogen (NOx)and carbon monoxide (CO). The amount of
poisonous gases delivered by a blasting is influenced by confinement, formulation, and
contamination of the explosive with water, an age of the explosive, or drill, cuttings, etc.
As oxygen is expended in any such blast, oxygen inadequacy may also be an issue.
2. Methane by Coal Beds:
“Exceptionally ignitable methane (CH4)/firedamp, is enclosed in the last segments of coal
organization, and due to depths and pressure, it grows to be entrenched in the coal.
Methane gas is given off into the air. As excavations are done along with from the coal
transportation from the surface.”
3. From Vehicle Exhaust:
Flue gas or exhaust gas is discharged as the result of the burning of fuels, for example,
regular gas, petrol, gasoline, diesel fuel, biodiesel blends, fuel oil, or coal. As per the kind
of engine, it is released into the environment through a flue gas stack, an exhaust pipe or
propelling nozzle. It regularly disperses downwind in an arrangement called an exhaust
plume. In mining diesel vehicles are utilised and nitrogen dioxide and carbon monoxide
and additionally oxygen insufficiency are of concern.
4. Underground Explosions and Fires:
A gas explosion is a combustion coming out because of a gas leak within the presence of
an ignition source. The principal hazardous gases are methane, natural gases, Propane and
butane since they are utilized for heating purposes. But many other gases, like methane
and hydrogen, are combustible and are caused because of explosions in the past.
5. Drilling into Still Water:
“Pockets of the stagnant water can also contain a bulk amount of hydrogen sulphide
coming about basically from the interruption of pyrites.”
Some mining gases with their impacts are as follows:
3.2.1 NATURAL GASES

VARSHA CHANDRAVANSHI 214MN1509 18 | P a g e
Natural gas is a volatile mixture of hydrocarbon gases and Considered a fossil fuel. In the
earth when gases are discharged from the decaying entity and under pressure over billions of
years. Gas is a colourless, tasteless, odourless, and non-toxic gas. An intense chemical called
mercaptan should be added in a very small amount of the gas, for giving the gas a particular
odour of the rotten eggs as the gas is odourless. Natural gas is, for the most part, aggregated
of methane (up to 90%) with the rest of comprising of ethane, butane, propane, hydrogen
sulphide carbon dioxide, nitrogen, oxygen, and trace measures of rare gases. It comes in four
forms:
Liquefied Natural Gas, (LNG)
Regasified Liquefied Natural Gas, (RLNG)
Compressed Natural Gas, (CNG)
Piped Natural Gas, (PNG)
Sources of Natural gases
Natural gas sources can be differentiated into two types based on the production of the rock
characters: conventional natural gas and nonconventional natural gas. The conventional
natural gas is released by an all-around bored in a geologic development in which the cistern
and fluid qualities allow the natural gas to flow promptly to the wellbore. Nonconventional
natural gas does not exist in these traditional supplies and this regular gas takes another
structure or is available in a distinct development that makes its different extraction compare
to conventional sources.
Uses of Natural gases
It is used for the production of electricity, as vehicle fuel, pipeline and distribution,
preheating glasses, waste treatment and incineration, meting glass, drying and
dehumidification and in many processes (like metals, pulp and paper, stone, petroleum
refining, chemicals, glass, clay, plastic and food processing industry).
3.2.2 METHANE (CH4)
Methane is an odourless, colourless, flammable gas, tasteless, and lighter than air with a wide
distribution in nature. It burns promptly in air, producing carbon dioxide and water vapour.
Sources of Methane

VARSHA CHANDRAVANSHI 214MN1509 19 | P a g e
Underground Mining: Methane gas released in all coal mines, given off in pores
inside the coal beam.
Surface Mining: it also results by surface mining
Post-Mining Activities: coal mining activity like transportation, extraction, distribution,
crushing it is released.
Abandoned Mines: Methane releases from the breakdown of the surrounding rock strata
after an area of coal seam have been mined and the artificial rooftop and wall support are
expelled as mining advances to another area.
Impact of CH4
“Methane is poisonous and highly combustible. It may produce explosive mixture with air. It
may lead to oxygen deficiency in air, and cause suffocation because of the High
concentration of methane. Breathing high amounts of the methane can also lead nausea,
slurred speech, vomiting, agitation, flushing and headache. Breathing coma, heart
complications and death may cause in severe cases. Frostbite may be caused when skin is
contacted with liquefied gas. Asphyxia may be the result if the oxygen percentage is
decreased to beneath 19.5%.”
3.2.3 HYDROGEN SULFIDE (H2S)
Hydrogen sulphide is a colourless, highly poisonous and combustible gas. As it is heavier
than air, it has a tendency to collect at the base of inadequately ventilated spaces. Its smell is
like rotten eggs and is in some cases called hydro-sulphuric acid, stink gas or sewer gas.
Sources of H2S
It normally found in raw petroleum, hot springs, and natural gas and is released by bacterial
breakdown of natural materials and animals and human wastes (like sewage). Modern
industrial activities that can also produce the gas which are wastewater treatment, petroleum
and natural gas drilling and refining, coke broilers, Kraft paper plants and tanneries. It can be
existing as a liquid compressed gas.
Impact of H2S

VARSHA CHANDRAVANSHI 214MN1509 20 | P a g e
Hydrogen sulphide is a concoction asphyxiates and irritant with consequences for both
oxygen use and the central anxious system.
Low concentration of gas irritates the nose, eyes, throat and the respiratory system (as
squatness of breath, burning or slitting of eyes, cough,). Even asthmatics may feel some
breathing problems.
The moderate concentration of gas results more severe respiratory and eye irritation (like an
accumulation of fluid in lungs, coughing, difficulty breathing), dizziness, headache,
vomiting, nausea, staggering and excitability.
High concentration can cause extremely rapid unconsciousness, convulsions, shock, inability
to breathe, coma and death. Effect can happen possibly in the few breaths or even within
single breath.
Table 3.1: Concentration of H2S in the air with their Health Effect and Category [27]
Concentration of H2S in
the air (in ppm)
Health Effect Category
0 -10 ppm Irritation of the nose, eyes, and throat Good
10 – 50 ppm Headache,
Coughing and Breathing problem,
Nausea and Vomiting Dizziness
Moderate
50 – 200 ppm Eye irritation or acute conjunctivitis
Severe respirational tract irritation,
Convulsions,
Shock,
Coma,
Death in severe cases
Very poor
3.2.4 CARBON MONOXIDE (CO)
Carbon Monoxide is tasteless, colourless, and odourless and it has specific gravity same as
air. It is very noxious at low concentrations too and in the blood stream. It is combustible in
the air between 12.5% and 74%. It is poisonous because of the fact that it blocks the capacity

VARSHA CHANDRAVANSHI 214MN1509 21 | P a g e
of the haemoglobin in the blood to convey oxygen from the lungs to the muscles and other
tissue in the human body.
Sources of CO
Carbon monoxide may be found in underground and surface mines in inadequately ventilated
or confined spaces. In different mining operations, the most frequent sources of CO are inner
combustion motor exhaust and explosives explosion and the low-temperature oxidation of
coal can also deliver CO. the main source of CO is
diesel emissions
underground machinery
blasting operations
incomplete combustion of carbonaceous materials, and
spontaneous combustion (coal mines)
fires
Methane and dust emission
Table 3.2: Concentration of CO in the air with their Health Effect and Category [28]
Concentration of CO in
the atmosphere (in PPM)
Breathing Time Toxic Symptoms
9 Short Term Exposure ASHRAE suggested maximum
permissible concentration in living
area.
35 8 hours
The maximum revelation
permissible by OSHA in the
factory over an 8 hour period.
200 2–3 hours Minor headache, fatigue, tiredness,
nausea and dizziness
400 1–2 hours Severe headache and other
symptoms intensify.
Life frightening after 3 hours.
800 45 minutes Nausea, Dizziness, and
convulsions
Unconscious within 2 hours.
Death subsequently 2 – 3 hours.
1,600 20 minutes Dizziness ,headache, and nausea.
Death within 1 hour.
3,200 5–10 minutes Dizziness headache, and nausea.

VARSHA CHANDRAVANSHI 214MN1509 22 | P a g e
Death within 1 hour.
6,400 1–2 minutes Dizziness ,headache, and nausea.
Death within 25-30 minutes.
12,800 1–3 minutes Death within 25-30 minutes.
Impact of CO
When miner get exposed to CO, the early indications of intense CO harming include a
headache, dizziness, blurry vision, drowsiness, confusion and weakness. At first, the victim
may have greyish skin. Because of the CO joining with blood haemoglobin later the skin and
mucous layers turn cherry red. If exposure continues they proceed with vomiting, nausea,
breathing difficulty and ringing in the ears., At last, the victim loses awareness and enters a
state of extreme lethargy or cause permanent brain damage even death can occur in a couple
of minutes.
3.2.5 CARBON DIOXIDE (CO2)
Carbon dioxide is odourless, colourless gas at the room temperature, which is inflammable in
typical conditions. CO2 can be constrained into a solid form, and known such as dry ice. It is
part of black damp and after damp both.
Sources of CO2
Mining release gas from the coal where gas can concentrate in hazardous amounts,
particularly in underground mines. It is created through decay of organic materials and also
through respiration and ignition. It is too created as a by-result of the ignition of fossil fuels,
lime and cement manufacture, beverage carbonation, explosions, chemical reactions with
certain rocks/minerals, even the decay of timber and waste combustion.
Effect of CO2
CO2 is a potential inward breath toxicant and a simple suffocate. It enters in the body by the
air via the lungs and is dispersed into the blood, and may results from an acid-base imbalance
which is called acidosis. Acidosis is brought on by an excess of CO2 in the blood. There is a
higher convergence of CO2 into the blood than in the lungs, framing a fixation inclination,
where blood CO2 spreads into the lungs and after that is breathed out under ordinary

VARSHA CHANDRAVANSHI 214MN1509 23 | P a g e
physiological circumstances. An increase in breathed in CO2 and ensuing response with water
into the blood produces carbonic acid (as H2CO3).
Table 3.3: Concentration of CO2 in the air with their Health Effect and Category [29]
Percentage of CO2
(%)
Symptoms Category
2-3 % Shortness of breath, deep breathing Very Poor
5% Breathing becomes heavy,
sweating, pulse quickens
Good
7.5% Headaches, restlessness, dizziness,
breathlessness, increased heart rate
and blood pressure, visual
distortion
Moderate
10% Impaired hearing, vomiting, nausea,
loss of consciousness
Poor
30% Convulsions,coma, death Very Poor
Table 3.4: Concentration of Different Gases in the air with their Source, Route of Entry, TLV and
Toxic Health Effect [30]
Gas Source(s) Route Of Entry TLV (ppm) Toxic Effects
Nitrogen (NO2) About 4/5th of
atmosphere, Rock
strata form some
mines.
Inhalation - Asphyxia from
oxygen
deficiency.
Carbon Dioxide
(CO2)
Oxidation of coal,
Rotting timbers,
blasting,
Breathing,
explosions, fires
diesel engines and
rock strata in
some mines.
Inhalation 5,000 Concentration
of 5% can
produces
shortness of
breath and
headaches.
Concentration
of 10% can
produces death
due to oxygen
deficiency.
Methane (CH4) Coal and rock
strata,
carbonaceous
shale, and rotting
mine timbers.
Inhalation - Oxygen
deficiency

VARSHA CHANDRAVANSHI 214MN1509 24 | P a g e
Carbon
Monoxide (CO)
Diesel engines,
explosions, fires,
and blasting
Inhalation 50 Low
concentration
can produce
headache,
dizziness and
drowsiness.
Higher
concentration
can produces
nausea,
collapse,
vomiting, coma
and death.
3.3 CONCLUSION
“The chapter gives information about mine gases along with their generation and the effect.
Different dangerous gases like natural gases, CO, CO2, CH4 etc. has been discussed. The
health impacts, toxic effect, the maximum exposure limit, source with their characteristic
each of them is described. With consideration of all of these suitable monitoring systems has
been designed.”

VARSHA CHANDRAVANSHI 214MN1509 25 | P a g e
Chapter 4
DESIGN
MEHTODOLOGY
VARSHA CHANDRAVANSHI 214MN1509 26 | P a g e
4.1 INTRODUCTION
“This chapter comprises of the methodology of the monitoring system with the design
implementation. In methodology block diagram, flow chart and algorithm will be explained
in length. and in design implementation step by step implementation of hardware system after
that software implementation and with the brief discussion of the component used in the
monitoring system.”
4.2 METHEDOLOGY
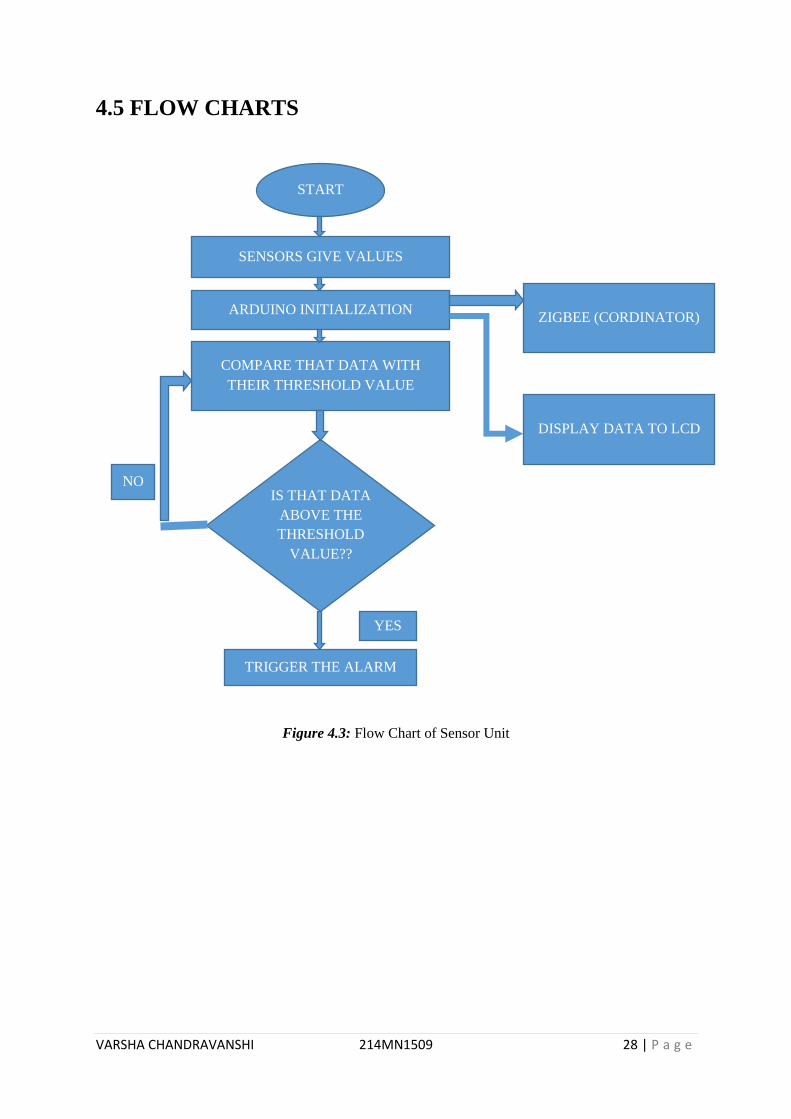
There are two units of the monitoring system Sensor unit and Monitoring unit. Sensor unit
will be placed in the underground section and Monitoring unit will be placed in the above the
mines from where monitoring is done.
Sensor unit comprises of Data Acquisition Module (sensors), Micro Controller Module
(Arduino UNO), Wireless Communication Module (ZigBee Pro SB), Display Module (LCD),
Buzzer, Power Module(batteries).
Monitor unit comprises of Wireless Communication Module (ZigBee Pro SB),
Microcontroller Module (Arduino UNO), Display Module (LCD), Power Module (batteries).
Firstly, the Sensor unit is placed in the underground section of the mine. Where input is taken
from the sensors in terms of Methane(CH4) i.e. MQ-2 sensor, Hydrogen Sulphide (H2S) i.e.
MQ-136 sensor, and Natural Gases i.e. MQ-5 sensor. Then they are compared with their
threshold value by Microcontroller Module and if value is above the threshold value Buzzer
start ringing meanwhile data is displayed in the Display module and sent to the Wireless
Communication Module of the Monitor unit i.e. end device or coordinator through the
Wireless Communication Module of the Sensor unit i.e. router.
In the Monitor unit data is taken by Wireless Communication Module and displayed in the
Display Module through Microcontroller Module.
4.3 ALGORITHM
Step 1: Take input through sensor.
Step 2: Input data is compared with their threshold value.
Step 3: If data is above the threshold value buzzer start ringing.

VARSHA CHANDRAVANSHI 214MN1509 27 | P a g e
Step 4: Input data is displayed in the LCD.
Step 5: Data is transmitted to the Monitor unit through Wireless sensor.
Step 6: Data is received from Sensor unit.
Step 7: Data is displayed through LCD in the Monitor Unit.
4.4 BLOCK DIAGRAMS
Figure 4.1: Block Diagram of Sensor Unit
Figure 4.2: Block Diagram of Monitoring Unit
ZIGBEE USB
INTERFACING
MODULE
POWER SUPPLY
(3.3 V)
ZIGBEE PRO SB
MODULE
(END DEVICE/
RAUTOR)
ARDUINO UNO
ATMEGA32B
BOARD
LCD
POWER
SUPPLY
(5V)
MQ-2 SENSOR
(CH4)
MQ-5 SENSOR
(NATURAL GASES)
MQ-136
SENSOR
(H2S)
ARDUINO UNO
ATMEGA 32B
BOARD
POWER SUPPLY
(5.0 V)
LCD DISPLAY
ALARM
ZIGBEE PRO SB
MODULE
(CORDINATOR)
ZIGBEE USB
INTERFACING MODULE
POWER SUPPLY
(3.3 V)
VARSHA CHANDRAVANSHI 214MN1509 28 | P a g e
4.5 FLOW CHARTS
Figure 4.3: Flow Chart of Sensor Unit
START
SENSORS GIVE VALUES
ARDUINO INITIALIZATION
COMPARE THAT DATA WITH
THEIR THRESHOLD VALUE
IS THAT DATA
ABOVE THE
THRESHOLD
VALUE??
ZIGBEE (CORDINATOR)
DISPLAY DATA TO LCD
TRIGGER THE ALARM
YES
NO

VARSHA CHANDRAVANSHI 214MN1509 29 | P a g e
Figure 4.4: Flow Chart of Monitoring Unit
4.6 SYSTEM HARDWARE DESIGN
This monitoring system consists of different sensors, Arduino UNO, ZigBee SB Module,
ZigBee USB interfacing Board, Buzzer and other small electronic components. They are
discussed here in length with their specific working.
4.6.1 Arduino
START
INITIALIZE UART (CORDINATOR)
FIND ZIGBEE NETWORK
(ROUTER/ END DEVICE)
IS
THERE ANY
DATA
AVAILABLE
??
COLLECT THAT DATA FROM THEIR NETWORK
GIVE THAT DATA TO ARDUINO
LCD
END
NO
YES
DISPLAY IN PC
VARSHA CHANDRAVANSHI 214MN1509 30 | P a g e
Arduino is an open-source precursor which is very easy-to-use in terms of hardware and
software. Arduino boards are able to read inputs , a finger on a button, light on a sensor,
publishing something online , turning on an LED. Arduino has 17 versions of it those are
Arduino Diecimila in Stoicheia, Arduino Duemilanove (rev 2009b), Arduino UNO, Arduino
Leonardo, Arduino Mega, Arduino MEGA 2560 R3 (front side), Arduino MEGA 2560 R3
(back side), Arduino Nano, Arduino Due (ARM Cortex-M3 core), Lily Pad Arduino (rev
2007), Arduino Yun and Arduino UNO is used in this system.
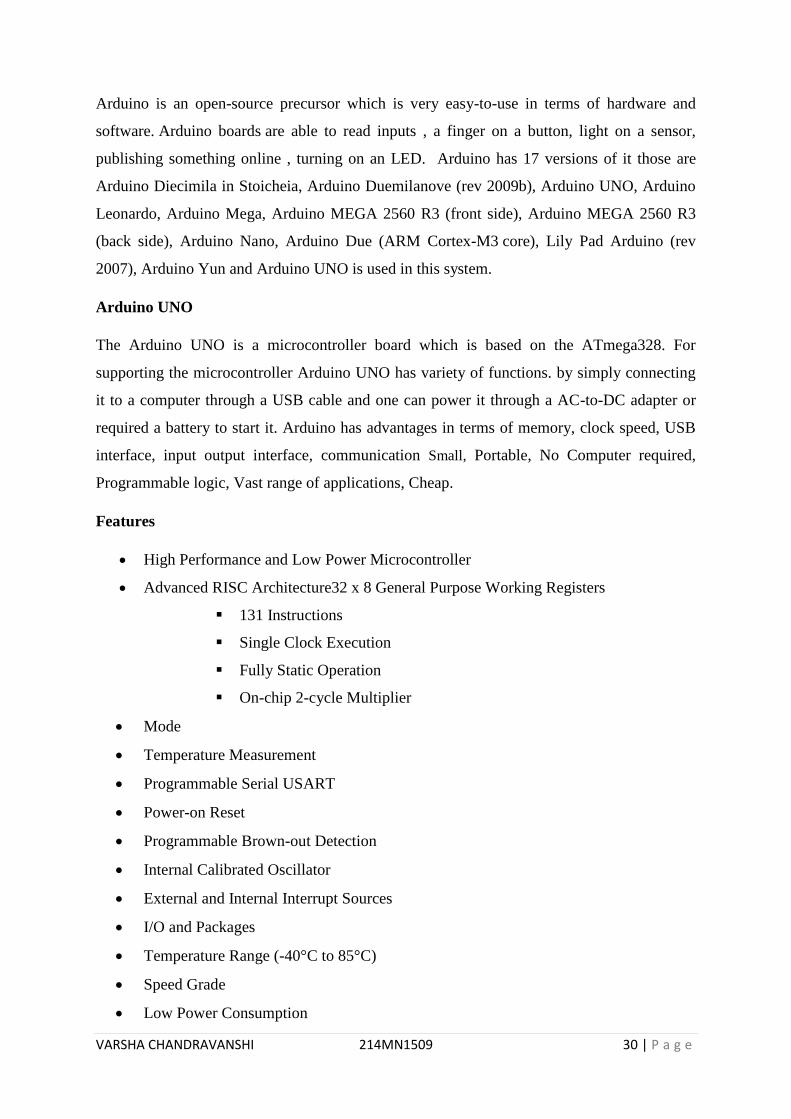
Arduino UNO
The Arduino UNO is a microcontroller board which is based on the ATmega328. For
supporting the microcontroller Arduino UNO has variety of functions. by simply connecting
it to a computer through a USB cable and one can power it through a AC-to-DC adapter or
required a battery to start it. Arduino has advantages in terms of memory, clock speed, USB
interface, input output interface, communication Small, Portable, No Computer required,
Programmable logic, Vast range of applications, Cheap.
Features
High Performance and Low Power Microcontroller
Advanced RISC Architecture32 x 8 General Purpose Working Registers
131 Instructions
Single Clock Execution
Fully Static Operation
On-chip 2-cycle Multiplier
Mode
Temperature Measurement
Programmable Serial USART
Power-on Reset
Programmable Brown-out Detection
Internal Calibrated Oscillator
External and Internal Interrupt Sources
I/O and Packages
Temperature Range (-40°C to 85°C)
Speed Grade
Low Power Consumption

VARSHA CHANDRAVANSHI 214MN1509 31 | P a g e
Table 4.1: Technical specification of Arduino UNO [31]
Figure 4.5: Arduino UNO Board [31]
”It has 14 digital input/output pins (of which 6 can be used as PWM outputs), a 16 MHz
crystal oscillator, an ICSP header, 6 analog inputs, a power jack, a USB connection, and a
reset button. The Atmega328 has a 1 KB of EEPROM and 2 KB of SRAM (these can be read
and written by the EEPROM library). It also has 32 KB of flash memory only for storing the
code (from which 0-5 KB is used for bootloader).”

VARSHA CHANDRAVANSHI 214MN1509 32 | P a g e
Figure 4.6: Block Diagram of ARDUINO UNO [32]
“Each 14 digital pins can be utilized as an input/output pins using the command pin Mode (),
digitalRead() and digitalWrite(). They are operated at 5 volts. Each of that pin can give or
receive maximum of 40 mA with an internal pull-up resistor of 20-50 kOhms (which is by
default disconnected).”
“The 1024 various values are obtained using 6 analog inputs that provide resolution of 10 bits.
they can measure by default from ground to 5 volts however upper range can be changed
using the analogReference() function and the AREF pin . “
”The Arduino Uno has many ways to communicating with another Arduino, a computer, or
other microcontrollers. The ATmega328 supports UART TTL serial communication(5V),
which is given by digital pin 0 (RX) and digital pin 1 (TX) and an ATmega8U2 given on the
board channels the serial communication on the USB and it give an appearance like a virtual
com port for software on the computer. No external drivers are needed, though an *.inf file is
required for windows.”

VARSHA CHANDRAVANSHI 214MN1509 33 | P a g e
Figure 4.7: Pin diagram of ARDUINO with their function [32]
4.6.2 ZigBee Pro SB
“ZIGBEE is a new wireless communication technology which is guided by the IEEE 802.15.4
(Personal Area Networks standard). And full fill the requirement of low-power, low-cost,
self-healing system for redundant, self-configuring, battery-free nodes which enable ZigBee’s
unique mobility, flexibility, and ease of use of wireless sensor networks. This XBee module

VARSHA CHANDRAVANSHI 214MN1509 34 | P a g e
requires minimal power and support reliable data delivery between devices. It operates in the
ISM 2.4 GHz frequency band.”
Figure 4.8: XBee PRO SB Series [33]
Key Features
Long range data integrity
Low power
Advanced security and networking system
ADC and I/O support line
Easy to use

VARSHA CHANDRAVANSHI 214MN1509 35 | P a g e
Figure 4.9: Pin Specification of XBee PRO [33]
4.6.3 XBee USB interfacing Board
”XBee USB Interfacing Board is used to interface XBee wireless Module with Laptop and
Desktop computer systems. It also can be used to connect raw module of XBee to develop
communication between PC to Mechanical Assembly, PC to PC, PC to embedded and
microcontroller based Circuits and configure XBee according to the required application. As
for XBee Serial Communication is used other end of USB, is connected to PC and treated as
COM port for that Serial Communication.”
Features:
Power booster which is responsible for interfacing suitability for all types of modules.
USB 2.0 protocol
3.3V and 5V dual power output
easy interface using Digi's X-CTU software
Pin-out compatible with other XBee Adapter board
Provides easy pluggable solder and wire connections
6 different status indicator LEDs that is for SUSPEND, ASSOC, RSSI, Power, TX,
RX
Reset button

VARSHA CHANDRAVANSHI 214MN1509 36 | P a g e
Supports AT and API commands
Figure 4.10: XBee USB interfacing board [36]
4.6.4 Hydrogen sulphide sensor (MQ-136)
”In MQ-136 gas sensor SnO2 is used as sensitive material with the lower conductivity in the
clean air. When the target H2S gas exist, the sensor’s conductivity increases along with the
gas concentration increase. “
Figure 4.11: MQ-136 Sensor and MQ-136 Module [37]
Features
Good sensitivity
VARSHA CHANDRAVANSHI 214MN1509 37 | P a g e
Simple drive circuit
Long life and low cost
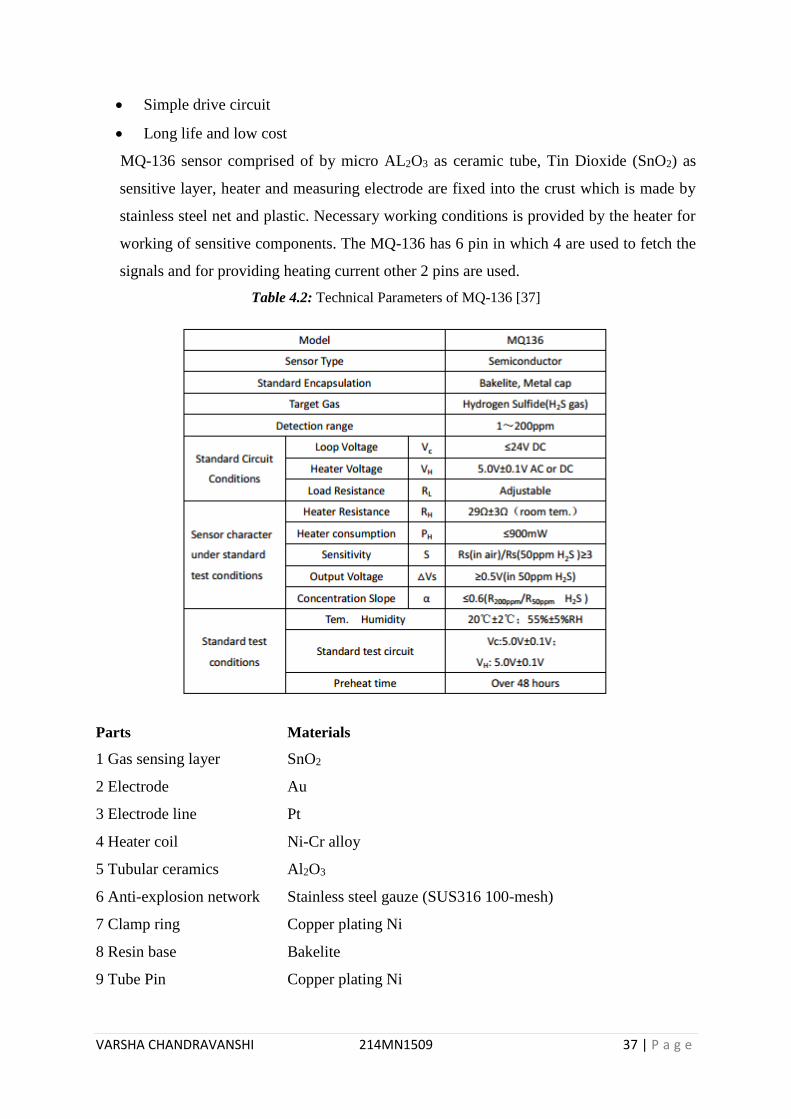
“MQ-136 sensor comprised of by micro AL2O3 as ceramic tube, Tin Dioxide (SnO2) as
sensitive layer, heater and measuring electrode are fixed into the crust which is made by
stainless steel net and plastic. Necessary working conditions is provided by the heater for
working of sensitive components. The MQ-136 has 6 pin in which 4 are used to fetch the
signals and for providing heating current other 2 pins are used. “”
Table 4.2: Technical Parameters of MQ-136 [37]
Parts Materials
1 Gas sensing layer SnO2
2 Electrode Au
3 Electrode line Pt
4 Heater coil Ni-Cr alloy
5 Tubular ceramics Al2O3
6 Anti-explosion network Stainless steel gauze (SUS316 100-mesh)
7 Clamp ring Copper plating Ni
8 Resin base Bakelite
9 Tube Pin Copper plating Ni
VARSHA CHANDRAVANSHI 214MN1509 38 | P a g e
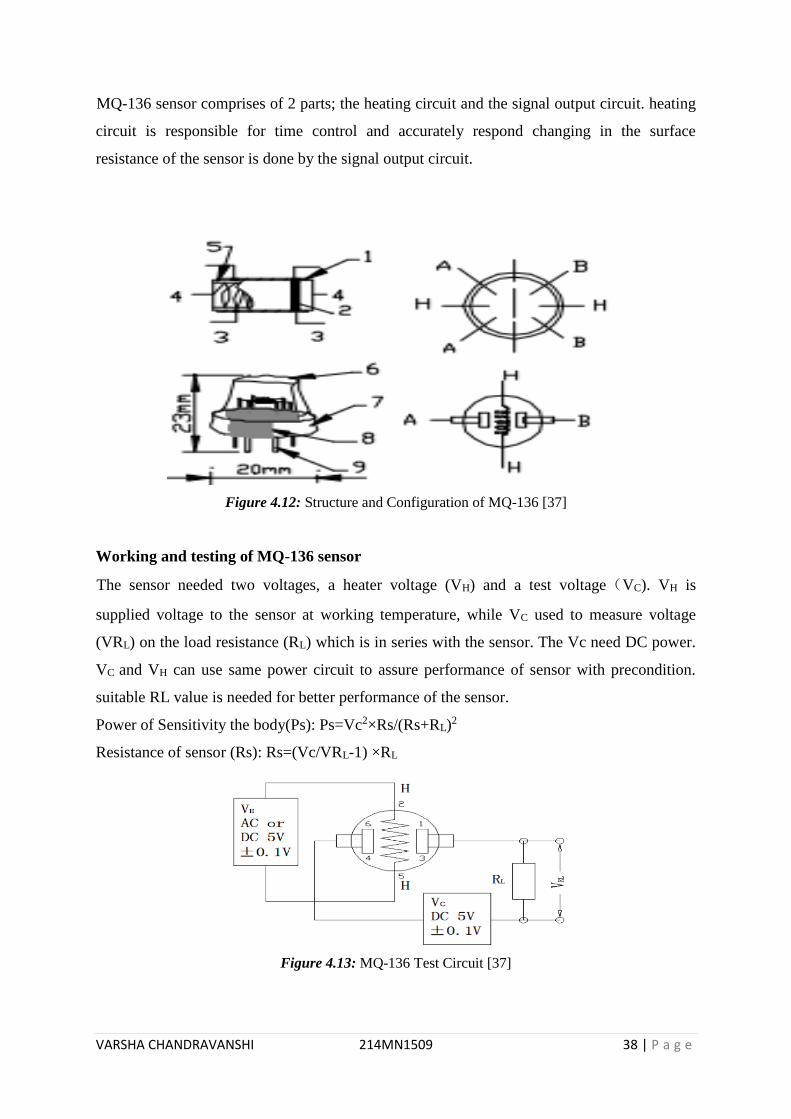
“MQ-136 sensor comprises of 2 parts; the heating circuit and the signal output circuit. heating
circuit is responsible for time control and accurately respond changing in the surface
resistance of the sensor is done by the signal output circuit. ”
Figure 4.12: Structure and Configuration of MQ-136 [37]
Working and testing of MQ-136 sensor
“The sensor needed two voltages, a heater voltage (VH) and a test voltage(VC). VH is
supplied voltage to the sensor at working temperature, while VC used to measure voltage
(VRL) on the load resistance (RL) which is in series with the sensor. The Vc need DC power.
VC and VH can use same power circuit to assure performance of sensor with precondition.
suitable RL value is needed for better performance of the sensor.
Power of Sensitivity the body(Ps): Ps=Vc2×Rs/(Rs+RL)2
Resistance of sensor (Rs): Rs=(Vc/VRL-1) ×RL “
Figure 4.13: MQ-136 Test Circuit [37]

VARSHA CHANDRAVANSHI 214MN1509 39 | P a g e
Figure 4.14: MQ-136 sensitivity characteristics for several gases in the condition [37]
At Temp: 20℃, O2=21%, Humidity=65%, RL=20kΩ, Ro=sensor resistance of H2S at 10ppm
in the clean air, Rs= sensor resistance at various concentrations of gases.
Figure 4.15: MQ-136 characteristic for temperature and humidity. [37]
Ro= sensor resistance of H2S at 10ppm at 33%RH and 20 degrees, Rs= sensor resistance of
H2S at 10ppm for different temperatures and humidity
4.6.5 Methane sensor (MQ-2)
It is used for detecting methane.
Features
Good sensitivity for Combustible gas
High sensitivity to Methane
Long life and low cost
Simple drive circuit

VARSHA CHANDRAVANSHI 214MN1509 40 | P a g e
Figure 4.16: MQ-2 Sensor and MQ-2 Module [34]
In the wiring of the sensor is both 'A' pins and both 'B' pins are connected together. It is a
safer phenomenon and it is having more reliable output results.
Figure 4.17: MQ-2 Sensor Wiring Circuit [34]
Figure 4.18: The MQ-2 sensitivity characteristics for several gases. [34]

VARSHA CHANDRAVANSHI 214MN1509 41 | P a g e
at Temp=20℃, Humidity=65%, O2=21%, RL=5kΩ, Ro=sensor resistance of H2 at 1000ppm
in the clean air, Rs= MQ-2 sensor resistance at various concentrations of gases.
Figure 4.19: Typical dependence curve on temperature and humidity of the MQ-2. [34]
Ro=sensor resistance of H2 at 1000ppm in air at 33%RH and 20 degrees. Rs=sensor resistance
of H2 different temperatures and humidity at 1000ppm.
Table 4.3: Technical Parameters of MQ-2 [34]
4.6.6 Natural gas sensor (MQ-5)
The MQ-5 gas sensor uses a small heater inside it with an electro-chemical sensor. According
to need it can be calibrated but for this a known concentration of the measured gas or a group

VARSHA CHANDRAVANSHI 214MN1509 42 | P a g e
of gasses is needed. Analog output is given by this and can be read by anlog input of the
Arduino.
The sensor is comprising Tin Dioxide (SnO2) sensitive layer, micro AL2O3 ceramic tube and
heater and measuring electrode are fixed within a crust which is made by plastic and stainless
steel net.in MQ-5 6 pins are there out of which 4 are used to give signals and remaining 2 are
current-availiation. for the heater some sensors use 5V, others need 2V. the heater should be
on for about 3 minutes After the "burn-in time".
Figure 4.20: MQ-5 Sensor and MQ-5 module [35]
Features
High sensitivity to natural gas, LPG, town gas.
Small sensitivity to smoke, alcohol.
Fast response.
Stable and long life.
Simple drive circuit
Wide detection range
Figure 4.21: Structure of MQ-5 sensor [35]

VARSHA CHANDRAVANSHI 214MN1509 43 | P a g e
Parts Materials
1) Gas sensing layer SnO2
2) Electrode Au
3) Electrode line Pt
4) Heater coil Ni-Cr alloy
5) Tubular ceramics Al2O3
6) Anti-explosion network Stainless steel gauze (SUS316 100-mesh)
7) Clamp ring Copper plating Ni
8) Resin base Bakelite
9) Tube Pin Copper plating Ni
Figure 4.22: The typical sensitivity characteristics curve of the MQ-5 for different gases. [35]
At Temperature=20℃, Humidity: 65%, O2 = 21% RL=20kΩ, Ro=sensor resistance of H2 at
1000ppm in the clean air, Rs=sensor resistance at various concentrations of the gases.
Figure 4.23: The typical dependency curve on temperature and humidity of the MQ-5, [35]

VARSHA CHANDRAVANSHI 214MN1509 44 | P a g e
Ro=sensor resistance of H2 at 1000ppm in air at 33%RH and 20 degrees, Rs: sensor
resistance at different temperatures and humidity.
4.6.7 LCD display unit
It is an electronic display module. This is preferable over multi segment and seven
segments LEDs .A 16x2 LCD displays 16 characters per line and 2 such lines. Each character
is displayed by 5x7 pixel matrix and has two registers: Command and Data.
Data is stored and the commanded instructions which is given to the LCD by the command
register. It is an instruction given for LCD to do a predefined task like clearing its screen,
initializing it, controlling display, setting the cursor position etc. The data register stores the
data which is to be displayed on the LCD. And the data is the ASCII value of the character
which is to be displayed on the LCD.
Figure 4.24: Pin Diagram of LCD [38]
Pin Description:
LCD has 16 pins. In which 5 pins are for power the LCD (Ground, VCC, VEE, led+, Led-), 3
pins are for controlling LCD and 8 pins are for data pins.
The three control lines are referred to as RS, EN, and RW.
The EN line is "Enable." This is used to inform the LCD that data is sent to it. This line
should be low (0) for sending data to the LCD and then other two control lines is set and/or
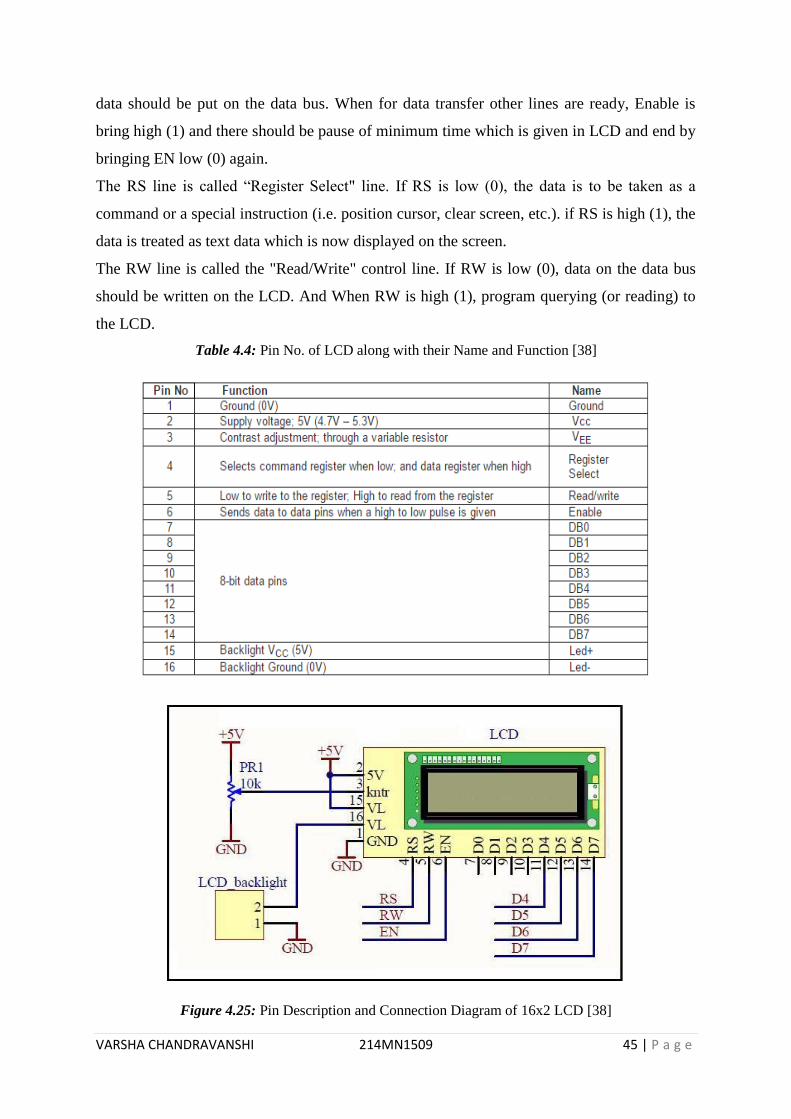
VARSHA CHANDRAVANSHI 214MN1509 45 | P a g e
data should be put on the data bus. When for data transfer other lines are ready, Enable is
bring high (1) and there should be pause of minimum time which is given in LCD and end by
bringing EN low (0) again.
The RS line is called “Register Select" line. If RS is low (0), the data is to be taken as a
command or a special instruction (i.e. position cursor, clear screen, etc.). if RS is high (1), the
data is treated as text data which is now displayed on the screen.
The RW line is called the "Read/Write" control line. If RW is low (0), data on the data bus
should be written on the LCD. And When RW is high (1), program querying (or reading) to
the LCD.
Table 4.4: Pin No. of LCD along with their Name and Function [38]
Figure 4.25: Pin Description and Connection Diagram of 16x2 LCD [38]

VARSHA CHANDRAVANSHI 214MN1509 46 | P a g e
4.7 HARDWARE IMPLIMENTATION
“Testing of designed Real Time Gas Monitoring System module using Wireless Sensor
Network is done in an artificial mining environment which is simulated inside the laboratory.
As the first, complete system is designed on a breadboard which is presented in Figure 4.26. ”
Figure 4.26: Sensor Unit of Monitoring System in Bread board
Designed system consist of:
1. Arduino Board -Arduino UNO Model
2. LCD (Liquid crystal display) - 16*2 LCD
3. Xbee - Xbee Pro SB Model
4. Methane Sensor - MQ-2 Sensor
5. Hydrogen Sulphide Sensor - MQ-136 Sensor
6. Natural Gases Sensor – MQ-5 sensor
Final design is simulated on PCB which additionally consists of Buzzer and shown in the
figure 4.27

VARSHA CHANDRAVANSHI 214MN1509 47 | P a g e
Figure 4.27: final design of monitoring system
4.8 SOFTWARE IMPLEMENTATION
Two software is used in the designing of the following monitoring system. For XBee i.e.
XCTU and for Arduino (Arduino IDE 1.6.1) is used.
With help of XCTU software XBee is assigned as transmitter (coordinator) or as receiver
(router).
Basically XBee can be defined in the three categories:
ZigBee Coordinator: it forms the root of the any network tree and can connect to
other networks. There is specifically one ZigBee Coordinator is present in each
network as it is the device which starts the network originally. It cannot go in off
mode
ZigBee Router (ZR): in any networks multiple ZigBee Router can be present and a
Router acts as an intermediate router, passing the data from one to other device .it also
cannot go to off mode.
ZigBee End Device (ZED): it is having enough functionality to connect to the other
node (either a Coordinator or the Router). This can go in the off mode which allow to
save significant amount of energy and time.it is less expensive as allow less memory
section.

VARSHA CHANDRAVANSHI 214MN1509 48 | P a g e
Figure 4.28: Configuration of coordinator on XCTU
Figure 4.29: Configuration of router on XCTU
“PAN ID (Personal Area Network identifier) should be same for stabilizing a network
between coordinator and router XBee. For this system we set the PAN ID as 0 for both XBee. “

VARSHA CHANDRAVANSHI 214MN1509 49 | P a g e
”Arduino UNO is microcontroller based board. And programming for the Arduino board, is
done in Arduino IDE 1.6.1 (Integrated Development Environment) which supports C and
C++ programming languages. “
4.9 CONCLUSION
“This chapter gives information about the methodology of the Real time monitoring system
with the hardware design in length. The algorithm, block diagram and flow chart shows
methodology, working and organization of the system. Each component is briefly described
here with their specification and functionality. The implementation of the hardware and
software is also described here.”

VARSHA CHANDRAVANSHI 214MN1509 50 | P a g e
Chapter 5
EXPERIMENT
RESULT AND
DISCUSSION
VARSHA CHANDRAVANSHI 214MN1509 51 | P a g e
5.1 INTRODUCTION
The utilization of any module designed can only be verified after it is used and desired results
are achieved. After the design of circuit, it is required to verify the working of the module
and also it should be verified for desired results. For this purpose, the module should be
tested for different gasses accompanied by a regular monitoring of desired output.
5.2 TESTING OF THE MODULE
The module was tested in the laboratory for natural gasses, CH4 and H2S individually. The
values of each gas was obtained at an interval of 0.5 sec and the obtained value was
compared with the atmospheric value of the gas.
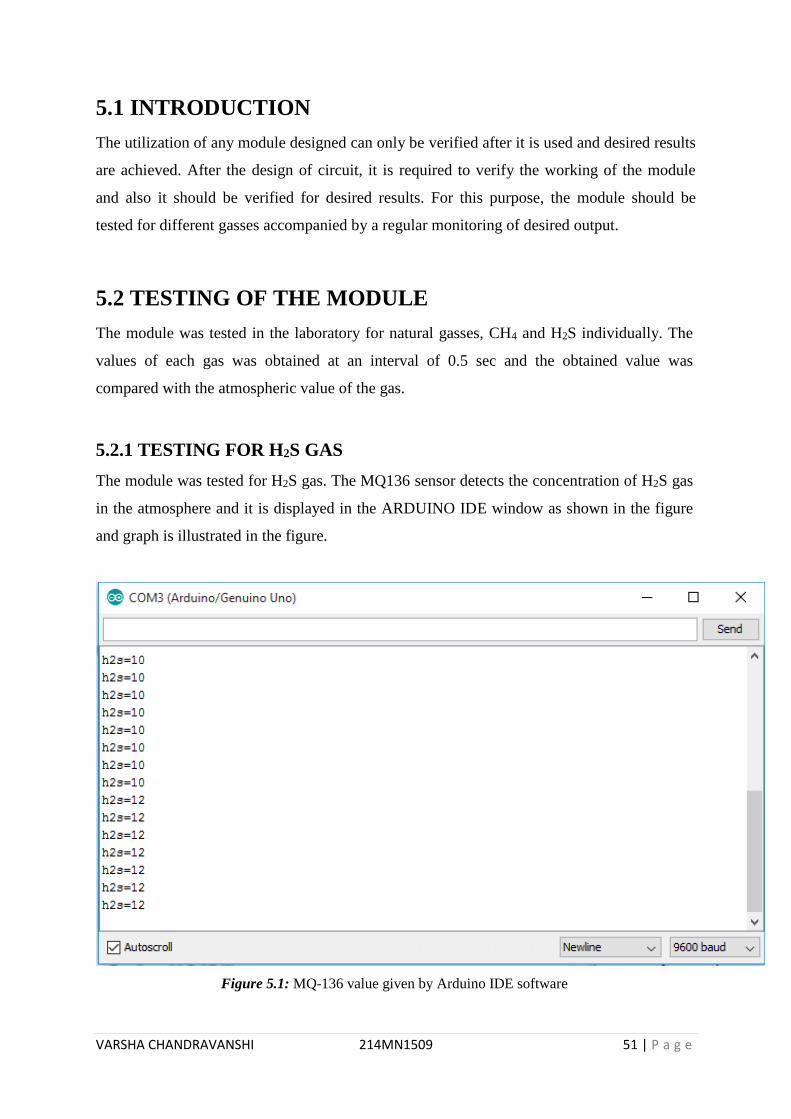
5.2.1 TESTING FOR H2S GAS
The module was tested for H2S gas. The MQ136 sensor detects the concentration of H2S gas
in the atmosphere and it is displayed in the ARDUINO IDE window as shown in the figure
and graph is illustrated in the figure.
Figure 5.1: MQ-136 value given by Arduino IDE software

VARSHA CHANDRAVANSHI 214MN1509 52 | P a g e
Figure 5.2: Comparison of atmospheric H2S and Sensor output
5.2.2 TESTING FOR NATURAL GASSES
The module was tested for CO gas. The MQ-5 sensor detects the concentration of CO gas in
the atmosphere and it is displayed in the ARDUINO IDE window as shown in the figure and
graph is illustrated in the figure.
Figure 5.3: MQ-5 value given by Arduino IDE software
0.004 0.004 0.003 0.004 0.004 0.004 0.004 0.004 0.004 0.004 0.004 0.004
10 10 10 10
12 12 12 12
14 14 14 14
1 2 3 4 5 6 7 8 9 10 11 12
PP
M
Delay in secs
ATMOSPHERIC VALUE OBTAINED VALUE

VARSHA CHANDRAVANSHI 214MN1509 53 | P a g e
Figure 5.4: Comparison of atmospheric Natural Gas and Sensor output
5.2.2 TESTING FOR CH4 GAS
The module was tested for CH4 gas. The MQ2 sensor detects the concentration of CH4 gas in
the atmosphere and it is displayed in the ARDUINO IDE window as shown in the figure and
graph is illustrated in the figure.
Figure 5.5: MQ-2 value given by Arduino IDE software
0.2 0.2 0.2 0.2 0.2 0.2 0.2 0.2 0.2 0.2 0.2 0.2
14 14 1415 15
16 1617 17 17
18
14
1 2 3 4 5 6 7 8 9 10 11 12
PP
M
Delay in secs
ATMOSPHERIC VALUE OBTAINED VALUE

VARSHA CHANDRAVANSHI 214MN1509 54 | P a g e
Figure 5.6: Comparison of atmospheric Methane and Sensor output
1.5 1.5 1.5 1.5 1.5 1.6 1.6 1.6 1.6 1.6 1.6 1.7
12 12 12
14 1415
16 1617
18 1819
1 2 3 4 5 6 7 8 9 10 11 12
PP
M
Delay in secs
ATMOSPHERIC VALUE OBTAINED VALUE

VARSHA CHANDRAVANSHI 214MN1509 55 | P a g e
Chapter 6
CONCLUSION AND
FUTURE SCOPE

VARSHA CHANDRAVANSHI 214MN1509 56 | P a g e
6.1 CONCLUSION
The designed real time gas monitoring system is utilized on order to detect the gas
concentration and the following conclusions were obtained:
The designed module gives the precise value of gas concentration.
Use of XBEE enhances the area of signal coverage and efficiency of data transfer.
The gas concentration values are displayed at underground section as well as in
monitoring unit at the surface in remote area where carrying PC is not possible.
The designed system is economical that costs Rs. 7500-8000.
6.2 FUTURE SCOPE
The designed equipment was studied in the laboratory scale; it can be implemented in
the mine substations with proper protection to verify the operation in a real time
environment.
Additional sensors can be used for all possible safety issues such as IR sensors (for
no. of person inside the mine), pressure sensor, water check sensor, rock collapse
sensor.
The sensor can be made auto calibrated.
Range of the networking can be extended using more number of ZigBee.
VARSHA CHANDRAVANSHI 214MN1509 57 | P a g e
REFERENCES
1) Li, Mo, and Yunhao Liu. "Underground coal mine monitoring with wireless sensor
networks." ACM Transactions on Sensor Networks (TOSN) 5.2 (2009): 10.
2) Li, Mo, and Yunhao Liu. "Underground structure monitoring with wireless sensor
networks." Proceedings of the 6th international conference on Information processing in
sensor networks. ACM, 2007.
3) Hongjiang, He, and Wang Shuangyou. "The application of ARM and ZigBee technology
wireless networks in monitoring mine safety system." Computing, Communication, Control,
and Management, 2008. CCCM'08. ISECS International Colloquium on. Vol. 2. IEEE, 2008.
4) Zhang, Xuhui. "Automatic calibration of methane monitoring based on wireless sensor
network." Wireless Communications, Networking and Mobile Computing, 2008. WiCOM'08.
4th International Conference on. IEEE, 2008.
5) Yuan, He Si. "The research of energy efficient MAC protocols in gas monitoring system of
mine." Information Science and Engineering, 2008. ISISE'08. International Symposium on.
Vol. 2. IEEE, 2008.
6) Weng, Lin-Song, Ching-Lung Lin, and Hsueh-Hsien Chang. "Development of a real-time
mine auxiliary monitoring system using RF wireless sensor networks." Computer Supported
Cooperative Work in Design, 2009. CSCWD 2009. 13th International Conference on. IEEE,
2009.
7) Wei, Shi, and Li Li-li. "Multi-parameter monitoring system for coal mine based on wireless
sensor network technology." Industrial Mechatronics and Automation, 2009. ICIMA 2009.
International Conference on. IEEE, 2009.
8) Li, Wenge, et al. "The remote monitoring and analysis system of mine safety based on virtual
instrument." Test and Measurement, 2009. ICTM'09. International Conference on. Vol. 2.
IEEE, 2009.
9) Molina, S., I. Soto, and R. Carrasco. "Detection of gases and collapses in underground mines
using WSN." Industrial Technology (ICIT), 2011 IEEE International Conference on. IEEE,
2011.
10) Srivastava, Dhruv, and Priya Ranjan. "Towards Greener & Safer Mines with Wireless Sensor
Networks." Green Technologies Conference (IEEE-Green), 2011 IEEE. IEEE, 2011.
VARSHA CHANDRAVANSHI 214MN1509 58 | P a g e
11) Bin, Ge, and L. I. Huizong. "The research on ZigBee-based mine safety monitoring
system." Electric Information and Control Engineering (ICEICE), 2011 International
Conference on. IEEE, 2011.
12) Zhu, Yingli, Wanghui Zeng, and Lingqing Xie. "Design of Monitoring System for Coal Mine
Safety Based on MSP430 and nRF905." Intelligence Science and Information Engineering
(ISIE), 2011 International Conference on. IEEE, 2011.
13) Song, Jingjiang, Yingli Zhu, and Fuzhou Dong. "Automatic monitoring system for coal mine
safety based on wireless sensor network." Cross Strait Quad-Regional Radio Science and
Wireless Technology Conference (CSQRWC), 2011. Vol. 2. IEEE, 2011.
14) He, Xuewen, and Yun Wang. "The design of tungsten mine environment monitoring system
based on wireless sensor networks." Intelligent System Design and Engineering Application
(ISDEA), 2012 Second International Conference on. IEEE, 2012.
15) Bo, Cheng, et al. "RESTful web service mashup based coal mine safety monitoring and
control automation with wireless sensor network." Web Services (ICWS), 2012 IEEE 19th
International Conference on. IEEE, 2012.
16) Yao, Junwu, and Hongxian Tian. "Design of roof abscission layer wireless monitoring system
based on 433MHz RF technology." Signal Processing (ICSP), 2014 12th International
Conference on. IEEE, 2014.
17) Li, Mo, and Yunhao Liu. "Underground coal mine monitoring with wireless sensor
networks." ACM Transactions on Sensor Networks (TOSN) 5.2 (2009): 10.
18) Yi-Bing, Zhang. "Wireless Sensor Network’s Application in Coal Mine Safety
Monitoring." Future Wireless Networks and Information Systems. Springer Berlin Heidelberg,
2012. 241-248.
19) Dange, K. M., and R. T. Patil. "Design of monitoring system for coal mine safety based on
MSP430." International Journal of Engineering Science Invention 2.7 (2013): 14-19.
20) Vandana, S., and V. B. Sundheep. "Development of coalmine safety system using wireless
sensor network." International Journal on Computer Science and Engineering 3.5 (2011):
2076-2085.
21) Ahalya, G., P. Suresh Babu, and P. Prabhakar Rao. "sDEVELOPMENT OF COAL MINE
SAFETY SYSTEM USING WIRELESS SENSOR NETWORKS." Intern. J. of Engineering
Science & Advanced Technology 3.3 (2013): 74-78.
VARSHA CHANDRAVANSHI 214MN1509 59 | P a g e
22) Kumar, Ashish, Kriti Singh, and Debmalya Bhattacharya. "Coal Mining Safety Monitoring
Using WSN." International Journal of Scientific Engineering and Technology, Volume No. 2,
Issue No 10 (2013): 979-981.
23) Archana, Kumari, and Abdul Wasay Mudasser. "Zig-Bee and Wi-Fi basedMine Safety
Application." International Journal of Scientific and Research Publications (2014): 280.
24) Bo, Cheng, et al. "Web of things-based remote monitoring system for coal mine safety using
wireless sensor network." International Journal of Distributed Sensor Networks 2014 (2014).
25) Statistics of Accidents ,http://www.coal.nic.in, Accessed: April 11, 2016.
26) Wireless Sensor Network, https://en.wikipedia.org/wiki/Wireless_sensor_network , Accessed:
April 14, 2016.
27) Hydrogen-Sulphide-gas,https://www.osha.gov/OshDoc/data_Hurricane_Facts/hydrogen_
sulfide_fact.pdf , Accessed: April 14, 2016.
28) Carbon monoxide gas, http://ephtracking.cdc.gov/showCoRisk.action, Accessed: April 14,
2016.
29) Carbon-Dioxide-gas, https://www.ccohs.ca/oshanswers/chemicals/chem_profiles/carbon_di
oxide .html , Accessed: April 15, 2016.
30) Concentration of Different Gases in the air with their Source, Route of Entry, TLV and Toxic
Health Effect, http://web.mst.edu/~tien/218/Gas-OH.pdf , Accessed: April 10, 2016.
31) Arduino, https://www.arduino.cc/en/main/arduinoBoardUno, Accessed: April 14, 2016.
32) Arduino-Block-Diagram,http://www.mouser.com/pdfdocs/Gravitech_ATMEGA328_data
sheet.pdf, Accessed: April 14, 2016.
33) XBee PRO SB, http://www.digi.com/products/xbee-rf-solutions/modules/xbee-pro-900hp,
Accessed: April 16, 2016.
34) MQ-2 Datasheet, https://www.seeedstudio.com/depot/datasheet/MQ-2.pdf , Accessed: April
15, 2016.
35) MQ-5 Datasheet, https://www.seeedstudio.com/depot/datasheet/MQ-5.pdf, Accessed: April
17, 2016.
36) XBee USB Interfacing Board, http://www.mouser.com/ds/2/737/32400-XBee-USB-Adapter-
Documentation-v1.0-932736.pdf, Accessed: April 14, 2016.
37) MQ-136 Datasheet, http://www.sensorica.ru/pdf/MQ-136.pdf, Accessed: April 19, 2016.

VARSHA CHANDRAVANSHI 214MN1509 60 | P a g e
38) LCD Datasheet, http://www.engineersgarage.com/electronic-components/16x2-lcd-module-
datasheet, Accessed: April 16, 2016.
39) LCD,https://www.arduino.cc/documents/datasheets/LCD-WH1602B-TMI-ET%23.pdf,
Accessed: April 18, 2016.
40) Natural Gas, https://www.originenergy.com.au/blog/about-energy/natural-gas.html, Accessed:
April 17, 2016.
41) Hydrogen sulphide gas, http://www.infomine.com/library/videos/1432c0/hydrogen_sulfide_
death_in_an_underground_mine_1973.aspx, Accessed: April 19, 2016.
42) Methane gas exposure data, http://inspectapedia.com/sickhouse/Gas_Exposure_Limits.php,
Accessed: April 19, 2016.