Embed Size (px)
Citation preview

www.first–qatar.com
Real Estate Market Overview
Qatar, 2014
CONTENTS
I. MACRO ECONOMIC CLIMATE
II. KEY MAJOR GROWTH IMPETUS
III. RESIDENTIAL SECTOR OVERVIEW
IV. OFFICE SECTOR OVERVIEW
V. RETAIL SECTOR OVERVIEW
VI. OUTLOOK
3
Qatar is a sovereign Arab state in western Asia on the Qatar Peninsula of the larger Arabian
Peninsula. Qatar is an absolute monarchy ruled by the Al Thani family and the country was
known for pearl hunting and sea trade before the discovery of oil. Qatar has the third largest
natural gas reserve in the world and one the richest country per capita.
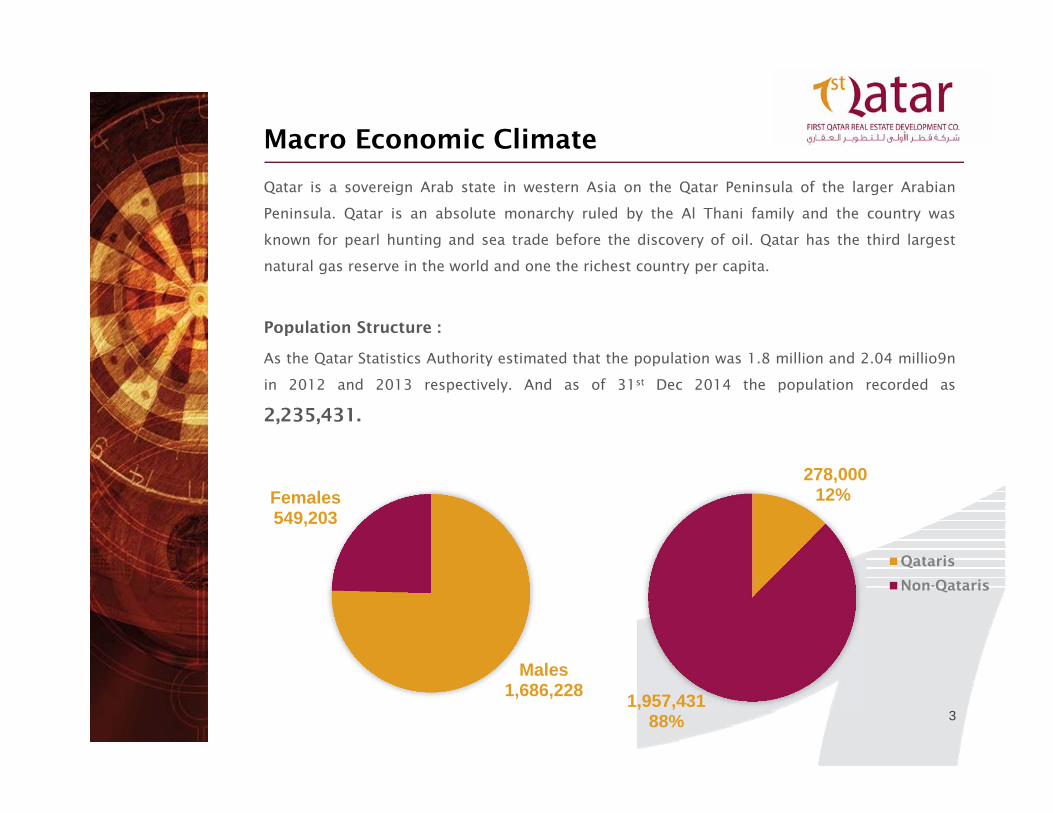
Population Structure :
As the Qatar Statistics Authority estimated that the population was 1.8 million and 2.04 millio9n
in 2012 and 2013 respectively. And as of 31st Dec 2014 the population recorded as
2,235,431.
Macro Economic Climate
Males1,686,228
Females549,203
278,00012%
1,957,43188%
Qataris
Non-Qataris
4
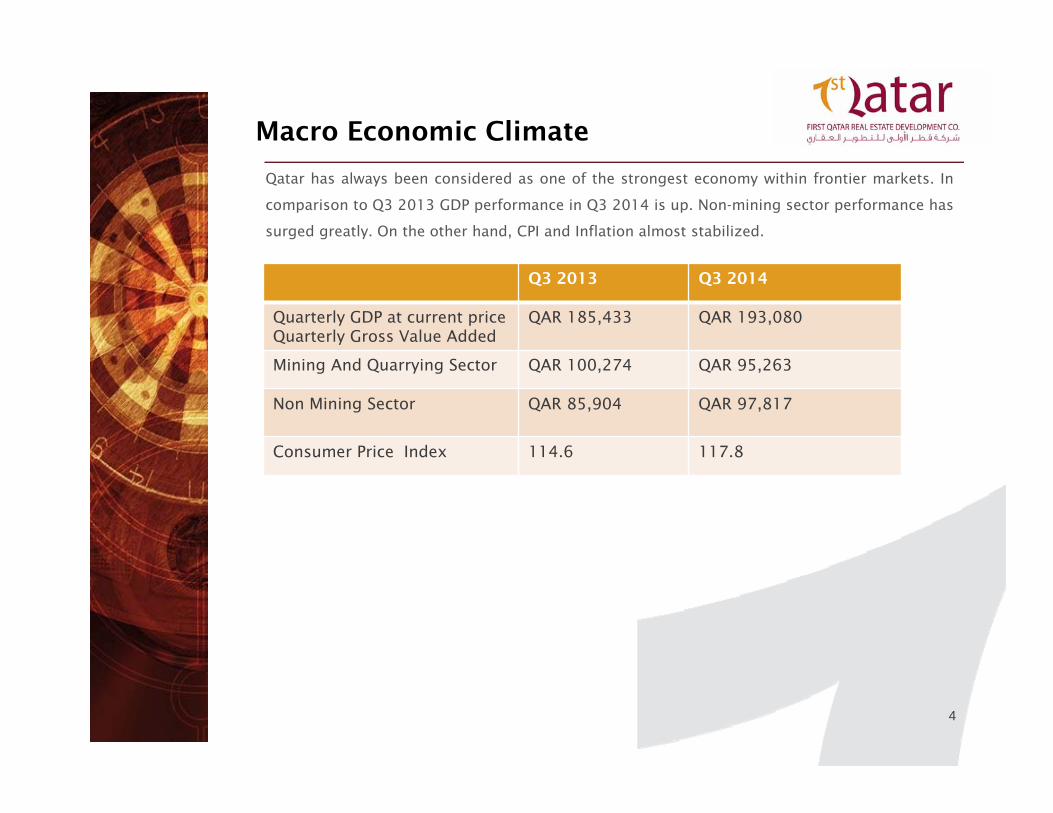
Qatar has always been considered as one of the strongest economy within frontier markets. In
comparison to Q3 2013 GDP performance in Q3 2014 is up. Non-mining sector performance has
surged greatly. On the other hand, CPI and Inflation almost stabilized.
Macro Economic Climate
Q3 2013 Q3 2014
Quarterly GDP at current price Quarterly Gross Value Added
QAR 185,433 QAR 193,080
Mining And Quarrying Sector QAR 100,274 QAR 95,263
Non Mining Sector QAR 85,904 QAR 97,817
Consumer Price Index 114.6 117.8
5
Qatar is embarking on a number of projects relating to tourism, culture and heritage in order to
enhance Qatar’s profile and promote Qatar as desirable destination to live, work and visit
locally, regionally and internationally.
Growth of the national airline and greater connectivity, supported by the recent opening of the
new Hamad International Airport has a direct impact on trade and tourism.
It is expected that the growth of Qatar Airways along with the new Airport will enhance Qatar’s
profile locally, regionally and internationally. Supported by existing and planned tourism, real
estate, and culture & heritage projects will make Qatar a desirable destination to live, work and
visit.
Hamad International Airport – formerly known under the project working name New Doha
International Airport opened in April 2014 at a cost of US$15.5 billion and with an initial
capacity of 30 million passengers a year.
Once fully developed beyond 2015, the airport is expected to handle up to 50 million
passengers a year.
One of the project’s key features is that 60 per cent of the site is built on reclaimed land from
the Arabian Gulf. Qatar Airways is managing the new airport, designed to help shape Doha as a
key regional and global aviation hub.
Key Major Growth Impetus
6
Qatar Airways - From only four aircraft in 1997, the airline grew to a fleet size of 28 aircraft by
the end of 2003 and a milestone 50 by October 2006. As of Dec 2014, the airline operates 146
aircraft to 146 destinations worldwide.
By the end of 2015, the fleet size will rise to more than 170 aircraft covering global network of
destinations that will also increase to over 170.
7
The residential sector in Qatar real estate market is one of the most promising investments.
Over the last few years, the residential sector has increased by many folds with prospects of
continuous growth. Traditionally, the city centre was the most sought after location for housing
in Doha. Gradually as the city began to move away from traditional locations into areas around
the C, D, and E Ring Roads, these locations grew in prominence for residential developments.
West Bay has now become a sought after location for high-end residential accommodation along
with office developments. The change in preference was the suburban quality of these
neighborhoods and the preference to live in close proximity to work and lifestyle facilities.
Supply
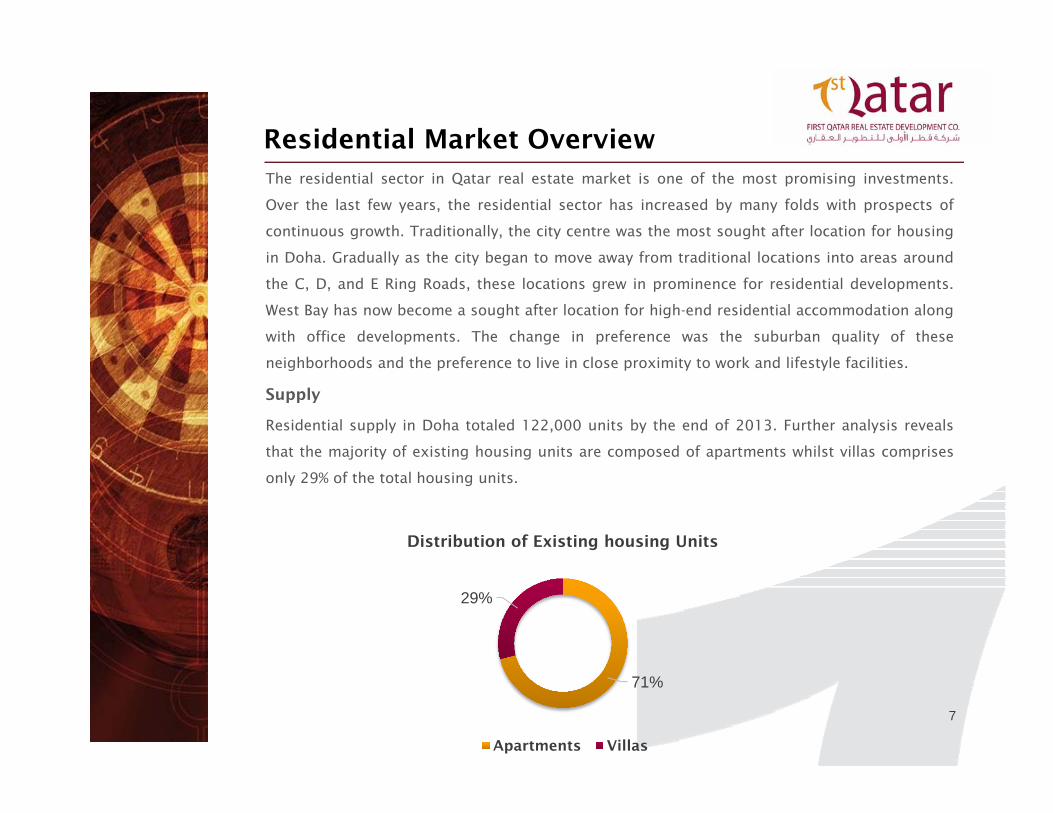
Residential supply in Doha totaled 122,000 units by the end of 2013. Further analysis reveals
that the majority of existing housing units are composed of apartments whilst villas comprises
only 29% of the total housing units.
Residential Market Overview
71%
29%
Distribution of Existing housing Units
Apartments Villas
8
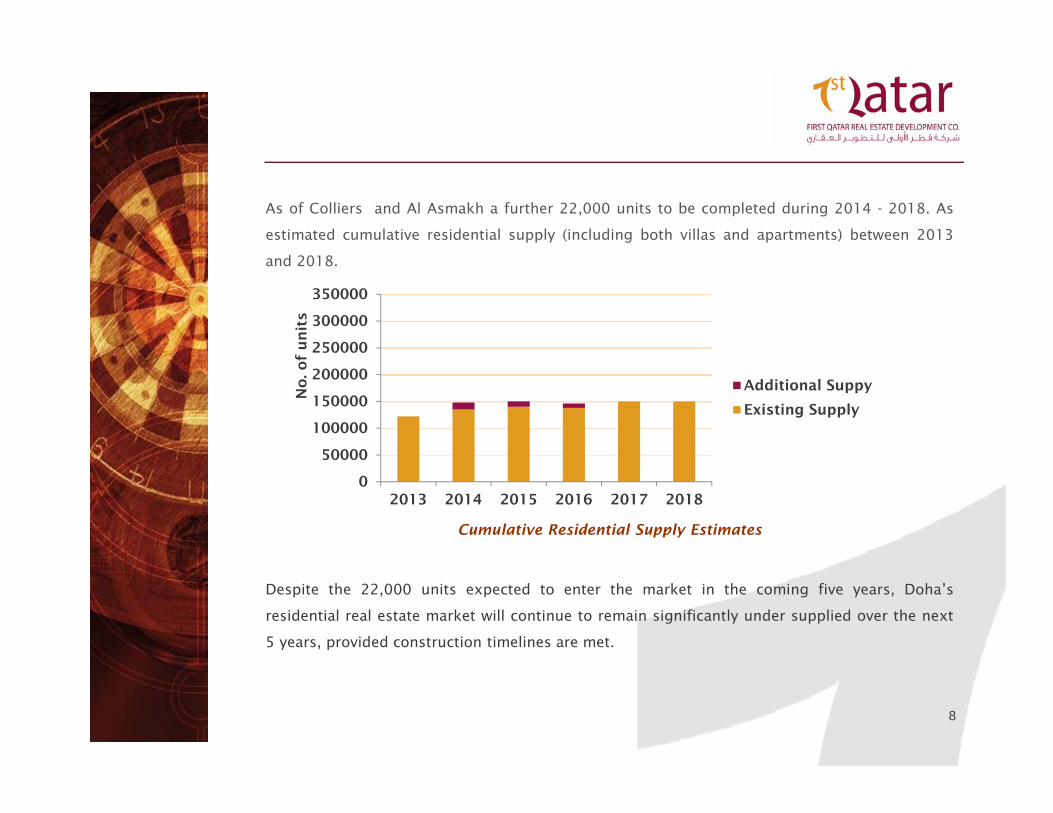
As of Colliers and Al Asmakh a further 22,000 units to be completed during 2014 - 2018. As
estimated cumulative residential supply (including both villas and apartments) between 2013
and 2018.
Cumulative Residential Supply Estimates
Despite the 22,000 units expected to enter the market in the coming five years, Doha’s
residential real estate market will continue to remain significantly under supplied over the next
5 years, provided construction timelines are met.
0
50000
100000
150000
200000
250000
300000
350000
2013 2014 2015 2016 2017 2018
Additional Suppy
Existing Supply
No
. o
f u
nit
s
9
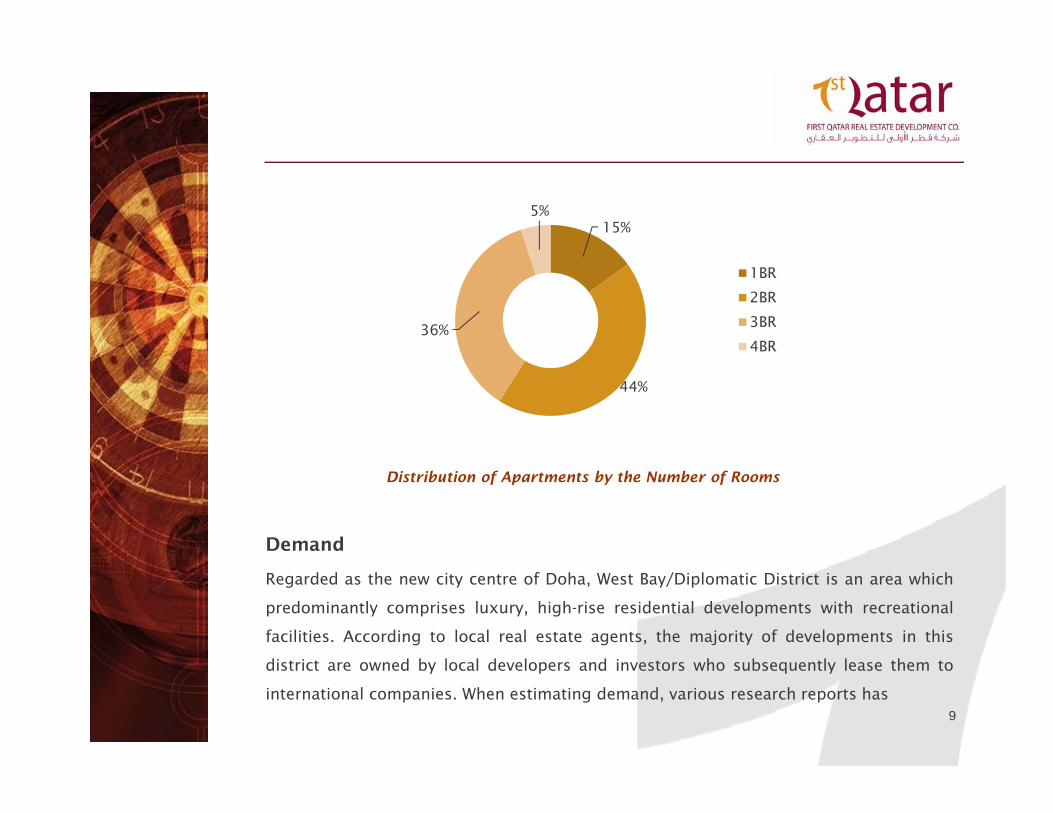
Distribution of Apartments by the Number of Rooms
Demand
Regarded as the new city centre of Doha, West Bay/Diplomatic District is an area which
predominantly comprises luxury, high-rise residential developments with recreational
facilities. According to local real estate agents, the majority of developments in this
district are owned by local developers and investors who subsequently lease them to
international companies. When estimating demand, various research reports has
15%
44%
36%
5%
1BR
2BR
3BR
4BR
10
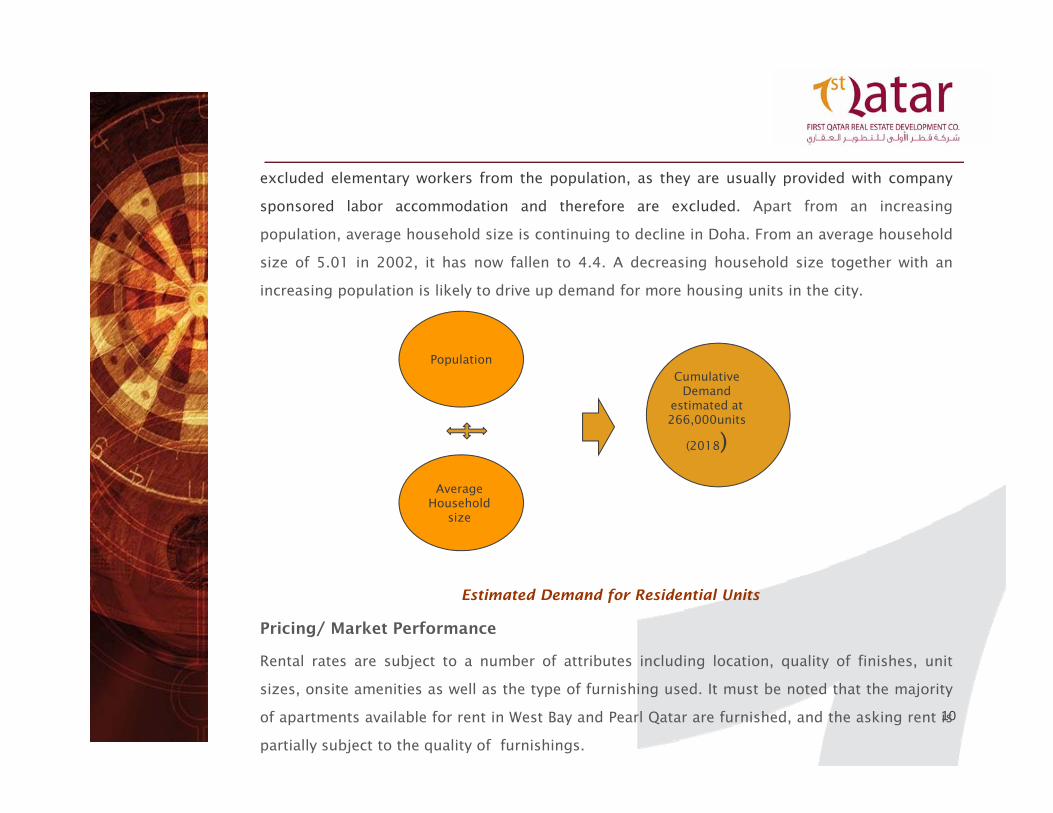
excluded elementary workers from the population, as they are usually provided with company
sponsored labor accommodation and therefore are excluded. Apart from an increasing
population, average household size is continuing to decline in Doha. From an average household
size of 5.01 in 2002, it has now fallen to 4.4. A decreasing household size together with an
increasing population is likely to drive up demand for more housing units in the city.
Estimated Demand for Residential Units
Pricing/ Market Performance
Rental rates are subject to a number of attributes including location, quality of finishes, unit
sizes, onsite amenities as well as the type of furnishing used. It must be noted that the majority
of apartments available for rent in West Bay and Pearl Qatar are furnished, and the asking rent is
partially subject to the quality of furnishings.
PopulationCumulative
Demandestimated at 266,000units
(2018)
Average Household
size
11
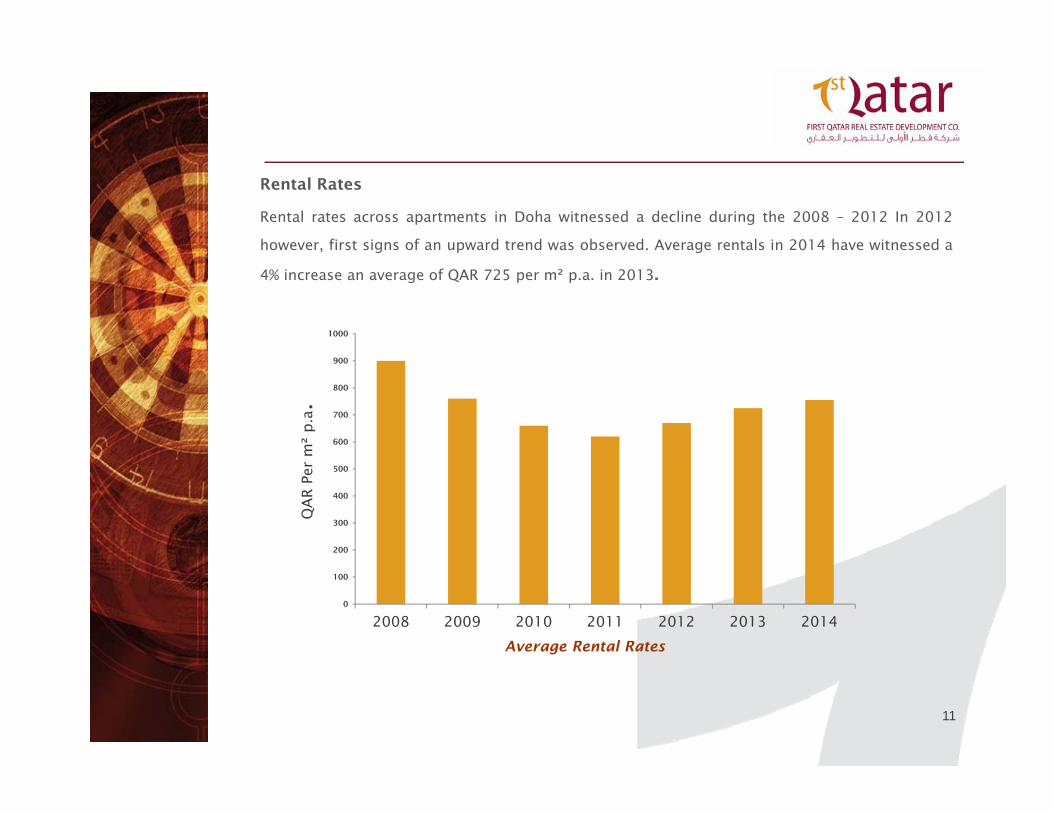
Rental Rates
Rental rates across apartments in Doha witnessed a decline during the 2008 – 2012 In 2012
however, first signs of an upward trend was observed. Average rentals in 2014 have witnessed a
4% increase an average of QAR 725 per m² p.a. in 2013.
Average Rental Rates
0
100
200
300
400
500
600
700
800
900
1000
2008 2009 2010 2011 2012 2013 2014
QA
R P
er m
² p.a.
12
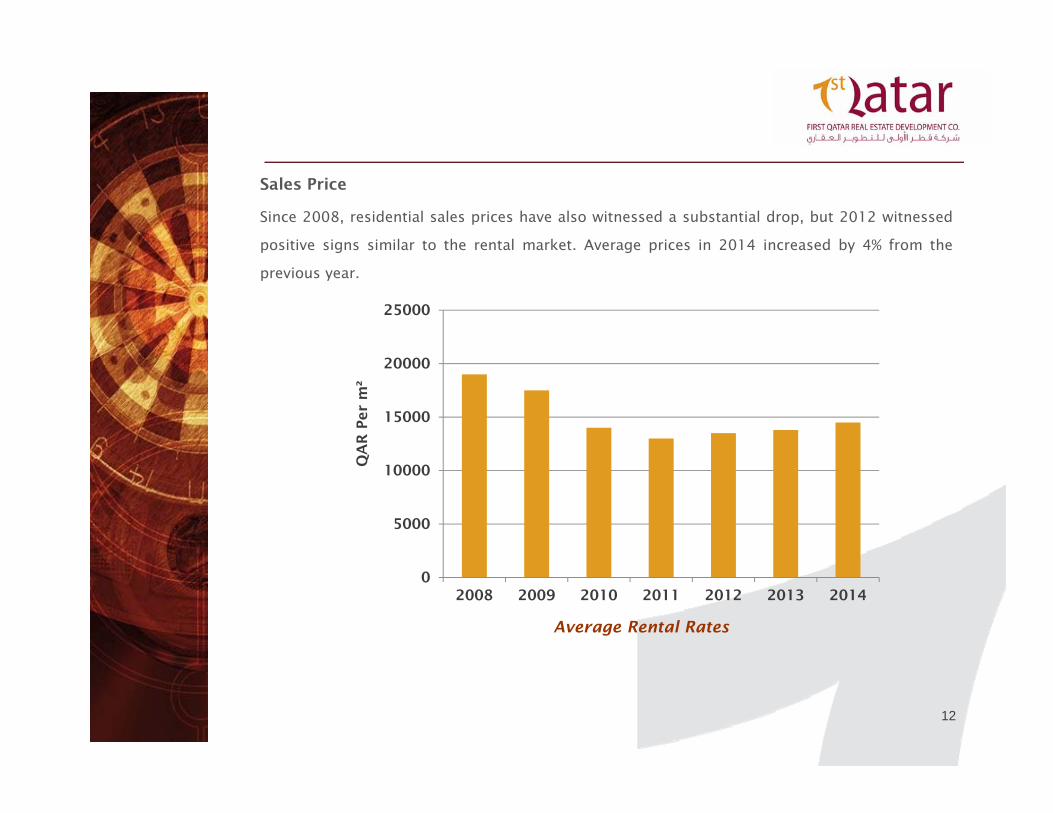
Sales Price
Since 2008, residential sales prices have also witnessed a substantial drop, but 2012 witnessed
positive signs similar to the rental market. Average prices in 2014 increased by 4% from the
previous year.
Average Rental Rates
0
5000
10000
15000
20000
25000
2008 2009 2010 2011 2012 2013 2014
QA
R P
er
m²
13
The office sector in Doha has undergone dramatic changes since the year 2000. Historically,
office space in Doha was located in the city centre (A and B Ring Roads) and along Grand Hamad
Avenue in the 1980s and 1990s. More recently along the C and D Ring roads, and currently, the
West Bay/Diplomatic District.
The growth in prominence of West Bay from the beginning of this decade and the current
government measures of moving public departments there has resulted in a change in the
market’s focus towards this area.
As with other markets, the predominant reason for office tenants moving into the Central
Business District (CBD) (in this case -West Bay) is the need to upgrade their offices, the
requirement for additional space, and overall attraction of moving into a better location.
Currently, West Bay comprises of the majority of office space in Doha.
Supply
The current Grade A (in terms of location) office space reached 2.5 million m² by the end of
2013. Although there are many dedicated office buildings in Doha, overall supply currently
existing in Doha cannot be classified as primary grade quality in comparison to international
markets. However, this is set to change with the provision of new office space currently under
construction and in the planning stages.
Office Sector Overview
14
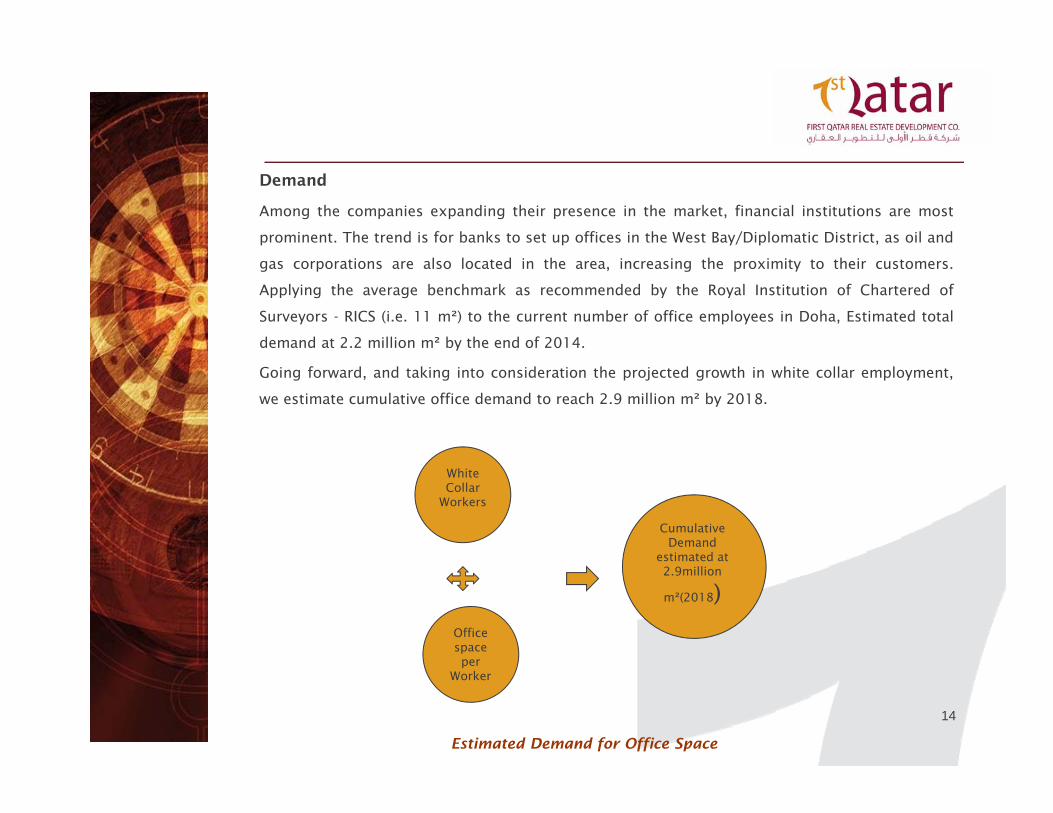
Demand
Among the companies expanding their presence in the market, financial institutions are most
prominent. The trend is for banks to set up offices in the West Bay/Diplomatic District, as oil and
gas corporations are also located in the area, increasing the proximity to their customers.
Applying the average benchmark as recommended by the Royal Institution of Chartered of
Surveyors - RICS (i.e. 11 m²) to the current number of office employees in Doha, Estimated total
demand at 2.2 million m² by the end of 2014.
Going forward, and taking into consideration the projected growth in white collar employment,
we estimate cumulative office demand to reach 2.9 million m² by 2018.
Estimated Demand for Office Space
White Collar
Workers
Office space per
Worker
CumulativeDemand
estimated at 2.9million
m²(2018)
15
Pricing/Market Performance
Following an increase in demand for new office space, a stabilization of rentals within primary
grade office space has also been witnessed. This can be attributed to the fact that there is tenant
movement towards central areas such as West Bay, as rentals have become more affordable.
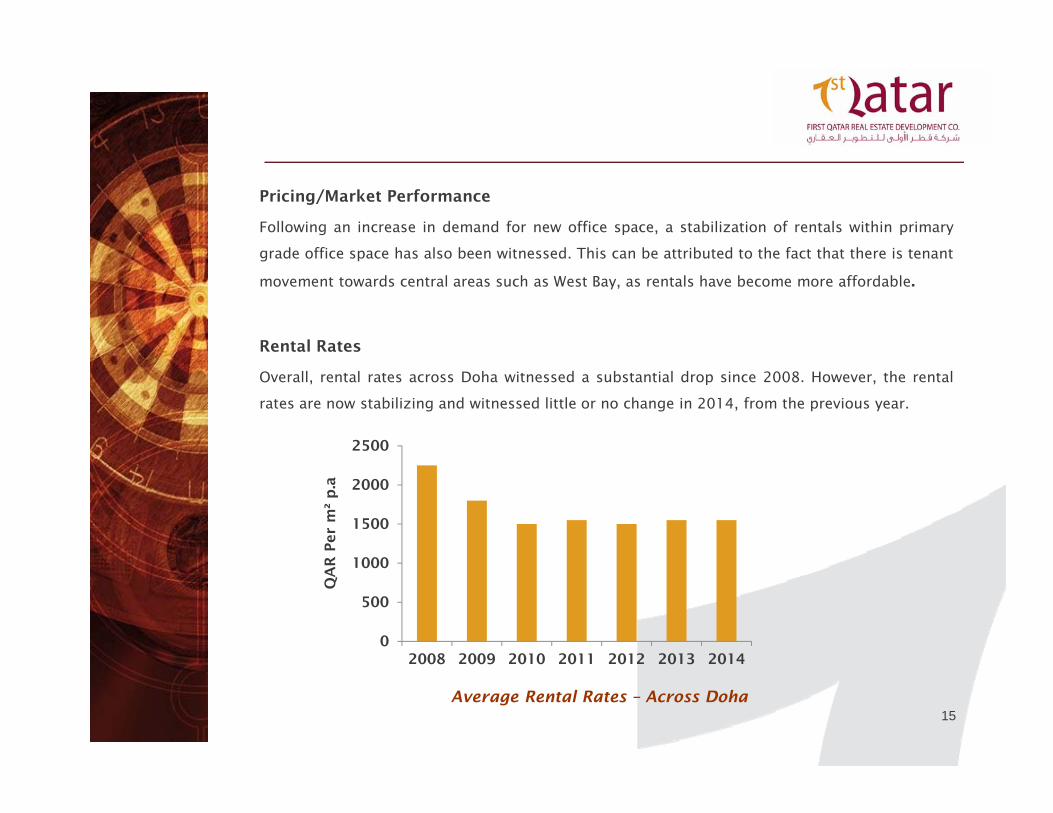
Rental Rates
Overall, rental rates across Doha witnessed a substantial drop since 2008. However, the rental
rates are now stabilizing and witnessed little or no change in 2014, from the previous year.
Average Rental Rates – Across Doha
0
500
1000
1500
2000
2500
2008 2009 2010 2011 2012 2013 2014
QA
R P
er
m²
p.a
16
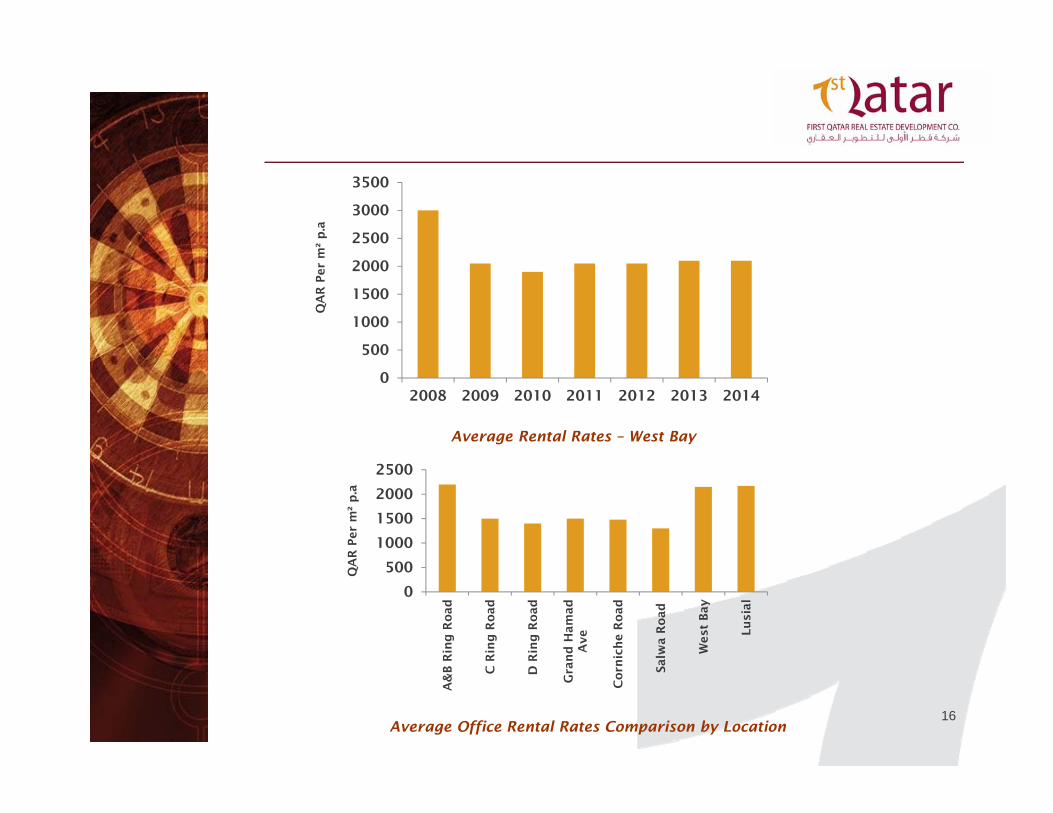
Average Rental Rates – West Bay
Average Office Rental Rates Comparison by Location
0
500
1000
1500
2000
2500
3000
3500
2008 2009 2010 2011 2012 2013 2014
QA
R P
er
m²
p.a
0
500
1000
1500
2000
2500
A&
B R
ing
Road
C R
ing
Ro
ad
D R
ing
Ro
ad
Gra
nd
Ham
ad
Ave
Co
rnic
he R
oad
Salw
a R
oad
West
Bay
Lu
sial
QA
R P
er
m²
p.a

17
Doha’s retail market continues to be dominated by modern shopping malls such as the
Villaggio, Lagoona, Landmark and City Centre, which together account for 60% of Doha’s formal
(mall) retail supply.
SUPPLY
The total existing supply in terms of Gross Leasable Area (GLA) currently stands at
approximately 629,000 m². Doha City Centre accounts for 20% of this supply, followed by
Villagio, at 17% and Porto Arabia representing 15% of cumulative supply.
The majority of shopping malls in Doha are located in the northern and north western side of the
city.
However, the majority of planned/ proposed malls will see a concentration shift towards and in
Lusail.
Based on future population growth estimates demand for shopping mall space is likely to
continue an upward trend. The delivery of a further 900,000 m² within the next 5 years (provided
construction timelines are met).
Given this volume of planned supply comes online (provided construction timelines are met), the
addition supply is expected to add more competition in the retail landscape.
Retail Sector Overview
18
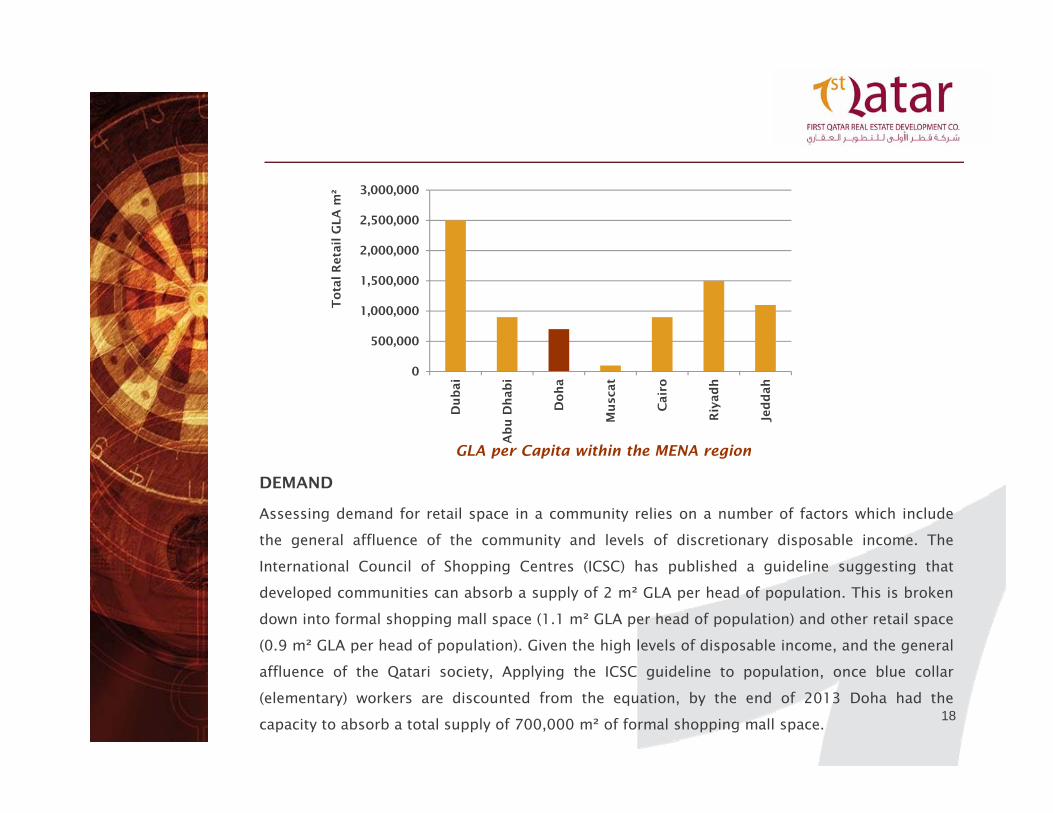
GLA per Capita within the MENA region
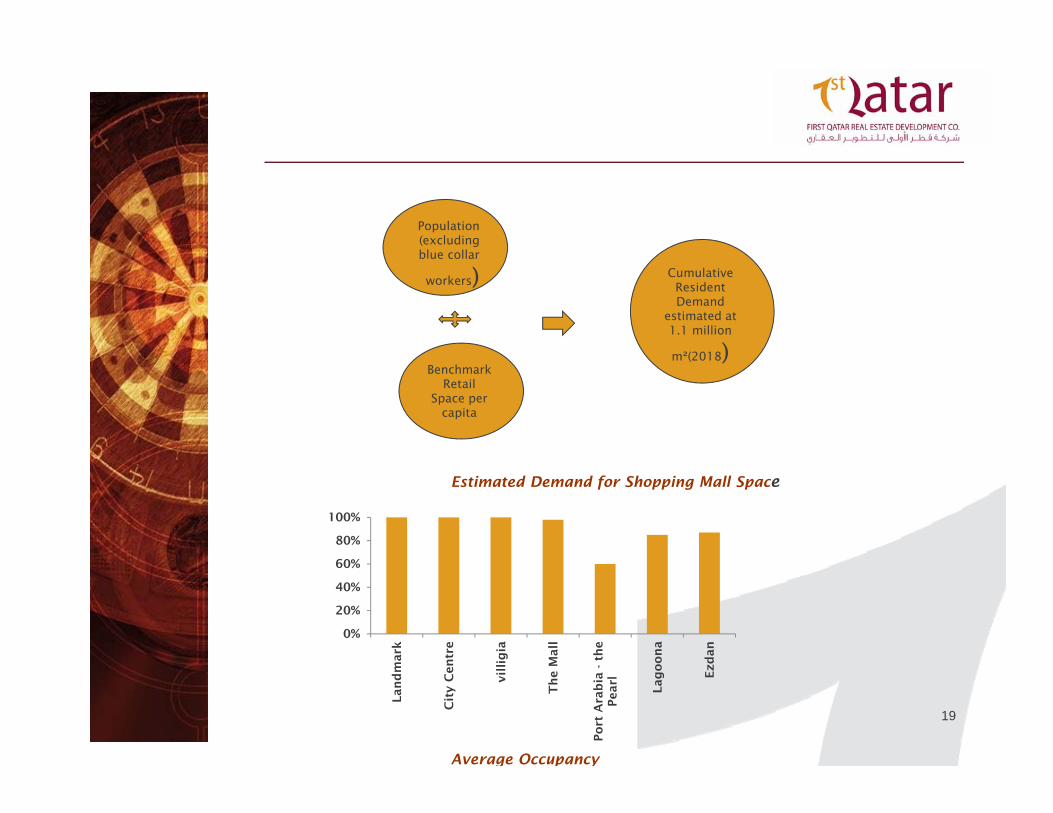
DEMAND
Assessing demand for retail space in a community relies on a number of factors which include
the general affluence of the community and levels of discretionary disposable income. The
International Council of Shopping Centres (ICSC) has published a guideline suggesting that
developed communities can absorb a supply of 2 m² GLA per head of population. This is broken
down into formal shopping mall space (1.1 m² GLA per head of population) and other retail space
(0.9 m² GLA per head of population). Given the high levels of disposable income, and the general
affluence of the Qatari society, Applying the ICSC guideline to population, once blue collar
(elementary) workers are discounted from the equation, by the end of 2013 Doha had the
capacity to absorb a total supply of 700,000 m² of formal shopping mall space.
0
500,000
1,000,000
1,500,000
2,000,000
2,500,000
3,000,000
Du
bai
Ab
u D
hab
i
Doh
a
Mu
scat
Cair
o
Riy
ad
h
Jed
dah
To
tal R
eta
il G
LA
m²
19
Estimated Demand for Shopping Mall Space
Average Occupancy
Population(excluding blue collar
workers)
Benchmark Retail
Space per capita
Cumulative Resident Demand
estimated at 1.1 million
m²(2018)
0%
20%
40%
60%
80%
100%
Lan
dm
ark
Cit
y C
en
tre
vil
lig
ia
Th
e M
all
Po
rt A
rab
ia - t
he
Pearl
Lag
oo
na
Ezd
an

20
PRICING / MARKET PERFORMANCE
Average line rentals in shopping malls in Doha range between QR 180 and QR 275 per m² per
month.
Average Rental Rates
0
100
200
300
400
Min Max Min Max
Landmark
City centre
Lagoona
Ezdan
Villagio
the Mall
Port Arabia-The Pearl
QA
R P
er
m²
per
mo
nth
AnchorLine
21
Doha will continue to experience strong residential demand over the short to medium term
as the economy remains stable and population growth continues.
Although occupancy rates across Doha are currently 85%, As per research we can suggests
that high-end gated communities in Doha are currently enjoying average occupancy rates of
approximately 97%, indicating a preference and high demand for such accommodation.
Developing residential units in close proximity to education facilities act as a significant
attractor to tenants from residential communities that do not have easy access to such
essential social infrastructure facilities.
The Office market is currently oversupplied and given the forthcoming projects in the
pipeline, the market is likely to remain oversupplied in the short to medium term.
Office occupancy rates across Doha are currently 75%, with newer buildings taking longer to
lease, given the oversupplied market.
Despite Doha’s office market being currently oversupplied, it is becoming more challenging
to find space for smaller occupiers but larger occupiers have a greater range of good quality
options to consider.
Increased demand for retail space in Doha has prompted the development and proposals of
numerous new shopping malls. These malls will increase the current GLA by almost 300%,
being actual realization of announced projects.
Outlook
22
deloitte.com
alasmakhrealestate.com
Euro monitor International
IMF
Colliers International
MEED Report
Oxfordbusinessgroup.com
Ministry of Development Planning and Statistics
Samba.com
Source & Reference
Thank You…!