Embed Size (px)
Citation preview
X
51
GCC Real Estate
Al Masah Capital Management Limited
Level 9, Suite 906 & 907 ETA Star - Liberty House Dubai International Financial Centre Dubai-UAE P.O.Box 506838 Tel: +971 4 4531500 Fax: +971 4 4534145 Email: [email protected] Website: www.almasahcapital.com Disclaimer: This report is prepared by Al Masah Capital Management Limited (“AMCML”). AMCML is a company incorporated under the DIFC Companies Law and is regulated by the Dubai Financial Services Authority (“DFSA”). The information contained in this report does not constitute an offer to sell securities or the solicitation of an offer to buy, or recommendation for investment in, any securities in any jurisdiction. The information in this report is not intended as financial advice and is only intended for professionals with appropriate investment knowledge and ones that AMCML is satisfied meet the regulatory criteria to be classified as a ‘Professional Client’ as defined under the Rules & Regulations of the appropriate financial authority. Moreover, none of the report is intended as a prospectus within the meaning of the applicable laws of any jurisdiction and none of the report is directed to any person in any country in which the distribution of such report is unlawful. This report provides general information only. The information and opinions in the report constitute a judgment as at the date indicated and are subject to change without notice. The information may therefore not be accurate or current. The information and opinions contained in this report have been compiled or arrived at from sources believed to be reliable in good faith, but no representation or warranty, express, or implied, is made by AMCML,as to their accuracy, completeness or correctness and AMCML does also not warrant that the information is up to date. Moreover, you should be aware of the fact that investments in undertakings, securities or other financial instruments involve risks. Past results do not guarantee future performance. We accept no liability for any loss arising from the use of material presented in this report. This document has not been reviewed by, approved by or filed with the DFSA. This report or any portion hereof may not be reprinted, sold or redistributed without our prior written consent.
Copyright © 2015 Al Masah Capital Management Limited
Al Masah Capital: GCC Real Estate Sector
December 2015
GCC Real Estate Sector Report_V3 COVER.indd 1 11/10/15 6:59 PM
X
2
GCC Real Estate
GLOBAL REAL ESTATE MARKET
Global real estate market fell back in 2014 due to policy changes in China and other Asia Pacific countries, which led to weakening in land sales. However, sales volumes excluding land sales registered a robust growth courtesy of global liquidity in the markets.
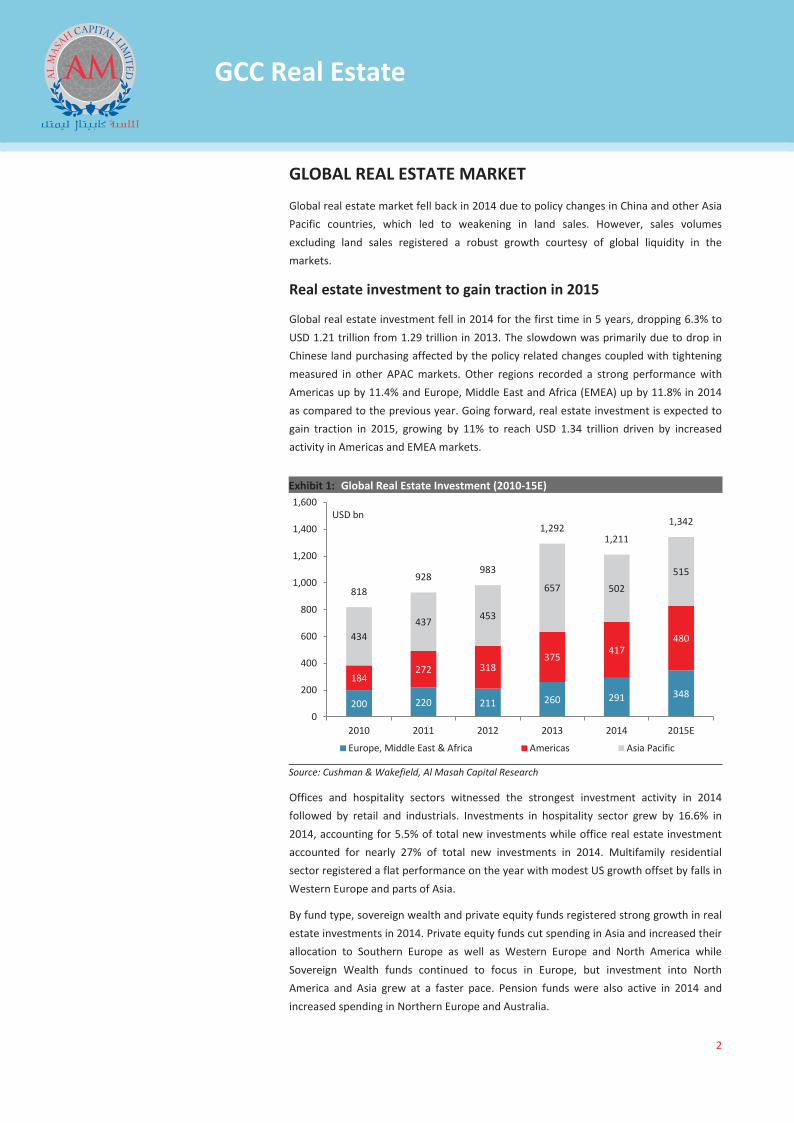
Real estate investment to gain traction in 2015
Global real estate investment fell in 2014 for the first time in 5 years, dropping 6.3% to USD 1.21 trillion from 1.29 trillion in 2013. The slowdown was primarily due to drop in Chinese land purchasing affected by the policy related changes coupled with tightening measured in other APAC markets. Other regions recorded a strong performance with Americas up by 11.4% and Europe, Middle East and Africa (EMEA) up by 11.8% in 2014 as compared to the previous year. Going forward, real estate investment is expected to gain traction in 2015, growing by 11% to reach USD 1.34 trillion driven by increased activity in Americas and EMEA markets.
Exhibit 1: Global Real Estate Investment (2010-15E)
Source: Cushman & Wakefield, Al Masah Capital Research
Offices and hospitality sectors witnessed the strongest investment activity in 2014 followed by retail and industrials. Investments in hospitality sector grew by 16.6% in 2014, accounting for 5.5% of total new investments while office real estate investment accounted for nearly 27% of total new investments in 2014. Multifamily residential sector registered a flat performance on the year with modest US growth offset by falls in Western Europe and parts of Asia.
By fund type, sovereign wealth and private equity funds registered strong growth in real estate investments in 2014. Private equity funds cut spending in Asia and increased their allocation to Southern Europe as well as Western Europe and North America while Sovereign Wealth funds continued to focus in Europe, but investment into North America and Asia grew at a faster pace. Pension funds were also active in 2014 and increased spending in Northern Europe and Australia.
200 220 211 260 291 348 184
272 318 375
417 480 434
437 453
657 502 515
818 928
983
1,292 1,211
1,342
0
200
400
600
800
1,000
1,200
1,400
1,600
2010 2011 2012 2013 2014 2015E
USD bn
Europe, Middle East & Africa Americas Asia Pacific
GCC Real Estate Sector Report_V3.indd 2GCC Real Estate Sector Report_V3.indd 2 11/10/15 6:49 PM11/10/15 6:49 PM
X
3
GCC Real Estate
GCC ECONOMIC OVERVIEW
Booming economy
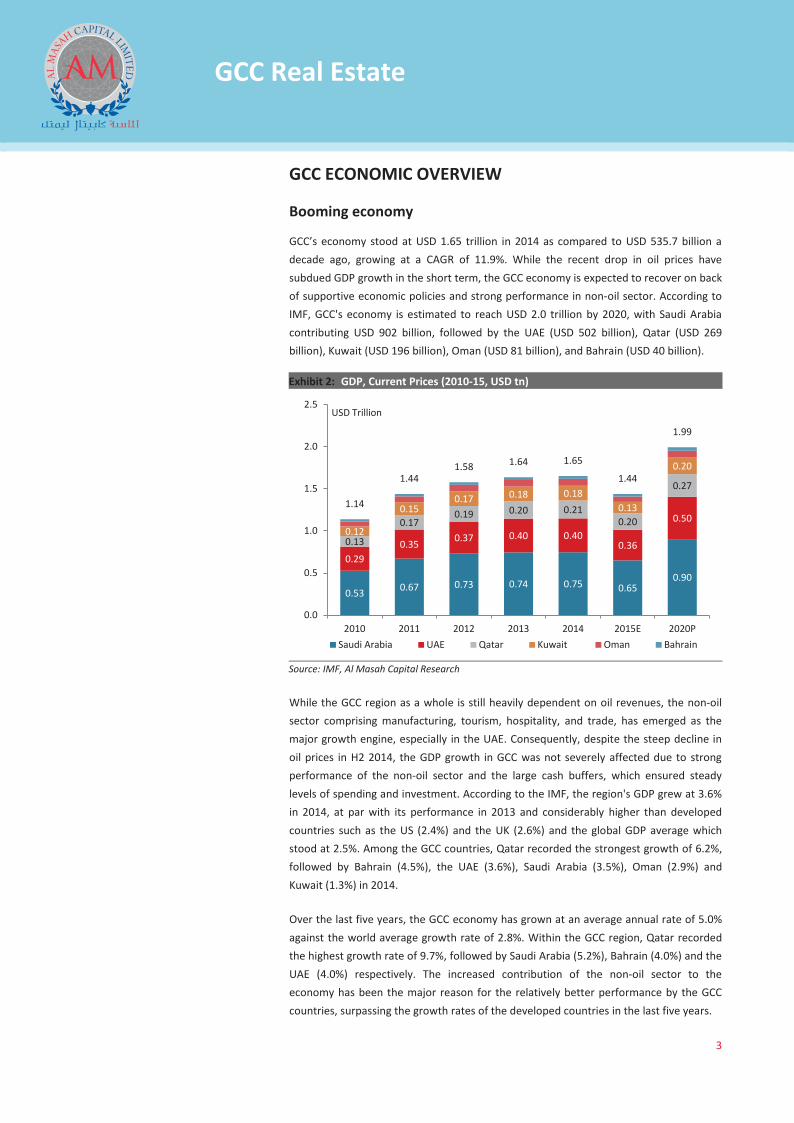
GCC’s economy stood at USD 1.65 trillion in 2014 as compared to USD 535.7 billion a decade ago, growing at a CAGR of 11.9%. While the recent drop in oil prices have subdued GDP growth in the short term, the GCC economy is expected to recover on back of supportive economic policies and strong performance in non-oil sector. According to IMF, GCC's economy is estimated to reach USD 2.0 trillion by 2020, with Saudi Arabia contributing USD 902 billion, followed by the UAE (USD 502 billion), Qatar (USD 269 billion), Kuwait (USD 196 billion), Oman (USD 81 billion), and Bahrain (USD 40 billion).
Exhibit 2: GDP, Current Prices (2010-15, USD tn)
Source: IMF, Al Masah Capital Research
While the GCC region as a whole is still heavily dependent on oil revenues, the non-oil sector comprising manufacturing, tourism, hospitality, and trade, has emerged as the major growth engine, especially in the UAE. Consequently, despite the steep decline in oil prices in H2 2014, the GDP growth in GCC was not severely affected due to strong performance of the non-oil sector and the large cash buffers, which ensured steady levels of spending and investment. According to the IMF, the region's GDP grew at 3.6% in 2014, at par with its performance in 2013 and considerably higher than developed countries such as the US (2.4%) and the UK (2.6%) and the global GDP average which stood at 2.5%. Among the GCC countries, Qatar recorded the strongest growth of 6.2%, followed by Bahrain (4.5%), the UAE (3.6%), Saudi Arabia (3.5%), Oman (2.9%) and Kuwait (1.3%) in 2014.
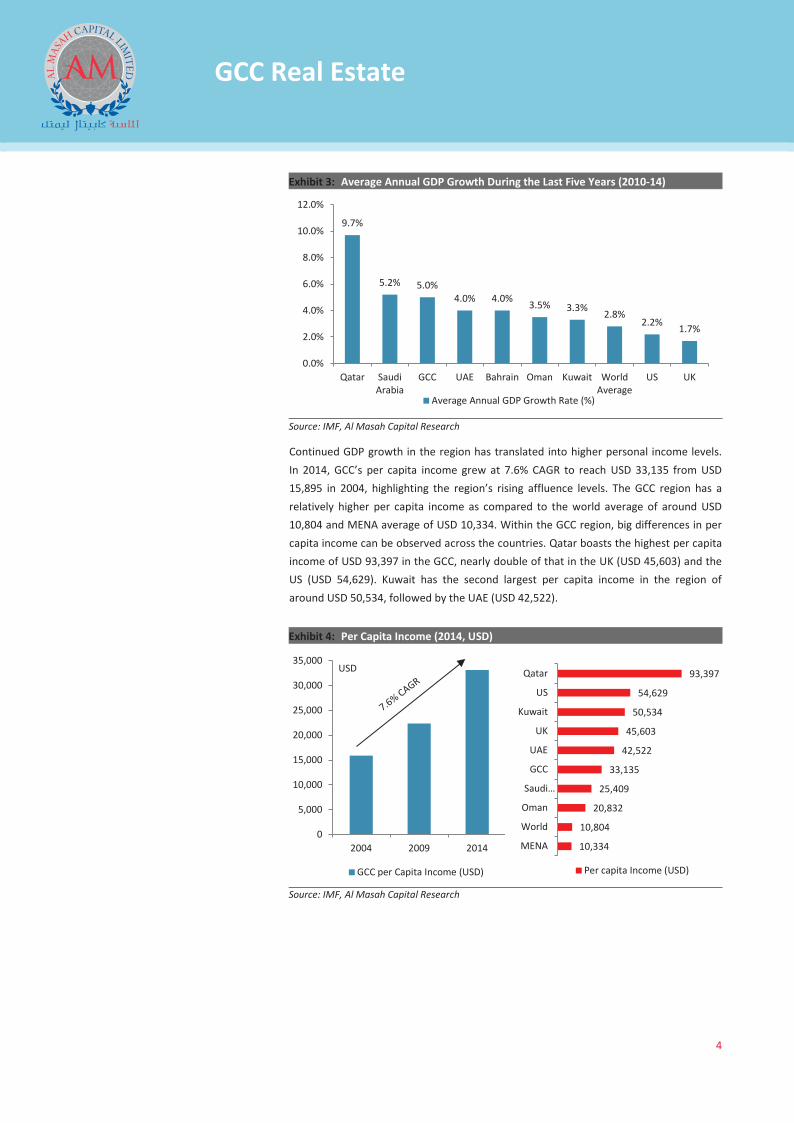
Over the last five years, the GCC economy has grown at an average annual rate of 5.0% against the world average growth rate of 2.8%. Within the GCC region, Qatar recorded the highest growth rate of 9.7%, followed by Saudi Arabia (5.2%), Bahrain (4.0%) and the UAE (4.0%) respectively. The increased contribution of the non-oil sector to the economy has been the major reason for the relatively better performance by the GCC countries, surpassing the growth rates of the developed countries in the last five years.
0.53 0.67 0.73 0.74 0.75 0.65 0.90
0.29 0.35 0.37 0.40 0.40
0.36
0.50
0.13
0.17 0.19 0.20 0.21
0.20
0.27
0.12
0.15 0.17 0.18 0.18
0.13
0.20
1.14
1.44 1.58 1.64 1.65
1.44
1.99
0.0
0.5
1.0
1.5
2.0
2.5
2010 2011 2012 2013 2014 2015E 2020P
USD Trillion
Saudi Arabia UAE Qatar Kuwait Oman Bahrain
GCC Real Estate Sector Report_V3.indd 3GCC Real Estate Sector Report_V3.indd 3 11/10/15 6:49 PM11/10/15 6:49 PM
X
4
GCC Real Estate
Exhibit 3: Average Annual GDP Growth During the Last Five Years (2010-14)
Source: IMF, Al Masah Capital Research
Continued GDP growth in the region has translated into higher personal income levels. In 2014, GCC’s per capita income grew at 7.6% CAGR to reach USD 33,135 from USD 15,895 in 2004, highlighting the region’s rising affluence levels. The GCC region has a relatively higher per capita income as compared to the world average of around USD 10,804 and MENA average of USD 10,334. Within the GCC region, big differences in per capita income can be observed across the countries. Qatar boasts the highest per capita income of USD 93,397 in the GCC, nearly double of that in the UK (USD 45,603) and the US (USD 54,629). Kuwait has the second largest per capita income in the region of around USD 50,534, followed by the UAE (USD 42,522).
Exhibit 4: Per Capita Income (2014, USD)
Source: IMF, Al Masah Capital Research
9.7%
5.2% 5.0% 4.0% 4.0% 3.5% 3.3% 2.8%
2.2% 1.7%
0.0%
2.0%
4.0%
6.0%
8.0%
10.0%
12.0%
Qatar SaudiArabia
GCC UAE Bahrain Oman Kuwait WorldAverage
US UK
Average Annual GDP Growth Rate (%)
0
5,000
10,000
15,000
20,000
25,000
30,000
35,000
2004 2009 2014
USD
GCC per Capita Income (USD)
10,334
10,804
20,832
25,409
33,135
42,522
45,603
50,534
54,629
93,397
MENA
World
Oman
Saudi…
GCC
UAE
UK
Kuwait
US
Qatar
Per capita Income (USD)
GCC Real Estate Sector Report_V3.indd 4GCC Real Estate Sector Report_V3.indd 4 11/10/15 6:49 PM11/10/15 6:49 PM
X
5
GCC Real Estate
Favorable Demographics
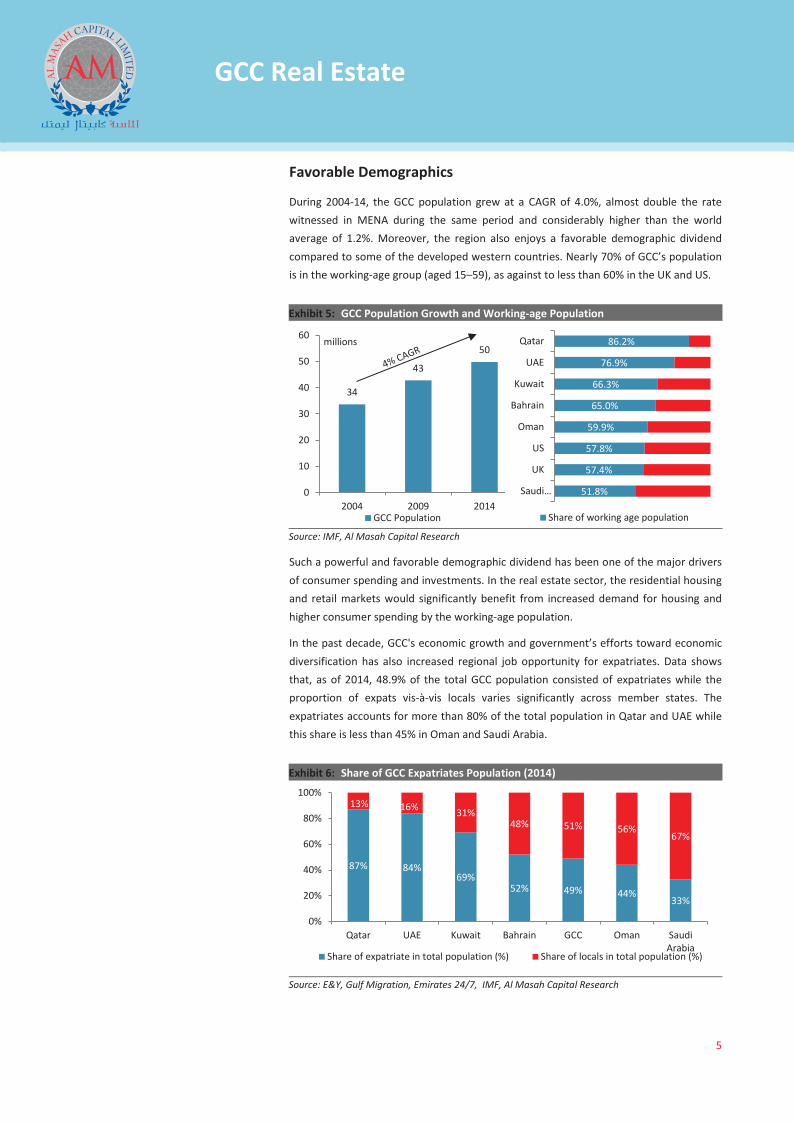
During 2004-14, the GCC population grew at a CAGR of 4.0%, almost double the rate witnessed in MENA during the same period and considerably higher than the world average of 1.2%. Moreover, the region also enjoys a favorable demographic dividend compared to some of the developed western countries. Nearly 70% of GCC’s population is in the working-age group (aged 15–59), as against to less than 60% in the UK and US.
Exhibit 5: GCC Population Growth and Working-age Population
Source: IMF, Al Masah Capital Research
Such a powerful and favorable demographic dividend has been one of the major drivers of consumer spending and investments. In the real estate sector, the residential housing and retail markets would significantly benefit from increased demand for housing and higher consumer spending by the working-age population.
In the past decade, GCC's economic growth and government’s efforts toward economic diversification has also increased regional job opportunity for expatriates. Data shows that, as of 2014, 48.9% of the total GCC population consisted of expatriates while the proportion of expats vis-à-vis locals varies significantly across member states. The expatriates accounts for more than 80% of the total population in Qatar and UAE while this share is less than 45% in Oman and Saudi Arabia.
Exhibit 6: Share of GCC Expatriates Population (2014)
Source: E&Y, Gulf Migration, Emirates 24/7, IMF, Al Masah Capital Research
34
43
50
0
10
20
30
40
50
60
2004 2009 2014
millions
GCC Population
51.8%
57.4%
57.8%
59.9%
65.0%
66.3%
76.9%
86.2%
Saudi…
UK
US
Oman
Bahrain
Kuwait
UAE
Qatar
Share of working age population
87% 84% 69%
52% 49% 44% 33%
13% 16% 31% 48% 51% 56%
67%
0%
20%
40%
60%
80%
100%
Qatar UAE Kuwait Bahrain GCC Oman SaudiArabia
Share of expatriate in total population (%) Share of locals in total population (%)
GCC Real Estate Sector Report_V3.indd 5GCC Real Estate Sector Report_V3.indd 5 11/10/15 6:49 PM11/10/15 6:49 PM
X
6
GCC Real Estate
The expatriate population plays a significant role in the growth of the regional economy with the education and real estate sectors receiving great impetus. The growing expat population has inevitably led to the increase in demand for larger and more luxurious housing which in turn has spurred construction in the premium residential real estate segment. Moreover, the government's decision to allow foreigners to own properties has also surged the real estate demand in the last few years.
Tourism and Upcoming Major Events
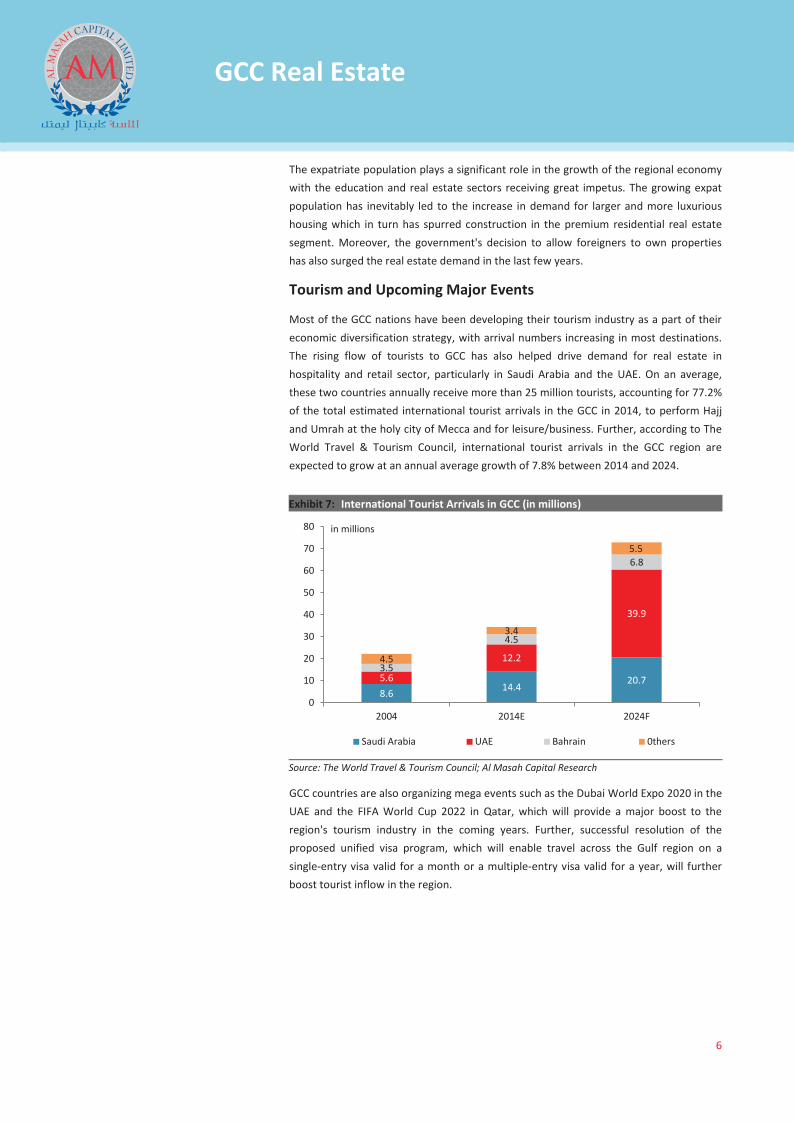
Most of the GCC nations have been developing their tourism industry as a part of their economic diversification strategy, with arrival numbers increasing in most destinations. The rising flow of tourists to GCC has also helped drive demand for real estate in hospitality and retail sector, particularly in Saudi Arabia and the UAE. On an average, these two countries annually receive more than 25 million tourists, accounting for 77.2% of the total estimated international tourist arrivals in the GCC in 2014, to perform Hajj and Umrah at the holy city of Mecca and for leisure/business. Further, according to The World Travel & Tourism Council, international tourist arrivals in the GCC region are expected to grow at an annual average growth of 7.8% between 2014 and 2024.
Exhibit 7: International Tourist Arrivals in GCC (in millions)
Source: The World Travel & Tourism Council; Al Masah Capital Research
GCC countries are also organizing mega events such as the Dubai World Expo 2020 in the UAE and the FIFA World Cup 2022 in Qatar, which will provide a major boost to the region's tourism industry in the coming years. Further, successful resolution of the proposed unified visa program, which will enable travel across the Gulf region on a single-entry visa valid for a month or a multiple-entry visa valid for a year, will further boost tourist inflow in the region.
8.6 14.4 20.7 5.6
12.2
39.9
3.5
4.5
6.8
4.5
3.4
5.5
0
10
20
30
40
50
60
70
80
2004 2014E 2024F
in millions
Saudi Arabia UAE Bahrain 0thers
GCC Real Estate Sector Report_V3.indd 6GCC Real Estate Sector Report_V3.indd 6 11/10/15 6:49 PM11/10/15 6:49 PM

X
7
GCC Real Estate
GCC REAL ESTATE MARKET
Post recession, GCC has emerged as an attractive destination for global investors and the real estate and construction sectors have become key economic barometers for the growth in the region.
REAL ESTATE PROJECTS IN THE GCC
According to Zawya Projects, the total value of ongoing and on-hold real estate projects in the GCC was estimated at USD 1.72 trillion as of September 2015. The UAE led the real estate market accounting for nearly 51% of the total regional projects by value (amounting to USD 0.88 trillion), followed by Saudi Arabia.
Exhibit 8: Value of Real Estate Projects (ongoing and on-hold) in GCC, as of Sept 2015
Source: Zawya Projects, Al Masah Capital Research
In terms of project status, nearly 66% of the GCC projects (by value) are currently ongoing, equating to a total value of USD 1.1 trillion while a substantial portion which equates to USD 0.6 trillion, are on-hold as of September 2015. Going forward, the sluggishness in real estate projects is expected to reduce as both countries have increased their pace in reviving the non-oil sectors, with the real estate industry being the primary benefactor.
Exhibit 9: Real Estate Projects by Status (By Value), as of Sept 2015
Source: Zawya Projects, Al Masah Capital Research
51.1%
26.8%
4.7%
12.6%
2.2%
2.6%
Total Value of Real Estate Projects = USD 1.72 trillion
UAE Saudi Arabia Qatar Kuwait Bahrain Oman
27% 44%
63%
24% 18% 39% 34%
73% 56%
37%
76% 82% 61% 66%
0%
20%
40%
60%
80%
100%
Bahrain Kuwait Oman Qatar Saudi Arabia UAE GCCOn Hold Ongoing
Total Project Value (USD bn)
37.2 217.7 45.2 81.3 460.9 879.4 1721.8
GCC Real Estate Sector Report_V3.indd 7GCC Real Estate Sector Report_V3.indd 7 11/10/15 6:49 PM11/10/15 6:49 PM
X
8
GCC Real Estate
UAE REAL ESTATE SECTOR
Introduction
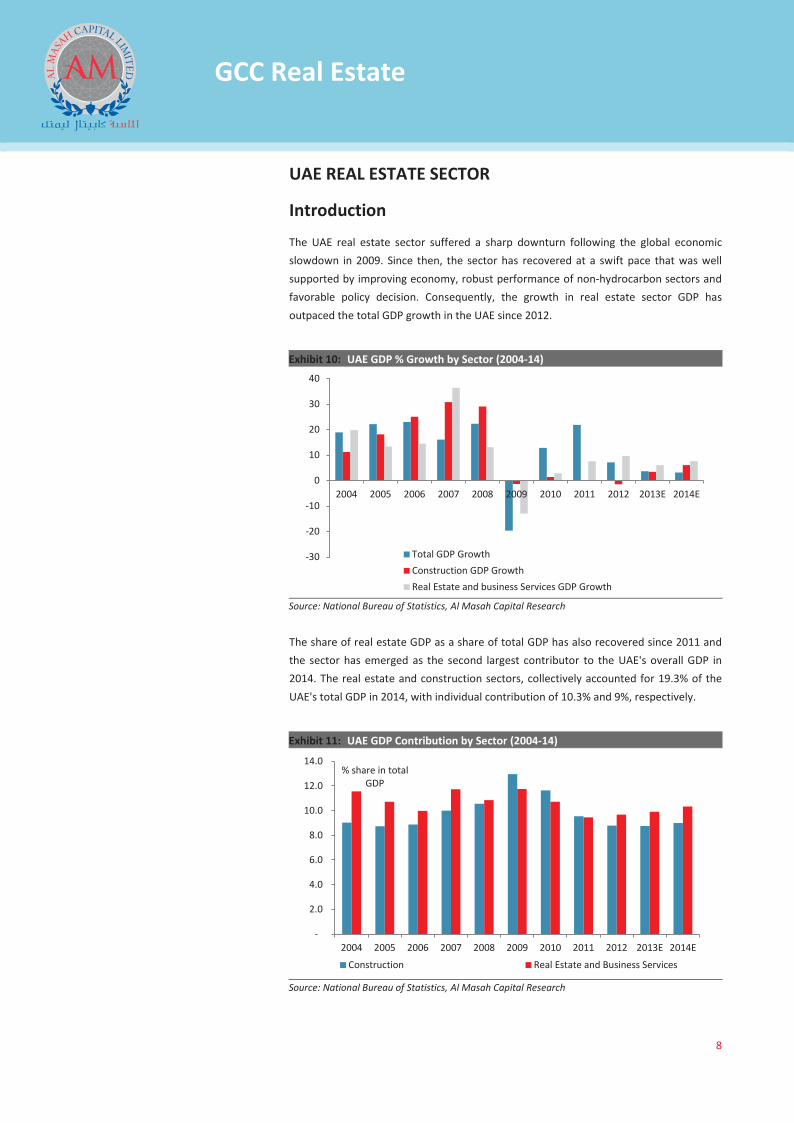
The UAE real estate sector suffered a sharp downturn following the global economic slowdown in 2009. Since then, the sector has recovered at a swift pace that was well supported by improving economy, robust performance of non-hydrocarbon sectors and favorable policy decision. Consequently, the growth in real estate sector GDP has outpaced the total GDP growth in the UAE since 2012.
Exhibit 10: UAE GDP % Growth by Sector (2004-14)
Source: National Bureau of Statistics, Al Masah Capital Research
The share of real estate GDP as a share of total GDP has also recovered since 2011 and the sector has emerged as the second largest contributor to the UAE's overall GDP in 2014. The real estate and construction sectors, collectively accounted for 19.3% of the UAE's total GDP in 2014, with individual contribution of 10.3% and 9%, respectively.
Exhibit 11: UAE GDP Contribution by Sector (2004-14)
Source: National Bureau of Statistics, Al Masah Capital Research
-30
-20
-10
0
10
20
30
40
2004 2005 2006 2007 2008 2009 2010 2011 2012 2013E 2014E
Total GDP GrowthConstruction GDP GrowthReal Estate and business Services GDP Growth
-
2.0
4.0
6.0
8.0
10.0
12.0
14.0
2004 2005 2006 2007 2008 2009 2010 2011 2012 2013E 2014E
% share in total GDP
Construction Real Estate and Business Services
GCC Real Estate Sector Report_V3.indd 8GCC Real Estate Sector Report_V3.indd 8 11/10/15 6:49 PM11/10/15 6:49 PM

X
9
GCC Real Estate
The recovery in real estate market was also supported by increasing Foreign Direct Investments (FDI) which nearly doubled from AED 30.5 billion in 2007 to AED 71.3 billion in 2014. Foreign portfolio investments (FPI) also recovered from 2009 economic slowdown to reach AED 4 billion in 2012.
Exhibit 12: FDI and FPI in Real Estate Sector (2007-12)
Source: National Bureau of Statistics, Al Masah Capital Research
Impact of Oil Prices
Lower oil prices are leading many in the GCC to wonder about the possible implications for real estate. According to Markit, the seasonally adjusted UAE and Saudi Arabia Purchasing Indices (PMI) remained well above the 50 mark during the last year, suggesting a healthy expansion in the markets’ private non-oil sectors. This is a positive indicator for real estate sector as non-hydrocarbon sector is an important source of demand for property owners in the region.
Exhibit 13: UAE and Saudi Arabia Purchasing Manager Indices (2014-Q2 2015)
Source: Markit, Al Masah Capital Research
Moreover, despite posting huge fiscal deficits, the GCC governments are unlikely to cut back on current levels of spending and will utilize large fiscal reserves to fund infrastructure projects. These large publicly funded, infrastructure-related schemes tend to stimulate hinterland construction activity, and thus support growth in the real estate sector.
30.5
39.8 46.2
54.3 59.9
71.3
2.0 5.6 7.3
3.9 4.3 4.0
0
10
20
30
40
50
60
70
80
2007 2008 2009 2010 2011 2012
in AED Billions
Foreign Direct Investments Foreign Porfolio Investments
51.0
54.0
57.0
60.0
63.0
Jan/
14
Feb/
14
Mar
/14
Apr/
14
May
/14
Jun/
14
Jul/1
4
Aug/
14
Sep/
14
Oct
/14
Nov
/14
Dec/
14
Jan/
15
Feb/
15
Mar
/15
Apr/
15
May
/15
Jun/
15
Jul/1
5
Aug/
15
A figure above 50 suggests economic expansion and below implies contraction. 50 means no change on previous month.
Saudi Arabia PMI UAE PMI
GCC Real Estate Sector Report_V3.indd 9GCC Real Estate Sector Report_V3.indd 9 11/10/15 6:49 PM11/10/15 6:49 PM
X
10
GCC Real Estate
Market Statistics
UAE Office Market
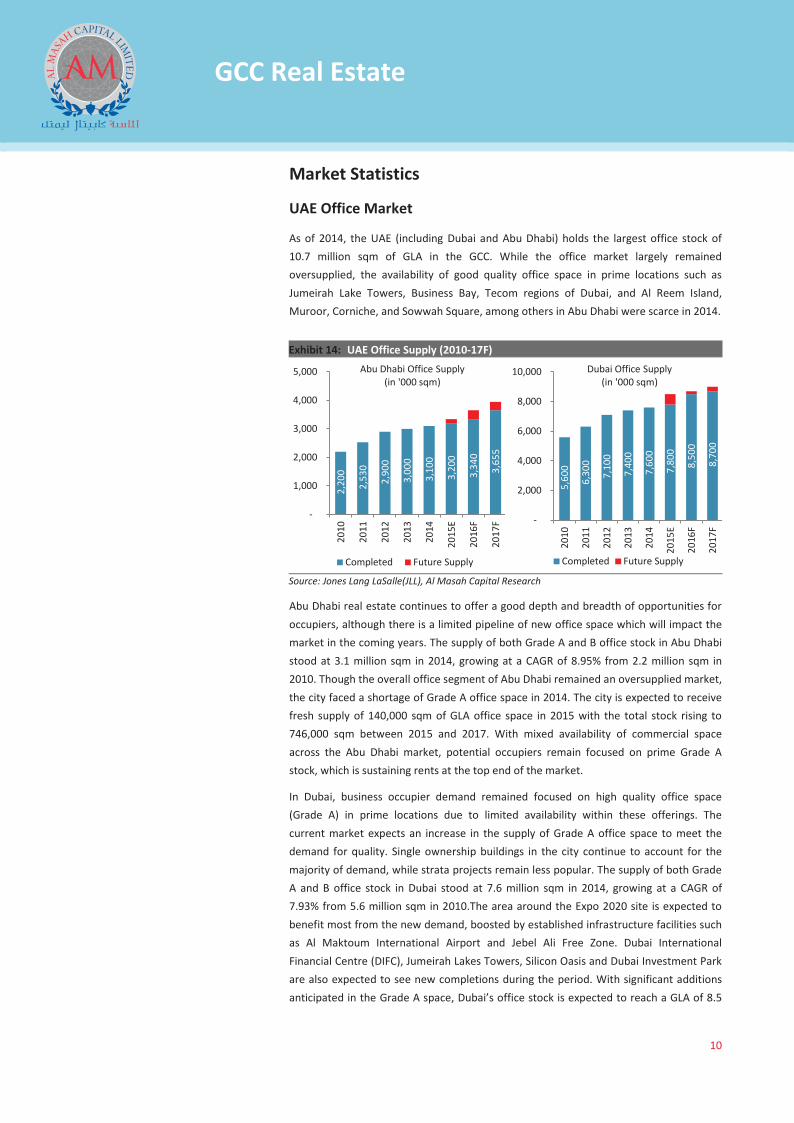
As of 2014, the UAE (including Dubai and Abu Dhabi) holds the largest office stock of 10.7 million sqm of GLA in the GCC. While the office market largely remained oversupplied, the availability of good quality office space in prime locations such as Jumeirah Lake Towers, Business Bay, Tecom regions of Dubai, and Al Reem Island, Muroor, Corniche, and Sowwah Square, among others in Abu Dhabi were scarce in 2014.
Exhibit 14: UAE Office Supply (2010-17F)
Source: Jones Lang LaSalle(JLL), Al Masah Capital Research
Abu Dhabi real estate continues to offer a good depth and breadth of opportunities for occupiers, although there is a limited pipeline of new office space which will impact the market in the coming years. The supply of both Grade A and B office stock in Abu Dhabi stood at 3.1 million sqm in 2014, growing at a CAGR of 8.95% from 2.2 million sqm in 2010. Though the overall office segment of Abu Dhabi remained an oversupplied market, the city faced a shortage of Grade A office space in 2014. The city is expected to receive fresh supply of 140,000 sqm of GLA office space in 2015 with the total stock rising to 746,000 sqm between 2015 and 2017. With mixed availability of commercial space across the Abu Dhabi market, potential occupiers remain focused on prime Grade A stock, which is sustaining rents at the top end of the market.
In Dubai, business occupier demand remained focused on high quality office space (Grade A) in prime locations due to limited availability within these offerings. The current market expects an increase in the supply of Grade A office space to meet the demand for quality. Single ownership buildings in the city continue to account for the majority of demand, while strata projects remain less popular. The supply of both Grade A and B office stock in Dubai stood at 7.6 million sqm in 2014, growing at a CAGR of 7.93% from 5.6 million sqm in 2010.The area around the Expo 2020 site is expected to benefit most from the new demand, boosted by established infrastructure facilities such as Al Maktoum International Airport and Jebel Ali Free Zone. Dubai International Financial Centre (DIFC), Jumeirah Lakes Towers, Silicon Oasis and Dubai Investment Park are also expected to see new completions during the period. With significant additions anticipated in the Grade A space, Dubai’s office stock is expected to reach a GLA of 8.5
2,2
00
2,5
30
2,9
00
3,0
00
3,1
00
3,2
00
3,3
40
3,6
55
-
1,000
2,000
3,000
4,000
5,000
2010
2011
2012
2013
2014
2015
E
2016
F
2017
F
Completed Future Supply
Abu Dhabi Office Supply (in '000 sqm)
5,6
00
6,3
00
7,1
00
7,4
00
7,6
00
7,8
00
8,5
00
8,7
00
-
2,000
4,000
6,000
8,000
10,000
2010
2011
2012
2013
2014
2015
E
2016
F
2017
F
Completed Future Supply
Dubai Office Supply (in '000 sqm)
GCC Real Estate Sector Report_V3.indd 10GCC Real Estate Sector Report_V3.indd 10 11/10/15 6:49 PM11/10/15 6:49 PM
X
11
GCC Real Estate
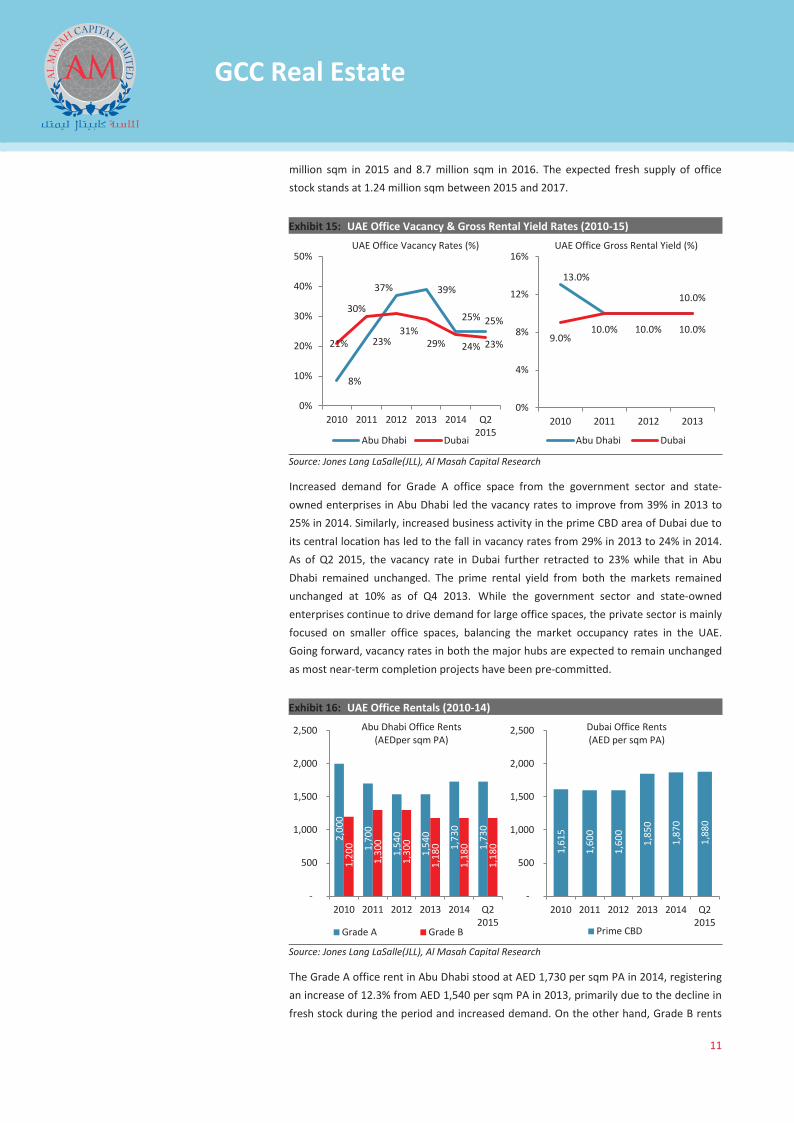
million sqm in 2015 and 8.7 million sqm in 2016. The expected fresh supply of office stock stands at 1.24 million sqm between 2015 and 2017.
Exhibit 15: UAE Office Vacancy & Gross Rental Yield Rates (2010-15)
Source: Jones Lang LaSalle(JLL), Al Masah Capital Research
Increased demand for Grade A office space from the government sector and state-owned enterprises in Abu Dhabi led the vacancy rates to improve from 39% in 2013 to 25% in 2014. Similarly, increased business activity in the prime CBD area of Dubai due to its central location has led to the fall in vacancy rates from 29% in 2013 to 24% in 2014. As of Q2 2015, the vacancy rate in Dubai further retracted to 23% while that in Abu Dhabi remained unchanged. The prime rental yield from both the markets remained unchanged at 10% as of Q4 2013. While the government sector and state-owned enterprises continue to drive demand for large office spaces, the private sector is mainly focused on smaller office spaces, balancing the market occupancy rates in the UAE. Going forward, vacancy rates in both the major hubs are expected to remain unchanged as most near-term completion projects have been pre-committed.
Exhibit 16: UAE Office Rentals (2010-14)
Source: Jones Lang LaSalle(JLL), Al Masah Capital Research
The Grade A office rent in Abu Dhabi stood at AED 1,730 per sqm PA in 2014, registering an increase of 12.3% from AED 1,540 per sqm PA in 2013, primarily due to the decline in fresh stock during the period and increased demand. On the other hand, Grade B rents
8%
23%
37% 39%
25% 25%
21%
30%
31% 29% 24% 23%
0%
10%
20%
30%
40%
50%
2010 2011 2012 2013 2014 Q22015
Abu Dhabi Dubai
UAE Office Vacancy Rates (%)
13.0%
10.0% 10.0% 10.0% 9.0%
10.0%
0%
4%
8%
12%
16%
2010 2011 2012 2013
Abu Dhabi Dubai
UAE Office Gross Rental Yield (%)
2,0
00
1,7
00
1,5
40
1,5
40
1,7
30
1,7
30
1,2
00
1,3
00
1,3
00
1,1
80
1,1
80
1,1
80
-
500
1,000
1,500
2,000
2,500
2010 2011 2012 2013 2014 Q22015
Grade A Grade B
Abu Dhabi Office Rents (AEDper sqm PA)
1,6
15
1,6
00
1,6
00
1,8
50
1,8
70
1,8
80
-
500
1,000
1,500
2,000
2,500
2010 2011 2012 2013 2014 Q22015
Prime CBD
Dubai Office Rents (AED per sqm PA)
GCC Real Estate Sector Report_V3.indd 11GCC Real Estate Sector Report_V3.indd 11 11/10/15 6:49 PM11/10/15 6:49 PM
X
12
GCC Real Estate
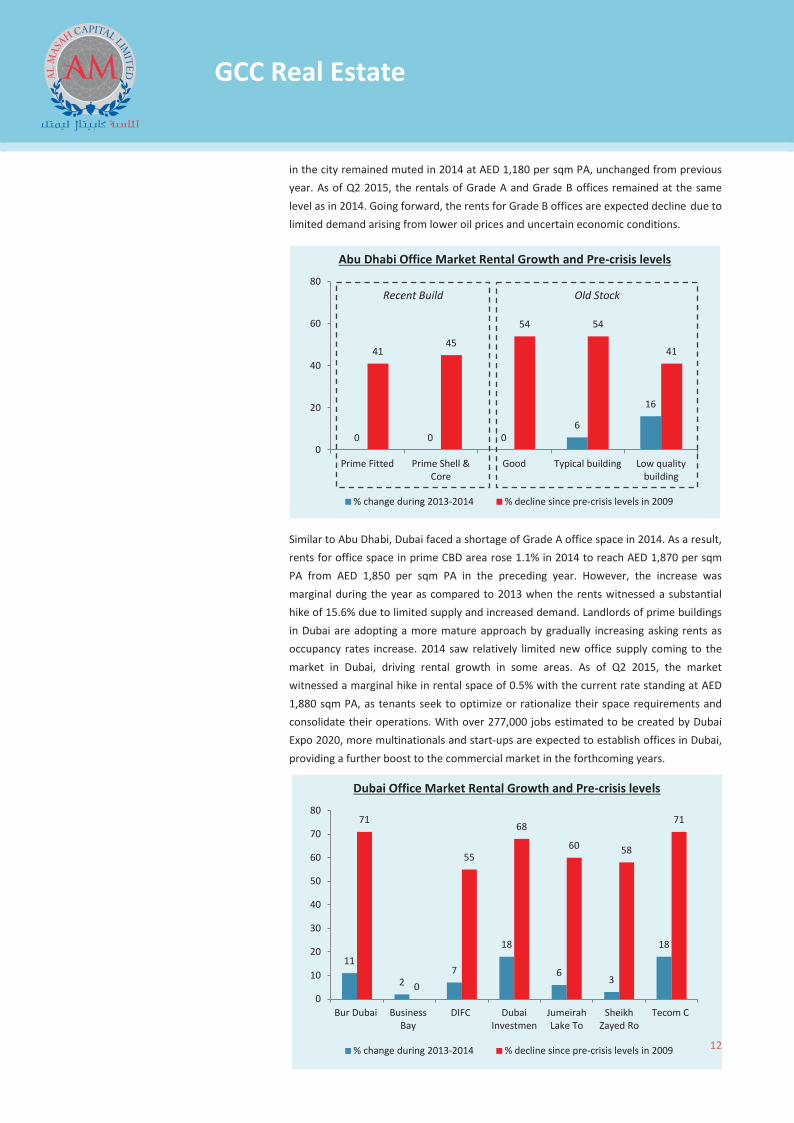
in the city remained muted in 2014 at AED 1,180 per sqm PA, unchanged from previous year. As of Q2 2015, the rentals of Grade A and Grade B offices remained at the same level as in 2014. Going forward, the rents for Grade B offices are expected decline due to limited demand arising from lower oil prices and uncertain economic conditions.
Similar to Abu Dhabi, Dubai faced a shortage of Grade A office space in 2014. As a result, rents for office space in prime CBD area rose 1.1% in 2014 to reach AED 1,870 per sqm PA from AED 1,850 per sqm PA in the preceding year. However, the increase was marginal during the year as compared to 2013 when the rents witnessed a substantial hike of 15.6% due to limited supply and increased demand. Landlords of prime buildings in Dubai are adopting a more mature approach by gradually increasing asking rents as occupancy rates increase. 2014 saw relatively limited new office supply coming to the market in Dubai, driving rental growth in some areas. As of Q2 2015, the market witnessed a marginal hike in rental space of 0.5% with the current rate standing at AED 1,880 sqm PA, as tenants seek to optimize or rationalize their space requirements and consolidate their operations. With over 277,000 jobs estimated to be created by Dubai Expo 2020, more multinationals and start-ups are expected to establish offices in Dubai, providing a further boost to the commercial market in the forthcoming years.
Abu Dhabi Office Market Rental Growth and Pre-crisis levels
0 0 0 6
16
41 45
54 54
41
0
20
40
60
80
Prime Fitted Prime Shell &Core
Good Typical building Low qualitybuilding
% change during 2013-2014 % decline since pre-crisis levels in 2009
Recent Build Old Stock
12
Dubai Office Market Rental Growth and Pre-crisis levels
11
2 7
18
6 3
18
71
0
55
68
60 58
71
0
10
20
30
40
50
60
70
80
Bur Dubai BusinessBay
DIFC DubaiInvestmen
JumeirahLake To
SheikhZayed Ro
Tecom C
% change during 2013-2014 % decline since pre-crisis levels in 2009
GCC Real Estate Sector Report_V3.indd 12GCC Real Estate Sector Report_V3.indd 12 11/10/15 6:49 PM11/10/15 6:49 PM

X
13
GCC Real Estate
According to Reidin, transaction levels in the office sector increased by 16% compared with 2013 with close to 1,500 deals recorded by the Dubai Land Department in 2014. The most transacted areas were Business Bay, Jumeirah Lake Towers and Tecom C, representing close to 80% of all office transactions in 2014 from 90% in 2013. In terms of size, most transactions in 2014 were for mid-sized offices measuring from 1,000 to 2,000 sqft, representing approximately 50% of all transactions, whereas small units of less than 1,000 sqft represented 30%. Although transaction levels improved, sales price growth remained relatively slow, with a yearly increase of only 9% since Q4 2013, and still 50% lower, on average, than at their peak in 2008.
Exhibit 17: Dubai Average Office Sales (AED per sqft PA, 2008-14)
Source: Asteco, Al Masah Capital Research
In 2015, the UAE office rentals are expected remain stable, which is good news for occupiers. However, vacancy rates will remain significant despite a continued gradual improvement in the strata title market, where different investors own one or more floors. Office rental rates in Dubai remained the highest in the UAE. After taking into consideration the cost and quality of living in Dubai & Abu Dhabi, many companies still opted to setup in Dubai rather than the capital. Sharjah and Al Ain predominantly appeal to local companies operating in these cities and, therefore, demand levels remained relatively subdued.
Some of the major ongoing commercial projects in the UAE includes: Dubai World Central (Dubai), Chemicals Industrial City (Abu Dhabi), Expo 2020 Site (Dubai), Dubai World Central - Aviation City (Dubai) and The Opus (Dubai).
0
1,000
2,000
3,000
4,000
5,000
2008 2009 2010 2011 2012 2013 2014
Business Bay DIFC Dubai Investment Park Jumeirah Lake Towers Tecom C
GCC Real Estate Sector Report_V3.indd 13GCC Real Estate Sector Report_V3.indd 13 11/10/15 6:49 PM11/10/15 6:49 PM
X
14
GCC Real Estate
UAE Residential Market
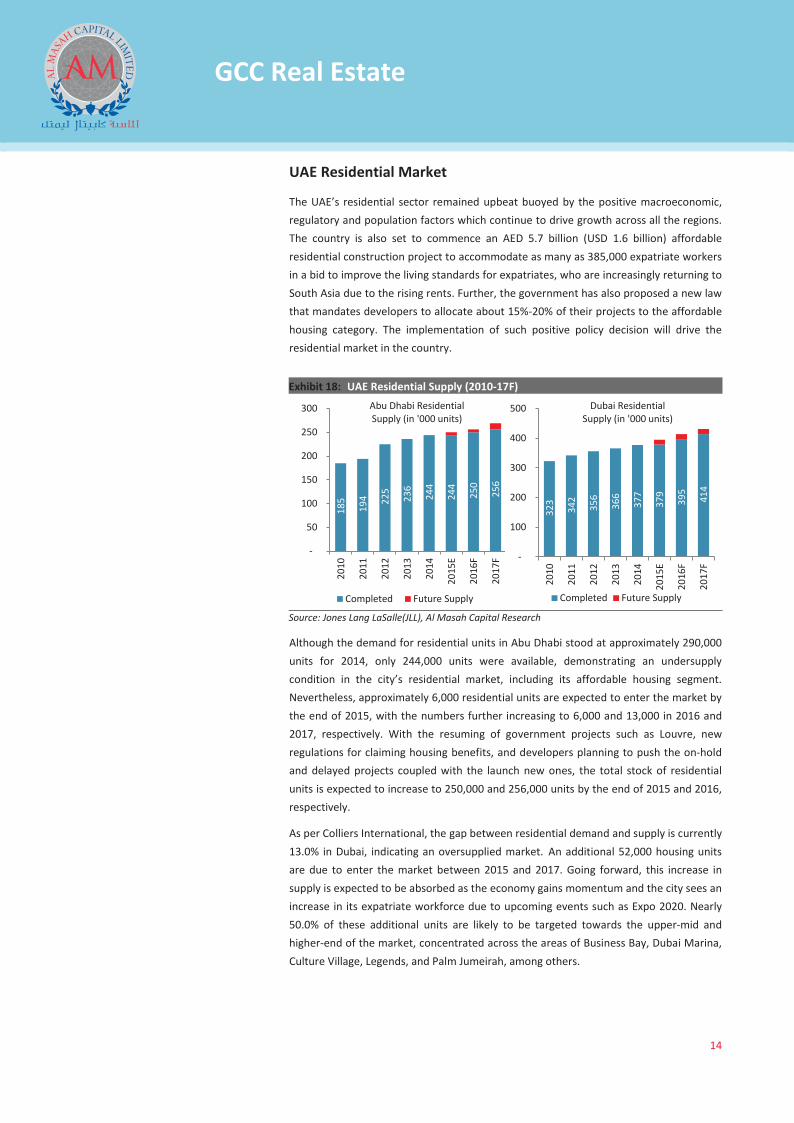
The UAE’s residential sector remained upbeat buoyed by the positive macroeconomic, regulatory and population factors which continue to drive growth across all the regions. The country is also set to commence an AED 5.7 billion (USD 1.6 billion) affordable residential construction project to accommodate as many as 385,000 expatriate workers in a bid to improve the living standards for expatriates, who are increasingly returning to South Asia due to the rising rents. Further, the government has also proposed a new law that mandates developers to allocate about 15%-20% of their projects to the affordable housing category. The implementation of such positive policy decision will drive the residential market in the country.
Exhibit 18: UAE Residential Supply (2010-17F)
Source: Jones Lang LaSalle(JLL), Al Masah Capital Research
Although the demand for residential units in Abu Dhabi stood at approximately 290,000 units for 2014, only 244,000 units were available, demonstrating an undersupply condition in the city’s residential market, including its affordable housing segment. Nevertheless, approximately 6,000 residential units are expected to enter the market by the end of 2015, with the numbers further increasing to 6,000 and 13,000 in 2016 and 2017, respectively. With the resuming of government projects such as Louvre, new regulations for claiming housing benefits, and developers planning to push the on-hold and delayed projects coupled with the launch new ones, the total stock of residential units is expected to increase to 250,000 and 256,000 units by the end of 2015 and 2016, respectively.
As per Colliers International, the gap between residential demand and supply is currently 13.0% in Dubai, indicating an oversupplied market. An additional 52,000 housing units are due to enter the market between 2015 and 2017. Going forward, this increase in supply is expected to be absorbed as the economy gains momentum and the city sees an increase in its expatriate workforce due to upcoming events such as Expo 2020. Nearly 50.0% of these additional units are likely to be targeted towards the upper-mid and higher-end of the market, concentrated across the areas of Business Bay, Dubai Marina, Culture Village, Legends, and Palm Jumeirah, among others.
185
194
225
236
244
244
250
256
-
50
100
150
200
250
300
2010
2011
2012
2013
2014
2015
E
2016
F
2017
F
Completed Future Supply
Abu Dhabi Residential Supply (in '000 units)
323
342
356
366
377
379
395
414
-
100
200
300
400
500
2010
2011
2012
2013
2014
2015
E
2016
F
2017
F
Completed Future Supply
Dubai Residential Supply (in '000 units)
GCC Real Estate Sector Report_V3.indd 14GCC Real Estate Sector Report_V3.indd 14 11/10/15 6:49 PM11/10/15 6:49 PM
X
15
GCC Real Estate
Exhibit 19: UAE Residential Rentals (2010-14)
Source: Jones Lang LaSalle(JLL), Al Masah Capital Research
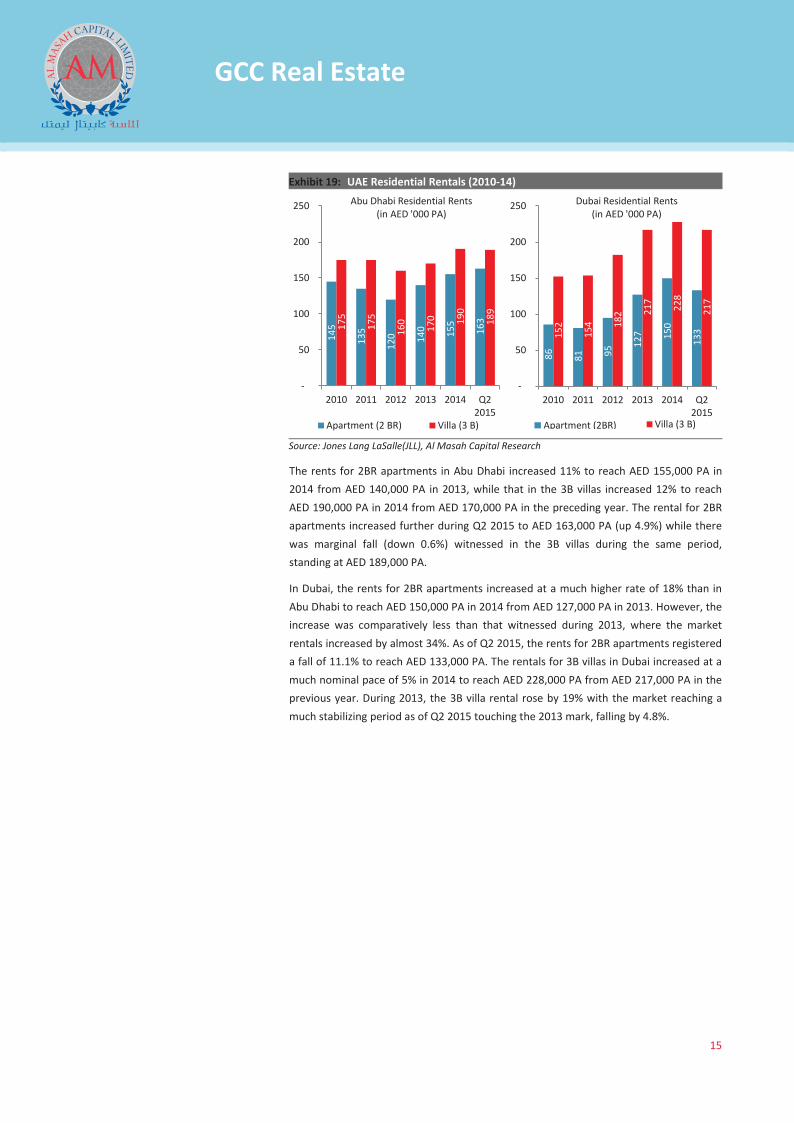
The rents for 2BR apartments in Abu Dhabi increased 11% to reach AED 155,000 PA in 2014 from AED 140,000 PA in 2013, while that in the 3B villas increased 12% to reach AED 190,000 PA in 2014 from AED 170,000 PA in the preceding year. The rental for 2BR apartments increased further during Q2 2015 to AED 163,000 PA (up 4.9%) while there was marginal fall (down 0.6%) witnessed in the 3B villas during the same period, standing at AED 189,000 PA.
In Dubai, the rents for 2BR apartments increased at a much higher rate of 18% than in Abu Dhabi to reach AED 150,000 PA in 2014 from AED 127,000 PA in 2013. However, the increase was comparatively less than that witnessed during 2013, where the market rentals increased by almost 34%. As of Q2 2015, the rents for 2BR apartments registered a fall of 11.1% to reach AED 133,000 PA. The rentals for 3B villas in Dubai increased at a much nominal pace of 5% in 2014 to reach AED 228,000 PA from AED 217,000 PA in the previous year. During 2013, the 3B villa rental rose by 19% with the market reaching a much stabilizing period as of Q2 2015 touching the 2013 mark, falling by 4.8%.
145
135
120
140
155
163
175
175
160
170
190
189
-
50
100
150
200
250
2010 2011 2012 2013 2014 Q22015
Apartment (2 BR) Villa (3 B)
Abu Dhabi Residential Rents (in AED '000 PA)
86
81
95
127
150
133
152
154
182
217
228
217
-
50
100
150
200
250
2010 2011 2012 2013 2014 Q22015
Apartment (3 BR) Villa (3 B)
Dubai Residential Rents (in AED '000 PA)
Apartment (2BR)
GCC Real Estate Sector Report_V3.indd 15GCC Real Estate Sector Report_V3.indd 15 11/10/15 6:49 PM11/10/15 6:49 PM
X
16
GCC Real Estate
Abu Dhabi Residential Rental Growth and Pre-crisis levels
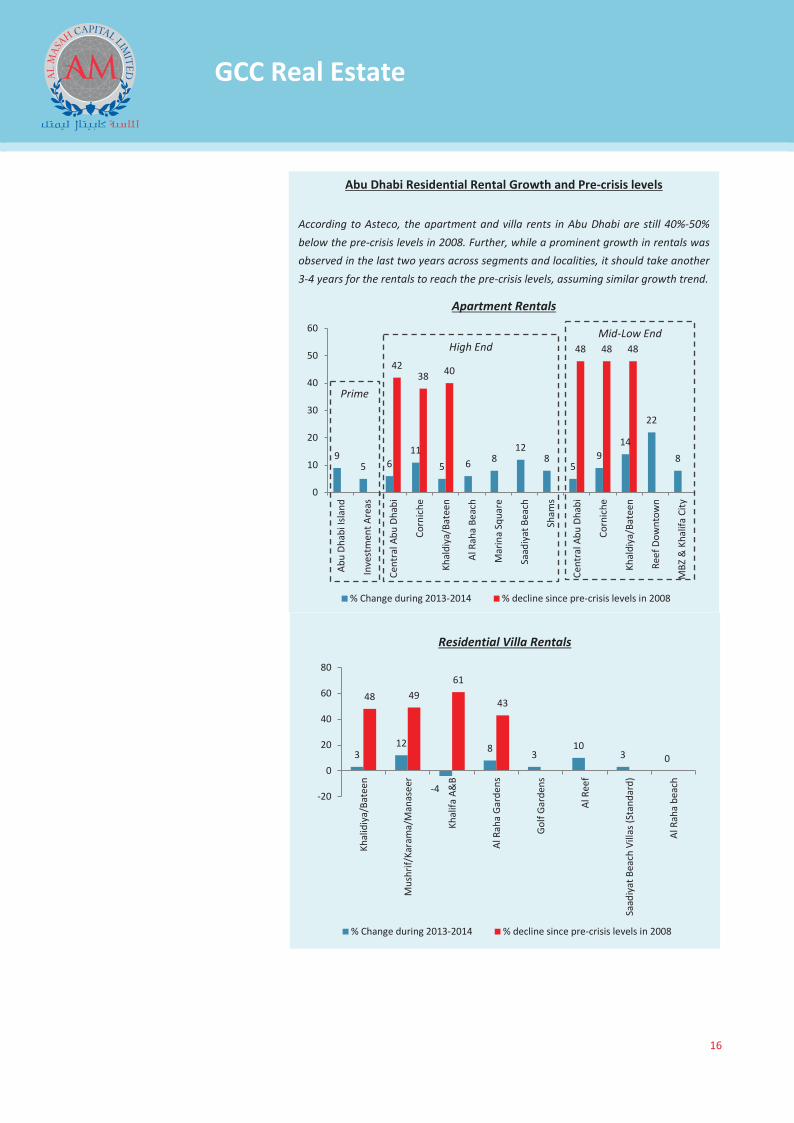
According to Asteco, the apartment and villa rents in Abu Dhabi are still 40%-50% below the pre-crisis levels in 2008. Further, while a prominent growth in rentals was observed in the last two years across segments and localities, it should take another 3-4 years for the rentals to reach the pre-crisis levels, assuming similar growth trend.
Apartment Rentals
9 5 6
11 5 6 8
12 8
5 9
14
22
8
42 38 40
48 48 48
0
10
20
30
40
50
60Ab
u Dh
abi I
sland
Inve
stm
ent A
reas
Cent
ral A
bu D
habi
Corn
iche
Khal
diya
/Bat
een
Al R
aha
Beac
h
Mar
ina
Squa
re
Saad
iyat
Bea
ch
Sham
s
Cent
ral A
bu D
habi
Corn
iche
Khal
diya
/Bat
een
Reef
Dow
ntow
n
MBZ
& K
halif
a Ci
ty
% Change during 2013-2014 % decline since pre-crisis levels in 2008
Prime
High End Mid-Low End
Residential Villa Rentals
3 12
-4
8 3 10
3 0
48 49 61
43
-20
0
20
40
60
80
Khal
idiy
a/Ba
teen
Mus
hrif/
Kara
ma/
Man
asee
r
Khal
ifa A
&B
Al R
aha
Gard
ens
Golf
Gard
ens
Al R
eef
Saad
iyat
Bea
ch V
illas
(Sta
ndar
d)
Al R
aha
beac
h
% Change during 2013-2014 % decline since pre-crisis levels in 2008
GCC Real Estate Sector Report_V3.indd 16GCC Real Estate Sector Report_V3.indd 16 11/10/15 6:49 PM11/10/15 6:49 PM
X
17
GCC Real Estate
Dubai Residential Apartment Rental Growth and Pre-crisis levels
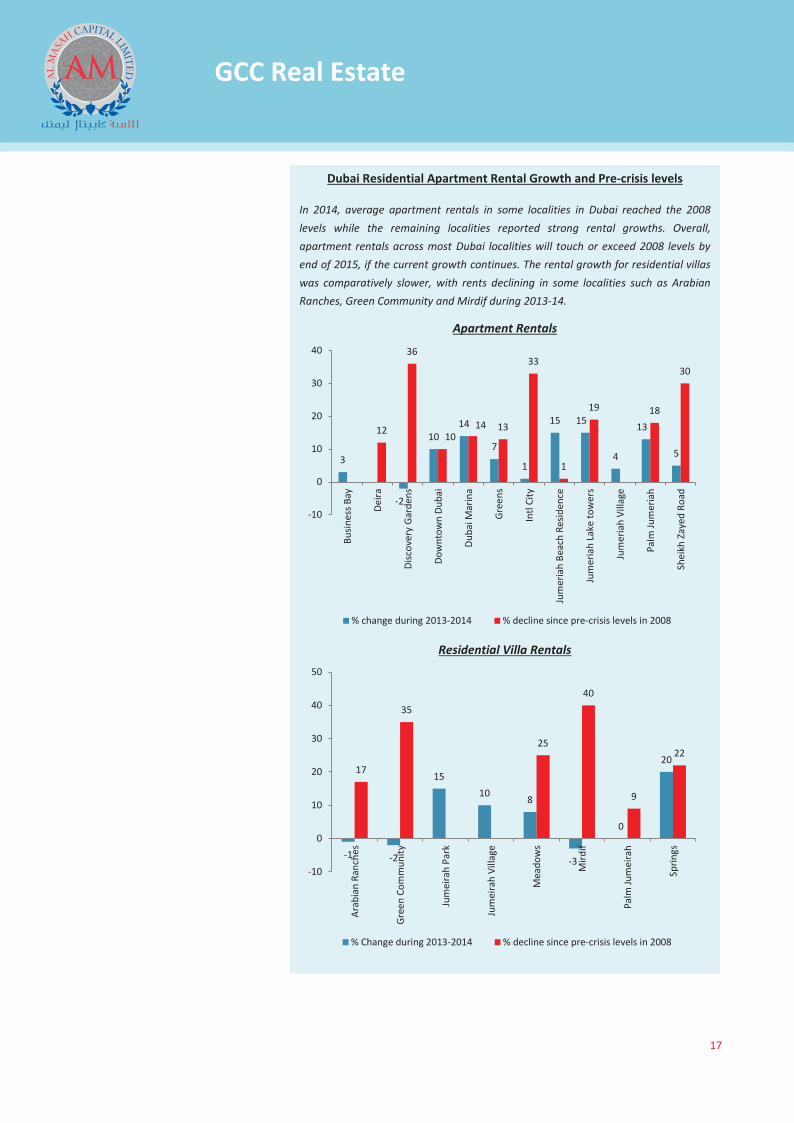
In 2014, average apartment rentals in some localities in Dubai reached the 2008 levels while the remaining localities reported strong rental growths. Overall, apartment rentals across most Dubai localities will touch or exceed 2008 levels by end of 2015, if the current growth continues. The rental growth for residential villas was comparatively slower, with rents declining in some localities such as Arabian Ranches, Green Community and Mirdif during 2013-14.
Apartment Rentals
3
-2
10 14
7
1
15 15
4
13
5
12
36
10 14 13
33
1
19 18
30
-10
0
10
20
30
40Bu
sines
s Bay
Deira
Disc
over
y Ga
rden
s
Dow
ntow
n Du
bai
Duba
i Mar
ina
Gree
ns
Intl
City
Jum
eria
h Be
ach
Resid
ence
Jum
eria
h La
ke to
wer
s
Jum
eria
h Vi
llage
Palm
Jum
eria
h
Shei
kh Z
ayed
Roa
d
% change during 2013-2014 % decline since pre-crisis levels in 2008
Residential Villa Rentals
-1 -2
15 10 8
-3
0
20 17
35
25
40
9
22
-10
0
10
20
30
40
50
Arab
ian
Ranc
hes
Gree
n Co
mm
unity
Jum
eira
h Pa
rk
Jum
eira
h Vi
llage
Mea
dow
s
Mird
if
Palm
Jum
eira
h
Sprin
gs
% Change during 2013-2014 % decline since pre-crisis levels in 2008
GCC Real Estate Sector Report_V3.indd 17GCC Real Estate Sector Report_V3.indd 17 11/10/15 6:49 PM11/10/15 6:49 PM
X
18
GCC Real Estate
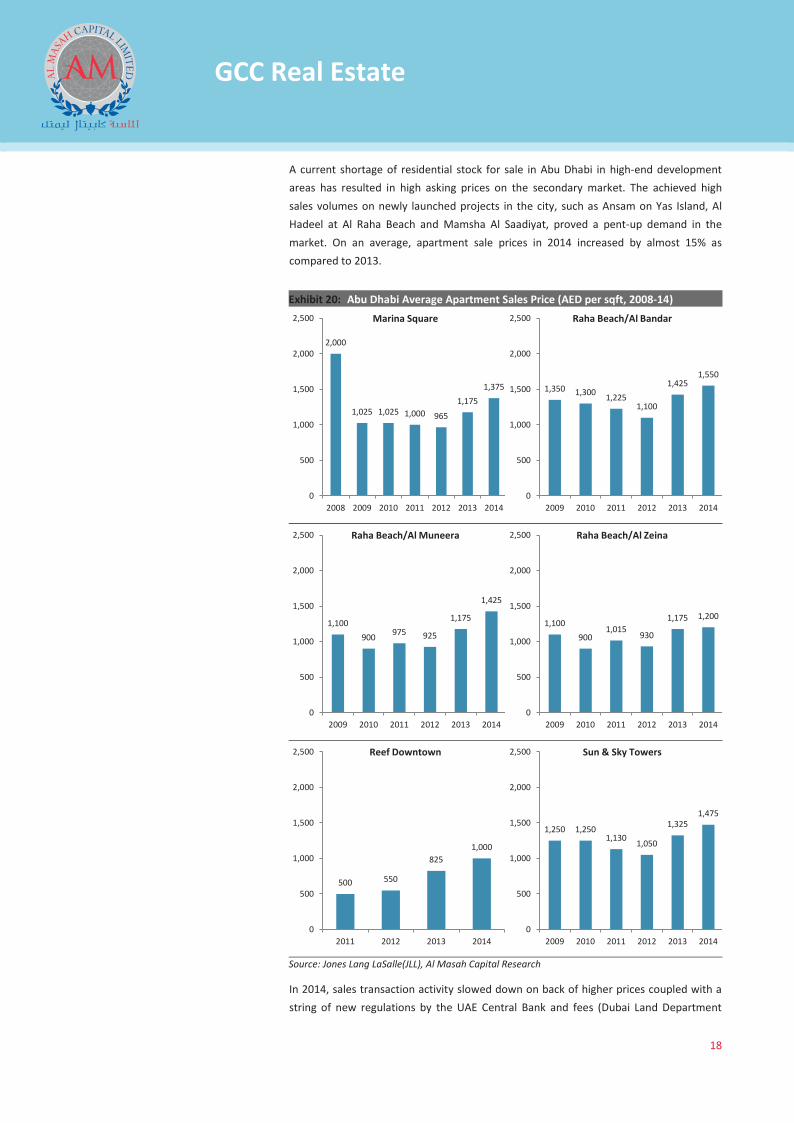
A current shortage of residential stock for sale in Abu Dhabi in high-end development areas has resulted in high asking prices on the secondary market. The achieved high sales volumes on newly launched projects in the city, such as Ansam on Yas Island, Al Hadeel at Al Raha Beach and Mamsha Al Saadiyat, proved a pent-up demand in the market. On an average, apartment sale prices in 2014 increased by almost 15% as compared to 2013.
Exhibit 20: Abu Dhabi Average Apartment Sales Price (AED per sqft, 2008-14)
Source: Jones Lang LaSalle(JLL), Al Masah Capital Research
In 2014, sales transaction activity slowed down on back of higher prices coupled with a string of new regulations by the UAE Central Bank and fees (Dubai Land Department
2,000
1,025 1,025 1,000 965
1,175 1,375
0
500
1,000
1,500
2,000
2,500
2008 2009 2010 2011 2012 2013 2014
Marina Square
1,350 1,300 1,225 1,100
1,425 1,550
0
500
1,000
1,500
2,000
2,500
2009 2010 2011 2012 2013 2014
Raha Beach/Al Bandar
1,100 900 975 925
1,175
1,425
0
500
1,000
1,500
2,000
2,500
2009 2010 2011 2012 2013 2014
Raha Beach/Al Muneera
1,100 900
1,015 930
1,175 1,200
0
500
1,000
1,500
2,000
2,500
2009 2010 2011 2012 2013 2014
Raha Beach/Al Zeina
500 550
825 1,000
0
500
1,000
1,500
2,000
2,500
2011 2012 2013 2014
Reef Downtown
1,250 1,250 1,130 1,050
1,325 1,475
0
500
1,000
1,500
2,000
2,500
2009 2010 2011 2012 2013 2014
Sun & Sky Towers
GCC Real Estate Sector Report_V3.indd 18GCC Real Estate Sector Report_V3.indd 18 11/10/15 6:49 PM11/10/15 6:49 PM
X
19
GCC Real Estate
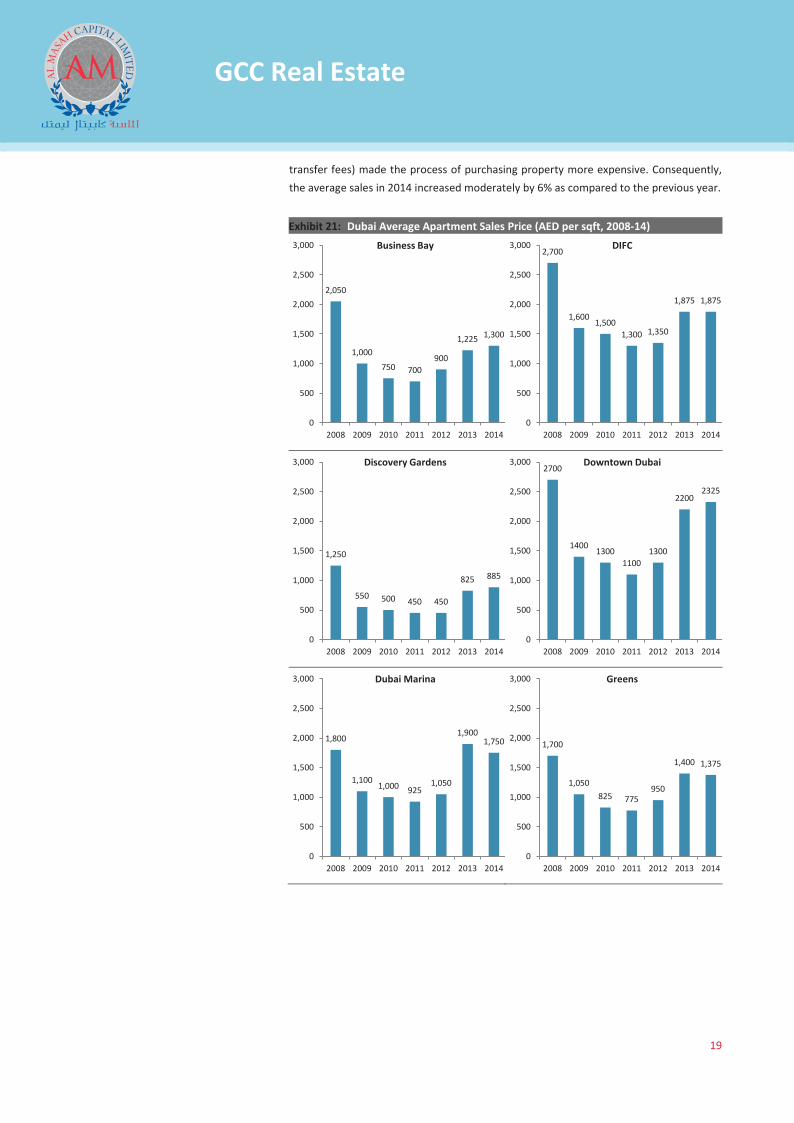
transfer fees) made the process of purchasing property more expensive. Consequently, the average sales in 2014 increased moderately by 6% as compared to the previous year.
Exhibit 21: Dubai Average Apartment Sales Price (AED per sqft, 2008-14)
2,050
1,000
750 700 900
1,225 1,300
0
500
1,000
1,500
2,000
2,500
3,000
2008 2009 2010 2011 2012 2013 2014
Business Bay 2,700
1,600 1,500
1,300 1,350
1,875 1,875
0
500
1,000
1,500
2,000
2,500
3,000
2008 2009 2010 2011 2012 2013 2014
DIFC
1,250
550 500 450 450
825 885
0
500
1,000
1,500
2,000
2,500
3,000
2008 2009 2010 2011 2012 2013 2014
Discovery Gardens 2700
1400 1300
1100 1300
2200 2325
0
500
1,000
1,500
2,000
2,500
3,000
2008 2009 2010 2011 2012 2013 2014
Downtown Dubai
1,800
1,100 1,000 925
1,050
1,900 1,750
0
500
1,000
1,500
2,000
2,500
3,000
2008 2009 2010 2011 2012 2013 2014
Dubai Marina
1,700
1,050 825 775
950
1,400 1,375
0
500
1,000
1,500
2,000
2,500
3,000
2008 2009 2010 2011 2012 2013 2014
Greens
GCC Real Estate Sector Report_V3.indd 19GCC Real Estate Sector Report_V3.indd 19 11/10/15 6:49 PM11/10/15 6:49 PM
X
20
GCC Real Estate
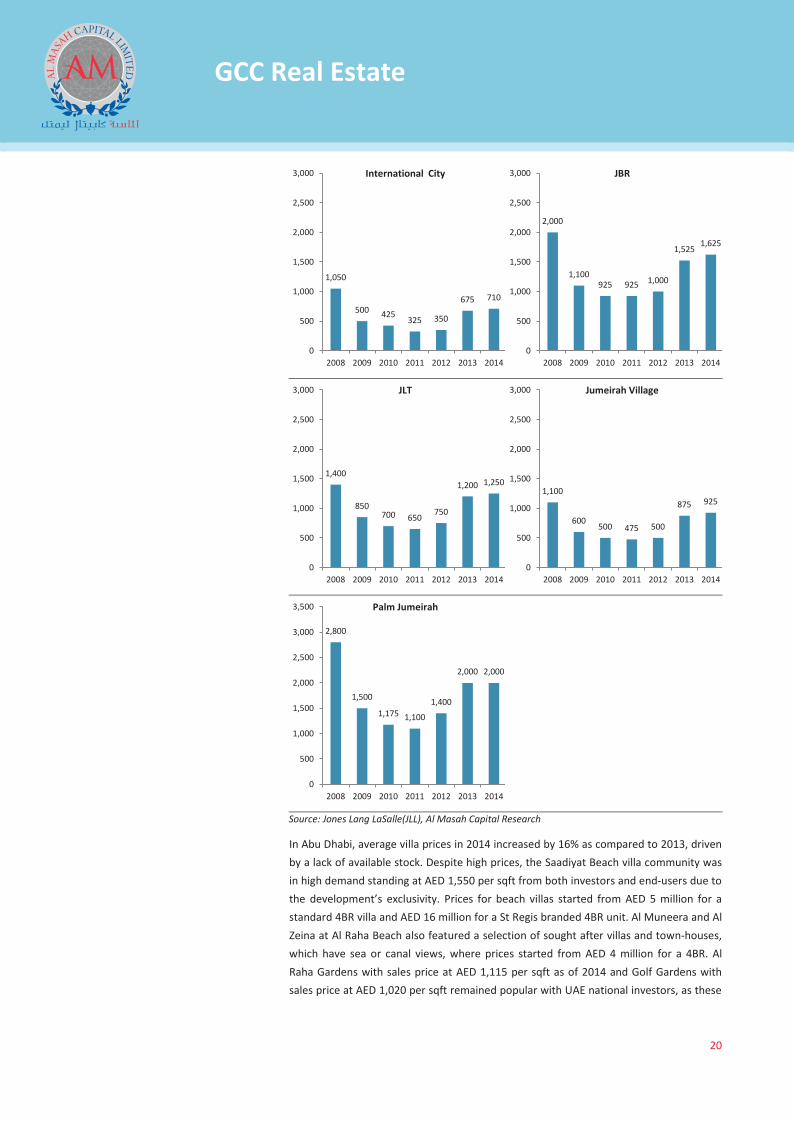
Source: Jones Lang LaSalle(JLL), Al Masah Capital Research
In Abu Dhabi, average villa prices in 2014 increased by 16% as compared to 2013, driven by a lack of available stock. Despite high prices, the Saadiyat Beach villa community was in high demand standing at AED 1,550 per sqft from both investors and end-users due to the development’s exclusivity. Prices for beach villas started from AED 5 million for a standard 4BR villa and AED 16 million for a St Regis branded 4BR unit. Al Muneera and Al Zeina at Al Raha Beach also featured a selection of sought after villas and town-houses, which have sea or canal views, where prices started from AED 4 million for a 4BR. Al Raha Gardens with sales price at AED 1,115 per sqft as of 2014 and Golf Gardens with sales price at AED 1,020 per sqft remained popular with UAE national investors, as these
1,050
500 425 325 350
675 710
0
500
1,000
1,500
2,000
2,500
3,000
2008 2009 2010 2011 2012 2013 2014
International City
2,000
1,100 925 925 1,000
1,525 1,625
0
500
1,000
1,500
2,000
2,500
3,000
2008 2009 2010 2011 2012 2013 2014
JBR
1,400
850 700 650
750
1,200 1,250
0
500
1,000
1,500
2,000
2,500
3,000
2008 2009 2010 2011 2012 2013 2014
JLT
1,100
600 500 475 500
875 925
0
500
1,000
1,500
2,000
2,500
3,000
2008 2009 2010 2011 2012 2013 2014
Jumeirah Village
2,800
1,500
1,175 1,100
1,400
2,000 2,000
0
500
1,000
1,500
2,000
2,500
3,000
3,500
2008 2009 2010 2011 2012 2013 2014
Palm Jumeirah
GCC Real Estate Sector Report_V3.indd 20GCC Real Estate Sector Report_V3.indd 20 11/10/15 6:49 PM11/10/15 6:49 PM
X
21
GCC Real Estate
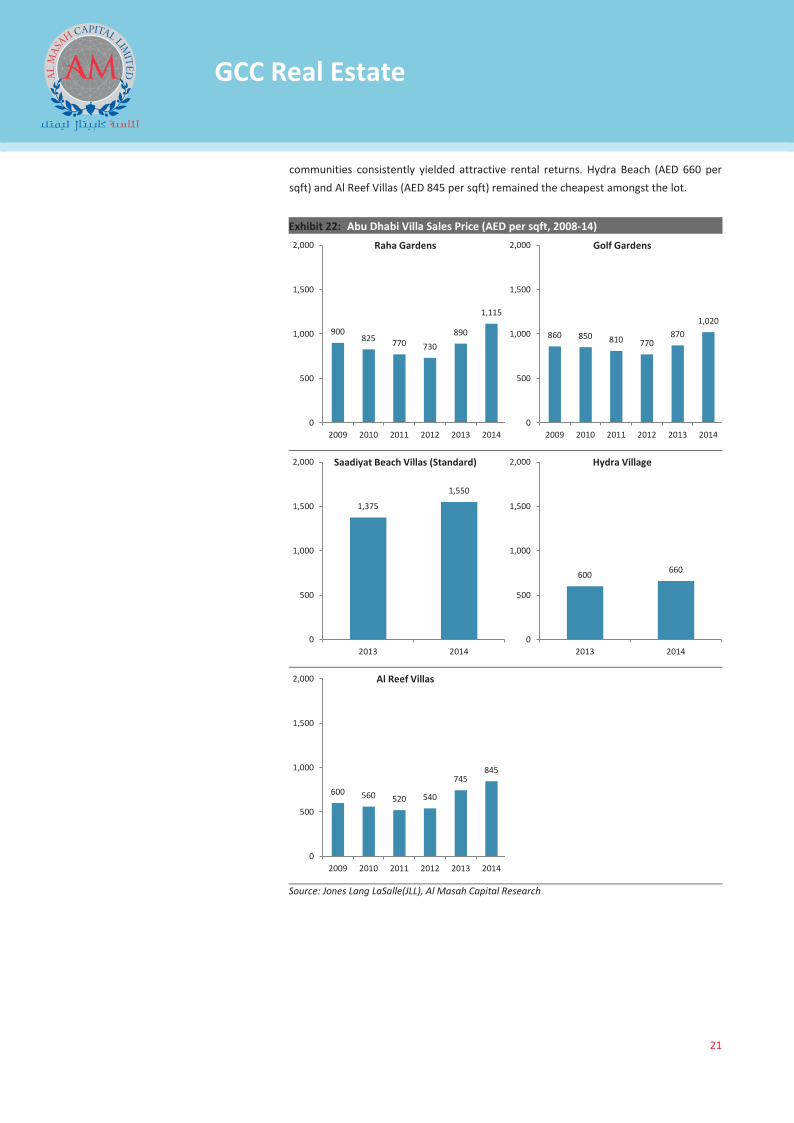
communities consistently yielded attractive rental returns. Hydra Beach (AED 660 per sqft) and Al Reef Villas (AED 845 per sqft) remained the cheapest amongst the lot.
Exhibit 22: Abu Dhabi Villa Sales Price (AED per sqft, 2008-14)
Source: Jones Lang LaSalle(JLL), Al Masah Capital Research
900 825 770 730
890
1,115
0
500
1,000
1,500
2,000
2009 2010 2011 2012 2013 2014
Raha Gardens
860 850 810 770 870
1,020
0
500
1,000
1,500
2,000
2009 2010 2011 2012 2013 2014
Golf Gardens
1,375
1,550
0
500
1,000
1,500
2,000
2013 2014
Saadiyat Beach Villas (Standard)
600 660
0
500
1,000
1,500
2,000
2013 2014
Hydra Village
600 560 520 540
745 845
0
500
1,000
1,500
2,000
2009 2010 2011 2012 2013 2014
Al Reef Villas
GCC Real Estate Sector Report_V3.indd 21GCC Real Estate Sector Report_V3.indd 21 11/10/15 6:49 PM11/10/15 6:49 PM
X
22
GCC Real Estate
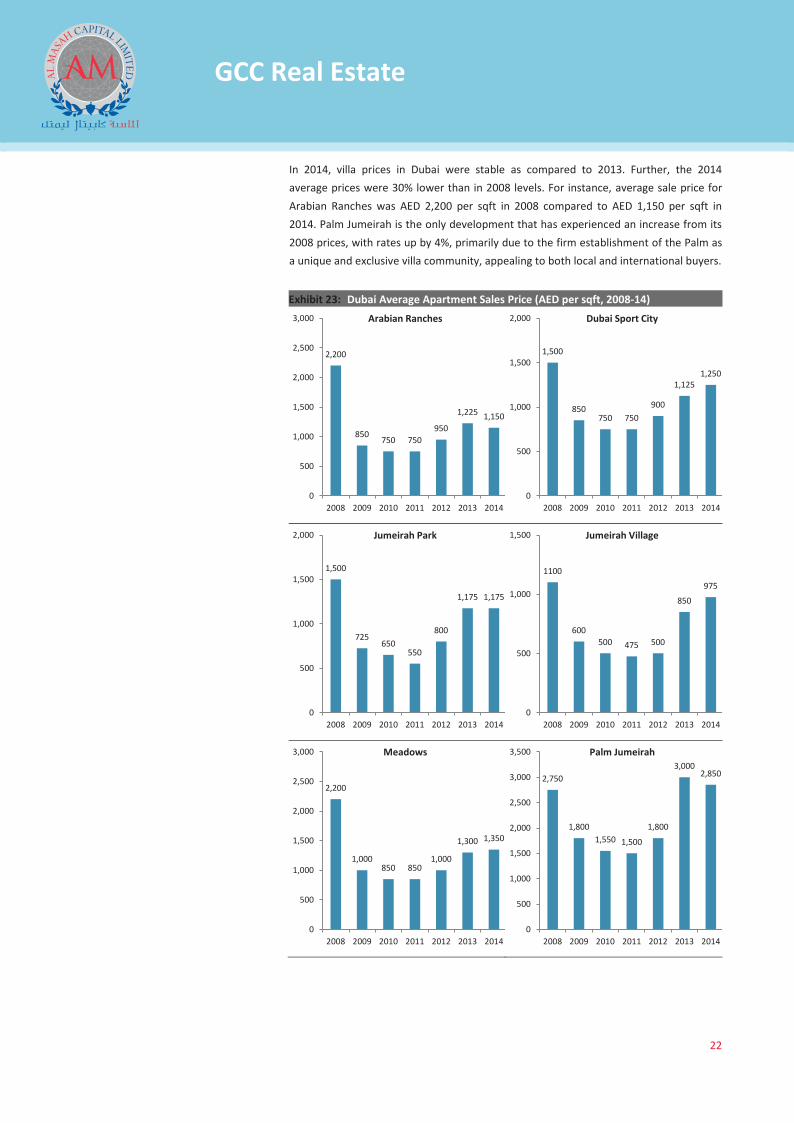
In 2014, villa prices in Dubai were stable as compared to 2013. Further, the 2014 average prices were 30% lower than in 2008 levels. For instance, average sale price for Arabian Ranches was AED 2,200 per sqft in 2008 compared to AED 1,150 per sqft in 2014. Palm Jumeirah is the only development that has experienced an increase from its 2008 prices, with rates up by 4%, primarily due to the firm establishment of the Palm as a unique and exclusive villa community, appealing to both local and international buyers.
Exhibit 23: Dubai Average Apartment Sales Price (AED per sqft, 2008-14)
2,200
850 750 750
950
1,225 1,150
0
500
1,000
1,500
2,000
2,500
3,000
2008 2009 2010 2011 2012 2013 2014
Arabian Ranches
1,500
850 750 750
900
1,125 1,250
0
500
1,000
1,500
2,000
2008 2009 2010 2011 2012 2013 2014
Dubai Sport City
1,500
725 650
550
800
1,175 1,175
0
500
1,000
1,500
2,000
2008 2009 2010 2011 2012 2013 2014
Jumeirah Park
1100
600 500 475 500
850
975
0
500
1,000
1,500
2008 2009 2010 2011 2012 2013 2014
Jumeirah Village
2,200
1,000 850 850
1,000
1,300 1,350
0
500
1,000
1,500
2,000
2,500
3,000
2008 2009 2010 2011 2012 2013 2014
Meadows
2,750
1,800 1,550 1,500
1,800
3,000 2,850
0
500
1,000
1,500
2,000
2,500
3,000
3,500
2008 2009 2010 2011 2012 2013 2014
Palm Jumeirah
GCC Real Estate Sector Report_V3.indd 22GCC Real Estate Sector Report_V3.indd 22 11/10/15 6:49 PM11/10/15 6:49 PM
X
23
GCC Real Estate
Source: Jones Lang LaSalle(JLL), Al Masah Capital Research
Some of the major ongoing residential projects in the UAE include: The Desert Rose City (Dubai), Al Falah (Abu Dhabi), Habtoor City - Residential Towers (Duabi), North Wathba Development (Abu Dhabi), The Residences at The Marina (Dubai) and DAMAC Towers by Paramount (Duabi).
UAE Retail Market
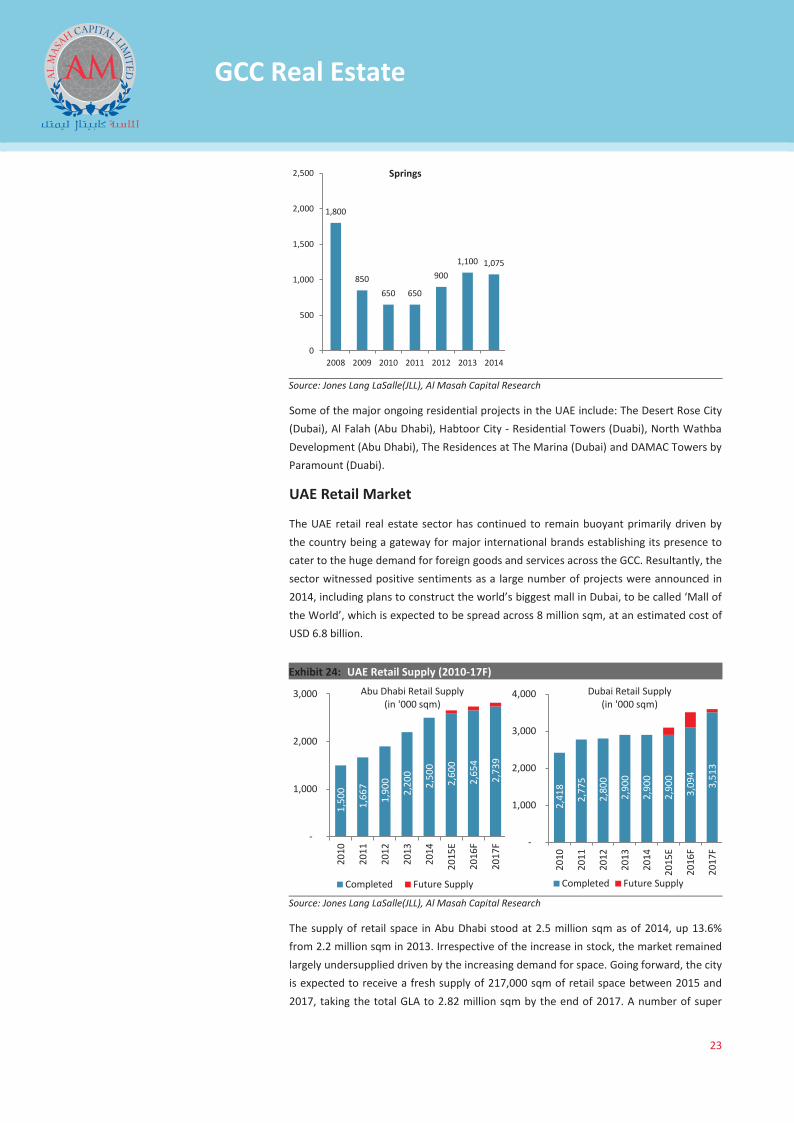
The UAE retail real estate sector has continued to remain buoyant primarily driven by the country being a gateway for major international brands establishing its presence to cater to the huge demand for foreign goods and services across the GCC. Resultantly, the sector witnessed positive sentiments as a large number of projects were announced in 2014, including plans to construct the world’s biggest mall in Dubai, to be called ‘Mall of the World’, which is expected to be spread across 8 million sqm, at an estimated cost of USD 6.8 billion.
Exhibit 24: UAE Retail Supply (2010-17F)
Source: Jones Lang LaSalle(JLL), Al Masah Capital Research
The supply of retail space in Abu Dhabi stood at 2.5 million sqm as of 2014, up 13.6% from 2.2 million sqm in 2013. Irrespective of the increase in stock, the market remained largely undersupplied driven by the increasing demand for space. Going forward, the city is expected to receive a fresh supply of 217,000 sqm of retail space between 2015 and 2017, taking the total GLA to 2.82 million sqm by the end of 2017. A number of super
1,800
850 650 650
900 1,100 1,075
0
500
1,000
1,500
2,000
2,500
2008 2009 2010 2011 2012 2013 2014
Springs
1,5
00
1,6
67
1,9
00
2,2
00
2,5
00
2,6
00
2,6
54
2,7
39
-
1,000
2,000
3,000
2010
2011
2012
2013
2014
2015
E
2016
F
2017
F
Completed Future Supply
Abu Dhabi Retail Supply (in '000 sqm)
2,4
18
2,7
75
2,8
00
2,9
00
2,9
00
2,9
00
3,0
94
3,5
13
-
1,000
2,000
3,000
4,000
2010
2011
2012
2013
2014
2015
E
2016
F
2017
F
Completed Future Supply
Dubai Retail Supply (in '000 sqm)
GCC Real Estate Sector Report_V3.indd 23GCC Real Estate Sector Report_V3.indd 23 11/10/15 6:49 PM11/10/15 6:49 PM
X
24
GCC Real Estate
regional malls are scheduled to enter the market from 2018, which are expected to substantially increase Abu Dhabi’s retail supply in the medium to long term. The release of new high-end retail space into the market in the coming years is likely to push some of Abu Dhabi’s older malls and shopping centers to maintain their profile in the face of increased competition. As a result, some established malls could lower their rents or seek to lock in key retailers through longer-term agreements to avoid any shift to the new developments.
Dubai being the favorite destination for global retailers to establish their presence in the GCC, faces the challenge of shortage in available retail space with the market remaining undersupplied in 2014 as it received little to no addition to its retail space during the year. The total supply of retail space in the city remained unchanged in 2014 from the preceding year at 2.9 million sqm. However, with a host of new projects being announced, the city is expected to receive new stock of 194,000 sqm in 2015. The supply of retail space in Dubai is expected to reach approximately 3.6 million by the end of 2017, growing at a CAGR of 7.79% between 2015 and 2017.
Exhibit 25: UAE Retail Vacancy Rates (2010-15)
Source: Jones Lang LaSalle(JLL), Al Masah Capital Research
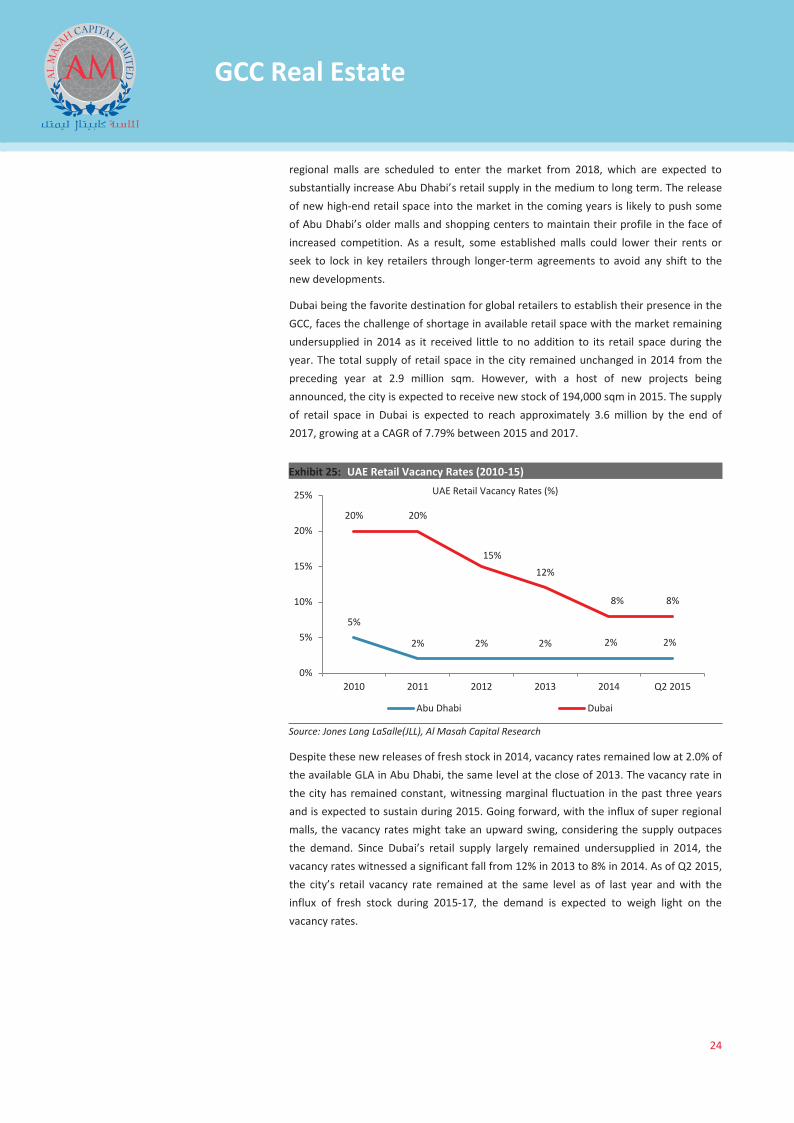
Despite these new releases of fresh stock in 2014, vacancy rates remained low at 2.0% of the available GLA in Abu Dhabi, the same level at the close of 2013. The vacancy rate in the city has remained constant, witnessing marginal fluctuation in the past three years and is expected to sustain during 2015. Going forward, with the influx of super regional malls, the vacancy rates might take an upward swing, considering the supply outpaces the demand. Since Dubai’s retail supply largely remained undersupplied in 2014, the vacancy rates witnessed a significant fall from 12% in 2013 to 8% in 2014. As of Q2 2015, the city’s retail vacancy rate remained at the same level as of last year and with the influx of fresh stock during 2015-17, the demand is expected to weigh light on the vacancy rates.
5%
2% 2% 2% 2% 2%
20% 20%
15%
12%
8% 8%
0%
5%
10%
15%
20%
25%
2010 2011 2012 2013 2014 Q2 2015
Abu Dhabi Dubai
UAE Retail Vacancy Rates (%)
GCC Real Estate Sector Report_V3.indd 24GCC Real Estate Sector Report_V3.indd 24 11/10/15 6:49 PM11/10/15 6:49 PM
X
25
GCC Real Estate
Exhibit 26: UAE Retail Rentals (2010-14)
Source: Jones Lang LaSalle(JLL), Al Masah Capital Research
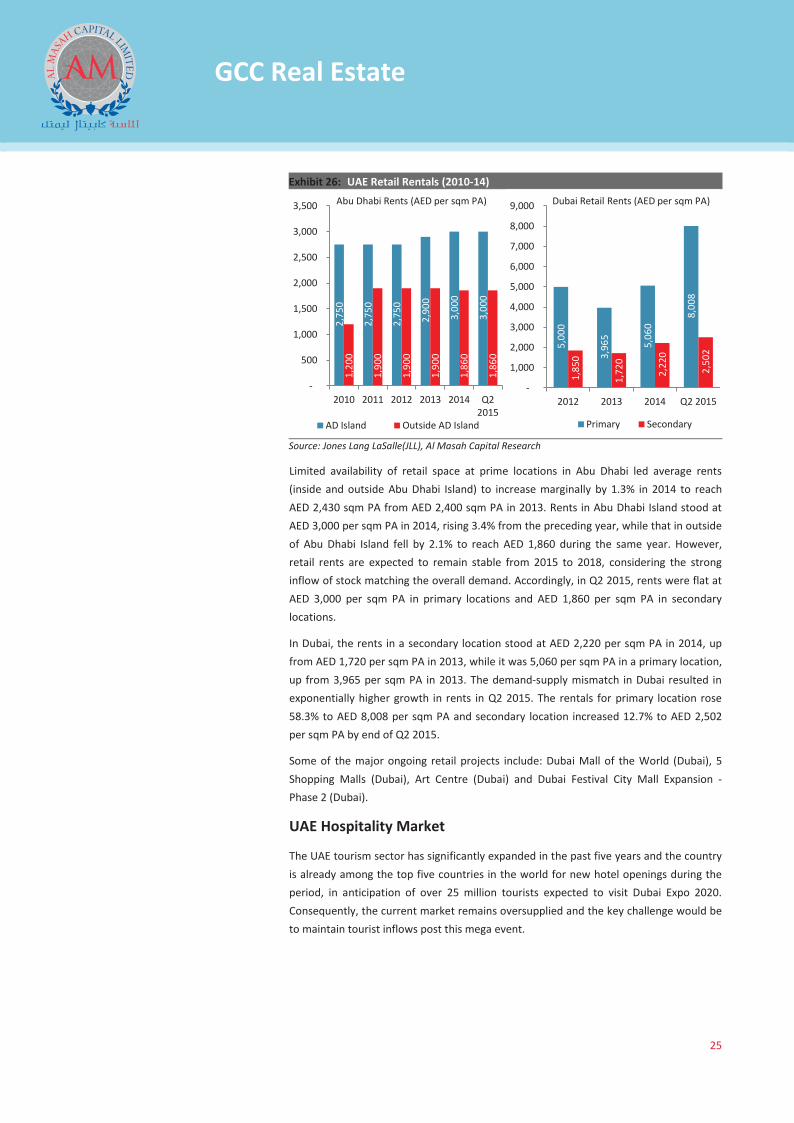
Limited availability of retail space at prime locations in Abu Dhabi led average rents (inside and outside Abu Dhabi Island) to increase marginally by 1.3% in 2014 to reach AED 2,430 sqm PA from AED 2,400 sqm PA in 2013. Rents in Abu Dhabi Island stood at AED 3,000 per sqm PA in 2014, rising 3.4% from the preceding year, while that in outside of Abu Dhabi Island fell by 2.1% to reach AED 1,860 during the same year. However, retail rents are expected to remain stable from 2015 to 2018, considering the strong inflow of stock matching the overall demand. Accordingly, in Q2 2015, rents were flat at AED 3,000 per sqm PA in primary locations and AED 1,860 per sqm PA in secondary locations.
In Dubai, the rents in a secondary location stood at AED 2,220 per sqm PA in 2014, up from AED 1,720 per sqm PA in 2013, while it was 5,060 per sqm PA in a primary location, up from 3,965 per sqm PA in 2013. The demand-supply mismatch in Dubai resulted in exponentially higher growth in rents in Q2 2015. The rentals for primary location rose 58.3% to AED 8,008 per sqm PA and secondary location increased 12.7% to AED 2,502 per sqm PA by end of Q2 2015.
Some of the major ongoing retail projects include: Dubai Mall of the World (Dubai), 5 Shopping Malls (Dubai), Art Centre (Dubai) and Dubai Festival City Mall Expansion - Phase 2 (Dubai).
UAE Hospitality Market
The UAE tourism sector has significantly expanded in the past five years and the country is already among the top five countries in the world for new hotel openings during the period, in anticipation of over 25 million tourists expected to visit Dubai Expo 2020. Consequently, the current market remains oversupplied and the key challenge would be to maintain tourist inflows post this mega event.
2,7
50
2,7
50
2,7
50
2,9
00
3,0
00
3,0
00
1,20
0
1,90
0
1,90
0
1,90
0
1,86
0
1,86
0
-
500
1,000
1,500
2,000
2,500
3,000
3,500
2010 2011 2012 2013 2014 Q22015
AD Island Outside AD Island
Abu Dhabi Rents (AED per sqm PA)
5,0
00
3,9
65
5,0
60 8
,008
1,8
50
1,7
20
2,2
20
2,5
02
-
1,000
2,000
3,000
4,000
5,000
6,000
7,000
8,000
9,000
2012 2013 2014 Q2 2015
Primary Secondary
Dubai Retail Rents (AED per sqm PA)
GCC Real Estate Sector Report_V3.indd 25GCC Real Estate Sector Report_V3.indd 25 11/10/15 6:49 PM11/10/15 6:49 PM
X
26
GCC Real Estate
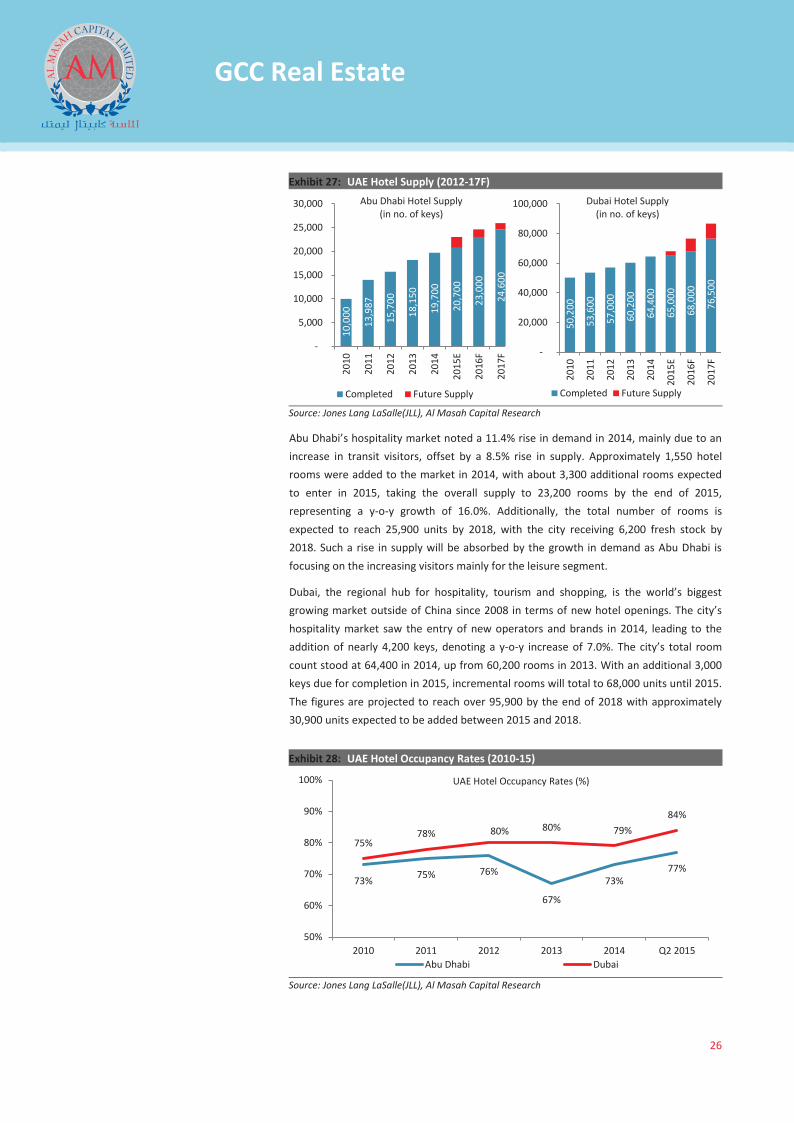
Exhibit 27: UAE Hotel Supply (2012-17F)
Source: Jones Lang LaSalle(JLL), Al Masah Capital Research
Abu Dhabi’s hospitality market noted a 11.4% rise in demand in 2014, mainly due to an increase in transit visitors, offset by a 8.5% rise in supply. Approximately 1,550 hotel rooms were added to the market in 2014, with about 3,300 additional rooms expected to enter in 2015, taking the overall supply to 23,200 rooms by the end of 2015, representing a y-o-y growth of 16.0%. Additionally, the total number of rooms is expected to reach 25,900 units by 2018, with the city receiving 6,200 fresh stock by 2018. Such a rise in supply will be absorbed by the growth in demand as Abu Dhabi is focusing on the increasing visitors mainly for the leisure segment.
Dubai, the regional hub for hospitality, tourism and shopping, is the world’s biggest growing market outside of China since 2008 in terms of new hotel openings. The city’s hospitality market saw the entry of new operators and brands in 2014, leading to the addition of nearly 4,200 keys, denoting a y-o-y increase of 7.0%. The city’s total room count stood at 64,400 in 2014, up from 60,200 rooms in 2013. With an additional 3,000 keys due for completion in 2015, incremental rooms will total to 68,000 units until 2015. The figures are projected to reach over 95,900 by the end of 2018 with approximately 30,900 units expected to be added between 2015 and 2018.
Exhibit 28: UAE Hotel Occupancy Rates (2010-15)
Source: Jones Lang LaSalle(JLL), Al Masah Capital Research
10,
000
13,
987
15,
700
18,
150
19,
700
20,
700
23,
000
24 ,
600
-
5,000
10,000
15,000
20,000
25,000
30,000
2010
2011
2012
2013
2014
2015
E
2016
F
2017
F
Completed Future Supply
Abu Dhabi Hotel Supply (in no. of keys)
50,
200
53,
600
57,
000
60,
200
64,
400
65,
000
68,
000
76,
500
-
20,000
40,000
60,000
80,000
100,000
2010
2011
2012
2013
2014
2015
E
2016
F
2017
F
Completed Future Supply
Dubai Hotel Supply (in no. of keys)
73% 75% 76%
67%
73% 77%
75% 78% 80% 80% 79%
84%
50%
60%
70%
80%
90%
100%
2010 2011 2012 2013 2014 Q2 2015Abu Dhabi Dubai
UAE Hotel Occupancy Rates (%)
GCC Real Estate Sector Report_V3.indd 26GCC Real Estate Sector Report_V3.indd 26 11/10/15 6:49 PM11/10/15 6:49 PM
X
27
GCC Real Estate
Reaping the government’s efforts to promote tourism, the Abu Dhabi hotel occupancy rate increased to 73% in 2014 from 67% in 2013, denoting a strong performance during the year. In Q1 2015, two major hotels were opened in Abu Dhabi, namely TRYP by Wyndham and the Swiss-Bel hotel Corniche increasing the occupancy rate to 77% as of Q2 2015. On the other hand, Dubai witnessed a marginal fall in occupancy rates to 79% in 2014 from 80% in 2013. However, the occupancy rate was back in track, rising to 84% as of Q2 2015.
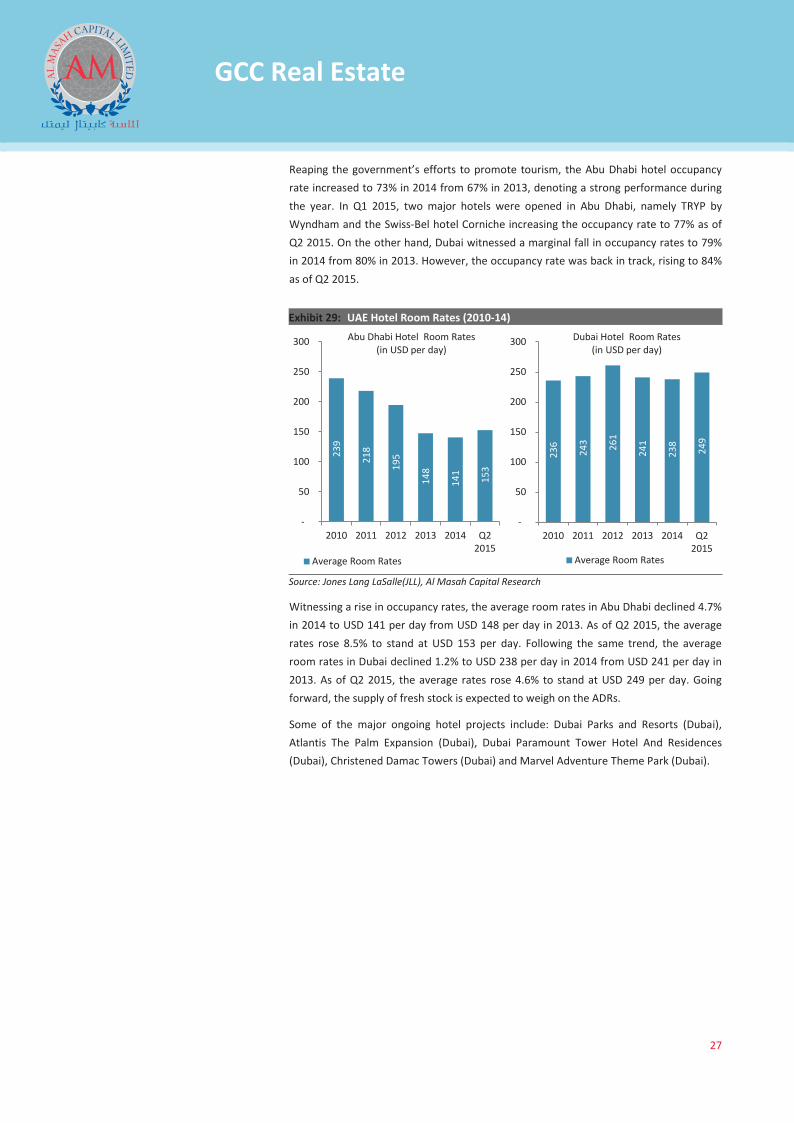
Exhibit 29: UAE Hotel Room Rates (2010-14)
Source: Jones Lang LaSalle(JLL), Al Masah Capital Research
Witnessing a rise in occupancy rates, the average room rates in Abu Dhabi declined 4.7% in 2014 to USD 141 per day from USD 148 per day in 2013. As of Q2 2015, the average rates rose 8.5% to stand at USD 153 per day. Following the same trend, the average room rates in Dubai declined 1.2% to USD 238 per day in 2014 from USD 241 per day in 2013. As of Q2 2015, the average rates rose 4.6% to stand at USD 249 per day. Going forward, the supply of fresh stock is expected to weigh on the ADRs.
Some of the major ongoing hotel projects include: Dubai Parks and Resorts (Dubai), Atlantis The Palm Expansion (Dubai), Dubai Paramount Tower Hotel And Residences (Dubai), Christened Damac Towers (Dubai) and Marvel Adventure Theme Park (Dubai).
239
218
195
148
141
153
-
50
100
150
200
250
300
2010 2011 2012 2013 2014 Q22015
Average Room Rates
Abu Dhabi Hotel Room Rates (in USD per day)
236
243
261
241
238
249
-
50
100
150
200
250
300
2010 2011 2012 2013 2014 Q22015
Average Room Rates
Dubai Hotel Room Rates (in USD per day)
GCC Real Estate Sector Report_V3.indd 27GCC Real Estate Sector Report_V3.indd 27 11/10/15 6:49 PM11/10/15 6:49 PM
X
28
GCC Real Estate
Real Estate Financing
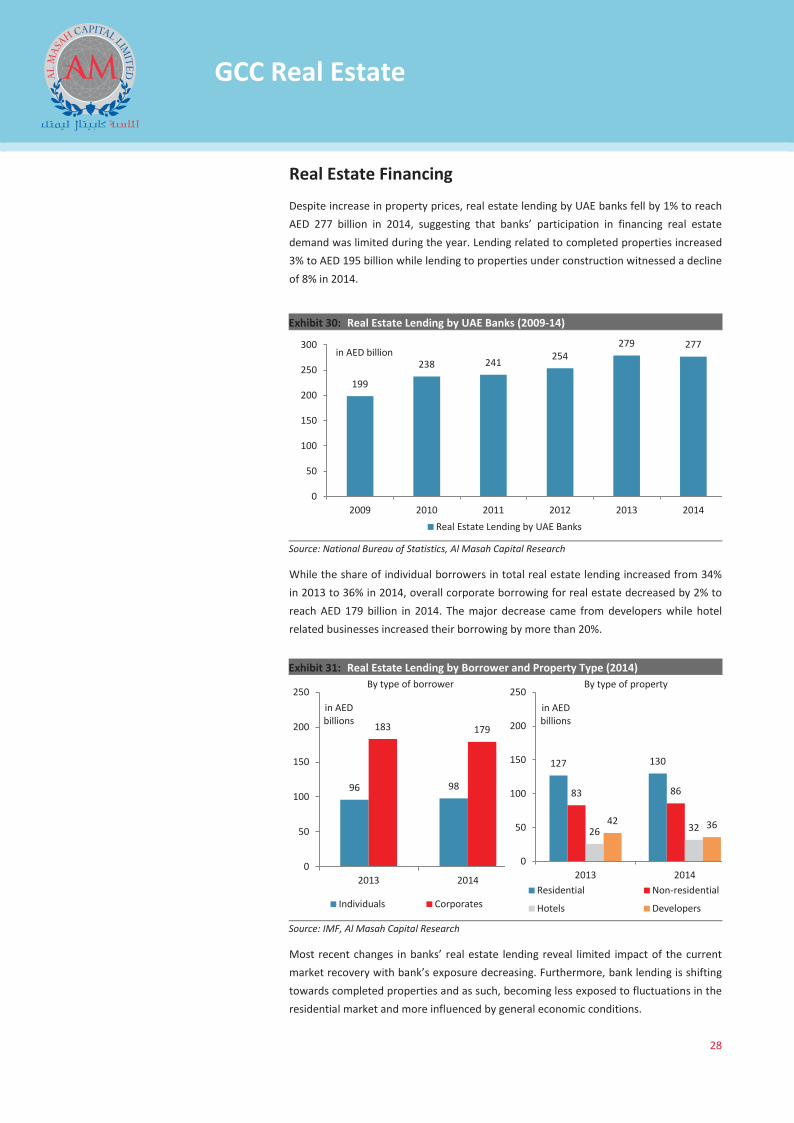
Despite increase in property prices, real estate lending by UAE banks fell by 1% to reach AED 277 billion in 2014, suggesting that banks’ participation in financing real estate demand was limited during the year. Lending related to completed properties increased 3% to AED 195 billion while lending to properties under construction witnessed a decline of 8% in 2014.
Exhibit 30: Real Estate Lending by UAE Banks (2009-14)
Source: National Bureau of Statistics, Al Masah Capital Research
While the share of individual borrowers in total real estate lending increased from 34% in 2013 to 36% in 2014, overall corporate borrowing for real estate decreased by 2% to reach AED 179 billion in 2014. The major decrease came from developers while hotel related businesses increased their borrowing by more than 20%.
Exhibit 31: Real Estate Lending by Borrower and Property Type (2014)
Source: IMF, Al Masah Capital Research
Most recent changes in banks’ real estate lending reveal limited impact of the current market recovery with bank’s exposure decreasing. Furthermore, bank lending is shifting towards completed properties and as such, becoming less exposed to fluctuations in the residential market and more influenced by general economic conditions.
199
238 241 254 279 277
0
50
100
150
200
250
300
2009 2010 2011 2012 2013 2014
in AED billion
Real Estate Lending by UAE Banks
96 98
183 179
0
50
100
150
200
250
2013 2014
in AED billions
By type of borrower
Individuals Corporates
127 130
83 86
26 32 42 36
0
50
100
150
200
250
2013 2014
in AED billions
By type of property
Residential Non-residential
Hotels Developers
GCC Real Estate Sector Report_V3.indd 28GCC Real Estate Sector Report_V3.indd 28 11/10/15 6:49 PM11/10/15 6:49 PM

X
29
GCC Real Estate
Real Estate Market Sentiments
According to the UAE Real Estate Market Sentiment Survey 2015 conducted by YouGov, the Dubai real estate market will continue the growth momentum over the next 12 months – which is perceived across the board by all respondents including real estate professionals, investors and potential home buyers. Nearly 60% of the investors and 69% of the real estate professionals expressed positive sentiments on the growth of real estate market. Surprisingly among the potential home buyers, younger age categories (18 to 24 years) were more optimistic about growth compared to older age groups (40+ years) - 63% and 49% respectively.
Exhibit 32: Real estate market growth in Dubai (2015 Survey by YouGov)
Source: YouGov, Al Masah Capital Research
From the investors' perspective, the focus on real estate in the portfolio mix is set to continue with a slight increase in real estate investments expected (45%) over the year ahead. As a result, distribution among the rest of investors’ portfolio mix is set to remain comparatively much less, among equities (18%), currencies (16%), commodities (16%), funds/indices (13%) and bonds (13%), according to investors interviewed by YouGov.
Exhibit 33: Investors' Current vs Future Portfolio Mix (2015 Survey by YouGov)
Source: YouGov, Al Masah Capital Research
13%
14%
5%
33%
26%
25%
54%
60%
69%
0% 10% 20% 30% 40% 50% 60% 70% 80% 90% 100%
Potential home buyers
Investors
Real estate professionals
Negative Neutral Positive
13%
13%
16%
16%
18%
45%
11%
13%
14%
15%
19%
43%
0% 10% 20% 30% 40% 5
Bonds
Funds/ Indices
Commodities
Currencies
Equities
Real Estate
Current In the next year
GCC Real Estate Sector Report_V3.indd 29GCC Real Estate Sector Report_V3.indd 29 11/10/15 6:49 PM11/10/15 6:49 PM
X
30
GCC Real Estate
SAUDI ARABIA REAL ESTATE
Saudi Arabia Office Market
Business activities in Saudi Arabia remained buoyant in 2014, with major cities such as Riyadh and Jeddah witnessing a substantial rise in stock and fall in vacancy rates. The average office rents (Grade A and Grade B) in Riyadh witnessed a decline during the year on the back of looming oversupply pressures, while that in Jeddah remained strong increasing substantially from the preceding year.
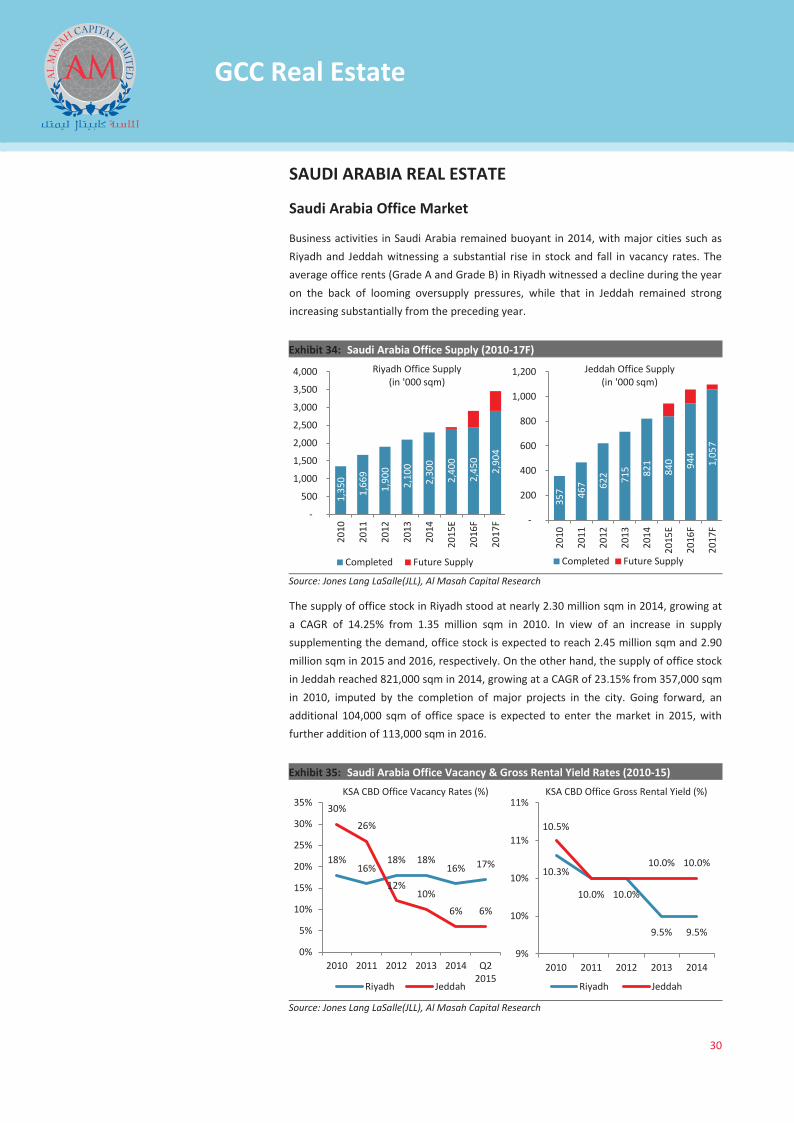
Exhibit 34: Saudi Arabia Office Supply (2010-17F)
Source: Jones Lang LaSalle(JLL), Al Masah Capital Research
The supply of office stock in Riyadh stood at nearly 2.30 million sqm in 2014, growing at a CAGR of 14.25% from 1.35 million sqm in 2010. In view of an increase in supply supplementing the demand, office stock is expected to reach 2.45 million sqm and 2.90 million sqm in 2015 and 2016, respectively. On the other hand, the supply of office stock in Jeddah reached 821,000 sqm in 2014, growing at a CAGR of 23.15% from 357,000 sqm in 2010, imputed by the completion of major projects in the city. Going forward, an additional 104,000 sqm of office space is expected to enter the market in 2015, with further addition of 113,000 sqm in 2016.
Exhibit 35: Saudi Arabia Office Vacancy & Gross Rental Yield Rates (2010-15)
Source: Jones Lang LaSalle(JLL), Al Masah Capital Research
1,3
50
1,6
69
1,9
00
2,1
00
2,3
00
2,4
00
2,4
50
2,9
04
-
500
1,000
1,500
2,000
2,500
3,000
3,500
4,000
2010
2011
2012
2013
2014
2015
E
2016
F
2017
F
Completed Future Supply
Riyadh Office Supply (in '000 sqm)
357
467
622
715
821
840
944
1,0
57
-
200
400
600
800
1,000
1,200
2010
2011
2012
2013
2014
2015
E
2016
F
2017
F
Completed Future Supply
Jeddah Office Supply (in '000 sqm)
18% 16%
18% 18% 16% 17%
30%
26%
12% 10%
6% 6%
0%
5%
10%
15%
20%
25%
30%
35%
2010 2011 2012 2013 2014 Q22015
Riyadh Jeddah
KSA CBD Office Vacancy Rates (%)
10.3%
10.0% 10.0%
9.5% 9.5%
10.5%
10.0% 10.0%
9%
10%
10%
11%
11%
2010 2011 2012 2013 2014
Riyadh Jeddah
KSA CBD Office Gross Rental Yield (%)
GCC Real Estate Sector Report_V3.indd 30GCC Real Estate Sector Report_V3.indd 30 11/10/15 6:49 PM11/10/15 6:49 PM
X
31
GCC Real Estate
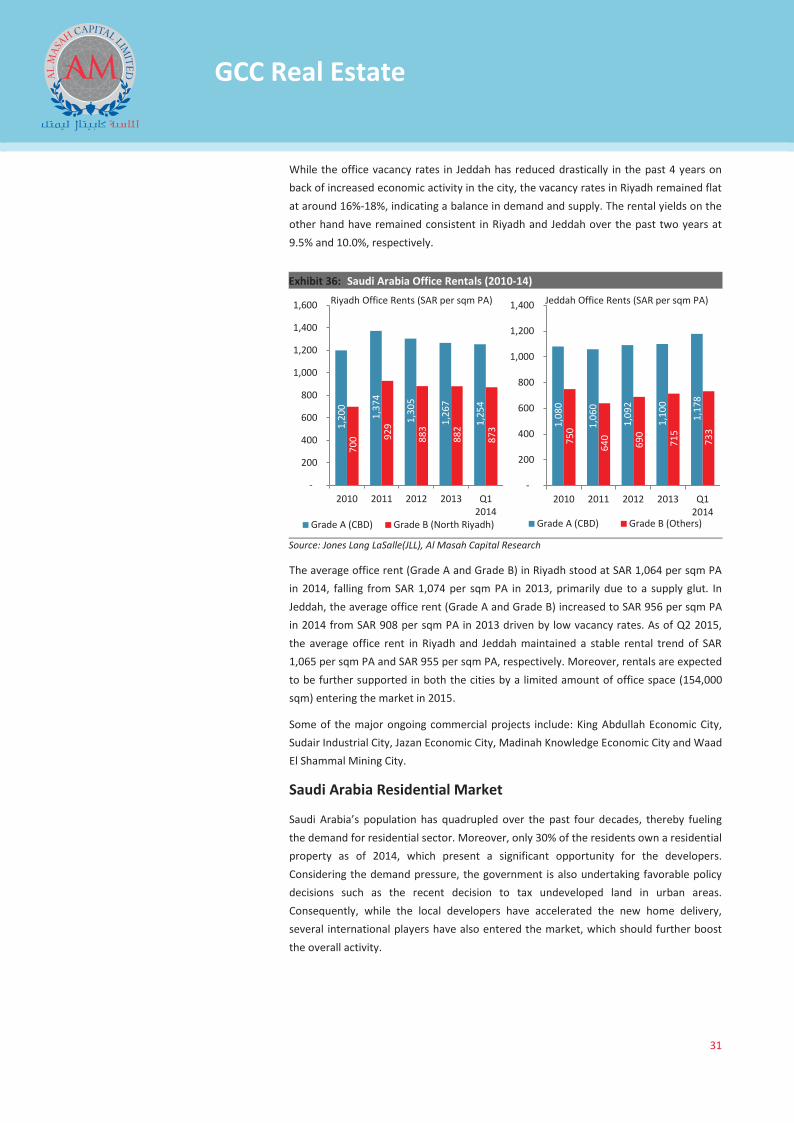
While the office vacancy rates in Jeddah has reduced drastically in the past 4 years on back of increased economic activity in the city, the vacancy rates in Riyadh remained flat at around 16%-18%, indicating a balance in demand and supply. The rental yields on the other hand have remained consistent in Riyadh and Jeddah over the past two years at 9.5% and 10.0%, respectively.
Exhibit 36: Saudi Arabia Office Rentals (2010-14)
Source: Jones Lang LaSalle(JLL), Al Masah Capital Research
The average office rent (Grade A and Grade B) in Riyadh stood at SAR 1,064 per sqm PA in 2014, falling from SAR 1,074 per sqm PA in 2013, primarily due to a supply glut. In Jeddah, the average office rent (Grade A and Grade B) increased to SAR 956 per sqm PA in 2014 from SAR 908 per sqm PA in 2013 driven by low vacancy rates. As of Q2 2015, the average office rent in Riyadh and Jeddah maintained a stable rental trend of SAR 1,065 per sqm PA and SAR 955 per sqm PA, respectively. Moreover, rentals are expected to be further supported in both the cities by a limited amount of office space (154,000 sqm) entering the market in 2015.
Some of the major ongoing commercial projects include: King Abdullah Economic City, Sudair Industrial City, Jazan Economic City, Madinah Knowledge Economic City and Waad El Shammal Mining City.
Saudi Arabia Residential Market
Saudi Arabia’s population has quadrupled over the past four decades, thereby fueling the demand for residential sector. Moreover, only 30% of the residents own a residential property as of 2014, which present a significant opportunity for the developers. Considering the demand pressure, the government is also undertaking favorable policy decisions such as the recent decision to tax undeveloped land in urban areas. Consequently, while the local developers have accelerated the new home delivery, several international players have also entered the market, which should further boost the overall activity.
1,2
00
1,3
74
1,3
05
1,2
67
1,2
54
700
929
883
882
873
-
200
400
600
800
1,000
1,200
1,400
1,600
2010 2011 2012 2013 Q12014
Grade A (CBD) Grade B (North Riyadh)
Riyadh Office Rents (SAR per sqm PA)
1,0
80
1,0
60
1,0
92
1,1
00
1,1
78
750
640
690
715
733
-
200
400
600
800
1,000
1,200
1,400
2010 2011 2012 2013 Q12014
Grade A (CBD) Grade B (Others)
Jeddah Office Rents (SAR per sqm PA)
GCC Real Estate Sector Report_V3.indd 31GCC Real Estate Sector Report_V3.indd 31 11/10/15 6:49 PM11/10/15 6:49 PM
X
32
GCC Real Estate
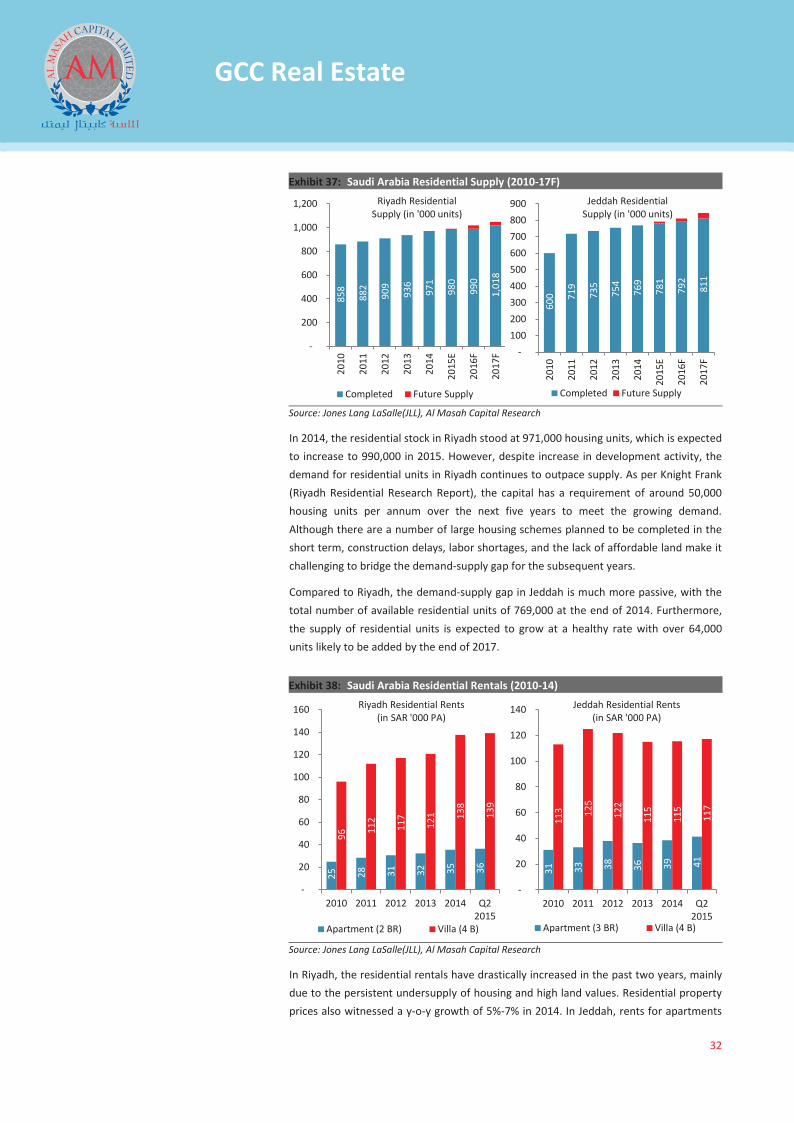
Exhibit 37: Saudi Arabia Residential Supply (2010-17F)
Source: Jones Lang LaSalle(JLL), Al Masah Capital Research
In 2014, the residential stock in Riyadh stood at 971,000 housing units, which is expected to increase to 990,000 in 2015. However, despite increase in development activity, the demand for residential units in Riyadh continues to outpace supply. As per Knight Frank (Riyadh Residential Research Report), the capital has a requirement of around 50,000 housing units per annum over the next five years to meet the growing demand. Although there are a number of large housing schemes planned to be completed in the short term, construction delays, labor shortages, and the lack of affordable land make it challenging to bridge the demand-supply gap for the subsequent years.
Compared to Riyadh, the demand-supply gap in Jeddah is much more passive, with the total number of available residential units of 769,000 at the end of 2014. Furthermore, the supply of residential units is expected to grow at a healthy rate with over 64,000 units likely to be added by the end of 2017.
Exhibit 38: Saudi Arabia Residential Rentals (2010-14)
Source: Jones Lang LaSalle(JLL), Al Masah Capital Research
In Riyadh, the residential rentals have drastically increased in the past two years, mainly due to the persistent undersupply of housing and high land values. Residential property prices also witnessed a y-o-y growth of 5%-7% in 2014. In Jeddah, rents for apartments
858
882
909
936
971
980
990
1,0
18
-
200
400
600
800
1,000
1,200
2010
2011
2012
2013
2014
2015
E
2016
F
2017
F
Completed Future Supply
Riyadh Residential Supply (in '000 units)
600
719
735
754
769
781
792
811
- 100 200 300 400 500 600 700 800 900
2010
2011
2012
2013
2014
2015
E
2016
F
2017
F
Completed Future Supply
Jeddah Residential Supply (in '000 units)
25
28
31
32
35
36
96
112
117
121
138
139
-
20
40
60
80
100
120
140
160
2010 2011 2012 2013 2014 Q22015
Apartment (2 BR) Villa (4 B)
Riyadh Residential Rents (in SAR '000 PA)
31
33
38
36
39
41
113
125
122
115
115
117
-
20
40
60
80
100
120
140
2010 2011 2012 2013 2014 Q22015
Apartment (3 BR) Villa (4 B)
Jeddah Residential Rents (in SAR '000 PA)
GCC Real Estate Sector Report_V3.indd 32GCC Real Estate Sector Report_V3.indd 32 11/10/15 6:49 PM11/10/15 6:49 PM
X
33
GCC Real Estate
rose 6.3% and those for villas rose 0.4% in 2014 as compared to a fall 4.4% and 5.7% witnessed in both the segments in 2013, respectively. Further, the western region of Jeddah remained the preferred residential location, recording the highest rental increases.
Going forward, new mortgage law (limiting maximum loan amount to 70% of the property value), which came into effect in November 2014, is likely to discourage residential transactions, especially for the middle income segment that relies heavily on financing, in the short term. However, entry of international developers should boost the construction activity in the long term.
Some of the major ongoing residential projects include: 500,000 Houses Program, Shams Al Arous, Jeddah Housing Project, and Jabal Omar Development Phase 1.
Saudi Arabia Retail Market
Saudi Arabia is one of the largest retail markets in the GCC. Growth in population and personal incomes coupled with increasing consumer preference toward modern retail outlets due to limited entertainment avenues, has boosted the demand of hypermarkets and malls in the country. Consequently, leading retailers such as Panda and Carrefour are on a robust expansion drive. For instance, Panda, the largest retailer in the country, is aiming to expand its outlets from 210 in 2014 to 250 by end of 2015. The growth in retail sector is also well supported by favorable policy decisions such as the recent announcement of Saudi Arabian General Investment Authority (SAGIA) to ease restrictions on foreign investors that will allow them 100% ownership in retail and wholesale businesses as compared to the present level of up to 75%. Going forward, the influx of foreign investment will support the sector growth and will enable the government to improve employment opportunities in the country.
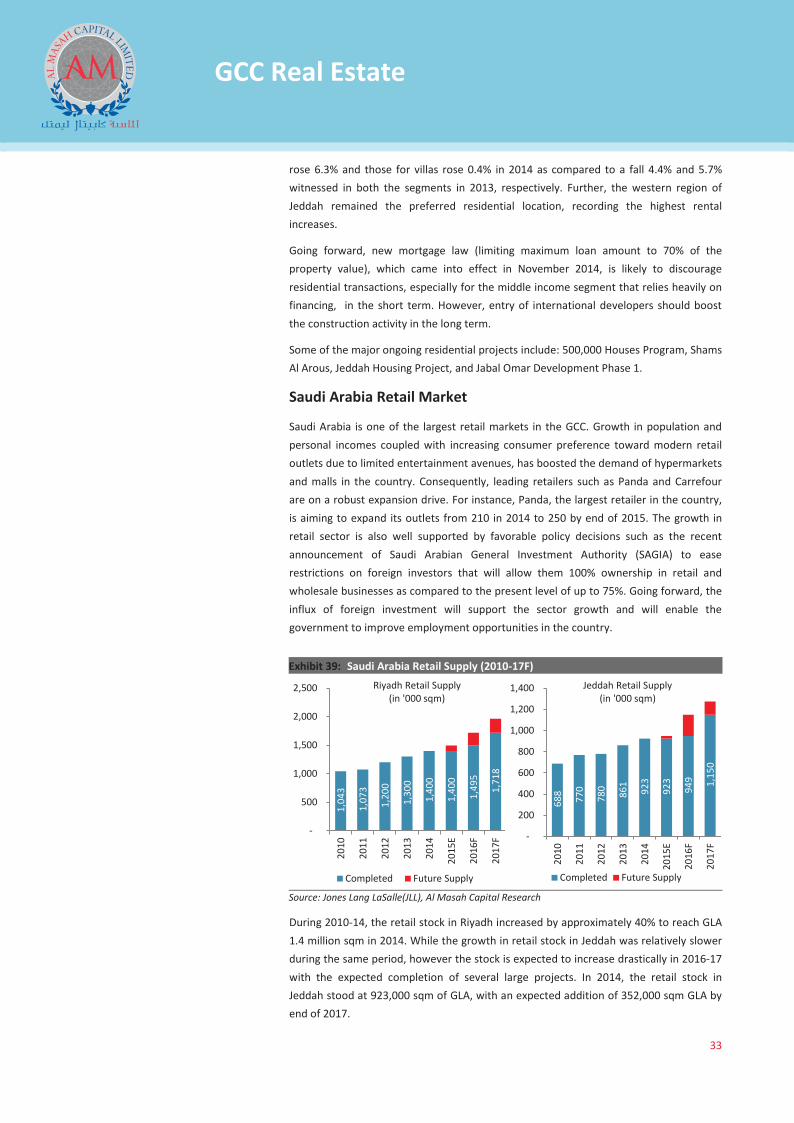
Exhibit 39: Saudi Arabia Retail Supply (2010-17F)
Source: Jones Lang LaSalle(JLL), Al Masah Capital Research
During 2010-14, the retail stock in Riyadh increased by approximately 40% to reach GLA 1.4 million sqm in 2014. While the growth in retail stock in Jeddah was relatively slower during the same period, however the stock is expected to increase drastically in 2016-17 with the expected completion of several large projects. In 2014, the retail stock in Jeddah stood at 923,000 sqm of GLA, with an expected addition of 352,000 sqm GLA by end of 2017.
1,0
43
1,0
73
1,2
00
1,3
00
1,4
00
1,4
00
1,4
95
1,7
18
-
500
1,000
1,500
2,000
2,500
2010
2011
2012
2013
2014
2015
E
2016
F
2017
F
Completed Future Supply
Riyadh Retail Supply (in '000 sqm)
688
770
780
861
923
923
949
1,1
50
-
200
400
600
800
1,000
1,200
1,400
2010
2011
2012
2013
2014
2015
E
2016
F
2017
F
Completed Future Supply
Jeddah Retail Supply (in '000 sqm)
GCC Real Estate Sector Report_V3.indd 33GCC Real Estate Sector Report_V3.indd 33 11/10/15 6:49 PM11/10/15 6:49 PM

X
34
GCC Real Estate
Moreover, the supply of retail stock is also well supported by the demand, which is evident from the declining vacancy rates in both cities. In Riyadh, the vacancy rates fell from 16% in 2010 to 8.0% in Q2 2015 while in Jeddah vacancy rates fell to approximately 7% in Q2 2015 as compared to 13% in 2010.
In Riyadh, the rentals for average mall space surged to SAR 2,788 per sqm PA in 2014 from SAR 2,509 per sqm PA in 2013 (up by 11.1%), primarily driven by the high occupancy rates witnessed during the year. By segments, the rents for super regional malls stood at SAR 2,836 per sqm PA in 2014, up from SAR 2,767 per sqm PA in 2013, while that in community retail centers rose to SAR 2,740 per sqm PA in 2014 from SAR 2,250 per sqm PA in 2013.
Exhibit 40: Saudi Arabia Retail Vacancy Rate (2010-15)
Source: Jones Lang LaSalle(JLL), Al Masah Capital Research
Similarly, in Jeddah, the rents for average mall space witnessed a rise of 5.0% to reach SAR 2,395 per sqm PA in 2014 from SAR 2,280 per sqm PA in 2013. By segments, the rents for super regional malls stood at SAR 2,990 per sqm PA in 2014, up from SAR 2,710 per sqm PA in 2013, while that in community retail centers fell to SAR 1,800 per sqm PA in 2014 from SAR 1,850 per sqm PA in 2013 mainly due to low demand.
Exhibit 41: Saudi Arabia Retail Rentals (2010-14)
Source: Jones Lang LaSalle(JLL), Al Masah Capital Research
13% 12%
10% 12%
10% 8%
16% 16%
4% 8% 7%
7%
0%
5%
10%
15%
20%
2010 2011 2012 2013 2014 Q2 2015
Riyadh Jeddah
Saudi Arabia Retail Vacancy Rates (%)
2,1
36
2,2
67
2,5
62
2,5
09
2,7
88
2,8
25
-
500
1,000
1,500
2,000
2,500
3,000
2010 2011 2012 2013 2014 Q22015
Average Mall Rents
Riyadh Retail Rents (SAR per sqm PA)
2,1
00
2,2
34
2,4
00
2,2
80
2,3
95
2,9
18
-
500
1,000
1,500
2,000
2,500
3,000
3,500
2010 2011 2012 2013 2014 Q22015
Average Mall Rents
Jeddah RetailRents (SAR per sqm PA)
GCC Real Estate Sector Report_V3.indd 34GCC Real Estate Sector Report_V3.indd 34 11/10/15 6:49 PM11/10/15 6:49 PM
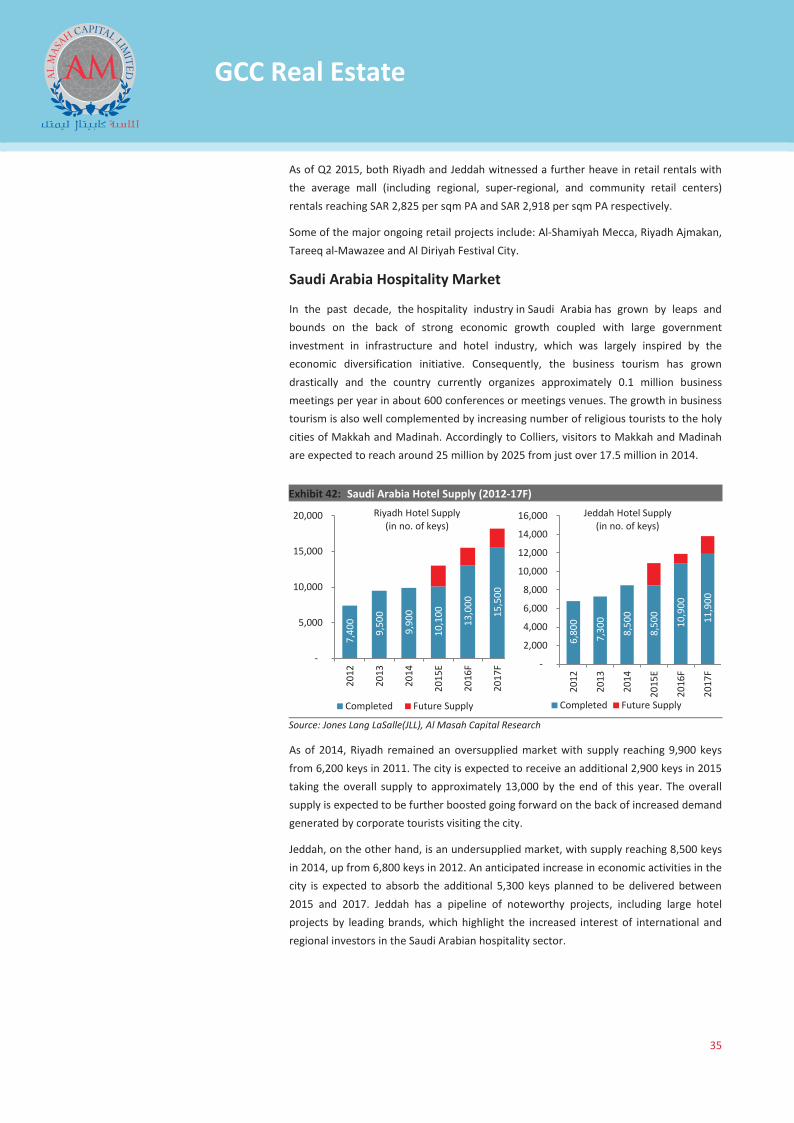
X
35
GCC Real Estate
As of Q2 2015, both Riyadh and Jeddah witnessed a further heave in retail rentals with the average mall (including regional, super-regional, and community retail centers) rentals reaching SAR 2,825 per sqm PA and SAR 2,918 per sqm PA respectively.
Some of the major ongoing retail projects include: Al-Shamiyah Mecca, Riyadh Ajmakan, Tareeq al-Mawazee and Al Diriyah Festival City.
Saudi Arabia Hospitality Market
In the past decade, the hospitality industry in Saudi Arabia has grown by leaps and bounds on the back of strong economic growth coupled with large government investment in infrastructure and hotel industry, which was largely inspired by the economic diversification initiative. Consequently, the business tourism has grown drastically and the country currently organizes approximately 0.1 million business meetings per year in about 600 conferences or meetings venues. The growth in business tourism is also well complemented by increasing number of religious tourists to the holy cities of Makkah and Madinah. Accordingly to Colliers, visitors to Makkah and Madinah are expected to reach around 25 million by 2025 from just over 17.5 million in 2014.
Exhibit 42: Saudi Arabia Hotel Supply (2012-17F)
Source: Jones Lang LaSalle(JLL), Al Masah Capital Research
As of 2014, Riyadh remained an oversupplied market with supply reaching 9,900 keys from 6,200 keys in 2011. The city is expected to receive an additional 2,900 keys in 2015 taking the overall supply to approximately 13,000 by the end of this year. The overall supply is expected to be further boosted going forward on the back of increased demand generated by corporate tourists visiting the city.
Jeddah, on the other hand, is an undersupplied market, with supply reaching 8,500 keys in 2014, up from 6,800 keys in 2012. An anticipated increase in economic activities in the city is expected to absorb the additional 5,300 keys planned to be delivered between 2015 and 2017. Jeddah has a pipeline of noteworthy projects, including large hotel projects by leading brands, which highlight the increased interest of international and regional investors in the Saudi Arabian hospitality sector.
7,4
00
9,5
00
9,9
00
10,
100
13,
000
15,
500
-
5,000
10,000
15,000
20,000
2012
2013
2014
2015
E
2016
F
2017
F
Completed Future Supply
Riyadh Hotel Supply (in no. of keys)
6,8
00
7,3
00
8,5
00
8,5
00
10,
900
11,
900
-
2,000
4,000
6,000
8,000
10,000
12,000
14,000
16,000
2012
2013
2014
2015
E
2016
F
2017
FCompleted Future Supply
Jeddah Hotel Supply (in no. of keys)
GCC Real Estate Sector Report_V3.indd 35GCC Real Estate Sector Report_V3.indd 35 11/10/15 6:49 PM11/10/15 6:49 PM
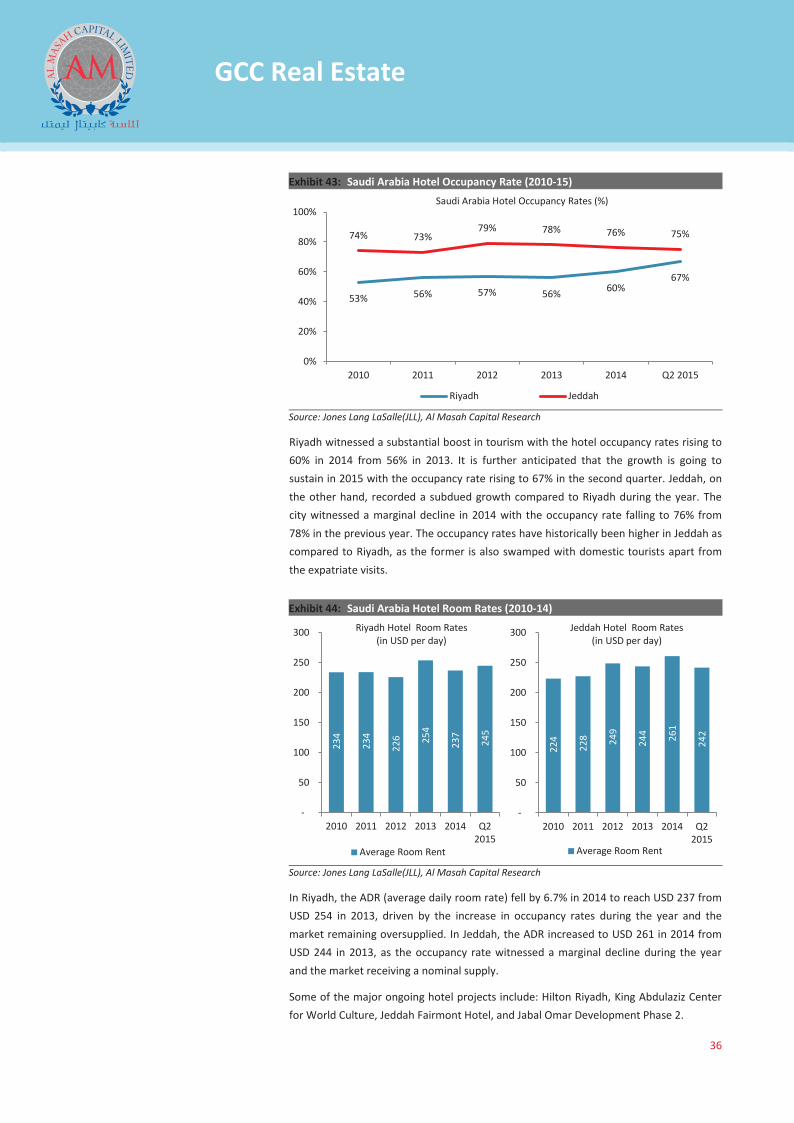
X
36
GCC Real Estate
Exhibit 43: Saudi Arabia Hotel Occupancy Rate (2010-15)
Source: Jones Lang LaSalle(JLL), Al Masah Capital Research
Riyadh witnessed a substantial boost in tourism with the hotel occupancy rates rising to 60% in 2014 from 56% in 2013. It is further anticipated that the growth is going to sustain in 2015 with the occupancy rate rising to 67% in the second quarter. Jeddah, on the other hand, recorded a subdued growth compared to Riyadh during the year. The city witnessed a marginal decline in 2014 with the occupancy rate falling to 76% from 78% in the previous year. The occupancy rates have historically been higher in Jeddah as compared to Riyadh, as the former is also swamped with domestic tourists apart from the expatriate visits.
Exhibit 44: Saudi Arabia Hotel Room Rates (2010-14)
Source: Jones Lang LaSalle(JLL), Al Masah Capital Research
In Riyadh, the ADR (average daily room rate) fell by 6.7% in 2014 to reach USD 237 from USD 254 in 2013, driven by the increase in occupancy rates during the year and the market remaining oversupplied. In Jeddah, the ADR increased to USD 261 in 2014 from USD 244 in 2013, as the occupancy rate witnessed a marginal decline during the year and the market receiving a nominal supply.
Some of the major ongoing hotel projects include: Hilton Riyadh, King Abdulaziz Center for World Culture, Jeddah Fairmont Hotel, and Jabal Omar Development Phase 2.
53% 56% 57% 56% 60% 67%
74% 73% 79% 78% 76% 75%
0%
20%
40%
60%
80%
100%
2010 2011 2012 2013 2014 Q2 2015
Riyadh Jeddah
Saudi Arabia Hotel Occupancy Rates (%)
234
234
226
254
237
245
-
50
100
150
200
250
300
2010 2011 2012 2013 2014 Q22015
Average Room Rent
Riyadh Hotel Room Rates (in USD per day)
224
228
249
244
261
242
-
50
100
150
200
250
300
2010 2011 2012 2013 2014 Q22015
Average Room Rent
Jeddah Hotel Room Rates (in USD per day)
GCC Real Estate Sector Report_V3.indd 36GCC Real Estate Sector Report_V3.indd 36 11/10/15 6:49 PM11/10/15 6:49 PM

X
37
GCC Real Estate
BAHRAIN REAL ESTATE
Bahrain Office Market
In 2014, the demand for commercial office space remained subdues on back of low economic activity, which can be largely attributed to the decline in oil prices. The market remained oversupplied and the trend is expected to continue in the short term. Further, the demand for smaller, fitted-office units that offer cost effective turnkey solutions is expected to increase in the short term.
Exhibit 45: Bahrain Office Rentals (2010-14)
Source: Gluttons, Al Masah Capital Research
Bahrain office rentals declined by 6.3% in 2014 to reach BDH 7.5 per sqm PA from BHD 8.0 per sqm PA IN 2013 as vacancy rates maintained an upward trend across the country. While the take up activity remained strong for smaller units (under 250 sqm) as of the start of 2015, largely driven by customers who want to lower capital expenditure and enhance flexibility. While Grade A international class office developers endeavor to protect market perception by staying firm on rentals, new occupier take up has been limited in this segment.
According to CBRE, the commercial office market has become fragmented with landlords who have been able to adapt to current market demands, performing better than those who have continued with traditional approaches to leasing space. Landlords proposing flexibility in their offering, providing smaller, partitioned units as well as traditional space are faring better in terms of occupancy rates and income in the current economic climate. Despite the office market remaining weak, developers are keen to proceed with large floor plans, largely driven by the positive market sentiments witnessed in the past years. Considering oil prices remain subdued, the Bahrain office market could continue to be impacted in terms of limited return on rental value. Moreover, if oil prices remain low for an extended period, the GCC Support Fund for Bahrain could be re-negotiated which is expected to significantly lower demand prospects.
10.0
7.0 8.
0
8.0
7.5
7.5
0.0
2.0
4.0
6.0
8.0
10.0
12.0
2010 2011 2012 2013 2014 Q1 2015
Financial Harbour & SEEF (fitted-out space)
Bahrain Office Rents (BHD per sqm PA)
GCC Real Estate Sector Report_V3.indd 37GCC Real Estate Sector Report_V3.indd 37 11/10/15 6:49 PM11/10/15 6:49 PM

X
38
GCC Real Estate
Bahrain Residential Market
The residential market in Bahrain remained undersupplied as of 2014 as the country witnessed limited construction activity during the year due to a challenging political environment. However, the residential construction sector is expected to improve steadily in 2015, deriving benefits from the GCC funding and the involvement of the private sector. Housing remained the government’s biggest construction priority with more than 55,000 on the waiting list for affordable housing. As per Quick-Wins, construction of 9,232 housing units was announced in 2014 comprising of projects worth USD 2.2 billion of which 2,548 units are scheduled for completion in 2015, while about 1,443 and 5,241 units are planned for completion by 2016 and 2017, respectively.
Exhibit 46: Bahrain Residential Rental Market (2010-15)
Source: Cluttons, Al Masah Capital Research
Bahrain’s residential real estate market activity has slowed down, primarily in areas dominated by expats such as Amwaj Islands and Reef Island where the annual change in rents stood at 2.2% and 3.6% respectively at the end of Q1 2015. The rentals for 2BR apartments in Al Juffair remained unchanged since 2013, suggesting market saturation. As of Q1 2015, apartments and villas continued to perform equally with those in Saar, Adliya, and Amwaj Islands witnessed increasing demand driven by the jobs created through the government’s ongoing infrastructure development programs. Additionally, the appeal for Saar and Amwaj Islands are increasing with market stability and added community infrastructure being developed. Going forward, landlords are expected to remain subdued on imposing in any rent increase.
Some of the major ongoing residential projects include: Villamar Residential Complex, PPP Affordable Housing Scheme, Wahat Al Muharraq and Al Ramli Housing Units.
Bahrain Retail Market
Bahrain's retail sector continued to remain resilient recording the highest growth in 2014, in terms of new developments in the community mall segments. Further, the supply of retail units outpaced their demand, creating an oversupply situation, primarily driven by newly delivered and upcoming developments announced in 2014, including destination malls such as The Avenues which is under construction opposite the Bahrain Bay on Manama Corniche and Seef Mall Muharraq which opened in the first quarter 2015. Consequently, developers are growing wary of the rising number of mega malls in the country and as a result, many are now focusing on smaller retail centers that are part of new residential or commercial schemes.
600 75
0
750
750
0
100
200
300
400
500
600
700
800
2012 2013 2014 Q1 20152 BR Apartments (Al Juffair)
Bahrain Residential Rents (BHD per unit PA)
GCC Real Estate Sector Report_V3.indd 38GCC Real Estate Sector Report_V3.indd 38 11/10/15 6:49 PM11/10/15 6:49 PM

X
39
GCC Real Estate
Some of the major ongoing retail projects include: Dragon City and Janabiya Retail Center.
Bahrain Hospitality Market
According to hotel industry benchmark STR Global data, the Bahrain market picked up with occupancy rates in Manama during 2014 averaging 56% as compared to 48% in 2013. According to CBRE, Q2 2015 witnessed the busiest time of the year for the hospitality sector, with the Bahrain Formula 1 Gulf Air Grand Prix taking place in April during which hotels reported over 90% occupancy across all classes. Although the average occupancy reported for hotels, particularly in the five-star bracket has been modest, the development in this area shows no sign of abating.
Going forward a surge in new projects entering the hospitality market both in the luxury and mid-range segments are expected to provide a much needed boost to Bahrain’s economy. According to KPMG, more than 1,500 new hotel rooms are expected to enter the Bahrain market in the next three years, predominantly in the upscale and luxury segment. The world's largest hotel company, US-based Wyndham Hotel Group, has four new properties - Ramada Hotel and Suites Amwaj, Hawthorn Suites by Wyndham, Ramada Manama City Centre and the Wyndham Grand - lined up for opening in the kingdom later in 2015 and early 2016. Going forward, Dubai-based Emaar Hospitality Group plans to bring its flagship hotel brands, The Address Hotel and Resort and Vida Hotel and Resort, to the country and other luxury five-star hotels looking to establish a presence in Bahrain include Shaza Hotels and Melia Hotels International, a Spanish hotel chain. Additionally, the proximity of Saudi Arabia is expected to result in a spillover of local and regional tourist traffic into Bahrain, helping to stabilize the market.
GCC Real Estate Sector Report_V3.indd 39GCC Real Estate Sector Report_V3.indd 39 11/10/15 6:49 PM11/10/15 6:49 PM
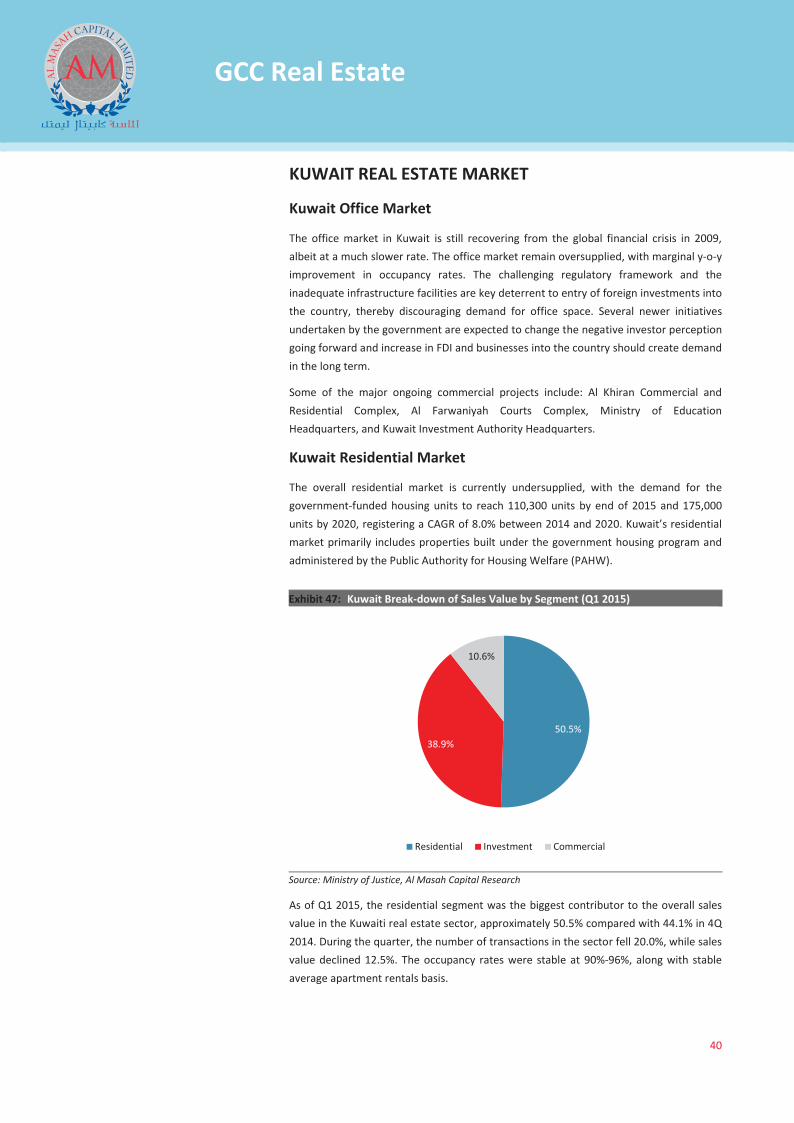
X
40
GCC Real Estate
KUWAIT REAL ESTATE MARKET
Kuwait Office Market
The office market in Kuwait is still recovering from the global financial crisis in 2009, albeit at a much slower rate. The office market remain oversupplied, with marginal y-o-y improvement in occupancy rates. The challenging regulatory framework and the inadequate infrastructure facilities are key deterrent to entry of foreign investments into the country, thereby discouraging demand for office space. Several newer initiatives undertaken by the government are expected to change the negative investor perception going forward and increase in FDI and businesses into the country should create demand in the long term.
Some of the major ongoing commercial projects include: Al Khiran Commercial and Residential Complex, Al Farwaniyah Courts Complex, Ministry of Education Headquarters, and Kuwait Investment Authority Headquarters.
Kuwait Residential Market
The overall residential market is currently undersupplied, with the demand for the government-funded housing units to reach 110,300 units by end of 2015 and 175,000 units by 2020, registering a CAGR of 8.0% between 2014 and 2020. Kuwait’s residential market primarily includes properties built under the government housing program and administered by the Public Authority for Housing Welfare (PAHW).
Exhibit 47: Kuwait Break-down of Sales Value by Segment (Q1 2015)
Source: Ministry of Justice, Al Masah Capital Research
As of Q1 2015, the residential segment was the biggest contributor to the overall sales value in the Kuwaiti real estate sector, approximately 50.5% compared with 44.1% in 4Q 2014. During the quarter, the number of transactions in the sector fell 20.0%, while sales value declined 12.5%. The occupancy rates were stable at 90%-96%, along with stable average apartment rentals basis.
50.5% 38.9%
10.6%
Residential Investment Commercial
GCC Real Estate Sector Report_V3.indd 40GCC Real Estate Sector Report_V3.indd 40 11/10/15 6:49 PM11/10/15 6:49 PM
X
41
GCC Real Estate
Some of the major residential projects include: Khiran Residential City, North West Sulaibikhat Residential City, and Jaber Al Ahmad City N1 & N3
Kuwait Retail Market
As per Ventures Middle East, Kuwait remains a largely undersupplied market, displaying the lowest retail mall space per capita (59% lower than its GCC peers), indicating a potential for further growth. The market is ripe for development, with a total projected construction of GLA of 440 million sqm to be added up by 2020. Moreover, the country's large consumer base and subsequent spending will triggered the growth of the retail construction market in the coming years.
Some of the major ongoing retail projects include: Jaber Al Ahmad New City, The Avenues-phase 4 and Al-Khiran.
Kuwait Hospitality Market
The hospitality segment in Kuwait remains largely underpenetrated in comparison to its GCC peers. However, the country has undertaken measures to promote itself as a strategic business destination in recent times, which has boosted its hospitality sector in 2014. With over a year of political stability as well as a return of consumer and investor confidence, the government is increasing its focus on the tourism sector, which will eventually translate into an improved hospitality market in the future.
Some of the major ongoing hospitality projects include: Sheikh Jaber Cultural Center and Sharq Equestrian Club Building.
GCC Real Estate Sector Report_V3.indd 41GCC Real Estate Sector Report_V3.indd 41 11/10/15 6:49 PM11/10/15 6:49 PM

X
42
GCC Real Estate
OMAN REAL ESTATE
Oman Office Market
The office real estate segment in Oman has witnessed an alarming undersupply of Grade A commercial space since the beginning of 2014, primarily due to high activity in its petrochemicals sector as a result of the Khazzan Gas Field Project. On the other hand, the country’s Grade B and C office spaces remained oversupplied in 2014. As per Savills, an additional 152,000 sqm of Grade A office space is expected to be completed by early 2016 and this planned supply appears sufficient to accommodate the additional anticipated demand over the next 4-5 years.
Exhibit 48: Oman Office Rentals Market (2010-15)
Source: Cluttons, Al Masah Capital Research
In the last (2-3 years), the office rentals in Oman remained stagnant or declined due to a supply glut. Demand for Grade A offices remained steady while rentals for offices in either less desirable locations or offering inferior facilities, such as insufficient parking spaces declined. Further, several large projects are on the verge of completion and will increase the total stock significantly by end of 2016, thereby increasing the pressure on rentals going forward.
Some of the major ongoing commercial projects include: Al Athaiba National Bank of Oman Headquarters, Sohar Industrial Estate Expansion Stage 7 and Salalah Administrative Headquarters.
Oman Residential Market
The country saw higher demand for quality residential units in 2014 across prime locations in Muscat, especially in areas such as the Wave, Madinat Qaboos, Qurum, Shatti Al Qurum, and Muscat Hills, where private investment is permitted. With rising demand, several new developments are due for completion from 2015 to 2020, including the development of Oman’s first residential zone named Zaha which comprises of a range of villas and apartments, part of the Saraya Bandar Jissah project. The project commenced construction in 2015 and is expected to be completed by 2017.
5 6
8
11
8.5 9
4
6 6
10
8 8
4
6 6
10
8 8
4
6 6
9
7 8
4
6 6
8 7 7
4
6 6
8 7 7
0
2
4
6
8
10
12
14
CBD Qurum Al Khuwair Shatti AlQurum
Ghubrah Azaiba
2010 2011 2012 2013 2014 Q1 2015
Oman Average Office Rents (OMR per sqm PA)
GCC Real Estate Sector Report_V3.indd 42GCC Real Estate Sector Report_V3.indd 42 11/10/15 6:49 PM11/10/15 6:49 PM
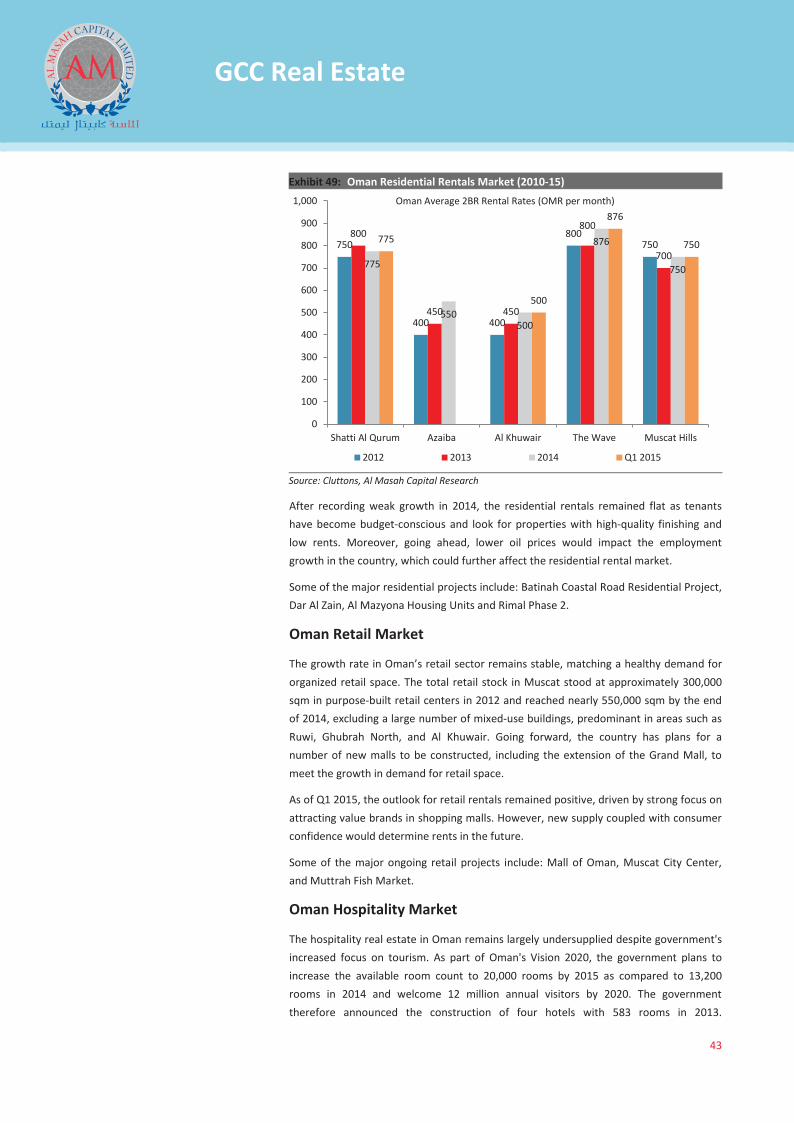
X
43
GCC Real Estate
Exhibit 49: Oman Residential Rentals Market (2010-15)
Source: Cluttons, Al Masah Capital Research
After recording weak growth in 2014, the residential rentals remained flat as tenants have become budget-conscious and look for properties with high-quality finishing and low rents. Moreover, going ahead, lower oil prices would impact the employment growth in the country, which could further affect the residential rental market.
Some of the major residential projects include: Batinah Coastal Road Residential Project, Dar Al Zain, Al Mazyona Housing Units and Rimal Phase 2.
Oman Retail Market
The growth rate in Oman’s retail sector remains stable, matching a healthy demand for organized retail space. The total retail stock in Muscat stood at approximately 300,000 sqm in purpose-built retail centers in 2012 and reached nearly 550,000 sqm by the end of 2014, excluding a large number of mixed-use buildings, predominant in areas such as Ruwi, Ghubrah North, and Al Khuwair. Going forward, the country has plans for a number of new malls to be constructed, including the extension of the Grand Mall, to meet the growth in demand for retail space.
As of Q1 2015, the outlook for retail rentals remained positive, driven by strong focus on attracting value brands in shopping malls. However, new supply coupled with consumer confidence would determine rents in the future.
Some of the major ongoing retail projects include: Mall of Oman, Muscat City Center, and Muttrah Fish Market.
Oman Hospitality Market
The hospitality real estate in Oman remains largely undersupplied despite government's increased focus on tourism. As part of Oman's Vision 2020, the government plans to increase the available room count to 20,000 rooms by 2015 as compared to 13,200 rooms in 2014 and welcome 12 million annual visitors by 2020. The government therefore announced the construction of four hotels with 583 rooms in 2013.
750
400 400
800 750
800
450 450
800
700 775
550 500
876
750
775
500
876
750
0
100
200
300
400
500
600
700
800
900
1,000
Shatti Al Qurum Azaiba Al Khuwair The Wave Muscat Hills
2012 2013 2014 Q1 2015
Oman Average 2BR Rental Rates (OMR per month)
GCC Real Estate Sector Report_V3.indd 43GCC Real Estate Sector Report_V3.indd 43 11/10/15 6:49 PM11/10/15 6:49 PM
X
44
GCC Real Estate
Additionally, the hospitality segment has also attracted considerable interest from private sector, brands such as Rotana Hotel Management Corporation Limited, Kempinski Hotels, and Fairmont Hotels & Resorts, among others, are expected to enter the untapped market in the near term.
Some of the major ongoing hospitality projects include: City Hotels Muscat Phase 1, Shaza Salalah Hotel and Resort, Jebel Sifah Four Seasons Hotel, and The Wave Muscat Kempinski Hotel.
GCC Real Estate Sector Report_V3.indd 44GCC Real Estate Sector Report_V3.indd 44 11/10/15 6:49 PM11/10/15 6:49 PM
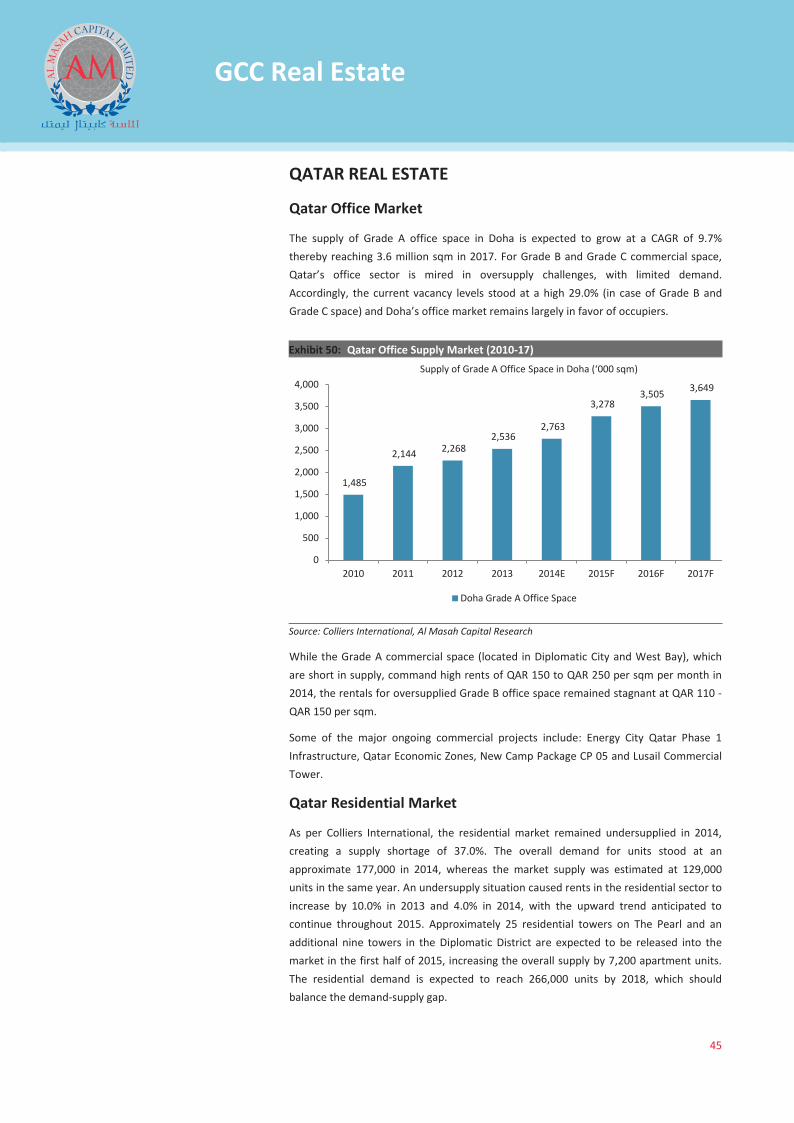
X
45
GCC Real Estate
QATAR REAL ESTATE
Qatar Office Market
The supply of Grade A office space in Doha is expected to grow at a CAGR of 9.7% thereby reaching 3.6 million sqm in 2017. For Grade B and Grade C commercial space, Qatar’s office sector is mired in oversupply challenges, with limited demand. Accordingly, the current vacancy levels stood at a high 29.0% (in case of Grade B and Grade C space) and Doha’s office market remains largely in favor of occupiers.
Exhibit 50: Qatar Office Supply Market (2010-17)
Source: Colliers International, Al Masah Capital Research
While the Grade A commercial space (located in Diplomatic City and West Bay), which are short in supply, command high rents of QAR 150 to QAR 250 per sqm per month in 2014, the rentals for oversupplied Grade B office space remained stagnant at QAR 110 - QAR 150 per sqm.
Some of the major ongoing commercial projects include: Energy City Qatar Phase 1 Infrastructure, Qatar Economic Zones, New Camp Package CP 05 and Lusail Commercial Tower.
Qatar Residential Market
As per Colliers International, the residential market remained undersupplied in 2014, creating a supply shortage of 37.0%. The overall demand for units stood at an approximate 177,000 in 2014, whereas the market supply was estimated at 129,000 units in the same year. An undersupply situation caused rents in the residential sector to increase by 10.0% in 2013 and 4.0% in 2014, with the upward trend anticipated to continue throughout 2015. Approximately 25 residential towers on The Pearl and an additional nine towers in the Diplomatic District are expected to be released into the market in the first half of 2015, increasing the overall supply by 7,200 apartment units. The residential demand is expected to reach 266,000 units by 2018, which should balance the demand-supply gap.
1,485
2,144 2,268 2,536
2,763
3,278 3,505 3,649
0
500
1,000
1,500
2,000
2,500
3,000
3,500
4,000
2010 2011 2012 2013 2014E 2015F 2016F 2017F
Doha Grade A Office Space
Supply of Grade A Office Space in Doha (‘000 sqm)
GCC Real Estate Sector Report_V3.indd 45GCC Real Estate Sector Report_V3.indd 45 11/10/15 6:49 PM11/10/15 6:49 PM
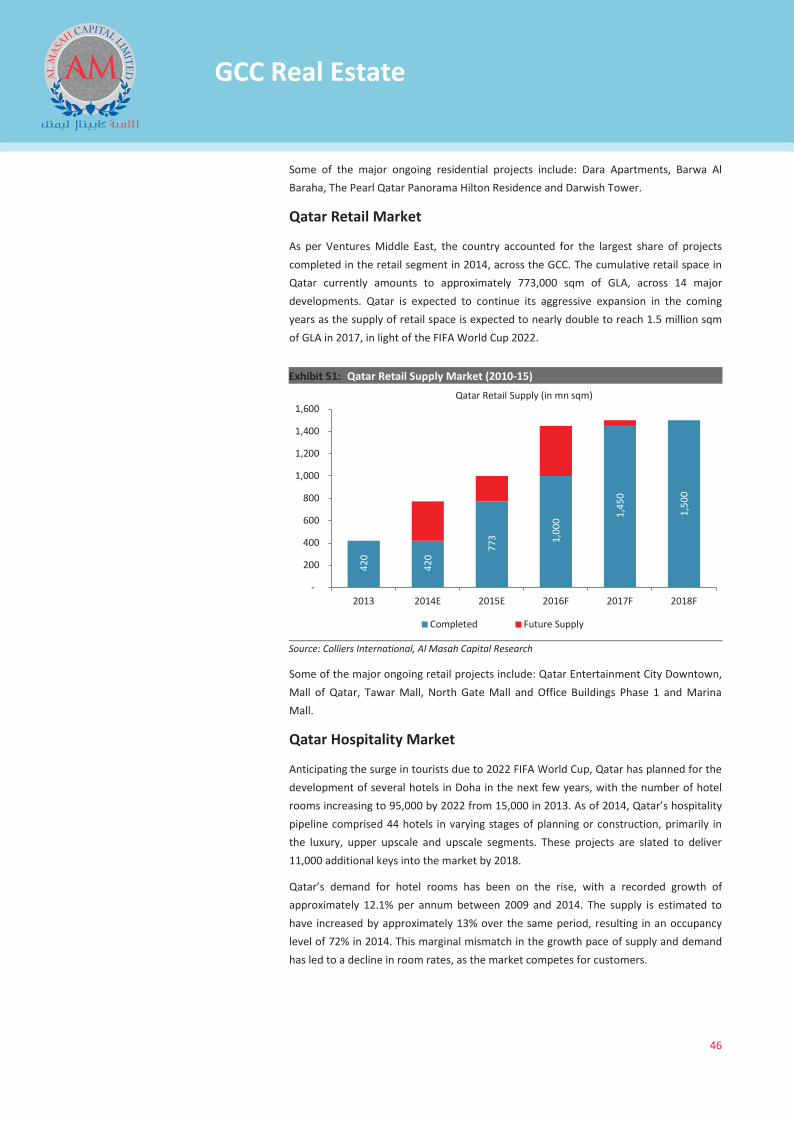
X
46
GCC Real Estate
Some of the major ongoing residential projects include: Dara Apartments, Barwa Al Baraha, The Pearl Qatar Panorama Hilton Residence and Darwish Tower.
Qatar Retail Market
As per Ventures Middle East, the country accounted for the largest share of projects completed in the retail segment in 2014, across the GCC. The cumulative retail space in Qatar currently amounts to approximately 773,000 sqm of GLA, across 14 major developments. Qatar is expected to continue its aggressive expansion in the coming years as the supply of retail space is expected to nearly double to reach 1.5 million sqm of GLA in 2017, in light of the FIFA World Cup 2022.
Exhibit 51: Qatar Retail Supply Market (2010-15)
Source: Colliers International, Al Masah Capital Research
Some of the major ongoing retail projects include: Qatar Entertainment City Downtown, Mall of Qatar, Tawar Mall, North Gate Mall and Office Buildings Phase 1 and Marina Mall.
Qatar Hospitality Market
Anticipating the surge in tourists due to 2022 FIFA World Cup, Qatar has planned for the development of several hotels in Doha in the next few years, with the number of hotel rooms increasing to 95,000 by 2022 from 15,000 in 2013. As of 2014, Qatar’s hospitality pipeline comprised 44 hotels in varying stages of planning or construction, primarily in the luxury, upper upscale and upscale segments. These projects are slated to deliver 11,000 additional keys into the market by 2018.
Qatar’s demand for hotel rooms has been on the rise, with a recorded growth of approximately 12.1% per annum between 2009 and 2014. The supply is estimated to have increased by approximately 13% over the same period, resulting in an occupancy level of 72% in 2014. This marginal mismatch in the growth pace of supply and demand has led to a decline in room rates, as the market competes for customers.
420
420
773
1,0
00 1
,450
1,50
0
-
200
400
600
800
1,000
1,200
1,400
1,600
2013 2014E 2015E 2016F 2017F 2018F
Completed Future Supply
Qatar Retail Supply (in mn sqm)
GCC Real Estate Sector Report_V3.indd 46GCC Real Estate Sector Report_V3.indd 46 11/10/15 6:49 PM11/10/15 6:49 PM
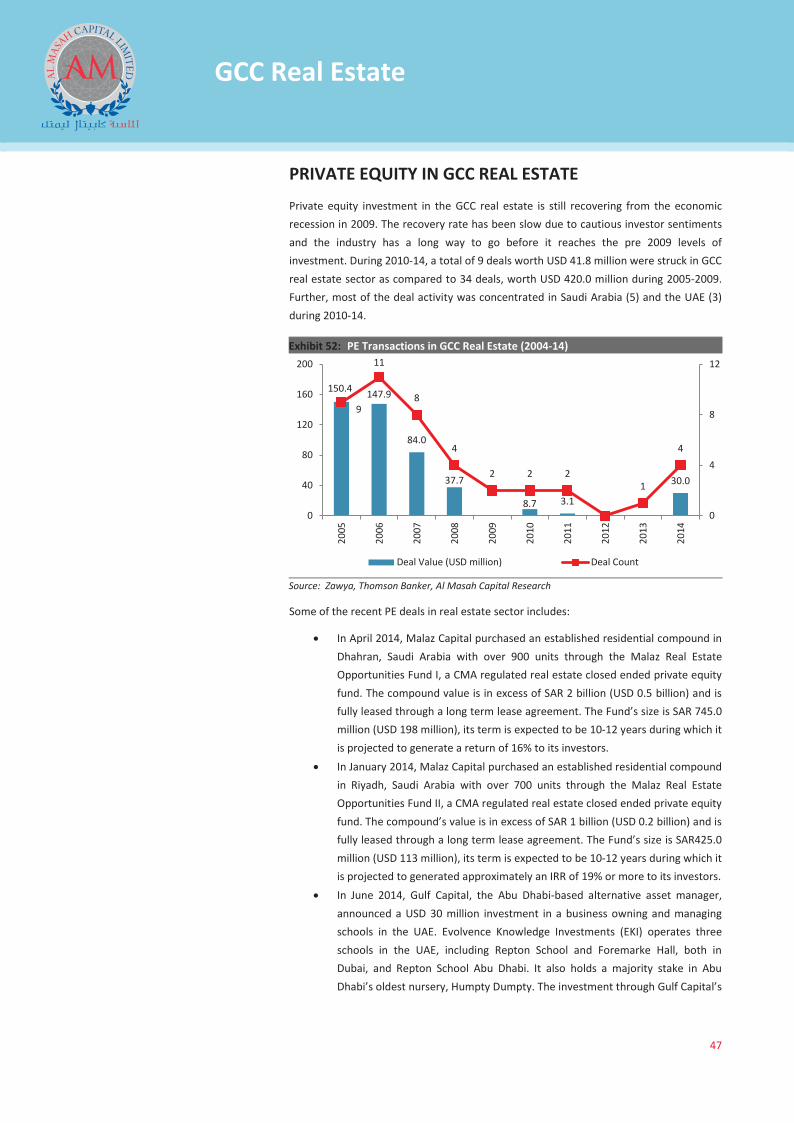
X
47
GCC Real Estate
PRIVATE EQUITY IN GCC REAL ESTATE
Private equity investment in the GCC real estate is still recovering from the economic recession in 2009. The recovery rate has been slow due to cautious investor sentiments and the industry has a long way to go before it reaches the pre 2009 levels of investment. During 2010-14, a total of 9 deals worth USD 41.8 million were struck in GCC real estate sector as compared to 34 deals, worth USD 420.0 million during 2005-2009. Further, most of the deal activity was concentrated in Saudi Arabia (5) and the UAE (3) during 2010-14.
Exhibit 52: PE Transactions in GCC Real Estate (2004-14)
Source: Zawya, Thomson Banker, Al Masah Capital Research
Some of the recent PE deals in real estate sector includes:
In April 2014, Malaz Capital purchased an established residential compound in Dhahran, Saudi Arabia with over 900 units through the Malaz Real Estate Opportunities Fund I, a CMA regulated real estate closed ended private equity fund. The compound value is in excess of SAR 2 billion (USD 0.5 billion) and is fully leased through a long term lease agreement. The Fund’s size is SAR 745.0 million (USD 198 million), its term is expected to be 10-12 years during which it is projected to generate a return of 16% to its investors. In January 2014, Malaz Capital purchased an established residential compound in Riyadh, Saudi Arabia with over 700 units through the Malaz Real Estate Opportunities Fund II, a CMA regulated real estate closed ended private equity fund. The compound’s value is in excess of SAR 1 billion (USD 0.2 billion) and is fully leased through a long term lease agreement. The Fund’s size is SAR425.0 million (USD 113 million), its term is expected to be 10-12 years during which it is projected to generated approximately an IRR of 19% or more to its investors. In June 2014, Gulf Capital, the Abu Dhabi-based alternative asset manager, announced a USD 30 million investment in a business owning and managing schools in the UAE. Evolvence Knowledge Investments (EKI) operates three schools in the UAE, including Repton School and Foremarke Hall, both in Dubai, and Repton School Abu Dhabi. It also holds a majority stake in Abu Dhabi’s oldest nursery, Humpty Dumpty. The investment through Gulf Capital’s
150.4 147.9
84.0
37.7
8.7 3.1
30.0
9
11
8
4
2 2 2 1
4
0
4
8
12
0
40
80
120
160
200
2005
2006
2007
2008
2009
2010
2011
2012
2013
2014
Deal Value (USD million) Deal Count
GCC Real Estate Sector Report_V3.indd 47GCC Real Estate Sector Report_V3.indd 47 11/10/15 6:49 PM11/10/15 6:49 PM
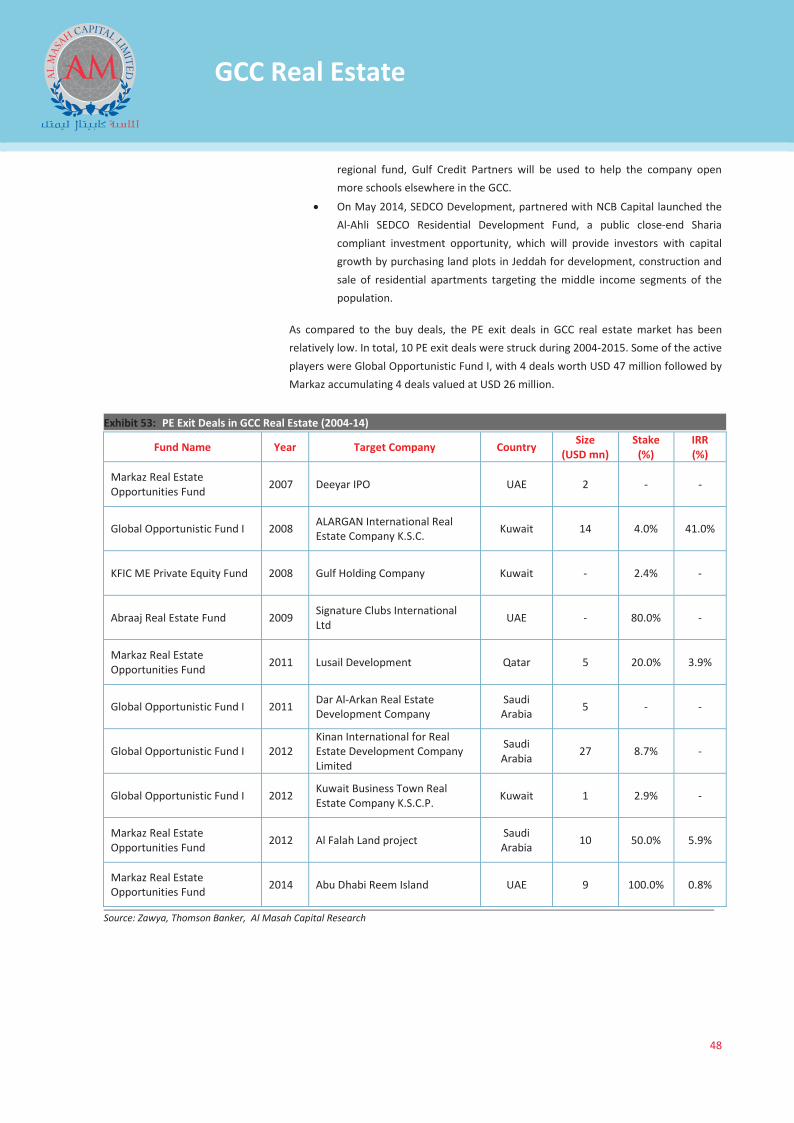
X
48
GCC Real Estate
regional fund, Gulf Credit Partners will be used to help the company open more schools elsewhere in the GCC.
On May 2014, SEDCO Development, partnered with NCB Capital launched the Al-Ahli SEDCO Residential Development Fund, a public close-end Sharia compliant investment opportunity, which will provide investors with capital growth by purchasing land plots in Jeddah for development, construction and sale of residential apartments targeting the middle income segments of the population.
As compared to the buy deals, the PE exit deals in GCC real estate market has been relatively low. In total, 10 PE exit deals were struck during 2004-2015. Some of the active players were Global Opportunistic Fund I, with 4 deals worth USD 47 million followed by Markaz accumulating 4 deals valued at USD 26 million.
Exhibit 53: PE Exit Deals in GCC Real Estate (2004-14)
Fund Name Year Target Company Country Size (USD mn)
Stake (%)
IRR (%)
Markaz Real Estate Opportunities Fund 2007 Deeyar IPO UAE 2 - -
Global Opportunistic Fund I 2008 ALARGAN International Real Estate Company K.S.C. Kuwait 14 4.0% 41.0%
KFIC ME Private Equity Fund 2008 Gulf Holding Company Kuwait - 2.4% -
Abraaj Real Estate Fund 2009 Signature Clubs International Ltd UAE - 80.0% -
Markaz Real Estate Opportunities Fund 2011 Lusail Development Qatar 5 20.0% 3.9%
Global Opportunistic Fund I 2011 Dar Al-Arkan Real Estate Development Company
Saudi Arabia 5 - -
Global Opportunistic Fund I 2012 Kinan International for Real Estate Development Company Limited
Saudi Arabia 27 8.7% -
Global Opportunistic Fund I 2012 Kuwait Business Town Real Estate Company K.S.C.P. Kuwait 1 2.9% -
Markaz Real Estate Opportunities Fund 2012 Al Falah Land project Saudi
Arabia 10 50.0% 5.9%
Markaz Real Estate Opportunities Fund 2014 Abu Dhabi Reem Island UAE 9 100.0% 0.8%
Source: Zawya, Thomson Banker, Al Masah Capital Research
GCC Real Estate Sector Report_V3.indd 48GCC Real Estate Sector Report_V3.indd 48 11/10/15 6:49 PM11/10/15 6:49 PM
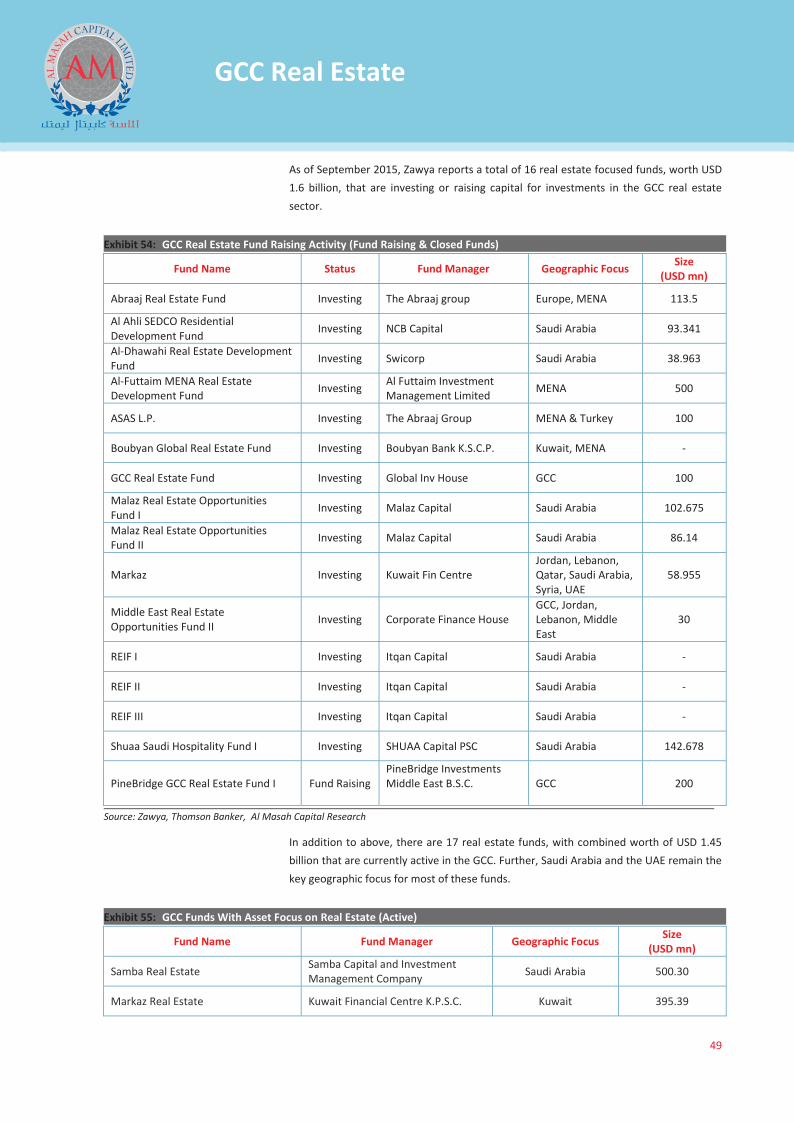
X
49
GCC Real Estate
As of September 2015, Zawya reports a total of 16 real estate focused funds, worth USD 1.6 billion, that are investing or raising capital for investments in the GCC real estate sector.
Exhibit 54: GCC Real Estate Fund Raising Activity (Fund Raising & Closed Funds)
Fund Name Status Fund Manager Geographic Focus Size (USD mn)
Abraaj Real Estate Fund Investing The Abraaj group Europe, MENA 113.5
Al Ahli SEDCO Residential Development Fund Investing NCB Capital Saudi Arabia 93.341
Al-Dhawahi Real Estate Development Fund Investing Swicorp Saudi Arabia 38.963
Al-Futtaim MENA Real Estate Development Fund Investing Al Futtaim Investment
Management Limited MENA 500
ASAS L.P. Investing The Abraaj Group MENA & Turkey 100
Boubyan Global Real Estate Fund Investing Boubyan Bank K.S.C.P. Kuwait, MENA -
GCC Real Estate Fund Investing Global Inv House GCC 100
Malaz Real Estate Opportunities Fund I Investing Malaz Capital Saudi Arabia 102.675
Malaz Real Estate Opportunities Fund II Investing Malaz Capital Saudi Arabia 86.14
Markaz Investing Kuwait Fin Centre Jordan, Lebanon, Qatar, Saudi Arabia, Syria, UAE
58.955
Middle East Real Estate Opportunities Fund II Investing Corporate Finance House
GCC, Jordan, Lebanon, Middle East
30
REIF I Investing Itqan Capital Saudi Arabia -
REIF II Investing Itqan Capital Saudi Arabia -
REIF III Investing Itqan Capital Saudi Arabia -
Shuaa Saudi Hospitality Fund I Investing SHUAA Capital PSC Saudi Arabia 142.678
PineBridge GCC Real Estate Fund I Fund Raising PineBridge Investments Middle East B.S.C.
GCC 200
Source: Zawya, Thomson Banker, Al Masah Capital Research
In addition to above, there are 17 real estate funds, with combined worth of USD 1.45 billion that are currently active in the GCC. Further, Saudi Arabia and the UAE remain the key geographic focus for most of these funds.
Exhibit 55: GCC Funds With Asset Focus on Real Estate (Active)
Fund Name Fund Manager Geographic Focus Size (USD mn)
Samba Real Estate Samba Capital and Investment Management Company Saudi Arabia 500.30
Markaz Real Estate Kuwait Financial Centre K.P.S.C. Kuwait 395.39
GCC Real Estate Sector Report_V3.indd 49GCC Real Estate Sector Report_V3.indd 49 11/10/15 6:49 PM11/10/15 6:49 PM
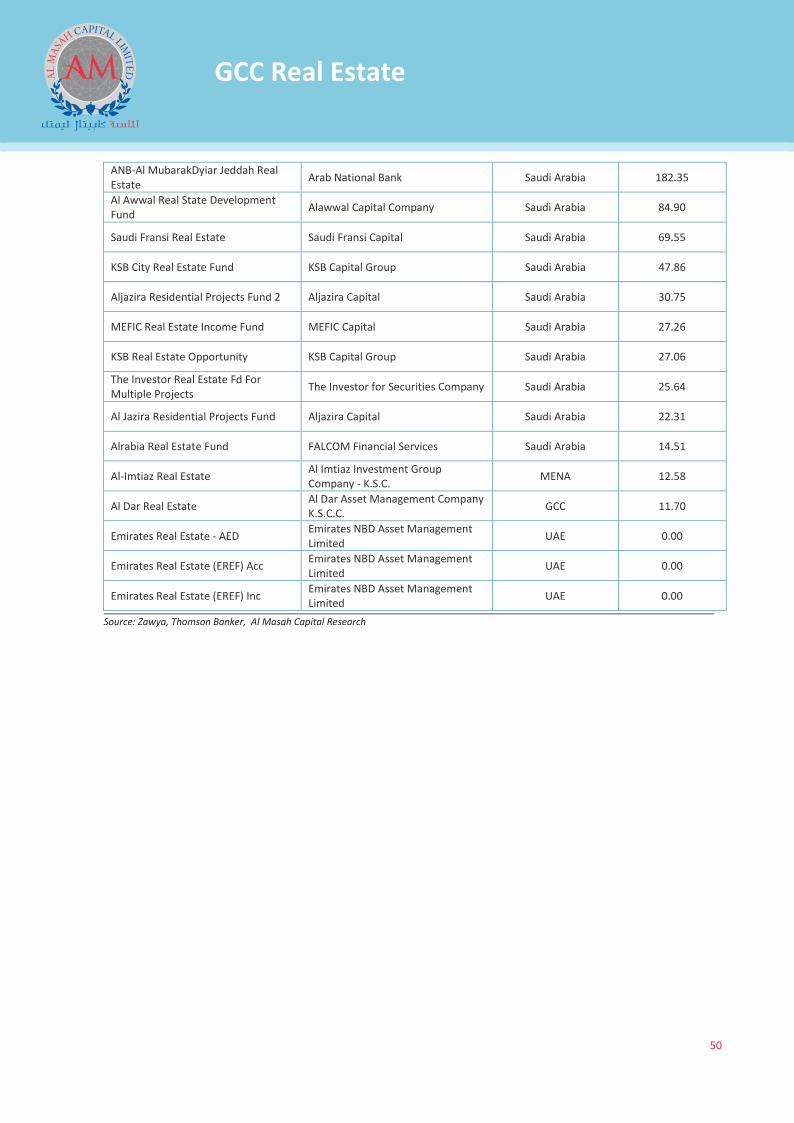
X
50
GCC Real Estate
ANB-Al MubarakDyiar Jeddah Real Estate Arab National Bank Saudi Arabia 182.35
Al Awwal Real State Development Fund Alawwal Capital Company Saudi Arabia 84.90
Saudi Fransi Real Estate Saudi Fransi Capital Saudi Arabia 69.55
KSB City Real Estate Fund KSB Capital Group Saudi Arabia 47.86
Aljazira Residential Projects Fund 2 Aljazira Capital Saudi Arabia 30.75
MEFIC Real Estate Income Fund MEFIC Capital Saudi Arabia 27.26
KSB Real Estate Opportunity KSB Capital Group Saudi Arabia 27.06
The Investor Real Estate Fd For Multiple Projects The Investor for Securities Company Saudi Arabia 25.64
Al Jazira Residential Projects Fund Aljazira Capital Saudi Arabia 22.31
Alrabia Real Estate Fund FALCOM Financial Services Saudi Arabia 14.51
Al-Imtiaz Real Estate Al Imtiaz Investment Group Company - K.S.C. MENA 12.58
Al Dar Real Estate Al Dar Asset Management Company K.S.C.C. GCC 11.70
Emirates Real Estate - AED Emirates NBD Asset Management Limited UAE 0.00
Emirates Real Estate (EREF) Acc Emirates NBD Asset Management Limited UAE 0.00
Emirates Real Estate (EREF) Inc Emirates NBD Asset Management Limited UAE 0.00
Source: Zawya, Thomson Banker, Al Masah Capital Research
GCC Real Estate Sector Report_V3.indd 50GCC Real Estate Sector Report_V3.indd 50 11/10/15 6:49 PM11/10/15 6:49 PM
X
51
GCC Real Estate
Al Masah Capital Management Limited
Level 9, Suite 906 & 907 ETA Star - Liberty House Dubai International Financial Centre Dubai-UAE P.O.Box 506838 Tel: +971 4 4531500 Fax: +971 4 4534145 Email: [email protected] Website: www.almasahcapital.com Disclaimer: This report is prepared by Al Masah Capital Management Limited (“AMCML”). AMCML is a company incorporated under the DIFC Companies Law and is regulated by the Dubai Financial Services Authority (“DFSA”). The information contained in this report does not constitute an offer to sell securities or the solicitation of an offer to buy, or recommendation for investment in, any securities in any jurisdiction. The information in this report is not intended as financial advice and is only intended for professionals with appropriate investment knowledge and ones that AMCML is satisfied meet the regulatory criteria to be classified as a ‘Professional Client’ as defined under the Rules & Regulations of the appropriate financial authority. Moreover, none of the report is intended as a prospectus within the meaning of the applicable laws of any jurisdiction and none of the report is directed to any person in any country in which the distribution of such report is unlawful. This report provides general information only. The information and opinions in the report constitute a judgment as at the date indicated and are subject to change without notice. The information may therefore not be accurate or current. The information and opinions contained in this report have been compiled or arrived at from sources believed to be reliable in good faith, but no representation or warranty, express, or implied, is made by AMCML,as to their accuracy, completeness or correctness and AMCML does also not warrant that the information is up to date. Moreover, you should be aware of the fact that investments in undertakings, securities or other financial instruments involve risks. Past results do not guarantee future performance. We accept no liability for any loss arising from the use of material presented in this report. This document has not been reviewed by, approved by or filed with the DFSA. This report or any portion hereof may not be reprinted, sold or redistributed without our prior written consent.
Copyright © 2015 Al Masah Capital Management Limited
Al Masah Capital: GCC Real Estate Sector
December 2015
GCC Real Estate Sector Report_V3 COVER.indd 1 11/10/15 6:59 PM