Embed Size (px)
Citation preview

Twentieth Symposium (International) on Combustion/The Combustion Institute, 1984/pp. 1539-1546
REACTIVITY AND COMBUSTION OF COAL CHARS
WAYNE F. WELLS, STEPHEN K. KRAMER, L. DOUGLAS SMOOT
AND
ANGUS U. BLACKHAM Brigham Young University, Provo, Utah 84602
Seven industrial process chars were tested to determine their reactivities and/or combus- tion characteristics. Char densities, total surface areas, and elemental and proximate com- positions were measured. Reactivity tests were conducted over three temperature ranges: thermogravimetric analysis (TGA) with air (550-750 K), with CO2 in a fixed-bed (1070-1270 K) and with air in a drop-tube furnace (1300-2100 K). In TGA tests, reactivities among chars differed by almost two orders of magnitude at the same temperature. Fixed-bed CO2 tests gave mass reactivities that differed by about one order of magnitude, while mass reactivities at high temperature in the drop-tube furnace differed by only a factor of two. Parent coal type and char formation conditions are major factors influencing reactivity in low and inter- mediate temperature ranges. N2-BET surface area does not adequately explain observed reac- tivity in any temperature range while variation in external surface area does correlate reac- tivity at high temperature. High temperature reactivities compared well with predictions from a pore tree/char oxidation model, after adding char volatiles percentage. Only high temper- ature reactivity data characterized the char consumption rate in a laboratory combustor, but a significant residual char volatiles content appeared to be essential for flame stability.
1. Introduction
The basic study of the reaction rate processes of chars is important to the efficient consumption of coal and to the use of residual chars. Smith 1 has recently reviewed char combustion. Cogoli et al. 2 have conducted reactivity experiments with three process chars in a fiat flame furnace. Others have tested a fourth process char. 3 The purpose of this study was to correlate the properties of residual chars from several coal processes with their combustion behavior. Process chars were selected in order to provide adequate quantities for both reactivity and laboratory combustion tests.
Five chars were used in all reactivity tests while two of these chars, together with two other similar chars available in sufficient quantity, were tested in the laboratory combustor. Physical characterization included elemental and proximate analyses, N2-BET surface area, density, porosity, size distribution and scanning electron micrographs (SEMs). Mass reac- tivity was measured in air at low temperature (TGA), at intermediate temperature in a fixed-bed with CO2 and at high temperature in a drop-tube furnace with air. The high temperature reactivity data were compared to the intrinsic reactivity data given by Smith. 4 The carbon consumption values were also compared to those predicted by a pore tree/char
oxidation model, corrected for volatiles and mois- ture content. 5
2. Char Properties
The chars with process conditions and parent coal types are listed in Table I. Chars were obtained from moving bed (Char E), fluidized bed (Char B) and entrained flow reactors (Chars A, C, D, F, G). Parent coal ranks were either bituminous or sub- bituminous. Carbon, hydrogen, nitrogen and sulfur percentages were determined by elemental analy- sis. Char and parent coal volatile matter were de- termined by ASTM procedure, with the modifica- tion for sparking coals used for the lighter chars (Table II). Parent coal data are included for com- parison.
Table II also shows N.2-BET surface areas and densities of the chars. N2-BET adsorption provides a particle surface area, but largely excludes area contained in micropores. 6'7 Bulk density was mea- sured from the packed char. Apparent density was calculated from the bulk density using a void frac- tion of 0.45, which has been found to be common in such packings, s Methanol density corresponds closely to helium density for chars and other low volatile carbons, 9'I~ and was used as a measure of
1539
1540 COAL COMBUSTION
TABLE I Test char process characteristics
Char Process
Approximate Amount Obtained
(kg)
Mass Mean Reactor Diameter (p.m) Heat-up Reaetion Vessel
As At~er Reactor Parent Reaction Rate Residence Temp Pressure Received Milling Type Coal Atmosphere (~ Time (~ (ATM)
A Bi-Gas 5
B FMC 600
C Occidental 5
D Rockwell Hydrogasi- 5 fication
E Toscoal Bench Scale 400
F Occidental 300
G Rockwell Hydroli- 300 quefaction
260 69 2-Stage En- Montana Char Combustion 105 3 sec. 1100-1200 50 trained Rose- Gases
bud Subbit.
490 89 4-Staged Flui-Pitts. Bit. Combustion Gases 103 2 hrs. 333--900 1 dized Bed and Steam
63 63 Externally Wyodak N2, COz 104 1.5 see. 600-800 1 Heated Subbit. Flow Lab Scale
280 60 High Mixing Kentucky H~, 02, H20 3 • 1 sec. 900-1000 70 Entrained #9 Bit. 105 Flow
10000 55 Externally Utah Bit. Pyrolysis Products 103 15-30 min. 525 1 Heated Moving Bed Bench Scale
60 60 Char Recycle Wyoming Combustor 104 2 sec. 600-800 1 Pilot Plant Mon- Gases
arch Subbit.
280 61 High Mixing Kentucky H2, Steam 3 • 0.60 sec. 900-1000 70 Entrained #9 Bit. 105 Flow
true density. Porosity was calculated from apparent and methanol densities. Results show that chars with high N2-BET surface areas do not necessarily have high porosities. Chars A and C have high surface area and high porosity, B has moderately high sur- face area and low porosity, D has low surface area and high porosity, and E has low surface area and low porosity.
Scanning electron micrographs were made of the char particles as received. A, C and D appeared to be very porous. E exhibited few pores and B ap- peared to be solid. Size distributions were mea- sured by sieving through standard screens and with an electronic counter (Table I). As-received sizes varied from 60 I~m (mass mean) for F to 1 cm for E. Size reduction for some chars was necessary for reactivity and combustion tests. For the interme- diate temperature reactivity tests, B and E were ball-milled and then passed through 250 ixm screen. The same procedure was used for low and high temperature reactivity tests with A also being ground. Further classification of each char into a 63-75 Ixm fraction was completed for high tem- perature reactivity tests. Combustor tests required larger amounts of char that were reduced to mass mean diameters of 55 to 89 Ixm (70% through 200 mesh) with an impact hammer mill.
3. Char Reactivity
Mass reactivity is herein defined as the mass rate of consumption of char per instantaneous unit of char mass. Reactivity bases of per unit of external area and per unit of reacting surface area (intrinsic reac- tivity) are also examined.
Low Temperature
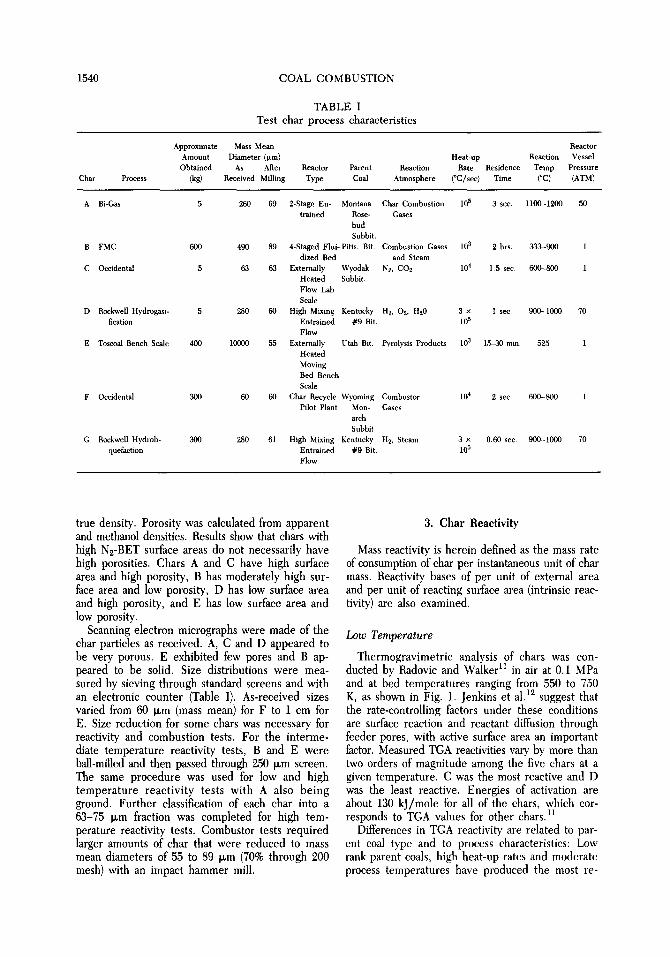
Thermogravimetric analysis of chars was con- 11 ducted by Radovic and Walker in air at 0.1 MPa
and at bed temperatures ranging from 550 to 750 K, as shown in Fig. 1. Jenkins et al.lZ suggest that the rate-controlling factors under these conditions are surface reaction and reactant diffusion through feeder pores, with active surface area an important factor. Measured TGA reactivities vary by more than two orders of magnitude among the five chars at a given temperature. C was the most reactive and D was the least reactive. Energies of activation are about 130 kJ/mole for all of the chars, which cor- responds to TGA values for other chars, n
Differences in TGA reactivity are related to par- ent coal type and to process characteristics: Low rank parent coals, high heat-up rates and moderate process temperatures have produced the most re-

REACTIVITY AND COMBUSTION OF COAL CHARS 1541
active chars in other studies. 12'13 C, the most re- active char tested, is from a subbituminous coal and a rapid heating process. A is from a subbituminous coal but with a higher process temperature than C. D is from a bituminous coal and a higher process temperature than C. E and B are from bituminous coals, but were formed at lower heating rates and
temperatures than A, C and D in fixed and fluid- ized bed reactors. These char reactivities are not correlated by measured N2-BET internal surface area. Nor do measured char apparent densities or particle size variations provide an explanation. Ra- dovic and Walker ll indicate that active surface sites are important.
TABLE II Elemental and proximate analyses of chars and parent coals
A) Chars A B C D E F G
Elemental H 1.0 1.7 1.8 1.9 2.7 1.1 0.9 C 77.5 80.1 78.7 73.8 71.2 80.8 76.1 N 0.4 1,8 1.3 1.3 1.8 1.3 0.9 O 0.2 0.7 6.5 3.6 8.7 3.5 1.6 S 0.4 2.8 0.3 1.6 0.5 0.7 1.9 Ash 21.5 12.9 11.4 17.8 15.1 12.6 18.6
Proximate Moisture 1.2 2.0 1.3 2.5 1.0 4.0 2.0 Ash 21.8 13.7 11.5 18.0 16.8 13.1 18.8 Volatile
Matter 5.6 9.1 15.1 7.0 17.0 12.6 6.1 Fixed
Carbon 71.4 75.2 72.1 72.5 65.2 70.3 73.1 Heating Value
(103 kJ/kg) 27.7 29.7 28.1 27.2 26.4 27.7 26.9 N~-BET Surface
Area (m2/g) 340 115 196 5.6 8.5 298 15 Apparent
Density 1 (g/ cm 3) 0.87 1.52 0.86 0.93 1.43 0.84 1.00
Porosity 1 0.58 0.13 0.55 0.51 0.11 0.56 - -
Montana Utah Kentucky Wyoming Kentucky B) Parent Coals Rosebud King Wyodak Pittsburgh #9 Monarch # 9
Elemental H 5.1 6.1 5.8 5.3 5.1 5.0 5.1 C 70.1 74.2 67.5 77.5 73.5 69.1 73.5 N 1.3 1.4 1.3 1.5 1.3 1.3 1.3 O 15.4 11.0 19.8 8.5 8.5 18.2 8.5 S 0.6 0.7 0.3 1.2 2.9 0.7 2.9 Ash 7.5 6.6 5.3 6.0 8.8 5.7 8.8
Proximate Moisture 2.8 4.0 6.0 2.0 5.1 11.6 5.1 Ash 9.2 6.3 6.4 6.0 9.1 5.0 9.1 Volatile
Matter 39.0 34.9 47.3 36.6 38.2 37.0 38.2 Fixed
Carbon 49.0 54.8 40.3 55.4 47.6 46.4 47.6
JFor -200 mesh fraction except F and G for unscreened char.
1542 COAL COMBUSTION
T(K) 700 650 600 550
2 .0 0 ~
$ 0.5
".>-- 0.4
~. 0.3
0 Ch
0 ~z 0.1
[ ] Char D
Char E " , [ ]
I I I I I 1.4 1.5 1.6 1.7 1.8
Bed Temperature (103/T, KI )
FIG. 1. Char reactivity from thermogravimetric analysis in 0.1 MPa air at low temperatures, u
Intermediate Temperature
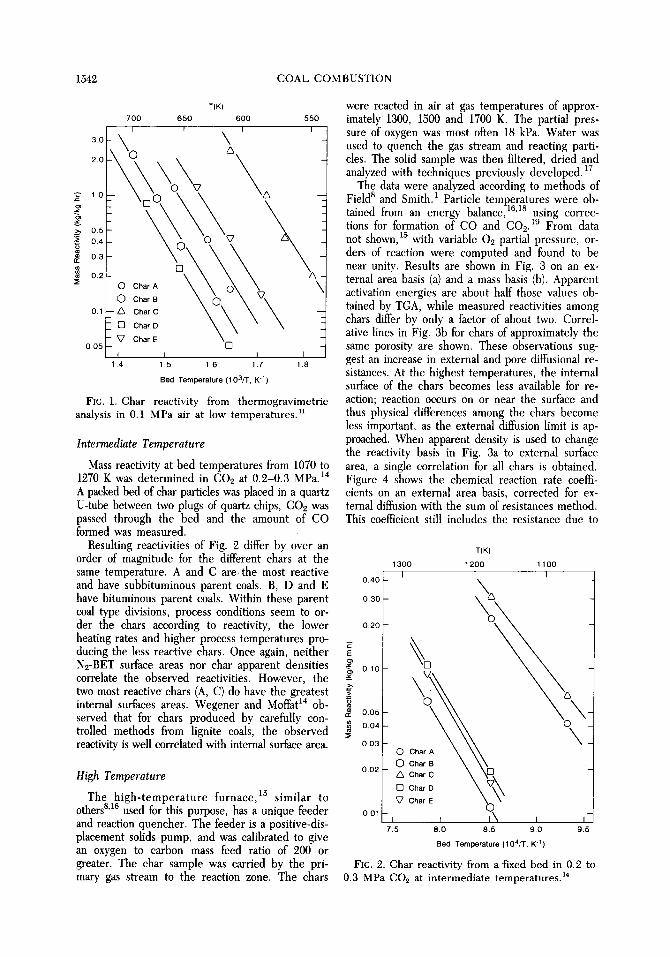
Mass reactivity at bed temperatures from 1070 to 1270 K was determined in CO2 at 0.2-0.3 MPa. 14 A packed bed of char particles was placed in a quartz U-tube between two plugs of quartz chips, CO2 was passed through the bed and the amount of CO formed was measured.
Resulting reactivities of Fig. 2 differ by over an order of magnitude for the different chars at the same temperature. A and C are the most reactive and have subbituminous parent coals. B, D and E have bituminous parent coals. Within these parent coal type divisions, process conditions seem to or- der the chars according to reactivity, the lower heating rates and higher process temperatures pro- ducing the less reactive chars. Once again, neither N2-BET surface areas nor char apparent densities correlate the observed reactivities. However, the two most reactive chars (A, C) do have the greatest internal surfaces areas. Wegener and Moffat 14 ob- served that for chars produced by carefully con- trolled methods from lignite coals, the observed reactivity is well correlated with internal surface area.
High Temperature
The high-temperature furnace, 15 similar to 8 16 others ' used for this purpose, has a unique feeder
and reaction quencher. The feeder is a positive-dis- placement solids pump, and was calibrated to give an oxygen to carbon mass feed ratio of 200 or greater. The char sample was carried by the pri- mary gas stream to the reaction zone. The chars
were reacted in air at gas temperatures of approx- imately 1300, 1500 and 1700 K. The partial pres- sure of oxygen was most often 18 kPa. Water was used to quench the gas stream and reacting parti- cles. The solid sample was then filtered, dried and analyzed with techniques previously developed, tr
The data were analyzed according to methods of Field 8 and Smith. I Particle temperatures were ob- tained from an energy balance, 16'18 using correc- tions for formation of CO and CO2.19 From data not shown, 15 with variable 02 partial pressure, or- ders of reaction were computed and found to be near unity. Results are shown in Fig. 3 on an ex- ternal area basis (a) and a mass basis (b). Apparent activation energies are about half those values ob- tained by TGA, while measured reactivities among chars differ by only a factor of about two. Correl- ative lines in Fig. 3b for chars of approximately the same porosity are shown. These observations sug- gest an increase in external and pore diffusional re- sistances. At the highest temperatures, the internal surface of the chars becomes less available for re- action; reaction occurs on or near the surface and thus physical differences among the chars become less important, as the external diffusion limit is ap- proached. When apparent density is used to change the reactivity basis in Fig. 3a to external surface area, a single correlation for all chars is obtained. Figure 4 shows the chemical reaction rate coeffi- cients on an external area basis, corrected for ex- ternal diffusion with the sum of resistances method. This coefficient still includes the resistance due to
T(K)
1300 1200 1100 I I I
0.40 ~
0.30 ~ : O
E ~ 0.20 ~ [ 3
0.10
r 0.05
0.04
0.03 o
0.02 O /k
0 ~2
0.01 I
7.5 8.0 8.5 9.0 9.5
Bed Temperature (104/T, K -1)
FIG. 2. Char reactivity from a fixed bed in 0.2 to 0.3 MPa C02 at intermediate temperatures) 4

REACTIVITY AND COMBUSTION OF COAL CHARS 1543
pore diffusion. The values, which are commonly used for modeling of char reaction processes, compare well with those shown by Smith. 1 3.0
4. Intrinsic Reactivity ~. 2 0
A method for determining the intrinsic reactivity of chars has been outlined by Smith. 4 The pore dif- fusion effect is assumed to be the same as that in porous catalysts. 2~ The Thiele modulus and effec- ~ lO tiveness factor are used.to determine the extent of ~ o9 reactant penetration into the pores. Smith corre- ~ o 8
lated available intrinsic reactivity data over a wide ~ o.z temperature range for several carbons and chars 4 ~ o6 with some data scatter. With this method, the in- ~ o5 trinsic reactivity of chars A-E at high temperatures was computed using a bimodal pore distribution o o4 model. 21 Results are shown in Fig. 5 with the cor- relative line and bands for data scatter from the o3 Smith correlation. Intrinsic reactivity values for the process chars were within the data scatter for all cases. Data were also examined with a monomodel pore size distribution, 72 but resulting reactivities were below those shown in Fig. 5 due to overes- timation of active internal surface area.
At high temperatures, much of the internal sur- face area is not involved in reaction due to the low oxygen concentrations inside the particles. Mea-
>,
101
10-2 102
I
0 Char A
~) Char B Z~ Char C
0 Char D
Char E
(a)
I i i i
(b)
0 ~ A High Porosity Chars
�9 ~ Z ) ~ -
.5 5 0 5.5 6.0 6.5 7.0
particle Temperature (104/-l'p, K "1 )
FIG. 3. Char reactivity in air at high tempera-
lO
tures: a. Reactivity based on particle external sur- face area, b. Mass reactivity.
Tp(K)
2100 1900 1700 1 5 0 0
0 Char A ~ : ~ - - - - A Char B O~. -S"" O CharC
I I ' i 5 0 5 5 6 .0 6.5 7.0
Particle Temperature (104/Tp, K I )
FK;. 4. Char reaction rate coefficient at high tem- perature based on particle external surface area, with unity reaction order.
sured internal surface areas for the chars range from about 6 to over 300 mZ/g (see Table II). The ex- ternal surface area for these chars, assuming solid spheres, is about 0.1 m2/g. The amount of active surface area depends mainly on porosity, temper- ature and pore diameter. From the computational method of Ref. 4, the surface area available for re- action was predicted to be as much as three orders of magnitude greater than the external surface area, dropping to near the external surface area at the highest temperatures. The rate of reaction on the internal surface varies with the local oxygen con- centration, and is often far below that near the par- ticle surface. In fact, Fig. 3b suggests that much of the internal surface is ineffective at high tempera- ture. Because the majority of the porosity is ac- counted for by the macropores, an increase in po- rosity also leads to an increase in area available for reaction. The ratio of the ordinate values from the correlative lines of Figs. 3a and 5 suggests that the active total area participating in surface reaction is about fifty times the external area at 1400 K and declines to only two at 2000 K. Thus, at the high temperature, results suggest that very little of the internal surface participates in the reaction, which explains why external surface area correlates results so well.
A predictive model of porous char oxidation has been developed by Simons 5 using adsorption-de- sorption rate data for nonporous carbons. This method calculates diffusion through a statistical pore- tree model rather than the Thiele modulus with an

1544 COAL COMBUSTION
t 0 ~
10-1
10-2
10 3
10 -4
a: 10-5
r .
t 0 "6
10-7
10 .8
10"91
4
1 I I l
- \
\ \ \
k �9 Char A �9 Char B �9 Char C �9 Char D �9 Char E Intrinsic Reactivity Correlation ( 1 ) - Data Scatter in Ref. 1
I I 6 8 10 12
Particle Temperature (104/Tp, K "1 ) 14 16
FIG. 5. Comparison of intrinsic char reactivity at high temperature with correlation of Smith.1 Active surface area basis.
effectiveness factor in a bimodal pore system. 4 Val- ues predicted by this model have compared well with experimental data obtained from other labo- ratories, 5'8'za2z but the model has not previously been used for process chars.
This model was used to predict the extent of char conversion at high temperatures. Particle temper- atures were computed from an energy balance. Measured values were used for the particle diam- eters, porosities, internal surface areas, mole frac- tions of oxygen and gas pressures. The rate en- hancement factor, to account for effects of catalysis or a high density of active sites, was taken as unity. The deviation parameter, which accounts for the variation of the char structure from statistical the- ory, was neglected.
Because the model only deals with heteroge- neous reactions of carbon, predictions do not in- clude weight loss due to volatiles emission. Cor- rections for volatiles content were made by adding the measured percentage of proximate volatile mat- ter and moisture for each char to the predieted percentage of heterogeneous carbon consumption. Predictions were made for chars A-E at each of three temperatures with an average absolute differ- ence of 13%, and a maximum difference of 30% for 14 of the 15 cases. The differences in measured and
predicted values are probably due in part to changes in porosity caused by further devolatilization and by loss of micropores due to particle plasticity at high temperatures.
5. Char Combustion
The chars were tested in a down-flow, cylindrical (20 cm ID) laboratory eombustor to determine the relationship between physical properties, reactivi- ties and the combustion characteristics. The com- bustor, described previously, z~ was lengthened for some of the tests to provide longer residence times. The sample system 17 was adapted for collection of large char samples.
Four chars were tested: z7 F (high volatiles, high porosity), E (high volatiles, low porosity), B (me- dium volatiles, low porosity), and G (low volatiles, high porosity). F and G were similar to C and D respectively, and were available in sufficient quan- tities. Each char was tested for flame stability and carbon conversion. The product of char heating value and feed rate was held near constant in an attempt to minimize effects of differences in combustor heat loss. Therefore, char feed rate varied between 14 and 20 kg/hr. Air/fuel stoichiometric ratio varied between 0.6 and 1.2. Other quantities varied wereF solids loading in primary, from 40 to 70%; percent of total air in primary, from 17.8 to 6.3%; primary air velocity, from 29.2 to 4.3 m/sec; calculated sec- ondary air swirl number, from 2.2 to 3.0; and com- bustor length, from 150 to 215 cm. The combustor was preheated to 1450 K at 45 cm (all locations are downward axial distances from the char inlet at the top). Wall temperatures along the length of the combustor and visual observations at 15 cm and 83 cm were used to determine flame stability. Char consumption was determined by ash analysis of samples from the water-quenched probe near the combustor exit (Fig. 6). Due to vaporization of ash during combustion and to dissolution of ash in the quench water, data shown are a lower limit and most accurate at high conversion values.
Figure 6a shows carbon conversion at various air/ fuel stoichiometric ratios for maximum wall tem- perature values of 1300-1450 K in the longer re- actor configuration (samples taken at 189 cm) and for 1200-1300 K in the short reactor configuration (samples taken at 150 cm). At low air/fuel ratios, char residence time was longer (ca. 120 ms) than at high air/fuel ratios (ca. 70 ms). At air/fuel ratios less than one, consumption of high volatile chars E and F was below low volatile chars B and G, pos- sibly since released volatiles react to form CO2, re- moving oxygen from further reaction with char.
Char F burned well under all conditions. The flame was a bright white color and the onset of ig- nition was near the inlet. The thermocouple at 45

REACTIVITY AND COMBUSTION OF COAL CHARS 1545
1~176 I 8O
60 .5
.~ 1 O0 cL
8 6o
o
6 0
40
20
(a)
�9 ~ o ~ o Q o - - ~ - - @ o �9 amO
@
Open Symbols - 1300 - 1450 K Long Configuration, Wall Temp. Closed Symbols - 1200 o" 1300 K Short Configuration, Wall Temp.
I I I I I I t 6 7 8 .9 1 0 11 1 2
Air/Fuel Stoichiometric Ratio
o / r p ~ - ~ - o - - o ~ . . Q o 0 0 / O ~ u 0
o
Symbol Char B
0 0 F 0 G 0 E
(b)
I I I 11 oo 1200 1300 1400
Maximum Wall Temperature, K
FIG. 6. The effects of (a) air/fuel stoichiometric ratio at high temperatures and (b) maximum mea- sured wall temperature at various air/fuel ratios on char consumption in a laboratory-scale combustor.
cm gave the highest temperature. Char consump- tion was high, 91 to 99% in the short combustor configuration, at air/fuel stoichiometric ratios of 0.89 to 1.19 and 83 to 97% in the longer combustor con- figuration, at air/fuel ratios of 0.74 and 0.97 (Fig. 6a).
Char E burned with a stable flame; however, the onset of ignition was some distance from the inlet. The flame was a brilliant yellow color. The highest thermocouple reading was at 106 cm from the top of the combustor. For feed rates below 12 to 13 kg/hr in the long combustor configuration, the flame was not stable. The extent of char consumption compared well with F.
Chars B and G did not burn with stable flames in the long configuration. However, attempts to stabilize the flame by adjusting primary stream air/ fuel ratios and secondary stream air flow rate and swirl number to create an extremely fuel-rich zone were successful in the short combustor configura- tion for G. Such attempts in the long combustor configuration only impeded flame disappearance. As with E at low fuel feed rates, unstable burning was characterized by movement of the flame slowly away from the inlet, with 10 to 30 minutes to flame dis- appearance. As the flame receded, wall tempera- tures cooled from 1400 K to 1100 K. Solid samples were taken at the beginning of each test and later as the flame progressed down the combustor. Char consumption values for samples obtained at the be- ginning of a test were as high as those for F and E, while samples obtained as the flame moved down
the combustor were lower, down to 31% for Char G at 1211 K (Fig. 6b). The flame was a dull red, thought to be characteristic of heterogeneous com- bustion.
From these tests, flame stability seemed to be principally dependent on char volatiles content and not on char reactivity. E and F had high char prox- imate volatiles content and exhibited stable flames under most conditions. G burned stably in the short combustor configuration when air flow rates and swirl were set to produce stoichiometric conditions with the proximate volatiles content. However, as seen in Fig. 6a, char conversion has little relation to flame stability. All the chars were nearly completely con- sumed when the combustor was hot, whether the flame was stable or not. A bright flame was not re- quired for efficient char consumption. B and G ex- hibited dull flames but had high conversion values at high temperatures. Thus, similar conversion rates of these chars relate to their similar reactivities at high temperature (Fig. 4).
Differences in ignition and flame stability among chars also observed by Cogoli, et al. 2 were attrib- uted principally to the influence of porosity on char reactivity. However, the present work indicates that high porosity chars burn unstably as well as stably. G, with high porosity, burned unstably while F, also with high porosity, had a very stable flame. Porosity may have had a secondary effect, since F, with high porosity, burned more stably than E which has a high volatiles content but lower porosity.
6. Conc lus ions
Low temperature char reactivities are dominated by internal surface reaction and vary with parent coal type and process conditions. The decrease in the variation of the reactivity data among the chars in the intermediate temperature range in CO2 in- dicated increasing diffusional resistance. At inter- mediate temperatures, parent coal type continued to be the dominant factor determining reactivity, with process conditions playing a secondary role. In the high temperature tests, external and pore dif- fusional resistance become increasingly important as shown by the lack of variation of reactivity among very different chars and by the reduction of the energies of activation to slightly less than half the value obtained in the lower temperature tests. The external area of the chars was the major factor af- fecting reactivity at high temperature. High tem- perature carbon conversion values were also suc- cessfully computed using an available intrinsic reaction model.
Low and intermediate temperature reactivity tests do not predict the high temperature combustion characteristics of the chars. Results from high tem- perature reactivity tests were consistent with car-
1546 COAL COMBUSTION
bon conversion rates observed in the laboratory combustor. However, the high temperature reac- tivity tests did not relate to the flame stability of the chars during combustion, which is believed to be controlled by the amount of char volatiles con- tent.
Acknowledgments
This work was supported by the U.S. Depart- ment of Energy, Pittsburgh Energy Technology Center, with Mr. J. D. Hickerson, project officer. TGA tests were performed by Radovic and Walker at Pennsylvania State University. Fixed-bed CO2 tests were conducted by Wegener and Moffat at Phillips Petroleum Company. We also thank Dr. G. A. Simons for supplying the computer code for the pore t ree /char oxidation model and for his helpful insights. Appreciation is also expressed to all of the organizations noted in Table 1 for pro- viding char.
8. REFERENCES
1. SMITH, I. W.: Nineteenth Symposium (Inter- national) on Combustion, p. 1045, The Com- bustion Institute, 1982.
2. COGOIA, J. G., GRAY, D. AND ESSENHIGH, R. H.: Combust. Sci. and Tech., 16, 165 (1977).
3. DVRAI-SWAMY, K., KNELL, E. W. AND JESSE, D.: Paper presented at the Western States Section of the Combust ion Inst i tute , 1982 Spring Meeting, University of Utah, Salt Lake City, Utah, April 5-6, 1982.
4. SMITH, I. W.: Fuel, 57, 409 (1978). 5. SIMONS, G. A.: Nineteenth Symposium (Inter-
national) on Combustion, p. 1067, The Com- bustion Institute, 1982.
6. ANDERSON, R. B., HALL, W. K., LECKY, J. A. AND STEIN, K. C.: J. Phys. Chem., 60, 1548 (1956).
7. GAN, H., NANDI, S. P. AND WALKER, P. L., JR.: Fuel, 51, 272 (1972).
8. FIELD, M. A, : Combust. Flame, 13, 237 (1069).
9. FRANKLIN, R. E.: Trans. Far. Soc., 45, 668 (1949). 10. MAHAJAN, O. P. AND WALKER, P. L., JR.: An-
alytical Methods for Coal and Coal Products, (Karr, C., Ed.), p. 125, Academic Press, 1978.
11. RADOVlC, L. R. AND WALKER, P. L., JR.: Fuel, 62, 849 (1983).
12. JENKINS, a. G., NANDI, S. P. AND WALKER, P. L., JR.: Fuel, 52, 288 (1973).
13. ASHU, J. T., NSAKALA, N. Y., MAHAJAN, O. P. AND WALKER, P. L., JR.: Fuel, 57, 250 (1978).
14. WEGENER, D. C. AND MOFFAT, A. J.: Phillips Petroleum Co., "'Investigations of Char Reac- t iv i ty -Par t II,'" Research Center Report, Bar- tlesville, Oklahoma, September, 1982.
15. WELLS, W. F. : High Temperature Reactivity of Selected Process Coal Chars, M.S. Thesis, Brigham Young University, 1985.
16. AYLING, A. B. AND SMITH, L W.: Combust. Flame, 18, 173 (1972).
17. BURKINSItAW, J. R., SMOOT, L. D., HEDMAN, P. O. AND BLACKHAM, A. U.: I/EC Fundamen., 22, (1983).
18. FIELD, M. A., GILL, D. W., MORGAN, B. B. AND HAWKSLEY, P. G. W.: Combustion of Pul- verized Coal, p. 192, BCURA, Leatherhead, England, 1967.
19. ARTHUR, J. R.: Trans. Faraday Soc., 47, 164 (1951).
20. MEHTA, B. N. AND Anls, R.: Chem. Eng. Sci., 26, 1699 (1971).
21. SMITH, I, W. AND TYLER, R. J.: Fuel, 51, 312 (1972).
22. WHEELER, A.: Adv. Catal., 3, 249 (1951). 23. SMITH, I. W.: Combust. Flame, 17, 303 (1971). 24. HAMOR, R. J., SMITH, I. W. AND TYLER, R. J.:
Combust. Flame, 21, 153 (1973). 25. SIMONS, G. A.: Combust. Sci. and Tech., 20, 117
(1970). 26. ASAY, B. W., SMOOT, L. D. AND HEDMAN, P.
O.: Combust. Sci. and Tech., 35, 15 (1983). 27. KRAMER, S. K. : The Combustion Characteristics
of Residual Chars from -Synthetic Fuel Pro- cesses, M.S. Thesis, Brigham Young Univer- sity, 1985.
COMMENTS
E. Suuberg, Brown University, USA. Was there a significant difference in variation of surface area with burnoff among the different coals (in the low and intermediate temperature reactivity experi- ments)?
Authors" Reply. No measurements of internal
(BET-N2) surface area were made for low and in- termediate temperature tests as a function of per- centage buruoff However, Wegener and Moffat, Ref. 14 above, measured reactivity as a function of burn- off at 900 ~ C. Over most of the burnoff range, up to about 60%, char reactivity values were near con- stant, implying little change in internal surface area.


![SW MATM through ZONE - Cisco · %SW_MATM-4-MACFLAP_NOTIF:Host[enet]in[chars][dec]isflappingbetweenport[chars]andport [chars] Recommended Checkthenetworkforpossibleloops. Action %SW_MATM-4-WIRELESS](https://img.dokumen.tips/doc/110x75/5f7c820f9a0d1f3f5c674488/sw-matm-through-zone-cisco-swmatm-4-macflapnotifhostenetincharsdecisflappingbetweenportcharsandport.jpg)