Embed Size (px)
Citation preview

RARYI
ELECTROFLOCCULATION OF RIVER WATER USING
IRON AND ALUMINIUM ELECTRODES
AUBREY NARE MASHAMAITE
B. Tech (Chemical Engineering)
Dissertation submitted in fulfilment of the requirements for the Magister Technologiae
Degree in Chemical Engineering at the Vaal University ofTechnology
Supervisor:
September 2008
Vanderbijlpark
Dr. H.C. van der Merwe
1 :(~~-~ UNIVERSITY OF TECHNOLOGY :~-:.-"l, •'<o
cirrJer Nr .
I I 2009 -08- 3 1 t
""rP:~· ---::a:l r·: J
I L BR_ RY s ·ocK

Declaration
This dissertation is my own, unaided work except where indicated to the contrary. It is being
submitted for the M-Tech degree to the Department of Chemical Engineering at the Vaal
University of Technology, Vanderbijlpark. It has not been submitted before for any subject,
examination or qualification at any other educational institution.
Signed by student Date
~ 2008-09-24
Aubrey Nare Mashamaite (YYYY-MM-DD)
9707409
ELECTROFLOCCliLATION OF RIVER \\, ATER ii
Acknowledgements
It was a privilege to work with Dr. HC van der Merwe, and together with the co-operation I
had from the Vaal University of Technology staff especially those in the Chemical
Engineering, Chemistry and Research Departments. I would also like to express appreciation
to the following individuals together with their departments and/or their companies: -
Mr James Parsons: Rand Water Technical Specialist- Research
Ms Olga Maleka: VUT B-Tech Student- Chemical Engineering
Ms Constance Tshisikawe: Sasol Infrachem Analyst- Process Laboratory
Mr Oswald Mahle: VUT Lecturer- Chemistry
Mr Josie Moabelo: Gold Fields Librarian- Library (Information)
Mr Reginald Fusane: VUT Research Technician- Chemical Engineering
I hope that some of their influence on my research is reflected in this dissertation. I wish to
acknowledge the continued help and assistance of all the people around me (Family, Friends,
Colleagues and my Mentor); they gave encouragement and their enthusiasm for my research
was infectious, and I have retained interest which they generated over these many days.
Above all these people, I give gratitude to the Almighty God who gave me the serenity and
courage to wake up each day and prove His power through this work.
Thanks
ELECTROFLOCctJl.ATIO"' OF RJ\ ER WATER ill

Abstract
A novel technology in the treatment of river water, which involves an electrochemical
treatment technique to produce domestic or drinking water is being investigated using
aluminium and iron electrodes in an electrochemical circuit. Coagulation and flocculation
are traditional methods for the treatment of polluted water. Electrocoagulation presents a
robust novel and innovative alternative in which a sacrificial metal anode treats water
electrochemically. This has the major advantage of providing mainly active cations required
for coagulation and flocculation, without increasing the salinity of the water.
Electrocoagulation is a complex process with a multitude of mechanisms operating
synergistically to remove pollutants from the water. A wide variety of opinions exist in the
literature for key mechanisms. A lack of a systematic approach has resulted in a myriad of
designs for electrocoagulation reactors without due consideration of the complexity of the
system. A systematic, holistic approach is required to understand electrocoagulation and its
controlling parameters.
An electrocoagulation-flotation process has been developed for water treatment. This
involved an electrolytic reactor with aluminium and/or iron electrodes. The water to be
treated (river water) was subjected to coagulation, by Al(III) and Fe(II) ions dissolved from
the electrodes, resulting in floes floating after being captured by hydrogen gas bubbles
generated at the cathode surfaces. Apparent current efficiencies for AI and Fe dissolution as
aqueous Al(III) and Fe(II) species at pH 6.5 and 7.8 were greater than unity. This was due to
additional chemical reactions occurring parallel with electrochemical AI and Fe dissolution:
oxygen reduction at anodes and cathodes, and hydrogen evolution at cathodes, resulting in
net (i.e. oxidation plus reduction) currents at both anodes and cathodes.
Investigation results illustrate the feasibility of ferrous and aluminium ion electrochemical
treatment as being a successful method of water treatment. Better results were achieved
under conditions of relatively high raw water alkalinity, relatively low raw water turbidity,
and when high mixing energy conditions were available.
ELE<TROFLOCCI ILA"rfO , Of Rl\'ER WATER iv

Table of Contents
TITLE PAGE .......................................................................................................................... i
DECLARATION ................................................................................................................... ii
ACKNOWLEDGEMENTS .............. ....................................... ............................................ iii
ABSTRACT ................................................... ........................................................................ iv
TABLE OF CONTENTS ...................................................................................................... v
LIST 0 F TABLES .............................................................................................................. viii
LIST OF FIGURES .............................................................................................................. ix
CHAPTER 1: INTRODUCTION AND PROBLEM STATEMENT ................................ I
1.1 INTRODUCTION ............................ . ........... ....... ............................................................. 1 1.2 PROBLEM STATEMENT AND MOTIVATION ............ ....................................................... 3
CHAPTER 2: LITERATURE SURVEY ............................................................................. 6
2.1 INTRODUCTION ..................................................................................... . ..... ... ............. . 6 2.2 OBJECTIVES OF WATER TREATMENT AND PURIFICATION ............................................ 7 2.3 LAWS AND REGULATIONS ........................ .................. ... ... ............. ................ ....... . .... .. . 8 2.4 WATER QUALITY .......................... ... .... .......................... .................... ..................... .. ... 9 2.5 RIVER WATER QUALITY .................................. ... .................... ........... ....... . .. ... ........... 12
2.5.1 Vaal Dam water quality ............ .. .................. .. .... ........ ......... ... ... .. ... ............. ................. 12 2.5.2 Natural processes affecting water quality .. .................... .. .............. ... .. .............. ............ 14 2.5.3 Water use and water quality deterioration .... .. .... .... .... .. ... .......... .... .... .. ........... ............. 15 2.5.4 Water and human health .......... ....... ... ............. ......................... ... .. ..................... .. ... ...... 16
2.6 DRINKING WATER QUALITY ................................. ... .. .. ....... . .. .................................... 17 2. 6.1 Water quality criteria ................. ... ...... .. .................... ... .. .............. .. ..... ... ... ............ ... ..... 17 2. 6. 2 Microbiological criteria for drinking water ........ .. ...... ......... ..... ...... ..... .. ..... ..... ............ 17 2. 6. 3 Hardness criteria for drinking water .................... ....... .. ...... .. ..... .... .............. ....... .. ....... 18 2. 6. 4 Aesthetic criteria for drinking water .... .. .................. ..... .... .. .......... ..... .................. ......... 18 2.6.5 Corrosiveness of drinking water .. ...... .. ........ .. .. ......... ... ..... .. .......................................... 21 2.6.6 Water quality index ................................................. ........................ .............................. 22
2. 7 WATER TREATMENT BY HYDROLYSING METAL SALTS ............................................. 23 2. 7.1 Colloid stability and instability ................................ .. .. .. ........... .. .................................. 24 2. 7.2 The basic concept of hydrolysis of metal ions .... ... ...... .. ................ .. .. .... .... ...... .............. 25 2. 7.3 Polynuclear species .................................. ........... ....... .. ...... .. ..... ........ .................. .... ...... 28 2. 7.4 Action of hydrolysing coagulants ..................... .... ....... .. ..... ... ...... ..... ...... .. .. ............... .... 29
2.7.4.1 Charge neutralization ............................................................. ............. ...... ......... ... . 29 2.8 GROUND WATER AND REDOX POTENTIAL. ...................... .... ...... .............. ............. ..... 31 2.9 POURBAIX DIAGRAMS AND REACTIONS IN AQUEOUS SOLUTION ....... .. .. .................... 34
2.9.1 Stability of water ..................................................... ...... ... ............ .... ....... ................ ...... 34
ELF.:CTI{QFLOC<.I ' Lt\.TIO~ Of Rl\ ER \\- TER v

2.9.2 Pourbaix diagrams for iron ...... ... .... ........ ..... ... .. ... ............ .............................. .. ..... ........ 38 2.9.2.1 Iron Complexing ....................................... ....... ............ .. ...... .................................. 39
2. 9. 3 Uses ofPourbaix diagrams ........................... .... .. ......... .. .. ............................................. 44 2.10 ELECTROCHEMISTRY (BACKGROUND AND THEORY) ................................................. 45
2.10.1 Introduction ................................................................................................................... 45 2.1 0.2 Advantages and disadvantages of electrochemistry ..... .. ...... ...................... ... ..... .... .... .. 46 2.10.3 Electrolysis mechanism ............................................ ........... ..... ....... ................. ............. 47 2.10.4 Faraday's Law ...................................... .. ................. ..... .......... .. .......... ... .............. ....... .. 48 2.1 0. 5 Electro.flocculation .......................................... ........ ..... .. ...... .. .................. ...... ............. .. 50
2.1 0.5.1 Theory of electroflocculation ................................................................................. 52 2.1 0.5.2 Electrode properties .................................. ............ .... .. ........ ................................... 53
2.10.5.2.1 Aluminium and its properties ...................................... .... ....... ................... .. .... .. ............. 53 2.10.5.2.2 Iron and its properties .... .... .............. ........ .. ....... .......................................... ....... .. ......... 54
2.10.6 Possible electrochemical mechanisms ................... .... ........... ...... .. .... ............................ 57 2.11 CHEMICAL ISSUES ..................................................................................................... 59
2.11.1 Electrode material ..... ................................................ ....... .. .. ..... ..... ..... .......................... 59 2.11.2 Electrode passivation ................................................................................. ......... .. ........ 60 2.11. 3 Solution pH. ... .. .. ............................................................................................................ 61
CHAPTER 3: EXPERIMENTAL PROCEDURE ............................................................ 62
3.1 INTRODUCTION ................................................................................. .... ..................... 62 3.2 OPERATING VARIABLES ...................................................................... ...... ............... .. 63 3.3 APPARATUS ............................................................................................................... 64 3.4 CELL DESIGN ............................................................................................................. 65 3.5 EXPERIMENTAL PROCEDURE .... ................................................................................. 66 3.6 ANALYTICAL PROCEDURES .. ...... ............................................................................... 67
3. 6.1 Operation procedure for Atomic absorption spectrometer ......... .... .......... .... ................ 67 3.6.1.1 Safety practices ..... .. ............................................................................... .. .............. 67 3 .6.1 .2 Apparatus and gases ............................................................................................... 69 3.6.1.3 Summary ofpractice ....................................................... .................... ....... ............ 69 3.6.1.5 Flame type ............... ................................................................................ ............... 70 3.6.1.6 Lighting instructions .... .. ........................................................................ ..... ........... 71
3. 6.2 Operation procedure for DR 2000 spectrometer ...... .. ........................... .. ...... .......... .... . 71
CHAPTER 4: RESULTS AND DISCUSSIONS ............................................................... 75
4.1 INTRODUCTION .................................. ......... ...................................... .. ........ . .............. 75 4.2 EFFECT OF CONTINUOUS AGITATION ON RIVER WATER TREATMENT ....................... 75 4.3 THE ELECTROCHEMICAL TREATMENT OF RIVER WATER USING IRON ELECTRODES .. 77
4. 3.1 The effect of energy charged on iron dissolution .... ................... ...... .... ......................... 7 8 4. 3. 2 The ejj(!Ct of energy charged on the water colour dissolution ...... .... ............. .. ...... .... ... 79 4.3.3 The effect of energy charged on conductivity ................... ............................................ 79 4.3.4 The effect of energy charged on turbidity .. ............................ .. ............... .. .................... 80 4.3.5 The effect of energy charged on total dissolved solids ................................................. 81 4. 3. 6 The effect of energy charged on phosphate concentration ........................................... 82
4.4 THE ELECTROCHEMICAL TREATMENT OF RIVER WATER USING ALUMINIUM ............ 83 4.4.1 The effect of energy charged on aluminium dissolution ............................................... 83 4.4.2 The effect of energy charged on the water colour dissolution ............................ ...... .... 84 4.4.3 The effect of energy charged on conductivity .. ............ .. ............................................... 85 4.4.4 The effect of energy charged on turbidity ...... ....... ........................................................ 86 4.4.5 The effect of energy charged on total dissolved solids ................................................. 87
F.LECTIWFLOCCI IL.\TION Of RIVER ;\'.\TER vi

4.4.6 The effect of energy charged on phosphate concentration ........................................... 87 4.5 OPTIMISATION ........................................................................................................... 89
4.5.1 The effect on the colour of treated water using iron electrodes ................................... 89 4.5.2 The e_ffect on the colour and pH using iron electrodes ................................................. 90 4. 5. 3 The effect on increased iron concentration in water .................. ........ .. ........................ 91 4.5.3 The effect in reduction of phosphates using iron electrodes ......................................... 92
4.6 COMPARISON BETWEEN ALUMINIUM AND IRON ELECTRODES ................................... 94 4.7 DISCUSSION ............................................................................................................... 95
CHAPTER 5: COST IMPLICATIONS ............................................................................ 96
CHAPTER 6: CONCLUSION AND RECOMMENDATIONS ...................................... 97
REFERENCES ..................................................................................................................... 99
APPENDIX A Experimental Data .................................................................... A-1
APPENDIX B Glossary of Terms and Symbols ............................................... B-1
APPENDIX C Quality Guidelines for Fresh Domestic Water ..................................... C-1
ELECTROFLOCCIILATION Of RIVER\\- .HER vil

List of Tables
Table 2.1: Summarized Acts governing the South African water legislation
Table 2.2: Vaal Dam water quality determinants exceeding the potable water
requirements as determined at the Engelbreghts weir. The SABS
8
guidelines for class 0 and 1 water are also included 13
Table 2.3: Water Quality Index rating 23
Table 2.4: Hydrolysis and solubility constants for Al3+ and Fe3
+ for zero ionic
strength and 25°C 36
Table 3.1: AAS gas supply pressure range 76
Table 4.1: Comparison between aluminium and iron electrodes 99
ELEITROFL.OCCL.LATION OF RI\'ER W .\TER viii

List of Figures
Figure 2.1: The variation in Vaal Dam turbidity as measured over an 18-month
period 13
Figure 2.2.a: Distribution of monomeric Fe hydrolysis product as a function of pH 27
Figure. 2.2.b: Distribution of monomeric AI hydrolysis product as a function of pH 27
Figure 2.3: Stability (Pourbaix) diagram for water 35
Figure 2.4:
Figure 2.5:
Figure 2.6:
Figure 2.7:
Figure 2.8:
Figure 2.9:
Figure 3.1:
Figure 3.2:
Figure 3.3:
Figure 4.1:
Figure 4.2:
Reduction and oxidation potentials of water versus pH
Approximate redox and acid-base behaviour for various types of
natural waters
Simplified Pourbaix diagram for 1 Miron solutions
Pourbaix diagram indicating the stability and instability of ferrate
Pourbaix diagram indicating the predominant area for iron (II) species
37
38
40
43
as it narrows with an increasing pH 43
The electrochemical principle 48
Electrolytic cell representing an experimental setup 62
The experimental setup 64
The electrochemical cell 66
Effect of agitation on pH during electroflocculation of iron electrode 76
Effect of agitation on phosphate removal during electroflocculation of
iron electrode 77
Figure 4.3: The effect of energy charged on the dissolution of iron (theoretical and
practical) and the pH of the solution. 78
Figure 4.4: The effect of energy charged on the colour of the solution using iron
electrode
Figure 4.5: The effect of energy charged on the solution conductivity using iron
electrodes
Figure 4.6:
Figure 4.7:
The effect of energy charged (represented by dosing rate) on the
solution turbidity using iron electrodes
The effect of energy charged on the solution total dissolved solids
using iron electrodes
ELECTilOFL.OCCl L!\TION OF RIYER \\1 ATER
79
80
81
82
ix
Figure 4.8: The effect of energy charged on the phosphate concentration using
iron electrodes
Figure 4.9: The effect of energy charged on the dissolution of aluminium
(theoretical and practical) and the pH of the solution
Figure 4.10: The effect of energy charged on the colour of the solution usmg
83
84
aluminium electrodes 85
Figure 4.11: The effect of energy charged on the solution conductivity using
aluminium electrodes 85
Figure 4.12: The effect of energy charged on the solution turbidity usmg
aluminium electrodes 86
Figure 4.13: The effect of energy charged on the solution total dissolved solids
using aluminium electrodes 87
Figure 4.14: The effect of energy charged on the phosphate concentration using
aluminium electrodes 88
Figure 4.15. The effect of energy charged on the colour of treated water using iron
electrodes 90
Figure 4.16: The effect of reduced energy charged on the colour of treated water
using iron electrodes 91
Figure 4. 17: The effect of reduced energy charged on increased iron concentration
in water 92
Figure 4. 18: The effect of reduced energy charged in reduction of phosphates from
water using iron electrodes 93
ELECfROFLOC" l iL\TIO' OF Rl\'t-:1~ W<\TER X

CHAI'TER 1: INTROO C'flON AND PROBLEM STATEMENT
Chapter 1: Introduction and Problem Statement
1.1 Introduction
Increasing concern is being expressed about the quality of fresh ground and surface waters
and oceanic waters in our environment. One of the priority uses is, of course, ingestion of
water by humans. Consequently, it is demanded that potable water should have a quality to
meet a rather rigid regimen of standards as set by the Department of Water and Forestry in
conjunction with the Department of Health. On the other hand, it has been recognised that
natural waters have uses other than for drinking by man. For example, water quality is
extremely important to freshwater and marine aquatic life, for industrial and agricultural
uses, and for recreation and aesthetic uses. These latter uses of water have moved the
governmental and scientific communities to establish criteria for these various uses of
natural waters (Faust, 1981).
National Drinking Water Regulations are legally enforceable standards that apply to public
water systems to protect drinking water quality by limiting the levels of specific
contaminants that can adversely effect human health and are known or anticipated to occur
in public water systems (Bojic et al., 2004).
Legislation and regulations of South Africa and abroad drive water management
philosophies. South African fresh water aquifers are increasingly being challenged by
industrially produced wastes that are routed to water sources such as rivers, dams, etc. To
remove these pollutants from water sources requires special treatment before it is ready to be
utilised for consumption.
There are many different water treatment methods (generally referred to as treatment
processes) that can be used, each on its own, or in combination with others to treat water for
domestic use. One method of treatment by which colloidal particles of water are destabilised
(i.e. the nature of the colloidal particles is changed) so that they form floes through the
process of flocculation that can be readily separated from water is called coagulation.
Eu:CTROFI .O('CliL\TION Of RIVER W\TE:R Page 1

CIIAPTER 1: ) ' TRODUCTION A~D PROBLE i\'l STATE IE . T
Destabilisation is achieved through the addition of chemicals called coagulants to the water.
Coagulants used in water treatment include aluminium sulphate, ferric chloride, lime, and
polyelectrolytes (Bojic et al., 2004)
The natural resources of South Africa are limited, therefore the use and reuse of water is
becoming an increasing concern. Cost-effective methods are required to treat a wide range of
pollutants in a diverse range of situations. Coagulation and flocculation are traditional
methods for the treatment of polluted water. In these processes, coagulating agents (e.g.
alum or ferric chloride) and other additives (e.g. polyelectrolytes) are dosed to produce
larger aggregates, which can be separated physically. This is a multi-stage process that
requires considerable land area and a continual supply of chemicals. A more cost-effective
method to clean a wide range of polluted water, on-site, and with minimal additives, 1s
required for sustainable water management (Bojic et al., 2004).
Electrocoagulation treatment of water may fit this description. Electrocoagulation involves
dissolution of metal from the anode with simultaneous formation of hydroxyl ions and
hydrogen gas occurring at the cathode. Electrocoagulation has been proposed since before
the tum of the century with Vik eta!. (1984) describing a treatment plant in London built in
1889 (for the treatment of sewage by mixing with sea water before electro lysing). In 1909, in
the United States, J.T. Harries (Vik eta!., 1984) received a patent for wastewater treatment
by electrolysis with sacrificial aluminium and iron anodes. Matteson eta!. (1995) describe a
device of the 1940's, the 'Electronic Coagulator' which electrochemically dissolved
aluminium (from the anode) into the solution, reacting this with the hydroxyl ion (from the
cathode) to form aluminium hydroxide. The hydroxide flocculates and coagulates the
suspended solids thereby purifying the water. A similar process was used in Britain in 1956
(Matteson eta!., 1995) in which iron electrodes were used to treat river water.
Presently electrocoagulation is marketed by a small number of companies around the world.
A variety of designs have been employed with no dominant design. Often the
electrocoagulation units are used simply as a replacement for chemical dosing systems and
do not take advantage of the electrolytic gases produced in the electrocoagulation process. It
is clear that electrocoagulation has the capability to remove a large range of pollutants under
a variety of conditions ranging from suspended solids (Matteson et a!., 1995), heavy metals
Eu:CTROFLOCTl'LA" ION OF RI\'ER W t\TER Page 2

HAPlE£~ 1: I fRODUCTIOJ\ A ,\1) PROBLEM STATEMENT
(Osipenko and Pogorelyi, 1977), petroleum products (Amosov et al., 1976), colour from
dye-containing solution (Do and Chen, 1994), aquatic humus (Vik et al., 1984), and de
fluoridation of water (Mameri et al., 1998).
1.2 Problem Statement and Motivation
The treatment of water is an area which is, and was, extensively researched. Because of
technological, developmental and economical impact there is a need for new efficient and
cost-effective flocculation methods. As a result, the evaluation of electrochemical technique
in river water treatment to remove suspended solids that meets the requirements of South
African Legislation, had to be investigated.
The purpose of this study was to investigate the feasibility of electrochemical dissolution of
iron and aluminium ions in river water to achieve electroflocculation and/or
electrocoagulation. The investigation did not include the economic consideration relevant to
the use of this electrochemical treatment technique.
The objectives of the project:
• Assess and demonstrates the ability of the electrochemical process as a process for the
removal of phosphates, suspended solids and other pollutants from river water to
produce drinking (domestic) water;
• Investigate and evaluate the electrochemical characteristics and mechanism of water
treatment under regulated parameters with no chemical reagents used in the process.
The main aspects that must be taken into account when conducting the research are:
• The quality of water source (river water)
• The quality of the treated water to be produced (drinking water)
• Characterisation of electrochemistry (iron and aluminium electrodes)
• Current methods of flocculation (dosing of aluminium sulphate, ferric chloride, lime and
polyelectrolytes)
• Operating factors (effect of pH, concentration, temperature and time studies)
EL.ECTROFLO('C'l iL\TIO,, m RI\ 'ER WATER Page 3

II \I'TER l: )"'ITROOliCTJON AND PROBLEM STATEI\1 NT
Other factors (including change in parameters) arising from the experimental process will
also be considered during the investigation.
[I ECTROFLOCC'l!LATIO:'<. OF RIVER \\ATER Page 4

CHAPTER 2: LITERATURE SURVEY
Chapter 2: Literature Survey
2.1 Introduction
Due to rapid industrialisation, there has been an increase in the amount of effluent flowing
into natural water bodies. Major contaminants found in water include biodegradable, volatile
and recalcitrant organic compounds, toxic metals, suspended solids, plant nutrients (nitrogen
and phosphorus), microbial pathogens and parasites (Bitton, 1994). Cooper (1993) also
reported that runoff is regarded as an important route of entry of non-point pollutants in the
surface water in agricultural areas. Runoff occurs during rainy seasons which last from April
to December in the Western Cape. Runoff-related inputs usually lead to an increase of water
levels, nutrients and total suspended solids (TSS). Pesticides may enter water-dissolved or
particle-associated chemicals (Wauchope, 1978).
The discharge of nitrogen as nitrate and phosphorus as phosphate to inland rivers, lakes and
dams causes massive growth of algae and plants due to the ' fertiliser type' effect of the
phosphate and nitrate (Steyn et al., 1975). This process is called eutrophication and disturbs
the natural balance that exists in the water body. Phosphate is a more limiting factor than
nitrate in eutrophication because some bacteria and algae are able to fix atmospheric
nitrogen and convert it to the more oxidisable states of nitrates and nitrites for growth
(Wentzel, 1990). Therefore, reducing phosphorus concentration to the lowest level is vital to
the maintenance of unpolluted water supplies.
Many advanced treatments have been studied and electrochemical oxidation has been
applied to many kinds of wastewater (Naumczyk et al., 1996; Simmonson., 1997). This
process is presented as an effective, selective, economical, and clean alternative for dealing
with wastewaters bearing high loads of organic compounds, especially some bio-refractory
organic pollutants. Such treatment produces total degradation of compounds to carbon
dioxide and water or at least a considerable decrease in toxicity. A direct anodic process or
an indirect anodic oxidation via the production of oxidants such as hydroxyl radicals, ozone,
etc. usually destroys the organic and toxic pollutants present in wastewater (Simmonson,
1997).
ELECTROFlOCCt LATION OF Rt VER WATER Page 6

CH \PTER 2: LITER ,\TI JRE SliR\' E\'
This wastewater treatment technology, which involves an electrochemical technique to
produce domestic or drinking water is to be employed in this investigation to treat river
water using aluminium and iron electrodes in an electrochemical circuit.
2.2 Objectives of Water Treatment and Purification
Mankind has recognised the need to improve water quality as early as 2000 BC (American
Society of Civil Engineers, 1990). The basic objectives of modem water treatment and
purification plants would be to:
• produce water that is safe for human consumption,
• produce water that is appealing to the customer, and
• produce water at a reasonable cost.
The production of biologically and chemically safe water is the primary objective in the
design of water treatment and purification plants and cannot be compromised. The principle
contaminant in safe water is, in most of the cases, suspended solids. A strong correlation
exists between the removal of suspended matter and micro-organisms. It is therefore not
surprising that the main objective of surface treatment plants is the removal of suspended
solids. Suspended solids consist mainly of clays, silts, bacteria, viruses, fulvic and humic
acids, mineral and organic particulates. Their collective presence may be indicated by
turbidity measurements (Pretorius et al., 2001).
Appealing water is clear and colourless, pleasant to taste, odourless, and cool. The water
should be non-staining, neither corrosive nor scale-forming and reasonably soft. Natural
colour in water can normally be ascribed to the presence of humic and fulvic acids. They are
strongly negatively charged hydrophilic colloids that will pass through conventional sand
filters unless destabilised. Iron and manganese are inorganic species that may be of aesthetic
concern (Pretorius et al. , 2001).
El.f:CfROFLOCCliL,\TIO OF lltVf.R W ,\TER Page 7

CHAPTER 2: LJTERATll RE SU RVEY
2.3 Laws and Regulations
The government of South Africa imposes strict regulations regarding the improvement of
water supply, water resource management, and quality of water. Table 2.1 summarises the
Acts governing the South African water legislation (DWAF, 1996).
Table 2.1: Summarized Acts governing the South African waregiklation
Water Acts
National Water Act [No. 36 of 1998]
• Fundamental Principles - Sustainability and equity guiding principles in protection, use, development,
conservation, management and control of resources.
- The need to share some water resources with other countries
- The need to develop social and economic development through the use of water
- The need to establish suitable institutions to achieve the purpose of the act
Water Services Act [No. 108 of 1997] - 19 December
• Governs the supply of water
- Water Services providers
- Water services Authorities
• Governs actions of Water Boards
• Governs Water Quality
- Water Services Act 1997 (Act No108 of 1997), Section 9(1) and 73 (l)OJ
- Regulation relating to compulsory national standards (March 2001)
- Use SANS 241 of 2005 or DWAF water quality guidelines
ELECTROFLO(.Cl.LHION OF H.t\"ER WATER
Year
2000
1999
Page 8

CHAPTER 2: LITERATURE SliRVEY
2.4 Water Quality
'Water quality' is a term used to express the suitability of water to sustain various uses or
processes. Any particular use will have certain requirements for the physical, chemical or
biological characteristics of water; for example, limits on the concentrations of toxic
substances for drinking water use, or restrictions on temperature and pH ranges for water
supporting invertebrate communities. Consequently, water quality can be defined by a range
of variables which limit water use. Although many uses have some common requirements
for certain variables, each use will have its own demands and influences on water quality
(Bartram and Ballance, 1996). According to DEAT ( 1999) there are three components that
have been chosen as indicators of water quality for South African surface waters:
phosphorus and nitrogen, which are good indicators of the level of domestic pollution in
surface waters, and total dissolved solids TDS, which gives an indication of the salinisation
or salt content of the water. Microbial contamination was also identified as a good indicator
(DEAT, 1999).
"The composition of surface and underground waters is dependent on natural factors
(geological, topographical, meteorological, hydrological and biological) in the drainage
basin and varies with seasonal differences in runoff volumes, weather conditions and water
levels. Large natural variations in water quality may, therefore, be observed even where only
a single watercourse is involved. Human intervention also has significant effects on water
quality. Some of these effects are the result of hydrological changes, such as the building of
dams, draining of wetlands and diversion of flow. More obvious are the polluting activities,
such as the discharge of domestic, industrial, urban and other wastewaters into the water
course (whether intentional or accidental) and the spreading of chemicals on agricultural
land in the drainage basin" (Bartram and Ballance, 1996).
A variety of human activities e.g. agricultural activities, urban and industrial development,
mining and recreation, potentially significantly alter the quality of natural waters, and
changes the water use potential. The effects of human activities on water quality are both
widespread and varied in the degree to which they disrupt the ecosystem and/or restrict
ELECTROFLOCTIII.ATION 0 • Rl\ Elt WATER Page 9

CHAPTER 2: Ltr R,\TlJRE. R\'E\'
water use. Deteriorating water quality leads to increased treatment costs of potable and
industrial process water, and decreased agricultural yields due to increased salinity of
irrigation water. Contamination of groundwater resources or of sediments deposited m
riverbeds, impoundments and estuaries by toxic and persistent compounds can cause
irreversible pollution, sometimes long after the original release to the environment has
ceased (WQM, 1996).
According to WQM (1996), the persistent water quality problem is salination, which has two
major causes, natural and anthropogenic. The origin of natural salination of river water is
geological. A wide variety of man's activities are associated with increased releases of salts,
some in the short and others in the long term. Immediate increases in salt concentrations
result from point sources of pollution, such as the discharging of water containing waste by
industries. Diffuse pollution, resulting inter alia from poorly managed urban settlements,
waste disposal on land and mine residue deposits pose even a bigger problem, as it impacts
over a larger area on the water resource. "The effect of diffuse pollution on groundwater is
also often problematic in terms of remediation. Another major water quality problem is
eutrophication which is the enrichment of water with the plant nutrients nitrate and
phosphate. These encourage the growth of microscopic green plants termed algae. As
nutrients are present in sewage effluent, the problem is accentuated wherever there is a
concentration of humans or animals. The algae cause problems in water purification, e.g.
undesirable tastes and odours, and the possible production of trihalomethanes or other
potentially carcinogenic products in water that is treated with chlorine for potable purposes"
(WQM, 1996).
A water quality issue which is receiving increasing attention among industrialised nations is
pollution by metals and man-made organic compounds, such as pesticides and it is referred
as micro-pollutants. WQM (1996) report that serious incidents of health impacts to man and
animals have occurred at places throughout the world through uncontrolled exposure to these
micro-pollutants. Pollution of this type tends to be highly localised and associated with
specific industries or activities. Mining activities often expose pyrite containing rock
formations to air and water to produce acid rock drainage. Due to the low pH of acid rock
drainage heavy metals are mobilised. The Department of Water Affairs and Forestry has
recently established a water pollution control works in the Brugspruit catchment, at huge
ELECfROFLOCCUI.ATIO ' 01 RI\'ER w \TER Pag~ JO

CHAPTER 2: LJTERAT RES RVE\'
cost, to treat acid rock drainage emanating from abandoned coal mines. Another source of
pollution is from Microbiological pollutants which is a water contamination by faecal matter
and it is the medium for the spread of diseases such as dysentery, cholera and typhoid.
Erosion and sedimentation also have impact in quality of water, according to WQM (1996)
an average sediment yields for South African catchments range from less than 10 to more
than 1 000 tonnes/km2/annum. In some parts of the country erosion has increased by as
much as tenfold as a result of human impacts. Apart from the loss of fertile agricultural soil,
off-site damage like loss of valuable reservoir storage, sediment damage during floods and
increased water treatment costs, have been largely ignored even though these are estimated
to be in excess of R 100 million per year. Bartram and Balance (1996) describe the quality of
water in terms of the concentration and state (dissolved or particulate) of some or all of the
organic and inorganic material present in the water, together with certain physical
characteristics of the water.
Contamination of the aquatic environment occurs when humans introduce, either by direct
release to water or indirectly (for example through atmospheric pollution or water
management practices), substances or energy that result in deleterious effects such as:
• hazards to human health,
• harm to living resources,
• hindrance to aquatic activities such as fishing, and
• impairment of water quality with respect to its use in agriculture, industry or other
economic activities, or reduction of amenity value.
The importance attached to quality will depend on the actual and planned use or uses of the
water (e.g. water that is to be used for drinking should not contain any chemicals or micro
organisms that could be hazardous to health).
Eu:Cl ROFLO(Tlll \TIOJ'\ OF Rl \ ER \V,\ ·1 ER l~age 11

C'H <\PTER 2: LITER .\TliR liRVEY
2.5 River Water Quality
South Africa's hydrological regime is characterised by high variability, due to climatic
conditions, and low water runoff, due to high absorption by soils (Walmsley 1991 ). An
understanding of the discharge regime of a river is extremely important to the interpretation
of water quality measurements, especially those including suspended sediment or intended to
determine the flux of sediment or contaminants (Meybeck et al., 1989). The discharge of a
river is related to the nature of its catchments, particularly the geological, geographical, and
climatological influences. Meybeck et al. (1989) add that the regime of a river is largely
determined by the annual cycle of wet and dry seasons.
The great rivers of the tropics do not fall exclusively into any of these categories, because
their drainage basins extend over many regions of differing climate and vegetation.
According to Meybeck et al. (1989), erosion can be said to vary according to the following
influences:
• amount and pattern of rainfall and resultant river regime,
• slope of the land,
• extent of destruction of vegetation,
• regeneration of vegetation, and
• soil type and resistance to the effects of temperature changes.
2.5.1 Vaal Dam water quality
Vaal Dam water quality data was retrieved and statistically analysed from Rand Water's
database. The Engelbreghts weir water sample point was the only sample point available to
characterise Vaal Dam water quality. A summary of water quality determinants exceeding
the requirements (SABS 241: 2001) for class 0 and class 1 water is compiled in Table 2.2.
The treatment objectives could therefore be defined through a comparison of water quality
and drinking water requirements.
ELECTROFLOCCl LHION OF Rl\ lR W\TER Page 12

Clii\PT · R 2 : LITERATURES RVE\
Table 2.2: Vaal Dam water quality determinants exceeding the potable water requirements as
determined at the Engelbreghts weir. The SABS guidelines for Class 0 and Class 1 water are
also included
Vaal Dam water quality Limits of SABS
Parameter Unit 241 Minimum Maximum Average Median Class 0 Class 1
DOC mg/L as C 6.1 19.0 10.0 9.1 5 10
Turbidity NTU 32 110 70 68 0.1 1.0
AI mg/L as Al <0.10 6.40 1.02 0.47 0.15 0.30
Fe mg/L as Fe <0.10 4.30 0.63 0.27 0.010 0.200
F- mg/L as F- 0.15 2.90 0.23 0.18 0.7 1.0
The raw water turbidity is affected by seasonal changes as illustrated in Figure 2.1. A
turbidity as high as 120 NTU can be experienced during rainfall seasons, while a turbidity as
low as 30 NTU can be measured towards the end of the winter season. The variation in
turbidity over an 18-month period is illustrated in Figure 2.1.
100
90
80 -~ 70 z -~60 "'C :e 50
::::::1 1-
40
30
20
-
{
LD ~ .
&:::: Cll ~
/~ /
LD LD LD LD LD q ~ q q ~ . . ....0
..... ..... >.. &:::: Q) Cll a... Cll ::J
u_ :::?: <1:: ~ ~
- "-~
\ \
\._ -~-
LD LD LD LD LD LD (0 (0 (0 ~ ~ q ~ ~ q ~ ~ q . . . . . .
O'l a... ....... > u &:::: ....0 ._
::J u ::J Q) 0 Q) Cll Q) Cll ~ 0 <1:: en z: 0 ~ u_ :::?:
Date
~ I
(0 (0 (0 (0 (0
~ q q q ~ . >.. &:::: O'l ::J c.. Cll ::J ::J ~ <1:: :::?: ~ <1::
Figure 2.1: The variation in Vaal Dam turbidity as measured over an 18-month period
EU:CrROI·LOCCliLATIO,\ OF RIVER \V ,\H.R Parrc 13

CIIAPTER 2: LITERATURE RVEY
2.5.2 Natural processes affecting water quality
Although degradation of water quality is almost consistently the outcome of human conduct,
certain natural phenomena can result in water quality. Natural events such as torrential
rainfall and hurricanes lead to excessive erosion and landslides, which in turn increase the
content of suspended material in affected rivers and lakes (Bartram and Ballance, 1996).
Seasonal overturn of the water in some lakes can bring water with little or no dissolved
oxygen to the surface. Such natural events may be frequent or occasional.
"Permanent natural conditions in some areas may make water unfit for drinking or for
specific uses, such as irrigation. Common examples of this are the salinisation of surface
waters through evaporation in arid and semi-arid regions and the high salt content of some
groundwater under certain geological conditions. Groundwater is naturally high in
carbonates (hardness), thus necessitating their treatment before use for certain industrial
applications. Groundwater in some regions contains specific ions (such as fluoride) and toxic
elements (such as arsenic and selenium) in quantities that are harmful to health, while others
contain elements or compounds that cause other types of problems (such as the staining of
sanitary fixtures by iron and manganese)", Bartram and Balance (1996).
The nature and concentration of chemical elements and compounds in a freshwater system
are subject to change by various types of natural processes, i.e. physical, chemical,
hydrological and biological. The major environmental factors as stated by Bartram and
Ballance (1996) are:
• distance from the ocean: extent of sea spray rich in Na, Cl, Mg, S04 and other ions,
• climate and vegetation: regulation of erosion and mineral weathering, concentration of
dissolved material through evaporation and evapo-transpiration,
• rock composition (lithology): the susceptibility of rocks to weathering ranges from 1 for
granite to 12 for limestone; it is much greater for more highly soluble rocks (for
example, 80 for rock salt),
Et.F.CTIWFLOCCl L.\TION OF Rt\ ER"' \TER Page 14

CIIAPTER 2: LITERATURE SLRVE\
• terrestrial vegetation: the production of terrestrial plants and the way in which plant
tissue is decomposed in soil affect the amount of organic carbon and nitrogenous
compounds found in water, and
• aquatic vegetation: growth, death and decomposition of aquatic plants and algae will
affect the concentration of nitrogenous and phosphorous nutrients, pH, carbonates,
dissolved oxygen and other chemicals sensitive to oxidation/reduction conditions.
Aquatic vegetation has a profound effect on the chemistry of lake water and a less
pronounced, but possibly significant, effect on river water.
"Under the influence of these maJor environmental factors, the concentrations of many
chemicals in river water are liable to change from season to season. In small watersheds the
influence of a single factor can cause a variation of several orders of magnitude. These
natural variations are reflected in the range of total dissolved solids in various water bodies.
Total dissolved solids are the sum of the silica plus the major ions in the water. A close
approximation of its value may be obtained by the measurement of electrical conductivity"
(Bartram and Ballance, 1996).
2.5.3 Water use and water quality deterioration
Historically, the development of civilisations has led to a shift in the pattern of water use
from rural/agricultural to urban/industrial, generally according to the following sequence:
drinking and personal hygiene, fisheries, navigation and transport, livestock watering and
agricultural irrigation, hydroelectric power, industrial production (e.g. pulp and paper, food
processing), industrial cooling water (e.g. fossil fuel and nuclear power plants), recreational
activities and wildlife conservation. According to Bartram and Ballance (1996) the water
uses with the highest demands for quantity often have the lowest demands for quality i.e.
drinking water, by contrast, requires the highest quality water but in relatively small
quantities.
In order to counter the continuing deterioration of water quality and to meet the challenges
of the future, the Department of Water Affairs and Forestry has adopted a receiving water
quality objectives approach, consisting of a receiving water quality objectives approach for
EI.ECTROFLOCCLIL.\TIO. Of RIV[R WATER Page 15

CIIAPH.R 2: Ll fER,\TliRE SURVEY
non-hazardous substances and a pollution minimisation and prevention approach for
hazardous substances. The receiving water quality objectives approach for non-hazardous
substances accepts that the receiving water environment has a certain, usually quantifiable,
capacity to assimilate waste without serious detriment to the quality requirements of its
recognised users. However, if applied without the necessary precaution, the receiving water
quality objectives approach for non-hazardous substances will inevitably lead to the
deterioration of water resources to the point where they will be less fit for use by the
recognised water user sectors. To counter the limitations of this approach, a precautionary
approach was accepted to avert danger and minimise uncertainty and potential risk of
undesirable impacts on the environment.
Human activities are the source of particulate, dissolved and volatile materials which may
eventually reach water. Dissolved materials and many particulates are discharged directly to
water bodies, while the particulate and volatile materials that pollute the atmosphere are
picked up by rain and then deposited on land or in water.
2.5.4 \Vater and human health
Although water is an absolute necessity for life, it can be a carrier of many diseases.
Paradoxically, the ready availability of water makes possible the personal hygiene measures
that are essential to prevent the transmission of enteric diseases. Infectious water-related
diseases can be categorised as waterborne, water-hygiene, water-contact and water-habitat
vector diseases. Some water-related diseases, however, may fall into more than one category
(Genthe, 2007).
Waterborne infectious diseases are those in which the pathogen, or causative organism, is
present in water and ingested when the water is consumed. Most of the pathogens involved
are derived from human faeces, and the diseases transmitted by consumption of faecally
contaminated water are called "faecal-oral" diseases. All of the faecal-oral diseases can also
be transmitted through media other than water, for example faecally contaminated food,
fingers or utensils. The principal faecal-oral diseases are cholera, typhoid, shigellosis,
amoebic dysentery, hepatitis A and various types of diarrhoea (Bartram and Ballance, 1996).
ELECfROFLO Cl ll.t\TION 0 Rl\ EH WATER Page 16

CHAPTER 2: LITERATURE St iRVE\
2.6 Drinking Water Quality
The provision of hygienic drinking water is one of the major contributions to the wellbeing
of the human species. Many of the major human diseases can be attributed to waterborne
micro-organisms, which, in the absence of adequate water treatment, are passed through a
cycle of effluent discharge. The need for effective water treatment reflects the pressures of
population growth and development of urban communities. Under conditions of low
population density the surface and ground water remain relatively unpolluted and direct
abstraction without treatment can be adequate, but large communities can easily pollute the
natural fresh water resources and make treatment essential (Barnes and Wilson, 1983).
2.6.1 Water quality criteria
Municipal water will be used for several purposes - washing, drinking, waste disposal and as
industrial water. The quality requirements will be set by the most critical of these uses, that
is, human consumption (Barnes and Wilson, 1983). The criteria will reflect the need to
produce water which is:
• hygienic with a minimum of pathogens and toxins,
• aesthetically acceptable and potable,
• non-corrosive to the distribution system, and
• which can be produced at the least cost.
To meet these requirements, several sets of standards have been proposed and are
continually being revised. The specific concentrations as those which will not adversely
affect water quality are suggested by Barnes and Wilson (1983).
2.6.2 Microbiological criteria for drinking water
Microbiological standards for drinking water are considered to be the most important and
most widely quoted standards. Direct tests for pathogens are difficult because of the low
number of pathogens present and the large number of different types of pathogens which can
be present. A common standard is that the average number of coliforms is less than one per
ELECTROFLOCCl iL\TIOI'I m RIVER WATER Page 17

Cll \PTER 2: LITERATURE SliRVE\
1 OOmL of sample with specification of statistical variation and sampling frequency (Barnes
and Wilson, 1983).
2.6.3 Hardness criteria for drinking water
Water hardness is the state or quality of being hard caused by various dissolved salts of
calcium, magnesium or iron. The range of water hardness varies from 0 mg/L of water to
over 1712 mg/L. Water with 65 mg/L is considered very hard water. Much of the Ida area
has water hardness ranging from 599 mg/L to 1455 mg/L. Most hardness test kits express
test results as ppm of CaC03• Currently there are no health standards for water hardness.
Hard water precipitates carbonate mineral deposits, scale, and incrustations on pipes, hot
water heaters, boilers and cooking utensils. Water hardness can cause other problems in the
home such as increased soap consumption by preventing soap and detergents from lathering
by giving rise to an insoluble curdy precipitation.
Water hardness can be lessened on a small scale by softening the water. This can be done
with the addition of ammonia, borax, or tri-sodium phosphate mixed together with sodium
carbonate. Hard water can be softened on a large scale by adding just enough lime to
precipitate the calcium as carbonate to remove the calcium salts. Home water softeners
commonly use natural or artificial zeolite minerals to soften the water. Zeolite minerals are
hydrous aluminium silicates of sodium, calcium, potassium or barium naturally found in
igneous rock (Barnes and Wilson, 1983).
2.6.4 Aesthetic criteria for drinking water
The production of drinking water which is aesthetically acceptable is generally regarded as
necessary to assure users about the hygienic quality of the water. The physical tests for
turbidity, colour, taste and odour are designed to ensure that the water will be potable and
aesthetically pleasing. The general standards require the production of water which has
properties within certain limits, for example less than 5 colour units and unobjectionable
taste and odour. Specific chemicals are subject to additional restriction, for instance chlorine
ions imparts a salty taste to water if present in concentrations greater than 200 mg/L while
ELECTROFLOCCLIL\TIO or Rl\ Ell\" ATER Page 18

CliAPTER 2: LITERATURE SUR E\'
phenolic compounds are restricted partly because of their tendency to form chlorophenols
which are highly unpleasant odours (Barnes and Wilson, 1983 ).
• Reactive Phosphorus
Phosphorus is a non-metallic chemical element. Reactive phosphorus is the phosphorus that
will react only with another substance. Phosphorus is found in many forms. In water,
phosphorus is usually found as phosphates. Phosphates are formed when metallic atoms
replace some or all of the hydrogen in phosphoric acid. The main sources of phosphates in
groundwater and surface water include fertilizers, sewage, detergents and rainwater. The
phosphates enter the water mostly as a result of surface runoff and bank erosion. The amount
of phosphates that water can hold without becoming polluted varies. In a stream draining
into a lake, the phosphates should not exceed 0.05 mg/L. In a lake the phosphates should not
exceed 0.025 mg/L. A stream not flowing into a lake should also not exceed 0.025 mg/L.
Phosphates exceeding these levels can be very harmful. If the phosphates exceed these levels
algal growth can choke out other plants and completely take over the water. This is best
avoided by using phosphate-free detergent to avoid fertilizer runoff and preventing stream
bank erosion.
• Total Phosphorus
Phosphorus is usually present in river water as phosphates, and is in very small amounts
unless there has been human-caused enrichment of the water. The natural scarcity of
phosphorus can be explained by its attraction to organic matter in soil particles. Generally
the lower the total phosphorus value in the water, the better. Total phosphorus includes
organic and inorganic phosphate. Organic phosphate is a part of living plants and animals.
Inorganic phosphates comprise the ions bonded to soil particles, and phosphates present in
laundry detergents (polyphosphates). Phosphorus is considered to be a limiting factor in
aquatic systems, meaning that it is not freely available for easy consumption by aquatic
organisms. A river that is not flowing into a lake should not exceed 0.1 mg/L. Phosphorus is
the major contributing factor in the process of eutrophication. Inputs of phosphorus come
from erosion, fertilizers, detergents, and the draining of wetlands.
ELECTROFLOCCUL\TIOJ\ OF RI\"ER \\ '\TER Page 19

CIL\PTER 2: LITERAT R£ SURVEY
• Suspended Solids
Suspended solids are pieces of sand, silt and the fine organic matter of leaves, pieces of
wood, etc. suspended in a stream or lake. The suspended solids in humid areas range from 0
ppm to 100 ppm. In arid areas the range can reach up to 100 000 ppm. Suspended solids can
increase when stream flow increases. The faster-flowing water erodes the banks and because
the stream is moving so fast, the suspended solids do not have a chance to settle to the
bottom. Suspended solids are an important part of water quality. In excess they can smother
the stream bottom life. When the water slows down, suspended solids settle out in stream
pools and can fill lakes and reservoirs. High levels of suspended solids can make the water
unusable in many ways. Pesticides and bacteria can attach to the suspended solids making
them more readily transported. This can kill off the plants and animals downstream and
make the water undrinkable to humans and wildlife alike.
• Total Dissolved Solids (TDS)
Rivers have solid particles called dissolved and suspended solids in them. The total
dissolved solids (TDS) test measures the amount of particles that are dissolved in the river
water. The USEP A standard is 500 mg/L or ppm. The TDS range from 20 to 2 000 mg/L in
rivers and may be higher in groundwater. High levels in drinking water may cause
objectionable tastes and have laxative effects. Water is tested for TDS because excessive
amounts may be unsuitable for aquatic river life and poor for crop irrigation, in addition to
being unsuited for drinking water. It may cause foaming or may corrode some metals. The
quantity of TDS in a body of water depends on several factors, including the precipitation
contributing to the body of water (Rainwater is almost pure with less than 10 ppm TDS.), the
type of soil and rock the water passes over, and human activities. The major dissolved
substances found in water that can cause the above problems are the positively charged ions
of sodium, calcium, magnesium, potassium and iron and the negatively charged ions of
chloride, bicarbonate, carbonate and sulphate.
• Total Solids
Total solids are the combined weight of both dissolved solids and suspended solids. The
weighing can be performed on a Metler balance to ensure accuracy to a thousandth of a
gram. All natural waters contain dissolved and suspended inorganic and organic substances.
ELECTROFLOCCLILATION Of RIVER \\'ATER Page 20

CH .\PTER 2: LITERATURE SIJR\'n
The major dissolved solids are sodium, potassium, calcium, magnesium, chloride, sulphate,
carbonate, bicarbonate and silica. The major suspended solids on the other hand include
anything from silt and plankton to industrial wastes and sewage.
• Turbidity
Turbidity is the measurement of a lack of water clarity. Turbidity is the result of suspended
solids in the water. A rough measure of turbidity can be made with a Secchi Disk, but more
accurate measurements need to be taken with a turbidimeter. Turbidity is measured in NTUs,
the abbreviation for nephelometric turbidity unit. A normal range for turbidity in river water
has not been established. Turbidity in drinking water should be less than one NTU. The
USEPA standard for drinking water is 0.5-1.0 NTU. Water treatment is required for drinking
water when there is excessive turbidity. Water with high turbidity will appear to be murky or
muddy. Turbidity in excess of five NTUs can be easily detected. Turbidity at that level may
not affect your health, but water treatment may be desirable. Excessive turbidity may
interfere with disinfection processes and is measured by municipalities to monitor the
efficiency of public water supply filtration systems used to remove parasites and viruses in
water.
2.6.5 Corrosiveness of drinking water
The major criterion used to control the corrosiveness of water is that of pH. In general, the
water should be supplied slightly alkaline (pH 7 - 8.5) and with no free carbon dioxide
(Barnes and Wilson, 1983).
• Alkalinity
Alkalinity is a measure of the quantity of compounds that shift the pH to the alkaline side of
neutrality (above 7) or it is a measure of the capacity of water to neutralize acids. In the
carbonate-bearing rock of Monroe County, most alkalinity is due to the presence of the
bicarbonate ion which is derived from the dissolution of carbonates by carbonic acid. Minor
contributors to alkalinity in the county include carbonate and hydroxide ions. Alkalinity is
important because it buffers pH changes that occur naturally during photosynthetic cycles,
water exchanges and the addition of acids to water. Raising the alkalinity almost always
raises the pH. Alkalinity is measured in parts per million (ppm) or milligrams per litre
El ECTROFLO Cl L.\TION OF Rl\ F:R W \TER Page 21

CHAPTER 2: LITERATURES R EY
(mg/L). There are no standards established for surface or groundwater by the United States
Environmental Protection Agency (USEP A). A range of 100 to 250 ppm for river water is
considered normal. If the alkalinity of water is too high, the water can be cloudy, which
inhibits the growth of underwater plants. Too high alkalinity raises the pH level, which in
tum harms or kills fish and other river organisms.
• pH
pH is a general measure of the acidity or alkalinity of a water sample. The symbol pH stands
for potential for hydrogen. The pH of water, on a scale of 0 to 14, is a measure of the
hydrogen ion concentration. Water contains both H ions and OH ions. Pure distilled water
contains an equal number of H and OH ions and is considered neutral (pH 7), neither basic
nor acidic. If water contains more H than OH ions the water is considered acidic with a pH
less than 7. If water contains more OH ions than H ions, the water is considered basic with a
pH greater than 7. The USEPA standard range is 6.5 to 8.5. Stream water usually ranges
from pH 6.5 to a pH of 8.5, an optimal range for most organisms. Rain-water by contrast is
naturally acidic at about 5.6.
2.6.6 Water quality index
In 1970 the National Sanitation Foundation created a standard index to measure water
quality. The Water Quality Index (WQI) can be used to measure water quality changes in a
particular river segment over time, comparing water quality from different segments of the
same river, and comparing water quality of different rivers. The results can determine if the
river is healthy for particular uses. Certain tests, which are discussed here, must be
performed, weighed, and added together to come up with the water quality value. The
overall WQI values can be rated from the following Table 2.3:
EU:Cl"ROFLOC.CliLATIOI'o OF RIVER \VA TEll Page 22

CHAPTER 2: LJTERATLRE SURVEY
Table 2.3: Water Quality Index rating
Percentage Rating
100-90 Excellent
90-70 Good
70-50 Medium
50-25 Bad
25-0 Very Bad
A minimum of 50-58 would be required to meet most state water quality standards. A body
of water can have high WQI, yet fail to meet state standards owing to a particular parameter.
An example of this would be the high faecal counts in the River Raisin after storm events.
An average WQI for the River Raisin in the Dundee and Ida area is >70, yet occasionally the
faecal coliform counts are found in the thousands rendering the water quality below State
standards for full body contact recreational use. The State and Federal standard for full body
contact is 2 000 colonies or less per 100 mL of water.
2.7 Water Treatment by Hydrolysing Metal Salts
Aluminium and ferric salts are widely used as coagulants in water and wastewater treatment.
They are effective in removing a broad range of impurities from water, including colloidal
particles and dissolved organic substances. Their mode of action is broadly understood in
terms of essentially two mechanisms: charge neutralization of negatively charged colloids by
cationic hydrolysis products and incorporation of impurities in an amorphous precipitate of
metal hydroxide. The relative importance of these two mechanisms depends on many
factors, especially pH and coagulant dosage (Gregory and Duan, 2001).
Hydrolysing metal salts, based on aluminium or iron, are very widely used as coagulants in
water treatment. These materials have been applied routinely since early in the 201" century
and play a vital role in the removal of many impurities from polluted waters. These
impurities include inorganic particles, such as clays, pathogenic microbes, and dissolved
natural organic matter. As well as traditional additives such as aluminium sulphate ('alum')
El.f.CfROF"LOCTllL\TIO OFRI\ER W.\Tffi Page 23

CIL\PTEfl 2: LITERATliRE SlJRVE\'
and ferric chloride, other products containing pre-hydrolysed metal ions are now commonly
used. These include a range of materials known as polyaluminium chlorides (Gregory and
Duan, 2001).
Although the mode of action of metal coagulants is broadly understood, there are still some
uncertainties, especially with regard to the nature of the active species, the role of dissolved
salts in water, and the strength and break-up of aggregates formed. The mechanisms of
action of pre-hydrolysed forms are also by no means fully understood (Gregory and Duan,
2001).
2.7.1 Colloid stability and instability
Particles in aqueous dispersions may interact m several ways, and their interactions
determine whether the dispersion is stable or not. In this context, stability implies that the
particles remain in a dispersed state for long periods, rather than forming aggregates
(coagulation or flocculation). For long-term stability, some form of repulsion must operate
between particles, otherwise, collisions of particles would result in attachment as result of
the universal Van Der Waals forces of attraction. In water, particles are nearly always
charged, and electrical repulsion between them may be responsible for their stability. A
quantitative theory of colloid stability was developed by Deryagin and Landau (1941) and
Verwey and Overbeek (1948) and now widely known as DLVO theory. There are other
forms of interaction between particles, such as hydration and hydrophobic forces and effects
associated with adsorbed polymers (Israelachvili., 1992), but these will not be considered
here. DLVO theory treats colloid stability in terms of a balance between Van Der Waals
attraction and electrical repulsion between particles. In practice, only the latter can be
modified to a significant extent, and repulsion can be greatly affected by changing the ionic
strength of the suspending medium or by modifying the surface charge of the particles.
Increasing ionic strength effectively screens electrical repulsion and allows particles to
approach each other more closely, so that Van Der Waals attraction may predominate. By
adding salts that have specifically adsorbing counter ions (i.e., opposite in charge to the
particles) the particle surface charge may be decreased or neutralized so that repulsion
between particles is reduced or eliminated altogether. This can be an effective way of
promoting coagulation and is often used in practice. In such cases, addition of excess
ELECTROFLOC" lfLATIO~ 01' RIVEt~ Wt\T R Page 24

!GOLDFIELDS LIBRARY! CIIAPrER 2: LITERATURE SURVEY
coagulant can cause charge reversal and restabilization of particles (Deryagin and Landau,
1941 ).
Another very important means of destabilizing particles is through the action of adsorbing
polymers. Polymers of high molecular weight can adsorb simultaneously on two or more
particles and bind them together by a process known as polymer bridging. The action of
hydrolysing metal coagulants may be through charge neutralization effects or involve the
binding of particles together by precipitated hydroxide (Deryagin and Landau, 1941 ).
2. 7.2 The basic concept of hydrolysis of metal ions
All ions in water are hydrated to some extent. In the case of Al3+ and Fe3
\ there is a primary
hydration shell with six octahedrally coordinated water molecules, e.g. , Al(H2 0) ~+.
Hydrolysis of such ions is often represented as a sequential replacement of the water
molecules by hydroxyl ions, and can also be thought of as a progressive deprotonation of
water molecules in the primary hydration shell (Richens, 1997). The simplest representation,
for Al3+, omitting the hydration shell for convenience, is:
A l 3+ ~ Al(OH) 2
+ ~ A l(OH) ; ~ Al(OH) 3 ~ Al(OH) ~ ........................ . ........... (2.1)
Since each step involves the loss of a proton, increasing pH causes the equilibria to be
shifted to the right. Aluminium hydroxide has low solubility in water, and precipitation
occurs at intermediate pH values. Further increase of pH causes the soluble aluminate ion to
be formed . A similar sequence can be written in the case of Fe3+. In this case, the hydroxide
is much less soluble than aluminium hydroxide.
Because of the formation of insoluble hydroxides, the determination of hydrolysis constants
is difficult, and there are significant discrepancies between published values (see e.g. ,
Wesolowski and Palmer, 1994). Hydrolysis constants may be defined for the successive
deprotonations in terms of the following equations:
M 3+ +H20 H M(OH) 2+ +H+ KI ...... . . .. ... , .. , .. ... ............. ... , .. . .. ......... . .. .. (2,2)
ELECTROFLOCCI I.ATION OF Rl\ ER W \TF.R Page 25

CHAPT · .R 2 : L11 ERATLIRE StiRVEY
M(OH) 2+ + H 20 ~ M(OH) ~ + H + K 2 •• . ... . .. . .... ........................................ (2.3)
M(OH) ~ +H20 ~ M(OH) , +H+ K 3 •• • • ..• . .. • .••••••••••••••••••••••••••••••••••••••.••• (2.4)
M(OH) 3 +H 20 ~ M(OH)~ +H+ K 4 ..... . ......... . ... ... ................... . ............. (2.5)
It is also necessary to define the solubility constant for the solid hydroxide:
M(OH) 3 ~ M3+ +30H- K 5 •••.•••••.••••• • .•••••••••••..••.••••••••••. • •••••••••••• • .•.• •••• (2 .6)
Although the most stable solid forms are gibbsite and goethite for aluminium and iron
respectively, these reach equilibrium very slowly (up to several months or more). It is usual
to take solubility constants for amorphous precipitates Ksam' since these form quite rapidly
and are much more relevant in practical applications of coagulants. However, solubilities of
amorphous hydroxides are not precisely known and only estimated values can be given.
Table 2.4 gives values for hydrolysis and solubility constants (in pK form), taken from
Wesoloski and Palmer (1994) for AI and from Flynn (1984) for Fe. The values are for
conditions of zero ionic strength and 25 °C. Wesoloski and Palmer (1994) give extensive
data for Al at other temperatures and ionic strengths.
Table 2.4: Hydrolysis and solubility constants for Al3+ and Fe3+ for zero ionic strength and
25°C. (Wesolowski and Palmer, 1994; Flynn, 1984)
pK, pK2 pK3 pK4 pKSam
AI H 4.95 5.6 6.7 5.6 31.5
Fe3' 2.2 3.5 6 10 38
As Martin (1991) pointed out, the hydrolysis constants for AI cover a much narrower range
than those for Fe, which was ascribed to a decrease in coordination number for Al from 6 to
4, in passing from the hexahydrate to tetrahedral aluminate. For Fe, the coordination number
remains 6 for all hydrolysed species. The effect on species distribution is quite marked, as
shown in Figures 2.2.a and b, which show the proportion of AI and Fe species in soluble
form, in equilibrium with the amorphous hydroxide. In the case of Al, the dominant species
in solution changes from Al3+ to Al(OH)4-, over little more than 1 pH unit. In contrast, the
corresponding change for Fe occurs over a range of more than 8 pH units and intermediate
EL£\TROFLOCCli.A TIO OF RJ\'ER WA £R Page 26

CHAPTER 2: LITERATt RESURVEY
species, such as Fe(OH)2+ and Fe(OH)3, can represent more than 90% of soluble forms at
intermediate pH values.
1.2
0::
~O.Sr---------------~-----------+--------------------~ .. .. ..... .; 0 4 t-------------------5
0.2 +------------
·0.2
s 10 pH
Figure. 2.2.a: Distribution of monomeric AI hydrolysis product as a function of pH
(Courtesy ofMartin, 1991)
, : I 0.6
0:::
D
..... ... ~ 0.4
,
~ F•_,. ' D
" ::;;;: 0.2 ' •
_j '
, •
I
-~~--~~~.- - . ~- ------~,
.. -- ...
, '
,· .,
' •
I ~~. I
" ,I
I
, ..... ' . - 7 --,-- -.....-- ._.,..... - .- ~ ·- --::.-·--:--.......... - -1
1(
pH
Figure 2.2.b: Distribution of monomeric Fe hydrolysis product as a function of pH (Courtesy
ofMartin, 1991)
From the standpoint of coagulation, the total amount of soluble metal species is important.
For AI, there is a minimum solubility (about 2 J.!M) in the region of pH 6. Ferric species
show a much lower solubility (around 20 nM) over a rather broad pH range. These
ELECTROFLOCCl L.'\TION OF 1{1\"ER W HER Page 27

Cll <\PTER 2: LITER ,\ Tl R E SUR VE
calculations can be significantly affected by the presence of certain anions, which form
complexes with AI and Fe. These include fluoride, phosphate, and sulphate, which can give
increased solubility of the metals, especially at lower pH values (Reiber et al., 1995).
As well as effects on equilibrium species distribution, some anions can modify the rate of
hydroxide precipitation. An important example is sulphate, which can enhance precipitation
of aluminium hydroxide (Hek et al, 1978), essentially by association with highly charged
polynuclear species, thereby reducing the free energy barrier to the formation of solid
particles. This is essentially a catalytic effect, since basic sulphates were not detected in the
precipitates. Hayden and Rubin (1974) found that the formation of settleable precipitates
from aluminium sulphate solutions occurred over a much broader pH range than from
solutions of aluminium nitrate. Another very important aspect is the complexation of metals
with dissolved organic matter in natural waters.
2.7.3 Polynuclear species
As well as the simple monomeric hydrolysis products considered above, it is well known
that highly charged metal ions can form a range of polynuclear species (Richens, 1997). For
AI, these include Al2(0H)2 4+ and Al3(0H)/+, and there are equivalent species for Fe.
Appropriate formation constants are known for the dimers and trimers, but at low total metal
concentration they do not greatly affect solution compositions, such as those shown in
Figures 2.2a and 2.2b. Various polymeric species, such as Al6(0H)126+, have been proposed,
but their existence has not been convincingly demonstrated. They might be regarded as
intermediate forms in the conversion of soluble metal salts to solid precipitates. It is known
that hydrolysis precipitation processes at ordinary temperatures are very slow and that true
equilibrium can take months or years to achieve.
One polynuclear hydrolysis product of aluminium is now well established and of some
practical importance. This is the so-called "Alu" polymer, AIJJ04(0Hb7+, which can be
formed by controlled neutralization of aluminium salt solutions. This has the Keggin
structure, with one tetrahedral AI surrounded by 12 AI octahedra with shared edges. The
Et.E TROFLOCCLL.o\TION OF RI\'ER W -\Tl;;R Page 28

CH ,\PTER 2: ITERATLIRE StiR EY
structure has been confirmed by 27 AI NMR studies (Akitt et al., 1972), small angle X-ray
methods (Bottero et al. , 1982), and potentiometric titration.
Another AI hydrolysis-polymerisation model involves the formation and condensation of
hexameric rings, leading eventually to precipitation (Bertsch et al., 1986), but this "core
link" model is now less popular, as a result of studies on the formation of the tridecamer
species Al 13 . However, the mechanism whereby Al 13 is transformed into a precipitate is not
fully understood (Bottero et al., 1987).
The speciation of Al solutions can be conveniently studied by a timed colorimetric reaction
with ferron reagent (8-hydroxy-7-iodo-5-quinoline sulfonic acid). This method was
introduced by Smith (1971) and is based on the observation that different forms of Al react
at varying rates with ferron. Mononuclear Al species (AIJ react almost instantaneously and
polynuclear species (Alb) much more slowly. Colloidal or precipitated AI (AIJ shows
practically no reaction with ferron. The proportion of polynuclear species (Alb) determined
by the ferron technique corresponds quite well with results from membrane filtration tests
(Gray et al., 1995) and with the proportion of Al 13 from NMR studies (Tang and Luan,
1996). Typically, the proportion of the various species is determined as a function of the
degree of neutralization of the aluminium salt solution, B (=OH/ Al). For 0.1 M AlC13
solution, titrated with 0.5 M NaOH, the proportion of Alb increased from around 33 to 83%
as B was raised from 1.0 to 2.5. For values of B above 2.5, the amount of precipitate (AU
increases significantly (Tang and Luan, 1996). In the same study, it was shown that the Alb
fraction was quite stable to dilution and to changes in pH, and only slowly converted to other
forms.
2.7.4 Action of hydrolysing coagulants
2.7.4.1 Charge neutralization
A simple mechanism for destabilization of negatively charged particles is the specific
adsorption of cationic species from solution. Since aluminium and iron salts give cationic
hydrolysis products, charge neutralization is a possible reason for the action of these
materials as coagulants. Adsorption of cations on negative surfaces may occur for simple
EI.ECTROI· LOCCLLt\ liON OF RIVER WATER Page 29

CHAPTER 2: LlTERt\Tl RE SUR E\
electrostatic reasons or by some form of surface complex formation. Since hydrolysing
coagulants are effective for a wide range of particle types, including bacteria, clays, and
many others, it is unlikely that a single adsorption interaction is responsible (Gregory and
Duan, 2001).
It is commonly observed that particles can be destabilized by small amounts of hydrolysing
coagulant and that optimum destabilization corresponds with the neutralization of particle
charge (determined, for instance, by electrophoretic mobility). Larger amounts of coagulant
cause charge reversal, so that the particles become positively charged and are thus
restabilised. For relatively low particle concentrations, destabilization and restabilisation
typically occur with just micro-molar concentrations of coagulant (Gregory and Duan,
2001).
Jf charge neutralization is the predominant destabilization mechanism, then there should be a
stoichiometric relationship between the particle concentration and the optimum coagulant
dosage (Stumm and O'Melia, 1968). At low particle concentrations, low coagulant dosages
should be required. Under these conditions, coagulation rates can be very low, and it is
found that higher coagulant dosages are much more effective. This is due to extensive
hydroxide precipitation and a process known as sweep flocculation.
2.7.4.2 Sweep flocculation
Although particles may be effectively destabilized by charge neutralization, there are two
disadvantages in water treatment:
• quite precise control of coagulant dosage is needed to give optimum destabilization;
• the particle collision rate and hence the coagulation rate depend on the square of the
particle concentration and can be very low for dilute suspensions.
Both of these problems can be overcome if higher coagulant dosages are used, smce
considerable quantities of amorphous hydroxide precipitate are then formed. It has long been
recognized (Packham, 1965) that, in many cases, optimal removal of particles from water is
achieved under conditions of rapid hydroxide precipitation. Jn the case of aluminium
coagulants, optimum pH conditions are close to the point of minimum solubility. Although
Et.E(TROFLOCClll.t\TI J OF Rl\ ER W.-\TER Page 30

CII.\PTEI~ l: LITERATURE SVRVE\
precise mechanisms are still not fully understood, it is clear that impurity particles are
enmeshed in the growing precipitate and hence can be removed from water by
sedimentation. This process has become known as sweep flocculation, since particles are
"swept out" of water by an amorphous hydroxide precipitate (Gregory and Duan, 2001).
Sweep flocculation generally gives considerably improved particle removal than when
particles are destabilized just by charge neutralization. At least part of the reason is the
greatly improved rate of aggregation, owing to the increased solids concentration. Hydroxide
precipitates tend to have a rather open structure, so that even a small mass can give a large
effective volume concentration and hence a high probability of capturing other particles. It is
also possible that binding of particles by precipitated hydroxide may give stronger
aggregates (Gregory and Duan, 2001).
The different mechanisms outlined above (Gregory and Duan, 2001) have led to the
definition of four zones of coagulant dosage, with the following consequences for negatively
charged particles:
• Zone 1 -Very low coagulant dosage, particles still negative and hence stable
• Zone 2 - Dosage sufficient to give charge neutralization and henOce coagulation
• Zone 3 - Higher dosage giving charge neutralization and restabilisation
• Zone 4- Still higher dosage giving hydroxide precipitate and sweep flocculation
2.8 Ground Water and Redox Potential
Oxidation and reduction (Redox) reactions play an important role in the geochemical
processes that occur in groundwater. Redox reactions are defined as reactions in which
electrons are transferred . The species receiving electrons is reduced, whilst that species
donating electrons is oxidized. Redox reactions determine the mobility of many inorganic
compounds as well as biologically important materials such as nitrogen and sulphur. In
addition, redox conditions govern the particulars for the biological degradation of complex
hydrocarbon contaminants (Vance, 2002).
Redox potential is an intensity parameter of overall redox reaction potential in the system
(similar in concept to pH), not the capacity of the system for specific oxidation or reduction
EI.F.CTROFLOCCULAliO!'o OF RIVER WA ER Page 31

CHAPTER 2: LITERA H IRE SURVEY
reactions. The redox value of standard half reactions (E0) and details of how to calculate
redox capacity can be found in any elementary chemistry text (Vance, 2002).
Most work with redox reactions involves laboratory evaluation under static conditions; the
focus is on solutions in closed systems that are in an equilibrium state. In groundwater with
more than one redox couple the redox potential cannot be accurately measured unless the
redox reactants are at thermodynamic equilibrium. However, environmental processes are
typically in dis-equilibrium, caused by the following (Vance, 2002):
• flowing groundwater conditions,
• biological activity,
• redox reactions oflight bioactive elements (C, H, 0, and S) which most often involve
the breaking of covalent bonds, a process that is normally slow, and
• electrochemical reactions of exposed active mineral surfaces.
Some redox reactions can take from 10 to 1000 years to reach equilibrium. Instead of
measuring the redox potential from a field sample, the redox potential can be calculated
using the relative concentrations and redox potential of major dissolved species. This is
precisely the process used in fate and transport models utilized in support of risk assessments
(Vance, 2002).
Groundwater typically contains both reduced and oxidized species, however what is termed
the redox buffer capacity of an aquifer is normally dominated by the chemistry of the aquifer
matrix:
• the oxidation capacity of the aquifer acts as a buffer to limit the transport of a plume in a
reduced state that would be generated from hydrocarbon contamination or a landfill;
• the reduction capacity of an aquifer will buffer against attempts to increase the redox
potential as part of the remediation program (such as air sparging or in-situ
bioremediation) to address a contaminant plume;
• in most natural groundwater systems iron is the dominant (by 1 to 3 orders of
magnitude) buffering species involved in redox reactions. In some organic rich aquifers
TOC can equal ferrous iron as a reduction buffer.
The following inorganic oxidation reactions, described by Vance, (2002) will consume
dissolved oxygen in groundwater:
ELECTROFI.O\Cl L,\ TION Of RIVER W \ HR Page 32

H.\PTER 2: LITERATURE StiRVEY
• Sulphide Oxidation -
202 + Hs- 0 so;-+ H+ .. .. . ... .. ........................ ............. . ... .. .... .. ....... (2.7)
• Iron Oxidation -
0 2 + 4Fe+2 +4H+ 0 4Fe3+ +H20 .......... .. .. .... .................. .. .......... .. .. . (2.8)
• Nitrification -
202 + NH; 0 N03- + 2H+ + H 20 ................ .. .. .................. .... ...... .... ... (2.9)
• Manganese (II) Oxidation -
0 2 + 2Mn +2 + 2H20 0 2Mn02 + 4H+ ...... .. .... .. . . ............................... . (2.10)
• Iron Sulphide Oxidation
150 2 + 4FeS 2 + 14H 20 0 4Fe(OH) 3 + 8SO ~- + 16H+ .................... ...... ... (2.11)
The following redox reactions will consume organic matter in groundwater:
• Aerobic Degradation -
CH 20 + 0 2 =C0 2 +H 20 .. .. ... ... .... .. .... .. . . .. .. .... .. .... ...... .. . ..... ... ..... ... (2.12)
• Denitrification -
3CH 20+4N03- 02N 2 +3HC0 3
. +H+ +2H 20 .. .................. .. ........... . ... (2.13)
• Manganese (IV) Reduction-
CH 20+2Mn0 2 +3H+ 02Mn 2+ +HC0 3. +2H 20 ............. ........ .. .. ...... (2.14)
• Ferric Iron Reduction -
CH 20 + 4Fe(OH) 3 + 7H+ 0 4Fe2+ + HC0 3. + 10H 20 ........ .. ........ .... ........ . .... (2.15)
• Sulphate Reduction-
2CH 20+SO/- =HS. +HC0 3. +H+ .. ........... ................ ........ ........... (2.16)
• Methane Fermentation-
2CH 20 + H 20 = CH 4 + HC0 3. + H+ .... . . .. .. ... ..... ... ......... . .......... ... ....... (2.17)
The above reactions are listed in order of decreasing Eh conditions as follows:
• Aerobic Degradation
+250mv and higher
• Oxygen - Nitrogen
EU.( HWFLOCCl 1LATIO Of· RI\'ER WATER Page 33
+250mv to lOOmv
• Iron - Mn (IV)
+ 1 OOmv to Omv
• Sulphate
Omv to -200mv
• Methane- Hydrogen
-200mv and lower
CHAPTER 2: LITERA rtiRE St RVE\
Water in contact with air will have an Eh in the range of 350mv to 500mv. Microbially
mediated redox processes may decrease the redox potential to values as low as -300mv. A
method of handling Eh data that has proven of particular value to the geochemist is the Eh
pH diagram, on which species oxidation state is plotted with variable Eh and pH conditions.
The Eh-pH diagram works well in a qualitative fashion, but due to conditions previously
discussed are usually unsuccessful when applied to quantitative applications. Vance (2002)
illustrates the geologically important iron/water system. In addition to illustrating iron
oxidation state, it shows how Eh in groundwater is governed at the upper range by the
oxidation of water to 0 2 and the lower range by the reduction of hydrogen ions to H2•
2.9 Pourbaix Diagrams and Reactions in Aqueous Solution
Water can act both as an oxidizing agent, in which case the water is reduced to H2, and a
reducing agent, with the attendant production of 0 2• If a chemical species is to be stable in
aqueous solution, it must not react with the water through a redox process. In other words,
the oxidation and reduction potentials of the species must be such that it is
thermodynamically unfavourable for the species to be either oxidized or reduced by the
water (Coleman, 2003).
2.9.1 Stability of water
According to Coleman (2003) and Lower (2005), in an acid solution, the primary redox
process occurs between H+ and metals producing metal ions and H2. The potential for the
reduction of H+ to H2 is given by:
2H+ + 2e- -- H2(g) .................... .. ................ .. ... . .... .... .. . ............. .... (2.18)
f.LE(TRQFLOCCI I.ATIOr" I· RIVER WAH.R Page 34
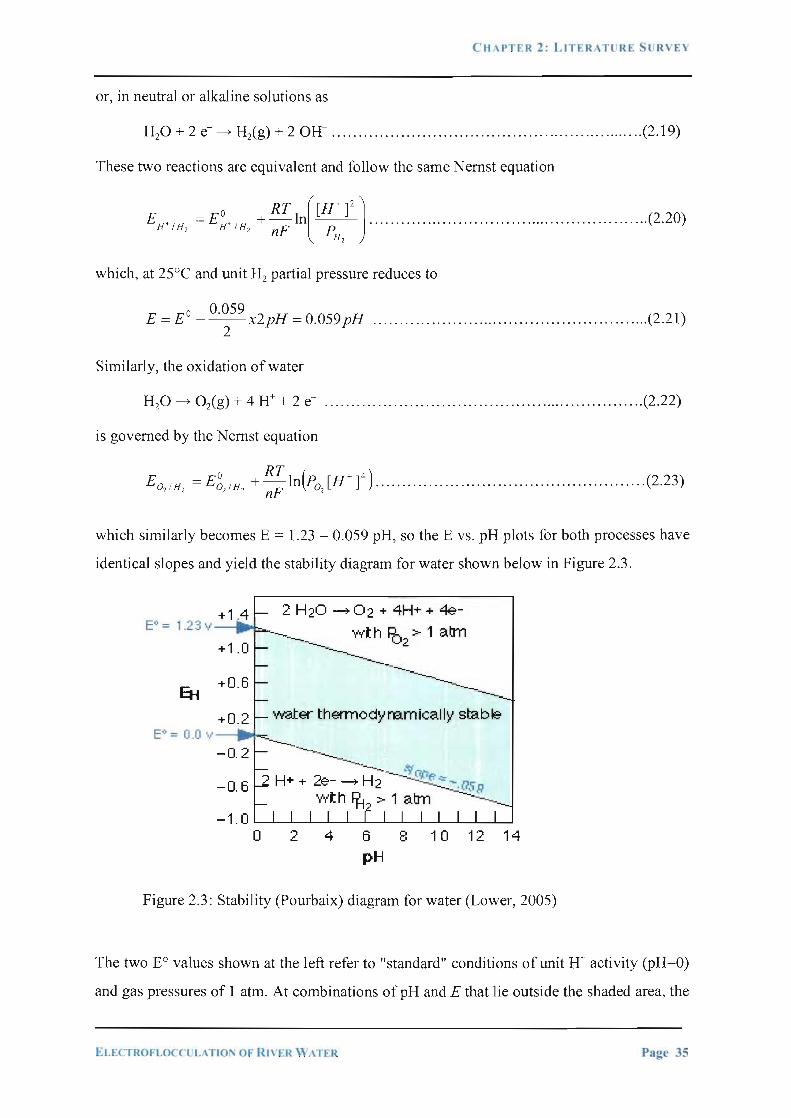
CH.\PTER 2 : LJTERATIJRE SURVEY
or, in neutral or alkaline solutions as
H20 + 2 e- ~ Hig) + 2 OH- ................................ .. .......................... (2.19)
These two reactions are equivalent and follow the same Nernst equation
E t+tH =Eo+. + RT ln([H +)2 J ............... .. ... .. .... .... ........................ (2.20) J-. 2 H , H, nF p
H2
which, at 25°C and unit H2 partial pressure reduces to
E = E 0-
0·059
x2pH = 0.059 pH .................. .. .......................... . .. .... (2.21) 2
Similarly, the oxidation of water
H20 ~ 0 2(g) + 4 H+ + 2 e- . . ....................... ... ....... . .................... . . . .. (2.22)
is governed by the Nemst equation
Eo tH = Eoo tH + RT ln(Po [H+t) ............................................ .. ..... (2.23) 22 22 nF 2
which similarly becomes E = 1.23 - 0.059 pH, so the E vs. pH plots for both processes have
identical slopes and yield the stability diagram for water shown below in Figure 2.3 .
2 H 20 ~ 0 2 + 4H+ + *-----'--- wl: h Jb2 > 1 atm
-......._ ___________ --.__
----------------------.... -....
water tihamodynam·ically stable
-1 . 0L-~~~~~~~~~~~~~
0 2 4 6 8 10 12 14 pH
Figure 2.3: Stability (Pourbaix) diagram for water (Lower, 2005)
The two Eo values shown at the left refer to "standard" conditions of unit H+ activity (pH=O)
and gas pressures of 1 atm. At combinations of pH and E that lie outside the shaded area, the
I!:LECTROFJ.OCC'I L\TION Of Rl\ F.R \\' i\ I'ER Page 35

CIIAPTER 2: LITErtATl RE SURVE\'
partial pressures of 0 2 or H2 exceed 1 atm, signifying the decomposition of water. The unity
partial pressures are of course arbitrary criteria; in a system open to the atmosphere, water
can decompose even at much lower H2 partial pressures, and at oxygen pressures below
0.2 atm. Fortunately, these processes are in most cases quite slow (Lower, 2005).
Coleman (2003) adds that in practice it turns out that the reduction potential referred to
above in Figure 2.3 needs to be at least 0.6V higher than predicted due to a kinetic
phenomenon known as the overvoltage (or overpotential). This "extra energy demand" is
always found when gases are involved in the redox processes, and is also associated with the
complexities of transferring 4 electrons at once, as in the oxidation of water (Coleman,
2003).
The diagram in figure 2.4 below shows how the potentials for reduction and oxidation of
water vary with pH. These are the inner two lines that slope downward from low pH to high
pH. The pH scale only runs from 2-10. For both oxidation and reduction of water, an
additional line is shown that lies 0.6V above (for oxidation of water) or below (for
reduction) the theoretical E. This pair of lines represents the potentials including an
approximation for the overvoltage. Lastly, there is a pair of vertical lines at pH = 4 and 9.
These are reflective of the fact that most natural waters have a pH somewhere between these
limits. The second plot emphasizes the region bounded by the upper and lower potential
lines and pH 4 and 9. This region is frequently referred to as the stability field of natural
waters (Coleman, 2003).
ELECTROFLOC UI.ATIO OF Rl\ ER W, TER Page 36

CH PTER 2 : LJTERATl RE l i RVEY
Stability Field of Water
; with overpotent1al I w I
---, r------ O,/H 20 - ~ ---
0
pH= 4 reg1on or stabil ity of natural
~i waters
pH =,9 I
'~ H;/Hi\ I
I! I
~
wrlh overpotentia~
-~ - i -1
2 4 6 8 10
pH
Figure 2.4: Reduction and oxidation potentials of water versus pH by Coleman
(2003)
A Pourbaix diagram is an attempt to overlay the redox and acid-base chemistry of an
element onto the water stability diagram. The data that are required are redox potentials and
solubility products. The next diagram (Figure 2.5) shows approximate redox and acid-base
behaviour for various types of natural waters. This diagram can be used in conjunction with
the Pourbaix diagrams above to explain and predict a number of phenomena. For example,
in Lake Waban and similar bodies of water, vertical mixing of material in the lake is greatly
retarded by temperature gradients. At the surface, you would expect to find Fe present,
mostly as Fe20/s), but as the solid settled to the bottom, where there is far less oxygen, and
probably organic matter from decay, it is likely that the iron will be reduced to Fe2+. The ions
migrate upwards and are deoxidised to Fe20 3(s).
ELE . fROFLOCCL L.\TION OF RIVER WATER Paae 37
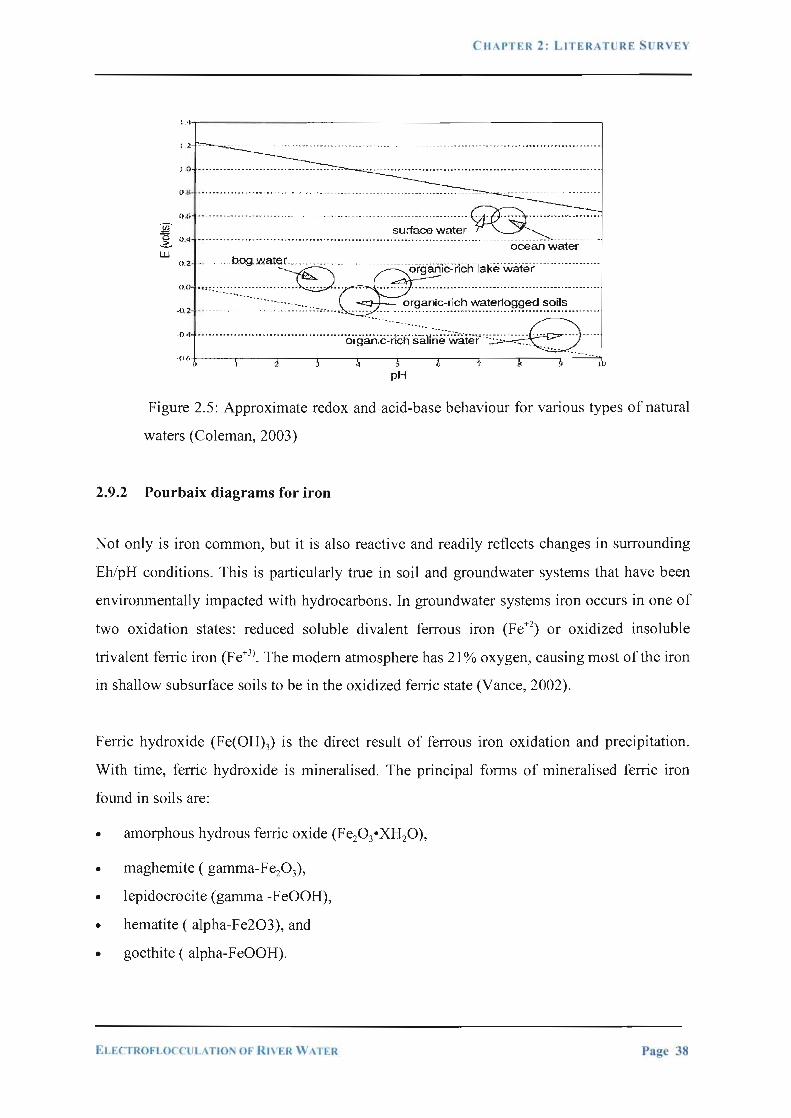
CHAPTER 2: LITERATURE SURVEY
1.4.,.---------------------------,
0 .6 ..... . . . . ... ..... ....... . . . .. . . . .... . . . ... . ........ .. ........ ... . .. .. .. ..... -~--------··· ····----·· ~ surface water -~ ~ 0.4 . .... .. ... .. ... ..... . ...... ...... .. ... .. .. .. ... . ...... .. . ... ..... .......... .. .. .............. ...... . .. ....... .. . .Z. ocean water w :: ::,,:::::::~~~~:::~~~~:~~~~~~:~~~~~-::::::: :::::: ::.:
. ----·----.. .. .. ...... .... ... _ ~~~~~i.<?-rich waterlogged soils
:~ ......... : . ..... : .. :.·::::::~~~~~~.~~~:::~ . (J.6
u
pH
Figure 2.5: Approximate redox and acid-base behaviour for various types of natural
waters (Coleman, 2003)
2.9.2 Pourbaix diagrams for iron
Not only is iron common, but it is also reactive and readily reflects changes in surrounding
Eh/pH conditions. This is particularly true in soil and groundwater systems that have been
environmentally impacted with hydrocarbons. In groundwater systems iron occurs in one of
two oxidation states: reduced soluble divalent ferrous iron (Fe+2) or oxidized insoluble
trivalent ferric iron (Fe+3l. The modem atmosphere has 21% oxygen, causing most of the iron
in shallow subsurface soils to be in the oxidized ferric state (Vance, 2002).
Ferric hydroxide (Fe(OH)3) is the direct result of ferrous iron oxidation and precipitation.
With time, ferric hydroxide is mineralised. The principal forms of mineralised ferric iron
found in soils are:
• maghemite ( gamma-Fe20 3),
• lepidocrocite (gamma -FeOOH),
• hematite ( alpha-Fe203), and
• goethite ( alpha-FeOOH).
ELECTROFLOCCUL\TIO OF J.ti\'ER WATER Page 38

CHAP I £R 2: LITER Tl RE SURVE'c
The above iron oxides are listed in order of decreasing solubility, which also reflects
increasing crystallinity. Amorphous hydrous ferric oxide at neutral pH and oxidizing Eh
conditions has a solubility of 0.6 !J.g/L, which is three orders of magnitude greater than that
of goethite. However, high concentrations of iron in groundwater are not rare; other
processes are at work.
2.9.2.1 Iron Complexing
Ferrous iron is soluble as a cation, ferric iron is only slightly soluble. However, ferric iron
can form soluble complexes with many inorganic and organic ligands, including compounds
that are the byproducts of the biodegradation of aromatic petroleum hydrocarbons
(catechols, which are organic acids resulting from aromatic ring cleavage). The
yellow/orange colouration of groundwater at some sites contaminated with petroleum
hydrocarbons is due to these ferric-catechol complexes.
It is important to remember that complexed ions typically react more slowly than
uncomplexed ions. This impacts the behaviour of ferrous iron. Ferrous iron can normally be
oxidized to ferric iron in minutes (see below for more details). Complexed ferrous iron may
take months to complete the same reaction. This has profound implications for the fouling of
groundwater injection systems. Humic acid, fulvic acid and tannic acid are examples on non
contaminant organic complexes. Phosphate also serves as a very effective complexing agent
for iron.
2.9.2.2 Iron Oxidation
The time required for uncomplexed ferrous iron to undergo oxidation to the ferric state is
dependent on many factors, the dominant being pH, temperature, dissolved oxygen level,
and the presence of other soluble ions. The lower the pH and temperature the longer the time
required for completion of the oxidation reaction. Increasing dissolved oxygen decreases the
time required for oxidation. For example:
• At pH 7.0, 90% Fe+2 oxidation requires 1 hour at 21 ° C and 10 hours at 5° C,
• At pH 8.0, 90% Fe+2 oxidation occurs in 30 seconds At 21 o C,
• At pH 6.0 it requires 100 hours, and
ELECTROFLOC:C"l l.AfiON Of' RIVER \\1.\rt::R Page 39

CtiAPTER 2: LJTERATliRE SLJR\ EY
• The critical dissolved oxygen concentration is 2 mg/L. below that ferrous iron oxidation
occurs slowly.
The above reactions are often responsible for the iron fouling of air strippers treating iron
rich groundwater. These reactions can also foul screens in poorly designed recovery wells
pumping that groundwater.
Knowledge of the pH condition of the environment is not sufficient for predicting the form
in which an element will exist in natural waters. Consideration should be given as to whether
the aqueous environment is well aerated (oxidizing) or polluted with organic wastes
(reducing). In order to add this variable, we must expand the predominance diagram to
include the reduction potential of the environment as well as the pH. This type of
predominance diagram is known as a Pourbaix diagram, E0-pH diagram, or pE-pH diagram
(Jones, 1996).
oxidizing condition
I 6
- U
-I reducing condition
--- I --
n
... ---...
0
20
- --- d --10
- 10 --.. ---........ . -... ---... -... -... -----... f (\) - ·~--
--~--------~--~- )0 1::!. 14
pi!
Figure 2.6: Simplified Pourbaix diagram for 1 Miron solutions
F:t.F.CTROFI.OCTlJI.AliO"\j Of I{ I\ R WA I ER Page 40
CHAPTER 2: LITERATURE SLRVEY
Low E or pE values represent a reducing environment. High E values represent an oxidizing
environment. The pE scale is intended to represent the concentration of the standard
reducing agent (the e·) analogously to the pH scale representing the concentration of
standard acid (H+). PE values are obtained from reduction potentials by dividing Pby 0.059.
The key to features on the Pourbaix diagram on Figure 2.6 is as follows:
• Solid lines separate species related by acid-base equilibria (line a) -
o line a shows the pH at which half of the 1 M iron is Fe3+ and half is precipitated as
Fe(OH)z
o Pourbaix diagrams incorporate Z 1/r calculations and acid-base equilibria.
o the position of an acid-base equilibrium is dependent on the total concentration of
Iron.
• reducing the total concentration of Fe3+ will reduce the driving force of the
precipitation.
• reducing the total iron concentration from 1 M to 10·6 M (more realistic
concentrations for geochemists and corrosion engineers) shifts the boundary from
pH 1.7 to pH 4.2.
In general, in more dilute solutions, the soluble spec1es have larger areas of
predominance.
• Solid double lines separate species related by redox equilibria (lines c & d) -
o redox equilibria of species not involving hydrogen or hydroxide ions appear as
horizontal boundaries (line b).
o redox equilibria of species involving hydrogen or hydroxide appear as diagonal
boundaries because they are in part acid-base equilibria (line c).
• diagonal boundaries slope from upper left to lower right because basic solutions
tend to favour the more oxidized species.
ELEC"TROFLOt CliLA r10.'1, Of Rl\ ER WAH. I{ Page 41

CHAPTER 2: LITERA l tRE SURVEY
• Longer dashed lines enclose the theoretical region of stability of the water to oxidation or
reduction (lines d & f) while shorter dashed lines enclose the practical region of stability
of the water (lines e & g) -
o Dashed line d represents the potential of water saturated with dissolved 0 2 at 1 atm
(very well aerated water).
o above this potential water is oxidized to oxygen:
E0 = + 1.229 V ...................... . .............. . .. . (2 .24)
theoretically water should be oxidized by any dissolved oxidizing agent Eo >
1.229.
• in practice, about 0.5 V of additional potential is required to overcome the
overvoltage of oxygen formation (dashed line e).
• Dashed line f represents the potential of water saturated with dissolved H2 at 1 atm
pressure (high level or reducing agents in solution).
• Below this potential water is reduced to hydrogen:
Eo=+ 1.229 V ... .... ..... ..... . .... . . . .. .. ................... . . .. .. ....... (2.25)
o in practice, an overvoltage effect prevents significant release of hydrogen until the
lower dashed line g is reached.
EI.ECTROFI.OC( UL.HION OF RIVER WATER Page 42

0
- ()
()
An SP6C I0:5 l)ln'l (I Wl\~ety below CIII.S ltrH!' o1t fJIVI!n 1>H Will II)IW~ Wlfh Wi"'tP.r
- 1 .2~ HydrOUt'H d.hd M il HO SJIOCIOS ltJQhet
Of• u.a .u w~• fO lmmod
1-c:- (aq)
-- ---- -------/ - --- I!
.__..._/' -- ~ ----t- C' { I
II
HAPTER 2: LITERATURE StiR V E\
12 1-l
pE:
10
----------
1:? 14
Figure 2.7: Pourbaix diagram indicating the stability and instability offerrate
0
r --------
------ ---------
Fe (s)
pH
---- ---Fe(OHh (s) ---...
------ ------10 14
()
pE
10 the predomln<~nce "llrell fo r Iron (II) wp~tcles narToWI conlldenobly at hi h.,. pH
Figure 2.8: Pourbaix diagram indicating the predominant area for uon (II) species as it
narrows with an increasing pH
ELf.CTROFI .OC<"liL.\TIO' OF Rl\ ER WATER Paae 43

Cll \PTER 2: LITERATURE SUin'EV
2.9.3 Uses of Pourbaix diagrams
• Any point on the diagram will give the thermodynamically most stable (theoretically the most abundant) form of the element for that E and pH i.e. at E = +0.8 V and pH = 14 the
predominant form is FeO/.
• The diagram gives a visual representation of the oxidizing and reducing abilities of the major stable compounds of an element:
o Strong oxidizing agents and oxidizing conditions are found ONLY at the top of the diagram. The lower boundaries of strong oxidizing agents are high on the diagram.
o Reducing agents and reducing conditions are found at the bottom of a diagram and nowhere else. Strong reducing agents have boundaries that are low on the diagram.
o A species that prevails from top to bottom at the pH in question has no oxidizing or reducing properties at all within that range.
ELECTROFI.O('( I l.t\TION OF RIVER\\ \TER Page 44

CUAP fER 2: LtTERATl RE SURVE\
2.10 Electrochemistry (Background and Theory)
2.10.1 Introduction
Towards the end of the eighteenth century, Galvani and Volta discovered methods of
producing electric current; the electrical energy was derived from chemically reactive
systems, though the mechanism was not well understood. Volta ' s devices found uses in the
reverse process of converting electrical energy into chemical energy (Davies, 1967). Water
was decomposed into hydrogen and oxygen, and within few years, Davy had used the same
process of electrolysis to isolate the alkali metals. Electrochemistry advanced rapidly from
these beginnings, and its theoretical foundations took shape with the quantitative study of
the electrolytic process by Michael Faraday in 1833.
Electrochemistry of solute systems deals with the exchange between an electrode and
electron donors or acceptors present in the solvent and with ionic charge transfer through the
solvent between two electrodes. A number of electrolytic reactions take place when there is
an addition or subtraction of electrons from the solute. This is the reason why
electrochemistry is used in the production of some organic and inorganic substances.
Two metallic conductors are immersed in an electrolyte solution. They are connected to a
voltmeter and power-supplying source to make a complete circuit. Electric potential
difference exists between the two electrodes and this leads the current to flow from the
cathode through the external wires and the voltmeter entering the system again on the anode.
The potential difference between the two electrodes is directly proportional to the amount of
ions dissolved in the solution when the electric current is flowing (Barrow, 1966). The
chemical element that has a positive potential of reduction tends to be reduced, that is to
acquire electrons, while the element that has a negative potential tends to be oxidized, that is
to give up electrons.
EL.ECTROFI.OC< llt.A no. Ot· Rt\ t-.H w -\TER Page 45

CH ,\PTER 2: LITER t\TLRE SlJRVE\'
2.10.2 Advantages and disadvantages of electrochemistry
Electrochemical teclmiques offer increasing degrees of accuracy and detection limits, often
involving dramatically lower costs than other teclmiques. In addition, electrochemistry offers
a series of advantages that in many cases can be used to make 'green' processes. Some
include the minimization of waste emissions by improved process design involving the
minimization of by-product formation, raw material usage, and energy consumption (Ibanez,
1994).
In this way, electrochemistry offers important degrees of:
• Environmental compatibility - Electrons are clean reagents per se and any chemical
additive is not necessary,
• Energetic efficiency - Electrochemical processes are not subject to some limitations
inherent in other processes,
• Cost - Among the reducing agents commonly employed, electrons have the lowest cost
per unit of charge,
• Easy operational control and maintenance - In addition, electrochemical reactors
normally do not require moving parts, and thus are mechanically simple and of
relatively low maintenance,
• Versatility - The same electrochemical reactor can often be used for more than one
purpose,
• Ease of automation - The main variables in electrochemical reactors are current and
voltage that are ideally suited for process automation, optimisation, monitoring, and
control,
• Friendly requirements - Contrary to other teclmiques or processes like incineration,
supercritical oxidation, wet oxidation, etc., electrochemical teclmiques normally do not
require high temperature or pressure, and
• Selectivity - An adequate combination of experimental conditions (electrolyte
composition, temperature, degree of convection, applied potential, current) and reactor
characteristics (shape, size, construction materials, electrode materials, membranes) can
be judiciously selected so as to prevent or minimize energy waste and by-product
ELECrROI'LOCCliL\TIO OF RIVf.R W ,\TER Page 46

CHAPT R 2: LITERATlJRE SURVEY
generation. Such by-products not only mean a waste of materials, but also introduce
additional difficulties for their separation and/or disposal.
In spite of these advantages, there are also some challenges to be faced:
• Electrode materials may be prone to erosion, complexation, oxidation, weanng, or
inactivation (the electrodes have to be substituted regularly due to the formation of a
impermeable oxide, which reduces electro-flotation efficiency),
• Since most of the electrochemical processes are performed in aqueous solutions, solvent
decomposition (that is, water oxidation/reduction) is often hard to avoid and thus there
is a concomitant energy waste,
• The production of gases from the above decomposition (hydrogen and oxygen) may
form explosive mixtures,
• The best electrode materials m terms of durability and inertness frequently involve
precious metals, and this increases costs,
• Electricity dependency- the cost of electricity in many areas is prohibitive,
• Initial capital investment may be large, and
• The lack of knowledge or understanding of electrochemistry is perhaps the greatest
hindrance for its utilization.
2.10.3 Electrolysis mechanism
Electrolysis involves passing an electric current through either a molten salt or an ionic
solution. The ions are ' forced' to undergo either oxidation (at the anode) or reduction (at the
cathode). Most electrolysis problems are really stoichiometry problems with the addition of
an amount of electric current. The quantities of substances produced or consumed by the
electrolysis process is dependent upon the following:
• electric current measured in amperes or amps,
• time measured in seconds, and
• the number of electrons required to produce or consume 1 mole of the substance.
LECTHOFL C PI :\TIOJ'\ OF RIVER Wt\TER Pagt> 47

+ r-----i " ,,,,,, t--=------,
Electrolyte
Electrolytic cell
Figure 2.9: The electrochemical principle
2.10.4 Faraday's Law
Cli .\PlER 2: LtTE R,\T I RE l! RVEV
In 1830, Michael Faraday published his experiment using the recently discovered voltaic
column to decompose substances through the use of electric current. An electric current can
pass through metals and many other substances without the substance itself appearing to
suffer any material change; these are metallic conductors. When electricity passes though
salt solutions or fused salts, on the other hand, the mechanism must be different, for where
the current enters or leaves the liquid there is the evidence of chemical action having taken
place; this is electrolytic conduction, and substances giving rise to such effects are termed
electrolytes.
Electrolysis is an oxidation-reduction process involving a conversion of electrical energy
into chemical energy. The electrolytic cell is a galvanic cell operation in reverse. The
automobile battery is an example that acts as a collection of galvanic cells when delivering
electric current, but acts as a collection of electrolytic cells when being recharged.
According to Delpierre and Sewell (2002) Faraday first described the qualitative relationship
between the amount of electric charge (number of electrons) that has passed through an
electrolytic cell and the amount of materials that has formed at the electrodes. Faraday's
investigation of electrolytic conduction established the following two laws:
Et.FCTROFLOCCl LHION Of Rl\ f..R \\ ,HEft Page 48

CHAPTER 2: LITERATURE SURVEY
• In any electrolytic process the amount of chemical action is proportional to the quantity
of the electricity passing the electrolytic conductor (The mass of substance reacting at an
electrode is directly proportional to the total amount of electric charge that passed
through the cell);
• The masses of different substances deposited or dissolved by the same quantity of
electricity are in the proportions of their chemical equivalents (The masses of the
substances reacting at the electrodes are in direct ratio to their equivalent masses).
The equivalent mass of a reacting substance is defined by Delpiere and Sewell (2002) as its
mass that reacts with one mole of electrons in the oxidation-reduction process. The second
law is a consequence of the stoichiometry of the balanced half reactions. Through exhaustive
experimentation, the charge of a single electron has been determined to be 1.602 x 1 o-t9
Coulombs (C). One mole of electrons has a total charge calculated to be 96 485C; this
quality is defined as Faraday (F):
1 F = 96 485 C/mol e·
Faraday's Law predicts a linear relationship between electrochemical dissolution and/or
deposition (plating) of metals. This is an exact science and concerns the variables of an
electrical charge and mobile charged chemical ions. The relationship between electrical
charge and mass is formulated as follows :
........................................................ . ............. ..... . . ......... (2 .26)
where m
Q
F
-mass of electrode dissolved (g)
- Molecular mass of metal electrode (g/mol)
- Electrical charge (C)
- Faraday's constant (96 485 C/mol)
The constant F in the formula is the number of Coulombs (C) that will be required to deposit
one gram of equivalent weight. Its evaluation from the above equation 2.26 requires a
measurement of the weight of an element, of known atomic weight and valency, that is
deposited by a known number of Coulombs, or, in practice, by a known current in amperes
(A) flowing for a known number of seconds.
I<~IJ·TrROFL.O( Cl L \ riON OF RIVER W \ TER Page 49

CHAPTER 2: LITERAT RE l !RVEY
M ·l·t Thus, m = w ••••• • •• • .•..•.•• • •••• •••.•• ••••••• •• • •• .•••••••• • • •. ••••••••••••••••••••• • •• (2.27)
Z·F
where m - mass of electrode dissolved (g)
Mw - Molecular mass of metal electrode (g/mol)
I - Electrical current through the circuit (A)
T -Time (seconds)
z -Valency of the element deposited
F -Faraday's constant (96 485 C/mol)
Electrolysis can also be defined as the decomposition of water and other inorganic
compounds in an aqueous solution by means of an electric current, the extent being
proportional to the quantity of electricity passing through the solution. The positive and
negative ions formed are carried by the current to the oppositely charged electrodes, where
they are collected if wanted or released if unwanted. Metallic ions deposited on the electrode
form a coating. A simple electrolysis is the separation of water into oxygen and hydrogen.
2.10.5 Electroflocculation
Electrocoagulation and electroflocculation are two techniques involving the electrolytic
addition of coagulating metal ions directly from sacrificial electrodes. These ions coagulate
with pollutants in the water, in a similar manner to the addition of coagulating chemicals
such as alum and ferric chloride, and allow the easier removal of the pollutants. The
electrolytic addition of these ions has a number of advantages over their addition chemically.
There is no addition of anions meaning no increase in salinity of the treated water. The
system produces half to one third of the sludge. Greater activity means fewer metal ions
required and a wider range of pollutants can be removed. In electroflocculation, the
pollutants are removed by the bubbles which are generated during the process, capturing the
coagulated pollutants and floating to the surface. Appropriately constructed a single unit can
be used to coagulate the pollutants and float them to the surface, from where they can be
easily removed (Robinson, 1999).
EI.FCIROFI OCTI L\IION OF RIVER W ,\fER Page 50

CHAPTER 2: LITERATLRE UR\'EY
Wastewater is the largest disposal problem associated with waste and by product production,
being typically many tonnes of water per person per year in industrialised countries
(Robinson, 1999). Yet the total amount of pollutant in the water is often much less than 0.1%
(1 000 ppm). Great quantities of water are used to remove small amounts of pollutant. The
magnitude of the waste problem could be considerably reduced if techniques which
concentrated or removed the small amount of pollutant and left the majority of water in a
condition suitable for reuse were used. Many different techniques are available, including a
variety of filters, chemical dosing, reverse osmosis and similar. Many of these are either very
pollutant specific or more expensive than dumping and using more water. These latter
options are fast disappearing and new methods need to be sought. According to Robinson
(1999), for a technique to be successful it needs to satisfy the following criteria:
• It must be cost-effective, producing results which are cheaper than dumping and
purchasing more water. With water costs - for purchasing water and a similar price for
disposing to sewer, both the capital and operating costs must be low and the results as
good as tap water for the technique to be successful;
• It must remove the contaminants thereby producing water which can be reused in the
same application, or as a replacement for water in another application;
• It must not in itself produce great amounts ofwaste;
• It must operate reliably and have low downtimes.
Electrolytically based processes appear to offer some of these advantages. These involve the
passage of an electric current via sacrificial electrodes. Their operating costs are low because
of the low cost of electricity and the element materials used. Many attempts have been made
in the literature to take advantage of the potential associated with these capabilities, but with
limited success. The process, usually known as Electrocoagulation (Stuart, 1946; Bonilla,
1947, Matteson et a!., 1995), involves the passage of an electric current, usually using
aluminium electrodes. Aluminium goes into solution at the anode and hydrogen gas is
released at the cathode. The aluminium coagulates with the pollutants which can then be
removed, usually by either settling or filtration.
Some of the problems encountered with this technique have been associated with element
lifetimes (Holt et a!., 1999). This has resulted in high operating costs and made the process
ELf.CTROFLOCCLILA 1'10.\ OF RIVEI~ WATER Page 51

CHAPTER 2: LITERATURES RVEY
uneconomical and the potential benefits were lost. Recently these problems appear to have
been overcome and at least one commercial electrocoagulation unit is available. A variation
of the electrocoagulation process is one in which the gas generated by the process captures
the coagulated pollutants and floats them to the surface. Known as electroflocculation, it
offers the possibility of a one-step process, in which polluted water is pumped into a
processing reactor, the pollutants are floated to the surface and the cleaned water is pumped
out at the end of the process. Theoretically there are no chemicals to be added and no filters
which need cleaning, enabling this process to have the potential to achieve the above goals.
Laboratory prototype reactors had been constructed in which preliminary work was
undertaken to check the feasibility of the process and determine its viability to treat different
types of wastewater. These results also enabled an understanding of the processes involved
to be gained. Based upon the success of laboratory experiments, industrial scale units were
field trialled in a number of different applications. Results by Bonilla (1947) indicated the
ability to treat a variety of different types of water. Fats, oils and greases (FOGs) removal
rates in excess of 99.95% have been achieved (Bonilla, 1947) and turbidity of rural clay
water has been reduced to below 1 NTU, from values starting at greater than 500 NTUs
(Packham, 1965). Bacteria removal rates in excess of 99% have been achieved from single
stage reactors. The process appears to hold significant advantages for the treatment of
wastewaters .
2.10.5.1 Theory of electroflocculation
Electroflocculation provides an alternative technique for the removal of pollutants from
wastewater. The process involves the application of an electric current to sacrificial
electrodes, usually aluminium, inside a processing tank. The reactions at the anode and
cathode respectively are typically generating aluminium ions as a coagulating agent as well
as gas bubbles. The well-known properties of the aluminium ions as a coagulating agent
cause them to combine with the pollutants. The gas bubbles generated can capture the
coagulated agglomerates, similar to the application in a dissolved air flotation (DAF) unit,
resulting in most of the pollutant being floated to the surface. In theory, this
electroflocculation process can be used as an alternative to DAF processing, with the added
ELF.CTROFLO< CI IL \TIO ' OF RI\"ER WA TF.R Page 52

CH ,\PTFR 2: LITERATURES R\'E\'
advantage that there are no chemicals to be added. As is the case with DAF, there are no
filters to be used for final pollutant removal.
AI+ 3e- -+ Al 3+ .•.•.••.•••.••..••...•..•.....•.•...•••.••........••.••.••....••.. •. •••.• •• .•• (2.28)
2H 20+2e--+ 20H- +H 2 •••••••••••••••••.••••..•••••••••.••••••••••••••••••••••••.•.•••••.•• (2.29)
In addition to the use of aluminium, other metals also have coagulating properties and can be
used in place of aluminium. The use of these in conjunction with or independently of the use
of aluminium, offers several potential advantages associated with the electroflocculation
process. Not the least of these is that the aluminium/metal coagulating cation is added
without the addition of an anion. This means that the whole process is carried out without
any substantial effect upon the salinity of the water. Additionally, the sludge produced by
Electrocoagulation is reduced by a factor of 2 or 3 over the use of chemical coagulants
(Musquere et a!., 1983). Furthermore , experiments suggested that electrolytically added
aluminium ions were much more active than chemically added aluminium ions (Donini et
al. , 1994), meaning that less aluminium was required and that this process could be used to
treat a number of different pollutants which could not be handled by chemical flocculants
such as alum (aluminium sulphate).
Based upon these and other perceived advantages, considerable development work was
undertaken with the objective of determining if the above-mentioned potential advantages
could be converted into a practical system.
2.10.5.2 Electrode properties
2.10.5.2.1 Aluminium and its properties
Aluminium has the atomic number of 13 with atomic weight of 26.981; it has a melting
point of 923.437 K, density of 2.7 grams per cubic meters and it appears as a solid metal at
room temperature. Although aluminium is the most abundant metal in earth's crust it is
never found free in nature. All of the earth's aluminium has combined with other elements to
form compounds. Two of the most common compounds are alum, such as potassium
aluminium sulphate (KAl (S02) 2.12H20), and aluminium oxide (Al20 3), about 8.2% of the
earth's crust is composed of aluminium (Waterwell, 2005).
ELECTROFLOCCI IL.ATIO. OF RIVF.R WATER Page 53

H\PTER 2: LITERATLRE SURVEY
Aluminium and its alloys have a high affinity for oxygen. This means that clean, bare
aluminium forms an oxide film in a minute when exposed to air. It is difficult to plate onto
an oxide film with good adhesion. The normal natural oxide film formed on aluminium
helps protect in normal outdoor environments. However, the oxide layer must be removed
for good adhesion. This presents a problem when plating aluminium, as the oxide layer
prevents the plate from sticking, but fortunately the oxide layer can be chemically removed.
Aluminium is difficult to coat with most conventional electroplating and/or conversion
coatings because it oxidises rapidly. Also, it acts as a cathode during the coating process,
which leaves voids in the coating, causing corrosion. Another issue is that the thermal
expansion of aluminium differs from most metal alloys used in plating. This factor causes
most conventional plating products to peel, chip and flake (Waterwell, 2005).
The decoration and protection of aluminium and its alloys by the application of the
electrodeposits or electroless deposits result in very attractive enhanced properties of the
base metal with highly desirable surface attributes. Much effort has been put into the
development of an efficient means of plating aluminium. The reasons for aluminium plating
can be summarised as followed:
• Formation of an attractive finish,
• Increasing the corrosion resistance,
• Increasing wear resistance,
• Increasing of the surface hardness (electro less nickel), and
• Increasing of the solderability/ brazability.
The low specific gravity of aluminium, whereby approximately three times as many
components may be produced from the same weight compared with ferrous or other
common base metals, is an important economic factor which makes it well worth
investigating the possibility of replacing heavier metal by the light alloys (Waterwell, 2005).
2.10.5.2.2 Iron and its properties
Iron is a chemical element and one of the most important metals in the world. The normal
range for iron in freshwater is 0.1-0.5 ppm or mg/L. The accepted USEP A regulatory limit is
300 micrograms/L. If there is too much iron in the water, the water appears rusty. This water
ELEC.TJ{OFLOCClii.A fiO"'I OF Rl\ Ell WATER Page 54

CHAPTER 2: LITERATURE "LJRVEY
has a metallic taste and it stains fixtures, utensils, and laundry. High concentrations of iron
form reddish-brown ferric hydroxide sediments, coatings, and stains. Rust occurs when iron
combines with the oxygen in water. A water softener in the home helps with this problem.
Despite the problem of rusty drinking and wash water, iron is needed by our body. It helps
carry oxygen throughout the body. Iron deficiency in the blood will cause body fatigue.
Certain foods provide the human body with the iron that is required (Waterwell, 2005).
Iron is one of the most troublesome minerals encountered in domestic and commercial water
supplies. The various forms of iron can leave stains and deposits that range in colour from
yellow to brown, but commonly have a "rusty" colour. As organic residue, it may be grey to
black, slimy to rock solid. Iron can also impart undesirable odours and tastes to water
(Waterwell, 2005).
Iron occurs in many forms in natural water supplies. The most common forms are described
as follows:
• Dissolved Iron
'Clear water' iron, is the most common form and the one that results in the most complaints
by water users. This type of iron is identified after you have poured a glass of cold clear
water. If allowed to stand for a few minutes, reddish brown particles will appear in the glass
and eventually settle to the bottom (DNR, 2003). Ferrous bicarbonate [Fe(HC03) 2] is found
only in oxygen-free water. Dissolved iron is measured in parts per million (ppm). One ppm
is equivalent to approximately 1/4 ounce of iron in 1 900 gallons of water. The
recommended limit of iron in drinking water is 0.3 ppm and will begin staining at 0.5 ppm.
Water containing iron can be clear and colourless when drawn. However, upon contact with
the air, oxygen is absorbed and reacts with the dissolved iron to form insoluble ferric
hydroxide (commonly known as rust). This clouds the water and colours it in shades of
yellow to red-brown (Waterwell, 2005).
This reaction produces carbon dioxide as follows
2Fe(HC03 ) 2 + /i 0 2 +H20 ~ Fe(OH) 3 +4C02 ••••••• ••••••••••••••••••••••••••••.••••• (2.30)
The dissolution of the above carbon dioxide in water also forms carbonic acid. The presence
of carbonic acid lowers the pH, and in low alkalinity water (2-3 gpg total solids) this can
[LfCTROFLOCCl iL\110 OF Rt \ER Wi\ I'ER Page 55

CHAPTER 1: LlTERATliRE SlR E\
cause some corrosion problems in the system. Filtration through a neutralization media is
then required to remedy this. The neutralization medium commonly used is composed of
calcium carbonate such as limestone or marble (Waterwell, 2005).
Small quantities (less than 0.5 ppm) of ferrous iron, in the absence of dissolved oxygen, may
be removed by ion exchange water conditioning. If this method is used, a chemical resin
cleaner is required to be added to the brine. This will help remove the exchanged iron and
prevent any oxidized iron from fouling the resin bed. Ferrous iron, in higher concentrations,
is most commonly removed by a two-step oxidation then filtration process. Chlorine,
oxygen, and potassium permanganate are the most common oxidizers used. The filter media
is most commonly manganese greensand (Waterwell, 2005).
• Insoluble Iron
When insoluble iron, or 'red water' iron is poured into a glass, it appears rusty or has a red or
yellow colour. Insoluble iron can create serious taste and appearance problems for the water
user. Because iron combines with di fferent naturally occurring acids, it may also exist as an
organic complex. A combination of acid and iron, or organic iron, can be found in shallow
wells and surface water. Although this kind of iron can be colourless, it is usually yellow or
brown. Insoluble ferric hydroxide in water produces a red water condition. It is found in
some natural waters as a suspension of fine, denser-than-water particles. More often ferric
hydroxide, in water, is formed when exposed to oxidizing conditions, like percolating from a
spring, or being exposed to air at a water tap (DNR, 2003).
Another source of insoluble iron is from the action of bacteria. When iron exists along with
certain kinds of bacteria, problems can become even worse. Iron bacteria consume iron to
survive and leave a reddish brown or yellow slime that can clog plumbing and cause an
offensive odour. You may notice this slime or sludge in your toilet cistern when you remove
the lid . Bacteria can produce ferric hydroxide or iron carbonate as a waste product. Chlorine
fed into the well or before the pressure tank will control this type of bacterial nuisance
(DNR, 2003).
~LECTROFL.OC CIIL \TIO~ OF RIVF.R ,V-\1<'1{ Pagl" 56

H PTER 2: LITERATLIRE Sl1RVEY
2.10.6 Possible electrochemical mechanisms
The pH, pollutant type and concentration, the bubble size and position, floc stability and
agglomerate size all influence the operation of the electrocoagulation unit. The overall
mechanism is a combination of mechanisms functioning synergistically. The dominant
mechanism may vary throughout the dynamic process as the reaction progresses. The
dominant mechanism will almost certainly shift with changes in operating parameters and
pollutant types.
A current is passed through a metal electrode, oxidising the metal (M) to its cation (Mn+) .
.......... .. . . ..... .. . .. ..... . ...... .. ................ .. ........... .. ........ (2.31)
Simultaneously, water is reduced to hydrogen gas and the hydroxyl ion (OR).
2H 20+2e- ~ 20H - +H 2 . • .•• • ••••••••••••••••••••• • • •• ••••••••••••••••••••••••••••••••..••• (2.32)
Electrocoagulation thus introduces metal cations electrochemically, using sacrificial anodes
(usually aluminium or iron). The cation hydrolyses in water forming a hydroxide with the
dominant species determined by solution pH. Equations 2.33 - 2.36 illustrate this in the case
of aluminium:
Al 3+ + H2 0 ~ AJOH 2+ + H+ ........... ... ......................... .... ................ (2.33)
Al0H 2+ + H 20 ~ Al(OH) ; + H+ ...... . . . ... .. ..... .. .... .. ............... . ...... . ......... (2.34)
Al(OH); + H 20 ~ Al(OH) ~ + H + ............ .. .......................... . . .. ............... (2.35)
Al(OH) ~ + H 20 ~ Al(OH)~ + H+ ........... .. . ...................... .. . . .. . . ............... (2.36)
Highly charged cations destabilize any colloidal particles by the formation of polyvalent
polyhydroxide complexes. These complexes have high adsorption properties, forming
aggregates with pollutants.
Evolution of hydrogen gas aids in mixing and hence flocculation. Once the floc is generated,
the electrolytic gas creates a flotation effect removing the pollutants to the floc - foam layer
at the liquid surface.
ELE("TROFL() n L\ T ION OF RIVER W •\ TER Page 57

CHAPTER 2: LITERATURE SURVEY
According to Paunovic and Schlesinger ( 1998), the deposition reaction involves four types
of issues. They are:
• Metal-solution interface as a locus of the deposition process,
• Kinetics and mechanism of the deposition process,
• Nucleation and growth process of metallic lattice (M lattice), and
• Structure and properties of the deposits.
The reduction of a metal, which occurs during the electrochemical deposition process, has
been generalised as Equation 1 for a single metallic ion. Obviously, to reduce one mole of a
given metal n moles of electrons are required. That is, the total cathodic charge used in the
deposition Q (Coulomb) is the product of the number of gram moles of the metal deposited
n, the number of electrons taking part in the reduction ne, Advogadro's number N. (the
number of atoms in a mole), and electrical charge per electron Qe (coulomb). Thus, the
following equation gives the charge required to reduce m mole of metal :
Q = n.ne.N •. Qe ... . . .. ......... .. ... . . . ... . .......... . .................. . .................... (2.37)
Now, the product of the last two terms in this equation is the Faraday constant F. Therefore,
the number of moles of metal reduced by charge Q can be obtained as:
n = _g__ n e · F
...... ... ... . .................................. . ............. . ... .... ................. (2.38)
on the other hand, the total charge used in the deposition can be obtained as the product of
the current I (Ampere) and the time of the deposition t (second) if the deposition current is
held constant. Or, if the current varies during the deposition:
Q = f I· dt ......... . .. . . .. . ..... ......... ..... . .. . .... ....... .. ............................. .. .. (2.39)
So, the number of moles deposited can be calculated as:
n =-1-JI·dt
n e ·F .............................................. . .......................... . ... (2.40)
ELECTROFLOCCl. L.\TION OF RIVER \V \TER Page 58

. HAPTER 2: LITERATURE SURVEY
There are a variety of ways in which species can interact in solution:
• Migration to an oppositely charged electrode (electrophoresis) and aggregation due to
charge neutralisation,
• The cation or hydroxyl ion (OR) forms a precipitate with the pollutant,
• The metallic cation interacts with OR to form a hydroxide, which has high adsorption
properties thus bonding to the pollutant (bridge coagulation),
• The hydroxides form larger lattice-like structures and sweep through the water (sweep
coagulation),
• Oxidation of pollutants to less toxic species, and
• Removal by electro-flotation and adhesion to bubbles.
The inherent complexity of the process makes it difficult to model and control. Adequate
scale-up parameters, a systematic approach to the optimisation and a priori prediction for the
performance of the electrocoagulation reactor are yet to be established. The literature reveals
that previously each new system has been considered on an individual basis. There has been
little or no attempt to provide a holistic approach to electrocoagulation. In order to
understand the mechanisms behind electrocoagulation, and thus control the system better, a
holistic approach is required.
2.11 Chemical Issues
The control, operation, and chemical interactions of the system affect performance and
reliability. Adding to complexity, the chemical interactions of the pollutants (type and
concentration) with the electrode material, electrode passivation, and operational region
should also be considered. This literature survey has not revealed a systematic approach to
these issues.
2.11.1 Electrode material
The anode material determines the cation introduced into the solution. Several researchers
have studied the choice of electrode material with a variety of theories as to the preference of
a particular material. The most conunon electrodes were aluminium or iron plates as
described by Holt et a!. (1999).
ELECTROFL.O( CI IL.\TIO.' OF RI\'ER \V,\TF.R Page 59

CIIAPTER 2: LITERATURE SURVEY
Holt et al. (1999) compare the performance of iron and aluminium electrodes for removing
colour from dye-containing solutions. Their conclusion was that the optimal
electrocoagulation conditions varied with the choice of iron or aluminium electrodes, which
in tum is determined by:
• Initial pollutant concentration,
• Pollutant type, and
• Stirring rate.
One group (Holt et al. , 1999) investigated the relationship between ' size' of the cation
introduced and removal efficiency of organic waste. The size of the cation produced (I 0-
30)..lm for Fe3+ compared to 0.05-1 ).lm for Al3+) was suggested to contribute to the higher
efficiency of iron electrodes.
2.11.2 Electrode passivation
One of the greatest operational issues with electrocoagulation is electrode passivation. The
passivation of electrodes is a concern for the longevity of the process. Passivation of
aluminium electrodes has been widely observed in the literature (Holt et al., 1999). The
latter also observed that during electrocoagulation with iron electrodes, deposits of calcium
carbonate and magnesium hydroxide were formed at the cathode and an oxide layer was
formed at the anode. Holt et al. (1999) investigated various methods of preventing and/or
controlling electrode passivation including:
• Changing polarity of the electrode,
• Hydro mechanical cleaning,
• Introducting inhibiting agents,
• Mechanical cleaning of the electrodes.
According to these researchers, the most efficient and reliable method of electrode
maintenance was to periodically mechanically clean the electrodes which for large-scale,
continuous processes is a non-trivial issue.
ELE\TROFLOCCIIL.\ TIO~ ()f Rl\ ER "" \TER Page 60

CHAPTER 2: LJTER.\TURE Sl'RVEY
2.11.3 Solution pH
Solution pH determines the speciation of metal ions. The pH influences the state of other
species in solution and the solubility of products formed. Thus, solution pH influences the
overall efficiency and effectiveness of electrocoagulation. The pH of the solution can easily
be altered. An optimal pH seems to exist for a given pollutant, with optimal pH values
ranging from 6.5 to 7.5.
F.J.fClltOFI 0( Cl L.\ liON CH Rl\ Ut WAr Eat Page 61

CH \PTER 3 : EXP RI\IE 'Tr\L PROCEDURE
Chapter 3: Experimental Procedure
3.1 Introduction
All experiments were carried out at the Vaal University of Technology and where required,
verifications were made. The experiments were performed on a bench scale. The
investigation procedure involved a modification of glass beaker used as a reactor consisting
of apparatus that included the electrode assembly and the auxiliary power supply.
The experimental procedure follows a simple electrolysis principle whereby electrodes are
placed in river water. The electrodes are connected and supplied with power to complete an
electrochemical cell. To determine the rate of dissolution of electrodes, during the course of
the experiments the electrodes were weighed. The theoretical amount of metal dissolved
(calculated using Faraday's equation for electrode dissolution) was compared with the
weighed values of electrode dissolved. Aluminium and iron cations undergo hydration
reactions in aqueous systems to an extend governed by the properties of the cation, the metal
ion concentration and the [H+] concentrations. That is the "naked' metal ions do not exist in
water, but occur as aqua complexes of varying degrees.
e
+ 1--------i 11111111 t----=------,
Anode Cathode r=+---f-'1
Electrolyte
Electrolytic cell
Figure 3.1: Electrolytic cell representing an experimental setup (Delpierre and Sewell, 2002)
The river water treated by the electroflocculation process during this project was purely
natural and no simulation of river water specifications was made. Distilled water was only
ELECTROFLOCC l L.\TION 01- RIVER WA n.R Page 62

CIIAPTER 3: [\PERii\IENT L PRO ED RE
used for cleaning of apparatus, for calibration and standardisation of analytical instruments.
No chemicals were used for pH or any other operating parameter adjustment. All
experiments were duplicated to validate the results. During the optimisation stage
continuous agitation was used to investigate the effect.
Initially the parameters (iron, aluminium, pH, colour, conductivity, turbidity, solids (TDS
and SS), as well as phosphates) were measured and compared against the guidelines as
determined at the Engelbreghts weir reported in Chapter 2 on page 13, Figure 2.1. For
electrolysis to exist, raw water (Vaal River water) was poured into a beaker; pre-weighed
electrodes were immersed into the beaker (approximately 75% of the electrode depth was
immersed). The equipment for variable measurement was immersed in the water in the
reactor unless otherwise stated in which case representative samples were withdrawn from
the mother solution for analysis at set time intervals. The inverter regulated the alternating
current. Alternating current makes "self-cleansing" of the electrodes possible and provides
favourable energy consumption during the electrolysis. The electrochemical reaction was
allowed to proceed for a predetermined time. During the experiment iron, aluminium, pH,
colour, conductivity, turbidity, solids (TDS and SS), and phosphates results were recorded
against time. Changes observed are reported in the Chapter 4 and also in the Appendix A.
In order to alternate between the anode and cathode, a reverse-polarity switch was used. The
switch reverses the direction of the current to alternate between the cathode and the anode as
necessary. This was done every five minutes to allow the electrodes to corrode equally and
to prevent the formation of a passive layer on the electrodes.
3.2 Operating Variables
Controlled variables include current passing through the circuit and the stirring rate (in some
experiments agitation was not employed to test and check the influence). The DC power
supply, model PS-3050 was used to supply the direct current to the solution. The current
was kept constant at a fixed value while the voltage was adjusted accordingly to keep the
current at a given set value. The sample was stirred continuously using a magnetic stirrer in
order to give an even distribution of ions in the solution for pH measurements. Where
[LECTROFLOCCL L'\TION OF RIVER \V.\TER Page 63

CHAPTER 3: EXPERIME 1 AL PROCEDURE
agitation was employed the stirring rate was kept constant at 700 revolutions per minutes
(the effect of variable agitation speed was not evaluated for this experimentation).
The measured variables in the treated water were iron, aluminium, pH, colour, conductivity,
turbidity, solids (TDS), and phosphates. Procedures for analytical methods and operation of
the analytical test instrument are summarised in Section 3.6.
3.3 Apparatus
Electrolysis involves passing an electric current through an ionic solution to ensure that ions
are 'forced' to undergo either oxidation (at the anode) or reduction (at the cathode). For this
electrochemical process, apparatus is needed to perform or fulfil this experiment. Figure 3.2
shows a photograph illustrating how the apparatus is setup for experimentation.
Figure 3.2: The experimental setup
t: LFCTROFLOCCI L. \ rJON OF HIVER W \fER Page 64

CII .\PTER 3 : EXPERll\lENTr\L PROCE D RE
List of apparatus, equipment, instruments and materials used for experiments
The apparatus as shown in Figure 3.2 includes the following:
• Aluminium electrodes
• Iron electrodes
• Electrodes holder
• Magnetic stirrer
• River water (as electrolyte)
• Glass beakers
• Volumetric cylinder
• Auxiliary Power supply with Ammeter, Voltmeter and power connecting cables -
Model PS-305D
• Inverter - Reverse polarity switch
• Bench top weighing scale
• Conductivity meter
• pH meter- Cyberscan 5000
• DR 2000 spectrometer
• Varian Spectr AA-10 atomic absorption spectrometer
3.4 Cell Design
The cell design will affect all the figures of merit for an electrolytic process and as a result
several factors had to be considered when designing the electrochemical cell. These
considerations included simplicity (the cell design should meet the process requirement in
the simplest way); in that way the following simple specifications were set to suit the design:
• Electrode materials: iron and aluminium
• Number of electrodes used per reaction cell = 2
• Distance between electrodes = 3 em
• Electrode thickness = 1.5 mm
• Length of electrodes = 20 em
• Breadth of electrode= 2.5 em
• Length of electrode submerged = 15 em
El F.CTROFL.O<T I I.ATION OF Rl\ ~R \\ ATER Page 65

CU .\PH.R 3: E P IHME TAL PROCEDURE
• Area submerged per electrode= 0.0077625 m2 (77.625 cm2)
• Reactor volume= 1000 mL (1 Litre)
• Stirring rate= 700 revolutions per minute (rpm)
Figure 3.3: The electrochemical cell
3.5 Experimental Procedure
The glassware was washed with ten percent hydrochloric acid and rinsed with distilled water
before the experimentation commenced. For re-use of electrodes, used electrodes were first
washed with ten percent hydrochloric acid, rinsed with distilled water and left to dry off.
Then the following generic step-by-step procedure was followed for each test:
• Weigh electrodes before commencing with experiments
• Measure and analyse raw water before commencing with experiments (ensure
instruments are working well and are calibrated)
• Pour a measured amount of raw water into the beaker
• Clamp the metal electrodes into the electrode holder - the configuration should be the
same as indicated in Section 3.4 Cell Design
• Immerse the electrodes into the water in the beaker
• Connect the power cables from the power source to the electrodes
El.E(IROFI.OCctiL\ liON OF Rl\ ER WATER Page 66

CHAPTER 3: EXPERIMENTAL PROCEDURE
• Set the timer for alternating the current through the circuit
• Switch on the power supply and recorder
• Record initial current flow and voltage
• Measure pH, turbidity, conductivity, TDS, colour, metal (iron and/or aluminium)
concentration, and phosphates at specified time intervals
• Take and filter samples to perform analytical tests
• Monitor the change and record observations
3.6 Analytical Procedures
3.6.1 Operation procedure for Atomic absorption spectrometer
This method describes the safety precautions, controls and operating instructions for the
Atomic absorption spectrophotometer Spectr AA-1 0.
3.6.1.1 Safety practices
A - Exhaust system:
• Fumes (some exhaust gases are toxic) and heat produced by the flame must be
extracted by means of an exhaust system.
• Equip the blower with a pilot light located near the instrument to indicate when
the blower is on, or use some other device for this purpose
B - Cylinders:
• Compressed gases should be stored and handled strictly m accordance with
relevant safety codes.
• Fasten all cylinders securely to an immovable structure or a permanent wall.
• Store, or move cylinders in a vertical position only.
• The area in which cylinders are stored must be adequately ventilated to prevent
toxic or explosive accumulations.
• Always locate cylinders away from heat or ignition sources. Cylinders have
pressure relief devices which will release the contents of the cylinder if the
temperature exceeds 52 °C.
• Always ensure that you have the right cylinder before connecting the cylinder to
the instrument.
ELr.cmor~.occu .. \TION or RI\'F.R WATF.R Page 67

CliAPTER 3: EXPERt IE T L PROCED RE
• Use only approved regulators and hose connectors. Remember that left-hand
thread fittings are used for fuel connections; right-hand fittings are used for
support gas connections.
C - Precaution with acetylene:
• Since acetylene is a flammable gas proper precautions should be taken when
using it.
• Never run acetylene at a pressure higher that 105 kPa. At pressures above this
level acetylene can explode spontaneously. Include a flash arrestor in the line.
• Never pass acetylene through copper tubing or brass tubing containing more that
65% copper since this may provoke explosion. Do not use any tubing which
reacts chemically with acetylene.
• Never bring acetylene into direct contact with silver, liquid mercury, or gaseous
chlorine.
D - General precautions:
• Perform leak tests every month by applying a soap solution to all joints and seals.
• Arrange gas hoses so that they will not be damaged, stepped on, or have things
dropped on them. Inspect all hoses regularly.
• A drainage tube must be connected to the drain outlet on the liquid trap and led to
a suitable waste vessel.
• Never attempt to light a burner unless the liquid trap is full. The standard liquid
trap supplied is for use with aqueous solutions. A vent tube must be connected to
the vapour vent on the liquid trap and led to a location where vapours may be
safely discharged when vapours are toxic.
• Never view the flame or hollow cathode lamb directly. Always use protective
eyewear - preferably with side shields. (Hazardous ultra-violet radiation is
emitted by flames and hollow cathode lamps).
• Do not leave a flame unattended.
E- Burners:
• Burners are clearly identified by the fuel I oxidant combination for which they
are intended. Always fit the correct burner. Never attempt to use an air-acetylene
burner for nitrous oxide-acetylene.
ELHTROFl.O Cl ll. \riO Of Rl\ R W \ TER Page 68

CHAPI'ER 3: EXPERIMENTAL PROCED RE
• Whenever you change burners remember that the burner you have just used may
be very hot. Always use protective gloves unless you are absolutely sure that the
burner is cool enough to handle safely without gloves.
• Always operate with the flame shield closed and the sample compartment front
panel in place.
F - Lighting a flame:
• Follow instructions provided (section 3.6.1.6). Turn the gases on and off in the
right order.
• At the end of the day close off the acetylene supply at the cylinder.
3.6.1.2 Apparatus and gases
• Cylinder of acetylene
• Cylinder of air or compressed air.
• Regulators for the gases.
3.6.1.3 Summary of practice
• In flame atomic absorption spectrophotometry, a standard or sample solution is
aspirated as a fine mist into a flame where it is converted to an atomic vapour
consisting of ground state atoms. The flame provides energy to the ground state
atoms allowing them to absorb electromagnetic radiation from a series of very
narrow sharply defined wavelengths. Light from a hollow cathode lamp or other
source consisting of the characteristic monochromatic radiation generated by
excitation of the element of interest is passed through the flame. Light from the
source beam is isolated by the monochromator and measured by the
photodetector. The amount of light absorbed by the analyte is quantified by
comparing the light transmitted through the flame during nebulisation of a known
concentration of the analyte to light transmitted during nebulisation of a solution
that does not contain any measurable concentration of the analyte.
• An atomic absorption spectrophotometer may have single or double system. The
spectr AA-1 0 has a single beam system. The amount of light absorbed in the
flame is proportional to the concentration of the element in solution.
ELI::CrROH.O(TIIL\TI0/'1. OF RI\'ER \V \T R Page 69
CH \PTER 3: EXPERil\lE1 TAL PROCED RE
• Calibration - The atomic absorption spectrophotometer is calibrated with
standard solutions containing a known concentration of the element of interest. A
calibration curve is constructed for each analyte from which the concentration in
the unknown sample is determined.
3.6.1.5 Flame type
• Air-acetylene
For most elements the flame should be oxidising (non-luminous with a hazy blue
inner cone). For some metals, particularly chromium, molybedium and tin, a
reducing flame (white, luminous) is required. The best flame condition may be found
for each element by adjusting the gas flows and burner position until maximum
absorbance is obtained while aspirating a standard solution known to give about 0,4
absorbance.
• Nitrous oxide-acetylene
This flame allows the determination of many refractory elements which cannot be
determined in the cooler air-acetylene flame. It also provides better sensitivity and
greater freedom from interference than air-acetylene for a number of elements,
notably barium, calcium, chromium, molybedium, strontium and tin. Flame
composition and burner position is more critical, and small departures from optimum
may cause severe loss in sensitivity.
Generally, a slight fuel-rich flame is required with a red zone approximately 2 em
high. A number of metals are appreciably ionised in the nitrous oxide acetylene
flame but this interference can be countered by adding excess of potassium or
caesium to the analytical solution (1 000 - 2000 !lg K orCs per ml).
ELECTROFLOCCI ILATIO"i OF RIVER WATER Page 70

CHAPTER 3: EXP£RIME TAL PROCEDURE
3.6.1.6 Lighting instructions
• Gas supply pressure
Set gas supply regulators to the following pressures:
Table 3.1: AAS Gas supply pressure ranges
Recommended Permissible range
kPa kPa
Acetylene 63 49- 105
Air 350 245-455
Nitrous oxide 350 245-455
Once the flame is on, the regulator setting should be checked and re-adjusted if
necessary.
3.6.2 Operation procedure for DR 2000 spectrometer
3.6.2.1 Platinum-Cobalt standard Method 8025 - Colour detection
Colour may be expressed as "apparent" or "true" colour. The apparent colour includes that
from dissolved materials plus that from suspended matter. By filtering or centrifuging out
suspended materials, true colour can be determined. The procedure describes true colour
analysis. If apparent colour is desired, it can be determined by measuring the unfiltered
water sample. The stored program is used for both forms of colour. The stored program is
calibrated in colour units based on the APHA - recommended standard of 1 colour unit
being equal to 1 mg/L platinum as chloroplatinate ion.
Collect samples in clean plastic or glass bottles. Most reliable results are obtained when
samples are analysed as soon as possible after collection. If prompt analysis is impossible,
fill bottles completely and cap tightly. A void excessive agitation or prolonged contact with
air. Samples can be stored for 24 hours by cooling to 4 °C. Warm to room temperature
before running the test.
Et.ECTROFI.OCUI..\TION or· Rt\ ER w HER Page 71

Cll \PTER 3: EXPEIHI\IENTAI. PROCEDURE
Step by step procedure
• Assemble the filtering apparatus (filter, filter holder, filter flask and aspirator)
• Rinse the filter with 50 mL of demineralised water and discard the rinse water
• Pour another 50 mL demineralised water through the filter
• Fill a sample cell (the blank) with 25 mL of filtered demineralised water and discard
excess
• Enter the stored program number for true colour. Press: 120 READ/ENTER. The
display will show DIAL nm TO 455
• Rotate the wavelength dial until the small display shows 455 nm
• Press: READ/ENTER. The display will show UNIT PtCo COLOUR
• Pour 50 mL of sample through the filter
• Fill a second sample cell (the prepared sample) with 25 mL of filtered sample
• Place the blank into the cell holder and close the light shield
• Press: ZERO. The display will show: WAIT then 0. UNIT PtCo COLOUR
• Place the prepared sample into a cell holder. Close the light shield and press:
READ/ENTER. The display will show WAIT and then the results in platinum
cobalt units will be displayed
EU.CTROFLO('C"UL.\TIO'II OF RI\.ER W TER Paf!e 72

CIIAPTEK 3: EXPE:RIME 'TAl PROCEDURE
3.6.2.2 Acid Persulfate Digestion Method 8190 - Phosphate detection
Phosphates present in organic and condensed inorganic form (meta-, pyro- or other
polyphosphates) must be converted to reactive orthophosphate before analysis. Pre-treatment
of samples with acid and heat provides the conditions for hydrolysis of the condensed
inorganic forms. Organic phosphates are converted to orthophosphate by heating with acid
and persulphate. Organically bound phosphates are thus determined indirectly by subtracting
the results of an acid hydrolysable phosphorus test from the total phosphorus results.
This procedure must be followed by one of the reactive phosphorus (orthophosphate)
analyses for the determination of phosphorus content of the sample. If the ascorbic acid
(PhosVer 3) method is used to measure the reactive phosphorus, this method is USEPA
approved for NPDES reporting.
Most reliable results are obtained when samples are analysed immediately. If prompt
analysis is not possible, samples may be preserved for up to 24 hours by cooling to 4 °C.
Warm to room temperature before testing.
Step by step procedure
• Enter the stored program number for reactive phosphorus-vial. Press: 535
READ/ENTER for mg/L PO/. The display will show DIAL nm TO 890
• Rotate the wavelength dial until the small display shows 890 nm
• Press: READ/ENTER. The display will show mg!L PO/- Vial
• Fill a Test 'N Tube Cuvette Vial with 5 mL of sample (run a reagent blank for this
test. Use demineralised water in place of the sample; subtract this result from all the
test results run with this batch of Phos V er.)
• Add 2 mL of 1.00 N sulphuric acid to the sample vial
• Using a funnel, add the contents of one Potassium Persulfate powder pillow for
phosphonate to the vial
• Cap tightly and shake to mix
• Heat the sample vials for 30 minutes
li:LECTROFI.OCCI"I .ATION OF RIVER WATER Page 73

CIIAPTER 3: EXPERIMENTAL PROCEDURE
• Remove vials and place in test tube rack and allow to cool to room temperature
• Remove caps from vials
• Add 2 mL of 1.00 N sodium hydroxide to each of the vials and wipe off any sodium
hydroxide on the cap or threads
• Cap tightly and shake to mix
• Place the COD vial adapter into the cell holder with the marker to the right
• Clean the outside of the vial with the towel. (Wiping with a damp towel, followed by
a dry one, will remove fingerprints or other marks.)
• Place a sample in the adapter with the Hach logo facing the front of the instrument.
Place the cover on the adapter.
• Press: ZERO. The display will show 0.00 mg!L PO/- Vial (for multiple samples,
zero on the first sample and record the blank value. Subtract the blank value from
reach sample value.)
• Remove the cap and using a funnel add the contents of one PhosVer 3 Phosphate
reagent powder pillow for 10 mL samples powder pillow to the vial
• Cap tightly and shake to mix
• Press: SHIFT TIMER. A 10 minutes waiting period will begin
• After the timer beeps, clean the outside of the sample vial with a towel
• Place the prepared sample vial into the adapter with the Hach logo facing the front of
the instrument. Place the cover on the adapter
• Press: READ/ENTER. The display will show WAIT and then the results in mg/L
PO/ will be displayed
ELECTROFLO<TILATION OF RI\'F.R W \TER Page 74

( HAPTER 4: RESULTS A\D DISCUSSION.
Chapter 4: Results and Discussions
4.1 Introduction
The results for the investigation of electroflocculation of river water are presented in this
chapter. Iron and aluminium electrodes were ionised and dissolved into Vaal River water in
an electric circuit for this investigational work (see Chapter 3). A number of laboratory
experiments were carried out to determine the effect of the different parameters on
electrochemical mechanism and to test whether the research - electroflocculation of river
water could be a competitive method for river water treatment. The following will be
reported on: The effect of continuous agitation as well as the effect of energy charged on the
parameters (iron, aluminium, pH, colour, conductivity, turbidity, solids, and phosphates) in
the river water. The efficiency of the electroflocculation treatment could therefore be
calculated by comparing the theoretical amount of metal dissolved in water with the actual
amount or concentration in treated water.
4.2 Effect of Continuous Agitation on River Water Treatment
Mixing is an important operation in any water purification process. It facilitates dispersion
and homogenisation of added reagents with water and contacts between the particles leading
to their combining into readily separable floes. The efficiency of the water purification
process is, therefore, dependent on the mixing conditions under which the formation of
flocculent suspension takes place. The reasons are that the importance of the mixing
intensity, its duration and flow characteristics on the properties of formed floes such as their
shape, size and compactness (density), are not yet fully appreciated and/or understood in
engineering practice (Polasek, 2007).
According to Polasek (2007), the term mixing is confusing because it is used to describe
transport mechanisms for both flash mixing (reagent dispersion and homogenisation with
water mixing) and agitation (flocculation mixing) because each of these mechanisms
requires different flow characteristics in order to take place with maximum efficiency.
Whereas flash mixing should take place under conditions of mixing on macro-scale with
ELECTROFLOC('l L.\IION OF Rl\ ER W-\TER Page 75

CIIAPTER 4: RESl' L l"\ A . 0 01 'CUSSIONS
macro-turbulent eddies being formed, agitation should take place under conditions of mixing
under micro-scale with micro-turbulent eddies being formed, resulting partial volumes of
water being transferred over short a distance. Agitation takes place under high- or low
intensity agitation. Only the conditions of agitation can be characterised by velocity gradient,
and uniform distribution of a velocity field throughout the volume of agitated water is
produced.
8.20 -
J 8.00
/~------- '·
7.80 .. . ,..-
7.60 I
~ 7.40 /
I ~ 7.20 I
/ I --pH reading with agitation employed ..._. pH without agitation
7.00 I
I // 6.80
1,/ 6.60
t/ 0 200 400 600 800 1000 1200
Charge (coulomb/s per litre)
Figure 4.1: Effect of agitation on pH during electroflocculation of iron electrode
Results show a smooth exponential inclination of pH when agitation is employed during
electroflocculation of river water whereas pH fluctuation was encountered when the water
treatment is performed without agitation (Figure 4.1 ). Maximum removal of phosphate was
also achieved when agitation is employed (Figure 4.2 overleaf). There were no significance
changes or comparability in colour and turbidity results. Observations indicate that floc
growth can be hastened by agitation.
li:L.ECTROFLOCCl l..\TION OF RJ\'ER \VATER Page 76

C'HAPTER 4 : RESULT!-. A"'D DISCl' SS IO:'<IS
040
0.35 \ ----\\
--.. E a. a. ........ -; 0.30
\ \ ~. 0 . ., "' ~ '\ g 0 25 0
""' --0
"' 10 '" -a 0.20 "'
~ 0 J::
- Agitation employed -+-Without agitation Q.
0.15 ------- ... 0.10
0 200 400 600 800 1000 1200
Charge (coulombls per litre)
Figure 4.2: Effect of agitation on phosphate removal during electroflocculation of iron
electrode
4.3 The Electrochemical Treatment of River Water using Iron Electrodes
During experimentation it was not clear as to which form iron will oxidised and hence after
the data analysis it was indicated throughout the entire investigations that pH was always
above pH6. Iron oxidation (see 2.9.2.2 Iron Oxidation on page 40 in Literature survey)
explains the non-existence of iron (III) species formation under such conditions. It also
indicates the predominant area for iron (II) species as it narrows with an increasing pH as
illustrated in Figure 2.6 to Figure 2.8.
The river water treatment by electrochemistry is highly reliant on the pH of the solution
which affects the surface charge of the electrodes, the degree of ionisation, current transfer
and the speciation of the electrode species. The electrochemical behaviour of the iron ion
was studied in aqueous solutions of different pH values using different dosing rates of ions
and a fixed/constant amount of phosphate concentration in the solution. The results obtained
are presented in Figures 4.3 to 4.9. It was observed that the maximum removal of
phosphates was achieved at pH levels between 6.5 and 7.0, whilst less phosphate was
removed with further increase in pH.
ELECTROFLO '(I L\TION OF RIYER W •\TER Page 77

CHAPH_R 4: RESULTS AND DIH' lJSS I ON~
4.3.1 The effect of energy charged on iron dissolution
The theoretical amount of iron utilised is directly proportional to the amount of energy
(expressed as charge). Trial experimentations have been conducted and charges exceeding
100 Coulombs per litre have been utilised. The initial optimisation was aimed to reduce
power consumption to below 20 Coulombs charge per litre which was calculated
theoretically (this is equivalent to 10 mg/L stoichiometric calculation of ferric chloride
dosage in chemical treatment). In terms of mass representation the consumption of iron
metal was projected theoretically to 3.443 mg per litre of water to be treated and 4.245 mg
was achieved.
7 50 700.0
7.40 600.0
7.30
500.0 7.20 c;
.s 7.1 0 400.0 "C .,
:I: c.
> 0 Ill
7.00 Ill 300.0 :c
c:
6 90 _g
200.0
6.80
--. pH Theoretical mass _,._ Actual mass 100.0
6.70
6.60 0.0
0 1200 1440 1560 1680 1800 1920
Charge (coulomb/s per litre)
Figure 4.3: The effect of energy charged on the dissolution of iron (theoretical and practical)
and the pH of the solution
The result above indicates near pH equilibrium at pH 7.4 where an energy consumption
reached about 1680 Coulombs per litre. The comparison between the theoretical and
measured iron dissolved shows huge distinction during the run but an overall error of about
3% was recorded at the end of the experimentation. The theoretical iron dissolution is
represented by a linear expression (between 1200 to 1920 coulombs per litre) whereas the
practical or actual measurement is not clearly defined.
ELECTROI'LOCCLILATIO 01· RIVER WATER Page 78

CII .\PTER 4 : RESLL n. A D OI~CLJSS J O N
4.3.2 The effect of energy charged on the water colour dissolution
Using an iron electrode as coagulant in water treatment resulted in a slight residual colour in
treated river water, this was also observed in case of ferric chemical treatment (i.e. ferric
chloride, ferric sulphate monohydrate). Figure 4.4 also indicates that as iron concentration in
the water increased to an equivalent energy charge of 1440 Coulombs per litre, the colour
improves and further increases in iron dosing then impact the colour negatively. This
marginal change indicates the extent to which further experimentation for optimisation
purposes could be employed.
100 -- -
90 ' I 80
/ 70
0 60 I (j I ~ 50 :; I 0
8 40
/ .
• 30
""',, I
20 ,/ ,_ ____.-/'
10 . ...--
..... ----- I --0 0 1200 1440 1560 1680 1800 1920
Charge (coulomb/s per litre)
Figure 4.4: The effect of energy charged on the colour of the solution using iron electrodes
4.3.3 The effect of energy charged on conductivity
Electrical conductivity is measured in microSiemens/centimetre (!J.Sicm). A microSiemen is
the same as a microhm. Conductivity of a water sample is a measure of its ability to carry an
electric current. The more impurities (total dissolved solids) in water, particularly salts, the
greater its electrical conductivity. By measuring the conductivity of a water sample, the
amount of total dissolved solids in the sample can be determined. To convert the electrical
conductivity (!J.S /em) of a water sample to the concentration of total dissolved solids (ppm)
in the sample, the conductivity must be multiplied by a factor of between 0.54 and 0.96 for
EL ECTROFl.OCCI 'L\TIOi\ OF RIVER \VATER Page 79

CHAPTER 4 : RF.Sl ' LTS A ' D DIS lJ ' SIONS
natural waters. The value of this factor depends upon the type of dissolved solids. A widely
accepted value to use when determining this type of dissolved solids is 0.67.
TDS (ppm)= Conductivity (~S /em) x 0.67
An increased dosing of iron in river water seems to be constantly improving the electric
conductance of water. Figure 4.5 illustrates the coordination of this effect, whereby six sets
of the test were performed at different charging rates, as a result of which it has been
observed that the higher the charge, the lower the conductance will be.
210 - - -- - -
190 " \ 170
\ E ~ 150
~ 2.
·f 130 f3 ' ::l
'2 11 0 8 ~ 90 ------70
50
0 1200 1440 1560 1680 1800 1920
Charge (coulomb/s per liter)
Figure 4.5 : The effect of energy charged on the solution conductivity using iron electrodes
4.3.4 The effect of energy charged on turbidity
A successful application of iron (ferric ion) in water treatment was also indicated in Figure
4.6 by reducing the turbidity of river water to an average of 0.44 NTU. During this period in
question the raw water turbidity varied from 60 to 40 NTU. This variation is indicated with
different dosage rates of ferrous ion in river water. The results are presented in terms of
dosage rate in milligram per litre and not as charge as in the previous result.
[LECTROFLOCCl LATIO"' OF RIVFR \\ \TER Page 80

CHAPTER 4: RES ' LfS AND DIS SSIONS
0.5
048
/\\ / 046
5' ~/ \ I >--~
-~ 044 "0
\ I :e :::>
>--
042
\ ~__--1 / 04
\ / 0.38
0.59 072 0.76 0.85 0.93 0.95 145 1.55 1.62 1.89 2.24 2.48
Fe Dosage (gil)
Figure 4.6: The effect of energy charged (represented by dosing rate) on the solution
turbidity using iron electrodes
4.3.5 The effect of energy charged on total dissolved solids
Similarly to the conductivity as indicated in sub section 4.3.3, an increased dosing of iron in
river water seems to be constantly decreasing the amount of dissolved solids in water. Figure
4. 7 overleaf illustrates the coordination of this effect, whereby six sets of tests were
performed at different charging rates and it has been observed that the higher the charge, the
lower the amount of solids left in the water.
ELE<TROFLOCTl ' I.ATION OF RIVFR WATER Page 81

CH .\PTER 4: R Sl I.TS :\ D DISCLISSION .
130
120 \ ~ \ ~ 110
\ ~ E 100
\ ~ g 90 -:§_
\~ "' 80 :2 ~ "0 70 ' "'
"'""' >
~ 60 i5 ~ ]j 50 0 I-
40
30
0 1200 1440 1560 1680 1800 1920
Charge (coulomb/s per litre)
Figure 4.7: The effect of energy charged on the solution total dissolved solids using iron
electrodes
4.3.6 The effect of energy charged on phosphate concentration
The iron treatment process reduced the phosphates concentration by up to 75% of the initial
concentration. This is illustrated in Figure 4.8 overleaf where 0.36 ppm was lowered to 0.09
ppm with the total energy consumption of about 18720 Coulomb used for every one litre of
the water treated.
ELFCTROFLoccuuTJON o · Rl\ ER WA rER Page 82

11 .\I'TER 4 : RESI . LTS AI\D DISCliSSION!ol
.------------------------------------------------------------------------,
0.40
0. 35
~ 0.30
c, E 0.25
"' o; > ~
0.20 Ill
"' c;; J: c. Ill 0.15 0
..c: 0..
- \ ~ ~ ~
-----------0.10
0.05 0 2070 4320 7020 9720 10800 12960 16380
Charge (Coulombls per liter)
Figure 4.8: The effect of energy charged on the phosphate concentration using iron
electrodes
-18720
4.4 The Electrochemical Treatment of River Water using Aluminium Electrodes
This method of treatment leaves no residual colour on treated river water. The drawback is
the fact that it requires more energy as compared to the iron dosing method. The tabulated
results in Appendix A reflect the energy consumption of this process. Aluminium electrode
dosing on water indicated an insignificant effect on the change of colour after treatment, thus
the colour variation is not indicated in these results.
4.4.1 The effect of energy charged on aluminium dissolution
Similar comparison of pH changes as in iron dissolution was achieved through aluminium
dosing to river water. The neutralisation was achieved and the pH reached equilibrium at pH
7.4. Unlike iron dissolution, the measured amount of aluminium dissolved in river water was
identified to be less compared to the theoretical values. Figure 4.9 overleaf indicates the
variation where an overall error of 5.43% relative to the theoretical values was achieved. The
speciation of this behaviour was not determined and no further explanation could be
identified.
l<: u :CTROFLOCC Li\ liON OF RI\'ER WATER Page 83

CHAPTER 4: RESULT. AND DISCUSSIONS
A dosage of about 700 Coulombs per litre achieved an acceptable pH range which has
increased from 6.6 to 7.4 displayed in Figure 4.9. At the start of the treatment, the pH of the
water rapidly increased where after the pH gradient decreased. In the last quarter of
treatment, there was no significant pH variation (pH was 7.4). Results shown are m
accordance with findings from previous studies of MAIC treatments whereafter a particular
period of time, the pH of the solution became stable. After neutralisation, Al(III) and OH
ions appeared in almost stoichiometrical amounts, because of continual formation of
insoluble Al(OH)3 and pH became constant.
7.4 0 .20
7.3 r-------------------------------------~--------------
7.2
7.1
:I: 7 a.
6.9
6.8 -------:!. 0 .05
--- pH Theoretical mass -.- Measured mass
6 .7
6 .6 +-----11"'--~------~------r-------------~--------.--------,------~-------+ 0 .00 0.0 144.0 234 .0 364.5 432 .0 540.0 702.0 850.5 1087.5
Charge (coulomb/s per litre)
Figure 4.9: The effect of energy charged on the dissolution of aluminium (theoretical and
practical) and the pH of the solution
4.4.2 The effect of energy charged on the water colour dissolution
The colour of water is improving as the energy increases; unlike in iron dissolution where
there is an increase in colour residuals with an increase in dosing. Aluminium dosing to river
water is seen as a remedial solution as compared to the pigmentation caused by iron
dissolution.
ELECTROFLOCCIJI..\TION OF Rl\ ER WHEI~ Page 84

CIIAPTER 4 : RESll. rs A 0 Dl 'C SSIO S
35 -- --
30 \ \ 25
\ ~ 20
\ ~ 0
15 8 ~ 10
~ 5 -------0 0.0 144.0 234.0 364.5 432.0 540 .0 702 0 850.5 1087.5
Charge (coulomb/s per litre)
Figure 4.10: The effect of energy charged on the colour of the solution using aluminium
electrodes
4.4.3 The effect of energy charged on conductivity
An increased dosing of iron in river water seems to be constantly improving the electric
conductance of water. Figure 4.11 illustrates the coordination of this effect, whereby six sets
of tests were performed at different charging rates and it has been observed that the higher
the charge, the lower the conductance will be.
-
" 190.0
~ 170.0
~ e <7i 150.0
~ 2. .i!:' ·;;
~ 130.0 . 1-"0 ~ c 8
110.0 --------90.0 ---. 70.0
0 .0 144.0 234.0 364.5 432.0 540 .0 702.0 850 .5 1087.5
Charge (coulomb/s per litre)
Figure 4.11: The effect of energy charged on the solution conductivity using aluminium
electrodes
EU:LI ROFLOCCUL.\ liO~ Of- Rl\ i::R WA r£R Page 85

CIIAP'I ER 4 : RE~lJ LTS AND DISC ·:10 . .._
4.4.4 The effect of energy charged on turbidity
A successful reduction of turbidity was also achieved using aluminium electrodes (below 1
NTU). Eight experiments were run whereby different dosing rates were applied and
correlation observed indicates proportionality in terms of the amount of energy used to the
amount of turbid materials removed from water. Figure 4.12 displays the results.
1
0.9 ....__
~ 0 .8
~ ~ 0.7
~ z. '0 :l5 ... 0.6
~ :l f-
0.5
~ 0.4
~ 0.3
144.0 234.0 364.5 432.0 540.0 702.0 850.5
Charge (coulomb/s per litre)
--Figure 4.12: The effect of energy charged on the solution turbidity using aluminium
electrodes
ELE('TROFLO('CI IL.ATIOI'o OF RIVER \V-\TER
1087.5
Page 86

CH .\PTER 4: RE ' l LTS AND OJ 'ClJSS JONS
4.4.5 The effect of energy charged on total dissolved solids
140 - - - -
130 --'i' .. ", ~ 120 ~
.,, E 110 111 r: -, .!2'
:§. 100 ' ~ ." ~ 90
al .""->
~ 80
·~ 15
~ 70 ------._ 1-
60 -- ---....
50
0.0 144.0 234.0 364.5 432.0 540.0 702.0 850.5 1087.5
Charge (coulomb/s per litre)
Figure 4.13: The effect of energy charged on the solution total dissolved solids usmg
aluminium electrodes
A successful reduction of dissolved solids was achieved using aluminium electrodes. It is
indicated that dissolved solids below 450 mg/L have no negative effect on human
consumption. The results on Figure 4.13 indicated correlation observed when varying energy
doses of aluminium in water has reduced the amount of solids in river water.
4.4.6 The effect of energy charged on phosphate concentration
The aluminium ion method of treatment achieved at least 50 percent reduction of
phosphates. Figure 4.14 illustrates the reduction of phosphates from as high as 0.36 ppm to
as low as 0.18 ppm. Figure 4.14 indicates the mole ratio of aluminium consumed compared
to the removal of phosphate concentration expressed in percentage.
ELECTROFLOC IlL\ flO!'. OF RI\'FR W \T R Pag~ 87

Cll \PTER 4: RE.!-.t:L TS AND DI~Cti :S IO S
0.38
0.36
\ , 0.34
\\ 0.32
"' \ .s \
0.3 ~ ~ "' .!:
1t 0.28
----------0 .!: [l_
0.26
~ 0.24
~ 0.22
~ 0.2
0.0 1440 234.0 364 .5 432.0 540.0 702.0 850.5 1087.5
Charge (coulomb/s per litre)
Figure 4.14: The effect of energy charged on the phosphate concentration using aluminium
electrodes
ELECTROFLOC( lll \TIO OF Rl\ El~ \\1,\Ttm Page 88
I
I
I I ' I

CIIAPTER 4: R SllLTS AND DISC SSJON!'>
4.5 Optimisation
This stage of investigations was aimed to reduce the cost implication of this process, to find
the optimal operational conditions, and to achieve best water quality results; in other words
at what operating variables will the process yield the optimum results. Although the
economical figures do not form part of this report, cost rating was performed mainly
focusing on the power consumption. Reduction in energy consumptions was the main
objective; achieving best results by reducing the cost of energy employed for this process.
During this stage, more operating variables involved in the investigations were studied
further. These variables included:
• Alkalinity of raw water,
• Turbidity of raw water,
• Mixing or agitation conditions,
• Levels or concentration of dosing metals (iron and aluminium) in final or treated
water, and
• Reduction of energy consumption.
4.5.1 The effect on the colour of treated water using iron electrodes
Agitation or mixing achieved in the form of stirring during experimentation indicated a
positive influence in the electroflocculation of river water. The following result was
achieved where agitation or stirring was employed. For assisting the alternating current
which makes 'self cleansing' of electrodes possible, agitation was employed to improve
energy consumption during the electrolysis. Stirring reduces the resistance that is formed as
a result of film formation on the water-electrode interface. The thicker the film at a point of
interface requires more energy. Figure 4.15 indicates the effect of agitation on colour.
ELE THOFLOCCI I L..\TIO~ OF RI\'F:R WATER Page 89
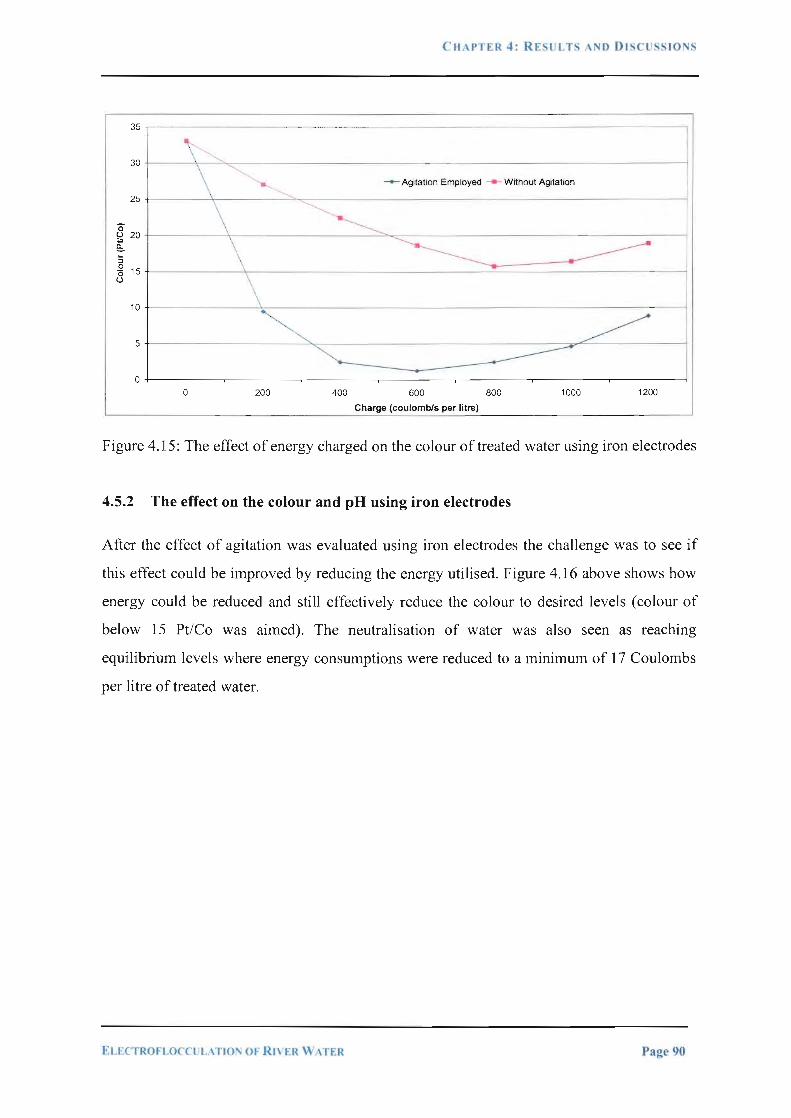
CtL\Pl'ER 4 : RESL TS NO Dt'iCUSS IO"''.'
35,--- - - ·-· ··----·-----'\
30 \ _......_
\ .......
--+- Agitation Employed Without Agitation
25 ,_
0 \ ~------g 20
\\ -----------!!:.. .. --:l
-§ 15 ~
(.) \ 10
5 ~----- ~ ~
0 0 200 400 600 800 1000 1200
Charge (coulombls per litre)
Figure 4.15: The effect of energy charged on the colour of treated water using iron electrodes
4.5.2 The effect on the colour and pH using iron electrodes
After the effect of agitation was evaluated using iron electrodes the challenge was to see if
this effect could be improved by reducing the energy utilised. Figure 4.16 above shows how
energy could be reduced and still effectively reduce the colour to desired levels (colour of
below 15 Pt/Co was aimed). The neutralisation of water was also seen as reaching
equilibrium levels where energy consumptions were reduced to a minimum of 17 Coulombs
per litre of treated water.
I~LFCTROFI.O( Cl L.,\TION OF Rl\ R W \TER Page 90

II \PTER 4 : RESl.L rs NO DISCUSSIONS
35 6.90
33
31
29
~ 27
25 ~ 8 23
21
19
17
15
& -- . ~
----------.... .
~' ~
/. \ \ Colour - pH \ .
\ . \ -
., . ~
........_"' ~
6.85
6 .80
6.75 ~
6 .70
6 .65
6.60 0 360 540 720 900 1260 1470 1680 1890 2100 3240
Charge (coulomb/s per litre)
Figure 4.16: The effect of reduced energy charged on the colour of treated water using iron
electrodes
4.5.3 The effect on increased iron concentration in water
It was also noted that as the treatment proceeds the level of iron concentration m water
increases with an increase in charge. This variation is indicated below (Figure 4.17) with
reduced energy levels. The initial variation can be observed in Appendix A where energy
optimisations were not considered.
ELECTRO FL.()( CliLATIO'\ OF' Rl\ ER W \TEl~ Page 91

CUAPTER 4: RESll T~ AI'IID Dl. C . SJ O S
80
70
60
'§, .s 50 c ~ ~ ;: 40 ., u c 0
~ 30 _g
20
10
0
// /
I /
.i
0 360 540 720
6.90
/·~ -.a .....-. /
~ , 6.85
I
~ I 6.80
/ 6.75 ~
-+- Iron Concentration ·pH
6.70
6.65
6.60
900 1260 1470 1680 1890 2100 3240 Charge (coulomb/s per litre)
Figure 4.17: The effect of reduced energy charged on increased iron concentration in water
4.5.3 The effect in reduction of phosphates using iron electrodes
Although results overleaf do not indicate maximum removal of phosphates as compared to
high energy utilisation, about 40% phosphate removal was achieved and within the required
water quality specifications. Figure 4.18 overleaf shows the reduction of phosphate
concentrations from 0.36 mg/L to 0.22 mg/L.
EU:CTROFLOCCti L.\TION Of RJ\ 'FR W .\T R Page 92

Cll P ER 4: RE!o.UL TS AND Dt~C SSIOi'\!o.
8000 0.380
70 .00 0.360
60 .00 0.340 ~
~ r r 50.00 0.320 1: 0
"" 1: g 0
"" 1: g ., 40 .00 0 300 " 1: 1: ., 0
" u 1: -+- Iron Concentration Phosphates 0 ,; u 1: 3000 .. 0.280 -a
_g "' 0 / .c.
c.. 20.00 0.260
I -1000 I
0.240
0.00 0.220
0 360 540 720 900 1260 1470 1680 1890 2100 3240
Charge (coulomb/s per litre)
Figure 4.18: The effect of reduced energy charged in reduction of phosphates from water
using iron electrodes
ELECTROFLOC< l ·LATION OF Rl\ ER \\' \TER Page 93

CHAPTER .t : RESULTS A:-10 D tsCU 'SIO S
4.6 Comparison between Aluminium and Iron Electrodes
The comparison of the performance between iron and aluminium electrodes was based on
the stoichiometric calculation of the required mass concentration that should be dosed into
river water to achieve optimal results. For both electrodes an equal amount of dosage was
projected to be 10 mg/L. This is shown in the comparison Table 4.1 where all characteristics
were based on the basis of 10 mg amount of electrode being dosed into one litre of river
water. The results achieved were also compared with the water quality limit set by SANS.
Table 4.1: Comparison between aluminium and iron electrodes
Characteristic Iron Electrode Aluminium Electrode Legal limits
(SANS 241)
Reaction rate Faster Slow
Low (34 Coulombs per High ( 1 07 Coulombs per Energy consumption
litre) litre)
Iron 0,09 mg/L - 0 - 0,1 mg/L
Aluminium - 0,256 mg/L 0 - 0,15 mg/L
Effect on pH 7.26 6.72 6-9
Effect on conductivity 94 11S/cm achieved 172 11S/cm achieved 0 - 700 11S/cm
Effect on colour Leaves residual colour No residual colour present 0 - 15 Pt-Co
Effect on turbidity 0,39 NTU achieved 0,92 NTU achieved 0-1 NTU
Effect on TDS 53 mg/L achieved 111 mg/L achieved 0-450 mg/L
Effect on phosphates 0,24 mg/L achieved 0,29 mg/L achieved
EI.ECTROFLOCCI L,\ liON OF Rl\ ER \\- \TER Page 94

CIIAP fER 4: RE~liL TS Al'ID DIS USSIONS
4.7 Discussion
Apparent current efficiencies for Al and Fe dissolution as aqueous AI(III) and Fe(II) species
at pH 6.5 and 7.8 were greater than unity. This was due to additional reactions occurring
parallel withAl and Fe dissolution: oxygen reduction at anodes and cathodes, and hydrogen
evolution at cathodes, resulting in net (i.e. oxidation plus reduction) currents at both anodes
and cathodes. During the investigations, results show that ferric and aluminium ion
treatment would be a successful water treatment technique.
The Electrocoagulation process was found to be superior to that of conventional coagulation
with aluminium sulphate and iron chloride for treating river water, with 30% more
phosphates being removed for the same dose.
i<:LECTROFLO("( UL\TIO OF Rl\ ER WATER Page 95
CHAPTF.R 5: COST IMPLI .\TIO
Chapter 5: Cost Implications
Besides improving the water quality treatment results, this research also aimed to reduce the
cost implications of water treatment process. Before a treatment company can consider
changing a treatment technology, cost-saving has to be taken into consideration. Although
the economic figures do not form part of this report, cost-rating was performed mainly
focusing on the power consumption. Reduction in energy consumption was the main
objective; other cost-related issues includes the following:
• Cost of raw materials
Electrodes - cost, performance and lifespan are dependent on current density and
electricity consumption when in use
• Electricity cost
This is the cost projected in terms of how much energy will be employed for the
treatment- power consumption.
• Maintenance and replacement of materials
During electrolysis, electrodes are ionised because of electrochemical reaction and as a
result they need to be replaced on a regular basis; this is the reason why the lifespan of
the electrode has to be taken into consideration when making a choice. Metal ion can
also be recovered from the sludge after treatment and maintenance costs are minimal due
to fewer amounts of raw materials used.
EU;CJ ROFI.OCCliLATIO"' 01 Rl\ FR \\"A TER Page 96

' HAPTER "i: CO C'Ll>StON A D RE OMJ\IE'IDATIO S
Chapter 6: Conclusion and Recommendations
Electrocoagulation has successfully treated a wide range of waste streams. Previous research
has focused on the application of electrocoagulation to a particular situation (plant and waste
stream). On-site optimisation and process 'tuning' had limited success. Mechanisms are
expected to change through the process but the dominant mechanisms and their role are yet
to be identified.
The lack of a methodical approach on a mechanistic level is reflected by the lack of
similarities in treatment process design. A logical, systematic approach to a fundamental
understanding of electrocoagulation is clearly required. The design phase can then proceed
on solid scientific and engineering knowledge.
A large number of key mechanisms are dependent on a few operating parameters. Individual
'optimisations' exist such as that for pH and speciation of the coagulant ion (Fe3+ or Al3+) but
this often conflicts with other localised optimal conditions. The electroflotation mechanism,
passivation of the electrodes, and economic considerations all has their own operating pH. A
trade-off between the competing factors must be evaluated to provide a global optimum
operating condition.
Apparent current efficiencies for AI and Fe dissolution as aqueous Al(III) and Fe(III) species
at pH 6.5 and 7.8 were greater than unity. This was due to additional reactions occurring
parallel with AI and Fe dissolution: oxygen reduction at anodes and cathodes, and hydrogen
evolution at cathodes, resulting in net (i.e. oxidation plus reduction) currents at both anodes
and cathodes. During these investigations, results show that ferric and aluminium ion
treatment would be successful under the following conditions.
• Relatively high raw water alkalinity of greater than 80 mg/1 as CaC03
• Relatively low raw water turbidity of less than 60 NTU
Eu. rROI•LO( C "LA fiON OF Rl\ E.R '"·'fER Page 97

H,\PTFR 5 : COM LliSIO ' A 0 RECO I~IE . ' D TIO .
The electrocoagulation process was found to be superior to that of conventional chemical
coagulation with aluminium sulphate and iron chloride for treating river water, with
reference to 30% more phosphates removal with equivalent stoichiometrical dosage. Due to
high energy consumption which is in low supply in South Africa, the electroflocculation
process may be constrained as compared to the conventional chemical coagulation process.
ELEITROFLOC C I ll. \TIO\ OF R t\ ER WATER Page 98

REFERE CES
References
1. AKJT, JW., GREENWOOD, N.N., KHANDELWAL, B.L. & LESTER G.D. 1972. Chemical society. Dalton. p. 604-61 0
2. AMERICAN SOCIETY OF CIVIL ENGINEERS. 1990. Water treatment plant design, 2nd ed. New York: McGraw-Hill, p.l
3. AMOSOV, V.V., ZIL'BERMAN, A.G., KUCHERY A VYKH, E.I., SORKJN, E.I., TSARIK, L.Y., EPPEL, S.A., TIMOSHEK, V.E. & TITOV I.P. 1976. Chemistry and Technology of Fuels and Oils. Experience in local treatment of wastewaters from petrochemical production. New York: Springer
4. BARNES, D. & WILSON, F. 1983. Chemistry and unit operations in water treatment. London & New York: Applied Science Publishers.
5. BARROW, G.M. 1966. Physical Chemistry. McGraw-Hill, New. York, 2nd ed. p. 315
6. BARTRAM, J & BALLANCE, R. 1996. Water quality monitoring -A practical guide to the design and implementation of freshwater quality studies and monitoring programmes. Published on behalf of UNEP United Nations Environment Programme and the World Health Organization, [Online] Available at: http://www.who.int/entity/water_sanitation_health/resourcesquality/wqmchap2.pdf. Accessed: 0 I /04/2004.
7. BERTSCH, P.M., THOMAS, G.W. & BARNHISEL, R.L. 1986. Soil Science. America. Vol. 50. p. 825-830
8. BITTON, G. 1994. Wastewater microbiology. USA: John Wiley & sons, p. 63-65.
9. BOJIC, A.L.I., PURENOVIC, M. & BOJIC, D. 2004. Removal of chromium (VI) from water by micro-alloyed aluminium composite (MAlC) under flow conditions. Water SA Vol. 30, No.3. p. 353-359.
10. BONILLA, C. F. 1947. Possibilities of the electronic coagulator for water treatment. Water and Sewage, Vol. 85 No.1: p. 21,22,44,45, March.
11. BOTTERO, J.Y., TCHOUBAR, D., CASES, J.M., FRIPPIAT, J.J. & FIESSINGER, F. 1982. Physical Chemistry. 86: p. 3667-3673.
12. COLEMAN, W.F. 2003. Pourbaix diagrams and reactions in aqueous solution. [Online] Available at http://www. wellesley.edu/Chernistry/chem 120/pour.html. Accessed 16/03/2006.
13. COOPER, C.M. 1993. Biological effects of agricultural derived surface-water pollutants on aquatic systems- A review. Journal Environmental Quality Vol. 22, No. 1: p. 402-408.
14. DAVIES, C.W. 1967. Electrochemistry. London: George Newnwes.
EI.ECTROFLO<Tt iL\ 110'1 o~ Rn El~ w,, rER Page 99

REFERE • CES
15. DEAT. 1999. See Department of Environmental Affairs and Tourism.
16. DELPIERRE, G.R. & SEWELL, B.T. 2002. Electrolysis: GRD Training Corporation. [Online] Available at: http://www.physchem.co.zalelectrolysis.html. Accessed: 24/04/2004.
17. DEPARTMENT OF ENVIRONMENTAL AFFAIRS AND TOURISM. 1999. National State of the Environment Report - State offreshwater systems and resources: No 4. Pretoria. [Online] Available at: http: //www .environment.gov.za!EnviroInfo/sote/nsoer/issues/water/state4.htm. Accessed: 06/09/2008.
18. DEPARTMENT OF WATER AFFAIRS AND FORESTRY, 1996. Water quality guidelines for domestic use. Pretoria: Government Printers.
19. DEPARTMENT OF WATER AFFAIRS AND FORESTR. 1996. Water quality management in South Africa. [Online] Available at: http: //www.dwaf.gov.za!Dir_ WQM/wqmFrame.htm. Accessed: 06/09/2008.
20. DEPARTMENT OF WATER AFFAIRS AND FORESTRY, 1997. Vaal River system analysis update- Water Quality of the Komati and Usutu. Pretoria: Government Printers.
21. DEPARTMENT OF WATER AFFAIRS AND FORESTRY, 1998. Excerpts from the South African Water Act, Act 36 of 1998.
22. DERYAGIN, BY & LANDAU. 1941. Theory of the stability of strongly charged lyophobic sols and of the adhesion of strongly charged particles in solution of electrolytes. Acta Pysicochim. URSS Vol. 14: p. 733
23 . DNR (Department of Natural Resources), 2003. Health and water quality. Madison: Bureau of Water Supply. [Online]. Available on http://dnr.wi.gov/org/water/dwg/iron.htm. Accessed: 23/02/2006.
24. DO, J.S. & CHEN, M.L. 1994. Decolourisation of dye-containing solutions by electrocoagulation Journal of Applied Electrochemistry Vol. 24, No. 8. August, Netherlands: Springer.
25. DONINI, J.C, KAN, J. , SZYNKARCZUK, J. , HASSAN, T.A. & KAR, K.L. 1994. Operating cost of electrocoagulation. Canadian Journal of Chemical Engineering, Vol. 72 No.6: p. 1077-1012, December.
26. DWAF See Department of Water Affairs and Forestry.
27. FAUST, S.D. & ALY, O.M. 1981. Chemistry of water treatment. 2nd ed. Boca Taton: Lewis Publishers.
28. GENTHE, B. 2007. Focus on CSIR research in water resources: Water and human health research in CSIR. Stockholm water week 13-17 August 2007, p. 2.
29. GRAY, K.A. , YAO, C.H. & O'MELIA, C.R. 1995. Polymeric Metal Coagulants, Journal of American Water Works Association Vol. 87, No. 4: p. 136-146.
30. GREGORY, J. & DUAN, J. 2001. Hydrolyzing metal salts as coagulants. Pure Applied
El ECTROFLOCCl L \TION OF RI\'ER WATER Page 100

REFERENCES
Chemistry, Vol. 73, No. 12: p. 2017-26.
31. GREGORY, J. & ROSSI, L. 2001. Dynamic testing of water treatment coagulants, Journal of Water Science Technology: Water supply. Vol. 1 No.4: p. 65-72.
32. HAYDEN, PL. & RUBIN, AJ. 1974. Aqueous environmental chemistry of metals. MI: Ann Arbor Science.
33. HEK, H., STOL. & BRUYN, P.L. 1978. Colloid Interface Science. Vol. 64. p. 72-89.
34. HOLT, P., BARTON, G., & MITCHELL, C. 2006. Electrocoagulation as wastewater treatment. In the third annual Australian Environmental Engineering Research Event. 23-26 November, Castlemaine, Victoria, 1999. [Online]. Available at: http://www.isf.uts.edu.au/publications/EERE-Paper.pdf. Accessed: 01 /04/2006.
35. IBANEZ, J.G., 1994. Environmental Chemistry. Department of Chemistry and Chemical Engineering, Mexican Microscale Chemistry Center, lberoamericana University. [Online] Available at: http://electrochem.cwru.edu/ed/encycl.htm. Accessed: 01/04/2006.
36. ISRAELACHEVILI, J. 1992. Intermolecular and surface forces. 2"ct ed., London, Academic.
37. JONES, D.A. 1996. Pourbaix diagram for iron. [Online] Available at: http://www.cheml.com/acad/webtext/elchem/ec4.html. Accessed: 15/03/2006
38. LENNTECH. 2006. Iron and water: reaction mechanisms, environmental impact and health effects [Online]. Available at: http://www.lenntech.com/elements-andwater/iron-and-water.htm. Accessed: 13/03/2006.
39. LOWER, S. 2005. Nemst equation. [Online]. Available at: http://www.corrosiondoctors.org/References/N ernst.htm. Accessed 15/03/2006.
40. MAMERI, N., YEDDOU, A.R., LOUNICI, H., BELHOCINE, D., GRIB, H. & BARIOU B. 1998. Defluorination of septentrional SAHARA water of north Africa by electrocoagulation process using bipolar aluminium electrodes. Water Research Vol. 32,No. 5.p. 1604-1612
41. MARTIN, R.B. 1991. Journal oflnorganic Biochemistry. Vol. 44. p. 141-147
42. MATTESON, M.J., DOBSON R.L., GLENN, R.W., KUKUNOOR, N.S., WAITS W.H. & CLAYFIELD E.J. 1995. Georgia Institute of Technology School of Chemical Engineering Electrocoagulation and separation of aqueous suspensions of ultrafine particles, Colloids and Surfaces A: Physicochemical and Engineering Aspects , Vol. 104, No. 1, November, USA, Atlanta. p. 101-109.
43 . MEYBECK, M., CHAPMAN, D. & HELMER, R., 1989, Global freshwater quality: A first assessment. Oxford: Blackwell Reference.
44. MUSQUERE, P, ELLINGSEN, F. & VIK, E.A. 1983. Electrotechnics in drinking and wastewater. Water Supply, Vol. 8, Special Subject 2-3. p.1-25.
45. NAUMCZYK, J. SZPYRKOWICZ, L. & GRANDI, F.Z. 1996. Electrochemical
Page 101

REFEREN E~
treatment of textile wastewater. Water Science Technology, Vol. 33 No.7. p.17-24.
46. OSIPENKO, V.D. & POGOREL YI, P.I. , 1977. Electrocoagulation neutralization of chromium containing effluent. New York: Springe
47. PACKHAM, R.F. 1965. Coagulation of dispersed clays with hydrolyzing salts, Journal Colloid Interface Science. Vol. 20: p. 81-89.
48. PARREIRA, H.C. 1964. Chemistry A to Z, Grosset and Dunlap.
49. PAUNOVIC, M. & SCHLESINGER, M., 1998. Fundamentals of electrochemical deposition. New York: Wiley.
50. PLETCHER, D. 1982. Industrial electrochemistry. London: Chapman and Hall.
51. PONTIUS, F. W. 1990. Water quality and treatment, New York; McGraw-Hill.
52. POLASEK, P. 2007. Differentiation between different kinds of mixing in water purification. Water SA Vol. 33, No.2: p. 249-251.
53. PRETORIUS W.A., SCHUTTE C.F. & DE VILLERS G.H. 2001. Rand water treatment processes - Coagulation, flocculation and sedimentation, Vol. 3, No. 4, September.
54. REPUBLIC OF SOUTH AFRICA. Department of Water Affairs and Forestry. 1993. South African Water Quality Guidelines, Vol. 1. 1st ed. Pretoria: The Government Printer.
55. RICHENS, D.T. 1997. The chemistry of aqua ions, Chechester: Wiley.
56. RIEBER, S., KUKULL, W. & STANDISH-LEE, P. 1995. American Water Works Association. Vol. 87, No.5: p. 86-100.
57. ROBINSON, V., 1999, Electrojloculation in treatment of polluted water. Wadonga: Electropure Australia. p. 1-12
58. SIMONSSON, D. 1997. Electrochemistry for cleaner environment. Chemical Society Revision. Vol. 26, No.3: p. 181-190.
59. SMITH, R.W. 1971. Relations among equilibrium and non-equilibrium aqueous species of aluminium hydroxy complexes, ACS Adv. Chern., Ser. Vol. 106: p. 250
60. STUMM, W & O'MELIA, C.R. 1968. Stoichiometry of coagulation, Water Works Association. Vol. 60: p. 514-539.
61. STEYN D.J., TOERIEN D.F. & VISSER J.H. 1975. Eutrophication levels of some SA impoundments II Hartebeespoort Dam. Water SA Vol. 1, No.3: p. 93-101.
62. STUART, F.E. 1946. Electronic water purification: Progress report on the electronic coagulator - a new device which gives promise of unusually speedy and effective results. Water and Sewage, Vol. 84: p. 24-26, May
63. TANG, H.X. & LUAN, Z.K. 1996. The differences of behaviour and coagulating mechanism between inorganic polymer flocculants and traditional coagulants, Chemical
ELEC'TROFLOC' lJLATION OF Rl\ ER WATER Page 102

REFERE 'CES
Water and Wastewater Treatment IV. Berlin: Springer. p. 85-93.
64. VAN DUUREN F.A., 1997, Water Purification works design, TT92/97, South Afiica: Beria, p. 81 .
65. VANCE D.B. 2002. Groundwater and redox potential. [Online). Available at: http://2the4.net/redox.htm. Accessed: 14/03/2006.
66. Verwey, E.J.W. & Overbeek, J. 1948. Theory of the Stability of Lyophobic Colloids. Amsterdam: Elsevier.
67. VIK, E.A., CARLSON, D.A., EIKUN, A.S. & GJESSING, E.T., (1984), Electrocoagulation of potable water, Water Research Vol. 18. No. 11: p 1355-1360.
68. WATERWELL. 2005. Iron in your water supply: Type and treatment. [Online] Available at: http://www.waterwell.cc/IRON.HTM. Accessed: 07/1 1/2005.
69. WATER QUALITY MANAGEMENT OF SOUTH AFRICA. 1996. See Department of water affairs and forestry. 1996
70. WAUCHOPE, R.D. 1978. The pesticide contents of surface water draining from agricultural fields- A review. Journal of Environmental Quality Vol. 7: p. 459-4 72
71. WENTZEL, M.C. 1990. Phosphorus removal from sewage in activated sludge systems. In: Procceedings of the Seminar of the Association of Water Treatment Personnel. Department of Civil Engineering, University of Cape Town. Vol. 2: p. 1-2.
72. WESOLOWSKI, D.J. & PALMER, D.A. 1994. Aluminium speciation and equilibria in aqueous solution, Geochimica et Cosmochimica Acta Vol. 58. p. 2947-2969
73. World Health Organisation. 1993. Guidelines for drinking-water quality. Geneva: World Health Organization. Vol. 1, No. 2.
74. WQM. 1996. See Water quality management of South Africa.
ELECTRO FLO( Cll L \riO' OF Rl\ El~ \\ ,\TER Page 103

APPE . 01\. A EXPERIMENTAL DATA
Appendix A
Experimental Data
EJ .ECTRO-·- · OCCl iL \flO!\ 0~ Rl\'lR W ,\TER A-1

APPE'IIDI'X A EX PERIM ENTAL D AT A
Experiment 1
Aim and objective:
To determine the feasibility of phosphate removal using iron electrode on electrochemical technique as a treatment media.
Quantity of river water treated= Two litres
Parameter Recording Table A 1:
Time Current Voltage Calculated Charge Iron Concentration Phosphate Colour pH (minutes) (Amp) (Volts) Mass (g) (C/L) Spec 100-2000 mg/1 (mg/1) (Pt/Co) 6.5- 8.5
0 1 50 0.0000 0 0.20 0.360 33 6.60
60 1.15 50 0.8027 2070 36.78 0.260 27 6.86
120 1.2 50 1.6753 4320 71.67 0.220 15 6.87
180 1.3 50 2.7223 7020 98.21 0.185 2 6.92
240 1.35 50 3.7694 9720 I 01.23 0.150 0 6.94
300 1.2 50 4.1882 10800 112.50 0.130 20 6.98
360 1.2 50 5.0259 12960 113.90 0.110 95 6.99
420 1.3 50 6.3521 16380 115.67 0.100 142 7.01
480 1.3 50 7.2596 18720 115.60 0.090 158 7.01
Discussion:
Taking of samples increases conductivity of the solution since the rate of dissolution remain constant throughout the experimentation. This is due to the reduced interface area that restricts the current flow (at constant voltage).
Observations
Solution turns brownish, then greenish Three suspended layers formed on top of the solution (top-brown, middle-greenish, bottomwhite)
ELECTRO-FL >CCULAfiO \ OF R IVER WATER A-2

PPE:>IDIX A E PERIMENTAL DATA
Experiment 2
Aim and objective:
To check the effect of neutralisation river water during electro-flocculation process and how it affects change in temperature.
Quantity of river water treated= 1.5 litres
Parameter Recording Table A2:
Time Current Voltage pH
Temperature Calculated Charge (minutes) (amps) (Volts) (Degree Celsius) Mass (g) (Coulomb per litre)
0 0.19 30 7.46 26 0.000 0 5 0.19 30 7.44 26 0.017 38 9 0.19 30 7.45 27 0.030 68.4 15 0.19 30 7.47 28 0.050 114 2 1 0.19 28.4 7.53 28 0.070 159.6 24 0.19 28.6 7.63 29 0.080 182.4 30 0.18 29.4 7.75 30 0.094 2 16 36 0.18 29.4 7.80 30 0.113 259.2 43 0.18 30.1 7.86 31 0.135 309.6 48 0.18 30.1 7.88 31 0.151 345.6 53 0.18 30.2 7.88 32 0.166 381.6 59 0.18 30.2 7.86 32 0.185 424.8
Observations:
Solution turns brownish green
ELE(TRC>-flOCCIJI.ATIO, OF Rl\ f.R \V.\"1 ER A-3

APPE'IOI\. A EXPERIME~TAL DATi\
Experiment 3
Aim and objective:
To test the variation in phosphate removal using different dosing rates of iron in river water
Quantity of river water treated = 1.6 litres
Parameter Recording Table A3:
Time Charge
Phosphate (Minutes)
Current Voltage (Coulomb pH Conductivity mg/1
per litre) 0 0.2 28.1 0 6.85 312 0.370 15 0.2 28.7 1125 7.66 325 0.340 30 0.2 30.0 2250 7.70 342 0.310 45 0.2 27.2 3375 8.01 346 0.270 60 0.2 29.1 4500 8.05 346 0.220 75 0.2 29.5 5625 8.63 345 0.198 90 0.2 31.0 6750 8.89 345 0.181 105 0.2 29.0 7875 6.99 346 0.165 120 0.2 28.2 9000 6.97 346 0.143
ELECJRQ-FLO . IJL\TION m Rl\ ER W \T R A-4

APPE'JOIX A EXPERIME T t\ L DATA
Experiment 4
Aim and objective:
To determine change in turbidity after treatment using different dosing rates of metal into water.
Parameter Recording Table A4:
Dosage rate Turbidity (g/L) (NTU)
Run I 0 .59 0.45 Run 2 0.72 0.4455 Run 3 0 .76 0.48 Run4 0.85 0.441 Run 5 0.93 0.434 Run 6 0.95 0.3905 Run 7 1.45 0.408 Run 8 !.55 0.405 Run 9 1.62 0.412
Run 10 1.89 0.465 Run II 2.24 0.48 Run 12 2.48 0.48
ELECTRo-FLOCCULATJOi\ OF Rl\ ER \\-ATER A-5

APPENDIX A EXPERIME1 TAL DATA
Experiment 5
Aim and objective:
To determine the feasibility of phosphate removal using aluminium electrode on electrochemical technique as a treatment media
Quantity of river water treated= Two litres
p arame er R d. T bl A5 ecor mg a e
time Current Voltage Phosphates Aluminium
Charge Mass
pH concentration dissolved (sec) (amps) (volts) (ppm)
(ppm) ( Coulom bs/L)
(grams) 0 1.15 50 0.36 6.60 0.200 0 0.0000
2340 1.2 50 0.29 6.72 0.540 1404 0.2631 3600 1.3 50 0.28 6.88 10.200 2340 0.4385 5400 1.35 50 0.28 6.94 26.121 3645 0.6830 7200 1.2 50 0.27 7.16 36 .544 4320 0.8094 9060 1.2 50 0.26 7.29 66 .145 5436 1.0186 10920 1.3 50 0.25 7.38 99.351 7098 1.3300 12540 1.35 50 0.22 7.39 168.440 8464.5 1.5860 14580 1.45 50 0.2 7.3 9 258 .641 10570.5 1.9806
Observation
A white wax-like layer is formed and suspended from the solution
ELECTRo-FLO ClLATIOl'l OF Rl\ £R WATER A-6

APPE~DI;\ A EXPERI\1 NTAL DATA
Experiment 6
Aim and objective:
To determine the feasibility of phosphate removal using aluminium electrode on electrochemical technique as a treatment media
Quantity of river water treated= 500 millilitres
Parameter Recording Table A6:
Time Voltage Currents Phosphates Mass
Charge pH Dissolved (minutes) (volts) (amps) (ppm)
(grams) (Coulomb/L)
0 50 1.20 6.60 0.36 0 0 10 50 1.15 6.68 0.29 0.064643 1380 20 50 1.20 6.74 0.27 0.134908 2880 30 50 1.20 6.77 0.24 0.202362 4320 40 50 1.20 6.81 0.23 0.269815 5760 50 49 1.20 6.85 0.22 0.337269 7200 60 49 1.20 6.88 0.21 0.404723 8640 70 49 1.30 6.91 0.20 0.511525 10920 80 48 1.20 6.93 0.19 0.539631 11520 90 48 1.20 6.94 0.18 0.607085 12960 100 47 1.20 6.94 0.18 0.674538 14400
Observations
A white wax-like layer is formed and suspended from the solution
ELECTRO..FLOC( l'LATI l'i Or Rl\ ER W\TER A-1

APP1!. 1 DJX A EXPERI !ENTAL DAT<\
Experiment 7
Aim and objective:
To determine concentrations of Turbidity, Phosphate and Colour of treated river water after electrochemical treatment using iron electrode on different electrical currents. The table also indicates percentages removal of Phosphate and Turbidity at varying electrical current supply after 60 minutes reaction time.
Parameter Recording Table A 7:
Time Current Phosphate Phosphate Turbidity Turbidity Colour Colour (min) (amps) (mg/L) removal(%) (NTU) removal(%) (Pt/Co) removal(%)
River 0 0.00 0.3600 0.00 42.32 0.00 33 .0 0.00
Water Run I 60 0.20 0.2509 30.30 0.48 98.87 27.0 18.18 Run2 60 0.40 0.1699 52.80 0.45 98.94 15.0 54.55 Run 3 60 0.60 0.1296 64.00 0.44 98.96 2.0 93.94 Run4 60 0.80 0.1058 70.60 0.39 99.08 1.0 96.97 Run 5 60 1.00 0.1040 71.10 0.32 99.24 20.0 39.39 Run 6 60 1.20 0.0983 72.70 0.29 99.31 95.0 -1 87.88 Run 7 60 1.40 0.0963 73.25 0.37 99.13 142.0 -330.30 Run 8 60 1.60 0.0900 75.00 0.42 99.01 158.0 -485. 19
Observations
At completion of run 6, 7 and 8, colour worsen- become brownish red (apparent colour) and after filtration (true colour) treated water still had colour residue
ELECTRO-FLO 'Cl'L.HIO OF 1~1\ ER WATER A-8
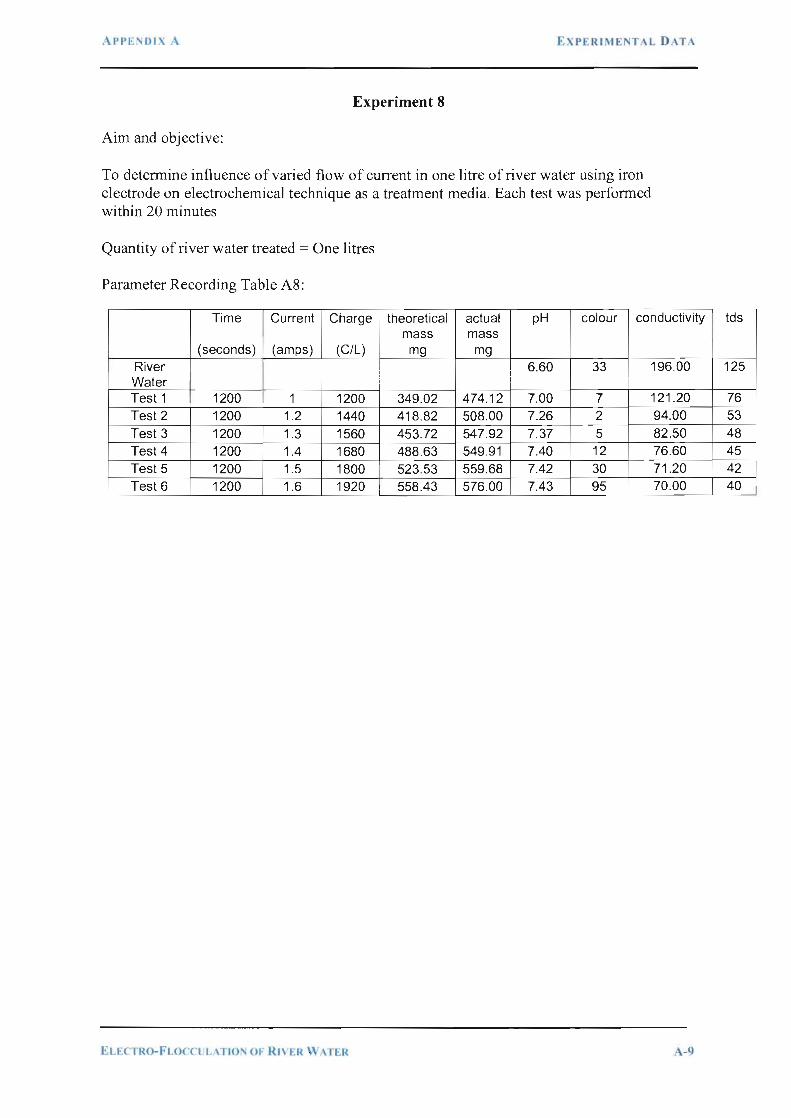
AJ>P£ L DIX A EXPERIMENTAL DATA
Experiment 8
Aim and objective:
To determine influence of varied flow of current in one litre of river water using iron electrode on electrochemical technique as a treatment media. Each test was performed within 20 minutes
Quantity of river water treated= One litres
Parameter Recording Table A8:
Time Current Charge theoretical actual pH colour conductivity mass mass
(seconds) (amps) (C/L) mg mg River I 6.60 33 196.00 Water
I i i
Test 1 1200 1 1200 349.02 474.12 7.00 7 121.20 Test 2 1200 1.2 1440 418.82 508.00 7.26 2 94.00
Test 3 1200 1.3 1560 453.72 547.92 7.37 5 82.50 Test4 1200 1.4 1680 488.63 549.91 7.40 12 76.60 TestS 1200 1.5 1800 523.53 559.68 7.42 30 71 .20 Test6 1200 1.6 1920 558.43 576.00 7.43 95 70.00
ELH IRO-FLO('Cl L \1101\ 0~ Rl\ l::R W \I ER A -l)
tds
125
76 53 48 45 42 40

'\PPE~DIX ,\ EXPERI\I E TA l D ·\TA
Experiment 9
Aim and objective:
To determine influence agitation or stirring using iron electrode on electrochemical technique as a treatment media in 750 ml
Quantity of river water treated = 750 millilitres
Parameter Recording Table A9:
Agitation Without Agitation Time Current Charge Colour Phosphates Colour Phosphates
(seconds) (amps) (C/L) pH (Pt!Co) (mg/L}_ pH (Pt!Co) (mg/L)
0 0 0 6.60 33 0.37 6.60 33 0.37 300 0.5 200 7.00 9 0.24 7.77 27 0 .34 600 0.5 400 7.26 2 0.17 7.74 22 0.31 900 0.5 600 7.37 1 0.14 7.95 19 0.27 1200 0.5 800 7.40 2 0.12 7.85 16 0.25 1500 0.5 1000 7.42 5 0.12 8.00 16 0.25
1800 0.5 1200 7.43 9 0.11 7.90 19 0.24
ELECTRO-Fl.OCCLLATIO OF RIVER W \TER A-10

APPE'IOIX A EXI'i':RIMEI'\ fAL DA I A
Experiment 10
Aim and objective:
To determine influence agitation or stirring using iron electrode on electrochemical technique as a treatment media in 750 ml
Quantity of river water treated = 750 millilitres
Parameter Recording Table AlO:
Time Aluminium Phosphates pH Current Mass dissolved (g) Charge Colour Conductivity Turbudity TDS
(minutes) theoretical actual (C/L)
0 0.200 0.36 6.6 1.15 0.0000 0.0000 0.0 33 198.0 52 129
4 0.540 0.29 6.72 1.2 0.0270 0.0220 144.0 14 172.0 0.92 111
6 10.200 0.28 6.88 1.3 0.0438 0.0376 234.0 8 138.0 0.88 88
9 26.121 0.28 7.013 1.35 0.0683 0.0615 364 .5 6 116.8 0.82 73
12 36.544 0.27 7.16 1.2 0.0809 0.0800 432 .0 4 105.8 0.7 64
15 66.1 45 0.26 7.29 1.2 0.1012 0.0954 540.0 2 99.9 0.56 60
18 99.351 0.25 7.38 1.3 0.1315 0.1257 702.0 1 95.2 0.45 57
21 168.440 0.22 7.39 1.35 0.1594 0.1514 850.5 1 92 .3 0.38 55
25 258.641 0.2 7.39 1.45 0.2038 0.1927 1087.5 0 85.5 0.33 53
EI.ECTRO-FI.OC'C'lJLATION OF RIVF.R WAJ ER A-11


APPE:"'OJ:\. A EXPERIME"'ITAL 0 ,\TA
Experiment 11
Aim and objective:
To determine influence agitation or stirring using iron electrode on electrochemical technique as a treatment media in 2 litres
Quantity of river water treated= two litres
Parameter Recording Table A 11:
Time Iron Phosphate Colour pH
Current Calc. Charge (minutes) (mg/1) (mg/1) (amp) Mass (g) (C/L)
0 0 .20 0.360 33 6.60 0 .6 0.0000 0
20 18.00 0.300 33 6.67 0 .6 0.1396 360
30 27.40 0.280 32 6.71 0.6 0.2094 540
40 35.30 0.260 31 6.74 0.6 0.2792 720
50 42.80 0.253 29 6 .78 0.6 0.3490 900
60 48.40 0.245 27 6.85 0.7 0.4886 1260
70 53 .50 0.238 22 6 .88 0.7 0.5701 1470
80 59 .10 0.234 19 6 .86 0.7 0.6515 1680
90 63.70 0.230 17 6 .87 0.7 0.7329 1890
100 68.40 0.230 15 6 .87 0 .7 0.8144 2100
120 71.67 0.220 15 6 .87 0.9 1.2565 3240
EU.CTR -FLOCCl L\TION OF RIVER WATER A-13

I\PPE 1 Dl'\ A EXPERIME 'TAL DATA
Further Results Discussions
ELECTRQ-FlOCCLL\flOi\ Or Rt\ ER WA rER A-14

API'ENDI'\ A EXPERIME 'TAL DATA
Phosphate Levels
Iron treatment process reduced the phosphates concentration by up to 75% of the initial
concentration. This is illustrated in Figure A.1 where 3.6 ppm was lowered to 0.09 ppm with
the total energy consumption of about 75 coulomb used for every one litre of the water
treated.
0.400 7.10
0.350 ~ 7.00
~ 0.300 c;, 6.90
.§.. 0.250 'iii' 6.8o=a_ Qj Aloshates - pH > 0.200 ~ 1/)
6.70 Q)
1ii 0.150 '-----_ .r:: c. 1/)
6.60 0 0.100 .r:: fl.
0.050 6.50
0 2070 4320 7020 9720 10800 12960 16380 18720
Charge (Coulomb per liter)
Figure A.1: Phosphate removal by iron dosing
Effect of pH
The removal of phosphate from river water by electrochemistry is highly reliant on the pH
of the solution which affects the surface charge of the electrodes, the degree of ionisation,
current transfer and the speciation of the electrode species. The electrochemical behaviour of
the iron ion was studied in aqueous solution of different pH values using different dosing
rates of ions and a fixed/constant amount of phosphate concentration in the solution. The
results obtained are presented in Figure A.1 to A.4. It was observed that the maximum
removal of phosphates was achieved at pH levels between 6.5 and 7.0, which gradually
decreased with further increase in pH.
ELf.CTRG-fLOCC"tiLATIO"\ OF RIVER WATER A-15

Af'P£1\01'\ A EXPER I ME 'TAL DATA
180
160
~ 140 c;, E 120
~ 100 '0 c: 80 tel
0 60 u
i. ... 40 ::I 0 0 20 u
0
.,...--------------------------,- 7.05
--+- Colour 7.00
6.95
6.90
6.85
6.80 ~
6.75
6.70
6.65
6.60
L--t----+---t-=*===t--~-t----+---+----+--+ 6.55
0 2070 4320 7020 9720 1 0800 12960 16380 18720 Charge (Coulomb per liter)
Figure A.2: pH, colour and iron concentration variation
7.10 ..-----------------------,- 8.0000
7.00
6.90
~ 6.80
6.70
6.60 - pH ---+- Iron Dissolved
7.0000
6.0000
5.0000 c: .Q "S
4.0000 0 VI .!!!
3.0000 '0 c:
2.0000 _g
1.0000
6.50 +--.....,_-t-- --i---+---+--+----+-- --+---t---+ 0.0000
0 2070 4320 7020 9720 10800 12960 16380 18720
Charge (coulomb per litre)
Figure A.3: pH change as an effect of iron dissolution in water
ELECTRO- FLOC<l L\ fiOJ\ OF Rl\ ~R W TER A-16

API'E. 1>1. A EXPERIMENTAL DATA
Colour comparability with Iron concentration
Iron electrode as coagulant in water treatment indicated to leave slight residual colour in
treated river water, this was also observed in case of ferric chemical treatment (i.e. ferric
chloride, ferric sulphate monohydrate). Figure A.2 also indicates that as iron concentration
in the water increased to 3.8 ppm, the colour improves and as it goes higher, the colour turns
the other way. This marginal change indicates extend at which further experimentation for
optimisation purposes could be employed.
Effect of pH in Iron Dissolution 8 0 T------------------------T 0.2
7.9 - pH
7.8 ----o-- lron Dissoived (calculated)
7.7
~ 7.6
7.5
7.4
7.3
0.1 8
0.1 6
0.1~ "C
0. 12~ 0
0.1 g: 0.0~
0 0.0&=
0.04
0.02
7.2 +--t?-+---+---+---t---t---t-----lf------lf---+--+---+---+ 0
0 38 68.4 114 159.6 182.4 216 259.2 309.6 345.6 381.6 424.8 Charge (coulomb per litre)
Figure A. 4 Iron Dissolution
Conductivity
The conductance of water increases with increase in metal dosing. Figure A.6 illustrates the
extent at which conductivity of water raise because of metal ion increase.
[I.ECTRQ-fLO CUL\ TION OF Rl\ ER W <\ IE.R A- 17

AI'P~ :"101\ A EXPERIMENT L DATA
~H versus Conductivity
9.00 350
345 8.50
340 -E CJ
8.00 ::r:: c.
7.50
7.00
335 en
l :I
330 ~ :~
325 ti :I
---- pH ---+-- Conductivity "0 c:
320 0 (.)
315
6.50 310
0 1125 2250 3375 4500 5625 6750 7875 9000
Charge (coulomb per litre)
Figure A. 5 Conductance as a result metal dosing
Iron consumption
The amount of iron utilised is directly linked to the amount of energy (expressed as charge).
Trial experimentation have been conducted and charge exceeding 75 coulombs per litre have
been utilised, about 90 coulombs charge was used per litre of river water and this was
reduced to 75 coulombs per litre then to 42.5 coulomb at the optimisation stage. The initial
optimisation was aimed to reduce power consumption to below 20 coulombs charge per litre
which was calculated theoretically (this is equivalent to 10 mg!L stoichiometric calculation
of ferric chloride dosage in chemical treatment). In terms of mass representation the
consumption of iron metal was projected theoretically to 3.443 mg per litre of water to be
treated and 4.245 mg was achieved.
Figure A. 7 below indicates the mole ratio of iron consumed compared to the removal of
phosphate concentraton expressed in percentage. A removal of 75% phosphates was
achieved by a consumption of about 7.3 mg!L iron utilisation.
ELECTRO..FLOC<.L L \TIO' 01- Rl\ ER WATER A-18

\PPF.\01\ A
80%
70% ~-
~ 60% E ::; 50% Q)
~ E 40% Q)
It: 30% Q)
iii -a 20% ~ '&. 10%
0%
II' I
j 0.0 0.8
EX P RIMEI'IITAL. D \T.\
~ ~
/ /
/
1.7 2.7 3.8 4 .2 5.0 6.4 7.3
Iron Consumed (mg/L)
Figure A. 7 - Mole ratio iron consumed to phosphate removed
EI.ECIRO- FLO('C'liL \TION Of RI\'Eil \\' \TER A-19

APPENDI:\ A EXPERIMI<: TAL DATA
Aluminium Treatment
This method of treatment leaves no residual colour on treated river water. The drawback is
the fact that it requires more energy as compared to the iron dosing method. The tabulated
results in the appendix reflect the energy consumption ofthis process. Aluminium electrode
dosing on water indicated an insignificant effect on the change of colour after treatment,
thus the colour variation are not indicated on these results
Phosphate Concentration
Aluminium ion method of treatment achieved at least 50 percent reduction of phosphates.
Figure A.8 illustrate the reduction of phosphates from as high as 0.36 ppm to as low as
0.18ppm. Although the aluminium concentration indicated gradual increment after
70coulomb per litre of charge dosage, intake from water exceeds 5% of the total daily
intake, but no acute health effects are expected except at very high concentrations. The
targeted aluminium concentration is 150ppm and maximum is 500ppm
0.4
0.35
:::J 0.3 c, .s 0.25
~ j 0.2 Cll 1ii .r:. 0.15 c. 1/)
_g 0.1 a..
0.05
0
.. ~ / - -,z_._ --
/_ ~ ___., /
/ ---- Phosphate Level (rrg/L) -+- pH
¥
0 1404 2340 3645 4320 5436 7098 8465 1 0571
Charge (coulomb per litre)
7.5
7.4
7.3
7.2
7.1
7 ~
6.9
6.8
6.7
6.6
6.5
Figure A.8: Phosphates reduction by Aluminium treatment method.
ELECTRo-FLO(Tl IL \ TIO OF Rl\ ER W HER A-20
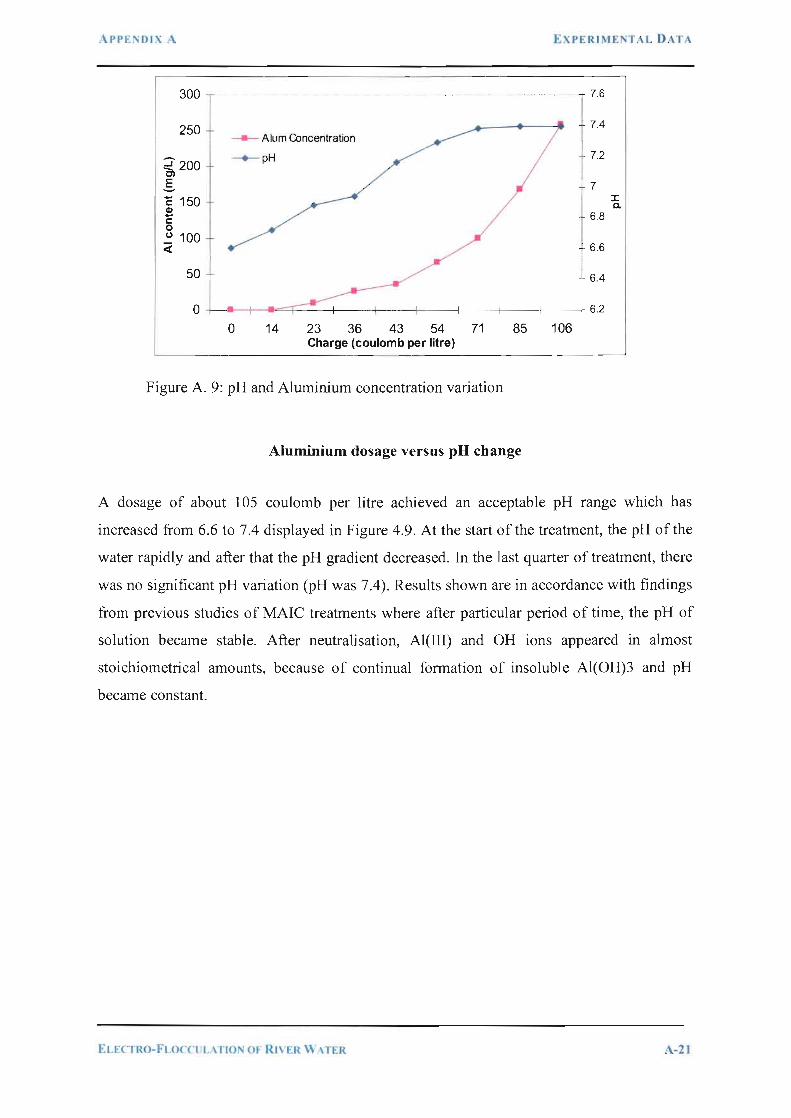
APP£ DIX i\.
300
250
:; 200 c, E ~
c 150 41 -c: 0 u 100 <(
----- Alum Concentration
-+- pH
0 14 23 36 43 54 Charge (coulomb per litre)
71 85
Figure A. 9: pH and Aluminium concentration variation
Aluminium dosage versus pH change
EXPERIME 'T.\l. DATA
1 7.6
7.4
7.2
7 :I: Q.
6.8
6.6
6.4
6.2
106
A dosage of about 105 coulomb per litre achieved an acceptable pH range which has
increased from 6.6 to 7.4 displayed in Figure 4.9. At the start of the treatment, the pH of the
water rapidly and after that the pH gradient decreased. In the last quarter of treatment, there
was no significant pH variation (pH was 7.4). Results shown are in accordance with findings
from previous studies of MAIC treatments where after particular period of time, the pH of
solution became stable. After neutralisation, Al(III) and OH ions appeared in almost
stoichiometrical amounts, because of continual formation of insoluble Al(OH)3 and pH
became constant.
Et.H-IIW-FLOCClL\ 110 OJ Rl\ ER \\ \TER A-21

.\PPF.~OI\ A EXPERIME T .\L DAT A
7 .00 .-----------------·--------.- 0.8
6.95 - pH
6 .90 ---.:r-- Mass dissolved
6.85
a 6.80
6.75
6.70
0.7
0.6 E _:!_ <('§,
0.5 '0 E c: ~ Ill <ll
0.4 ~ 1§ ~ § ~ :s
0_3 10 = -a -~ lQ '0
0.2 .c: c..
6 .60 0 0
0 1380 2880 4320 5760 7200 8640 1 0920 11520 12960 14400
Charge (C/1)
Figure A. I 0: pH change as an effect of aluminium dosing in river water
Aluminium consumption
Figure 4.11 below indicates the mole ratio of aluminium consumed compared to the removal
of phosphate concentration expressed in percentage. A removal of about 45% phosphates
was achieved by a minimal consumption of about 2 mg/L aluminium utilisation.
50% .--------------------------.
45% -~ 40%
~ 35% .
~ 30% 0 E 25% (I)
'!; 20%
~ 15% 0..
:s 10% .r: a.. 5%
0%+--.-.--~--~------~--~--.----.--~
0.00 0.26 0.44 0 .68 0.81 1.02 1.33 1.59 1.98
Aluminium consumed (mg/L)
Figure A.ll: Mole ratio of aluminium consumed versus phosphate removal
Agitation or mixing achieved in the form of stining during experimentation indicated to
have positive influence in the electro-flocculation of river water. The following result was
achieved where agitation or stirring was employed. For assisting the alternating current
ELEC'TRO-FLOCCL L\ TJO OF RIV R W.\TER A-22

APPE DIX \ EXPERIMENTAL DATA
which makes 'self cleansing' of electrode possible, agitation was employed to improve
energy consumption during the electrolysis. Stirring reduces the resistance that is formed as
a result of film formation on the water-electrode interface. The thicker the film at a point of
interface requires more energy. A successful application of iron (ferric ion) in water
treatment was also indicated in Figure 4.7 by reducing the turbidity of river water to an
average of 0.44 NTU. During this period in question the raw water turbidity varied from 60
to 40 NTU. This variation is indicated with different dosage rates of ferric ion on river
water.
Combined Iron and Aluminium ions dosing
The combined method of water treatment show better results compared to the individual ion
treatment. With this method energy requirements have got a room of optimisation, method
of treatment leaves no residual colour on treated river water. The snag is the fact that it
requires more energy as compared to the single iron dosing method.
ELECTRo-Ft.OCCUl..\TIO Of RIVER W.\TER A-23
APPENDIX B GLOSSARY F TERMS A 0 SYMBOLS
Appendix B
Glossary of Terms and Symbols
ELECTRO-FLOCClLATION 01' RIVER WATER B-1

APPE: Dl 8 GLO 'Si\RY OF TE I~MS AND SYMBOLS
A Symbol and abbreviation of ampere.
absorption
A process "to take in and incorporate." E.g., light can be "absorbed" by a material. In chemistry, a term often used to describe the dissolution of a gas into a liquid or solid. The dissolving gas is said to be "absorbed." Or a liquid substance can be "absorbed" by a solid. This is a bulk process, not to be confused with adsorption.
ac
Abbreviation of alternating current. However this term is also used in connection with ac voltage, that is, an "alternating" voltage that will cause an "ac current" to flow in a conductor, and also in connection with ac power. Contrast with de.
acid
A compound that dissociates to produce hydrogen (H+) cations when dissolved in water. See also pH.
active metal
A metal that is easily oxidized (corroded) in air. For example, sodium will violently react with air, aluminium will always have an air-formed oxide film on its surface, and iron is easily rusted. These metals have high negative standard electrode potentials and are high the on the electromotive series. Contrast with noble metal.
adsorbate
A material that is adsorbed.
adsorption
An increase of the concentration of a solute in the vicinity of a solid surface, over that in the bulk of the solution, due to the attractive interaction between the solid immersed into the solution and the solute. Adsorption on a solid from a gaseous phase also occurs. It is a surface process, not to be confused with absorption. Opposite: desorption.
aluminium production
Aluminium metal is produced by electrolysis of aluminium oxide dissolved in a high-temperature molten-salt electrolyte. Aluminium is deposited as a liquid metal on the cathode of the electrolytic cell (the aluminium cations are reduced to liquid metal). This is the only large-scale industrial process for the production of aluminium.
ammeter
Instrument used for the measurement of current.
amp
Symbol and abbreviation of ampere.
ampere
Measurement unit of current. Abbreviation: "A" or "amp".
anion
A negatively charged ion.
EL rTRO-FLOCC"lll..\TIO OF RI\'ER WATER B-2

API'El\DJ:\ B GLO~SARY OF TER 1~ A •' O SYMBOL~
anode
The electrode where oxidation occurs in an electrochemical cell. It is the positive electrode in an electrolytic cell, while it is the negative electrode in a galvanic cell. The current on the anode is considered a positive current according to international convention; however, in electroanalytical chemistry the anodic current is often considered negative. Contrast with cathode.
anode effect
A condition in an electrolytic cell that produces an abrupt increase in cell voltage and a decrease in current flow. It is usually caused by the temporary formation of an insulating layer on the anode surface. It occurs almost exclusively in molten salt electrolysis, such as in aluminium production.
aqueous solution
A solution with water as the solvent. Contrast with: non-aqueous solution.
atom, atomic structure (proton, neutron, electron)
The smallest physical unit of a chemical element that can still retain all the physical and chemical properties of that element. Atoms combine to form molecules, and they themselves contain several kinds of smaller particles. An atom has a dense central core (the nucleus) consisting of positively charged particles (protons) and uncharged particles (neutrons). Negatively charged particles (electrons) are scattered in a relatively large space around this nucleus and move about it in orbital patterns at extremely high speeds. An atom contains the same number of protons as electrons and thus is electrically neutral (uncharged) and stable under most conditions.
atomic weight
The average relative weight of a chemical element as it occurs in nature referred to some element taken as a standard.
barrier (oxide) film
A thin, continuous, non-porous, electrically insulating film on metal surfaces (usually comprised of oxides).
base
A compound that dissociates to produce hydroxyl (OR) anions when dissolved in water (also called "caustic" or "alkali"). See also pH.
bioelectrochemistry
Electrochemistry of biological (living) systems and biological compounds.
buffer solution
A solution with a constant, specified pH. The pH of the solution "resists" any change: addition of small amounts of solvent or even acid or base will not appreciable change the pH. This is called "buffer capacity."
c Symbol and abbreviation of coulomb.
capacitor
An electrical device which serves to store electricity or electrical energy. It has three essential parts: two electrical conductors, which are usually metal plates, separated and insulated by the third part called the "dielectric." The plates are charged with equal amounts of positive and negative electrical
ELECTRO-FLOCCl:L.\TIOI\ OF RIVER WATER B-3

APPEI'\DI\ B GLO..,'tARY OF TER tS ANL> SYMBOLS
charges, respectively. This is a "physical" storage of electricity as compared with the "chemical" storage in a battery.
capacity
See capacitance. The term "capacity" is also used in a somewhat different meaning for batteries: it expresses the total amount of electrical charge a battery is able to hold. It is usually expressed in ampere-hours.
cathode
The electrode where reduction occurs in an electrochemical cell. It is the negative electrode in an electrolytic cell, while it is the positive electrode in a galvanic cell. The current on the cathode is considered a negative current according to international convention; however, in electroanalytical chemistry the cathodic current is often considered positive. Contrast with anode.
cation
A positively charged ion.
charge carrier
The particle carrying the electrical charge during the flow of electrical current. In metallic conductors the charge carriers are electrons, while ions carry the charges in electrolyte solutions.
charge density
Charge referred to the unit area of the electrode. Charge divided by electrode area.
charger
An electrical device used to charge a rechargeable battery using household electricity.
charge rate
The current applied to a rechargeable battery to restore its capacity. This rate is commonly expressed as a multiple of the rated capacity.
charge-transfer reaction
A chemical reaction where an electrical charge (usually an electron) is transferred from one reactant to another. See also heterogeneous charge-transfer reaction and homogeneous charge-transfer reaction. In case of an electrode reaction, the electrode itself is considered one of the "reactants." An electrode reaction is a heterogeneous charge-transfer reaction.
charge-transfer resistance
A characteristic quantity for an electrode reaction indicative of its inherent speed: a large chargetransfer resistance indicates a slow reaction. See also non-ohmic resistance.
charging
A process to "fill" a rechargeable battery or a capacitor with electricity by applying a current to its terminals. In a battery, this process will cause electrochemical reactions to occur storing the electricity in chemical form. In contrast, during the charging of a capacitor the electricity is stored as electrical charges, without causing any chemical reactions to occur. Opposite: discharging.
closed-circuit voltage
The voltage of a battery when it is discharging (on-load condition). Abbreviated as "ccv."
coagulation
ELECIRO-FLOCCUL\ TIO OF RI\ER \\ .'\fER B-4

APPE~DI\ B GLO 'SARY OF TEI~MS .\ 0 SYMBOLS
Coagulation is the process of adding chemicals to water to make dissolved and suspended particles bind together (coagulate) and form larger particles (flocculant) that settle out of the water.
concentration
The measure of the amount of dissolved material (solute) in a solution. It can be expressed in a variety of ways. Expressions in weight percent, and grams of solute per litre of solution are corrunon. A more fundamental way to express concentration is used in chemistry: the "molar" concentration. A solution is considered one molar (I M) if it contains as many grams of solute per litre of solution as is the molecular weight of the solute (the so called gram-mole). This provides an atomistically fundamental expression because one gram-mole of any material will contain the same (and very large) number of molecules. One gram-mole of hydrogen gas contains the exact same number of molecules as one gram-mole of table salt (sodium chloride), even though the latter is much heavier. In this dictionary, the term "concentration" always designates "molarity" unless otherwise specified.
conductivity (electrical)
The measure of a material's capability to carry electrical cwTent. The measurement unit of conductivity (conductance) is the siemens. The reciprocal of resistivity.
conductor (electrical)
A material that is capable to carry an electrical current. See also electronic conductor and ionic conductor ..
corrosion
A chemical (often electrochemical) process that destroys structural materials. Typically it refers to corrosion of metals, but any other material (e.g., plastic or semiconductor) will also corrode. The simplest example of metallic corrosion is the rusting of iron in air. Iron is spontaneously oxidized by the oxygen in air to iron oxides (while the oxygen is being reduced). Metallic corrosion is very often an electrochemical process. It is always electrochemical when the metal is immersed in a solution, but even in atmospheric corrosion a thin film of condensed moisture often covers the surface. The metal in the corrosive solution essentially acts as a short-circuited galvanic cell. Different areas of the surface act as anode and cathode, at the anodic areas the metal is oxidized to an oxide while at the cathodic areas the dissolved oxygen is being reduced. The spontaneous complementary oxidation/reduction processes of "rusting" are spatially separated while an electrical current is flowing "internally" from one part of the corroding metal to another; the current is totally "wasted" as it produces no useful work but only generates heat. (A cell arrangement like this is often called a "local cell.") See corrosion current and corrosion potential.
Corrosion products are typically oxides, but other products (e.g., sulphides) can also form depending on the environment. Corrosion always involves oxidation of the corroding material in the general sense of the term.
corrosion inhibitor
A chemical that stops (or at least decreases the rate of) a corrosion process. The inhibitor can be added to an otherwise corrosive solution (often a very small concentration will accomplish the goal) or it can be incorporated in a coating applied to the metal surface.
corrosion potential
The electrode potential of a corroding metal. It is a "mixed potential" with a value that is in between the equilibrium potentials of the anodic and cathodic corrosion reactions. The corrosion is a spontaneous, dynamic phenomena with electrode reactions taking place and a current flowing. Consequently, both reactions are polarized and their potentials approach each other; as a matter of fact, they must become equal to preserve a single potential for the metal. However, the two reactions
EI.ECTRO-FLOCCULATIO .. OF RJ\ER \\ATER B-5

APPENDIX R GLOS .\RY OF TEIBtS AND ., 1\IBOLS
are not necessarily equally polarized. The overpotential of the two electrode reactions will be generally different, and their values will be dictated by the requirement that the electrode potentials be equal (at the "corrosion potential") at one, uniquely defined current (the corrosion current). See the Tafel equation for a relation between overpotential and current. (The ir drops in the solution and the metal are ignored in the above discussion; this is justified by the close proximity of the anodic and cathodic areas on the corroding metal.)
coulomb
Measurement unit of the electrical charge. Symbol: "C".
The charge passing a given point during one second when the current is one ampere.
current
The movement of electrical charges in a conductor; carried by electrons in an electronic conductor (electronic current) or by ions in an ionic conductor (ionic current). "By definition" the electrical current always flows from the positive potential end of the conductor toward the negative potential end, independent of the actual direction of motion of the differently charged current carrier (or "charge carrier") particles. Two kinds of currents must be distinguished: "direct current (de)" and "alternating current (ac)." Direct current is the unidirectional continuous flow of current, while alternating current is the oscillating (back and forth) flow of current. In electrochemistry, we almost always use direct current. Consequently, the term "current" always designates "de" in this dictionary unless specifically stated to be "ac." The normal household current is an alternating current. The measurement unit of current is the ampere.
As mentioned above, the "defined" current flows from the positive terminal of the current source, trough the load, to the negative terminal of the source. Consequently, inside the "source" (whether it is electromechanical or electrochemical) the current must flow from the negative terminal to the positive terminal since there must be a complete circuit. This concept is especially important in electrochemistry because an electrochemical cell can be either a current "source" (galvanic cell) or a "load" (electrolytic cell). Furthermore, a rechargeable battery operates as a "source" during discharge and as a "load" during charge. Current flowing through an electrochemical cell is usually the sum of the capacitive current and the faradaic current.
current efficiency
The fraction, usually expressed as a percentage, of the current passing through an electrolytic cell (or an electrode) that accomplishes the desired chemical reaction. Inefficiencies may arise from reactions other than the intended reaction taking place at the electrodes, or side reactions consuming the product. The expected production can be theoretically calculated and compared with the actual production.
current leakage
Current that is bypassing bipolar electrodes in a series coupled cell assembly (due to insufficient sealing or improper piping around the bipolar electrode) and therefore is not producing the required chemical change (electrode reaction).
de
Abbreviation of direct current. However this term is also used in connection with de voltage, that is, a steady voltage that will cause a "de current" to flow in a conductor, and also in connection with de power. Contrast with ac.
deposition/dissolution
See metal deposition/dissolution reactions.
U .ECTRO-FLOCTl L \ TION OF Rl\ fR W \ TER B-6
APPE DIX B GlOSSARY OF TERMS AND ' YMBOL.'.
dissociation
The process that may occur when a chemical compound is dissolved in a solvent (e.g., water). The molecules of the compound will break up ("dissociate") into two or more ions resulting in an ionically conducting electrolyte solution. E.g., the common table salt (sodium chloride) will dissociate into a single charged sodium cation and a single charged chloride anion.
electrical charge
A basic property of matter that gives rise to all electric and magnetic forces and interactions. Matter can be "neutral" (having no electrical charge) or it can have one of two kinds of charges distinguished as "positive" or "negative." The measurement unit of charge is the coulomb.
electrical energy
A form of energy. It expresses the ability of an electrical source to carry out useful work or generate heat. E.g., this energy can be used to drive an electrical motor and carry out some mechanical work, or to generate heat with an electrical heater. The electrical energy is usually expressed in units of watt-hour, symbol: "Wh". See also electrical power.
electrical field
A region of space, associated with a distribution of electric charge, in which forces due to that charge act upon other electric charges.
electrical potential
The electrical potential difference between two point in a circuit is the cause of the flow of a current. It is somewhat analogous to the difference in height in a waterfall that causes the water to fall, or the difference in pressure in a pipeline that causes the gas to flow . In electrochemistry we typically carmot measure "absolute" potentials, only the "difference" of potential between two points. For similar concepts, see electromotive force (emf) and voltage. These terms are sometimes used interchangeably. However, in electrochemistry "emf' usually refers to the potential difference between the two electrodes of an electrochemical cell when there is no current flowing through the cell, "voltage" refers to same with current flowing, and "potential" is usually used in cormection with electrodes (see electrode potential). The measurement unit of the potential is the volt.
electrical power
The rate at which an electrical source can supply electrical energy. E.g., a battery may be able to store a large amount of energy, but if it has a small power capability it can provide the energy (do some work) only slowly, and it will take a long time to discharge. Another battery with the same energy storage capability but larger power will provide the energy (do work) faster, but will also be discharged faster. Electrical power is expressed usually in units of watt, symbol: "W". Unfortunately, the terms "power" and "energy" are often used interchangeably in everyday language (and sometimes also in the technical literature) even though they are quite distinct concepts, e.g., when we talk about "energy source" or "power source," we usually mean the same thing. Not only electrical sources but also loads are characterized by a power rating, e.g., an electrical motor or a light bulb is characterized by the power it needs to operate it.
The power of a source (or the power need of a load) can be calculated as the product of the current and voltage (watt= ampere x volt). One watt means that one watt-second (coulomb x volt) energy is provided (used) every second. In more practical units, one watt means that one watt-hour (amperehour x volt) energy is provided (used) every hour.
electrical source (supply)
A source of electrical power (electrical energy), a device that supplies electrical current. It can be electrochemical (battery or fuel cell) or an electromechanical device (dynamo) or a specialized
'I.E RO-fi.OCTllL.\TION OF RrVER W \TER B-7

APPENDIX B GLOSSARl OF TERM AND SYMBOLS
of the cation of the electrode metal in the solution (see Nemst equation). Contrast with electrode of the second kind and electrode of the third kind.
electrode of the second kind
A metal electrode assembly with the equilibrium potential being a function of the concentration of an anion in the solution. Typical examples are the silver/silver-chloride electrode and the calomel electrode. Contrast with electrode of the first kind and electrode of the third kind.
The assembly consists of a metal, in contact with a slightly soluble salt of this metal, immersed in a solution containing the same anion as that of the metal salt (e.g., silver---silver chloride---potassium chloride solution). The potential of the metal is controlled by the concentration of its cation in the solution, but this, in tum, is controlled by the anion concentration in the solution through the solubility product of the slightly soluble metal salt.
electrode of the third kind
A metal electrode assembly with the equilibrium potential being a function of the concentration of a cation, other than the cation of the electrode metal, in the solution. These have been used, with limited success, in sensors for metal ions for metals that are not stable in aqueous solutions, e.g., calcium and magnesium. Contrast with electrode of the first kind and electrode of the second kind.
The assembly consists of a metal in contact with two slightly soluble salts (one containing the cation of the solid metal, the other the cation to be determined, with both salts having a common anion) immersed in a solution containing a salt of the second metal (e.g., zinc metal---zinc oxalate--calcium oxalate---calcium salt solution). The potential of the metal is controlled by the concentration of its cation in the solution, but this is controlled by the anion concentration in the solution through the solubility product of the slightly soluble metal salt, which, in tum is controlled by the concentration of the cation of the second slightly soluble salt. These electrodes are very sluggish and unstable due to a series of equilibria to be established to produce a stable potential.
electrode potential
The electrical potential difference between an electrode and a reference electrode. We cannot measure the "absolute" potential of an electrode; therefore, the electrode potential must always be referred to an "arbitrary zero point," defined by the potential of the reference electrode. Consequently, it is very important always to note the type of reference electrode used in the measurement of the electrode potential. See also equilibrium electrode potential.
electrode reaction
A chemical "half" (or "partial") reaction occurring at the electrode surface. It is called a "half'' (or "partial") reaction because only the oxidation or the reduction part of the overall cell reaction occurs at any one electrode. See also electrochemical reaction. Many electrode reactions can proceed either as oxidation or as reduction, depending on the direction of the current flowing through the electrode/electrolyte interface. See, e.g. metal deposition/dissolution or redox reactions.
An electrode reaction always occurs in several series and parallel elementary reaction steps. Even in the simplest case there are three steps in series: (1) the reactant must be transported to the electrode surface from the bulk of the electrolyte (usually predominantly by diffusion, but it can also occur by electromigration), (2) a charge-transfer reaction occurs, and (3) the product must be transported from the electrode surface to the bulk of the electrolyte.
electrolysis
A process that decomposes a chemical compound into its elements or produces a new compound by the action of an electrical current. The electrical current is passed trough an electrolytic cell and
ELECTIW-FLOCCLIL TION m Rt\ ER W .\TEI{ B-9

• \I'PENOIX B GLOS~AR\ OF TERMS AND S' MBOL .
oxidation/reduction reactions occur at the electrodes. E.g. , water can be decomposed into hydrogen and oxygen, or a metal can be electroplated by electrolysis.
electrolyte
A chemical compound (salt, acid, or base) that dissociates into electrically charged ions when dissolved in a solvent. The resulting electrolyte (or electrolytic) solution is an ionic conductor of electricity. Very often, the so formed solution itself is simply called an "electrolyte." Also, molten salts and molten salt solutions are often called "electrolyte" when used in electrochemical cells, see ionic liquid. See also solid electrolyte.
electrolytic cell
An electrochemical cell that converts electrical energy into chemical energy. The chemical reactions do not occur "spontaneously" at the electrodes when they are connected through an external circuit. The reaction must be forced by applying an external electrical current. It is used to store electrical energy in chemical form, see rechargeable battery. It is also used to decompose or produce (synthesize) new chemicals by application of electrical power. This process is called electrolysis, e.g., water can be decomposed into hydrogen gas and oxygen gas.
The free energy change of the overall cell reaction is positive.
electromotive force
The cell voltage of a galvanic cell measured when there is no current flowing through the cell. In other words, the equilibrium electrode potential difference between the two electrodes of the cell. Abbreviated as "emf."
electroplating
The process that produces a thin, metallic coating on the surface on another metal (or any other conductor, e.g., graphite). The metal substrate to be coated is made the cathode in an electrolytic cell where the cations of the electrolyte are the positive ions of the metal to be coated on the surface. When a current is applied, the electrode reaction occurring on the cathode is the reduction of the metal ions to metal. E.g. , gold ions can be discharged form a gold solution to form a thin gold coating on a less expensive metal to produce "custome" jewellery. Similarly, chromium coating is often applied to steel surfaces to make them more "rust resistant." Electroplating is also used in the production of integrated circuits on computer chips and for other modem electronic instrumentation. The anode material can either be the metal to be deposited (in this case the electrode reaction is electrodissolution that continuously supplies the metal ions) or the anode can be of inert material and the anodic reaction is oxygen evolution (in this case the plating solution is eventually depleted of metal ions). Also called "electrodeposition.".
element, chemical
A substance that cannot be decomposed into simpler substances by chemical means.
emf
Stands for electromotive force.
energy
The energy of a system expresses the ability of that system to do some useful work or generate heat. Energy can be in many forms; e.g., mechanical energy, chemical energy, heat energy, electrical energy, etc. The different forms of energy can be converted into each other.
It is a fundamental law of nature that energy can never be converted from one form to another 100%, some of the energy is always converted into heat energy during the conversion. Also, heat can never be converted 100% into any other form of energy.
EJ.EC RO-FLOCClJl.\ 110 01' Rl\ ER WATER B-10

APPF?IIDI\. B GLO!'. Aln' OF TERMS AND S MBOLS
F Symbol and abbreviation of farad, and symbol and abbreviation of the Faraday number. (Often a "bold-face" letter is used for the latter, but this is not a general practice.) It is usually obvious from the context which meaning is appropriate.
farad
Measurement unit of capacitance. Symbol: "F," which is the same as the symbol of the Faraday Number. It is usually obvious from the context which meaning is appropriate.
A capacitor has a capacitance of one farad when one coulomb charges it to one volt.
Faraday's Laws
Some of the most fundamental laws of electrochemistry discovered by Faraday in the 1830's. They are usually stated as: (1) In any electrolytic process the amount of chemical change produced is proportional of the total amount of electrical charge passed through the cell. (2) The mass of the chemicals changed is proportional to the chemicals' equivalent weight. The proportionality constant being the Faraday Number.
Faraday Number (Faraday constant)
The Faraday Number (or constant) gives the amount of electrical charge needed to change one gramequivalent of substance by electrochemical reaction. Its value is 96,485.34 coulombs or 26.80 ampere-hours. This charge is often simply called one "Faraday." Symbol : "F," which is the same as the symbol of the farad. It is usually obvious from the context which meaning is appropriate.
The Faraday number is the product of Avogadro's number and the electrical charge of a single electron.
faradic current (density)
The current (or current density) that is flowing through an electrochemical cell and is causing (or is caused by) chemical reactions (charge transfer) occurring at the electrode surfaces. Contrast with capacitive current.
faradaic reaction
A heterogeneous charge-transfer reaction occurring at the surface of an electrode.
flocculation Flocculation refers to a process where a solute comes out of solution in the form of floc or "flakes." The term is also used to refer to the process by which fine particulates are caused to clump together into floc. The floc may then float to the top of the liquid, settle to the bottom of the liquid, or can be readily filtered from the liquid.
flow-through electrode
An electrode that permits the electrolyte to flow through it, e.g., a porous electrode or a packed-bed electrode. This type of electrode is especially useful for removing small traces of impurities from the solution by electrolysis (e.g., waste treatment) because the solution contacts a large surface of the electrode material.
frequency
The frequncy of an alternating (ac) current is a measure of how many times the direction of the current flow changes, in the same direction, per second. As the direction of flow changes back and forth, the total number of directional changes, per second, is twice the frequency. The frequency of the household current is 60 hertz. The measurement unit of the frequency is the hertz.
ELECIRD-FLOCCl.LATION OF RIYER WATER B-11

APPE'IIDIX B GLOS~ARY OF TER,IS :\NO SYMBOL~
half cell
A somewhat archaic te1m, indicating a structure that contains an electrode and the surrounding electrolyte. Electrochemical cells are often divided, containing two separate electrolytes (one surrounding each electrode, e.g., the Daniell cell). In these cases the electrode and its electrolyte can be considered "half' of the cell. Corrunercially available reference electrodes can be considered "half cells."
half-cell reaction
A not incorrect, but somewhat archaic te1m for electrode reaction.
ion
An electrically charged chemical particle (atom, molecule, or molecule fragment). "Anions" are negatively charged (contain excess electron(s), and "cations" are positively charged (deficient in electron(s)).
ionic current
Electrical current with ions as charge carriers.
meta] deposition/dissolution
A class of electrode reactions involving oxidation/reduction of a solid metal and its dissolved ion. E.g., if a copper metal rod is irrunersed in a copper sulfate solution, the copper cations can be cathodically reduced to copper metal, or the copper metal can be anodically oxidized to copper ions. Compare with a redox reaction where both the oxidized and the reduced species are in solution. The terms "electrodeposition" and "electrodissolution" are often used to describe these reactions. These reactions are used in many technologies, such as electroplating, electrowinning, electrorefining, and production of metal powders. And also in electro gravimetry.
mol The measurement unit and symbol of mole.
molecular weight
The weight of a molecule of a compound that may be calculated as the sum of the atomic weights of its constituent atoms.
molecule
The smallest physical unit of a substance that retains all the physical and chemical properties of that substance. It may consist of a single atom or of a group of atoms bonded together chemically.
Nernst equation
An equation defining the equilibrium potential of an electrode. The potential is the sum of the standard electrode potential and a correction term for the deviation from unit concentrations of the reactant and the product of the electrode reaction in the solution; if the "reduced" form is a metal, a pure metal (not alloyed with other metals) is considered to be at unit concentration.
c E = E 0 + Slog~
C red
The correction term is the product of the "Nemst slope" and the logarithm of the ratio of the concentrations (strictly speaking, activities) of the oxidized species and the reduced species. At room temperature, the Nemst slope is 0.05916 volt divided by the number of electrons transferred during the reaction. E.g., for a simple metal deposition/dissolution reaction the slope is 0.05916 for a single charged metal cation, 0.00296 volt for a double charged ion, etc.
ELECTRO-Fl.OCCliLA riO 'I OF RIVER W \ TE!t B-12

APPENOI'\ B GLOSSARY OF TERMS A D SYMBOLS
normal electrode potential
Alternative name for standard electrode potential.
n Symbol and abbreviation of ohm. (The symbol is the "Greek capital omega" letter, some browsers unfortunately do not support this.)
ohm
Measurement unit of the electrical resistance. Symbol : "Q"- (The symbol IS the "Greek capital omega" letter, some browsers unfortunately do not support this.)
Ohm's Law
The relation amongst the current flowing through a resistor and the potential difference between the two ends of the resistor. The potential difference is equal to the product of the current and the resistance (volt= ampere times ohm).
V =IR
ohmic loss
The total ir drop in an electrochemical cell, including the 1r drop in the solution between the electrodes and in any separator.
ohmmeter
Instrument used for the measurement of electrical resistance.
osmotic pressure
The pressure that develops in a solution separated from a solvent by a membrane permeable only to the solvent.
overcharging
During the charging of a rechargeable battery, eventually enough electrical charge is supplied to convert all the active material stored in the electrodes. If charging continues, the battery is said to be "overcharged." It very much depends on the battery system whether overcharging is detrimental to the battery or not.
oxidation/reduction
In a narrow sense, oxidation means the reaction of a substance with oxygen. Hydrogen can react with oxygen to be oxidized to water. Hydrocarbon fuels (gasoline, natural gas, etc) can react with oxygen to be oxidized to carbon dioxide and water. Iron can react with oxygen to be oxidized to "rust." During oxidation, the oxygen itself is being reduced. Oxidation and reduction always occur simultaneously.
During these reactions, electrons are transferred from the substance that is oxidized to the oxygen. In a wider sense, all electron-transfer reactions are considered oxidation/reduction. The substance gaining electrons ("oxidizing agent" or "oxidant") is oxidizing the substance that is losing electrons ("reducing agent" or "reductant"). In the process, the "oxidizing agent" is itself reduced by the "reducing agent." Consequently, the reduction process is sometimes called "electronation," and the oxidation process is called "de-electronation."
ELECrRO-FLOCCUL.\TION OF RJ\ ER WATER B- 13

API'E~DI'\ B GLO"i~ARY OF TERM~ AND SYMBOL~
oxidation/reduction potential
A measure of the oxidation/reduction capability of a solution. It is a redox potential measured with an inert electrode. An oxidizing solution (e.g., one saturated with oxygen) has a more positive potential than a reducing solution (e.g., one saturated with hydrogen).
passivation The formation of a thin adherent film or layer on the surface of a metal or mineral that acts as a protective coating to protect the underlying surface from further chemical reaction, such as corrosion, electro-dissolution, or dissolution.
pH A measure of the acidity/alkalinity (basicity) of a solution. The pH scale extends from 0 to 14 (in aqueous solutions at room temperature). A pH value of7 indicates a neutral (neither acidic nor basic) solution. A pH value of less than 7 indicates an acidic solution, the acidity increases with decreasing pH value. A pH value of more than 7 indicates a basic solution, the basicity or alkalinity increases with increasing pH value.
The pH of a solution is equal to the negative, ten-based logarithm of the activity of the hydrogen ions in the solution. Neutral water dissociates into equal amounts of hydrogen (H+) cations and hydroxyl (OR) anions. As the product of the concentrations (activities) of the two ions is always a constant 10·14
, water has a pH of 7. In acidic solutions the hydrogen ions are in excess, while in basic solutions the hydroxyl ions are in excess.
pH electrode
An electrode assembly with a pH dependent potential. A variety of different electrodes can be used for this purpose, the most common one is the glass electrode.
pH meter Volt meter that measures the electrical potential difference between a pH electrode and a reference electrode and displays the result in terms of pH value of the sample solution in which they are immersed.
Precipitation Precipitation is the formation of a solid in a solution during a chemical reaction. This can occur when an insoluble substance is formed in the solution due to a reaction or when the solution has been supersaturated by a compound. In most situations, the solid forms ("falls") out of the solute phase, and sinks to the bottom of the solution (though it will float if it is less dense than the solvent, or form a suspension).
proton
See atomic structure.
Hydrogen ions are often called "protons." Hydrogen is the simplest atom, containing only a proton and an electron. Consequently, a hydrogen cation is indeed a proton. However, this is a simplification because ions are almost always solvated.
(electrode) reaction mechanism
The totality of all the elementary reaction steps occurring in series or parallel that fully defines the overall electrode reaction.
Eu:rmo-FLOCTl L.\TIOI\ OF Rt\ ER \\ ATER B-14

API'EI\01:>. B GLO'i~.\R\ OF TER .\IS .\ NO 'VMBOLS
redox reaction
A class of electrode reactions involving oxidation/reduction of two dissolved species. E.g. , iron metal can exist in solution as a doubly positively charged ("ferrous") ion or a triply positively charged ("ferric") ion. Such a system is often called a "redox couple," such as the "ferrous/ferric" couple. The ferric ions can be cathodically reduced to ferrous ions, or the ferrous ions can be anodically oxidized to ferric ions. With these reactions, an inert electrode is used that does not take part in any reactions under the conditions of the oxidation/reduction of the ions. This electrode then acts only as a source or sink of electrons; examples are: carbon, graphite, platinum, gold. Compare with a metal deposition/dissolution reaction where one of the reacting species is a solid metal and the other species is in solution.
reducing agent
A substance that is affecting reduction by donating electrons to another substance. See oxidation/reduction. Also called "reductant."
resistor
An electrical circuit element with a fixed resistivity. under pressure. During discharging, the same cell is used as a fuel cell and the gases are recombined to produce water and electricity.
solubility The maximum amount of a species that can be dissolved in a given solvent. It is usually expressed as the maximum acmevable concentration. A solution is called "saturated" if it contains the maximum dissolvable amount.
standard cell
A non-rechargeable cell (battery) whose emf is accurately known and remains sufficiently constant. It is less and less used nowadays because the availability of electronic voltage standards.
volt
Measurement unit of the electrical potential. Symbol: "V". A term named in honour of Alessandro Volta.
voltage
A term sometimes used interchangeably with electrical potential. See also cell voltage.
voltmeter
Instrument used for the measurement of electrical potential differences.
ELECTRO-FLOCCllL\TIO ' OF RIVER WATER B-15

APPI-."J>I\. C DIH Kll', W\I~R QU.-\LITY l i iJ>ELI-;E:-
Appendix C
Drinking water quality guidelines
El FCl RO-Fl OCCUL,\ 110 01 RI\'~. R WA I El{ C-1

Colour Background Information
Introduction
Occurrence
Interactions
Measurement
Data
Interpretation
Treatment
Options
Domestic Water Use
True colour is the colour of a water sample from which the turbidity has been removed. Apparent colour includes the colour and appearance of suspended matter. True colour is described by the dominant wavelength or hue together with the degree of brightness or luminance and the saturation or purity of the colour. Colour in domestic water may be due to natural sources of coloured organic matter like humic and fulvic acids. Colour is strongly influenced by the presence of iron, manganese and certain other metals either as natural impurities or corrosion products.
Colour in water can be of natural mineral or origin or it may be as an industrial result of effluents containing soluble coloured materials (discharges from pulp and paper, and textile industries). The presence of iron and manganese can cause a natural brown discolouration in water. Iron and manganese are also found in association with humic acids or lignins. Colloidal matter present in water is often associated with colour. The persistence of colour in water depends on the causative substance(s). The reddish-brown colour from dissolved iron complexes is generally readily removed in conventional water treatment processes. Colour from dissolved organic dyes may be more persistent.
The apparent colour of water is strongly related to turbidity. Most natural causes of colour
are associated with the presence of dissolved organic matter, and iron and manganese compounds. Other metal ions may on occasion give rise to colour in water.
Colour may be measured either in Pt-Co colour units, using the visual colour comparison method, or by spectrophotometric methods, where the colour characteristics are reported as:
Dominant wavelength (nm) Hue (colour) Luminance(%) Purity(%)
Mean values should be used to compare with the criteria given.
Colour in water supplies is caused by a variety of agents. Different methods may therefore be required to remove colour. These include:
Filtration of the water through a slow sand filter. The biologically active surface layer on the filter removes colour by metabolising the organic material in the water.
Some forms of colour in water are amenable to removal by coagulation, flocculation, clarification (by settlement or flotation) and filtration. A further activated carbon filtration step may be beneficial.
2nd Edition. 1996 (1st Issue) Colour: Page I of2
48
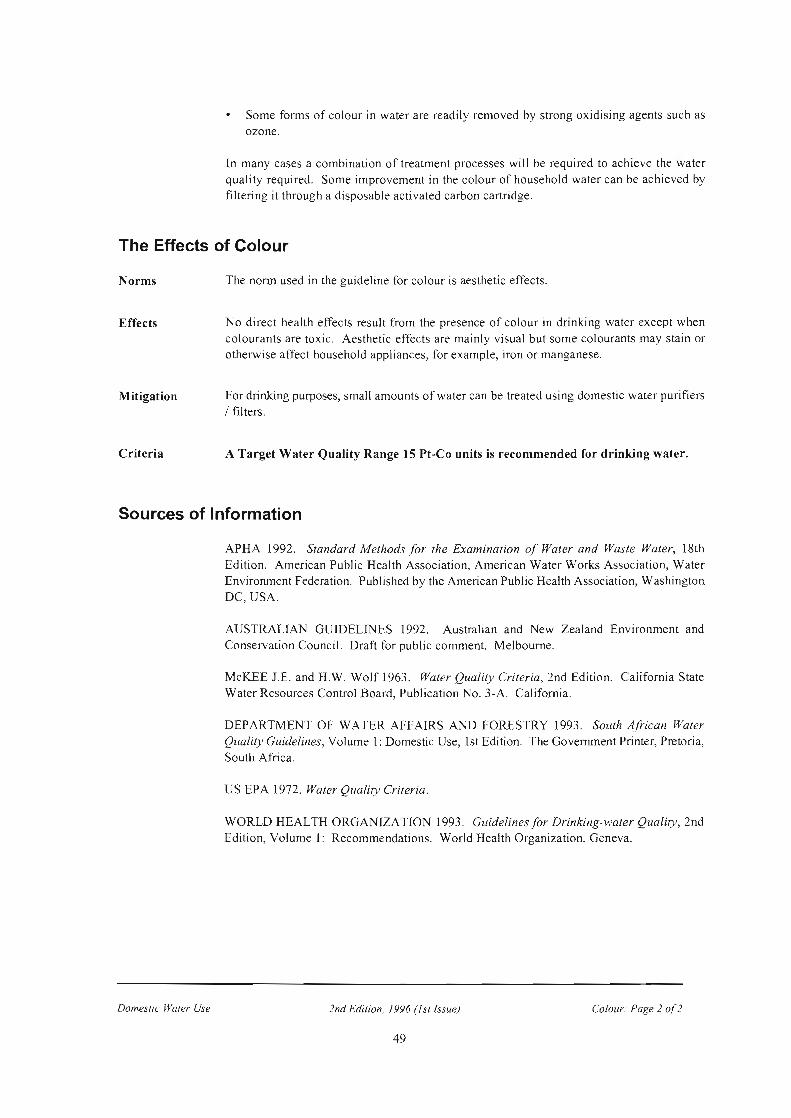
Some fonns of colour in water are readily removed by strong oxidising agents such as ozone.
In many cases a combination of treatment processes will be required to achieve the water quality required . Some improvement in the colour of household water can be achieved by filtering it through a disposable activated carbon cartridge.
The Effects of Colour
Norms
Effects
Mitigation
Criteria
The nonn used in the guideline for colour is aesthetic effects.
No direct health effects result from the presence of colour in drinking water except when colourants are toxic. Aesthetic effects are mainly visual but some colourants may stain or otherwise affect household appliances, for example, iron or manganese.
For drinking purposes, small amounts of water can be treated using domestic water purifiers I filters.
A Target Water Quality Range 15 Pt-Co units is recommended for drinking water.
Sources of Information
Domestic Water Use
APHA 1992. Standard Methods for the Examination of Water and Waste Water, 18th Edition. American Public Health Association, American Water Works Association, Water Environment Federation. Published by the American Public Health Association, Washington DC, USA.
AUSTRALIAN GUIDELINES 1992. Australian and New Zealand Environment and Conservation Council. Draft for public comment. Melbourne.
McKEE J.E. and H .W. Wolf 1963. Water Quality Criteria, 2nd Edition. California State Water Resources Control Board, Publication No. 3-A. California.
DEPARTMENT OF WATER AFFAIRS AND FORESTRY !993. South African Water Quality Guidelines, Volume 1: Domestic Use, 1st Edition. The Government Printer, Pretoria, South Africa.
US EPA 1972. Water Quality Criteria.
WORLD HEALTH ORGANIZATION 1993. Guidelines for Drinking-water Quality, 2nd Edition, Volume 1: Recommendations. World Health Organization, Geneva.
2nd Edition, 1996 (I st Issue) Colour: Page 2 of 2
49

Iron Background Information
Introduction
Occurrence
Interactions
Measurement
Domestic Water Use
Pure iron is silvery in colour but usually appears as greyish black or brown deposits as a result of oxidation. Iron is found in three oxidation states, namely, 0, II and III of which the III oxidation state is the most common. In water, iron can be present as dissolved ferric iron, Fe(Ill), as ferrous iron, Fe(II) or as suspended iron hydroxides. Biologically iron is an essential micronutrient required by all living organisms. High concentrations of iron are predominantly an aesthetic concern since ferrous salts are unstable under the pH conditions prevailing in drinking water and precipitate as insoluble ferric hydroxide, which settles out as a rust-coloured silt.
Iron is the fourth most abundant element and constitutes five percent of the earth's crust. It is found in many minerals, the most common of which is haematite (Fep3) , widely used as an iron ore for metallurgical purposes. Other important iron minerals are pyrite (FeS2),
siderite (FeC03), magnetite (F~ q ), goethite (F~ q .Ji 0) and limonite (2F~ 9 .3lj 0), as well as a number of mixed ores, such as chalcopyrite (CuFeS2) and arsenopyrite (FeAsS). Pyrite is often associated with coal formations and iron may occasionally also be found in the elemental form, either as terrestrial iron or as meteoric iron. The reddish colour of soil is due to iron, the median concentration in soil being 4.0 % (m/m) . Typically, the concentration of dissolved iron in:
unpolluted surface water, is in the range of 0.001 - 0.5 mg/•; and sea water, is approximately 0.002 mg/•.
The speciation of iron is strongly related to the pH and the redox potential of the water. At neutral or alkaline pH, under oxidising conditions, the dissolved iron concentration is usually in the j..l.g/• range but under reducing conditions, soluble ferrous iron may be formed and substantially higher concentrations in the mg/• range may be encountered. Where marked acidification of the water occurs and the pH is less than 3.5, the dissolved iron concentration can be several hundred mg/•, as may be the case with acid mine drainage.
There is a natural cycling of iron between the dissolved and precipitated phases at the water sediment interface, in which micro-organisms, particularly iron bacteria such as Gallionella spp. play a significant role.
The concentration of dissolved iron in water is dependent on the pH, redox potential,
turbidity, suspended matter, the concentration of aluminium and the occurrence of
several heavy metals, notably manganese. The natural cycling of iron may also result in the
coprecipitation of trace metals such as arsenic, copper, cadmium and lead.
The criteria are given in terms of the total iron concentration, expressed in units of mg/•. The reference method for the determination of iron is by atomic absorption spectrometry (AAS), using an air-acetylene flame. Measurement of the total iron concentration requires acidification followed by filtration prior to AAS analysis. Where other methods are used, their characteristics relative to the reference method should be known .
2nd Edition, 1996 (/st!ssue) Iron.· Page I o/4
89

Data Interpretation
Treatment Options
Mean values should be used to compare with the criteria given. Turbidity and pH must also be taken into account in the interpretation of iron concentrations.
Iron in water supplies is most conveniently removed by applying conventional water treatment processes of coagulation with lime or alum, followed by settlement and filtration. Iron can also be removed from water using an oxidising process which will convert the iron
into an insoluble hydroxide or hydrated oxide, removable by filtration. The following treatment approaches are used:
The water can be aerated by devices such as fountains, cascades or mechanical aeration;
The addition of lime to the water will raise the pH and facilitate the oxidation of iron by air in the water, followed by settlement of the iron oxide;
The water can also be chemically oxidised by dosing with chlorine, hydrogen peroxide, ozone or other strong oxidants. On an industrial scale chlorine is commonly used as the chemical oxidant. Post-treatment, high levels of residual chlorine should be avoided since this may interfere with the quality of the water.
Removal of iron can be achieved on a household scale by cascading the water tlu·ough the air and allowing the iron oxide particles to settle. On an industrial scale the process usually needs to be more closely controlled and monitored because the consequences of incomplete treatment may be severe.
For the optimisation of treatment processes it is important to determine both the total and dissolved iron species and their relative concentrations.
The Effects of Iron
Norms
Effects
Domestic Water Use
The norms used in the guideline are based on aesthetic and health effects. The major effects of the presence of iron in domestic water are aesthetic, but in some cases distribution systems may also be affected. Health effects may occur at extremely high concentrations.
Excessive ingestion of iron may result in haemoclu·omatosis, wherein tissue damage occurs as a consequence of iron accumulation. Haemochromatosis generally results from prolonged consumption of acid foodstuffs cooked in kitchenware made of iron. Poisoning is rare since excessively high concentrations of iron do not occur naturally in water. The extreme unpalatability of such water would probably prevent consumption. Further, iron in the distribution system promotes proliferation of iron-oxidising bacteria which ox idise ferrous iron to ferric iron, and manifest as s limy coatings in plumbing when the iron concentration of the water in the distribution system approaches 0.3 mg/•. Effects are predominantly aesthetic, such as the staining of enamelled surfaces of baths, hand basins and lavatory c isterns/bowls and laundry . Iron causes discolouration of water supplies when present at low concentrations in association with aluminium. Iron that settles out in distribution systems gradually reduces the flow rate of water. The only associated health effects are those that could arise from the presence of microbial deposits on internal surfaces of plumbing.
2nd Edition, !996 (Istlssue} Iron. Page 2 of4
90
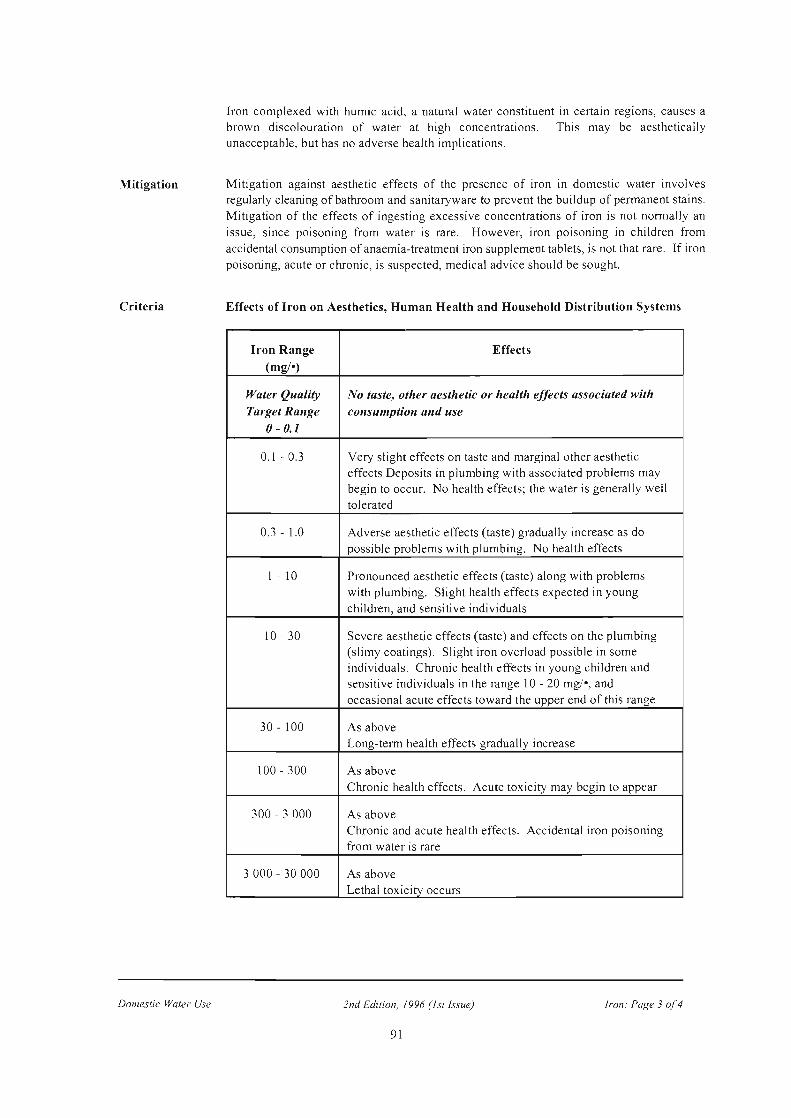
Mitigation
Criteria
Domestic Water Use
Iron complexed with humic acid, a natural water constituent in certain regions, causes a brown discolouration of water at high concentrations. This may be aesthetically unacceptable, but has no adverse health implications.
Mitigation against aesthetic effects of the presence of iron in domestic water involves regularly cleaning of bathroom and sanitaryware to prevent the buildup of permanent stains. Mitigation of the effects of ingesting excessive concentrations of iron is not normally an issue, since poisoning from water is rare. However, iron poisoning in children from accidental consumption of anaemia-treatment iron supplement tablets, is not that rare. If iron poisoning, acute or chronic, is suspected, medical advice should be sought.
Effects of Iron on Aesthetics, Human Health and Household Distribution Systems
Iron Range Effects (mg/•)
Water Quality No taste, other aesthetic or health effects associated with Target Range consumption and use
0-0.1
0.1 - 0.3 Very slight effects on taste and marginal other aesthetic effects Deposits in plumbing with associated problems may begin to occur. No health effects; the water is generally well
tolerated
0.3 - 1.0 Adverse aesthetic effects (taste) gradually increase as do possible problems with plumbing. No health effects
1 - 10 Pronounced aesthetic effects (taste) along with problems with plumbing. Slight health effects expected in young children, and sensitive individuals
10- 30 Severe aesthetic effects (taste) and effects on the plumbing (slimy coatings). Slight iron overload possible in some individuals. Chronic health effects in young children and sensitive individuals in the range 10-20 mg/•, and occasional acute effects toward the upper end of this range
30 - 100 As above Long-term health effects gradually increase
100-300 As above Chronic health effects. Acute toxicity may begin to appear
300 - 3 000 As above Chronic and acute health effects. Accidental iron poisoning from water is rare
3 000- 30 000 As above Lethal toxicity occurs
2nd Edition. 1996 (I stlssue) Iron: Page 3 of 4
91

Sources of Information
Domestic Water Use
APHA 1989. Standard Methods for the Examination of Water and Waste Water, 17th Edition. American Public Health Association, American Water Works Association, Water Pollution Control Federation. Published by the American Public Health Association, Washington DC, USA.
AUCAMP P.J. and F.S. Vi viers 1990. Water Quality Criteria in South Africa. Technology SA, June 1990, 21-30.
BOWEN H.J.M. 1979. Environmental Chemistry of the Elements. Academic Press, London.
CANADIAN WATER QUALITY GUIDELINES 1987. Canadian Water Quality Guidelines, Canadian Council of Resource and Environment Ministers, Ottowa.
DEPARTMENT OF WATER AFFAIRS AND FORESTRY 1993. South African Water Quality Guidelines, Volume I, I st Edition. The Government Printer, Pretoria, South Africa.
FORD W.E. and E.S. Dana 1963. A Textbook of Mineralogy, 4th Edition. John Wiley & Sons Inc., New York.
KEMPSTER P.L. and R. Smith 1985. Proposed Aesthetic/Physical and Inorganic Drinkingwater Criteria for the Republic of the South Africa. Research Report No. 628, National Institute for Water Research, CSIR, Pretoria, South Africa.
KEMPSTER P.L. and H.R. van Vliet 1991 . Water Quality Fitness for Use Curves for Domestic Water. Draft Internal Report, Hydrological Research Institute, Department of Water Affairs and Forestry, Pretoria, South Africa.
McKEE J.E. and H.W. Wolf 1963. Water Quality Criteria, 2nd Edition. California State Water Resources Control Board, Publication No. 3-A. California.
WEAST R.C. 1979. CRC Handbook of Chemistry and Physics, 60th Edition. CRC Press Inc., Boca Raton, Florida, USA.
WORLD HEALTH ORGANIZATION 1984. Guidelines for Drinking Water Quality, Volume 2: Health Criteria and Other Supporting Information. World Health Organization, Geneva.
WORLD HEALTH ORGANIZATION 1993. Guidelines for Drinking Water Quality, 2nd Edition, Volume 1: Recommendations. World Health Organization, Geneva.
2nd Edition, 1996 (1st Issue) Iron: Page 4 of 4
92

pH Tentative guideline
Background Information
Introduction
Occurrence
Interactions
Measurement
Domestic Water Use
The pH of a solution is the negative logarithm to the base ten of the hydrogen IOn concentration, given by the expression:
where [H+] is the hydrogen ion concentration.
At pH less than 7 water is acidic, while at pH greater than 7 water is a lkaline.
The pH of natural waters is the result of complex acid-base equilibria of various dissolved compounds, mainly the carbon dioxide-bicarbonate-carbonate equilibrium system, which is also affected by temperature. Conditions which favour production of hydrogen ions result in a lowering of pH, referred to as an acidification process. Alternatively, conditions which favour neutralisation of hydrogen ions result in an increase in pH, referred to as an alkalinization process. The pH of water does not indicate the ability to neutralise additions of acids or bases without appreciable change. This characteristic, termed buffering capacity, is controlled by the amounts of acidity and alkalinity present.
The pH of a water does not have direct health consequences except at extremes. The adverse effects of pH result from the solubilisation of toxic heavy metals and the protonation or deprotonation of other ions. The pH of most raw water sources lies within the range of 6.5 - 8.5. The main significance of pH in domestic water supplies relates to its effects on water treatment.
The geology and geochemistry of the rocks and soils of a particular catchment area affect the pH and alkalinity of the water. The pH of most raw waters lies in the range of 6.5 - 8.5.
Biological and anthropogenic activities such as nutrient cycling and indus trial effluent discharge respectively can give rise to pH fluctuations. Notably, acid mine drainage can have a marked effect on the pH. Further, acid-forming substances, such as oxides of sulphur and nitrogen released into the atmosphere may ultimately alter the acid-base equilibria in natural waters and result in a reduced acid-neutralising capacity and hence lowering the pH.
The pH of natural waters is influenced by various factors and processes, including temperature, discharge of effluents, acid mine drainage, acidic precipitation, runoff, microbial activity and decay processes.
Water pH is measured electrometrically using a pH meter. The pH meter should be calibrated against standard buffer solutions of known pH prior to measurement of a sample. Fresh samples should be used to determine pH. The temperature at which measurements are made should always be reported, since pH measurement is influenced by temperature. Errors may be caused by the presence of sodium at pH values greater than l 0 .
2nd Edition, 1996 (1st issue) pH. Page I of 4
116

Data Interpretation
Treatment Options
Use of individual or mean values to compare with the criteria given depends on the application. Normally, individual values are used but the pH should always be interpreted in relation to the full analysis of the water sample and its use. For example, if the pH is acidic, the water should be analysed for metal constituents, which may have dissolved from the distribution system.
The main significance of pH in domestic water supplies relates to its effects on water treatment processes. The pH of water can be adjusted up or down by the addition of an alkali or an acid.
Commonly used alkaline reagents are sodium carbonate, sodium hydroxide and lime. Acidic reagents commonly used are carbon dioxide (a gas which forms carbonic acid in water), hydrochloric acid or sulphuric acid. The reagent is usually added in dilute form using a dosing pump controlled by a pH monitor.
The adjustment of pH in water will inevitably increase the salinity of the water by adding ions such as sodium, carbonate, hydroxyl, sulphate or chloride. Reagents should be chosen to minimise secondary effects. For certain purposes the pH of the water will need to be stabilised to within a chosen range by the addition of buffering reagents.
The handling of acids and alkalis is often hazardous requiring special precautions in the form of protective clothing and in materials used in the manufacture of the dosing equipment.
The Effects of pH
Norms
Effects
Mitigation
Domestic Water Use
The norms used in the guideline for pH are based on human health and aesthetic effects.
The selection of raw water as a drinking water source is never based solely on pH. Danger to health would result primarily from the presence of metal ions, which are more likely to influence selection than the pH value. A direct relationship between the pH of drinking water and human health effects is difficult, if not impossible to establish since pH is very closely associated with other aspects of water quality.
The taste of water, its corrosivity and the solubility and speciation of metal ions are all influenced by pH. At low pH water may taste sour, while at high pH water tastes bitter or soapy. The potential toxicity of metal ions and chemicals which can be protonated, for example ammonia, is influenced by pH. Changes in pH affect the degree of dissociation of weak acids and bases. This effect is of special importance because the toxicity of many compounds is affected by their degree of dissociation.
Corrosion in the water supply system is a major source of metal contamination in drinking
water. Metals that have the potential for causing such contamination are lead, copper and
zinc. Lead is subject to corrosion at a pH higher than 12. Corrosion of cadmium is only significant below pH 6. Other metals which are frequently used in household plumbing and that may be affected by pH are copper and zinc.
See Treatment Options.
2nd Edition, /996 (lstlssue) p H. Page 2 of 4
117

Criteria Effects of pH on Aesthetics and Human Health
pH Range Effects (pH units)
< 4.0 Severe danger of health effects due to dissolved toxic metal ions. Water tastes sour
4.0- 6.0 Toxic effects associated with dissolved metals, including lead, are likely to occur at a pH of less than 6 Water tastes slightly sour
Target Water Quality No significant effects on health due to toxicity of dissolved Range metal ions and protonated species, or on taste are expected.
6.0- 9.0 Metal ions (except manganese) are unlikely to dissolve readily unless complexing ions or agents are present. Slight metal solubility may occur at the extremes of this range. Aluminium solubility begins to increase at pH 6, and amphoteric oxides may begin to dissolve at a pH of greater than 8.5. Very slight effects on taste may be noticed on occasion
9.0 - 11.0 Probability of toxic effects associated with deprotonated species (for example, ammonium deprotonating to form ammonia) increases sharply. Water tastes bitter at a pH of greater than 9
> 11.0 Severe danger of health effects due to deprotonated species Water tastes soapy at a pH of greater than II
Note:
The above criteria indicate possible health effects in the general population and the descriptions given for health effects should be considered tentative. The criteria are tentative since pH does not exert direct health effects, but may exert indirect heal th effects via metal solubility.
Sources of Information
Domestic Water Use
AUCAMP P.J. and F.S. Vivier 1990. Water Quality Criteria in South Africa. Technology SA, June 1990, 21-30.
CANADIAN WATER QUALITY GUIDELINES 1987. Canadian Water Quality Guidelines. Canadian Council of Resource and Environment Ministers, Ottowa.
KEMPSTER P.L. and R . Smith, 1985. Proposed Aesthetic/Physical and Inorganic Drinking-water Criteria for the Republic of South Africa. Research Report No. 628, National Institute for Water Research, CSIR, Pretoria, South Africa.
2nd Edition, 1996 (Is/Issue) pH· Page 3 of 4
11 8

Domestic Water Use
KEMPSTER P .L. and H.R. van Vliet 1991 . Water Quality Fitness for Use Curves for Domestic Water. Draft Internal Report, Hydrological Research Institute, Department of Water Affairs and Forestry, Pretoria, South Africa.
McKEE J.E. and H.W . Wolf 1963. Water Quality Criteria, 2nd Edition. California State Water Resources Control Board, Publication No. 3-A. California.
SA WATERQUALJTYGUIDELINES 1993. Volume l: 1stEdition. DepartmentofWater Affairs and Forestry. The Government Printer, Pretoria, South Africa.
US EPA 1986. Quality Criteria for Water 1986. EPA 440/5-86-001. United States Environmental Protection Agency, Washington DC, USA.
WORLDHEALTHORGANIZATION 1984. GuidelinesforDrinking Water Quality, Volume 2: Health Criteria and Other Supporting Information. World Health Organization, Geneva.
WORLD HEALTH ORGANIZATION 1993. Guidelines for Drinking Water Quality, 2nd Edition, Volume I: Recommendations . World Health Organization, Geneva.
2nd Edition, 1996 {lst lssue) pH: Page 4 of 4
11 9

Total Dissolved Solids Background Information
Introduction
Occurrence
Interactions
Measurement
Domestic Water Use
The total dissolved solids (TDS) is a measure of the amount of various inorganic salts dissolved in water. The TDS concentration is directly proportional to the electrical conductivity (EC) of water. Since EC is much easier to measure than TDS, it is routinely used as an estimate of the TDS concentration.
Electrical conductivity (EC) is a measure of the ability of water to conduct an electrical current. This ability is a result of the presence of ions in water such as carbonate, bicarbonate, chloride, sulphate, nitrate, sodium, potassium, calcium and magnesium, all of which carry an electrical charge. Most organic compounds dissol ved in water do not dissociate into ions, consequently they do not affect the EC.
Virtually all natural waters contain varying concentrations of TDS as a consequence of the dissolution of minerals in rocks, soils and decomposing plant material and the TDS of natural waters is therefore often dependent on the characteristics of the geological formations the water was, or is, in contact with.
Typically, the concentration of the TDS in
rainwater is low, generally less than I mg TDS/•; water in contact with granite, siliceous sand and well-leached soils is generally low, less than 30 mg TDS/•; water in contact with precambrian shield areas is generally below 65 mg TDS/•; and water in contact with palaeozoic and mesozoic sedimentary rock formations is generally in the range of 195 - I I 00 mg TDS/•.
TDS are likely to accumulate in water moving downstream because salts are continuously being added through natural and manmade processes while very little of it is removed by precipitation or natural processes. Domestic and industrial effluent discharges and surface runoff from urban, industrial and cultivated areas are examples of the types of return flows that may contribute to increased TDS concentrations .
High TDS concentrations in surface water are also caused by evaporation in water bodies which are isolated from natural drainage systems. The saline pans in the central parts of South Africa are such water bodies.
The properties of the TDS are governed by the characteristics of the constituent inorganic salts dissolved in the water. As such, TDS is also closely related to other water quality
constituents such as the total hardness and the corrosion and scaling potential of water.
The criteria are given in terms ofTDS concentration in mg/•, as well as the equivalent EC, expressed in milli-Siemens per metre (mS/m), measured at, or corrected to a temperature of 25 •C.
The TDS concentration can be measured as
2nd Edition, 1996 (1st Issue) Total Dissolved Solids: Page I of 5
150
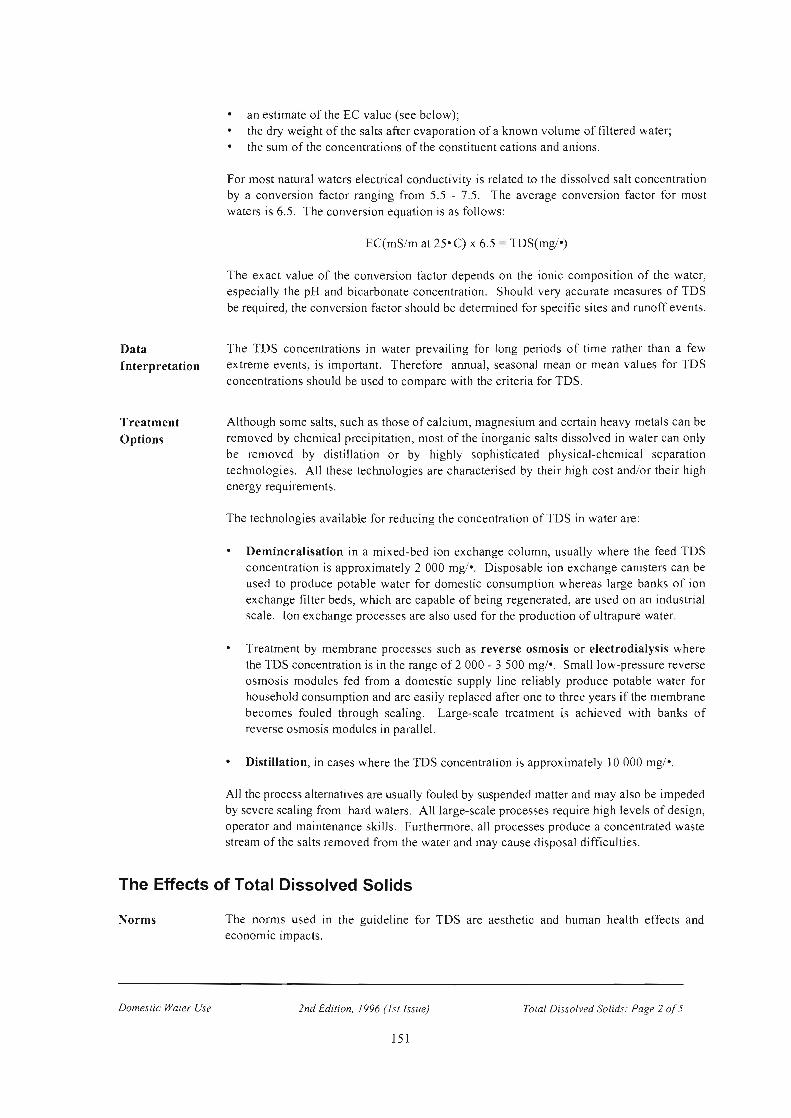
Data
Interpretation
Treatment
Options
an estimate of the EC value (see below); the dry weight of the salts after evaporation of a known volume of filtered water; the sum of the concentrations of the constituent cations and anions.
For most natural waters electrical conductivity is related to the dissolved salt concentration by a conversion factor ranging from 5.5 - 7.5. The average conversion factor for most waters is 6.5. The conversion equation is as follows:
EC(mS/m at 25• C) x 6.5 = TDS(mg/•)
The exact value of the conversion factor depends on the ionic composition of the water, especially the pH and bicarbonate concentration. Should very accurate measures of TDS be required, the conversion factor should be determined for specific sites and runoff events.
The TDS concentrations in water prevailing for long periods of time rather than a few extreme events, is important. Therefore annual, seasonal mean or mean values for TDS concentrations should be used to compare with the criteria for TDS.
Although some salts, such as those of calcium, magnesium and certain heavy meta ls can be removed by chemical precipitation, most of the inorganic salts dissolved in water can only be removed by distillation or by highly sophisticated physical-chemical separation technologies. All these technologies are characterised by their high cost and/or their high energy requirements.
The technologies available for reducing the concentration ofTDS in water are:
Demineralisation in a mixed-bed ion exchange column, usually where the feed TDS concentration is approximately 2 000 mgl•. Disposable ion exchange canisters can be used to produce potable water for domestic consumption whereas large banks of ion exchange filter beds, wh.ich are capable of being regenerated, are used on an industrial scale. Ion exchange processes are also used for the production of ultrapure water.
Treatment by membrane processes such as reverse osmosis or electrodialysis where the TDS concentration is in the range of 2 000 - 3 500 mg/•. Small low-pressure reverse osmosis modules fed from a domestic supply line reliably produce potable water for household consumption and are easily replaced after one to three years if the membrane becomes fouled through scaling. Large-scale treatment is achieved with banks of reverse osmosis modules in parallel.
Distillation, in cases where the TDS concentration is approximately 10 000 mgl•.
All the process alternatives are usually fouled by suspended matter and may also be impeded by severe scaling from hard waters. All large-scale processes require high levels of design, operator and maintenance skills. Furthermore, all processes produce a concentrated waste stream of the salts removed from the water and may cause disposal difficulties.
The Effects of Total Dissolved Solids
Norms
Domestic Water Use
The norms used in the guideline for TDS are aesthetic and human health effects and economic impacts.
2nd Edition, /996 (1st Issue) Total Dissolved Solids: Page 2 of 5
151

Effects
Mitigation
Domestic Water Use
Low concentrations of particularly calcium and magnesium salts have nutritional value, although water with an extremely low TDS concentration may be objectionable because of its flat, insipid taste. Health effects related to TDS are minimal at concentrations below 2 000 - 3 000 mg!• TDS. In contrast, high concentrations of salts impart an unpleasant taste to water and may also adversely affect the kidneys.
Some of the physiological effects which may be directly related to high concentrations of dissolved salts include:
laxative effects, mainly from sodium sulphate and magnesium sulphate, see sulphate; adverse effects of sodium on certain cardiac patients and hypertension sufferers;
effects of sodium on women with toxaemia associated with pregnancy; and some effects on kidney function.
Bathing and washing in water with excessively high concentrations of TDS may give rise to excessive skin dryness and hence discomfort. Soap may lather poorly or with difficulty,
see calcium and magnesium.
Chemical corrosion may occur when the alkalinity, i.e. the concentrations of carbonate, bicarbonate and hydroxide are low, the TDS concentration is high, particularly the concentrations of chloride and sulphate, and the pH is low. Scaling may also occur, see
corrosion, calcium, magnesium and total hardness. Excessively high concentrations of TDS may adversely affect plumbing and appliances and hence the maintenance and replacement requirements.
Measures to mitigate the effects of having consumed water containing a high TDS concentration are unnecessary since salts are rapidly eliminated in the urine once consumption of such water has been discontinued. Any electrolyte imbalances that may result can be restored by consuming water with more acceptable levels of dissolved salts.
Water with high concentrations of TDS may be diluted with other sources, e.g. rain water.
2nd Edition, 1996 (lstlssue) Total Dissolved Solids· Page 3 of 5
152

Modifications EC is usually measured at 20 • C for domestic water use, but in view of the climate of South Africa, EC values should be measured at 25 • C. Since measurement of EC is quick and simple, it is suggested that the standard measurement of EC with the application of a conversion factor to a TDS measurement be adopted.
Sources of Information
Domestic Water Use
APHA 1989. Standard Methods for the Examination of Water and Waste Water, 17th Edition. American Public Health Association, American Water Works Association, Water Pollution Control Federation. Published by the American Public Health Association, Washington DC, USA.
AUCAMP P.J. and F.S. Vivier 1990. Water Quality Criteria in South Africa. Technology SA, June 1990,21-30.
KEMPSTER P .L. and H.R. van VI iet 1991. Water Quality Fitness for Use Curves for Domestic Water. Draft Internal Report, Hydrological Research Institute, Department of Water Affairs and Forestry, Pretoria, South Africa.
KEMPSTER P.L. and R. Smith 1985. Proposed Aesthetic/Physical and Inorganic Drinkingwater Criteria for the Republic of South Africa. Research Report No. 628, National Institute for Water Research, CSIR, Pretoria, South Africa.
US EPA 1986. Quality Criteria for Water 1986. EPA 440/5-86-001. United States Environmental Protection Agency, Washington DC, USA.
CANADIAN GUIDELINES 1987. Canadian Water Quality Guidelines. Prepared by the Task Force on Water Quality Guidelines of the Canadian Council of Resource and Environmental Engineers. Canada.
DEPARTMENT OF WATER AFFAIRS AND FORESTRY 1993. South African Water Quality Guidelines. Volume 1: Domestic Use, 1st Edition, The Government Printer, Pretoria, South Africa.
HART B.T. 1974. A Compilation of Australian Water Quality Criteria. A WRC Technical Paper no 7. Australian Government Publishing Service, Canberra, Australia.
McKEE J.E. and H.W. Wolf 1963. Water Quality Criteria, 2nd Edition. California State Water Resources Control Board, Publication No. 3-A. California.
WORLD HEALTH ORGANIZATION 1984. Guidelines for Drinking Water Quality. World Health Organisation, Geneva, Switzerland.
2nd Edition, /996 (lstlssue) Total Dissolved Solids. Page 5 of 5
!54

Turbidity Background Information
Introduction
Occurrence
Interactions
Measurement
Data Interpretation
Treatment Options
Domestic Water Use
Turbidity is a measure of the light-scattering ability of water and is indicative of the concentration of suspended matter in water. The turbidity of water is also related to clarity,
a measure of the transparency of water and settleable material, which refers to suspended matter which settles after a defined time period as opposed to that which remains in suspension.
Micro-organisms are often associated with turbidity, hence low turbidity minimises the potential for transmission of infectious diseases. The probability of the presence of carcinogenic asbestos fibres is also reduced under conditions of low turbidity . Turbidity also affects the aesthetic quality of water.
Turbidity in water is caused by the presence of suspended matter which usually consists of a mixture of inorganic matter, such as clay and soil particles, and organic matter. The latter can be both living matter such as micro-organisms and non-living matter such as dead algal cells. The turbidity of raw water can range from less than one nephelometric turbidity unit (NTU) in very clear water, to over 1 000 NTU in turbid, muddy water.
Soil particles constitute the major part of the suspended matter contributing to the turbidity in most natural waters. Discharge of sewage and other wastes can contribute significantly to turbidity.
Turbidity is strongly associated with apparent water colour. The relationship between
turbidity, taste and odour of raw and treated water has long been recognised. However, all these constituents may also be present in the absence of excessive turbidity.
The criteria refer to turbidity measured in nephelometric turbidity units (NTU). A nephelometric turbidimeter is used for the measurement of turbidi ty . Turbidity should be determined on the day of sample collection. If necessary, samples may be stored in the dark for 24 hours, after which irreversible changes in turbidity occur. Samples must be shaken vigorously before examination.
Single-sample values should be used to compare with the criteria given and should be interpreted as maximal values, not to be exceeded. Turbidity should also be interpreted in
conjunction with the suspended solids concentration and content .
The settleable fraction of the suspended matter in water will tend to gradually settle to the bottom where the water is not disturbed. However, the smaller particles and colloidal fraction do not settle out and are kept in suspension by Brownian motion, as well as by mutual repulsion of the like-electrical charges which are often presen t on the surfaces of the suspended matter. When a flocculant is added to a water, the electrical charges are neutralised and the particles cohere and settle out.
Removal of turbidity from domestic or industrial water normally requires an effective coagulation and flocculation process following settlement or deep-bed or multimedia filtration, if the particles involved are colloidal in nature.
2nd Edition, 1996 (l st1ssue) Turbidity: Page 1 of4
158

Coagulants like aluminium sulphate or ferric chloride are conventionally used, with small doses of polyelectrolytes added to assist in flocculation. With many waters, small doses of polyelectrolytes alone may be sufficient to promote flocculation of the particles for removal by settlement and filtration .
Silica sand filters are most commonly used in large-scale treatment plants. Multimedia filters of anthracite and garnet are also used, even though there is a growing tendency to use membrane processes such as microfiltration or ultrafiltration in more critical applications. Filter backwash water may cause disposal difficulties. The processes require careful design and skilled monitoring and control. They are generally not suited to application on a household scale.
As the turbidity of water increases, the amount of chlorine required for disinfection of the water increases. Low turbidity therefore minimises the required chlorine dose and reduces the formation of chloro-organics that often give rise to taste and odour problems and trihalomethanes. Due to the many advantages associated with water of low turbidity and the relative ease of monitoring, it is often used as an indicator of potential water quality problems during treatment.
The Effects of Turbidity
Norms
Effects
Mitigation
Domestic Water Use
The norms used in the guideline are based on human health and aesthetic effects .
The consumption of turbid water per se does not have any direct health effects, but associated effects due to microbial contamination or the ingestion of substances bound to particulate matter, do. Turbidity can have a significant effect on the microbiological quality of water. Microbial growth in water is most extensive on the surface of particulates and inside loose, naturally-occurring floes. River silt also readily adsorbs viruses and bacteria. During treatment, micro-organisms become entrapped in the floc formed during coagulation and breakthrough of the floc may represent significant microbial contamination. Consumption of highly turbid, chlorinated water may therefore pose a health risk. Particulate matter can also protect bacteria and viruses against disinfection. The adsorptive properties of some suspended particles can lead to the entrapment of undesirable inorganic and organic compounds in water, including metal-humate complexes and herbicides (e.g. 2,4-D, Paraquat, Diquat). This may interfere with the detection of such compounds, and could be an indirect health risk.
Turbidity may also be associated with the presence of inorganic ions such as manganese(II). For example, when water containing manganese(Il) ions is treated with chlorine and left to
stand, slow reaction kinetics indicate that colloidal manganese(IV) oxide is formed, leading eventually to the formation of a fine precipitate.
Any adverse effects thought to be due to microbial contamination or adsorbed substances should be referred to a medical practitioner.
Aesthetic effects (appearance, taste, odour) of turbidity can be mitigated or removed by filtration using household water filters if relatively small amounts of water are involved such as for food preparation and drinking.
2nd Edition, 1996 (Jstlssue) Turbidity: Page 2 of 4
159
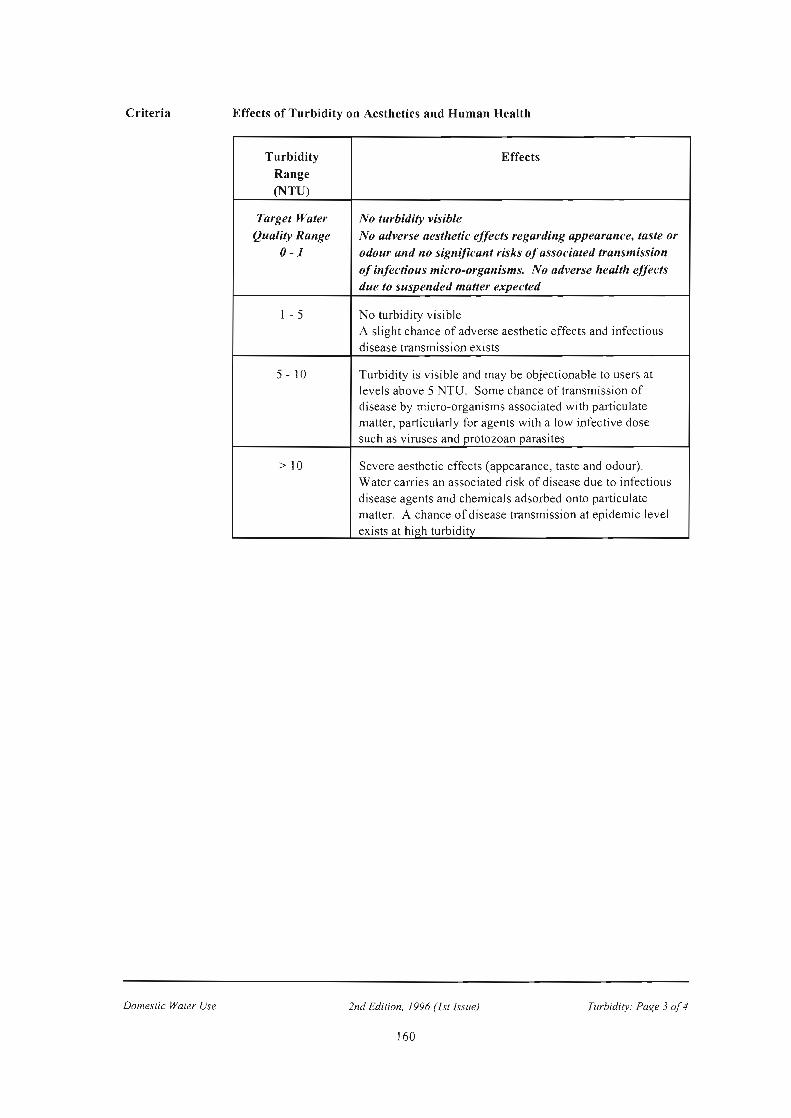
Criteria Effects of Turbidity on Aesthetics and Human Health
Turbidity Effects Range (NTU)
Target Water No turbidity visible Quality Range No adverse aesthetic effects regarding appearance, taste or
0-1 odour and no signiflca/ll risks of associated transmission of infectious micro-organisms. No adverse health effects due to suspended matter expected
I - 5 No turbidity visible A slight chance of adverse aesthetic effects and infectious disease transmission exists
5- 10 Turbidity is visible and may be objectionable to users at levels above 5 NTU. Some chance of transmission of disease by micro-organisms associated with particulate matter, particularly for agents with a low infective dose such as viruses and protozoan parasites
> 10 Severe aesthetic effects (appearance, taste and odour). Water carries an associated ri sk of disease due to infectious disease agents and chemicals adsorbed onto particulate matter. A chance of disease transmission at epidemic level exists at high turbidity
Domestic Water Use 2nd Edition, 1996 (lsi Issue) Turbidity. Page 3 of4
160

Sources of Information
Domestic Water Use
APHA 1992. Standard Methods for the Examination of Water and Waste Water, 18th Edition. American Public Health Association, American Water Works Association, Water Environment federation Published by the American Public Health Association, Washington DC, USA.
AU CAMP P.J. and F.S. Vivier 1990. Water Quality Criteria in South Africa. Technology SA, June 1990, 21-30.
CANADIAN GUIDELINES 1987. Canadian Water Quality Guidelines. Prepared by the Task Force on Water Quality Guidelines of the Canadian Council of Resource and Environmental Engineers. Canada.
DEPARTMENT OF WATER AFFAIRS AND FORESTRY 1993. South Africa Water Quality Guidelines , Volume 1: Domestic Use, 1st Edition, The Government Printer, Pretoria, South Africa.
KEMPSTER P.L. and H.R. Smith 1985. Proposed Aesthetic/Physical and Inorganic Drinking-water Criteria for the Republic of South Africa. Research Report No. 628, National Institute for Water Research, CSIR, Pretoria, South Africa.
US EPA 1986. Quality Criteria for Water 1986. EPA 440/5-86-001. United States Environmental Protection Agency, Washington DC, USA.
WORLD HEALTH ORGANIZATION 1984. Guidelines for Drinking Water Quality, Volume 2: Health Criteria and Other Supporting Information. WHO, Geneva.
2nd Edition, 1996 (lst/ssue) Turbidity. Page 4 of 4
161


![Welcome []Christianah Olakitan Ijagbemi Tshwane University of Technology, South Africa John Mosokeikome Vaal University of Technology, South Africa Wyhan Jooste Stellenbosch University,](https://img.dokumen.tips/doc/110x75/5e951755f3256947106129e1/welcome-christianah-olakitan-ijagbemi-tshwane-university-of-technology-south.jpg)