Embed Size (px)
Citation preview
RUBBER TYRE AND PLASTIC WASTE USE IN ASPHALT CONCRETE
PAVEMENT
A dissertation submitted in the fulfilment of the requirements for the degree
Magister Technologiae: Civil Engineering
in the Faculty of Engineering and Technology
Onyango, F.O.
211122726
Vaal University of Technology
Supervisor: Dr. R W. Salim
Co- Supervisors: Prof. M. Ndege
Prof. L.M. Masu

i
DECLARATION
I, Onyango Felix Odhiambo, hereby declare that this dissertation is my own original
work, except where specific acknowledgement is made in the form of a reference. This
dissertation has not been previously submitted to any institution for similar or any
degree award.
Signature: on this _________day of __________2015
ii
ACKNOWLEDGEMENTS
I would like to express my sincere gratitude to my supervisor Dr Salim Wanjala and
co-supervisors Prof. Maurice Ndege and Prof. Leonard Masu for their patience,
support, inspiration and guidance throughout my research work.
Special thanks to the Civil engineering department staff and technicians. I would like
to thank Mr. Ezra Nzama for his facilitation of my work by timely procurement of the
equipment required for my research work.
My sincere gratitude goes to the Road Lab (PTY) staff, Mr Charel Van Biljon and Mr.
Nico Herbst for allowing me to use their facilities for this research work and their
technical input into my research work.
My sincere gratitude goes to Mr. Abdul Hajee of Afrisam (SA) who supplied me with
aggregate materials for my research work at no cost. My gratitude also goes to Vidar
rubber products and Welpac who supplied me with the crumb rubber and plastics for
this research.

iii
DEDICATION
To my late dad Hezekiah Onyango Jimbo.
iv
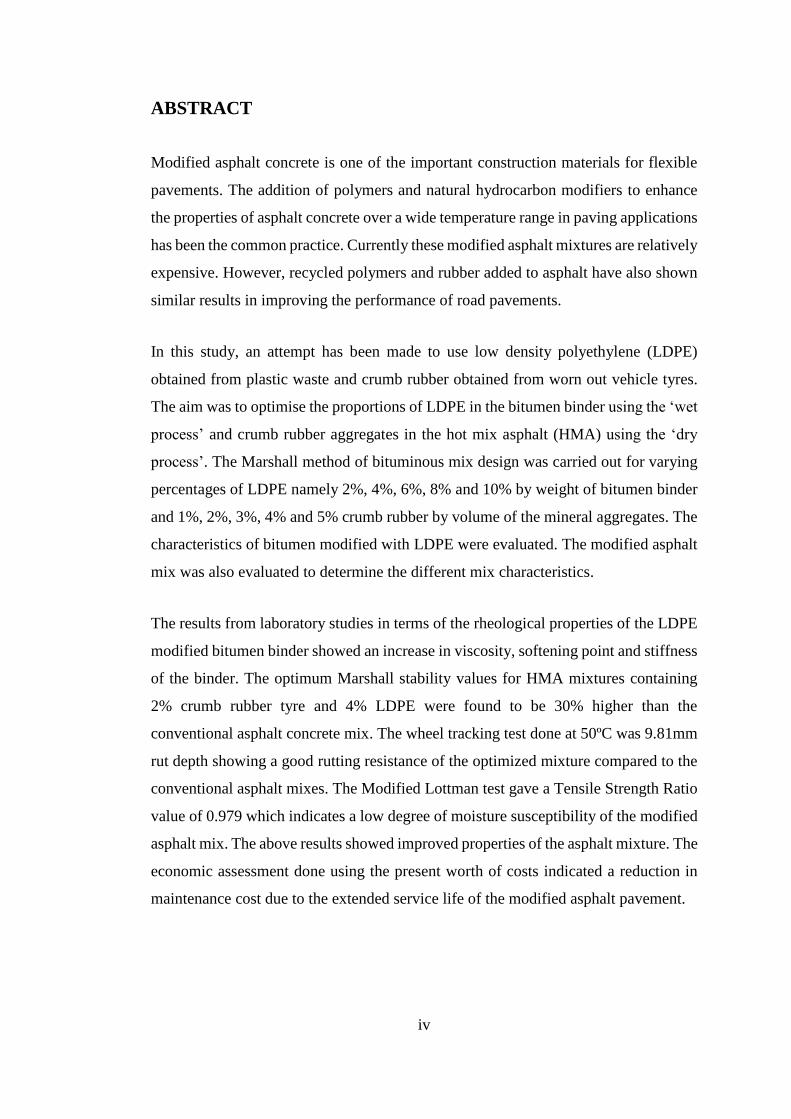
ABSTRACT
Modified asphalt concrete is one of the important construction materials for flexible
pavements. The addition of polymers and natural hydrocarbon modifiers to enhance
the properties of asphalt concrete over a wide temperature range in paving applications
has been the common practice. Currently these modified asphalt mixtures are relatively
expensive. However, recycled polymers and rubber added to asphalt have also shown
similar results in improving the performance of road pavements.
In this study, an attempt has been made to use low density polyethylene (LDPE)
obtained from plastic waste and crumb rubber obtained from worn out vehicle tyres.
The aim was to optimise the proportions of LDPE in the bitumen binder using the ‘wet
process’ and crumb rubber aggregates in the hot mix asphalt (HMA) using the ‘dry
process’. The Marshall method of bituminous mix design was carried out for varying
percentages of LDPE namely 2%, 4%, 6%, 8% and 10% by weight of bitumen binder
and 1%, 2%, 3%, 4% and 5% crumb rubber by volume of the mineral aggregates. The
characteristics of bitumen modified with LDPE were evaluated. The modified asphalt
mix was also evaluated to determine the different mix characteristics.
The results from laboratory studies in terms of the rheological properties of the LDPE
modified bitumen binder showed an increase in viscosity, softening point and stiffness
of the binder. The optimum Marshall stability values for HMA mixtures containing
2% crumb rubber tyre and 4% LDPE were found to be 30% higher than the
conventional asphalt concrete mix. The wheel tracking test done at 50ºC was 9.81mm
rut depth showing a good rutting resistance of the optimized mixture compared to the
conventional asphalt mixes. The Modified Lottman test gave a Tensile Strength Ratio
value of 0.979 which indicates a low degree of moisture susceptibility of the modified
asphalt mix. The above results showed improved properties of the asphalt mixture. The
economic assessment done using the present worth of costs indicated a reduction in
maintenance cost due to the extended service life of the modified asphalt pavement.
v
TABLE OF CONTENTS
DECLARATION .......................................................................................................... i
ACKNOWLEDGEMENTS ......................................................................................... ii
DEDICATION ............................................................................................................ iii
ABSTRACT ................................................................................................................ iv
TABLE OF CONTENTS ............................................................................................. v
List of Tables............................................................................................................. viii
List of Figures ............................................................................................................. ix
List of Abbreviations.................................................................................................. xii
1 INTRODUCTION ................................................................................................ 1
1.1 Background of the Study ............................................................................... 1
1.2 Motivation ..................................................................................................... 2
1.3 Significance of the Study .............................................................................. 3
1.4 Problem Statement ........................................................................................ 3
1.5 Study Objectives ............................................................................................ 5
1.5.1 Main objectives ...................................................................................... 5
1.5.2 Specific objectives ................................................................................. 5
1.6 Research Outline ........................................................................................... 5
2 LITERATURE REVIEW ..................................................................................... 6
2.1 Introduction ................................................................................................... 6
2.2 Asphalt Concrete Road .................................................................................. 7
2.3 Environmental Waste and Legislation .......................................................... 8
2.3.1 Rubber tyre waste ................................................................................... 8
2.3.2 Plastic wastes ....................................................................................... 11
2.3.3 The South African climate ................................................................... 12
2.3.4 Legislation ............................................................................................ 14
2.4 Hot Mix Asphalt .......................................................................................... 16
2.4.1 Aggregates............................................................................................ 16
2.4.2 Penetration grade bitumen.................................................................... 17
2.4.3 Manufacture of hot mix asphalt ........................................................... 18
2.5 Pavement Deterioration ............................................................................... 20
vi
2.5.1 Introduction .......................................................................................... 20
2.5.2 Rutting .................................................................................................. 21
2.5.3 Fatigue cracking ................................................................................... 23
2.5.4 Moisture susceptibility ......................................................................... 23
2.6 Modification Technology ............................................................................ 24
2.6.1 Introduction .......................................................................................... 24
2.6.2 Polymer modified bitumen ................................................................... 27
2.6.3 Crumb rubber modifier ........................................................................ 29
2.7 Conclusion ................................................................................................... 31
3 RESEARCH METHODOLOGY ....................................................................... 33
3.1 Introduction ................................................................................................. 33
3.2 Hot Mix Asphalt .......................................................................................... 34
3.2.1 Bitumen ................................................................................................ 34
3.2.2 Mineral aggregates ............................................................................... 34
3.2.3 Waste polyethylene bags ...................................................................... 35
3.2.4 Rubber aggregate ................................................................................. 35
3.3 HMA Component Evaluation ...................................................................... 36
3.3.1 Mineral aggregates ............................................................................... 36
3.3.2 Crumb rubber aggregate ....................................................................... 45
3.3.3 60/70 penetration grade bitumen .......................................................... 46
3.3.4 LDPE modified bitumen ...................................................................... 50
3.4 Volumetric Design ...................................................................................... 51
3.4.1 Preparation of asphalt concrete briquettes ........................................... 52
3.4.2 Bulk relative density of the briquettes ................................................. 53
3.4.3 Maximum theoretical relative density of aggregate mixture ............... 54
3.4.4 Calculation of void content in bituminous mixes ................................ 57
3.4.5 Calculating target binder content ......................................................... 58
3.4.6 Marshall Flow, Stability and Quotient ................................................. 59
3.4.7 Determination of optimum binder content ........................................... 60
3.5 Optimization Process ................................................................................... 61
3.5.1 LDPE modified binder ......................................................................... 61
vii
3.5.2 Rubber aggregate ................................................................................. 61
3.5.3 Preparation of modified Marshall briquettes........................................ 62
3.6 Modified Hot Mix Asphalt .......................................................................... 63
3.6.1 Permanent deformation test.................................................................. 63
3.6.2 Indirect Tensile Strength Test .............................................................. 64
3.6.3 Moisture sensitivity (Modified Lottman) test ...................................... 65
3.7 Cost Analysis ............................................................................................... 65
4 RESULTS, ANALYSIS AND DISCUSSION ................................................... 67
4.1 Introduction ................................................................................................. 67
4.2 Materials for Hot Mix Asphalt .................................................................... 67
4.2.1 Mineral aggregate physical properties ................................................. 67
4.2.2 Rubber aggregates ................................................................................ 72
4.2.3 Bitumen characterisation ...................................................................... 73
4.2.4 LDPE modified bitumen ...................................................................... 76
4.3 Determination of optimum binder content of control HMA ....................... 79
4.4 Optimization ................................................................................................ 82
4.4.1 Bulk relative density ............................................................................ 84
4.4.2 Marshall stability .................................................................................. 85
4.4.3 Marshall flow ....................................................................................... 87
4.5 Modified HMA Performance ...................................................................... 88
4.5.1 MMLS3 test ......................................................................................... 89
4.5.2 Indirect tensile strength ........................................................................ 97
4.6 Economic assessment .................................................................................. 99
5 CONCLUSION AND RECOMMENDATIONS ............................................. 101
5.1 Conclusions ............................................................................................... 101
5.2 Recommendations ..................................................................................... 102
References ................................................................................................................ 103
viii
List of Tables
Table 2.1: Rubber Tyre Composition .......................................................................... 8
Table 2.2: General guide for the selection of binder type ......................................... 17
Table 3.1: Aggregate sizes as supplied by Afrisam (South Africa) .......................... 35
Table 3.2: Required physical properties of aggregates fractions .............................. 37
Table 4.1: Physical properties of aggregates ............................................................. 68
Table 4.2: Grading of mineral aggregate used in this research ................................. 69
Table 4.3: Flakiness Index for various aggregate sizes ............................................. 71
Table 4.4: Properties of 60/70 bitumen binder .......................................................... 75
Table 4.5: Summary of Volumetric and Marshall data for 60/70 penetration grade
bitumen. ................................................................................................... 80
Table 4.6: Summary of the effect of crumb rubber and waste polyethylene on HMA
................................................................................................................. 83
Table 4.7: MMLS3 Test parameters ......................................................................... 89
Table 4.8: Control sample cumulative right heave ................................................... 90
Table 4.9: Control sample cumulative left heave ...................................................... 90
Table 4.10: Modified sample cumulative right heave ............................................... 91
Table 4.11: Modified sample cumulative left eave ................................................... 91
Table 4.12: Average cumulative heave for the control sample ................................. 93
Table 4.13: Average cumulative rut for modified sample ........................................ 96
Table 4.14: Interim Guidelines for the interpretation of wheel tracking results ....... 96
Table 4.15: Summary of Indirect Tensile Strength test results ................................. 97
Table 4.16: Guidelines for the interpretation of ITS results for fatigue performance
evaluation .............................................................................................. 98
Table 4.17: Present worth of costs .......................................................................... 100
ix
List of Figures
Figure 2.1: Layers within a typical flexible highway pavement ................................. 7
Figure 2.2: Worn out tyres transported on a major freeway ....................................... 9
Figure 2.3: Market applications for Low Density Polyethylene- LDPE .................. 11
Figure 2.4: Estimated hours per year with asphalt surface temperatures above 50 ˚C
................................................................................................................. 13
Figure 2.5: Estimated hours per year with asphalt surface temperatures below 5 ˚C
................................................................................................................. 13
Figure 2.6: The Waste Management Hierarchy ........................................................ 15
Figure 2.7: Representative continuous-graded, open-graded and gap-graded mixes of
13.2 mm maximum aggregate size ......................................................... 18
Figure 2.8: Drum mixer ............................................................................................ 19
Figure 2.9: Critical Stresses/strains in a bituminous highway pavement slab .......... 21
Figure 2.10: (a) Wide subgrade rutting, and (b) Narrow wheel path rutting ............ 22
Figure 2.11: Alligator cracks on HMA pavement..................................................... 23
Figure 2.12: Relationship between the absorption rate and viscosity of different
penetration grade bitumen at 160°C ....................................................... 27
Figure 3.1: A compacted HMA briquette and the aggregates and asphalt binder used
to prepare it ............................................................................................. 34
Figure 3.2: Low Density Polyethylene ..................................................................... 35
Figure 3.3: Test sieves ............................................................................................... 38
Figure 3.4: Compression machine setup ................................................................... 39
Figure 3.5: AIV Sample in test cylinder ................................................................... 40
Figure 3.6: The aggregate impact value (Treton) apparatus ..................................... 41
Figure 3.7: LAA apparatus........................................................................................ 41
Figure 3.8: Flakiness Index test sieve ....................................................................... 42
Figure 3.9: Weight in water set-up for determining specific gravity of coarse
aggregate ................................................................................................. 43
Figure 3.10: (a) Cylinder after shaking and irrigating - clay has not settled (b) Close
up of cylinder showing clay and sand height. ......................................... 45
Figure 3.11: Crumb rubber sample ........................................................................... 45
x
Figure 3.12: Penetration test for bitumen.................................................................. 46
Figure 3.13: Softening point test ............................................................................... 47
Figure 3.14: Ductility test setup ................................................................................ 48
Figure 3.15: Brookfield viscometer .......................................................................... 48
Figure 3.16: Rolling Thin Film Oven (RTFO) equipment ....................................... 49
Figure 3.17: Briquette Sample .................................................................................. 52
Figure 3.18: (a) Heating up the bitumen (b) Preparation of the asphalt concrete
mixture. ................................................................................................... 52
Figure 3.19: Buoyancy balance apparatus ................................................................ 54
Figure 3.20: Diagramatic representation for determining maximum theoretical
relative density ........................................................................................ 54
Figure 3.21: Marshall stability and flow test setup ................................................... 60
Figure 3.22: MMLS3 Testing Equipment ................................................................. 63
Figure 3.23: MMLS3 samples .................................................................................. 64
Figure 3.24: Sample positioned for ITS testing ........................................................ 65
Figure 4.1: Mineral aggregate grading curve ............................................................ 69
Figure 4.2: 2.36 mm crumb rubber ........................................................................... 73
Figure 4.3: Influence of LDPE on penetration .......................................................... 76
Figure 4.4: Influence of LDPE on softening point.................................................... 77
Figure 4.5: Influence of LDPE on ductility .............................................................. 78
Figure 4.6: Influence of LDPE on dynamic viscosity at 60˚C .................................. 78
Figure 4.7: Influence of LDPE on bitumen mass loss .............................................. 79
Figure 4.8: Bitumen against Bulk density ................................................................. 81
Figure 4.9: Bitumen against Marshall stability ......................................................... 81
Figure 4.10: Bitumen against VMA .......................................................................... 81
Figure 4.11: Bitumen against Flow ........................................................................... 81
Figure 4.12: Bitumen against Air voids .................................................................... 81
Figure 4.13: Bitumen against VFB ........................................................................... 81
Figure 4.14: Influence of plastic waste (LDPE) on density of modified HMA ........ 84
Figure 4.15: Influence of crumb rubber on density of modified HMA .................... 85
xi
Figure 4.16: Influence of crumb rubber content on Marshall stability with variation in
LDPE....................................................................................................... 86
Figure 4.17: LDPE content against Marshall stability with variation in crumb rubber
contents ................................................................................................... 87
Figure 4.18: Influence of crumb rubber and LDPE on Marshall Flow ..................... 88
Figure 4.19: Deformation of slab after wheel tracking test ...................................... 89
Figure 4.20: Cross-section of the pavement deformation ......................................... 92
Figure 4.21: Cumulative Heave ................................................................................ 94
Figure 4.22: Average Cumulative rut ....................................................................... 95
xii
List of Abbreviations
4R: Reduce Reuse Recycle Recover
AASHTO: American Association of State Highway and Transportation Officials
AC: Asphalt Concrete
ACV: Aggregate Crushing Value
AIV: Aggregate Impact Value
ASTM: American Society of Testing and Materials
BRD: Bulk Relative Density
COLTO: Committee of Land Transport Officials
COTO: Committee of Transport Officials
CRM: Crumb Rubber Modified
CSIR: Council for Scientific and Industrial Research
FACT: Fines Aggregate Crushing Test
FHWA: Federal Highways Administration
GW: General Wastes
HDPE: High Density Polyethylene
HMA: Hot Mix Asphalt
ITS: Indirect Tensile Strength
LAA: Los Angeles Abrasion
LDPE: Low Density Polyethylene
MMLS: Model Mobile Load Simulator
MTRD: Maximum Theoretical Relative Density
NCHRP: National Cooperative Highway Research Program
PET: Polyethylene Terephthalate
PMB: Polymer Modified Binder
PWOC: Present Worth of Costs
RTFOT: Rolling Thin Film Oven Test
SABITA: Southern African Bitumen Association
SANRAL: South African National Roads Agency Limited
SANS: South African National Standards

xiii
SATRPC: South African Tyre Recycling Process Company
TG: Technical Guidelines
TMH: Technical Methods for Highways
TRB: Transportation Research Board
TRH: Technical Recommendations for Highways
TSR: Tensile Strength Ratio
VFB: Volume Filled with Binder
VMA: Voids in Mineral Aggregate
1
1 INTRODUCTION
1.1 Background of the Study
Roads are expensive to construct, operate and maintain. Construction of 1 km of road
can cost as much as R25 million (Van Rooyen & Hilda, 2010, p. 7). Between 2006 and
2020, the South African government has planned to invest more than R63 billion for
the development and maintenance of the country's road network. The majority of South
Africa’s national road network is older than 25 years. This exceeds the design life of
the roads and although well maintained, the national road network is experiencing
unprecedented high traffic volumes (Van Rooyen & Hilda, 2010, p. 7). One
consequence of growing freight volumes on the roads is that the overloading of freight
trucks is causing not only rapid deterioration in road conditions, but also diminishes
road capacity and safety (Development Bank of Southern Africa, 2012, p. 53).
Construction and maintenance of the South Africa’s extensive road networks consume
large amounts of natural non-renewable resources in form of virgin raw materials (CIB
and UNEP-IETC, 2002, p. 24). The principal roads in South Africa are surfaced with
hot-mixed asphalt (HMA) i.e. a mixture of coarse and fine aggregates bound together
with asphalt cement used in a “hot mix” pavement composition (Department for
International Development, 2002, p. 3; Liebenberg, et al., 2004).
In tropical and sub-tropical countries the performance of HMA has often been
disappointing under severe climate conditions, with road surfaces sometimes failing
within a few months of construction and rarely lasting the design life (Department for
International Development, 2002, p. 3). The main distress contributing to asphalt
pavement failures in South Africa are fatigue cracking, permanent deformation and
thermal cracking (Mturi & O'Connell, 2011, p. 2). Such distresses are influenced by
the rheological properties of the binder in asphalt pavement. Fatigue cracking and
thermal cracking are associated with lower temperatures and aged binder of high
viscosity, while permanent deformation is associated with higher temperatures where
its rheology approaches Newtonian behaviour (Mturi & O'Connell, 2011, p. 2; Al-
2
Hadidy, et al., 2009, p. 1462). An ideal binder should, therefore display adequate
elastic behaviour at higher temperatures to resist permanent deformation with a
reduced age of ageing and lower viscosity at lower temperatures to prevent fatigue and
thermal cracking.
Some improvements in asphalt properties have been gained by selecting the proper
crude or tailoring the refinery process used to make asphalt (Kalantar, et al., 2012, p.
56). Unfortunately there are only a limited number of actions that can be taken to
control the refining process to make improved asphalts. Air blowing makes asphalt
binder harder. Fluxing agents or diluent oils are sometimes used to soften the asphalt.
Another method used to significantly improve asphalt quality is the addition of
polymers. To date two types of modifications have been proposed. These are crumb
rubber modified (CRM) and polymer modified bitumen (PMB). Many studies have
shown that modifying the asphalt with synthetic and natural polymers increases the
viscosity and resistance to moisture damage and reduces the susceptibility to
temperature and tendency to flow (Cao, 2007, p. 1011; Gawandea, et al., 2012, p. 1;
Flynn, 1993, p. 41).
1.2 Motivation
Environmental sustainable development on a global level requires durable road
infrastructures that consume a minimum of natural resources and energy during
construction and allow reduced traffic induced atmospheric and acoustic pollution
during its service life (Partl, et al., 2010, p. 283). Environmental concerns are
becoming increasingly important and influence the techniques available; for example,
encouraging the recycling of existing materials. The demand for higher pavement
quality from users is ever increasing as the cost resulting from pavement failures
continues to escalate. Hence, there is a strong desire to have a better performing asphalt
mixture from highway agencies (Chui-Te & Li-Cheng, 2007, p. 1027).
Many approaches have been considered in recent years for treating and improving the
conventional asphalts, such as the introduction of additives in order to improve their
3
properties (Fontes, et al., 2010, p. 1193). Modified bitumen provides the technology
to produce a bituminous binder with improved viscoelastic properties which remain in
balance over a wider temperature range and loading conditions (Technical Guide 1,
2007, p. 5). Modified bitumen is expected to improve the life of surfacing up to 100%
depending on the degree of modification and type of additives and modification
process used (Rokade, 2012, p. 105).
1.3 Significance of the Study
Modification of asphalt concrete could lead to improved performance of the asphalt
pavement and extension of its service life. This research is an attempt to improve the
mechanical properties of asphalt concrete by using plastic waste and crumb rubber.
The recycling of wastes in construction helps to save and sustain the natural resources
base. It also decreases the pollution of the environment and it also helps to save and
recycle energy in the production process (Hassani, et al., 2005). This will significantly
reduce the cost of construction and maintenance thus saving government funds on
infrastructure development which can be directed to other critical sectors of the
economy. The landfill disposal sites for plastic and crumb rubber waste would be freed
up for development.
1.4 Problem Statement
Solid waste management is one of the major environmental concerns all over the world
including in South Africa (Department of Environmental Affairs, 2012). Plastics and
rubber tyres form the bulk of the municipal solid wastes that are non-biodegradable.
Approximately 11 million tyres or 275,000 tonnes of pneumatic waste tyres are
generated in South Africa (SA) annually (SATRPC, 2011, p. 12). As a commodity a
waste tyre has no economic value and therefore less than 4% of waste tyres are
recycled at present. Tyre dealers and large end-users have virtually no satisfactory
disposal mechanism for waste tyres leading to many waste tyres being illegally
dumped, re-used or burnt.
4
The apparent annual consumption of plastic materials in South Africa was 1,250,000
tonnes in 2009 (Plastics SA, 2013). A major portion of plastics produced each year is
used to make disposable items of packaging or other short lived products that are
discarded within a year of manufacture. Once used, plastic materials are thrown out.
They do not undergo bio-decomposition therefore they end up either in landfills or
incinerators (Rokade, 2012, p. 105). Both processes are not eco-friendly as they pollute
the land and the air. With the increase in demand for plastic and lack of
suitable/appropriate sources of separation, collection and recycling facilities, plastic
waste problem is expected to be even worse in future (Kajal, et al., 2007, p. 938).
Asphalt concrete pavements have a short life cycle, failing mainly due to temperature
changes, traffic loading and ageing (Alonso, et al., 2010, p. 2592). The problem with
asphalt is the tendency to become brittle at low temperatures and soft at high
temperatures (Jain, et al., 2011, p. 233). These cause fatigue cracking and rutting which
are the major forms of asphalt pavement failures (Al-Hadidy, et al., 2009, p. 1456).
Numerous modifiers currently used to improve the properties of road surfaces are
virgin materials (Kalantar, et al., 2012, p. 55). However the manufacture and
application of these virgin modifiers is costly (Adhikari, et al., 2000, p. 943; Kalantar,
et al., 2012, p. 56). The use of secondary (recycled), instead of primary (virgin),
materials helps ease landfill pressures and reducing demand of extraction (Huang, et
al., 2007, p. 59). Crumb rubber and recycled plastics have been used separately as
binder modifiers and to replace a portion of the mineral aggregates in asphalt concrete
mixtures (Al-Hadidy, et al., 2009, p. 1456; Huang, et al., 2007, p. 67). Polymer
modified binders (PMB) contain small percentages of polymers to improve their
physical properties. The principal source of raw material for producing crumb rubber
modified (CRM) asphalt is scrap tyres (Liu, et al., 2009, p. 2701). However, concerns
over inferior road performance and additional costs of construction have hindered the
widespread use of such secondary binders and aggregates in such applications. For
these reasons amongst others, research into improving the design and performance of
asphalt road surfaces continue to be undertaken (Department for International
Development, 2002, p. 3).
5
1.5 Study Objectives
1.5.1 Main objectives
The main objective of this research was to optimally utilise polymers from plastic
waste and crumb rubber from waste tyres in making asphalt concrete.
1.5.2 Specific objectives
The specific objectives of this study were to:
i) Determine the optimum mix proportions of crumb rubber and plastic waste in
modified asphalt concrete.
ii) Characterize the physical properties of the optimized crumb rubber -plastic waste
modified asphalt concrete against conventional asphalt concrete, rubber asphaltic
concrete and plastic asphaltic concrete.
iii) Evaluate the compatibility of crumb rubber and plastic waste in the asphalt mix.
iv) Evaluate the cost effectiveness of using plastic crumb rubber modified asphalt
concrete against conventional asphalt concrete mixes.
1.6 Research Outline
This dissertation presents the methodology, results, analysis and discussion from an
extensive laboratory investigation. The dissertation is divided into five chapters.
Chapter one is an overview of the purpose and significance of this study. Chapter Two
is a detailed literature review on the past and current use of modified asphalt concrete
mixtures. Chapter Three outlines the test procedures carried out on bitumen and
aggregates as well as asphalt concrete mixtures. Chapter Four gives the findings of the
various tests carried out in the study as well as their analysis and discussions. Chapter
Five gives the conclusions derived from the test analysis and recommendations from
the study.
6
2 LITERATURE REVIEW
2.1 Introduction
Governments around the world rank infrastructure policy among their greatest
concerns. The modernisation of infrastructure is seen as being critical to future
economic competitiveness and crucial to accommodating expanding populations in
urbanising environments (Urban Land Institute and Earnest and Young, 2011, p. 5).
South Africa is no exception. Infrastructure lies at the heart of government’s
stimulatory fiscal package and is a pivotal component of the New Growth Path
(Department of Economic Development, 2010, p. 1), accounting for just less than 8%
of GDP in the 2012/13 fiscal year. South Africa’s total road network consists of
approximately 154 000 km of paved roads and 454 000 km of gravel roads, which are
proclaimed as national, provincial or municipal roads (Development Bank of Southern
Africa, 2012, p. 47). Un-proclaimed roads account for 140 000 km, or 33% of the total
gravel network of 593 000 km. The un-proclaimed roads are predominantly in rural
areas and have not been officially recorded in road inventories, hence no authority is
responsible for their maintenance and upgrading. The total road network is in the order
of 750 000 km in length (Development Bank of Southern Africa, 2012, p. 47).
According to the European Asphalt Pavement Association (European Asphalt
Pavement Association, 2012, p. 2), South Africa’s total production of hot and warm
mix asphalt in the year 2011 and 2012 is 5.7 million tonnes. This translates to over 5.4
million metric tonnes of aggregates used in the production of the asphalt concrete mix
in the respective years. A record 445,000 tonnes of bitumen was consumed in South
Africa during 2010, showing an increase of some 10% on 2009 (Southern African
Bitumen Association (Sabita), 2011, p. 3). Globally, crude oil sources are being
depleted due to continuous extraction of these non-renewable sources. The high global
demand for crude oil as an energy source is also driving the cost of this pavement
material significantly higher. The cost of petroleum oil has increased ten-fold in the
past 10 years. This has translated into high cost of bitumen binder used for
construction.
7
2.2 Asphalt Concrete Road
A road pavement is composed of a system of overlaid strata of chosen processed
materials that is positioned on the in-situ soil termed the sub-grade (Rogers, 2003, p.
192). Its basic requirement is the provision of a uniform skid resistant running surface
with adequate performance life and requiring minimum maintenance. The structural
function of the pavement is to support vehicle wheel loading applied and distribute
them to the sub-grade underneath. Hence the pavement structure must ensure an
economic and effective way that guarantees adequate dispersion of the incident wheel
stresses so that the layers are not overstressed during the pavement’s design life. The
pavement design must be economical and guarantee adequate dispersion of the
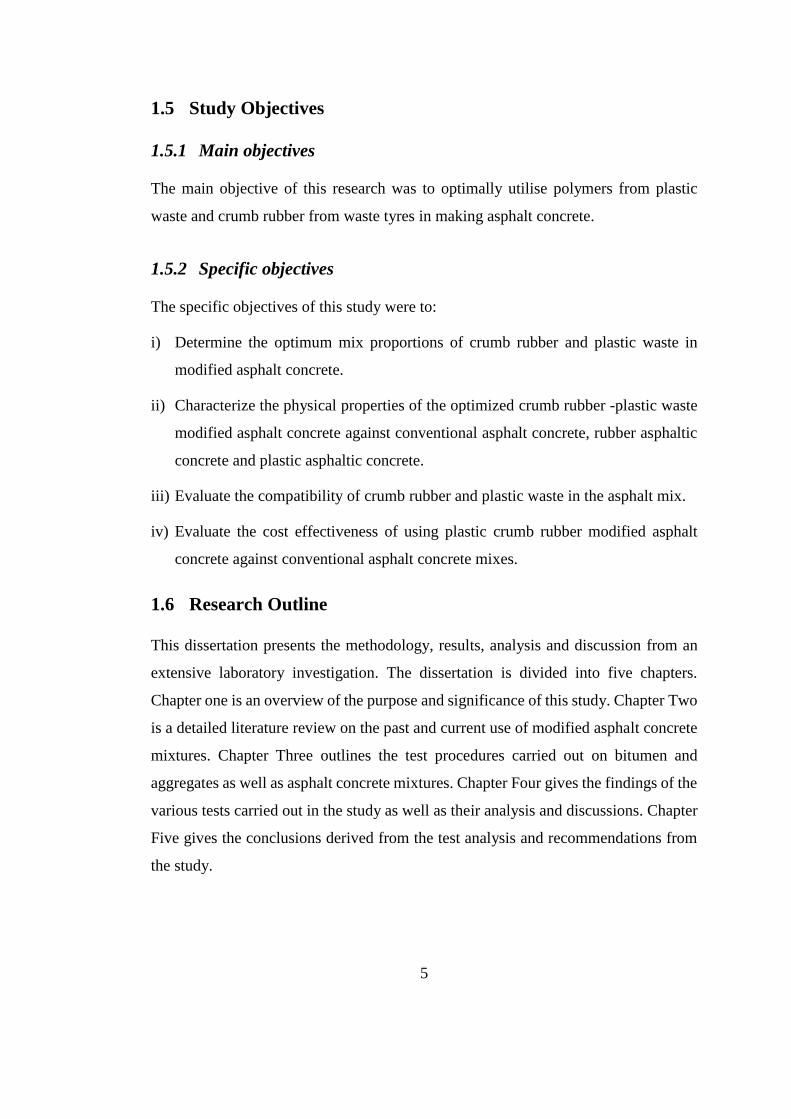
incident wheel stresses to the subsequent layers. The layers within a typical flexible
highway pavement are shown in Figure 2.1 below.
Figure 2.1: Layers within a typical flexible highway pavement (Rogers, 2003, p. 193)
The surfacing provides good riding quality by combining a regular surface with
adequate skidding resistance as well as protecting the underlying layers from water
infiltration. The durability, texture and flexibility of the surfacing are therefore key
factors. Asphalt concrete is the most commonly used material in pavement surfacing
because of its superior service performance in providing driving comfort, stability,
durability and water resistance (Yilmaz, et al., 2011, p. 4279).
Asphalt concrete is a material that has been specially prepared for use in flexible road
pavements by controlling its quality and consistency. Asphalt concrete is made of
8
aggregate or solid materials such as sand, gravel, or recycled concrete bound together
by bitumen. Bitumen is a thermoplastic material i.e. it gradually melts when heated. It
is characterized by its stiffness, consistency, or ability to flow at different temperatures
(Al-Hadidy, et al., 2009, p. 1456). It has an extremely diverse molecular structure
depending on the crude oil source. Aggregate is the granular material used in asphalt
concrete mixtures which make up 90-95 percent of the mixture weight and provides
most of the load bearing characteristics of the mix. Asphalt concrete is ordinarily used
in a ‘hot mix’ pavement composition that contains coarse and fine aggregates which
are blended at specified temperatures, applied to the roadbed and compacted with
rollers to produce a smooth driving surface (Al-Hadidy, et al., 2009, p. 1456).
2.3 Environmental Waste and Legislation
2.3.1 Rubber tyre waste
A tyre is a composite of complex elastomer formulations, fibres, textiles and steel cord
(Siddique & Naik, 2004, p. 563). Tyres are made of plies of reinforcing cords
extending transversely from bead to bead; on top is a belt which is located below the
thread. Table 2.1 lists typical types of materials used to manufacture tyres.
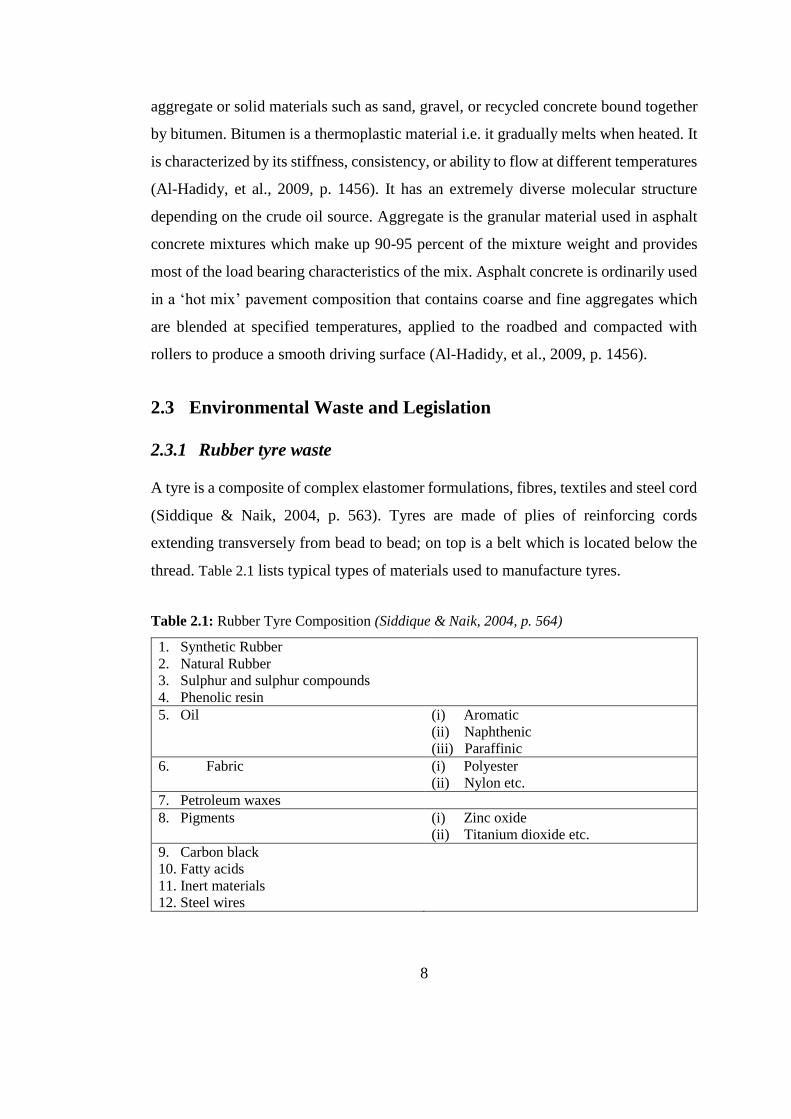
Table 2.1: Rubber Tyre Composition (Siddique & Naik, 2004, p. 564)
1. Synthetic Rubber
2. Natural Rubber
3. Sulphur and sulphur compounds
4. Phenolic resin
5. Oil (i) Aromatic
(ii) Naphthenic
(iii) Paraffinic
6. Fabric (i) Polyester
(ii) Nylon etc.
7. Petroleum waxes
8. Pigments (i) Zinc oxide
(ii) Titanium dioxide etc.
9. Carbon black
10. Fatty acids
11. Inert materials
12. Steel wires
9
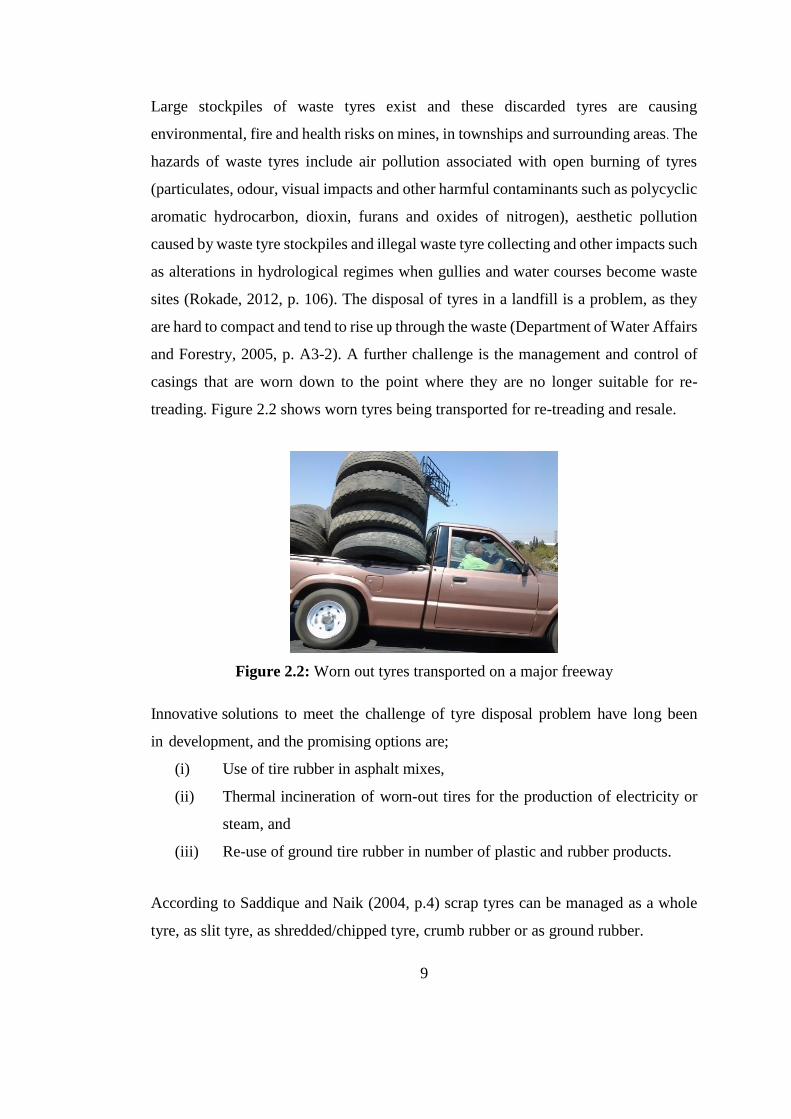
Large stockpiles of waste tyres exist and these discarded tyres are causing
environmental, fire and health risks on mines, in townships and surrounding areas. The
hazards of waste tyres include air pollution associated with open burning of tyres
(particulates, odour, visual impacts and other harmful contaminants such as polycyclic
aromatic hydrocarbon, dioxin, furans and oxides of nitrogen), aesthetic pollution
caused by waste tyre stockpiles and illegal waste tyre collecting and other impacts such
as alterations in hydrological regimes when gullies and water courses become waste
sites (Rokade, 2012, p. 106). The disposal of tyres in a landfill is a problem, as they
are hard to compact and tend to rise up through the waste (Department of Water Affairs
and Forestry, 2005, p. A3-2). A further challenge is the management and control of
casings that are worn down to the point where they are no longer suitable for re-
treading. Figure 2.2 shows worn tyres being transported for re-treading and resale.
Figure 2.2: Worn out tyres transported on a major freeway
Innovative solutions to meet the challenge of tyre disposal problem have long been
in development, and the promising options are;
(i) Use of tire rubber in asphalt mixes,
(ii) Thermal incineration of worn-out tires for the production of electricity or
steam, and
(iii) Re-use of ground tire rubber in number of plastic and rubber products.
According to Saddique and Naik (2004, p.4) scrap tyres can be managed as a whole
tyre, as slit tyre, as shredded/chipped tyre, crumb rubber or as ground rubber.
10
a) Shredded/chipped tires- Tire shreds or chips involve primary, secondary or
both shredding operations. The size of the tire shreds produced in the primary
shredding process can vary from as large as 300 to 460 mm (12–18 in.) long by 100–
230 mm (4–9 in.) wide, down to as small as 100–150 mm (4–6 in.) in length,
depending on the manufacturer’s shredder model and the condition of the cutting
edges. Production of tire chips, normally sized from 76 (3 in.) to 13 mm (0.5 in.),
requires both primary and secondary shredding to achieve adequate volume (quantity)
reduction.
b) Crumb Rubber - Crumb rubber consists of particles ranging in size from 4.75
mm (No. 4 Sieve) to less than 0.075 mm (No. 200 Sieve). Generally, these methods
are used to convert scrap tires into crumb rubber. These methods are (i) cracker mill
process, (ii) granular process, and (iii) micro mill process. The cracker mill process
tears apart or reduces the size of tire rubber by passing the material between rotating
corrugated steel drums. By this process irregularly shaped torn particles having large
surface areas are produced. The size of these particles varies from 5 mm to 0.5 mm
(No. 4 to No. 40 Sieve), and are commonly known as ground crumb rubber. Granular
process shears apart the rubber with revolving steel plates, producing granulated crumb
rubber particles, ranging in size from 9.5 mm (3/8 inch) to 0.5 mm (No. 40 Sieve).
c) Ground Rubber- Ground rubber for commercial applications may be
nominally sized as large as 19 mm (or 3/4 in.) to as small as 0.15 mm (No. 100 sieve).
It depends upon the type of size reduction equipment and intended applications. The
processed used tires in ground rubber applications are typically subjected to two stages
of magnetic separation and to screening. Various size fractions of rubber are recovered
(Heitzman & Michael , 1992, p. 23). Some processes/markets term 30 mesh rubber as
crumb rubber.
The most significant opportunity will be the recovery of all the products from the used
tyres and to identify markets for re-use. Once this happens, used tyres will have an
intrinsic value and thus will be items for both formal and informal collection
(REDISA, 2009). Although the use of asphalt rubber is attractive from the viewpoint
11
of environmental preservation, it is not widely used because its performance and cost
effectiveness have not been conclusively proven (Hossain , et al., 1995, p. 189).
2.3.2 Plastic wastes
Plastics are cheap, lightweight and durable materials which can be readily moulded
into various products with a wide range of applications (Hopewell, et al., 2009, p.
2115). The total global production of plastics reached 230 million tonnes in 2009 up
from 1.5 million tonnes in 1950 (PlasticEurope, 2010, p. 9). Polyolefin is the collective
description for plastics types that include polyethylene, namely: low-density
polyethylene (LDPE), linear low-density polyethylene (LLDPE), high-density
polyethylene (HDPE) and polypropylene (PP). Together they account for more than
57% (775 thousand tonnes) of South Africa’s total consumption of 1.34 million tonnes
of plastics each year (Plastics SA, 2013, p. 1). According to the Plastics SA Plastics
Recycling Survey for 2011, South Africa currently recycles 18.9% of virgin plastics
produced which has increased from 17.8% in 2009. The amount of plastic recycled in
South Africa increased from 241,853 tonnes in 2010 to 245,696 tonnes in 2011
(Plastics SA, 2013, p. 4). The most common recyclable 'household' plastics are
Polyethylene terephthalate (PET) and High Density Polyethylene (HDPE). PET is
used in the manufacture of bottles for soft drinks and fruit juices bottles, pillow and
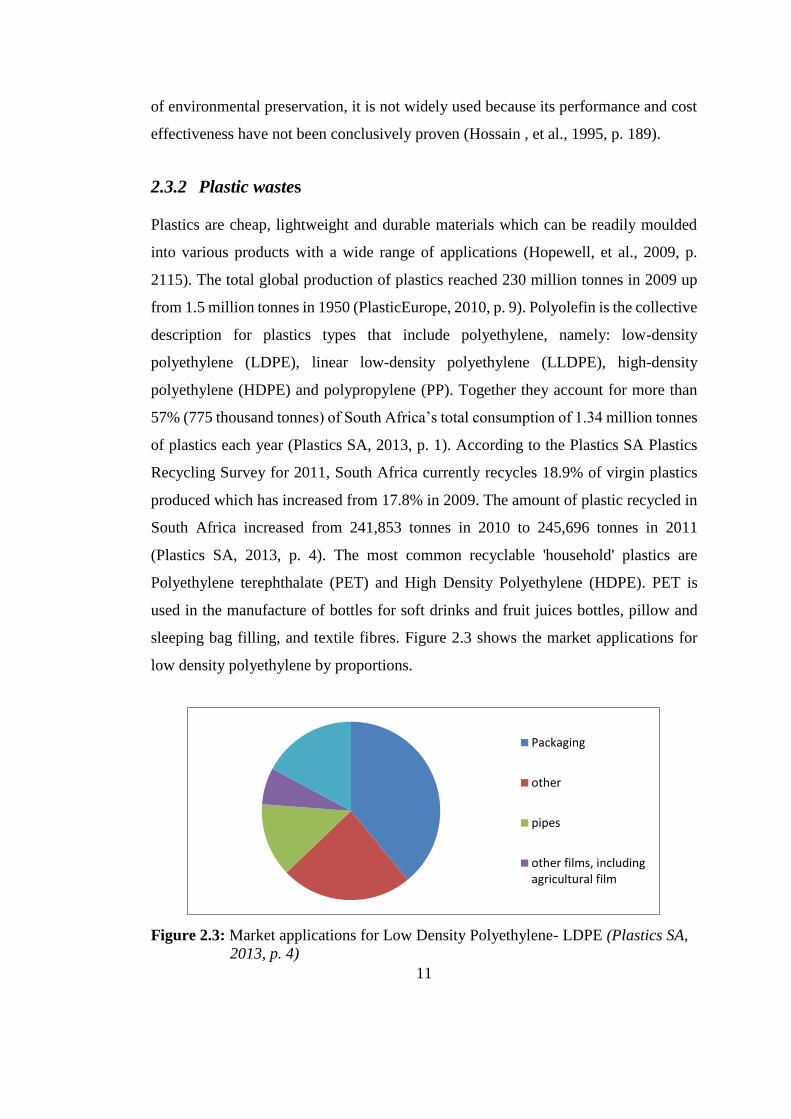
sleeping bag filling, and textile fibres. Figure 2.3 shows the market applications for
low density polyethylene by proportions.
Figure 2.3: Market applications for Low Density Polyethylene- LDPE (Plastics SA,
2013, p. 4)
Packaging
other
pipes
other films, includingagricultural film
12
Around 4 percent of world oil and gas production, a non-renewable resource, is used
as feedstock for plastics and a further 3-4 percent is expended to provide energy for
their manufacture (Hopewell, et al., 2009, p. 2115). A major difficulty with the
recycling of plastics is the need to separate different types of plastic, as these have
different melting points (Department of Water Affairs and Forestry, 2005, p. A3-1).
Mixed plastic will not form a uniform and stable material instead they tend to phase-
separate like oil and water and set in different layers. Although packaging plastic
accounts for the most recycled in form of HDPE, LDPE is among the main types that
have the lowest recycling rates. As landfilling, the traditional source of waste disposal,
has become more expensive because of closures and stricter operating requirements,
recycling is becoming an alternative for waste disposal (Halstead, 1994, p. 4). Thus
the use of LDPE plastics in asphalt pavements may provide an important outlet for
such materials. The binding property of LDPE in its molten state has helped in finding
out a method of safe disposal of waste polyethylene by using them in road making.
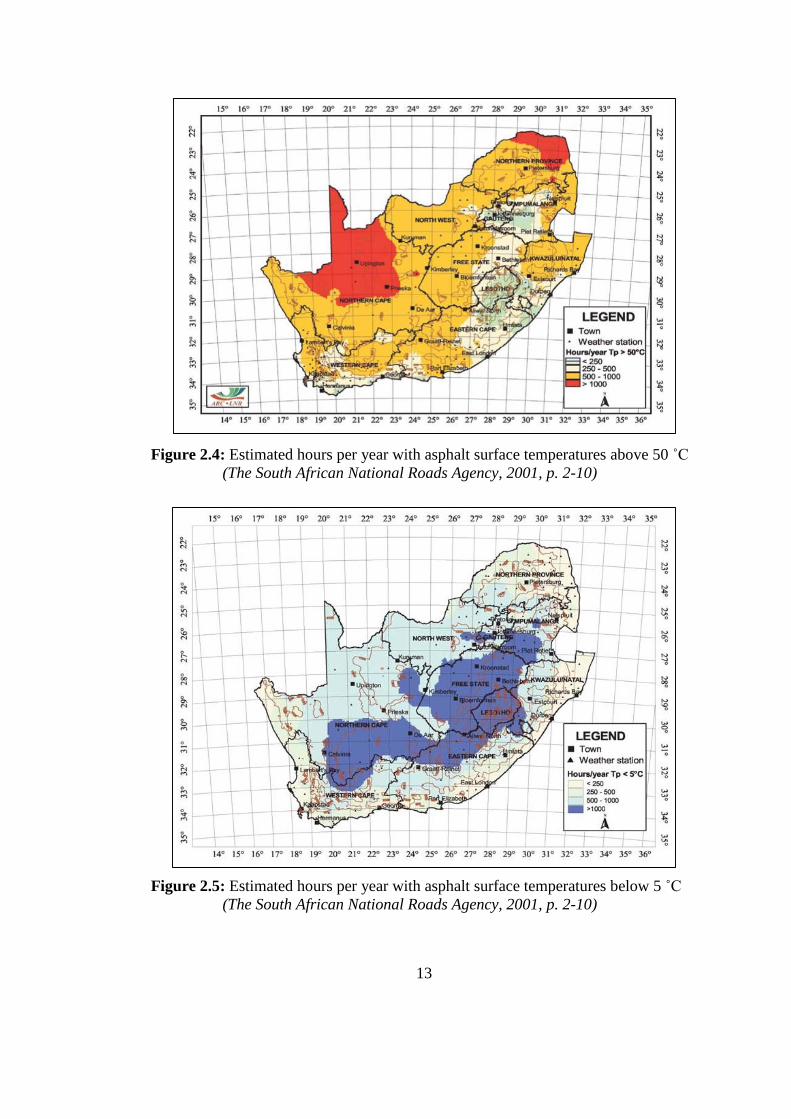
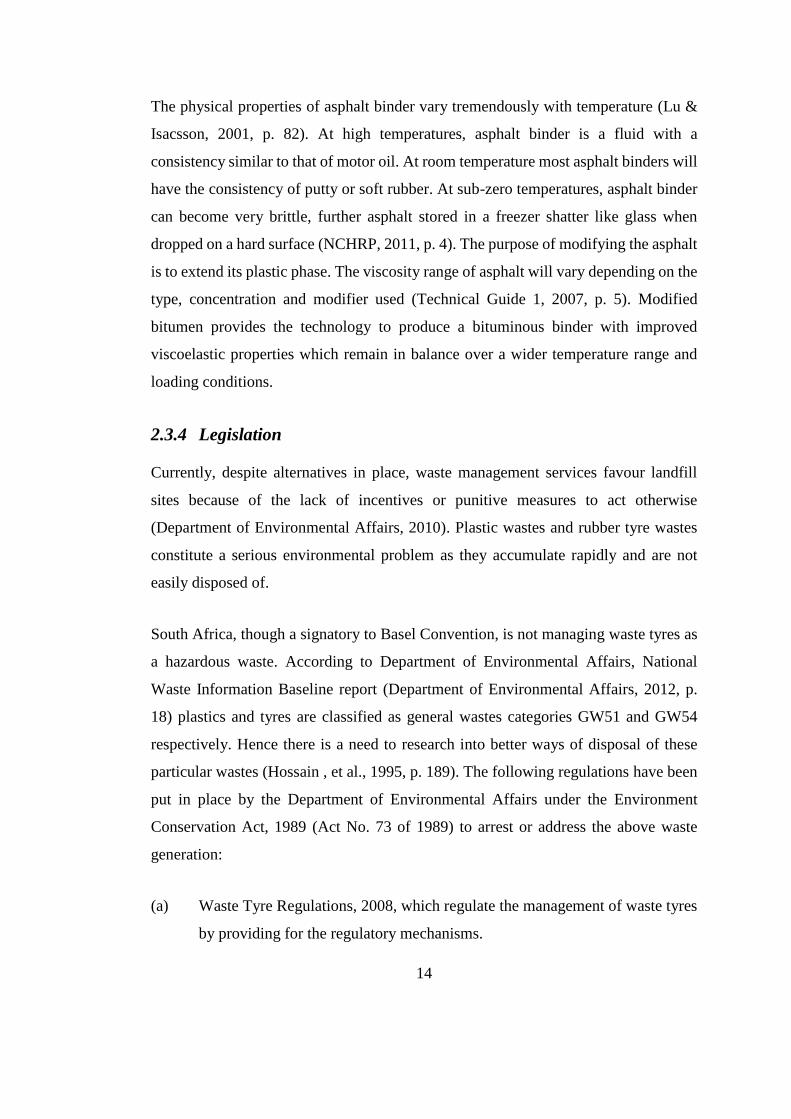
2.3.3 The South African climate
Air temperatures influence the road surface temperatures which in turn dictate the type
and grade of binder to be used. Air and road temperatures are strongly affected by
altitude. The average annual air temperatures in South Africa vary from less than 13˚C
in the central mountain areas to 17˚C in the broader central and southern coastal areas
and to 22˚C or more in the western, northern and eastern parts of the country (TRH 3,
2007, p. 3). In these areas, maximum air temperatures may exceed 35˚C (40˚C in the
northern and eastern parts of South Africa) as shown in Figure 2.4. On the Highveld
and in the mountainous regions, minimum temperatures may be as low as -8˚C
(temperatures below -10˚C have been recorded). Minimum temperatures mainly occur
during June and July (TRH 3, 2007, p. 3) as shown in Figure 2.5.
13
Figure 2.4: Estimated hours per year with asphalt surface temperatures above 50 ˚C
(The South African National Roads Agency, 2001, p. 2-10)
Figure 2.5: Estimated hours per year with asphalt surface temperatures below 5 ˚C
(The South African National Roads Agency, 2001, p. 2-10)
14
The physical properties of asphalt binder vary tremendously with temperature (Lu &
Isacsson, 2001, p. 82). At high temperatures, asphalt binder is a fluid with a
consistency similar to that of motor oil. At room temperature most asphalt binders will
have the consistency of putty or soft rubber. At sub-zero temperatures, asphalt binder
can become very brittle, further asphalt stored in a freezer shatter like glass when
dropped on a hard surface (NCHRP, 2011, p. 4). The purpose of modifying the asphalt
is to extend its plastic phase. The viscosity range of asphalt will vary depending on the
type, concentration and modifier used (Technical Guide 1, 2007, p. 5). Modified
bitumen provides the technology to produce a bituminous binder with improved
viscoelastic properties which remain in balance over a wider temperature range and
loading conditions.
2.3.4 Legislation
Currently, despite alternatives in place, waste management services favour landfill
sites because of the lack of incentives or punitive measures to act otherwise
(Department of Environmental Affairs, 2010). Plastic wastes and rubber tyre wastes
constitute a serious environmental problem as they accumulate rapidly and are not
easily disposed of.
South Africa, though a signatory to Basel Convention, is not managing waste tyres as
a hazardous waste. According to Department of Environmental Affairs, National
Waste Information Baseline report (Department of Environmental Affairs, 2012, p.
18) plastics and tyres are classified as general wastes categories GW51 and GW54
respectively. Hence there is a need to research into better ways of disposal of these
particular wastes (Hossain , et al., 1995, p. 189). The following regulations have been
put in place by the Department of Environmental Affairs under the Environment
Conservation Act, 1989 (Act No. 73 of 1989) to arrest or address the above waste
generation:
(a) Waste Tyre Regulations, 2008, which regulate the management of waste tyres
by providing for the regulatory mechanisms.
15
(b) Regulations under section 24(d) of the ECA – plastic carrier bags and plastic
flat bags, 2003, which regulate the manufacture, trade and commercial
distribution of domestically produced and imported plastic carrier bags and
plastic flat bags.
(c) Regulations regarding waste disposal sites, 1994, which regulate the
establishment and operation of landfill sites in the Republic of South Africa.
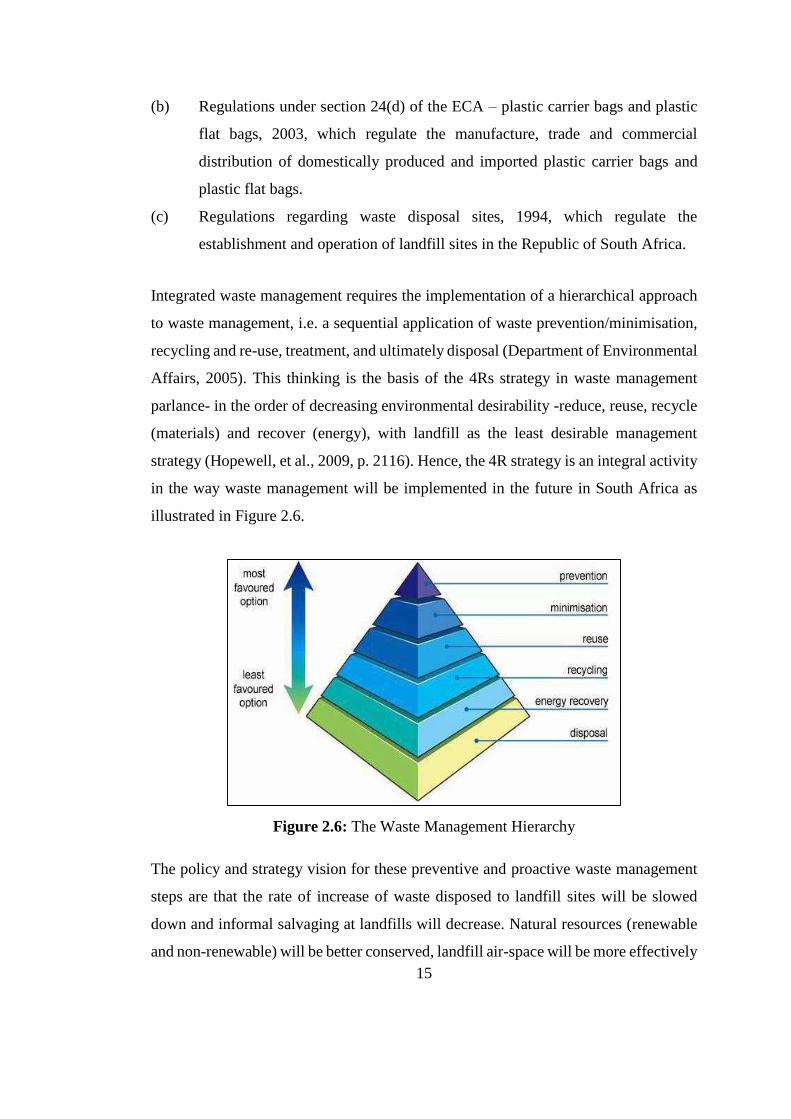
Integrated waste management requires the implementation of a hierarchical approach
to waste management, i.e. a sequential application of waste prevention/minimisation,
recycling and re-use, treatment, and ultimately disposal (Department of Environmental
Affairs, 2005). This thinking is the basis of the 4Rs strategy in waste management
parlance- in the order of decreasing environmental desirability -reduce, reuse, recycle
(materials) and recover (energy), with landfill as the least desirable management
strategy (Hopewell, et al., 2009, p. 2116). Hence, the 4R strategy is an integral activity
in the way waste management will be implemented in the future in South Africa as
illustrated in Figure 2.6.
Figure 2.6: The Waste Management Hierarchy
The policy and strategy vision for these preventive and proactive waste management
steps are that the rate of increase of waste disposed to landfill sites will be slowed
down and informal salvaging at landfills will decrease. Natural resources (renewable
and non-renewable) will be better conserved, landfill air-space will be more effectively
16
utilised, and pollution and environmental degradation will be reduced. In addition,
recycling has the potential for job creation, by promoting entrepreneurs to establish
community collection systems and recycling centres.
2.4 Hot Mix Asphalt
Hot-mix asphalt has been used in South Africa since the 1920s (SABITA, 2005, p. 8).
The term hot mix asphalt (HMA) is generally used to describe a variety of mixtures of
aggregate, bitumen and mineral filler that are produced at an elevated temperature in
an asphalt plant (SABITA, 2008, p. 1). Small amounts of additives and admixtures
could be added to many HMA mixtures to enhance their performance or workability.
These additives include fibres, crumb rubber, and anti-strip additives (NCHRP, 2011,
p. 4). The types of HMA most frequently used in tropical countries are manufactured
in an asphalt plant by hot-mixing appropriate proportions of the following materials:
2.4.1 Aggregates
There are a number of formal definitions of aggregate. In terms of road building,
aggregate is defined as hard material which is generally derived from the crushing of
solid rock or boulders (SANRAL, 2013, pp. 3-12).
Course aggregates material have particles larger than 4.75 mm.
Fine aggregates may be in form of sand, gravel, crushed stone or a blend of
these having particles less than 4.75 mm and larger than 0.075 mm.
Filler is mineral material less than 0.075 mm in size and may include stone
dust, fly-ash, hydrated lime, Portland cement or a combination of these. Filler
acts as an extender to the binder in an asphalt mix. It acts as a void-filling
material to give a dense durable mix as well as stiffens the mix to improve
resistance to plastic deformation.
Aggregates should be free of organic matter, clay lumps and soil which make it
susceptible to binder stripping.
17
2.4.2 Penetration grade bitumen
Penetration grade bitumen is classified by its penetration, and is commonly supplied
in the following grades; 40/50 pen, 60/70 pen, 80/100 pen and 150/200 pen (SANRAL,
2013, p. 15). Typically, the selection of penetration grade bitumen is made on the basis
of climate, traffic volumes and speed, and aggregate shape. Higher values of
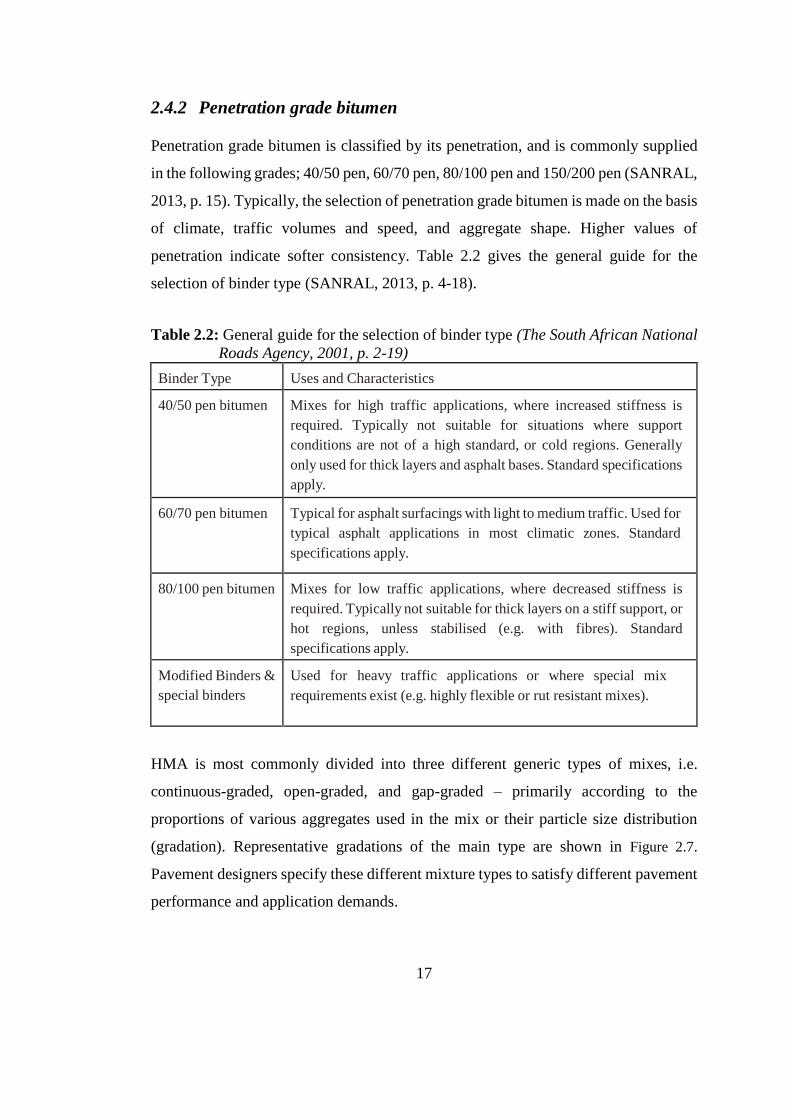
penetration indicate softer consistency. Table 2.2 gives the general guide for the
selection of binder type (SANRAL, 2013, p. 4-18).
Table 2.2: General guide for the selection of binder type (The South African National
Roads Agency, 2001, p. 2-19)
Binder Type Uses and Characteristics
40/50 pen bitumen Mixes for high traffic applications, where increased stiffness is
required. Typically not suitable for situations where support
conditions are not of a high standard, or cold regions. Generally
only used for thick layers and asphalt bases. Standard specifications
apply.
60/70 pen bitumen Typical for asphalt surfacings with light to medium traffic. Used for
typical asphalt applications in most climatic zones. Standard
specifications apply.
80/100 pen bitumen Mixes for low traffic applications, where decreased stiffness is
required. Typically not suitable for thick layers on a stiff support, or
hot regions, unless stabilised (e.g. with fibres). Standard
specifications apply.
Modified Binders &
special binders
Used for heavy traffic applications or where special mix
requirements exist (e.g. highly flexible or rut resistant mixes).
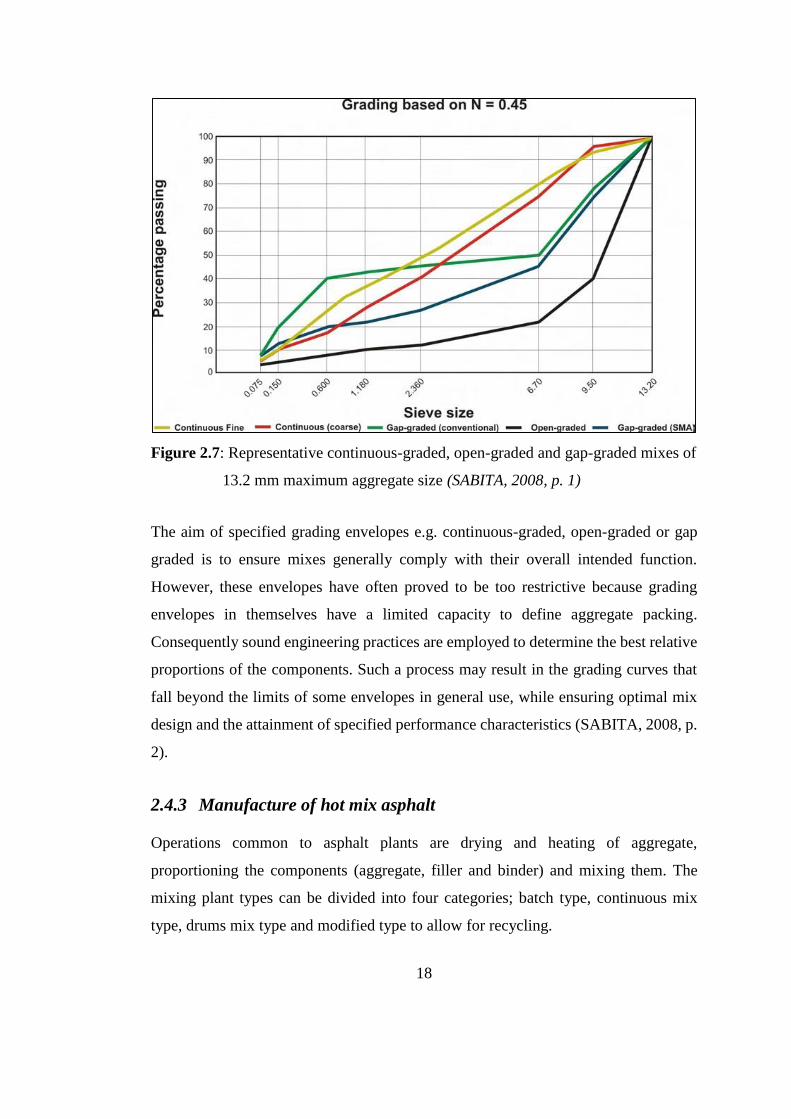
HMA is most commonly divided into three different generic types of mixes, i.e.
continuous-graded, open-graded, and gap-graded – primarily according to the
proportions of various aggregates used in the mix or their particle size distribution
(gradation). Representative gradations of the main type are shown in Figure 2.7.
Pavement designers specify these different mixture types to satisfy different pavement
performance and application demands.
18
Figure 2.7: Representative continuous-graded, open-graded and gap-graded mixes of
13.2 mm maximum aggregate size (SABITA, 2008, p. 1)
The aim of specified grading envelopes e.g. continuous-graded, open-graded or gap
graded is to ensure mixes generally comply with their overall intended function.
However, these envelopes have often proved to be too restrictive because grading
envelopes in themselves have a limited capacity to define aggregate packing.
Consequently sound engineering practices are employed to determine the best relative
proportions of the components. Such a process may result in the grading curves that
fall beyond the limits of some envelopes in general use, while ensuring optimal mix
design and the attainment of specified performance characteristics (SABITA, 2008, p.
2).
2.4.3 Manufacture of hot mix asphalt
Operations common to asphalt plants are drying and heating of aggregate,
proportioning the components (aggregate, filler and binder) and mixing them. The
mixing plant types can be divided into four categories; batch type, continuous mix
type, drums mix type and modified type to allow for recycling.
19
In a batch plant aggregates are drawn from storage or stockpiles in controlled amounts
in a cold feed unit and passed through a rotary dryer where they are dried and heated.
The heated aggregates then pass over a screening unit which separates the material
into different sized fractions and deposits them into bins for hot storage. The
aggregates and mineral filler (when used) are then withdrawn from the bins in
controlled amounts into a pug mill, where they are combined with binder and
thoroughly mixed in a batch. The mixing temperatures for 60/70 bitumen penetration
grade is 140 -170˚C (Department for International Development, 2002, p. 24). The mix
is either stored in special bins or loaded into trucks and hauled to the paving site. Where
aggregate gradations are consistent and the cold feed calibration system is in good
order, the screening unit may be bypassed. In this case the mix composition is
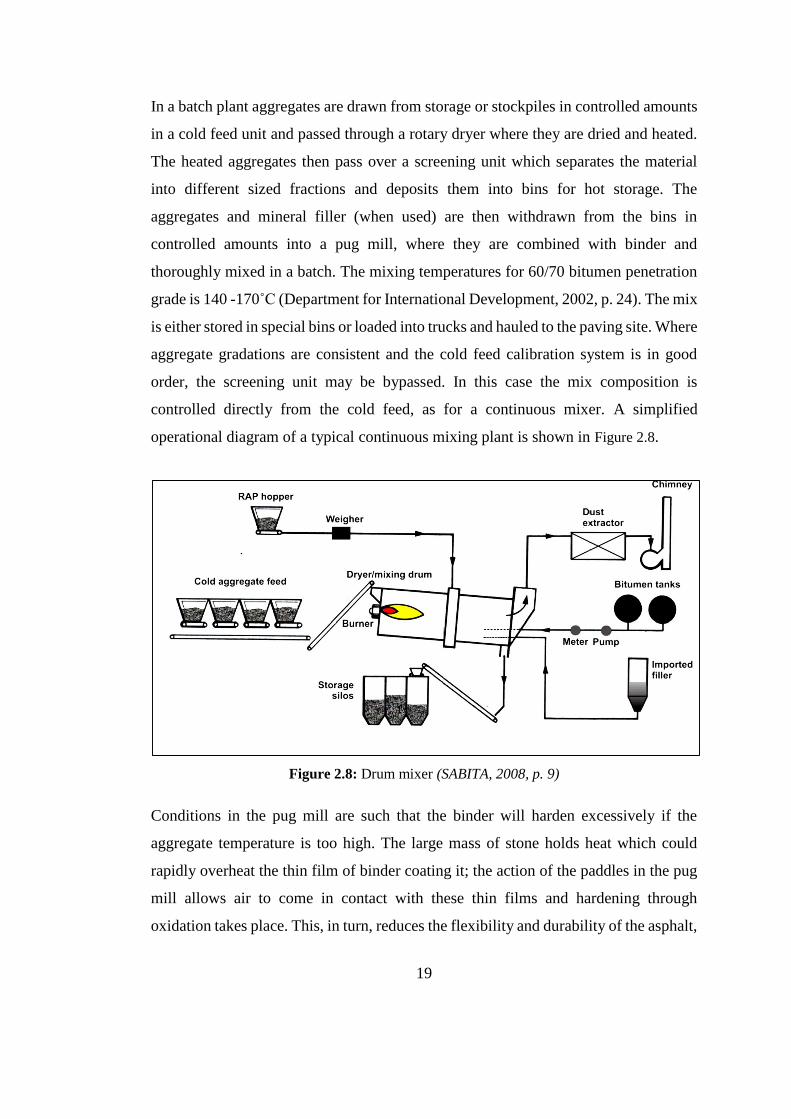
controlled directly from the cold feed, as for a continuous mixer. A simplified
operational diagram of a typical continuous mixing plant is shown in Figure 2.8.
Figure 2.8: Drum mixer (SABITA, 2008, p. 9)
Conditions in the pug mill are such that the binder will harden excessively if the
aggregate temperature is too high. The large mass of stone holds heat which could
rapidly overheat the thin film of binder coating it; the action of the paddles in the pug
mill allows air to come in contact with these thin films and hardening through
oxidation takes place. This, in turn, reduces the flexibility and durability of the asphalt,
20
shortening its effective life. Mixing should therefore take place at as low a temperature
and as short a cycle as will provide complete coating of the aggregate particles.
Optimal mix cycles are between 45 – 50 seconds, of which the wet mixing times are
30 – 35 seconds to ensure adequate coating of the aggregate (SABITA, 2008, p. 10).
The mixing times may have to be increased if additives such as bitumen modifiers or
cellulose fibres are added. Too long a mixing cycle can result in excessive binder
ageing. The modifiers used in this research tend to increase the viscosity and therefore
may reduce workability. It is necessary to ensure that the binders are workable enough
so that the mineral aggregates are properly coated during the production. To achieve
the required workability the mixing and compaction temperatures are usually
increased. This can result in increased production cost, loss of volatiles, increased
oxidative ageing and possible degradation of the modifier (Bahia & Perdomo, 1996,
p. 1192). The waste materials in the production process results to
emissions/fumes/odour problems because HMA is produced at high temperatures.
However very tight emission and environmental controls are already in place on HMA
production facilities therefore there is no need for change in production equipment.
2.5 Pavement Deterioration
2.5.1 Introduction
The process of deformation of bituminous surfacing is accelerated by increase of
pavement temperature, reduction in stiffness of the mix and increase in traffic loads
(Jain, et al., 2011, p. 233). One of the initiatives aimed at increasing the design life of
heavy-trafficked road sections is the high-modulus asphalt that combines superior
permanent deformation resistance with high structural strength and good endurance.
A higher performance pavement requires bitumen that is less susceptible to high
temperature rutting or low temperature cracking (Chen, et al., 2003, p. 594). To a large
extent, the stiffness and strength of mixtures determine the performance of asphalt
pavements.
21
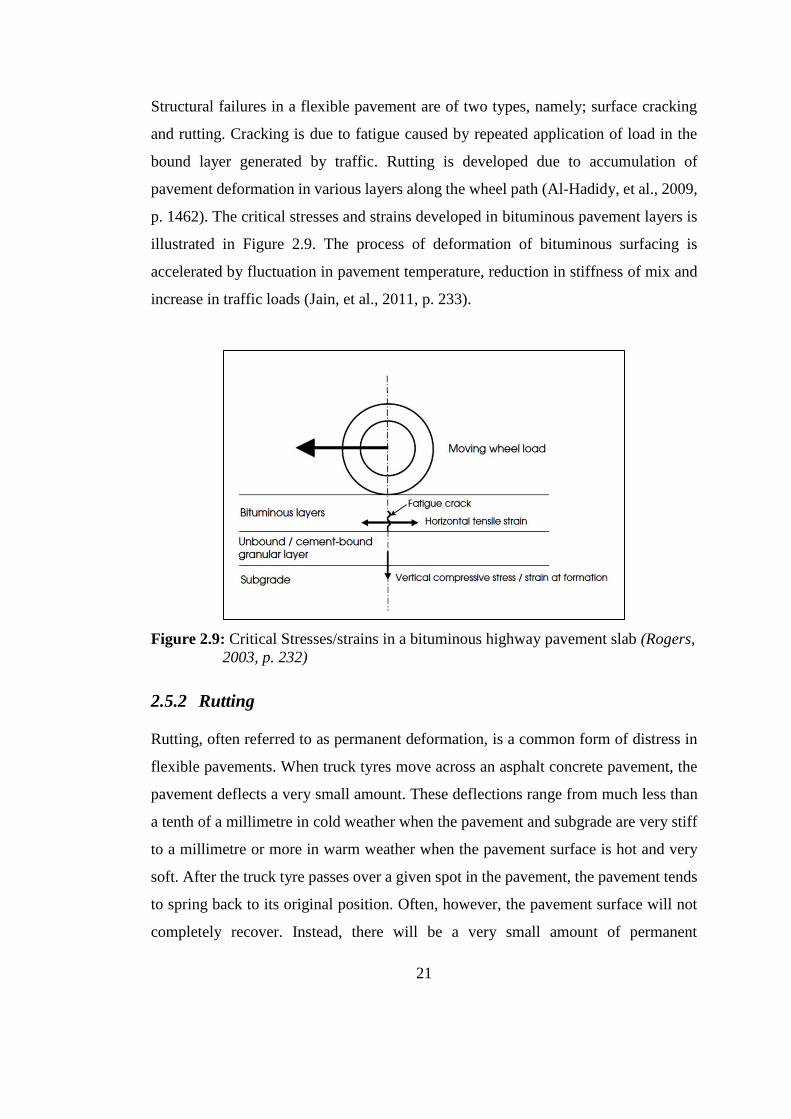
Structural failures in a flexible pavement are of two types, namely; surface cracking
and rutting. Cracking is due to fatigue caused by repeated application of load in the
bound layer generated by traffic. Rutting is developed due to accumulation of
pavement deformation in various layers along the wheel path (Al-Hadidy, et al., 2009,
p. 1462). The critical stresses and strains developed in bituminous pavement layers is
illustrated in Figure 2.9. The process of deformation of bituminous surfacing is
accelerated by fluctuation in pavement temperature, reduction in stiffness of mix and
increase in traffic loads (Jain, et al., 2011, p. 233).
Figure 2.9: Critical Stresses/strains in a bituminous highway pavement slab (Rogers,
2003, p. 232)
2.5.2 Rutting
Rutting, often referred to as permanent deformation, is a common form of distress in
flexible pavements. When truck tyres move across an asphalt concrete pavement, the
pavement deflects a very small amount. These deflections range from much less than
a tenth of a millimetre in cold weather when the pavement and subgrade are very stiff
to a millimetre or more in warm weather when the pavement surface is hot and very
soft. After the truck tyre passes over a given spot in the pavement, the pavement tends
to spring back to its original position. Often, however, the pavement surface will not
completely recover. Instead, there will be a very small amount of permanent
22
deformation in the wheel path. After many wheel loads have passed over the pavement
perhaps only a few thousand in a poorly constructed pavement, to 10 million or more
for one properly designed and constructed for heavy traffic loads this rutting can
become significant. Severely rutted pavements can have ruts 20 mm or more in depth.
Rutting is a serious problem because the ruts contribute to a rough riding surface and
can fill with water during rain or snow events, which can then cause vehicles traveling
on the road to hydroplane and lose control (NCHRP, 2011, p. 7). Rut depths of about
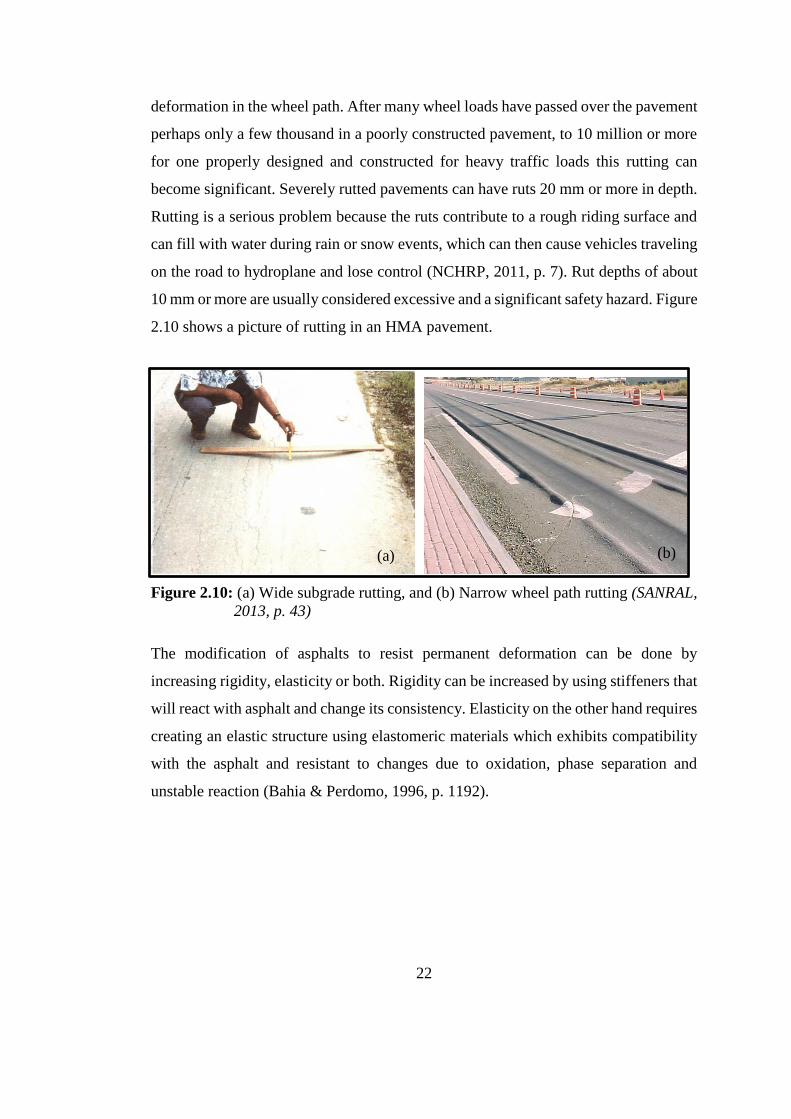
10 mm or more are usually considered excessive and a significant safety hazard. Figure
2.10 shows a picture of rutting in an HMA pavement.
Figure 2.10: (a) Wide subgrade rutting, and (b) Narrow wheel path rutting (SANRAL,
2013, p. 43)
The modification of asphalts to resist permanent deformation can be done by
increasing rigidity, elasticity or both. Rigidity can be increased by using stiffeners that
will react with asphalt and change its consistency. Elasticity on the other hand requires
creating an elastic structure using elastomeric materials which exhibits compatibility
with the asphalt and resistant to changes due to oxidation, phase separation and
unstable reaction (Bahia & Perdomo, 1996, p. 1192).
(a) (b)
23
2.5.3 Fatigue cracking
Like rutting, fatigue cracking results from the large number of loads applied over time
to a pavement subjected to traffic (NCHRP, 2011, p. 7). However, fatigue cracking
tends to occur when the pavement is at moderate to low temperatures, rather than at
the high temperatures that cause rutting. This is because the HMA at low temperatures
is stiffer and more brittle than at high temperatures, it tends to crack under repeated
loading rather than deform. Under the action of traffic loading, the initially
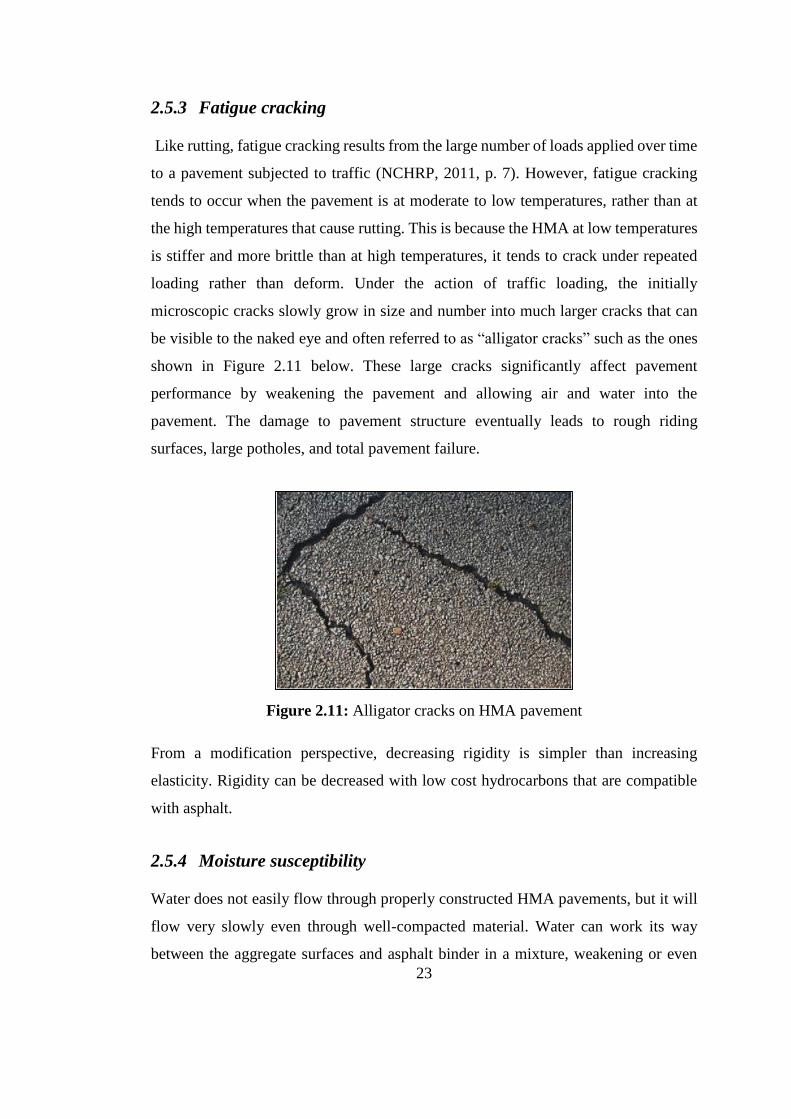
microscopic cracks slowly grow in size and number into much larger cracks that can
be visible to the naked eye and often referred to as “alligator cracks” such as the ones
shown in Figure 2.11 below. These large cracks significantly affect pavement
performance by weakening the pavement and allowing air and water into the
pavement. The damage to pavement structure eventually leads to rough riding
surfaces, large potholes, and total pavement failure.
Figure 2.11: Alligator cracks on HMA pavement
From a modification perspective, decreasing rigidity is simpler than increasing
elasticity. Rigidity can be decreased with low cost hydrocarbons that are compatible
with asphalt.
2.5.4 Moisture susceptibility
Water does not easily flow through properly constructed HMA pavements, but it will
flow very slowly even through well-compacted material. Water can work its way
between the aggregate surfaces and asphalt binder in a mixture, weakening or even
24
totally destroying the bond between these two materials. This moisture damage is
called stripping. Moisture damage can occur quickly when water is present underneath
a pavement, as when pavements are built over poorly drained areas and are not
properly designed or constructed to remove water from the pavement structure. Even
occasional exposure to water can cause moisture damage in HMA mixtures prone to it
because of faulty design or construction or poor materials selection. The
physicochemical processes that control moisture damage are complex and only now
are beginning to be understood (NCHRP, 2011, p. 9). Different combinations of
asphalt binder and aggregate will exhibit widely varying degrees of resistance to
moisture damage. It is very difficult to predict the moisture resistance of a particular
combination of asphalt and aggregate. Hot Mix Asphalt produced with aggregates
containing a large amount of silica, such as sandstone, quartzite, chert, and some
granites, tend to be more susceptible to moisture damage (NCHRP, 2011, p. 9). Proper
construction, especially thorough compaction, can help reduce the permeability of
HMA pavements and so significantly reduce the likelihood of moisture damage. Anti-
stripping additives can be added to HMA mixtures to improve their moisture
resistance. Hydrated lime is one of the most common and most effective of such
additives.
2.6 Modification Technology
2.6.1 Introduction
Road conditions are not static due to continuing developments in vehicle and tyre
designs as well as traffic volumes and loading (Anochie-Boeteng, et al., 2011, p. 563;
Department for International Development, 2002, p. 6) resulting into an increase in the
stresses applied to the road. Heavier loads, higher traffic volume and higher tyre
pressure demand higher performance pavements. The situation is worsened by the
present drastic climatic variations that impact negatively on road pavements. This, in
addition to the high cost of asphalt production has induced rigorous research in
establishing a substitute or modification to improve the quality of the pavement.
25
The processes of asphalt modification involving natural and synthetic polymers were
patented as early as 1843 (Kalantar, et al., 2012, p. 56). Test projects were underway
in Europe in the 1930s, and neoprene latex began to be used in North America in the
1950s. In the late 1970s, Europe was ahead of the United States in the use of modified
asphalts. This is because Europe used contractors who provided warranties thus
motivated a greater interest in decreased life cycle costs, even at higher initial costs.
The high preliminary expenses for polymer modified asphalt limited its use in the US.
In the mid-1980s, newer polymers were developed and European technologies began
to be used in the US (King, et al., 1993, p. 2). At the same time, the prevalence of a
long-term economic outlook increased. In Australia, the current National Asphalt
Specification includes guides and specifications regarding polymer modified binders
(Yildirim, 2007, p. 66). More recently and South Africa’s Asphalt academy and
Southern African Bitumen Association (SABITA) have developed technical
guidelines and manual for the use of modified binders in asphalt pavement
applications.
The use of modifiers in asphalt concrete generally has two distinct approaches referred
to as the ‘wet’ and ‘dry’ processes (Huang, et al., 2007, p. 64). The ‘wet process’
defines any method that blends the modifier with the asphalt binder prior to
incorporating the binder into the asphalt mixture (Heitzman & Michael , 1992, p. 6).
This process involves dissolving the polymer modifier in the bitumen at high
temperatures to produce a viscous fluid through polymer-bitumen interaction
(Gawandea, et al., 2012, p. 4; Flynn, 1993, p. 41). In the ‘dry process’ a portion of
mineral aggregates is replaced with ground rubber (0.85-6.4 mm) at typically a 1-3%
replacement rate (Huang, et al., 2007, p. 66). In this process the reaction time between
asphalt cement and crumb rubber is limited so that the crumb rubber can retain its
physical shape and rigidity (Heitzman & Michael , 1992, p. 20; Huang, et al., 2007, p.
67)
Although the dry process presents some advantages in relation to the wet process,
mainly concerning the costs involved and to the higher amount of modifier to be used,
26
related research has concentrated mainly on the wet process. This choice may be
explained by the irregular performance of some experimental sections built with the
dry process, unlike the wet process, which has presented more satisfactory results
(Cao, 2007, p. 1011). Considerable research into the wet process and the production
of Crumb Rubber Modified (CRM) binders have been undertaken in South Africa over
the past decade. The wet process is more popular because the binder properties are
better controlled although its application requires modification of equipment
(Heitzman & Michael , 1992, p. 25). On the other hand, the dry process is a far less
popular method due to the need for specially graded aggregate to incorporate the
reclaimed tyre crumb, construction difficulties and most importantly poor
reproducibility and premature failures in terms of cracking and ravelling of the asphalt
road surfacing. In addition, field trials have shown the performance of dry process
CRM material used as a surface layer to be inconsistent and service life varies (Cao,
2007, p. 1011).
There are several reasons for this inconsistency and variation. The main assumption
with the dry process is that rubber crumb is solely part of the aggregate and the reaction
between bitumen and crumb rubber is negligible. However, recent research has
showed that in the dry process, crumb rubber swells and reacts with bitumen at
elevated temperatures and has an effect on the performance of the bitumen and,
therefore, the asphalt mixture (Airey, et al., 2004, p. 455). The organic solvents in the
bitumen diffuse into the bulk of the rubber increasing the dimensions of the rubber
network until the concentration of the liquid is uniform and equilibrium is achieved
(Heitzman & Michael , 1992, p. A-2). Hence the residual bitumen, i.e. bitumen not
absorbed by the rubber, is the medium which binds the mineral aggregates and crumb
rubber together (Airey, et al., 2001, p. 454). The interaction process depends on a
number of variables, such as blending temperature, blending time, type and amount of
mechanical mixing, polymer type, size and effective surface area of the polymer and
the type of bitumen. Tyre properties also change with age and vary from manufacturer
to manufacturer and this variability of scrap tyre source makes it even more difficult
to control the consistency of the properties of the crumb rubber and consequently the
27
properties of the mixture (Rahman , et al., 2011, p. 121). Therefore, the effect of crumb
rubber particles in the dry process is different from the wet process as the binder
modification and rubber swelling could change the mechanical properties of the
mixtures.
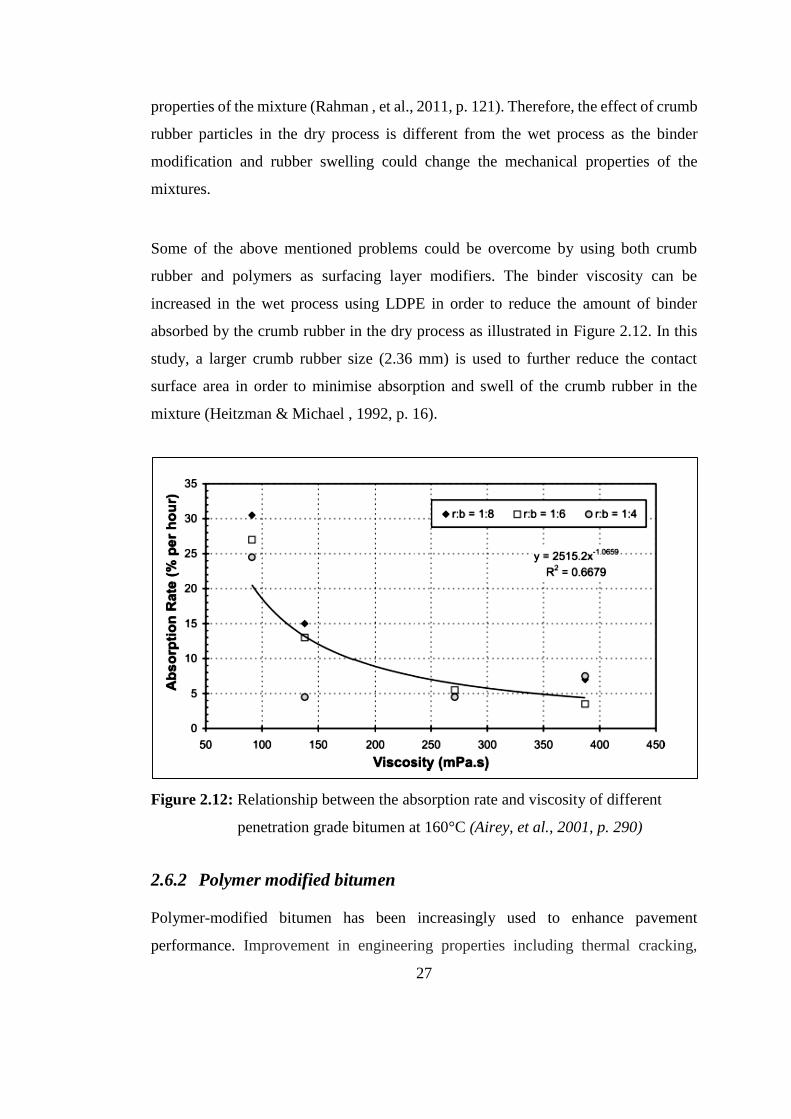
Some of the above mentioned problems could be overcome by using both crumb
rubber and polymers as surfacing layer modifiers. The binder viscosity can be
increased in the wet process using LDPE in order to reduce the amount of binder
absorbed by the crumb rubber in the dry process as illustrated in Figure 2.12. In this
study, a larger crumb rubber size (2.36 mm) is used to further reduce the contact
surface area in order to minimise absorption and swell of the crumb rubber in the
mixture (Heitzman & Michael , 1992, p. 16).
Figure 2.12: Relationship between the absorption rate and viscosity of different
penetration grade bitumen at 160°C (Airey, et al., 2001, p. 290)
2.6.2 Polymer modified bitumen
Polymer-modified bitumen has been increasingly used to enhance pavement
performance. Improvement in engineering properties including thermal cracking,
28
stripping, rutting resistance, temperature susceptibility and fatigue damage have led to
polymer modified binders to be a substitute for asphalt in paving and maintenance
applications such as cold and hot crack filling, slurry seal, patching, hot mix, chip seals
and recycling (Huang, et al., 2007; Yildirim, 2007, p. 70). The polymer in a polymer
modified asphalt (PMA) road should neither make it too viscous at high service
temperatures resulting in permanent deformation or too brittle at low service
temperatures resulting in fatigue cracking (Alonso, et al., 2010, p. 2591).
The study by Chen et al. (2003, p. 594) was aimed at developing the procedure to
determine the proper polymer content to be mixed with bitumen using two styrene
butadiene-styrene (SBS) copolymers. The storage stability, shear rheometer and
scanning electron microscopy (SEM) tests were conducted to investigate visco-elastic
properties and microstructure of the polymer PMB. The investigation revealed that the
addition of polymers increased the viscosity, softening point, toughness and complex
modulus of bitumen. SEM results indicated that, as the polymer content increased,
SBS gradually became the dominant phase and resulted in an increase in PMB’s
mechanical properties. Good compatibility produced an elastic network into the PMB
up to 6% polymer concentration. The optimum polymer content was determined based
on the rheological properties and formation of a critical network. However, adding
higher polymer contents could lead to the separation of polymer and bitumen. In a
paper by Jain et.al, (2011,p.237) it is reported that an increase in stiffness modulus of
bituminous mixes is achieved by incorporation of waste polymeric packaging material
(WPPM) through an optimum dose of WPPM of 0.3 to 0.4% by weight of bituminous
mix for modification of bitumen and bitumen mix. There is little information to date
about the use of PET in hot mix asphalt (Ahmadinia, et al., 2011, p. 4845).
Zoorob and Suparma (2000, p. 238) discusses the laboratory design of continuously
graded asphaltic concrete mixtures containing recycled plastics aggregate replacement
(Plastiphalt). Recycled waste plastics composed predominantly of low density
polyethylene (LDPE) in pellet form were used in dense graded bituminous mixes to
replace, by volume, a portion of the mineral aggregates of an equal size, i.e., 5.00.-
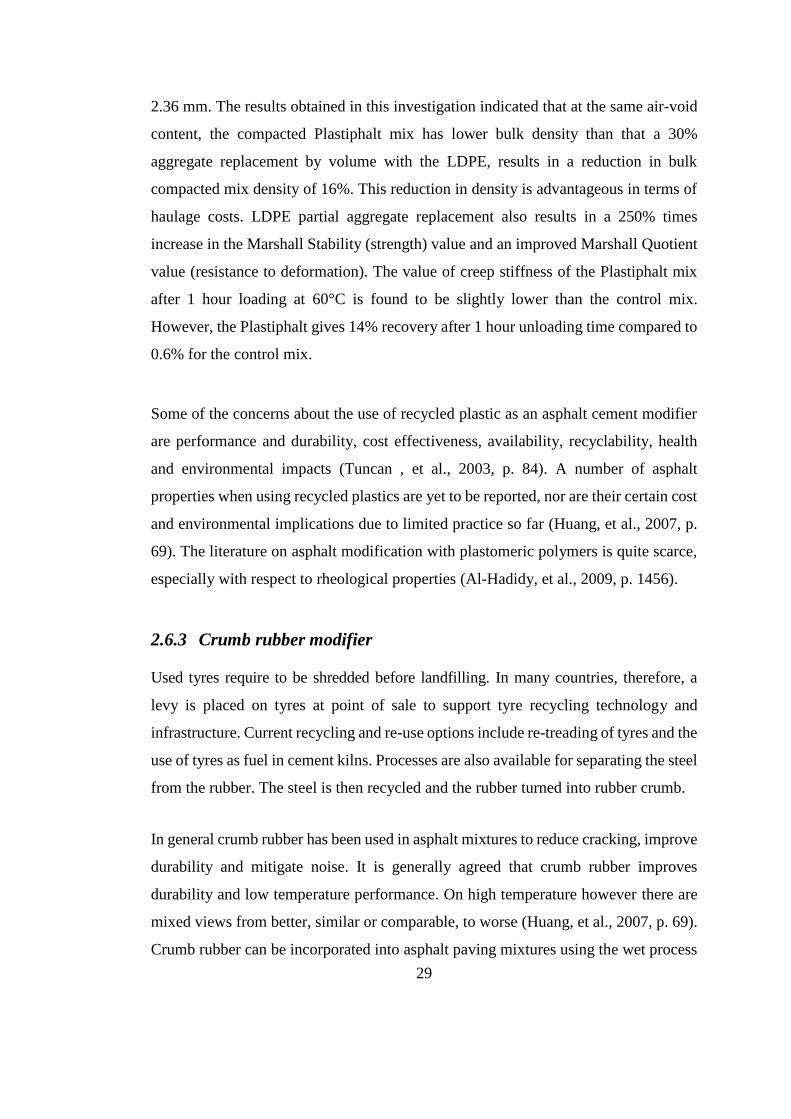
29
2.36 mm. The results obtained in this investigation indicated that at the same air-void
content, the compacted Plastiphalt mix has lower bulk density than that a 30%
aggregate replacement by volume with the LDPE, results in a reduction in bulk
compacted mix density of 16%. This reduction in density is advantageous in terms of
haulage costs. LDPE partial aggregate replacement also results in a 250% times
increase in the Marshall Stability (strength) value and an improved Marshall Quotient
value (resistance to deformation). The value of creep stiffness of the Plastiphalt mix
after 1 hour loading at 60°C is found to be slightly lower than the control mix.
However, the Plastiphalt gives 14% recovery after 1 hour unloading time compared to
0.6% for the control mix.
Some of the concerns about the use of recycled plastic as an asphalt cement modifier
are performance and durability, cost effectiveness, availability, recyclability, health
and environmental impacts (Tuncan , et al., 2003, p. 84). A number of asphalt
properties when using recycled plastics are yet to be reported, nor are their certain cost
and environmental implications due to limited practice so far (Huang, et al., 2007, p.
69). The literature on asphalt modification with plastomeric polymers is quite scarce,
especially with respect to rheological properties (Al-Hadidy, et al., 2009, p. 1456).
2.6.3 Crumb rubber modifier
Used tyres require to be shredded before landfilling. In many countries, therefore, a
levy is placed on tyres at point of sale to support tyre recycling technology and
infrastructure. Current recycling and re-use options include re-treading of tyres and the
use of tyres as fuel in cement kilns. Processes are also available for separating the steel
from the rubber. The steel is then recycled and the rubber turned into rubber crumb.
In general crumb rubber has been used in asphalt mixtures to reduce cracking, improve
durability and mitigate noise. It is generally agreed that crumb rubber improves
durability and low temperature performance. On high temperature however there are
mixed views from better, similar or comparable, to worse (Huang, et al., 2007, p. 69).
Crumb rubber can be incorporated into asphalt paving mixtures using the wet process
30
or the dry process. There are more studies and experiments on the use of crumb rubber
in bituminous mixes related to the wet process than the dry process. This has made it
possible to establish a set of reference values for different variables that affect its
application with a view to obtain optimal results. In recent years however, the dry
process has also captured the interest of researchers since it consumes larger quantities
of waste than the wet process (Tuncan , et al., 2003, p. 84; Moreno, et al., 2012, p.
2323; Cao, 2007, p. 1011). In addition, the production of modified asphalt mixture by
means of the dry process is logistically easier than the wet process and, therefore, the
dry process is potentially available to a much larger market (Airey, et al., 2004, p.
455).
Liu et al. (2009, p. 2701) evaluated the performance of different crumb rubber
modified (CRM) asphalt and reported that in general the crumb rubber content is the
primary factor affecting the performance of CRM asphalt. Moreno (2012, p. 466),
reports that the addition of crumb rubber significantly improved the performance of
mixes and their response to plastic deformation. Hossain et al. (1995, p. 196) observed
that since rubber is not as hard as the crushed stone aggregates, it follows that the
Marshall stability of an asphalt aggregate chunk rubber mix would be lower than the
mix without chunk rubber. However, it was also surmised that the larger rubber chunks
tend to absorb some of energy imparted to compact a chunk rubber asphalt concrete
(CRAC) sample, resulting in a weaker aggregate structure than a mix without any
chunk rubber. According to Al-Abdul-Wahhab & Al-Amri (1991, p. 189), Mustafa et
al., (2003, p.83) and Siddique & Naik, (2004, p. 568) pavements made of rubber and
plastic modified asphalt concrete have better skid resistance, less cracking and a longer
pavement life in comparison to conventional asphalt pavements. Early investigations
on the use of discarded tyres in asphalt mixtures showed that rubberized asphalt had
better skid resistance, reduced fatigue cracking and longer pavement life than
conventional asphalt (Siddique & Naik, 2004, p. 565).
Cao (2007, p. 1011) in a study to minimize waste tyres pollution and improve
properties of asphalt mixtures investigated the properties of recycled tyre rubber
modified asphalt mixtures using the dry process. Tests on three types of asphalt
31
mixture containing different rubber content (1%, 2% and 3% by weight of total mix)
and a control mixture without rubber were conducted. Based on the results of rutting
tests (60˚C), indirect tensile tests (-10˚C) and variance analysis, the addition of
recycled tyre rubber in asphalt mixtures using dry process could improve engineering
properties of asphalt mixtures, and the rubber content has a significant effect on the
performance of resistance to permanent deformation at high temperature and cracking
at low temperature. Cao (2007) concluded that the long term performance of recycled
tyre rubber modified asphalt mixtures using the dry process required further study.
Research and feasibility studies have shown that bitumen rubber is the most cost
effective modified binder in the South African bituminous product spectrum (Jooste,
2011, p. 597). In South Africa, crumb rubber modified (CRM) bitumen is
manufactured through blending penetration grade bitumen (72-82%), rubber crumbs
(18-24%) and extender oil (0-4%) (Technical Guide 1, 2007, p. 10) at elevated
temperatures of between 190-210 ˚C. Thus large scale use of rubber from waste tyres
in asphalt mixtures appears attractive and promising from the engineering and
environmental point of view (Tuncan , et al., 2003, p. 83).
2.7 Conclusion
The philosophy of asphalt modification is expected to change from a general
improvement of quality to focus more on using modifiers based on the most critical
need as defined by two factors: (a) the application temperature domain, and (b) the
type of distress to be remedied. Current research and practice tends to concentrate on
the use of waste materials in the lower courses (base and sub-base) of the road as they
absorb materials in larger quantities than the upper courses. However, highway
authorities in South Africa are dealing more with the maintenance and repair works
rather than new road construction. Such works are affecting mainly the upper layers
of the pavement. Incorporating recycled waste polymers in pavement does not only
have the potential of improving the performance of the pavement but will also reduce
environmental pollution and need for extraction of mineral aggregates. The need to

32
utilize virgin polymers in pavement will also be reduced, thus leading to possible cost
savings in the long run. An improved asphalt pavement would mean extension in
service life of the pavement. In addition there will be a significant reduction in density
of the asphalt concrete mixture. This is economical in terms of haulage costs when tyre
waste is used as partial replacement of aggregates and reduced bitumen used when
plastic is used as binder modifier. This will further reduce the costs of construction
materials.
33
3 RESEARCH METHODOLOGY
3.1 Introduction
This Chapter focuses on the materials, tests and standards that were used in this study.
These tests are standards as normally applied to bituminous materials and mixtures
used in road pavements. Authorities and publications relevant to test methods which
were used are as follows:
a) TMH1, 1986: Standard Methods of Testing Road Construction Materials,
superseded by SANS 3001
b) TRH8, 1987 used in parallel with Interim Guidelines for the Design of
Hot-Mix Asphalt in South Africa.
c) TRH14, 1985 (reprinted 1989): Guidelines for Road Construction
Materials
d) COLTO, 1998: Standard Specifications for Road and Bridge Works for
State Road Authorities (currently under revision).
e) TG1, 2007: Technical Guideline: The use of Modified Bituminous Binders
in Road Construction Second Edition.
f) ASTM International: Standards and Test Methods for Road Building
Materials.
g) AASHTO Specifications and Test Methods
The HMA design method in South Africa that was used in this study is centred on the
Marshall design method. The design process was divided into four phases namely;
Preliminary considerations leading to mix selection and rating of design
objectives
Component evaluation (aggregate, binder and filler)
Volumetric design leading to gradation and optimum binder content selection
Performance testing
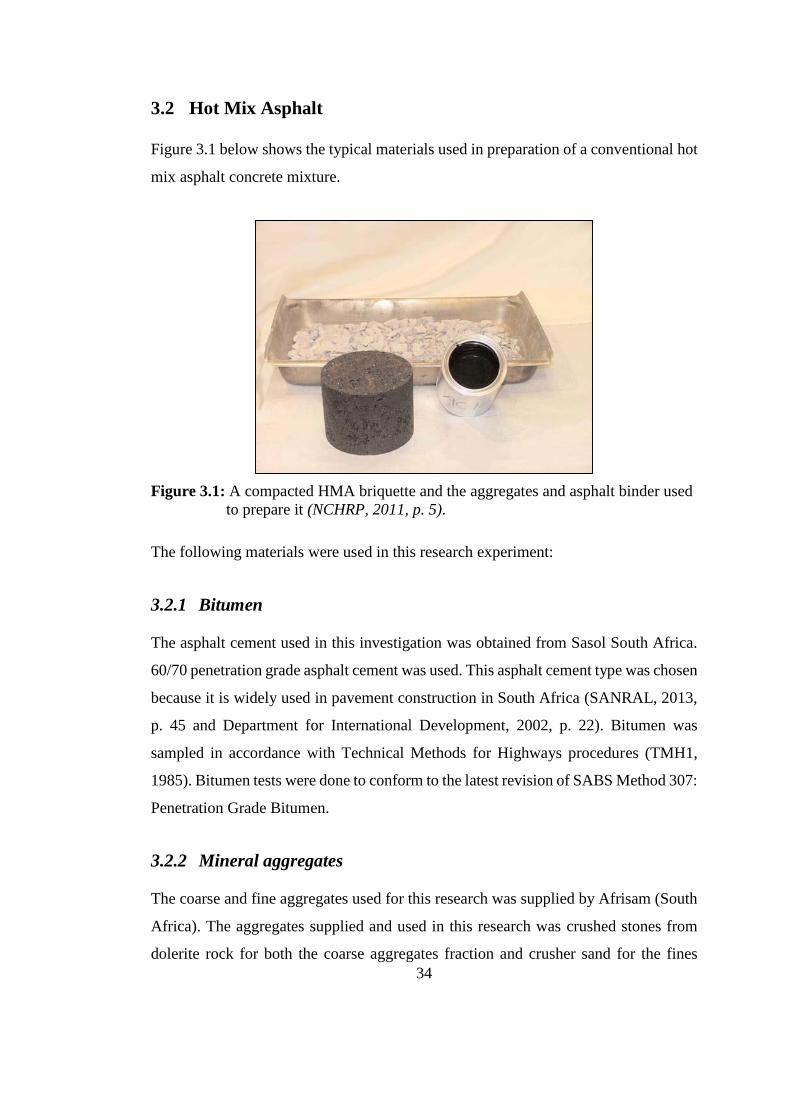
34
3.2 Hot Mix Asphalt
Figure 3.1 below shows the typical materials used in preparation of a conventional hot
mix asphalt concrete mixture.
Figure 3.1: A compacted HMA briquette and the aggregates and asphalt binder used
to prepare it (NCHRP, 2011, p. 5).
The following materials were used in this research experiment:
3.2.1 Bitumen
The asphalt cement used in this investigation was obtained from Sasol South Africa.
60/70 penetration grade asphalt cement was used. This asphalt cement type was chosen
because it is widely used in pavement construction in South Africa (SANRAL, 2013,
p. 45 and Department for International Development, 2002, p. 22). Bitumen was
sampled in accordance with Technical Methods for Highways procedures (TMH1,
1985). Bitumen tests were done to conform to the latest revision of SABS Method 307:
Penetration Grade Bitumen.
3.2.2 Mineral aggregates
The coarse and fine aggregates used for this research was supplied by Afrisam (South
Africa). The aggregates supplied and used in this research was crushed stones from
dolerite rock for both the coarse aggregates fraction and crusher sand for the fines
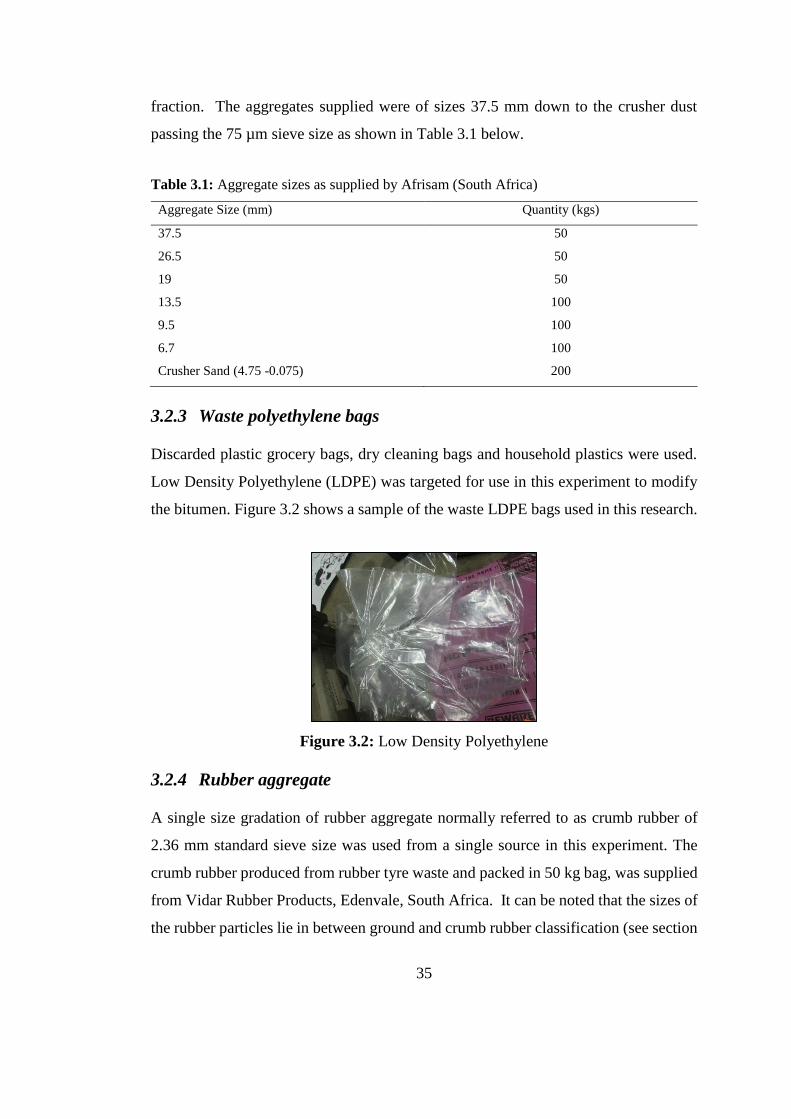
35
fraction. The aggregates supplied were of sizes 37.5 mm down to the crusher dust
passing the 75 µm sieve size as shown in Table 3.1 below.
Table 3.1: Aggregate sizes as supplied by Afrisam (South Africa)
Aggregate Size (mm) Quantity (kgs)
37.5 50
26.5 50
19 50
13.5 100
9.5 100
6.7 100
Crusher Sand (4.75 -0.075) 200
3.2.3 Waste polyethylene bags
Discarded plastic grocery bags, dry cleaning bags and household plastics were used.
Low Density Polyethylene (LDPE) was targeted for use in this experiment to modify
the bitumen. Figure 3.2 shows a sample of the waste LDPE bags used in this research.
Figure 3.2: Low Density Polyethylene
3.2.4 Rubber aggregate
A single size gradation of rubber aggregate normally referred to as crumb rubber of
2.36 mm standard sieve size was used from a single source in this experiment. The
crumb rubber produced from rubber tyre waste and packed in 50 kg bag, was supplied
from Vidar Rubber Products, Edenvale, South Africa. It can be noted that the sizes of
the rubber particles lie in between ground and crumb rubber classification (see section
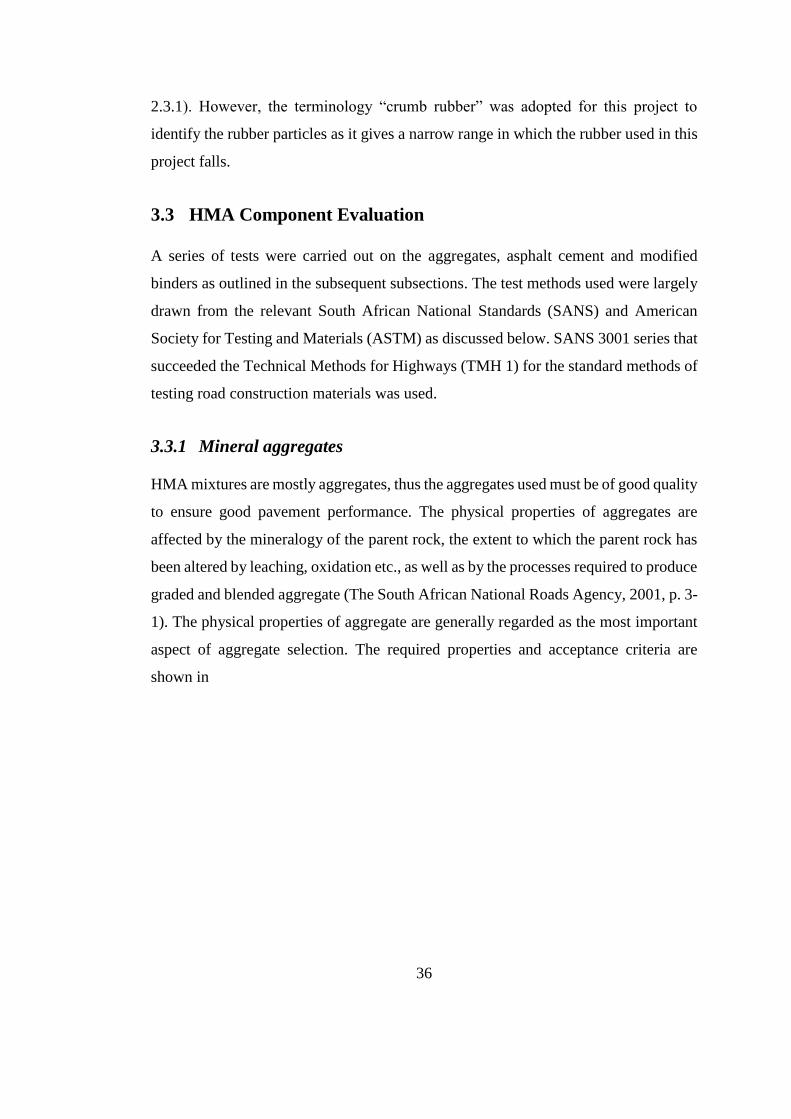
36
2.3.1). However, the terminology “crumb rubber” was adopted for this project to
identify the rubber particles as it gives a narrow range in which the rubber used in this
project falls.
3.3 HMA Component Evaluation
A series of tests were carried out on the aggregates, asphalt cement and modified
binders as outlined in the subsequent subsections. The test methods used were largely
drawn from the relevant South African National Standards (SANS) and American
Society for Testing and Materials (ASTM) as discussed below. SANS 3001 series that
succeeded the Technical Methods for Highways (TMH 1) for the standard methods of
testing road construction materials was used.
3.3.1 Mineral aggregates
HMA mixtures are mostly aggregates, thus the aggregates used must be of good quality
to ensure good pavement performance. The physical properties of aggregates are
affected by the mineralogy of the parent rock, the extent to which the parent rock has
been altered by leaching, oxidation etc., as well as by the processes required to produce
graded and blended aggregate (The South African National Roads Agency, 2001, p. 3-
1). The physical properties of aggregate are generally regarded as the most important
aspect of aggregate selection. The required properties and acceptance criteria are
shown in

37
Table 3.2
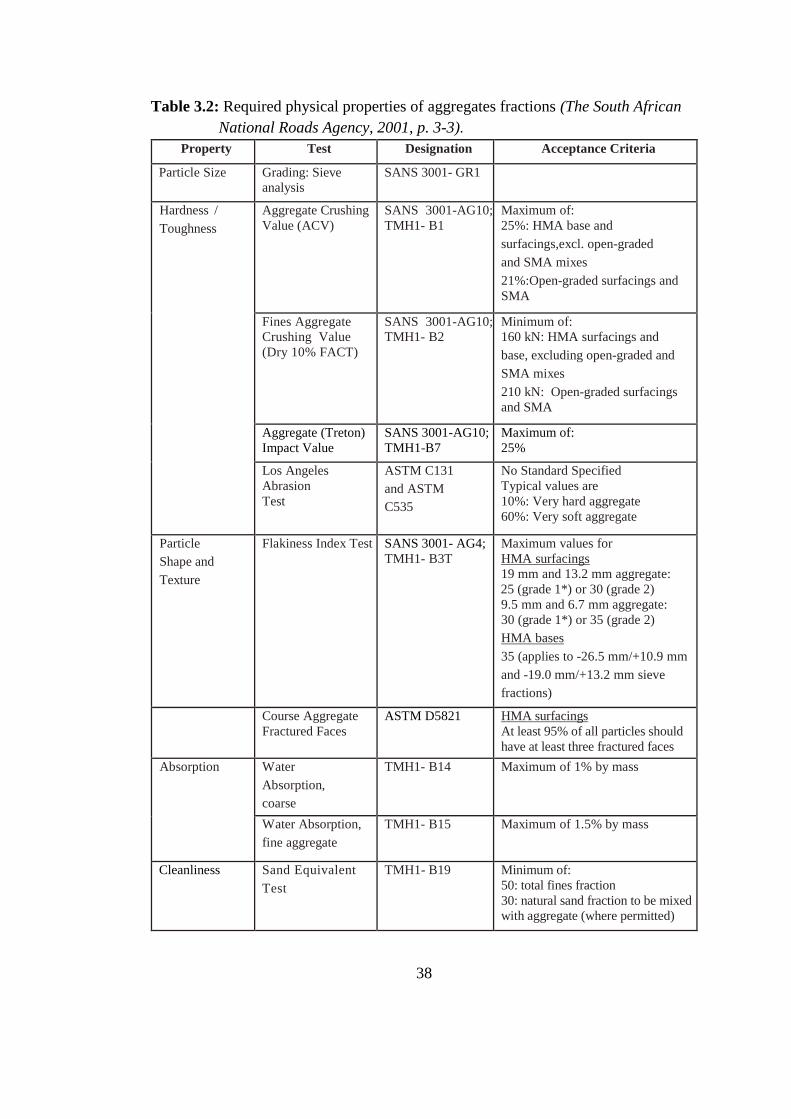
38
Table 3.2: Required physical properties of aggregates fractions (The South African
National Roads Agency, 2001, p. 3-3).
Property Test Designation Acceptance Criteria
Particle Size Grading: Sieve
analysis
SANS 3001- GR1
Hardness /
Toughness
Aggregate Crushing
Value (ACV)
SANS 3001-AG10;
TMH1- B1
Maximum of:
25%: HMA base and
surfacings,excl. open-graded
and SMA mixes
21%:Open-graded surfacings and
SMA
Fines Aggregate
Crushing Value
(Dry 10% FACT)
SANS 3001-AG10;
TMH1- B2
Minimum of:
160 kN: HMA surfacings and
base, excluding open-graded and
SMA mixes
210 kN: Open-graded surfacings
and SMA
Aggregate (Treton)
Impact Value
SANS 3001-AG10;
TMH1-B7
Maximum of:
25%
Los Angeles
Abrasion
Test
ASTM C131
and ASTM
C535
No Standard Specified
Typical values are
10%: Very hard aggregate
60%: Very soft aggregate
Particle
Shape and
Texture
Flakiness Index Test SANS 3001- AG4;
TMH1- B3T
Maximum values for
HMA surfacings
19 mm and 13.2 mm aggregate:
25 (grade 1*) or 30 (grade 2)
9.5 mm and 6.7 mm aggregate:
30 (grade 1*) or 35 (grade 2)
HMA bases
35 (applies to -26.5 mm/+10.9 mm
and -19.0 mm/+13.2 mm sieve
fractions)
Course Aggregate
Fractured Faces
ASTM D5821 HMA surfacings
At least 95% of all particles should
have at least three fractured faces
Absorption Water
Absorption,
coarse
aggregate
TMH1- B14 Maximum of 1% by mass
Water Absorption,
fine aggregate
TMH1- B15 Maximum of 1.5% by mass
Cleanliness Sand Equivalent
Test
TMH1- B19 Minimum of:
50: total fines fraction
30: natural sand fraction to be mixed
with aggregate (where permitted)
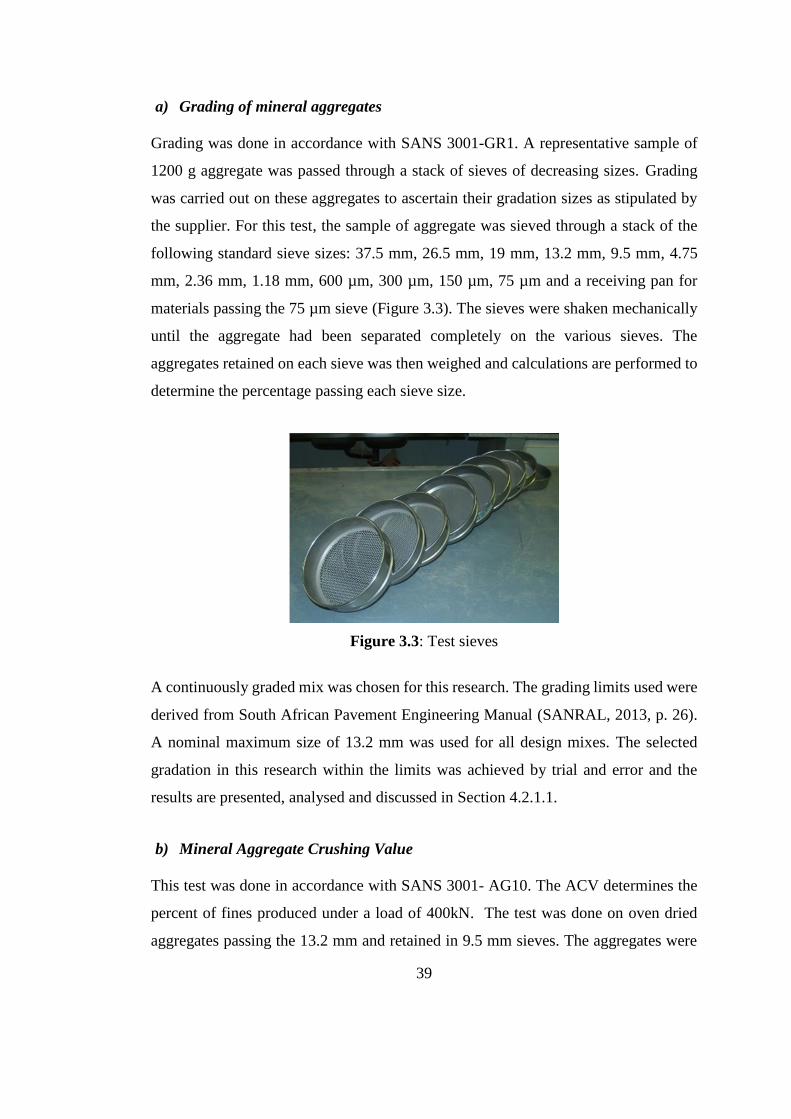
39
a) Grading of mineral aggregates
Grading was done in accordance with SANS 3001-GR1. A representative sample of
1200 g aggregate was passed through a stack of sieves of decreasing sizes. Grading
was carried out on these aggregates to ascertain their gradation sizes as stipulated by
the supplier. For this test, the sample of aggregate was sieved through a stack of the
following standard sieve sizes: 37.5 mm, 26.5 mm, 19 mm, 13.2 mm, 9.5 mm, 4.75
mm, 2.36 mm, 1.18 mm, 600 µm, 300 µm, 150 µm, 75 µm and a receiving pan for
materials passing the 75 µm sieve (Figure 3.3). The sieves were shaken mechanically
until the aggregate had been separated completely on the various sieves. The
aggregates retained on each sieve was then weighed and calculations are performed to
determine the percentage passing each sieve size.
Figure 3.3: Test sieves
A continuously graded mix was chosen for this research. The grading limits used were
derived from South African Pavement Engineering Manual (SANRAL, 2013, p. 26).
A nominal maximum size of 13.2 mm was used for all design mixes. The selected
gradation in this research within the limits was achieved by trial and error and the
results are presented, analysed and discussed in Section 4.2.1.1.
b) Mineral Aggregate Crushing Value
This test was done in accordance with SANS 3001- AG10. The ACV determines the
percent of fines produced under a load of 400kN. The test was done on oven dried
aggregates passing the 13.2 mm and retained in 9.5 mm sieves. The aggregates were
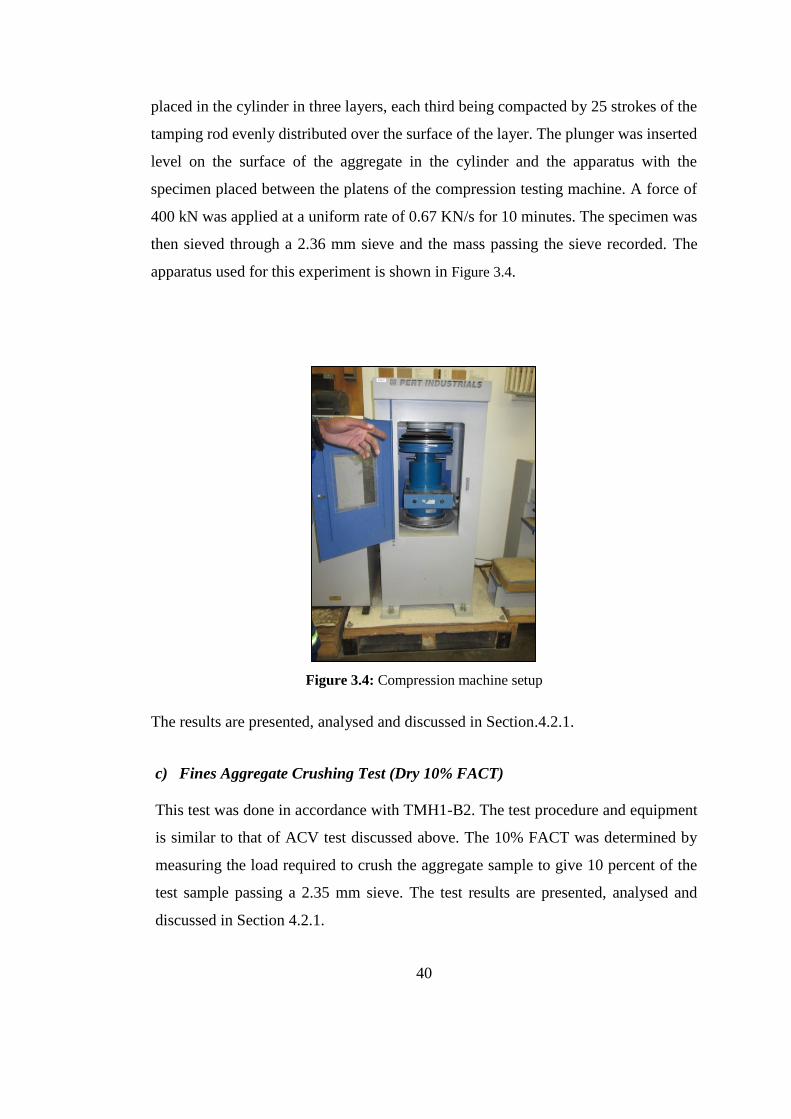
40
placed in the cylinder in three layers, each third being compacted by 25 strokes of the
tamping rod evenly distributed over the surface of the layer. The plunger was inserted
level on the surface of the aggregate in the cylinder and the apparatus with the
specimen placed between the platens of the compression testing machine. A force of
400 kN was applied at a uniform rate of 0.67 KN/s for 10 minutes. The specimen was
then sieved through a 2.36 mm sieve and the mass passing the sieve recorded. The
apparatus used for this experiment is shown in Figure 3.4.
Figure 3.4: Compression machine setup
The results are presented, analysed and discussed in Section.4.2.1.
c) Fines Aggregate Crushing Test (Dry 10% FACT)
This test was done in accordance with TMH1-B2. The test procedure and equipment
is similar to that of ACV test discussed above. The 10% FACT was determined by
measuring the load required to crush the aggregate sample to give 10 percent of the
test sample passing a 2.35 mm sieve. The test results are presented, analysed and
discussed in Section 4.2.1.
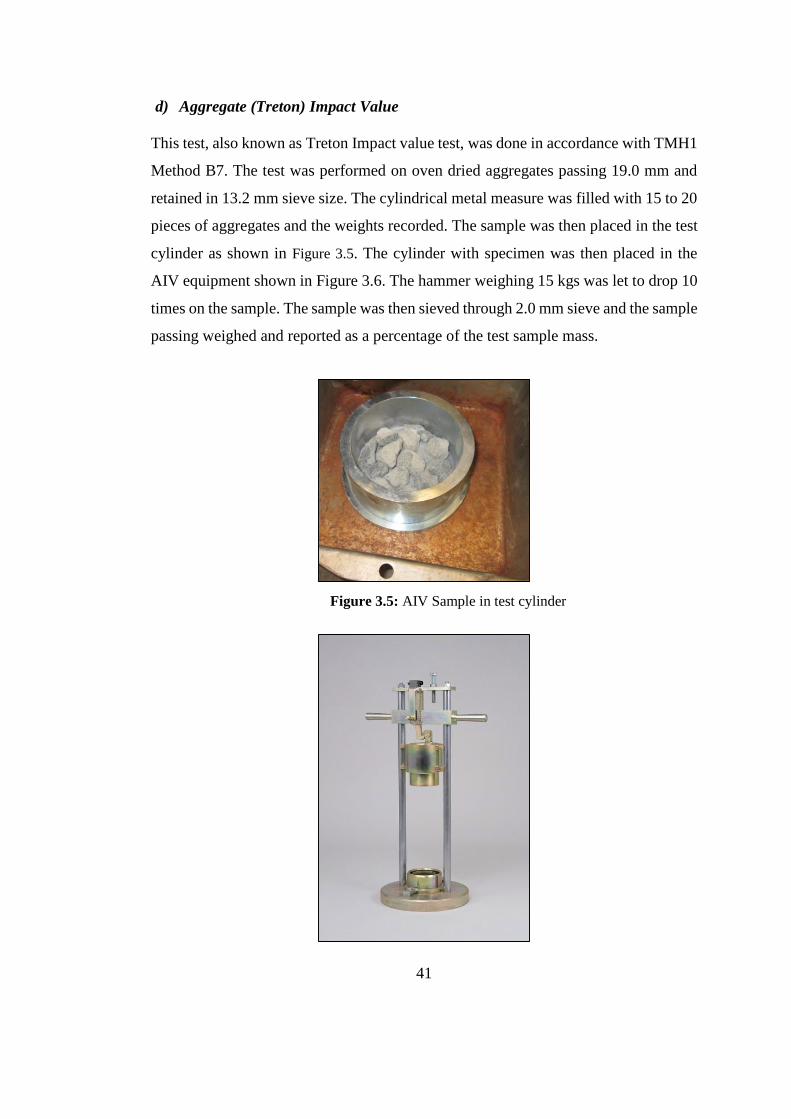
41
d) Aggregate (Treton) Impact Value
This test, also known as Treton Impact value test, was done in accordance with TMH1
Method B7. The test was performed on oven dried aggregates passing 19.0 mm and
retained in 13.2 mm sieve size. The cylindrical metal measure was filled with 15 to 20
pieces of aggregates and the weights recorded. The sample was then placed in the test
cylinder as shown in Figure 3.5. The cylinder with specimen was then placed in the
AIV equipment shown in Figure 3.6. The hammer weighing 15 kgs was let to drop 10
times on the sample. The sample was then sieved through 2.0 mm sieve and the sample
passing weighed and reported as a percentage of the test sample mass.
Figure 3.5: AIV Sample in test cylinder
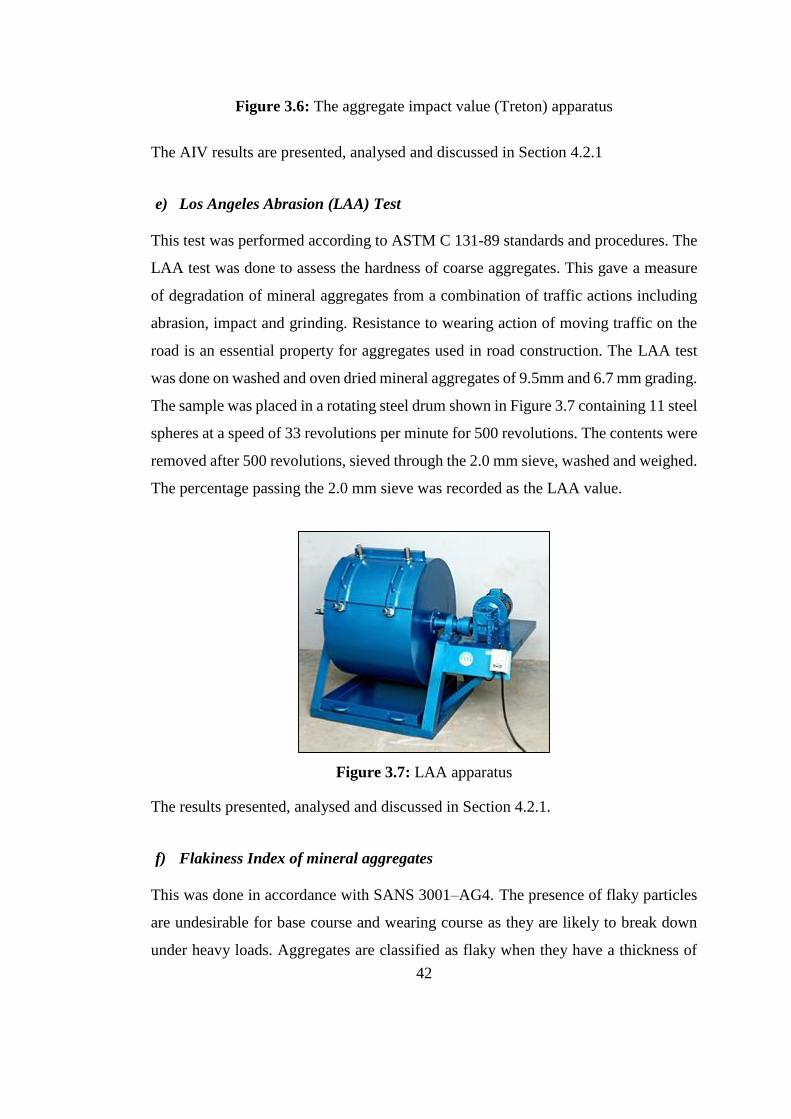
42
Figure 3.6: The aggregate impact value (Treton) apparatus
The AIV results are presented, analysed and discussed in Section 4.2.1
e) Los Angeles Abrasion (LAA) Test
This test was performed according to ASTM C 131-89 standards and procedures. The
LAA test was done to assess the hardness of coarse aggregates. This gave a measure
of degradation of mineral aggregates from a combination of traffic actions including
abrasion, impact and grinding. Resistance to wearing action of moving traffic on the
road is an essential property for aggregates used in road construction. The LAA test
was done on washed and oven dried mineral aggregates of 9.5mm and 6.7 mm grading.
The sample was placed in a rotating steel drum shown in Figure 3.7 containing 11 steel
spheres at a speed of 33 revolutions per minute for 500 revolutions. The contents were
removed after 500 revolutions, sieved through the 2.0 mm sieve, washed and weighed.
The percentage passing the 2.0 mm sieve was recorded as the LAA value.
Figure 3.7: LAA apparatus
The results presented, analysed and discussed in Section 4.2.1.
f) Flakiness Index of mineral aggregates
This was done in accordance with SANS 3001–AG4. The presence of flaky particles
are undesirable for base course and wearing course as they are likely to break down
under heavy loads. Aggregates are classified as flaky when they have a thickness of
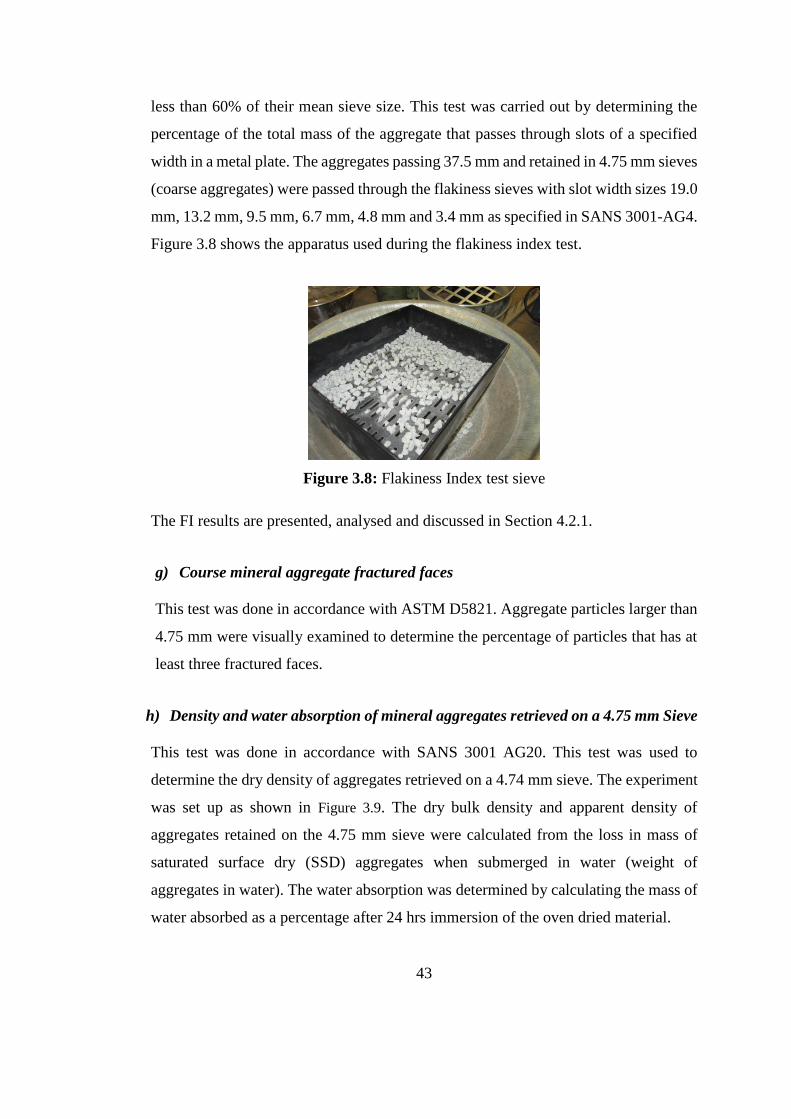
43
less than 60% of their mean sieve size. This test was carried out by determining the
percentage of the total mass of the aggregate that passes through slots of a specified
width in a metal plate. The aggregates passing 37.5 mm and retained in 4.75 mm sieves
(coarse aggregates) were passed through the flakiness sieves with slot width sizes 19.0
mm, 13.2 mm, 9.5 mm, 6.7 mm, 4.8 mm and 3.4 mm as specified in SANS 3001-AG4.
Figure 3.8 shows the apparatus used during the flakiness index test.
Figure 3.8: Flakiness Index test sieve
The FI results are presented, analysed and discussed in Section 4.2.1.
g) Course mineral aggregate fractured faces
This test was done in accordance with ASTM D5821. Aggregate particles larger than
4.75 mm were visually examined to determine the percentage of particles that has at
least three fractured faces.
h) Density and water absorption of mineral aggregates retrieved on a 4.75 mm Sieve
This test was done in accordance with SANS 3001 AG20. This test was used to
determine the dry density of aggregates retrieved on a 4.74 mm sieve. The experiment
was set up as shown in Figure 3.9. The dry bulk density and apparent density of
aggregates retained on the 4.75 mm sieve were calculated from the loss in mass of
saturated surface dry (SSD) aggregates when submerged in water (weight of
aggregates in water). The water absorption was determined by calculating the mass of
water absorbed as a percentage after 24 hrs immersion of the oven dried material.
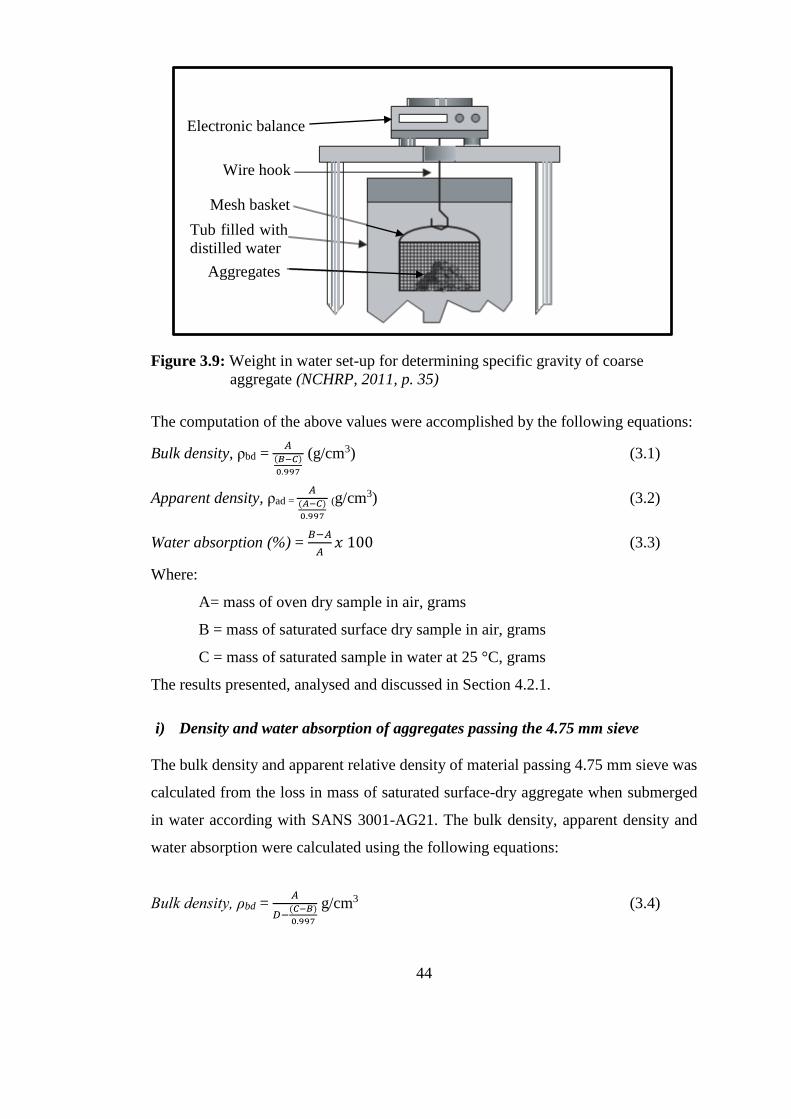
44
Figure 3.9: Weight in water set-up for determining specific gravity of coarse
aggregate (NCHRP, 2011, p. 35)
The computation of the above values were accomplished by the following equations:
Bulk density, ρbd = 𝐴
(𝐵−𝐶)
0.997
(g/cm3) (3.1)
Apparent density, ρad = 𝐴
(𝐴−𝐶)
0.997
(g/cm3) (3.2)
Water absorption (%) = 𝐵−𝐴
𝐴𝑥 100 (3.3)
Where:
A= mass of oven dry sample in air, grams
B = mass of saturated surface dry sample in air, grams
C = mass of saturated sample in water at 25 °C, grams
The results presented, analysed and discussed in Section 4.2.1.
i) Density and water absorption of aggregates passing the 4.75 mm sieve
The bulk density and apparent relative density of material passing 4.75 mm sieve was
calculated from the loss in mass of saturated surface-dry aggregate when submerged
in water according with SANS 3001-AG21. The bulk density, apparent density and
water absorption were calculated using the following equations:
Bulk density, ρbd = 𝐴
𝐷−(𝐶−𝐵)
0.997
g/cm3 (3.4)
Electronic balance
Aggregates
Tub filled with
distilled water
Wire hook
Mesh basket
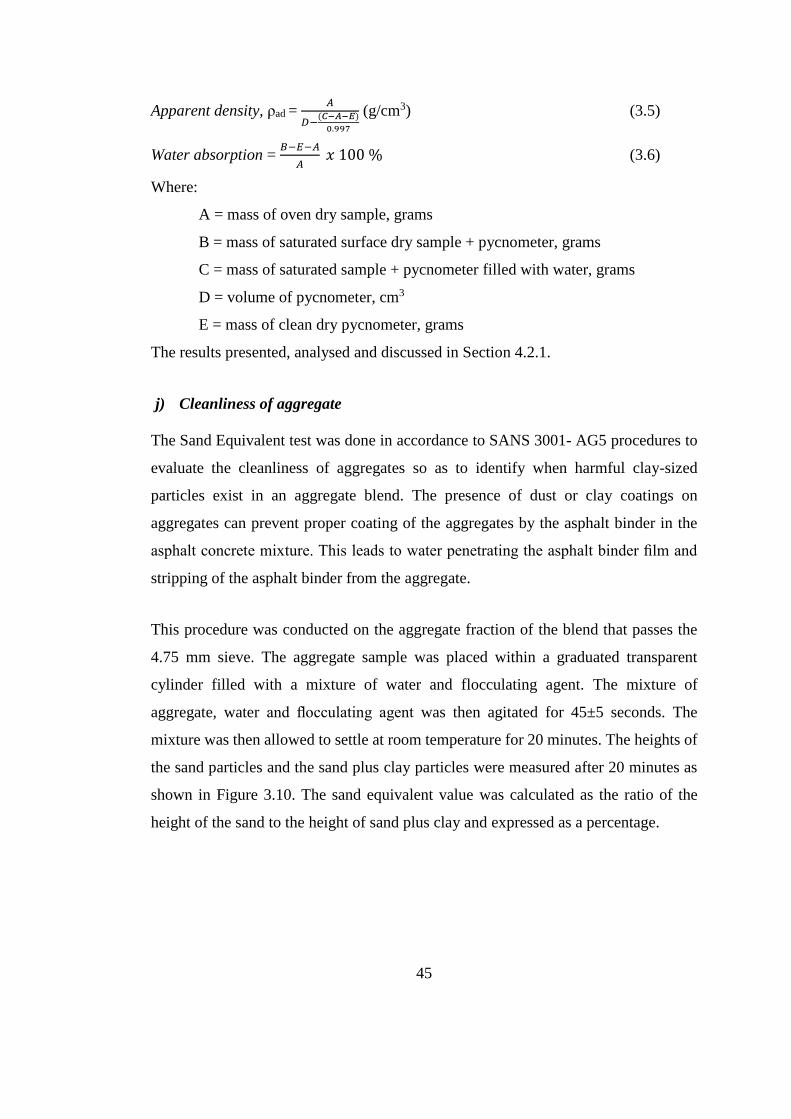
45
Apparent density, ρad = 𝐴
𝐷−(𝐶−𝐴−𝐸)
0.997
(g/cm3) (3.5)
Water absorption = 𝐵−𝐸−𝐴
𝐴 𝑥 100 % (3.6)
Where:
A = mass of oven dry sample, grams
B = mass of saturated surface dry sample + pycnometer, grams
C = mass of saturated sample + pycnometer filled with water, grams
D = volume of pycnometer, cm3
E = mass of clean dry pycnometer, grams
The results presented, analysed and discussed in Section 4.2.1.
j) Cleanliness of aggregate
The Sand Equivalent test was done in accordance to SANS 3001- AG5 procedures to
evaluate the cleanliness of aggregates so as to identify when harmful clay-sized
particles exist in an aggregate blend. The presence of dust or clay coatings on
aggregates can prevent proper coating of the aggregates by the asphalt binder in the
asphalt concrete mixture. This leads to water penetrating the asphalt binder film and
stripping of the asphalt binder from the aggregate.
This procedure was conducted on the aggregate fraction of the blend that passes the
4.75 mm sieve. The aggregate sample was placed within a graduated transparent
cylinder filled with a mixture of water and flocculating agent. The mixture of
aggregate, water and flocculating agent was then agitated for 45±5 seconds. The
mixture was then allowed to settle at room temperature for 20 minutes. The heights of
the sand particles and the sand plus clay particles were measured after 20 minutes as
shown in Figure 3.10. The sand equivalent value was calculated as the ratio of the
height of the sand to the height of sand plus clay and expressed as a percentage.
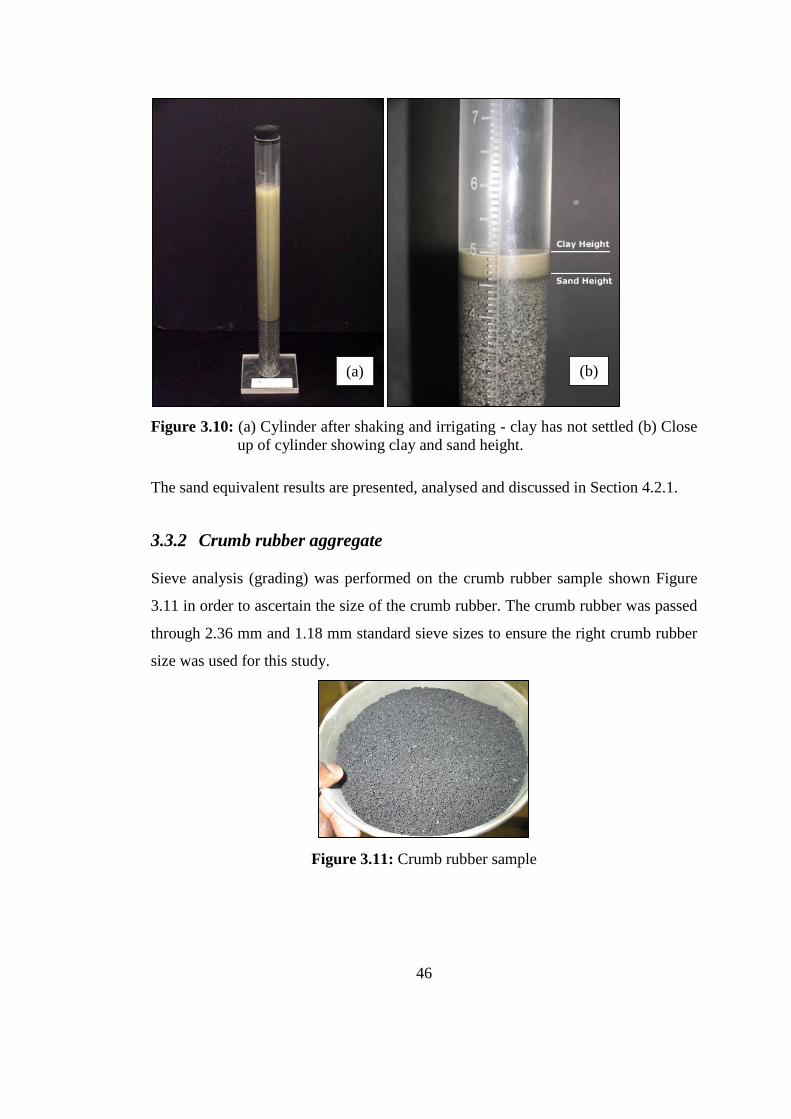
46
Figure 3.10: (a) Cylinder after shaking and irrigating - clay has not settled (b) Close
up of cylinder showing clay and sand height.
The sand equivalent results are presented, analysed and discussed in Section 4.2.1.
3.3.2 Crumb rubber aggregate
Sieve analysis (grading) was performed on the crumb rubber sample shown Figure
3.11 in order to ascertain the size of the crumb rubber. The crumb rubber was passed
through 2.36 mm and 1.18 mm standard sieve sizes to ensure the right crumb rubber
size was used for this study.
Figure 3.11: Crumb rubber sample
(a) (b)
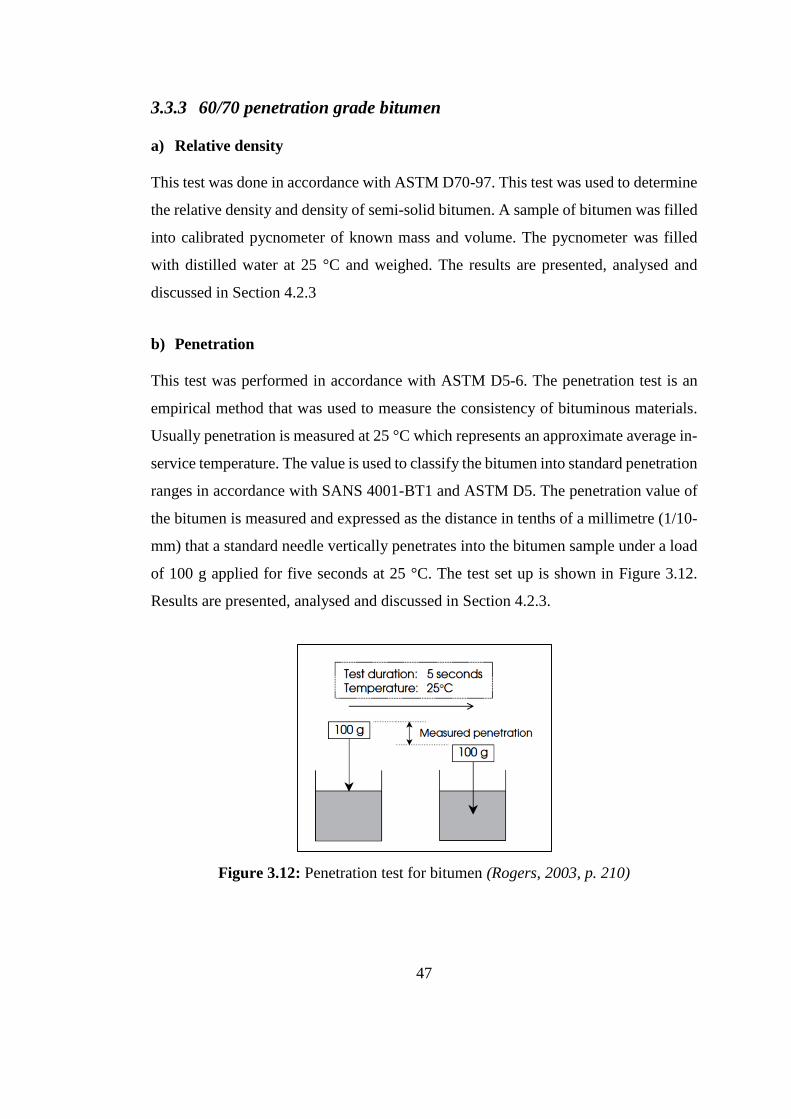
47
3.3.3 60/70 penetration grade bitumen
a) Relative density
This test was done in accordance with ASTM D70-97. This test was used to determine
the relative density and density of semi-solid bitumen. A sample of bitumen was filled
into calibrated pycnometer of known mass and volume. The pycnometer was filled
with distilled water at 25 °C and weighed. The results are presented, analysed and
discussed in Section 4.2.3
b) Penetration
This test was performed in accordance with ASTM D5-6. The penetration test is an
empirical method that was used to measure the consistency of bituminous materials.
Usually penetration is measured at 25 °C which represents an approximate average in-
service temperature. The value is used to classify the bitumen into standard penetration
ranges in accordance with SANS 4001-BT1 and ASTM D5. The penetration value of
the bitumen is measured and expressed as the distance in tenths of a millimetre (1/10-
mm) that a standard needle vertically penetrates into the bitumen sample under a load
of 100 g applied for five seconds at 25 °C. The test set up is shown in Figure 3.12.
Results are presented, analysed and discussed in Section 4.2.3.
Figure 3.12: Penetration test for bitumen (Rogers, 2003, p. 210)
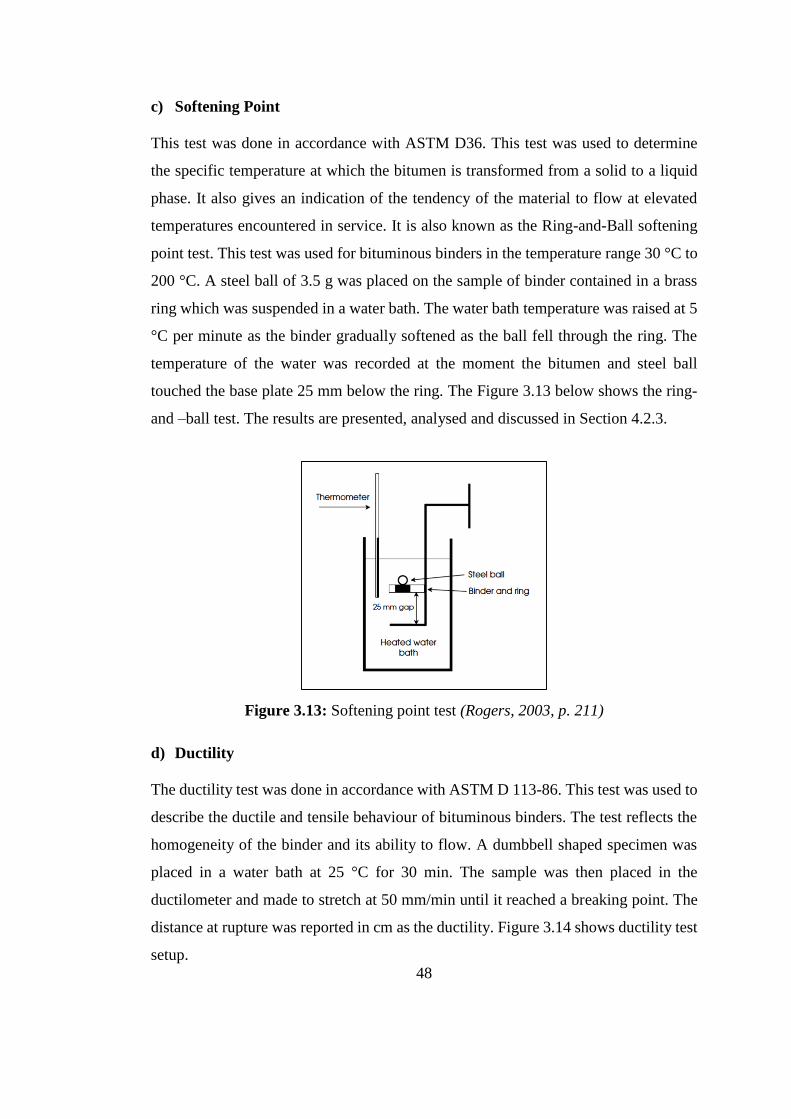
48
c) Softening Point
This test was done in accordance with ASTM D36. This test was used to determine
the specific temperature at which the bitumen is transformed from a solid to a liquid
phase. It also gives an indication of the tendency of the material to flow at elevated
temperatures encountered in service. It is also known as the Ring-and-Ball softening
point test. This test was used for bituminous binders in the temperature range 30 °C to
200 °C. A steel ball of 3.5 g was placed on the sample of binder contained in a brass
ring which was suspended in a water bath. The water bath temperature was raised at 5
°C per minute as the binder gradually softened as the ball fell through the ring. The
temperature of the water was recorded at the moment the bitumen and steel ball
touched the base plate 25 mm below the ring. The Figure 3.13 below shows the ring-
and –ball test. The results are presented, analysed and discussed in Section 4.2.3.
Figure 3.13: Softening point test (Rogers, 2003, p. 211)
d) Ductility
The ductility test was done in accordance with ASTM D 113-86. This test was used to
describe the ductile and tensile behaviour of bituminous binders. The test reflects the
homogeneity of the binder and its ability to flow. A dumbbell shaped specimen was
placed in a water bath at 25 °C for 30 min. The sample was then placed in the
ductilometer and made to stretch at 50 mm/min until it reached a breaking point. The
distance at rupture was reported in cm as the ductility. Figure 3.14 shows ductility test
setup.
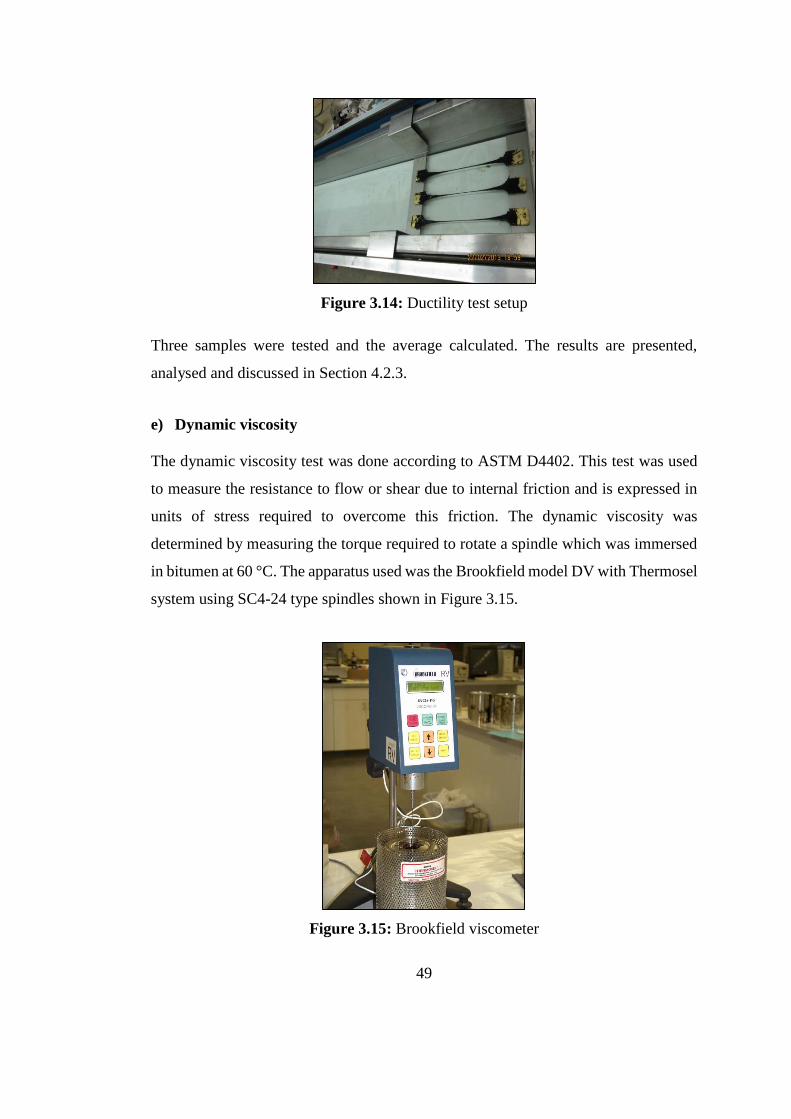
49
Figure 3.14: Ductility test setup
Three samples were tested and the average calculated. The results are presented,
analysed and discussed in Section 4.2.3.
e) Dynamic viscosity
The dynamic viscosity test was done according to ASTM D4402. This test was used
to measure the resistance to flow or shear due to internal friction and is expressed in
units of stress required to overcome this friction. The dynamic viscosity was
determined by measuring the torque required to rotate a spindle which was immersed
in bitumen at 60 °C. The apparatus used was the Brookfield model DV with Thermosel
system using SC4-24 type spindles shown in Figure 3.15.
Figure 3.15: Brookfield viscometer
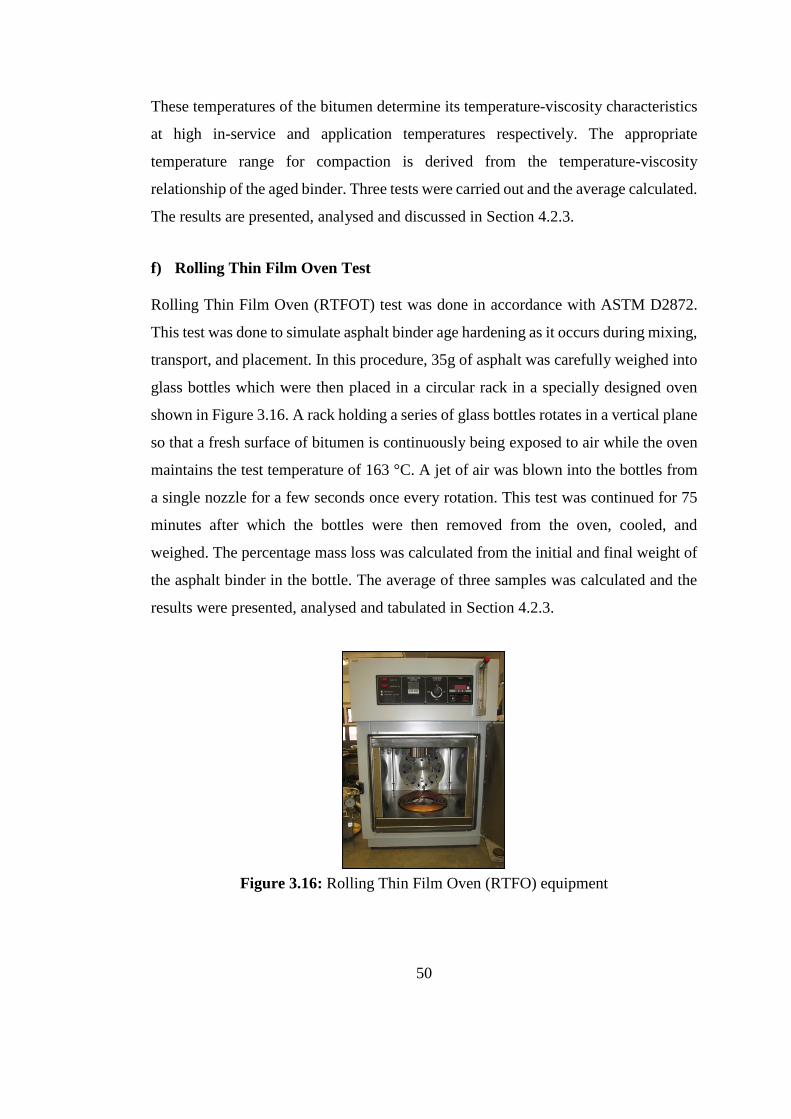
50
These temperatures of the bitumen determine its temperature-viscosity characteristics
at high in-service and application temperatures respectively. The appropriate
temperature range for compaction is derived from the temperature-viscosity
relationship of the aged binder. Three tests were carried out and the average calculated.
The results are presented, analysed and discussed in Section 4.2.3.
f) Rolling Thin Film Oven Test
Rolling Thin Film Oven (RTFOT) test was done in accordance with ASTM D2872.
This test was done to simulate asphalt binder age hardening as it occurs during mixing,
transport, and placement. In this procedure, 35g of asphalt was carefully weighed into
glass bottles which were then placed in a circular rack in a specially designed oven
shown in Figure 3.16. A rack holding a series of glass bottles rotates in a vertical plane
so that a fresh surface of bitumen is continuously being exposed to air while the oven
maintains the test temperature of 163 °C. A jet of air was blown into the bottles from
a single nozzle for a few seconds once every rotation. This test was continued for 75
minutes after which the bottles were then removed from the oven, cooled, and
weighed. The percentage mass loss was calculated from the initial and final weight of
the asphalt binder in the bottle. The average of three samples was calculated and the
results were presented, analysed and tabulated in Section 4.2.3.
Figure 3.16: Rolling Thin Film Oven (RTFO) equipment

51
After mass loss determination, the bottles were heated, and the asphalt was poured into
tins for further rheological testing. The penetration, softening point, ductility and
viscosity were assessed in terms of the requirements of the relevant specifications as
outlined in Section 3.3.2 above. The results are presented, analysed and discussed in
Section 4.2.3.
3.3.4 LDPE modified bitumen
The penetration test, softening point test and dynamic viscosity tests were carried out
in the same manner as the conventional bitumen test discussed in Section 3.3.2. The
results are presented, analysed and discussed in Section 4.2.4. The RTFOT and
ductility test methods on modified bitumen in accordance with Technical Guideline 1
(2007) and are given as follows.
a) Modified Rolling Thin Film Oven Test
This test was done in accordance with TG1 MB-3. This test has a similar purpose and
procedure to that described under the Rolling Thin Film Oven Test carried out on
conventional penetration grade bitumen. The effects of the LDPE modifier on age-
hardening were evaluated by measuring the rheological properties of asphalt binders
before and after selected levels of ageing. Short-term ageing was simulated using the
rolling thin film oven at 163°C. Three samples were prepared for each percentage of
LDPE content in the bitumen i.e. 2%, 4%, 6%, 8% and 10%. The percentage mass loss
was calculated from each of the glass bottles. The results are presented, analysed and
discussed in Section 4.2.4.
The LDPE modified bitumen samples from the RTFOT were used in the dynamic
viscosity (TG MB-13), penetration, softening point (TG MB-17) and elastic recovery
by ductilometer (TG MB-4) tests. The dynamic viscosity, penetration and softening
point test procedures are similar to those carried out on conventional bitumen and were
conducted as discussed in Section 3.3.2 above. The results are presented, analysed and
discussed in Section 4.2.4
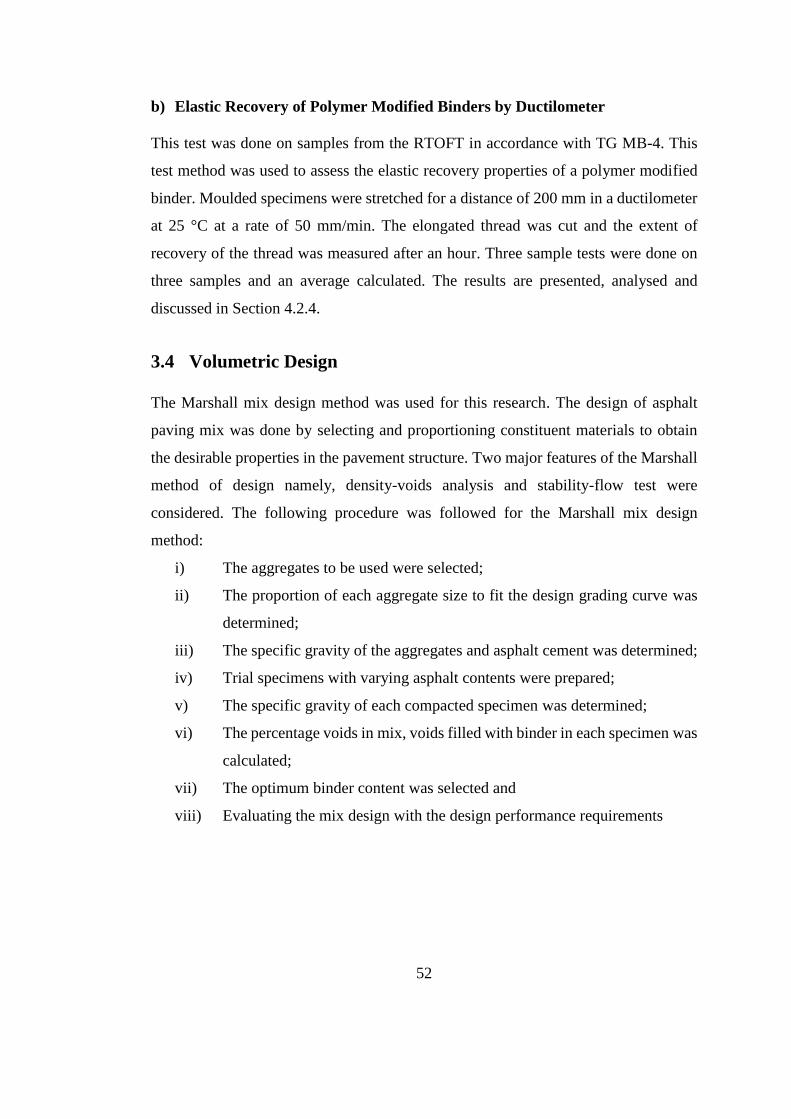
52
b) Elastic Recovery of Polymer Modified Binders by Ductilometer
This test was done on samples from the RTOFT in accordance with TG MB-4. This
test method was used to assess the elastic recovery properties of a polymer modified
binder. Moulded specimens were stretched for a distance of 200 mm in a ductilometer
at 25 °C at a rate of 50 mm/min. The elongated thread was cut and the extent of
recovery of the thread was measured after an hour. Three sample tests were done on
three samples and an average calculated. The results are presented, analysed and
discussed in Section 4.2.4.
3.4 Volumetric Design
The Marshall mix design method was used for this research. The design of asphalt
paving mix was done by selecting and proportioning constituent materials to obtain
the desirable properties in the pavement structure. Two major features of the Marshall
method of design namely, density-voids analysis and stability-flow test were
considered. The following procedure was followed for the Marshall mix design
method:
i) The aggregates to be used were selected;
ii) The proportion of each aggregate size to fit the design grading curve was
determined;
iii) The specific gravity of the aggregates and asphalt cement was determined;
iv) Trial specimens with varying asphalt contents were prepared;
v) The specific gravity of each compacted specimen was determined;
vi) The percentage voids in mix, voids filled with binder in each specimen was
calculated;
vii) The optimum binder content was selected and
viii) Evaluating the mix design with the design performance requirements
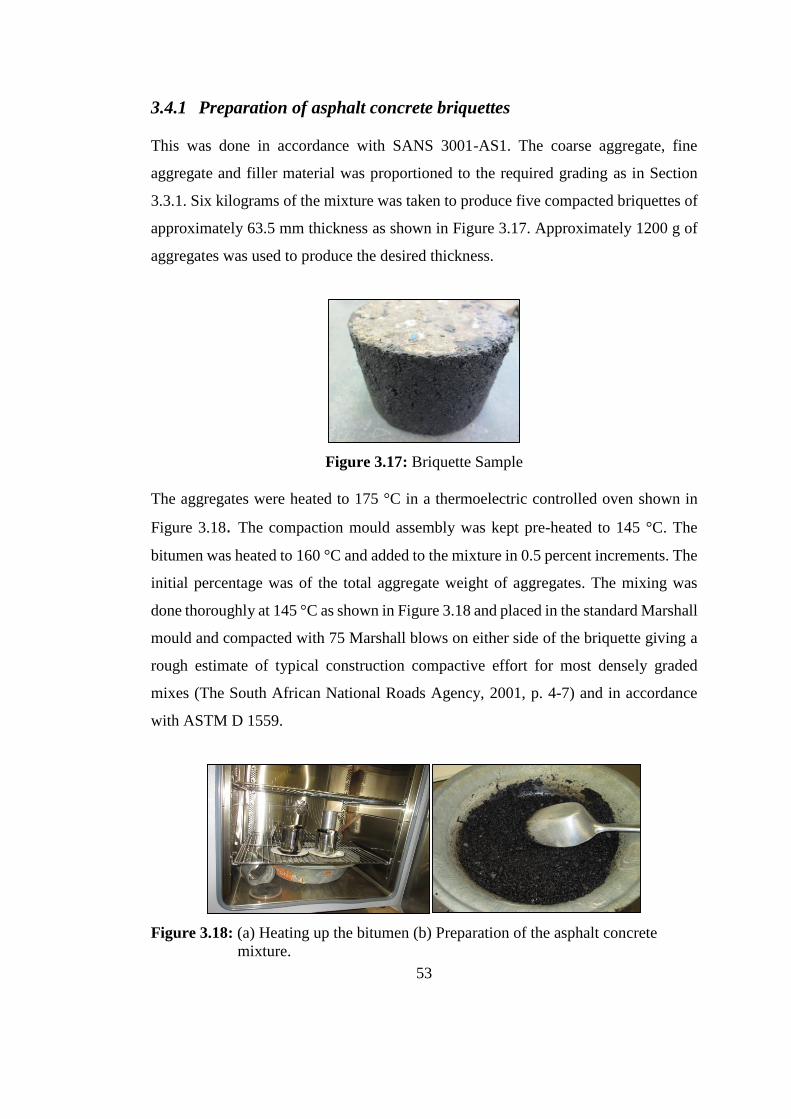
53
3.4.1 Preparation of asphalt concrete briquettes
This was done in accordance with SANS 3001-AS1. The coarse aggregate, fine
aggregate and filler material was proportioned to the required grading as in Section
3.3.1. Six kilograms of the mixture was taken to produce five compacted briquettes of
approximately 63.5 mm thickness as shown in Figure 3.17. Approximately 1200 g of
aggregates was used to produce the desired thickness.
Figure 3.17: Briquette Sample
The aggregates were heated to 175 °C in a thermoelectric controlled oven shown in
Figure 3.18. The compaction mould assembly was kept pre-heated to 145 °C. The
bitumen was heated to 160 °C and added to the mixture in 0.5 percent increments. The
initial percentage was of the total aggregate weight of aggregates. The mixing was
done thoroughly at 145 °C as shown in Figure 3.18 and placed in the standard Marshall
mould and compacted with 75 Marshall blows on either side of the briquette giving a
rough estimate of typical construction compactive effort for most densely graded
mixes (The South African National Roads Agency, 2001, p. 4-7) and in accordance
with ASTM D 1559.
Figure 3.18: (a) Heating up the bitumen (b) Preparation of the asphalt concrete
mixture.
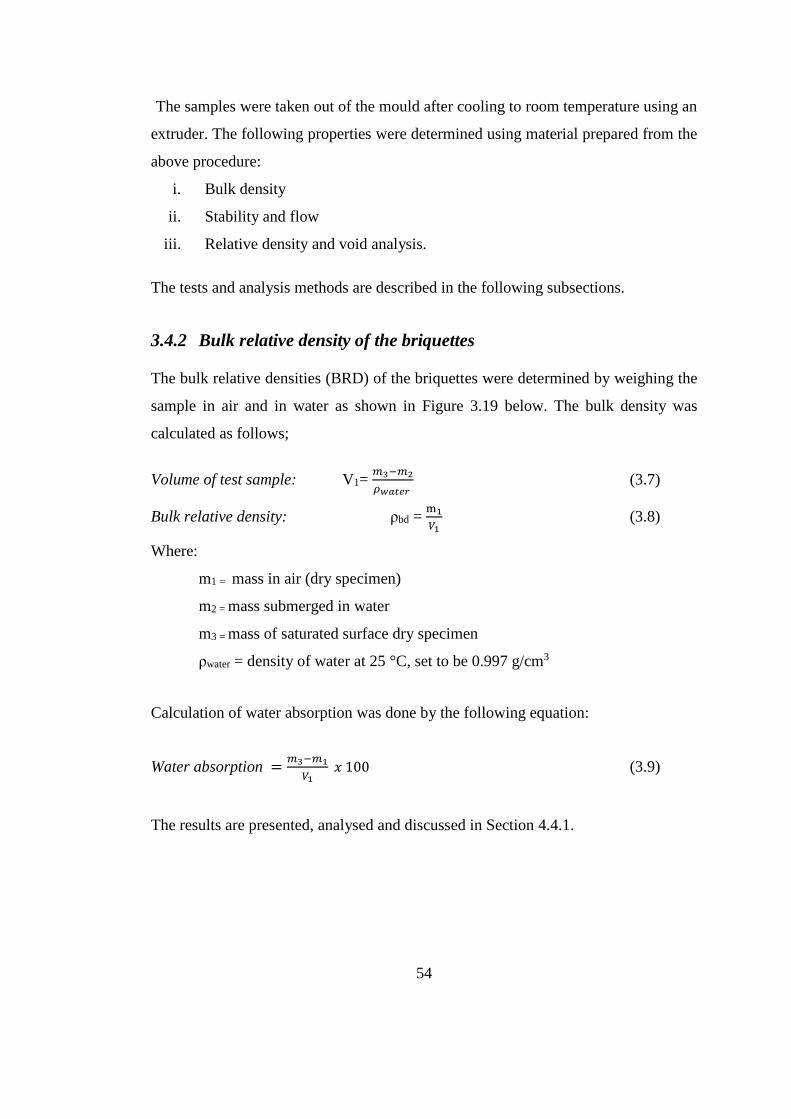
54
The samples were taken out of the mould after cooling to room temperature using an
extruder. The following properties were determined using material prepared from the
above procedure:
i. Bulk density
ii. Stability and flow
iii. Relative density and void analysis.
The tests and analysis methods are described in the following subsections.
3.4.2 Bulk relative density of the briquettes
The bulk relative densities (BRD) of the briquettes were determined by weighing the
sample in air and in water as shown in Figure 3.19 below. The bulk density was
calculated as follows;
Volume of test sample: V1= 𝑚3−𝑚2
𝜌𝑤𝑎𝑡𝑒𝑟 (3.7)
Bulk relative density: ρbd = m1
𝑉1 (3.8)
Where:
m1 = mass in air (dry specimen)
m2 = mass submerged in water
m3 = mass of saturated surface dry specimen
ρwater = density of water at 25 °C, set to be 0.997 g/cm3
Calculation of water absorption was done by the following equation:
Water absorption =𝑚3−𝑚1
𝑉1 𝑥 100 (3.9)
The results are presented, analysed and discussed in Section 4.4.1.
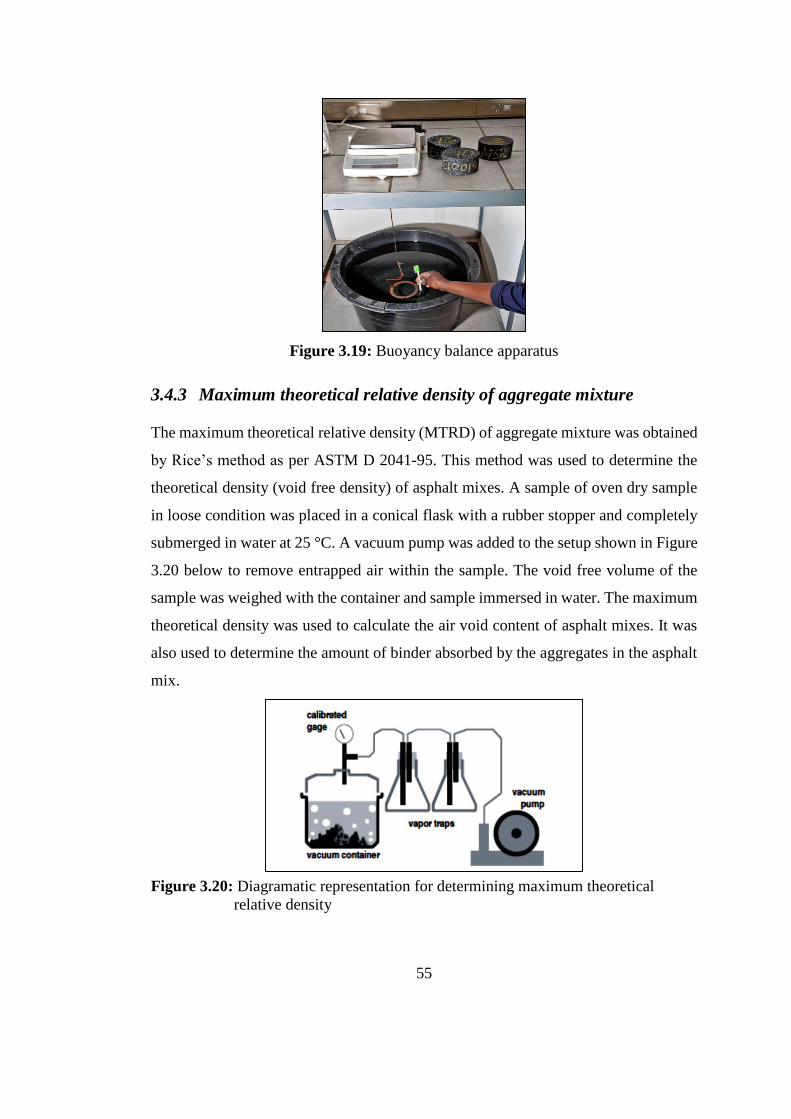
55
Figure 3.19: Buoyancy balance apparatus
3.4.3 Maximum theoretical relative density of aggregate mixture
The maximum theoretical relative density (MTRD) of aggregate mixture was obtained
by Rice’s method as per ASTM D 2041-95. This method was used to determine the
theoretical density (void free density) of asphalt mixes. A sample of oven dry sample
in loose condition was placed in a conical flask with a rubber stopper and completely
submerged in water at 25 °C. A vacuum pump was added to the setup shown in Figure
3.20 below to remove entrapped air within the sample. The void free volume of the
sample was weighed with the container and sample immersed in water. The maximum
theoretical density was used to calculate the air void content of asphalt mixes. It was
also used to determine the amount of binder absorbed by the aggregates in the asphalt
mix.
Figure 3.20: Diagramatic representation for determining maximum theoretical
relative density
56
Calculations:
The calculation of maximum theoretical density to the nearest 0.001 g/cm3 was done
using the following formula:
Maximum theoreticalrelative density, ρd, max = 𝐴
𝐴−(𝐵−𝐶)
𝜌(𝑤𝑎𝑡𝑒𝑟)
g/cm3 (3.10)
Where:
A = mass of dry sample in air, grams
B= mass of flask and sample immersed in water, grams
C= mass of flask immersed in water, grams
ρwater = density of water (0.997 g/cm3 at 25 °C)
The maximum theoretical density was used in the calculations of the voids in the
asphalt mixtures as presented in Section 4.3.
Calculation of binder absorption:
Calculation of the binder absorption was done by the following steps:
Step 1: The mass of binder in the sample was determined by:
D = 𝑝 𝑥 𝐴
100 grams (3.11)
Where:
D= mass of binder in the sample, grams
A = mass of dry sample in air, grams
p = percentage of binder in mixture, %
Step 2: The mass of aggregates in the sample was determined by:
E = (100−𝑝)𝑥 𝐴
100 , grams (3.12)
Where:
E= mass of aggregates in the sample, grams
A= mass of dry sample in air, grams
p = percentage of binder in the mixture, %
57
Step 3: The bulk volume of aggregates and binder in the sample was determined by:
Volbulk = 𝐸
ρbd+
𝐷
ρbit , cm3 (3.13)
Where:
Volbulk = bulk volume of aggregates and binder in the sample, cm3
D = mass of binder in the sample, grams
E = mass of aggregates in the sample, grams
ρbd = density of the aggregate, g/cm3
ρbit = density of the binder, g/cm3
Step 4: The volume of void-free sample was determined by:
Volvoidfree = 𝐴−(𝐵−𝐶)
𝜌𝑤𝑎𝑡𝑒𝑟 , cm3 (3.14)
Where:
Volvoidfree = void-free volume of the sample, cm3
A = mass of dry sample in air, grams
B = mass of flask and sample immersed in water
C = mass of flask immersed in water, grams
ρwater = density of water ( 0.997 g/cm3 at 25 °C)
Step 5: The percentage of the binder absorbed by the aggregates was determined by:
Pabs = (𝑉𝑜𝑙𝑏𝑢𝑙𝑘−𝑉𝑜𝑙𝑣𝑜𝑖𝑑𝑓𝑟𝑒𝑒)𝑥 𝜌𝑏𝑖𝑡
𝐸 𝑥 100 , % (3.15)
Where:
Volbulk = calculated bulk volume of aggregates and binder in the sample, cm3
Volvoid-free = void-free volume of the sample, cm3
E = mass of aggregates in the sample, grams
The values gotten from the calculations were used in the calculation of voids in the
concrete mixture. The results are presented, analysed and discussed in Section 4.3
58
3.4.4 Calculation of void content in bituminous mixes
This was done in accordance with ASTM D3203 and AASHTO PP19-93. This method
was used to calculate void content, voids filled with binder and voids in mineral
aggregate for bituminous mixes. The void content was calculated using the density and
the maximum theoretical density of the samples. The voids in mineral aggregate were
determined from the bulk volume of asphalt mix sample and the bulk volume of
aggregates in the mix. The voids filled with binder were determined from the volume
of effective binder in the mix and the volume of voids in the aggregate.
The mass of aggregates in the sample was calculated by:
magg = ρbd mix x (100-p) (3.16)
The mass of binder in the sample was calculated by:
mbit = ρbd mix x p (3.17)
The mass of absorbed binder was calculated by:
mabs = 𝑃𝑎𝑏𝑠 𝑥 𝑚𝑎𝑔𝑔
100 (3.18)
The mass of effective binder was calculated by:
meff = mbit - mabs (3.19)
The volume of aggregates was calculated by:
Vagg = 𝑚𝑎𝑔𝑔
𝜌𝑏𝑑 𝑎𝑔𝑔 (3.20)
The volume of effective binder was calculated by:
Vbit = 𝑚𝑒𝑓𝑓
𝜌𝑏𝑖𝑡 (3.21)
Where:
ρbd, mix = bulk density of asphalt mix sample, g/cm3
P = binder content, %
59
Pabs = binder absorbed by the aggregates, %
Ρbd, agg = average bulk density of total aggregates, g/cm3
Ρbit = density of the binder, g/cm3
Calculation of void content
The void content was calculated using the following equation:
V0 = 𝜌𝑑 𝑚𝑎𝑥− 𝜌𝑏𝑑 𝑚𝑖𝑥
𝜌𝑑 𝑚𝑎𝑥𝑥100 (3.22)
Where:
ρd max = maximum theoretical density of sample, g/cm3
ρbd mix = bulk density of asphalt mix sample, g/cm3
Calculation of voids in mineral aggregate
The voids in mineral aggregate were calculated using the following equation:
VMA = 100 – V agg (3.23)
Where V agg = volume of aggregates, cm3
Calculation of voids filled with binder
The voids filled with binder were calculated using the following equation;
V fb = 𝑉𝑏𝑖𝑡
𝑉𝑀𝐴𝑥 100 (3.24)
Where:
V bit = volume of effective binder, cm3
VMA = voids in mineral aggregate, %
The results are presented, analysed and discussed in Section 4.3.
3.4.5 Calculating target binder content
The target value for VBE (effective binder content by volume) was calculated by
subtracting the design air void content—normally 4%—from the target VMA value.
For example, a standard 13.5 mm mixture with a target VMA value of 15% would
have a target VBE value of 15 − 4 = 11%.
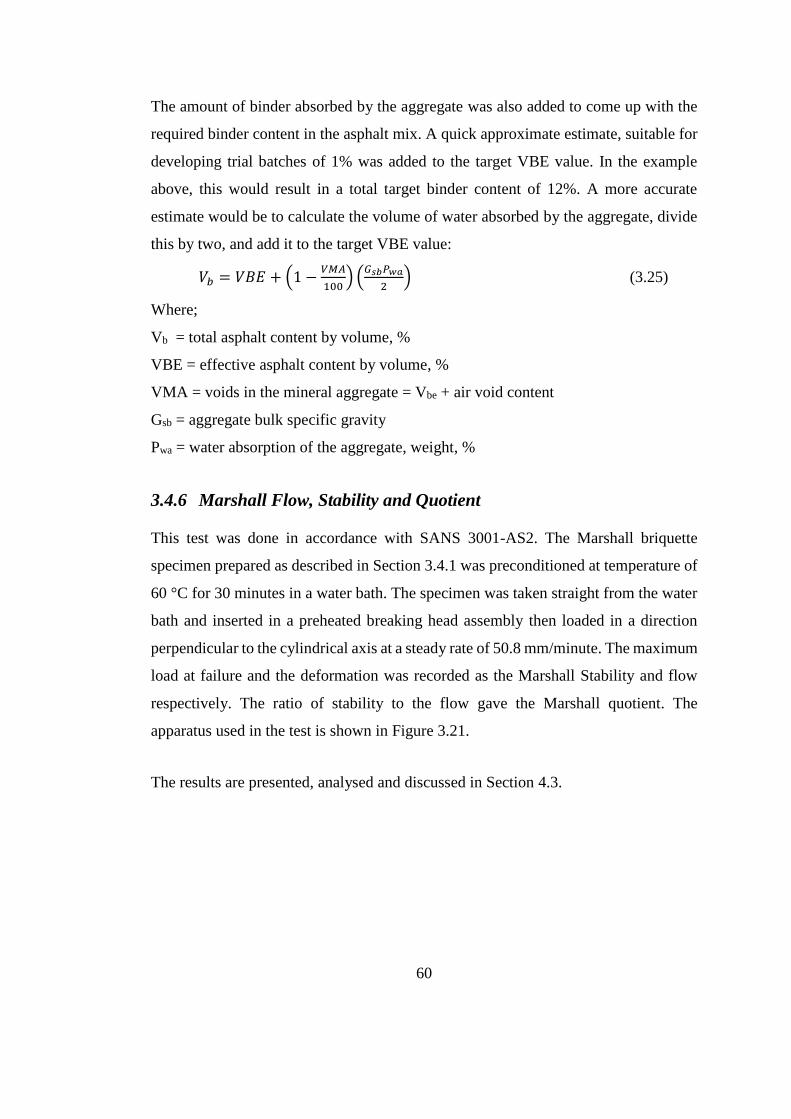
60
The amount of binder absorbed by the aggregate was also added to come up with the
required binder content in the asphalt mix. A quick approximate estimate, suitable for
developing trial batches of 1% was added to the target VBE value. In the example
above, this would result in a total target binder content of 12%. A more accurate
estimate would be to calculate the volume of water absorbed by the aggregate, divide
this by two, and add it to the target VBE value:
𝑉𝑏 = 𝑉𝐵𝐸 + (1 −𝑉𝑀𝐴
100) (
𝐺𝑠𝑏𝑃𝑤𝑎
2) (3.25)
Where;
Vb = total asphalt content by volume, %
VBE = effective asphalt content by volume, %
VMA = voids in the mineral aggregate = Vbe + air void content
Gsb = aggregate bulk specific gravity
Pwa = water absorption of the aggregate, weight, %
3.4.6 Marshall Flow, Stability and Quotient
This test was done in accordance with SANS 3001-AS2. The Marshall briquette
specimen prepared as described in Section 3.4.1 was preconditioned at temperature of
60 °C for 30 minutes in a water bath. The specimen was taken straight from the water
bath and inserted in a preheated breaking head assembly then loaded in a direction
perpendicular to the cylindrical axis at a steady rate of 50.8 mm/minute. The maximum
load at failure and the deformation was recorded as the Marshall Stability and flow
respectively. The ratio of stability to the flow gave the Marshall quotient. The
apparatus used in the test is shown in Figure 3.21.
The results are presented, analysed and discussed in Section 4.3.
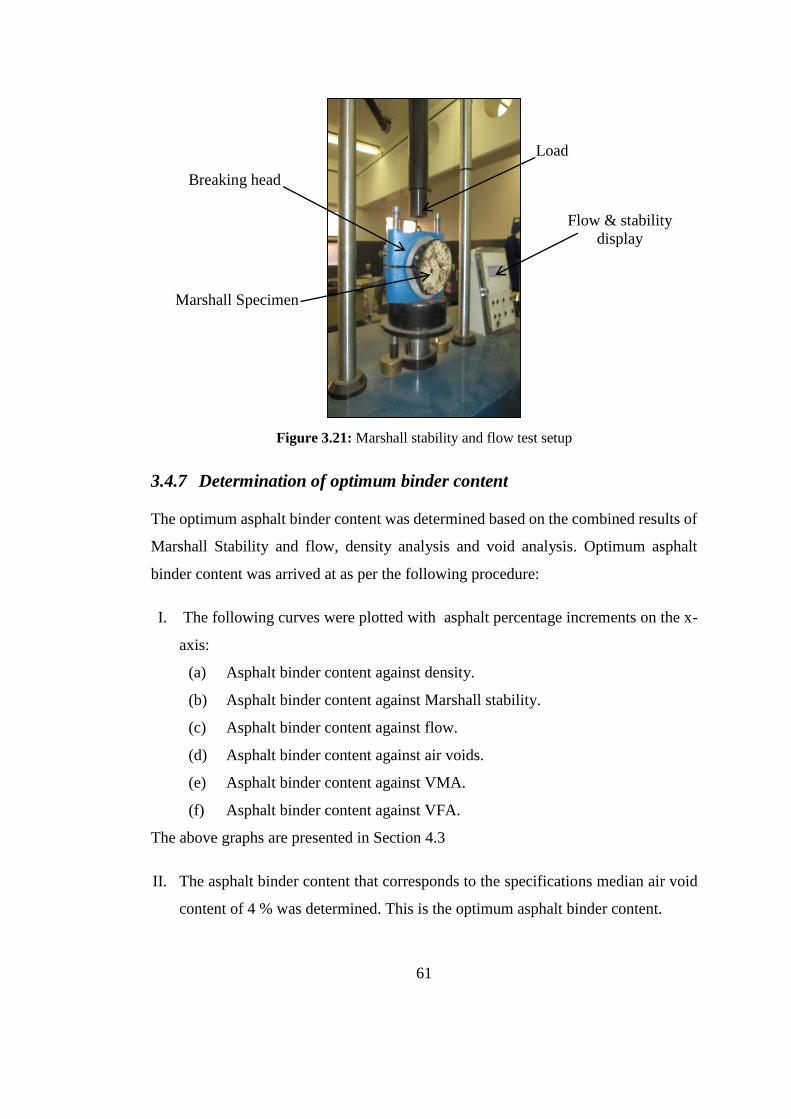
61
Figure 3.21: Marshall stability and flow test setup
3.4.7 Determination of optimum binder content
The optimum asphalt binder content was determined based on the combined results of
Marshall Stability and flow, density analysis and void analysis. Optimum asphalt
binder content was arrived at as per the following procedure:
I. The following curves were plotted with asphalt percentage increments on the x-
axis:
(a) Asphalt binder content against density.
(b) Asphalt binder content against Marshall stability.
(c) Asphalt binder content against flow.
(d) Asphalt binder content against air voids.
(e) Asphalt binder content against VMA.
(f) Asphalt binder content against VFA.
The above graphs are presented in Section 4.3
II. The asphalt binder content that corresponds to the specifications median air void
content of 4 % was determined. This is the optimum asphalt binder content.
Breaking head
Marshall Specimen
Load
Flow & stability
display
62
III. The properties of the asphalt binder at this optimum binder content was
determined by referring to the plot and each compared against specification values
to ensure all are within specification.
The optimum binder content was selected as the average binder content for maximum
density, maximum stability and percent air voids in the total mix. It was calculated by
equation 3.26 below;
𝐵0 =𝐵1+𝐵2+𝐵3
3 (3.26)
Where;
B0= optimum bitumen content
B1= % asphalt content at maximum density
B2 = % asphalt content at maximum stability
B3 = % asphalt content at 4% air voids in total mix
3.5 Optimization Process
3.5.1 LDPE modified binder
Asphalt cement was heated in an oven at a temperature of 160 °C (Cao, 2007). The
required amount of asphalt was weighed into a steel beaker, then the amount of plastic
required to yield the desired plastic to asphalt ratio was added from 2-10 % by weight
of bitumen (Kalantar, et al., 2012, p. 57). The beaker was placed on a hot plate to
maintain a mixing temperature of at least 165 °C. The laboratory mixer was placed so
that the propeller was about 15 mm above the bottom of the beaker and started. The
prepared amount of plastic was added gradually to the beaker while stirring. The mixer
was continued for 5-15 minutes until a homogeneous plastic modified binder was
obtained (Hinislioglu & Agar, 2004, p. 269).
3.5.2 Rubber aggregate
Crumb rubber of sieve fraction 2.36 mm was used to substitute a fraction of the fine
mineral aggregates of similar sieve size (2.36 mm) so that the overall grading was
maintained. Proportions of 0%, 1% 2%, 3%, 4% and 5% of crumb rubber by weight
63
of the aggregates were used in the asphalt mix (Cao, 2007, p. 1012). The ground rubber
was added to the hot aggregate mixture just before the polymer modified bitumen was
introduced into the mixture.
3.5.3 Preparation of modified Marshall briquettes
A percentage of optimum asphalt content by weight of the total mix established from
the Marshall mix design was used in preparing the LDPE modified bitumen to be used
in preparing asphalt concrete mixes throughout the study. The aggregates were heated
to 160 °C in a thermostatically controlled oven and LDPE modified binder heated to
180 °C. The crumb rubber was introduced to the aggregate mix and mixed evenly into
the aggregate mix for 10 seconds then modified binder was introduced into the mixture
and the sample mixed thoroughly for 2 to 3 minutes at a temperature of 135 °C. The
mixture was then placed into a standard Marshall mould with base and collar attached
and compacted using the Marshall compactor according to test method specified in
ASTM D1559.
Waste plastic content was varied from 2% to 10% at 2% intervals (Ahmadinia, et al.,
2011, p. 4846; Al-Hadidy, et al., 2009, p. 1458) while the rubber content in the
aggregates was varied from 1% to 5% percent by volume at 1% intervals with the
corresponding zero percentages being the control specimens. Three samples were
prepared for each polyethylene-binder and rubber-aggregate contents in the mix. The
three samples prepared were used for the Marshall triplicate testing to ASTM D1559.
In total 108 briquettes were prepared for the experiment. The temperature of the mix
was increased from the conventional 165°C to 175 °C to keep the modified binder
viscous enough to improve the workability of the mix. The manufacture of the mix
involved 10 seconds agitation of the aggregate with the crumb rubber to ensure a
homogeneous dispersion of the particles in the mix. LDPE modified bitumen was
added followed by a 3 minutes of agitation to form a homogeneous mix. Preparation
of the test specimens as well as determination of the bulk densities, voids in the mix
and voids in the mineral aggregate of the asphalt concrete was done as described in
Section 3.4.
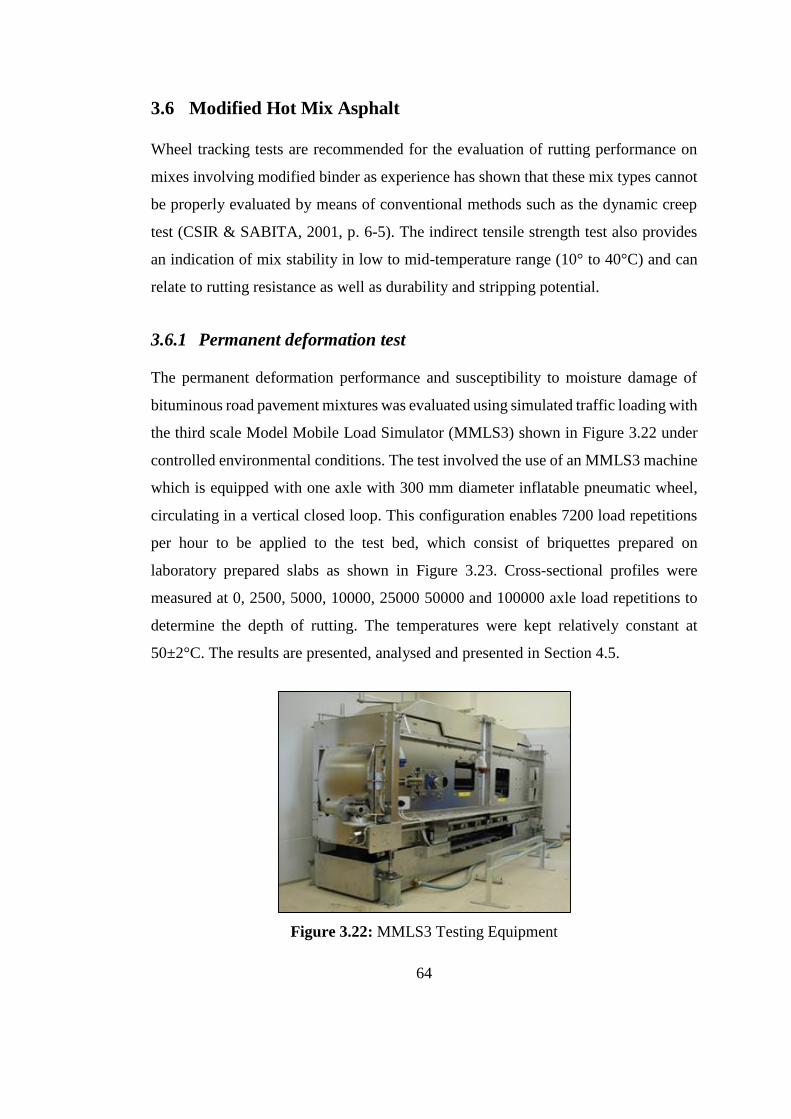
64
3.6 Modified Hot Mix Asphalt
Wheel tracking tests are recommended for the evaluation of rutting performance on
mixes involving modified binder as experience has shown that these mix types cannot
be properly evaluated by means of conventional methods such as the dynamic creep
test (CSIR & SABITA, 2001, p. 6-5). The indirect tensile strength test also provides
an indication of mix stability in low to mid-temperature range (10° to 40°C) and can
relate to rutting resistance as well as durability and stripping potential.
3.6.1 Permanent deformation test
The permanent deformation performance and susceptibility to moisture damage of
bituminous road pavement mixtures was evaluated using simulated traffic loading with
the third scale Model Mobile Load Simulator (MMLS3) shown in Figure 3.22 under
controlled environmental conditions. The test involved the use of an MMLS3 machine
which is equipped with one axle with 300 mm diameter inflatable pneumatic wheel,
circulating in a vertical closed loop. This configuration enables 7200 load repetitions
per hour to be applied to the test bed, which consist of briquettes prepared on
laboratory prepared slabs as shown in Figure 3.23. Cross-sectional profiles were
measured at 0, 2500, 5000, 10000, 25000 50000 and 100000 axle load repetitions to
determine the depth of rutting. The temperatures were kept relatively constant at
50±2°C. The results are presented, analysed and presented in Section 4.5.
Figure 3.22: MMLS3 Testing Equipment
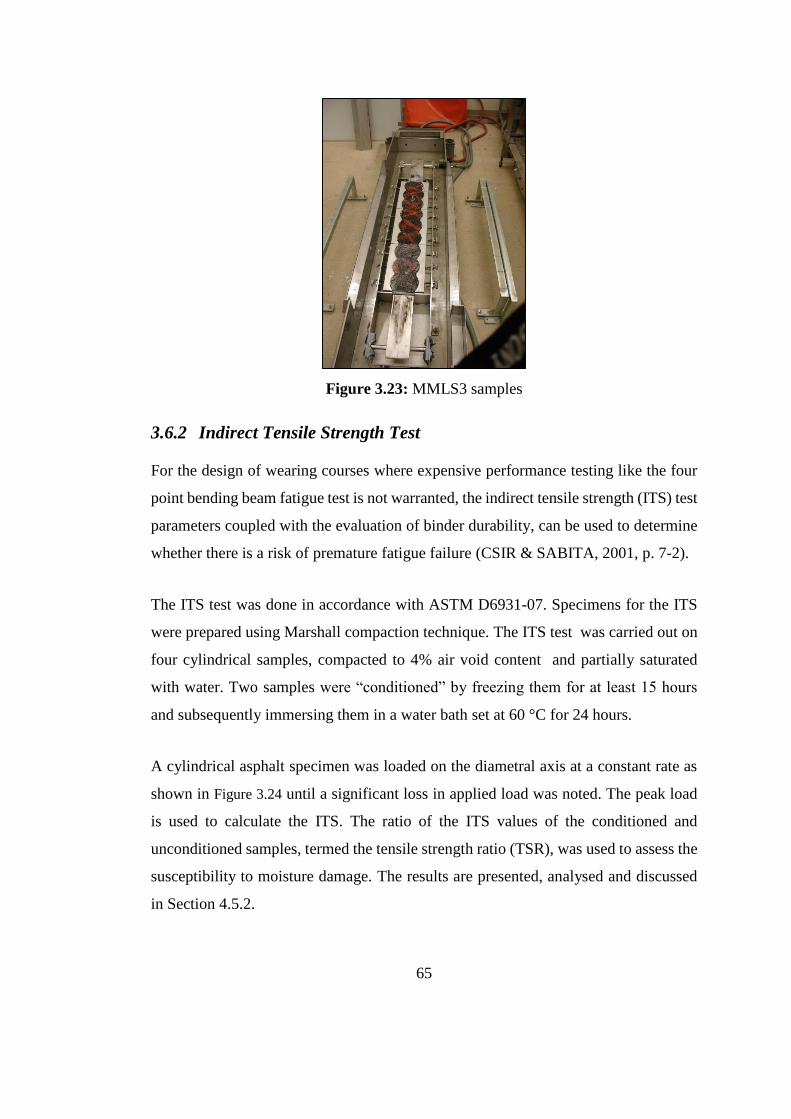
65
Figure 3.23: MMLS3 samples
3.6.2 Indirect Tensile Strength Test
For the design of wearing courses where expensive performance testing like the four
point bending beam fatigue test is not warranted, the indirect tensile strength (ITS) test
parameters coupled with the evaluation of binder durability, can be used to determine
whether there is a risk of premature fatigue failure (CSIR & SABITA, 2001, p. 7-2).
The ITS test was done in accordance with ASTM D6931-07. Specimens for the ITS
were prepared using Marshall compaction technique. The ITS test was carried out on
four cylindrical samples, compacted to 4% air void content and partially saturated
with water. Two samples were “conditioned” by freezing them for at least 15 hours
and subsequently immersing them in a water bath set at 60 °C for 24 hours.
A cylindrical asphalt specimen was loaded on the diametral axis at a constant rate as
shown in Figure 3.24 until a significant loss in applied load was noted. The peak load
is used to calculate the ITS. The ratio of the ITS values of the conditioned and
unconditioned samples, termed the tensile strength ratio (TSR), was used to assess the
susceptibility to moisture damage. The results are presented, analysed and discussed
in Section 4.5.2.
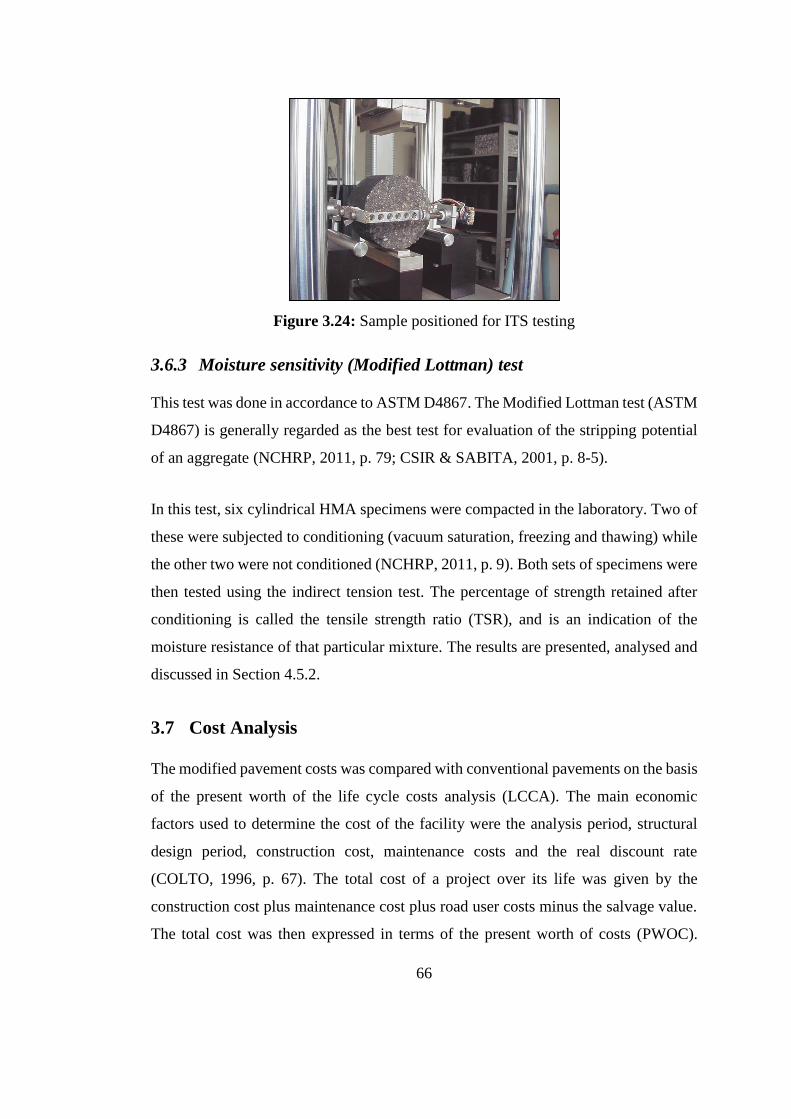
66
Figure 3.24: Sample positioned for ITS testing
3.6.3 Moisture sensitivity (Modified Lottman) test
This test was done in accordance to ASTM D4867. The Modified Lottman test (ASTM
D4867) is generally regarded as the best test for evaluation of the stripping potential
of an aggregate (NCHRP, 2011, p. 79; CSIR & SABITA, 2001, p. 8-5).
In this test, six cylindrical HMA specimens were compacted in the laboratory. Two of
these were subjected to conditioning (vacuum saturation, freezing and thawing) while
the other two were not conditioned (NCHRP, 2011, p. 9). Both sets of specimens were
then tested using the indirect tension test. The percentage of strength retained after
conditioning is called the tensile strength ratio (TSR), and is an indication of the
moisture resistance of that particular mixture. The results are presented, analysed and
discussed in Section 4.5.2.
3.7 Cost Analysis
The modified pavement costs was compared with conventional pavements on the basis
of the present worth of the life cycle costs analysis (LCCA). The main economic
factors used to determine the cost of the facility were the analysis period, structural
design period, construction cost, maintenance costs and the real discount rate
(COLTO, 1996, p. 67). The total cost of a project over its life was given by the
construction cost plus maintenance cost plus road user costs minus the salvage value.
The total cost was then expressed in terms of the present worth of costs (PWOC).
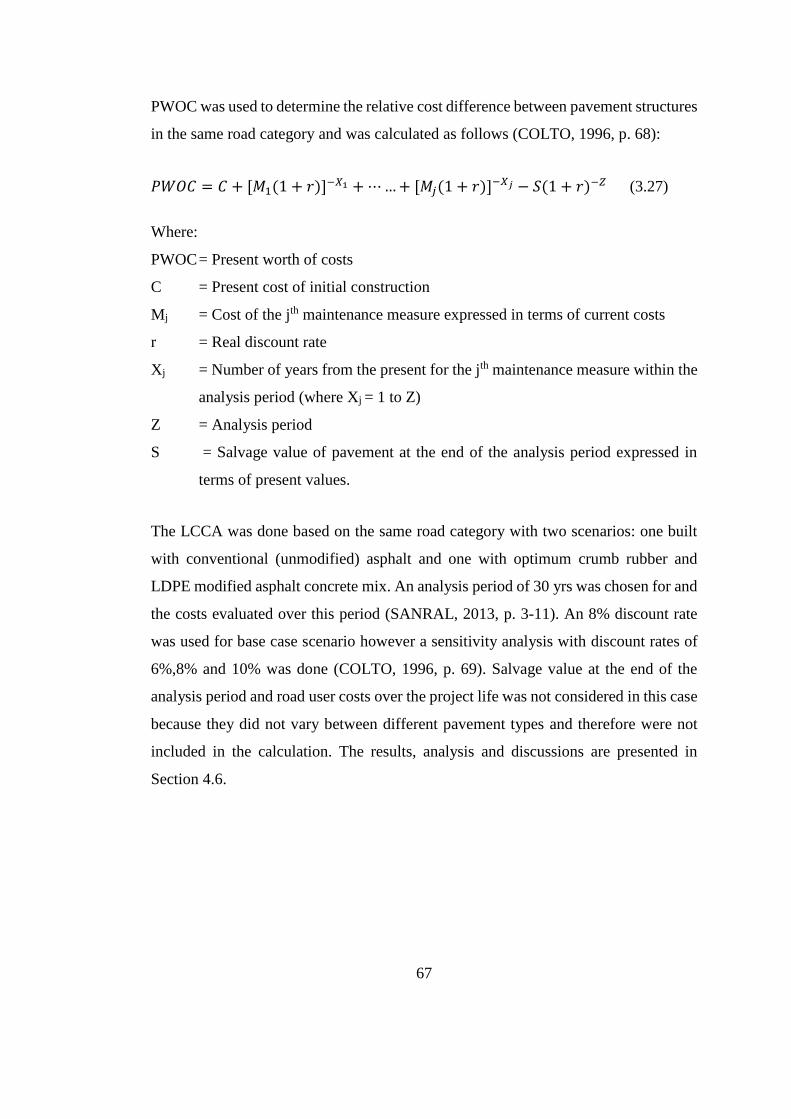
67
PWOC was used to determine the relative cost difference between pavement structures
in the same road category and was calculated as follows (COLTO, 1996, p. 68):
𝑃𝑊𝑂𝐶 = 𝐶 + [𝑀1(1 + 𝑟)]−𝑋1 + ⋯ … + [𝑀𝑗(1 + 𝑟)]−𝑋𝑗 − 𝑆(1 + 𝑟)−𝑍 (3.27)
Where:
PWOC = Present worth of costs
C = Present cost of initial construction
Mj = Cost of the jth maintenance measure expressed in terms of current costs
r = Real discount rate
Xj = Number of years from the present for the jth maintenance measure within the
analysis period (where Xj = 1 to Z)
Z = Analysis period
S = Salvage value of pavement at the end of the analysis period expressed in
terms of present values.
The LCCA was done based on the same road category with two scenarios: one built
with conventional (unmodified) asphalt and one with optimum crumb rubber and
LDPE modified asphalt concrete mix. An analysis period of 30 yrs was chosen for and
the costs evaluated over this period (SANRAL, 2013, p. 3-11). An 8% discount rate
was used for base case scenario however a sensitivity analysis with discount rates of
6%,8% and 10% was done (COLTO, 1996, p. 69). Salvage value at the end of the
analysis period and road user costs over the project life was not considered in this case
because they did not vary between different pavement types and therefore were not
included in the calculation. The results, analysis and discussions are presented in
Section 4.6.
68
4 RESULTS, ANALYSIS AND DISCUSSION
4.1 Introduction
This chapter presents the results, their analysis and the discussions that connects them
to the specific objectives of this research. The significance of the experimental results,
collected data and references to the outcome of the literature review will be blended in
this chapter to connect the various experimental and other results to give credible
answers to the objectives of this research.
4.2 Materials for Hot Mix Asphalt
Hot mix asphalt mixtures are composed primarily of aggregate and asphalt binder.
Aggregates make up about 95% of a hot mix asphalt (HMA) mixture by weight
whereas the asphalt binder makes up the remaining 5% (CSIR & SABITA, 2001, p.
4). By volume a typical HMA mixture is about 85% aggregate, 10% asphalt binder
and 5% air voids. These components were tested, analysed and benchmarked to the
standard specifications. The individual properties of the constituent materials were
characterised and their influence on the overall performance of the HMA discussed.
4.2.1 Mineral aggregate physical properties
Pavement engineers have been able relate specific aggregate properties to HMA
performance such as rutting, ravelling, fatigue cracking, skid resistance and moisture
resistance (NCHRP, 2011, p. 28). The mineral aggregate physical properties test
results and specifications are summarized in Table 4.1. The results reported for
hardness and toughness are ACV, 10% FACT, AIV (Treton), and LAA tests. While
for particle shape and texture are flakiness index and course aggregate fractured faces.
Other physical properties tests included are grading, course and fine aggregate specific
gravity, water absorption and cleanliness.
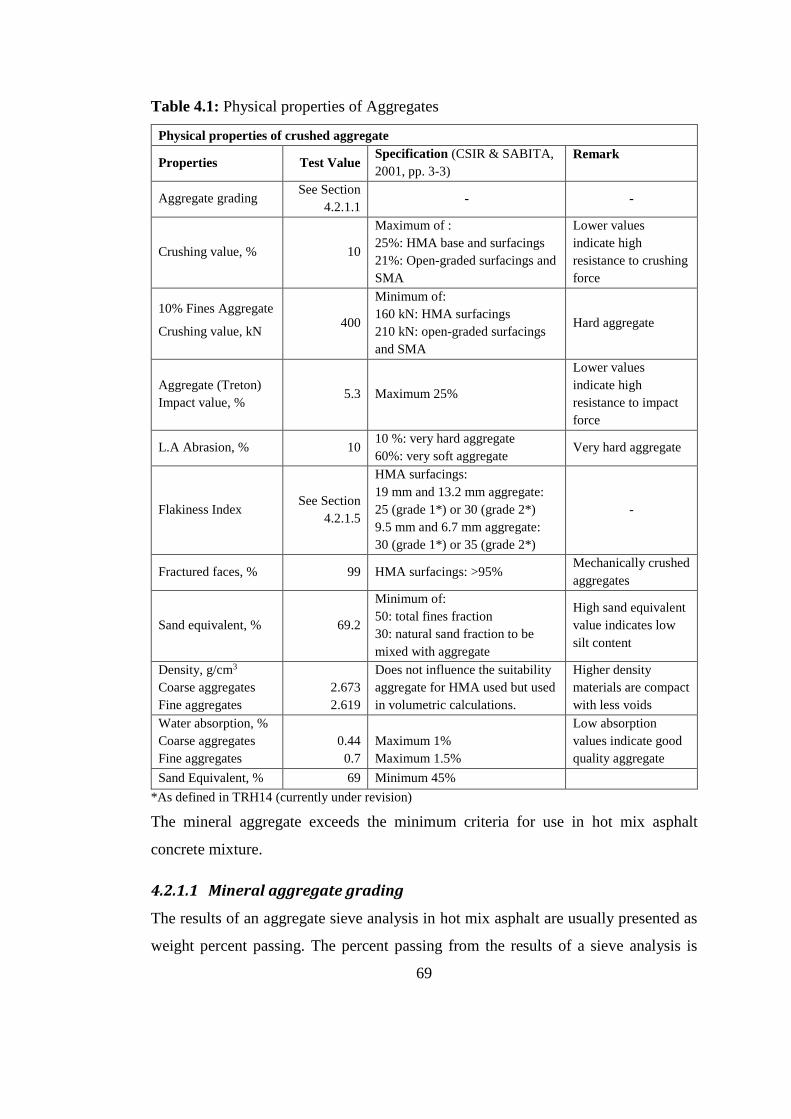
69
Table 4.1: Physical properties of Aggregates
Physical properties of crushed aggregate
Properties Test Value Specification (CSIR & SABITA,
2001, pp. 3-3)
Remark
Aggregate grading See Section
4.2.1.1 - -
Crushing value, % 10
Maximum of :
25%: HMA base and surfacings
21%: Open-graded surfacings and
SMA
Lower values
indicate high
resistance to crushing
force
10% Fines Aggregate
Crushing value, kN 400
Minimum of:
160 kN: HMA surfacings
210 kN: open-graded surfacings
and SMA
Hard aggregate
Aggregate (Treton)
Impact value, % 5.3 Maximum 25%
Lower values
indicate high
resistance to impact
force
L.A Abrasion, % 10 10 %: very hard aggregate
60%: very soft aggregate Very hard aggregate
Flakiness Index See Section
4.2.1.5
HMA surfacings:
19 mm and 13.2 mm aggregate:
25 (grade 1*) or 30 (grade 2*)
9.5 mm and 6.7 mm aggregate:
30 (grade 1*) or 35 (grade 2*)
-
Fractured faces, % 99 HMA surfacings: >95% Mechanically crushed
aggregates
Sand equivalent, % 69.2
Minimum of:
50: total fines fraction
30: natural sand fraction to be
mixed with aggregate
High sand equivalent
value indicates low
silt content
Density, g/cm3
Coarse aggregates
Fine aggregates
2.673
2.619
Does not influence the suitability
aggregate for HMA used but used
in volumetric calculations.
Higher density
materials are compact
with less voids
Water absorption, %
Coarse aggregates
Fine aggregates
0.44
0.7
Maximum 1%
Maximum 1.5%
Low absorption
values indicate good
quality aggregate
Sand Equivalent, % 69 Minimum 45%
*As defined in TRH14 (currently under revision)
The mineral aggregate exceeds the minimum criteria for use in hot mix asphalt
concrete mixture.
4.2.1.1 Mineral aggregate grading
The results of an aggregate sieve analysis in hot mix asphalt are usually presented as
weight percent passing. The percent passing from the results of a sieve analysis is
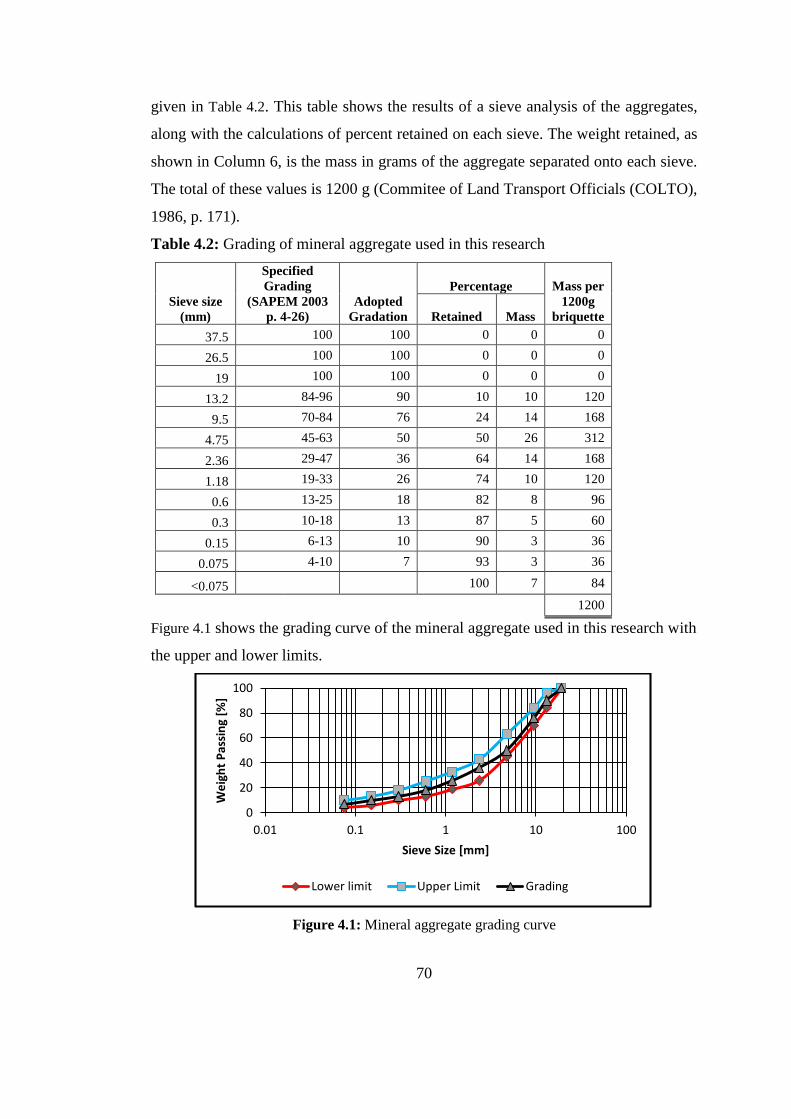
70
given in Table 4.2. This table shows the results of a sieve analysis of the aggregates,
along with the calculations of percent retained on each sieve. The weight retained, as
shown in Column 6, is the mass in grams of the aggregate separated onto each sieve.
The total of these values is 1200 g (Commitee of Land Transport Officials (COLTO),
1986, p. 171).
Table 4.2: Grading of mineral aggregate used in this research
Sieve size
(mm)
Specified
Grading
(SAPEM 2003
p. 4-26)
Adopted
Gradation
Percentage Mass per
1200g
briquette Retained Mass
37.5 100 100 0 0 0
26.5 100 100 0 0 0
19 100 100 0 0 0
13.2 84-96 90 10 10 120
9.5 70-84 76 24 14 168
4.75 45-63 50 50 26 312
2.36 29-47 36 64 14 168
1.18 19-33 26 74 10 120
0.6 13-25 18 82 8 96
0.3 10-18 13 87 5 60
0.15 6-13 10 90 3 36
0.075 4-10 7 93 3 36
<0.075 100 7 84
1200
Figure 4.1 shows the grading curve of the mineral aggregate used in this research with
the upper and lower limits.
Figure 4.1: Mineral aggregate grading curve
0
20
40
60
80
100
0.01 0.1 1 10 100
We
igh
t P
assi
ng
[%]
Sieve Size [mm]
Lower limit Upper Limit Grading
71
The grading selected fits within the grading limit for continuously graded asphalt mix.
Densely graded sand-skeleton mixes are the most commonly used mix type for low to
high traffic volume designs (The South African National Roads Agency, 2001, p. 4-
6). This design derives its stability from a sand skeleton which comprises of a densely
graded mix with the spaces between the coarse aggregate particles filled with well-
graded portions of finer aggregate.
4.2.1.2 Aggregate crushing value and 10% FACT
The ACV test is an assessment of the strength of aggregates to resist crushing under
traffic wheel loads. A test result of 10% for ACV under 400 kN on dry material was
obtained. This also doubles up as the ten percent FACT value. The 10% FACT value
of 400 kN obtained is an indication of a high resistance of the aggregate material to
crushing under a gradually applied load. The result shows that the aggregates are
strong enough to resist crushing under traffic wheel loads.
4.2.1.3 Aggregate (Treton) Impact value (AIV)
The aggregate impact value (AIV) test is a relative measure of the resistance of an
aggregate to sudden shock or impact. The test value of 5.3% indicates high resistance
to impact of the aggregate as it is less than the maximum specification of 25%. This
value shows that there was little disintegration which is an indication of a hard
material.
4.2.1.4 Los Angeles Abrasion (LAA)
The aggregates LAA result of 10% is an indication of very hard aggregate. Hence this
material is of good aggregate strength when subject to abrasive wear. This implies that
the aggregate particles would not break during construction therefore ensuring that the
asphalt concrete mix can be placed and compacted properly. Aggregate toughness and
abrasion resistance have been shown to relate to the pavement performance.
Aggregates with poor abrasion resistance polish under traffic action causing the
pavement surface to lose skid resistance especially under wet conditions. The LAA
test is not a standard test in South Africa because the correlation between LAA test
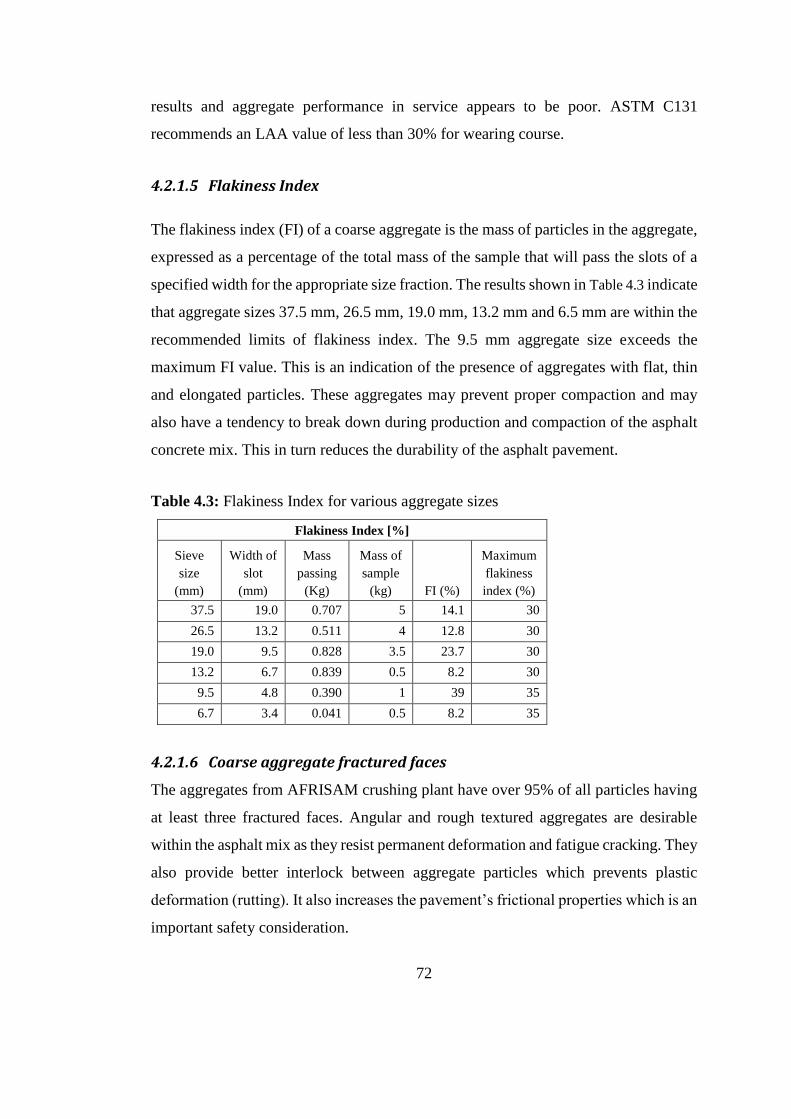
72
results and aggregate performance in service appears to be poor. ASTM C131
recommends an LAA value of less than 30% for wearing course.
4.2.1.5 Flakiness Index
The flakiness index (FI) of a coarse aggregate is the mass of particles in the aggregate,
expressed as a percentage of the total mass of the sample that will pass the slots of a
specified width for the appropriate size fraction. The results shown in Table 4.3 indicate
that aggregate sizes 37.5 mm, 26.5 mm, 19.0 mm, 13.2 mm and 6.5 mm are within the
recommended limits of flakiness index. The 9.5 mm aggregate size exceeds the
maximum FI value. This is an indication of the presence of aggregates with flat, thin
and elongated particles. These aggregates may prevent proper compaction and may
also have a tendency to break down during production and compaction of the asphalt
concrete mix. This in turn reduces the durability of the asphalt pavement.
Table 4.3: Flakiness Index for various aggregate sizes
Flakiness Index [%]
Sieve
size
(mm)
Width of
slot
(mm)
Mass
passing
(Kg)
Mass of
sample
(kg) FI (%)
Maximum
flakiness
index (%)
37.5 19.0 0.707 5 14.1 30
26.5 13.2 0.511 4 12.8 30
19.0 9.5 0.828 3.5 23.7 30
13.2 6.7 0.839 0.5 8.2 30
9.5 4.8 0.390 1 39 35
6.7 3.4 0.041 0.5 8.2 35
4.2.1.6 Coarse aggregate fractured faces
The aggregates from AFRISAM crushing plant have over 95% of all particles having
at least three fractured faces. Angular and rough textured aggregates are desirable
within the asphalt mix as they resist permanent deformation and fatigue cracking. They
also provide better interlock between aggregate particles which prevents plastic
deformation (rutting). It also increases the pavement’s frictional properties which is an
important safety consideration.
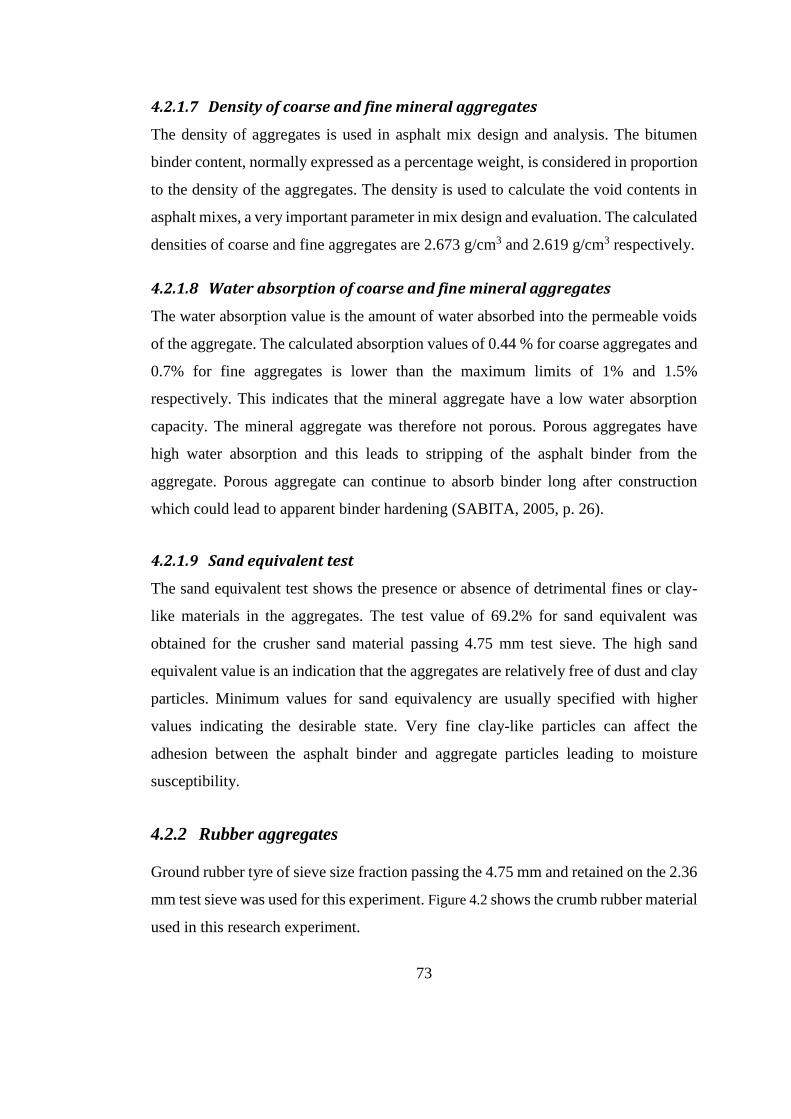
73
4.2.1.7 Density of coarse and fine mineral aggregates
The density of aggregates is used in asphalt mix design and analysis. The bitumen
binder content, normally expressed as a percentage weight, is considered in proportion
to the density of the aggregates. The density is used to calculate the void contents in
asphalt mixes, a very important parameter in mix design and evaluation. The calculated
densities of coarse and fine aggregates are 2.673 g/cm3 and 2.619 g/cm3 respectively.
4.2.1.8 Water absorption of coarse and fine mineral aggregates
The water absorption value is the amount of water absorbed into the permeable voids
of the aggregate. The calculated absorption values of 0.44 % for coarse aggregates and
0.7% for fine aggregates is lower than the maximum limits of 1% and 1.5%
respectively. This indicates that the mineral aggregate have a low water absorption
capacity. The mineral aggregate was therefore not porous. Porous aggregates have
high water absorption and this leads to stripping of the asphalt binder from the
aggregate. Porous aggregate can continue to absorb binder long after construction
which could lead to apparent binder hardening (SABITA, 2005, p. 26).
4.2.1.9 Sand equivalent test
The sand equivalent test shows the presence or absence of detrimental fines or clay-
like materials in the aggregates. The test value of 69.2% for sand equivalent was
obtained for the crusher sand material passing 4.75 mm test sieve. The high sand
equivalent value is an indication that the aggregates are relatively free of dust and clay
particles. Minimum values for sand equivalency are usually specified with higher
values indicating the desirable state. Very fine clay-like particles can affect the
adhesion between the asphalt binder and aggregate particles leading to moisture
susceptibility.
4.2.2 Rubber aggregates
Ground rubber tyre of sieve size fraction passing the 4.75 mm and retained on the 2.36
mm test sieve was used for this experiment. Figure 4.2 shows the crumb rubber material
used in this research experiment.
74
Figure 4.2: 2.36 mm crumb rubber
4.2.3 Bitumen characterisation
The bitumen characteristics used in this study are discussed below.
a) Density
The density of bitumen varies depending on the crude oil source. The density does not
influence the suitability of bitumen for HMA but is used in volumetric calculations.
b) Penetration
The bitumen used in this research was penetration grade 60/70. This bitumen grade
has a penetration range of 60-70 dmm. The sample tested gave a penetration value of
68 dmm which is within the specified range. High penetration grade is desirable in
colder regions. Penetration below 20 will result in cracking. For lower penetration
grades the bonding of the binder with the aggregate is difficult to achieve but once
achieved, the bond lasts a long time.
c) Softening point
The softening point is an indication of the capacity of the bitumen to perform
adequately at high in-service temperatures. The sample giving a value of 44.4 is within
the standard specifications of this bitumen grade. Higher values indicate greater
susceptibility to rutting while lower values greater susceptibility to fatigue cracking.
Bitumen with higher softening point is used for warmer places.
75
d) Ductility
The ductility improves the physical interlocking of aggregate bituminous mixes.
Binder material with low ductility would crack under traffic loading therefore
becoming a pervious pavement surface.
e) Dynamic viscosity
Dynamic viscosity value is used to assess consistency at high in-service and
application temperatures. This is used to determine the correct pumping, spraying,
mixing and compaction temperatures. The dynamic viscosity value at 60 ˚C of 193.7
Pa.s (Pascal second) is within the specified range. Lower values indicate greater
susceptibility to rutting of the mix during service of the road pavement.
f) Rolling Thin Film Oven Test Aging
RTFO test exposed the bitumen to simulated short term ageing and hardening due to
the effect of heat and oxidation in the presence of air as in the hot mix asphalt
manufacturing process. A change in mass of 0.23% which is less than the specified
limit of 0.5% is an indication of acceptable loss of volatiles. The retained penetration
value of 58 dmm is greater than the minimum specification for grade 60/70 pen grade
bitumen. Lower penetration values indicate susceptibility to thermal cracking. The
increase in softening point by 5.4 ˚C is below the maximum allowable value of 9 ˚C.
Higher values indicate low durability of the binder. The change in dynamic viscosity
at 60 ˚C is 51.45% of the original. This is lower than the specified maximum of 300%.
This is an indication of a durable binder.
Table 4.4 shows the standard tests results and specifications for bituminous binder
used in this study.
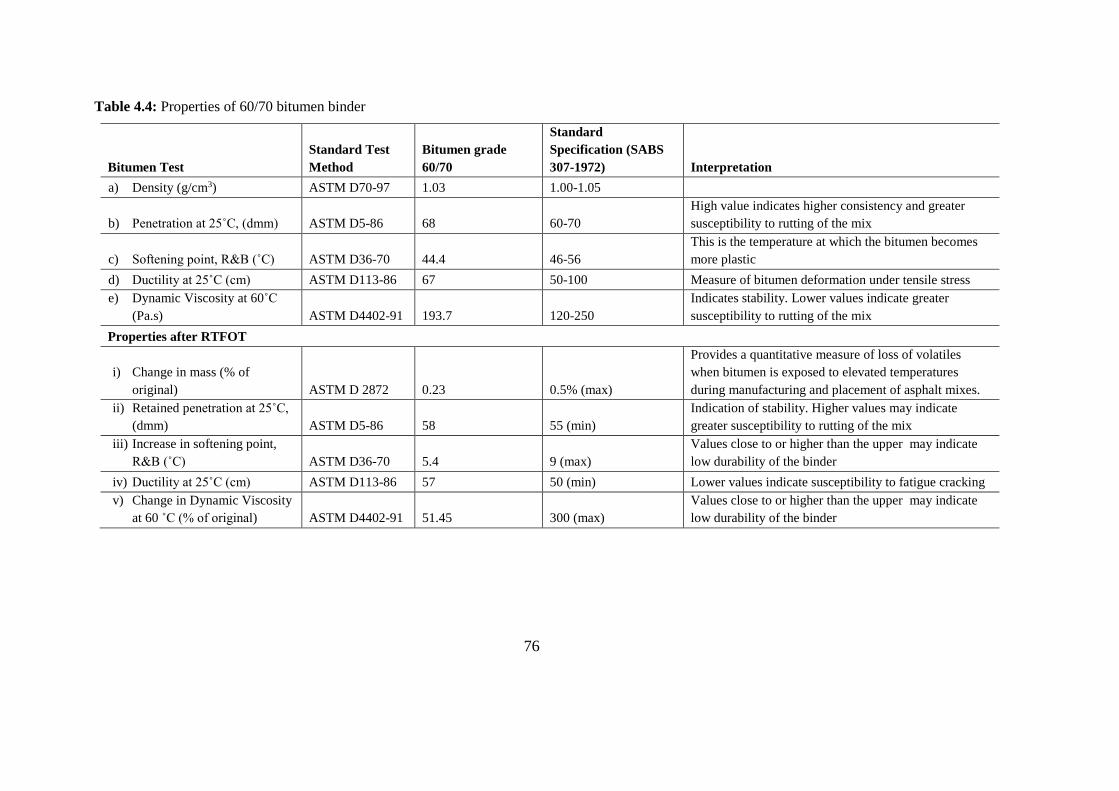
76
Table 4.4: Properties of 60/70 bitumen binder
Bitumen Test
Standard Test
Method
Bitumen grade
60/70
Standard
Specification (SABS
307-1972) Interpretation
a) Density (g/cm3) ASTM D70-97 1.03 1.00-1.05
b) Penetration at 25˚C, (dmm) ASTM D5-86 68 60-70
High value indicates higher consistency and greater
susceptibility to rutting of the mix
c) Softening point, R&B (˚C) ASTM D36-70 44.4 46-56
This is the temperature at which the bitumen becomes
more plastic
d) Ductility at 25˚C (cm) ASTM D113-86 67 50-100 Measure of bitumen deformation under tensile stress
e) Dynamic Viscosity at 60˚C
(Pa.s) ASTM D4402-91 193.7 120-250
Indicates stability. Lower values indicate greater
susceptibility to rutting of the mix
Properties after RTFOT
i) Change in mass (% of
original) ASTM D 2872 0.23 0.5% (max)
Provides a quantitative measure of loss of volatiles
when bitumen is exposed to elevated temperatures
during manufacturing and placement of asphalt mixes.
ii) Retained penetration at 25˚C,
(dmm) ASTM D5-86 58 55 (min)
Indication of stability. Higher values may indicate
greater susceptibility to rutting of the mix
iii) Increase in softening point,
R&B (˚C) ASTM D36-70 5.4 9 (max)
Values close to or higher than the upper may indicate
low durability of the binder
iv) Ductility at 25˚C (cm) ASTM D113-86 57 50 (min) Lower values indicate susceptibility to fatigue cracking
v) Change in Dynamic Viscosity
at 60 ˚C (% of original) ASTM D4402-91 51.45 300 (max)
Values close to or higher than the upper may indicate
low durability of the binder
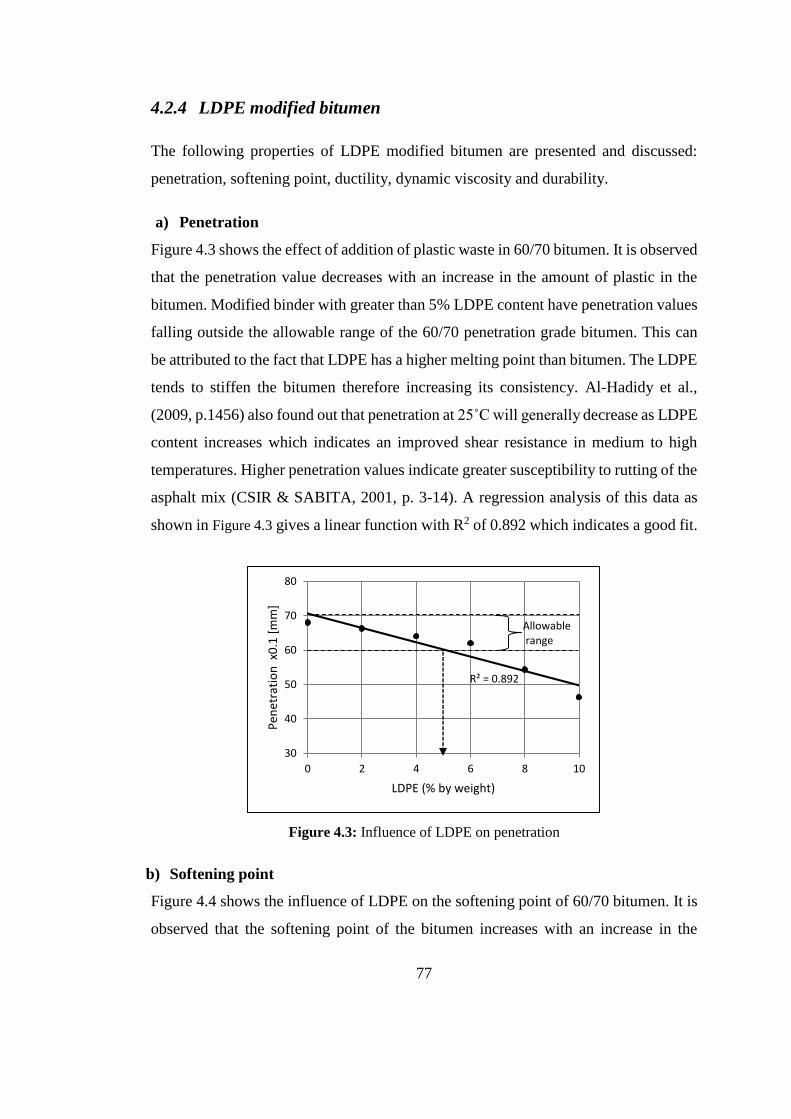
77
4.2.4 LDPE modified bitumen
The following properties of LDPE modified bitumen are presented and discussed:
penetration, softening point, ductility, dynamic viscosity and durability.
a) Penetration
Figure 4.3 shows the effect of addition of plastic waste in 60/70 bitumen. It is observed
that the penetration value decreases with an increase in the amount of plastic in the
bitumen. Modified binder with greater than 5% LDPE content have penetration values
falling outside the allowable range of the 60/70 penetration grade bitumen. This can
be attributed to the fact that LDPE has a higher melting point than bitumen. The LDPE
tends to stiffen the bitumen therefore increasing its consistency. Al-Hadidy et al.,
(2009, p.1456) also found out that penetration at 25˚C will generally decrease as LDPE
content increases which indicates an improved shear resistance in medium to high
temperatures. Higher penetration values indicate greater susceptibility to rutting of the
asphalt mix (CSIR & SABITA, 2001, p. 3-14). A regression analysis of this data as
shown in Figure 4.3 gives a linear function with R2 of 0.892 which indicates a good fit.
Figure 4.3: Influence of LDPE on penetration
b) Softening point
Figure 4.4 shows the influence of LDPE on the softening point of 60/70 bitumen. It is
observed that the softening point of the bitumen increases with an increase in the
R² = 0.892
30
40
50
60
70
80
0 2 4 6 8 10
Pen
etra
tio
n x
0.1
[m
m]
LDPE (% by weight)
Allowablerange
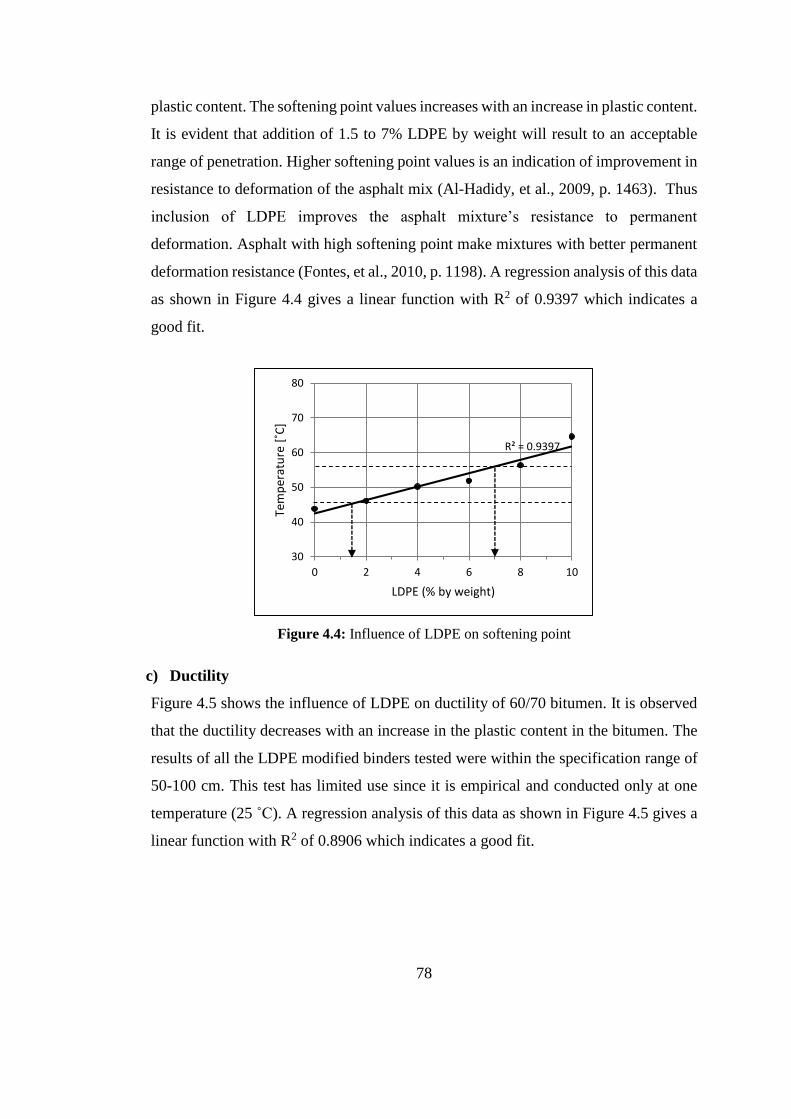
78
plastic content. The softening point values increases with an increase in plastic content.
It is evident that addition of 1.5 to 7% LDPE by weight will result to an acceptable
range of penetration. Higher softening point values is an indication of improvement in
resistance to deformation of the asphalt mix (Al-Hadidy, et al., 2009, p. 1463). Thus
inclusion of LDPE improves the asphalt mixture’s resistance to permanent
deformation. Asphalt with high softening point make mixtures with better permanent
deformation resistance (Fontes, et al., 2010, p. 1198). A regression analysis of this data
as shown in Figure 4.4 gives a linear function with R2 of 0.9397 which indicates a
good fit.
Figure 4.4: Influence of LDPE on softening point
c) Ductility
Figure 4.5 shows the influence of LDPE on ductility of 60/70 bitumen. It is observed
that the ductility decreases with an increase in the plastic content in the bitumen. The
results of all the LDPE modified binders tested were within the specification range of
50-100 cm. This test has limited use since it is empirical and conducted only at one
temperature (25 ˚C). A regression analysis of this data as shown in Figure 4.5 gives a
linear function with R2 of 0.8906 which indicates a good fit.
R² = 0.9397
30
40
50
60
70
80
0 2 4 6 8 10
Tem
per
atu
re [
˚C]
LDPE (% by weight)
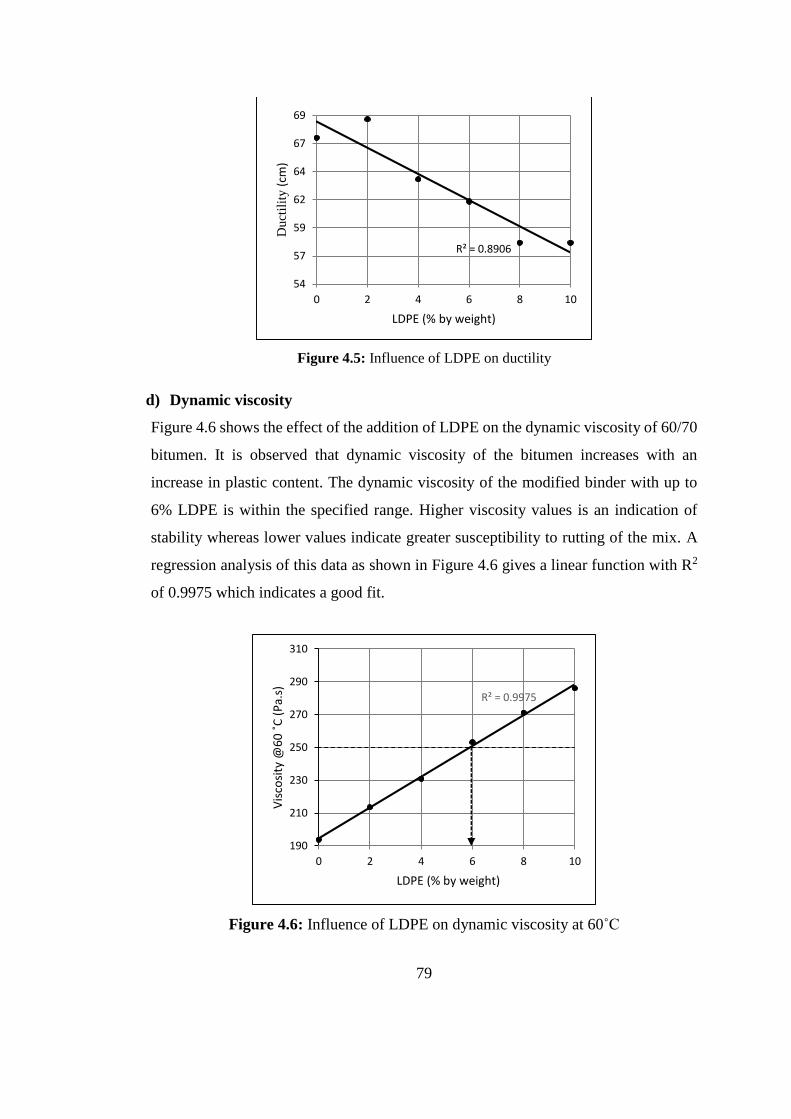
79
Figure 4.5: Influence of LDPE on ductility
d) Dynamic viscosity
Figure 4.6 shows the effect of the addition of LDPE on the dynamic viscosity of 60/70
bitumen. It is observed that dynamic viscosity of the bitumen increases with an
increase in plastic content. The dynamic viscosity of the modified binder with up to
6% LDPE is within the specified range. Higher viscosity values is an indication of
stability whereas lower values indicate greater susceptibility to rutting of the mix. A
regression analysis of this data as shown in Figure 4.6 gives a linear function with R2
of 0.9975 which indicates a good fit.
Figure 4.6: Influence of LDPE on dynamic viscosity at 60˚C
R² = 0.8906
54
57
59
62
64
67
69
0 2 4 6 8 10
Duct
ilit
y(c
m)
LDPE (% by weight)
R² = 0.9975
190
210
230
250
270
290
310
0 2 4 6 8 10
Vis
cosi
ty @
60
˚C
(Pa.
s)
LDPE (% by weight)
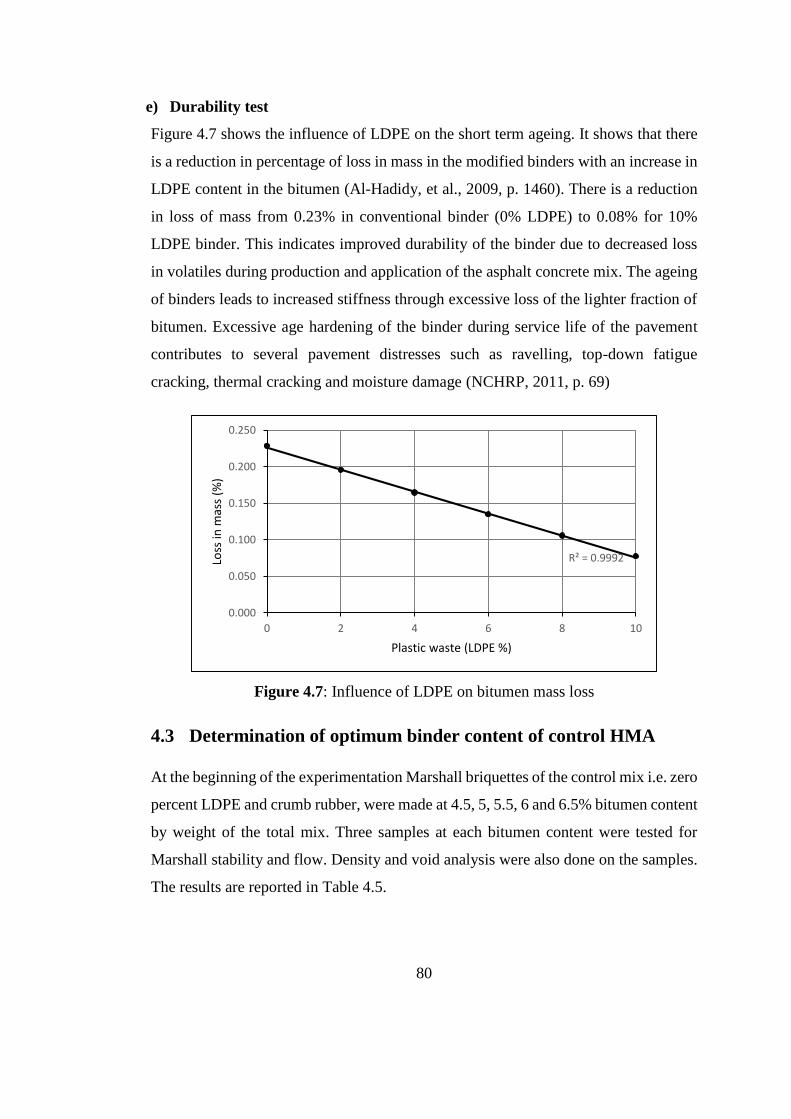
80
e) Durability test
Figure 4.7 shows the influence of LDPE on the short term ageing. It shows that there
is a reduction in percentage of loss in mass in the modified binders with an increase in
LDPE content in the bitumen (Al-Hadidy, et al., 2009, p. 1460). There is a reduction
in loss of mass from 0.23% in conventional binder (0% LDPE) to 0.08% for 10%
LDPE binder. This indicates improved durability of the binder due to decreased loss
in volatiles during production and application of the asphalt concrete mix. The ageing
of binders leads to increased stiffness through excessive loss of the lighter fraction of
bitumen. Excessive age hardening of the binder during service life of the pavement
contributes to several pavement distresses such as ravelling, top-down fatigue
cracking, thermal cracking and moisture damage (NCHRP, 2011, p. 69)
Figure 4.7: Influence of LDPE on bitumen mass loss
4.3 Determination of optimum binder content of control HMA
At the beginning of the experimentation Marshall briquettes of the control mix i.e. zero
percent LDPE and crumb rubber, were made at 4.5, 5, 5.5, 6 and 6.5% bitumen content
by weight of the total mix. Three samples at each bitumen content were tested for
Marshall stability and flow. Density and void analysis were also done on the samples.
The results are reported in Table 4.5.
R² = 0.9992
0.000
0.050
0.100
0.150
0.200
0.250
0 2 4 6 8 10
Loss
in m
ass
(%)
Plastic waste (LDPE %)
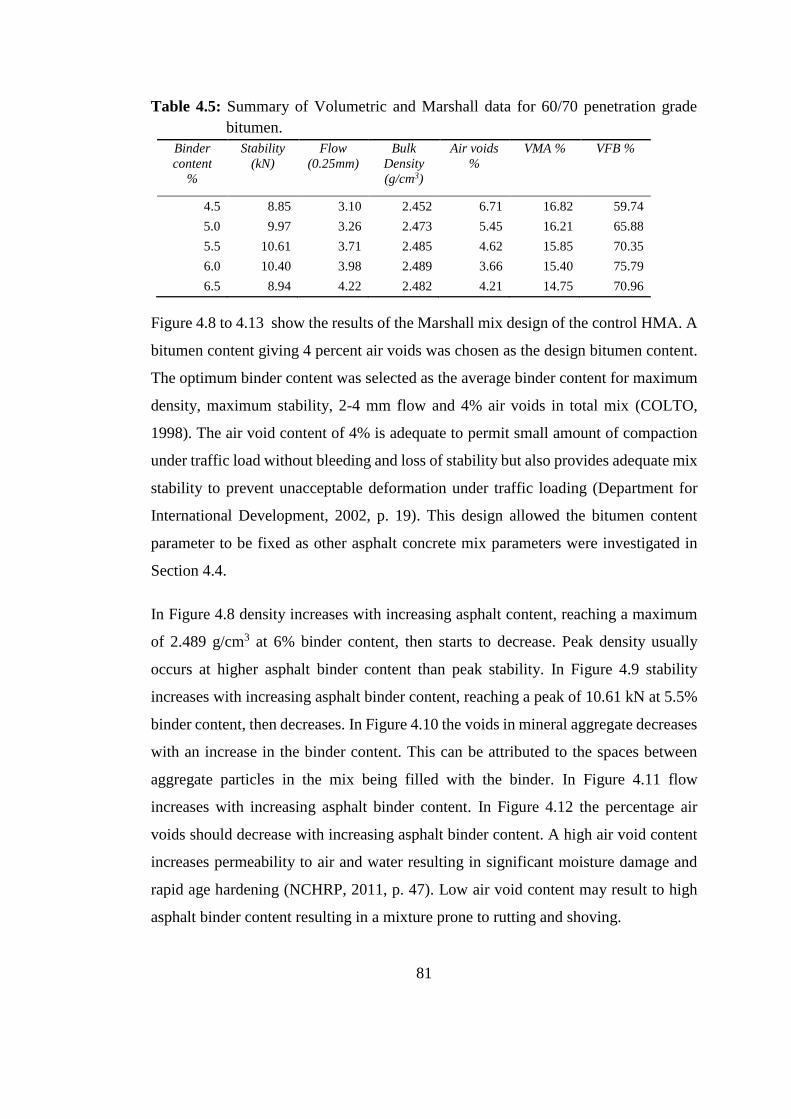
81
Table 4.5: Summary of Volumetric and Marshall data for 60/70 penetration grade
bitumen.
Binder
content
%
Stability
(kN)
Flow
(0.25mm)
Bulk
Density
(g/cm3)
Air voids
%
VMA % VFB %
4.5 8.85 3.10 2.452 6.71 16.82 59.74
5.0 9.97 3.26 2.473 5.45 16.21 65.88
5.5 10.61 3.71 2.485 4.62 15.85 70.35
6.0 10.40 3.98 2.489 3.66 15.40 75.79
6.5 8.94 4.22 2.482 4.21 14.75 70.96
Figure 4.8 to 4.13 show the results of the Marshall mix design of the control HMA. A
bitumen content giving 4 percent air voids was chosen as the design bitumen content.
The optimum binder content was selected as the average binder content for maximum
density, maximum stability, 2-4 mm flow and 4% air voids in total mix (COLTO,
1998). The air void content of 4% is adequate to permit small amount of compaction
under traffic load without bleeding and loss of stability but also provides adequate mix
stability to prevent unacceptable deformation under traffic loading (Department for
International Development, 2002, p. 19). This design allowed the bitumen content
parameter to be fixed as other asphalt concrete mix parameters were investigated in
Section 4.4.
In Figure 4.8 density increases with increasing asphalt content, reaching a maximum
of 2.489 g/cm3 at 6% binder content, then starts to decrease. Peak density usually
occurs at higher asphalt binder content than peak stability. In Figure 4.9 stability
increases with increasing asphalt binder content, reaching a peak of 10.61 kN at 5.5%
binder content, then decreases. In Figure 4.10 the voids in mineral aggregate decreases
with an increase in the binder content. This can be attributed to the spaces between
aggregate particles in the mix being filled with the binder. In Figure 4.11 flow
increases with increasing asphalt binder content. In Figure 4.12 the percentage air
voids should decrease with increasing asphalt binder content. A high air void content
increases permeability to air and water resulting in significant moisture damage and
rapid age hardening (NCHRP, 2011, p. 47). Low air void content may result to high
asphalt binder content resulting in a mixture prone to rutting and shoving.
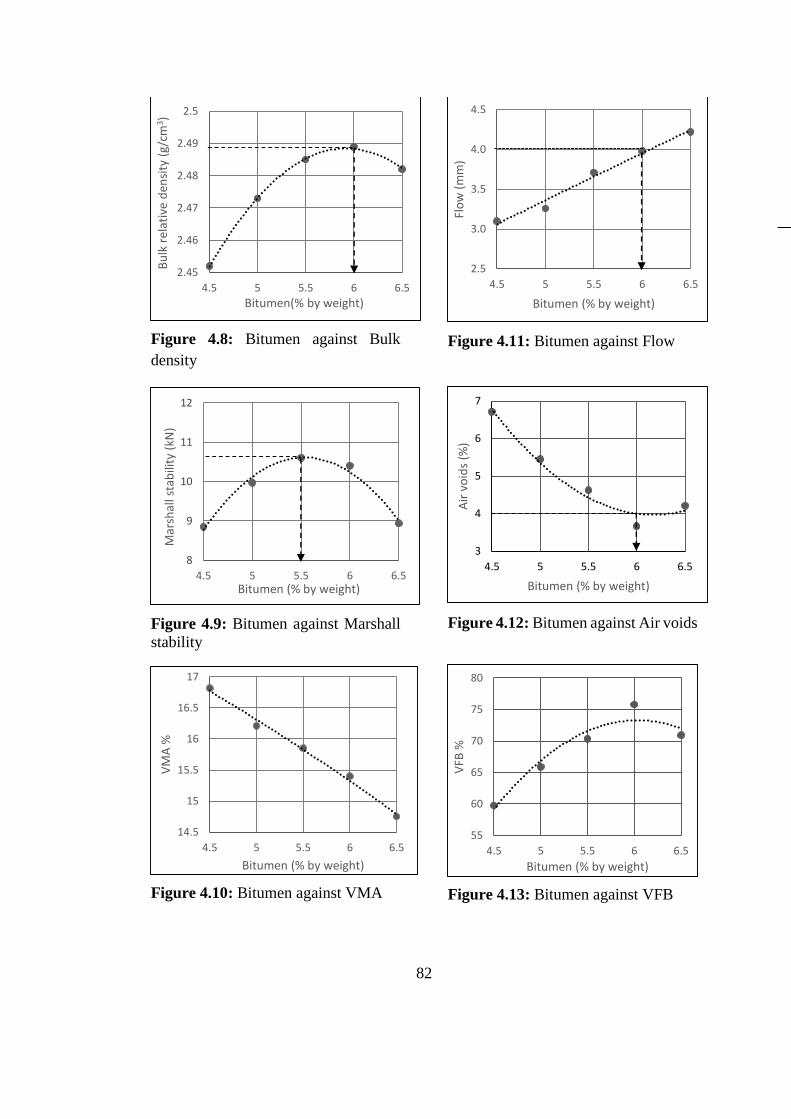
82
Figure 4.8: Bitumen against Bulk
density
Figure 4.9: Bitumen against Marshall
stability
Figure 4.10: Bitumen against VMA
Figure 4.11: Bitumen against Flow
Figure 4.12: Bitumen against Air voids
Figure 4.13: Bitumen against VFB
2.45
2.46
2.47
2.48
2.49
2.5
4.5 5 5.5 6 6.5
Bu
lk r
elat
ive
den
sity
(g/
cm3 )
Bitumen(% by weight)
8
9
10
11
12
4.5 5 5.5 6 6.5
Mar
shal
l sta
bili
ty (
kN)
Bitumen (% by weight)
14.5
15
15.5
16
16.5
17
4.5 5 5.5 6 6.5
VM
A %
Bitumen (% by weight)
2.5
3.0
3.5
4.0
4.5
4.5 5 5.5 6 6.5
Flo
w (
mm
)
Bitumen (% by weight)
3
4
5
6
7
4.5 5 5.5 6 6.5
Air
vo
ids
(%)
Bitumen (% by weight)
55
60
65
70
75
80
4.5 5 5.5 6 6.5
VFB
%
Bitumen (% by weight)
83
In Figure 4.10 percentage VMA decreases with increasing asphalt binder content. The
minimum VMA required for 13.2 mm nominal maximum stone size at 4.0 % voids in
mix is 11 % (Department for International Development, 2002, p. 19). This is to ensure
that the compacted mineral aggregate mix has a void content large enough to contain
sufficient bitumen. In Figure 4.13 the voids filled with binder (VFB) percentage
increases with increasing asphalt binder content. VFB is one of the volumetric
parameters with the strongest relationship to rutting performance. A void structure
overfilled with binder tends to lubricate aggregates thereby reducing frictional
resistance resulting in an increase in rutting potential.
The design binder content was calculated from the mean value of the binder contents
for maximum stability, maximum density, the mean value for the specified range of
void contents and the mean value for the specified range of flow values. Values of 6%,
5.5%, 6% and 6% bitumen are read off from Figures 4.8, 4.9, 4.11 and 4.12
respectively giving an average optimum binder content of 5.9%. This value was
rounded up to 6% to cater for asphalt binder that may be absorbed by the more porous
crumb rubber aggregates in modified asphalt concrete mixtures. This mix design
ensures adequate amount of asphalt binder for durability of the pavement as well as
workability during production and construction.
4.4 Optimization
Table 4.6 is a summary of the Marshall test results carried out on modified asphalt
concrete mix briquettes. The table shows results of bulk relative density, Marshall
stability, flow and Marshall quotient of the briquettes prepared for the study. These
properties were used to determine the optimum proportions of LDPE and crumb rubber
for the asphalt concrete mix. The optimal proportions were then used in preparation of
the modified asphalt concrete specimen used in subsequent performance tests.
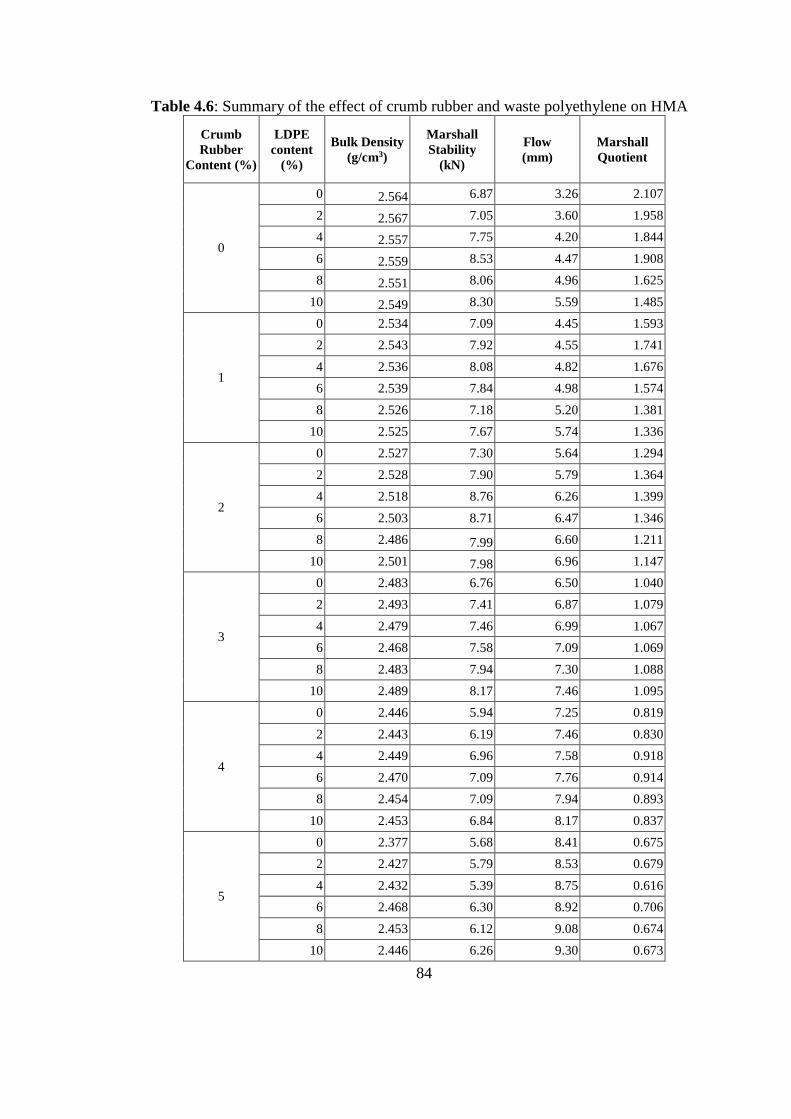
84
Table 4.6: Summary of the effect of crumb rubber and waste polyethylene on HMA
Crumb
Rubber
Content (%)
LDPE
content
(%)
Bulk Density
(g/cm3)
Marshall
Stability
(kN)
Flow
(mm)
Marshall
Quotient
0
0 2.564 6.87 3.26 2.107
2 2.567 7.05 3.60 1.958
4 2.557 7.75 4.20 1.844
6 2.559 8.53 4.47 1.908
8 2.551 8.06 4.96 1.625
10 2.549 8.30 5.59 1.485
1
0 2.534 7.09 4.45 1.593
2 2.543 7.92 4.55 1.741
4 2.536 8.08 4.82 1.676
6 2.539 7.84 4.98 1.574
8 2.526 7.18 5.20 1.381
10 2.525 7.67 5.74 1.336
2
0 2.527 7.30 5.64 1.294
2 2.528 7.90 5.79 1.364
4 2.518 8.76 6.26 1.399
6 2.503 8.71 6.47 1.346
8 2.486 7.99 6.60 1.211
10 2.501 7.98 6.96 1.147
3
0 2.483 6.76 6.50 1.040
2 2.493 7.41 6.87 1.079
4 2.479 7.46 6.99 1.067
6 2.468 7.58 7.09 1.069
8 2.483 7.94 7.30 1.088
10 2.489 8.17 7.46 1.095
4
0 2.446 5.94 7.25 0.819
2 2.443 6.19 7.46 0.830
4 2.449 6.96 7.58 0.918
6 2.470 7.09 7.76 0.914
8 2.454 7.09 7.94 0.893
10 2.453 6.84 8.17 0.837
5
0 2.377 5.68 8.41 0.675
2 2.427 5.79 8.53 0.679
4 2.432 5.39 8.75 0.616
6 2.468 6.30 8.92 0.706
8 2.453 6.12 9.08 0.674
10 2.446 6.26 9.30 0.673
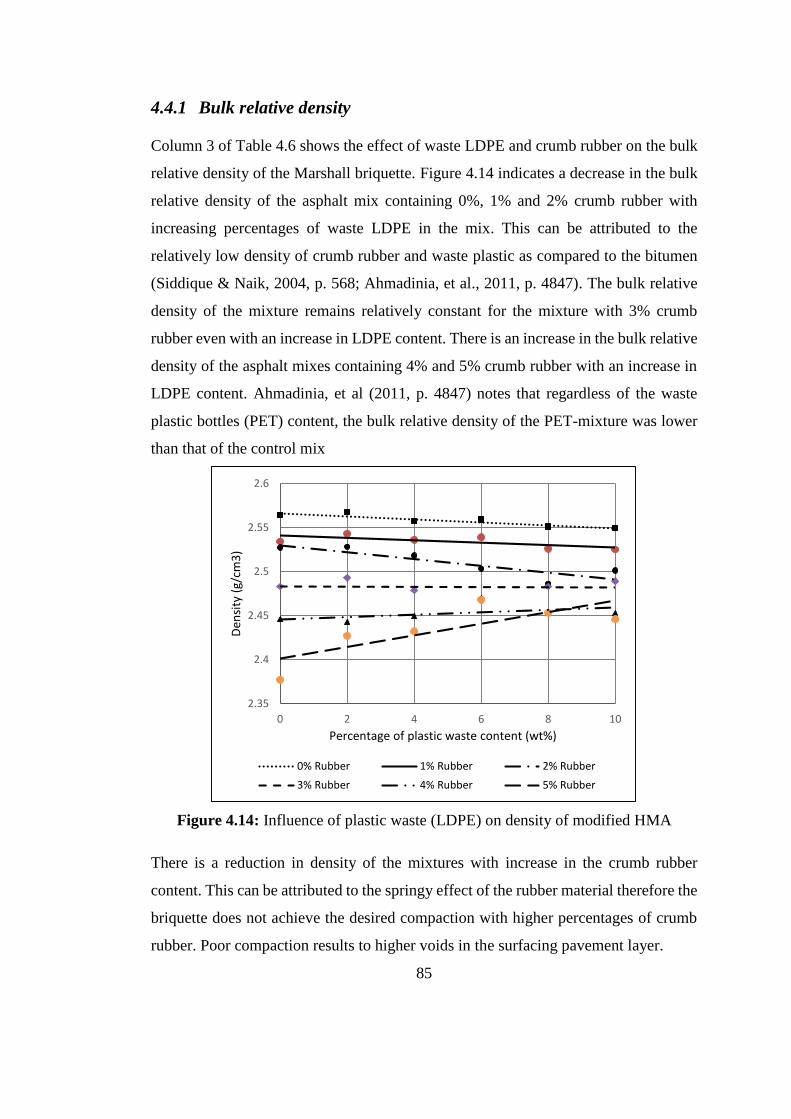
85
4.4.1 Bulk relative density
Column 3 of Table 4.6 shows the effect of waste LDPE and crumb rubber on the bulk
relative density of the Marshall briquette. Figure 4.14 indicates a decrease in the bulk
relative density of the asphalt mix containing 0%, 1% and 2% crumb rubber with
increasing percentages of waste LDPE in the mix. This can be attributed to the
relatively low density of crumb rubber and waste plastic as compared to the bitumen
(Siddique & Naik, 2004, p. 568; Ahmadinia, et al., 2011, p. 4847). The bulk relative
density of the mixture remains relatively constant for the mixture with 3% crumb
rubber even with an increase in LDPE content. There is an increase in the bulk relative
density of the asphalt mixes containing 4% and 5% crumb rubber with an increase in
LDPE content. Ahmadinia, et al (2011, p. 4847) notes that regardless of the waste
plastic bottles (PET) content, the bulk relative density of the PET-mixture was lower
than that of the control mix
Figure 4.14: Influence of plastic waste (LDPE) on density of modified HMA
There is a reduction in density of the mixtures with increase in the crumb rubber
content. This can be attributed to the springy effect of the rubber material therefore the
briquette does not achieve the desired compaction with higher percentages of crumb
rubber. Poor compaction results to higher voids in the surfacing pavement layer.
2.35
2.4
2.45
2.5
2.55
2.6
0 2 4 6 8 10
Den
sity
(g/
cm3
)
Percentage of plastic waste content (wt%)
0% Rubber 1% Rubber 2% Rubber
3% Rubber 4% Rubber 5% Rubber
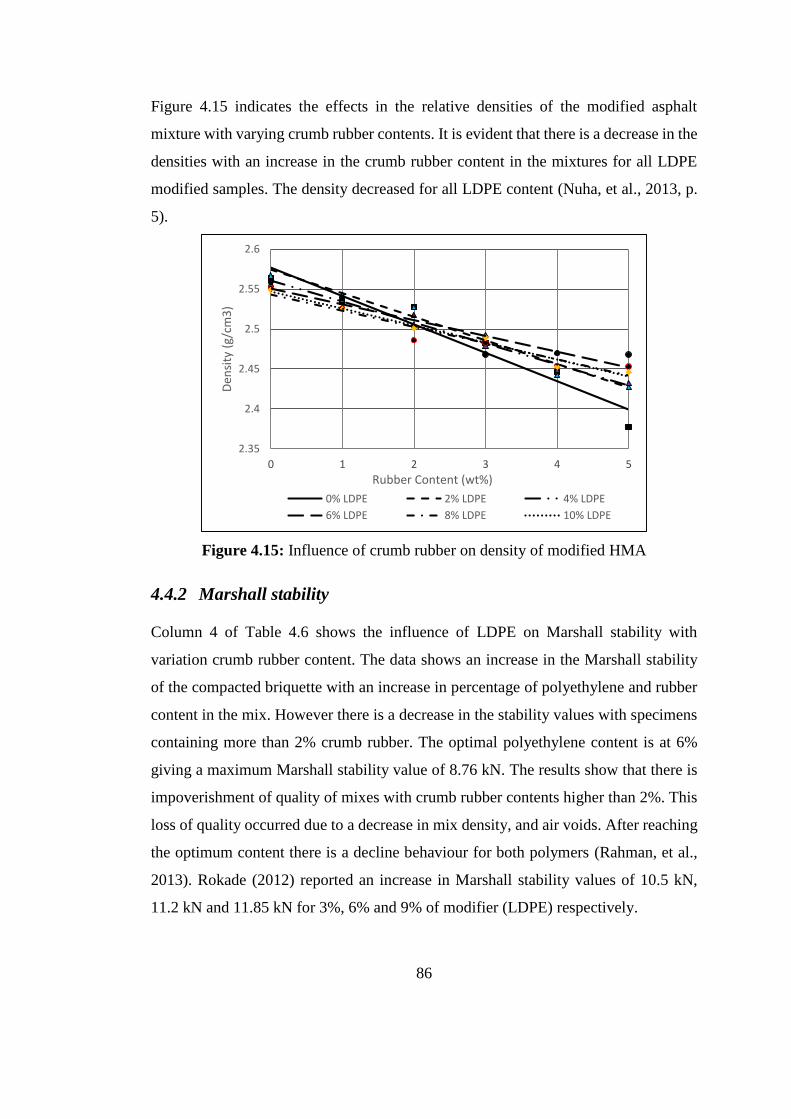
86
Figure 4.15 indicates the effects in the relative densities of the modified asphalt
mixture with varying crumb rubber contents. It is evident that there is a decrease in the
densities with an increase in the crumb rubber content in the mixtures for all LDPE
modified samples. The density decreased for all LDPE content (Nuha, et al., 2013, p.
5).
Figure 4.15: Influence of crumb rubber on density of modified HMA
4.4.2 Marshall stability
Column 4 of Table 4.6 shows the influence of LDPE on Marshall stability with
variation crumb rubber content. The data shows an increase in the Marshall stability
of the compacted briquette with an increase in percentage of polyethylene and rubber
content in the mix. However there is a decrease in the stability values with specimens
containing more than 2% crumb rubber. The optimal polyethylene content is at 6%
giving a maximum Marshall stability value of 8.76 kN. The results show that there is
impoverishment of quality of mixes with crumb rubber contents higher than 2%. This
loss of quality occurred due to a decrease in mix density, and air voids. After reaching
the optimum content there is a decline behaviour for both polymers (Rahman, et al.,
2013). Rokade (2012) reported an increase in Marshall stability values of 10.5 kN,
11.2 kN and 11.85 kN for 3%, 6% and 9% of modifier (LDPE) respectively.
2.35
2.4
2.45
2.5
2.55
2.6
0 1 2 3 4 5
Den
sity
(g/
cm3
)
Rubber Content (wt%)
0% LDPE 2% LDPE 4% LDPE
6% LDPE 8% LDPE 10% LDPE
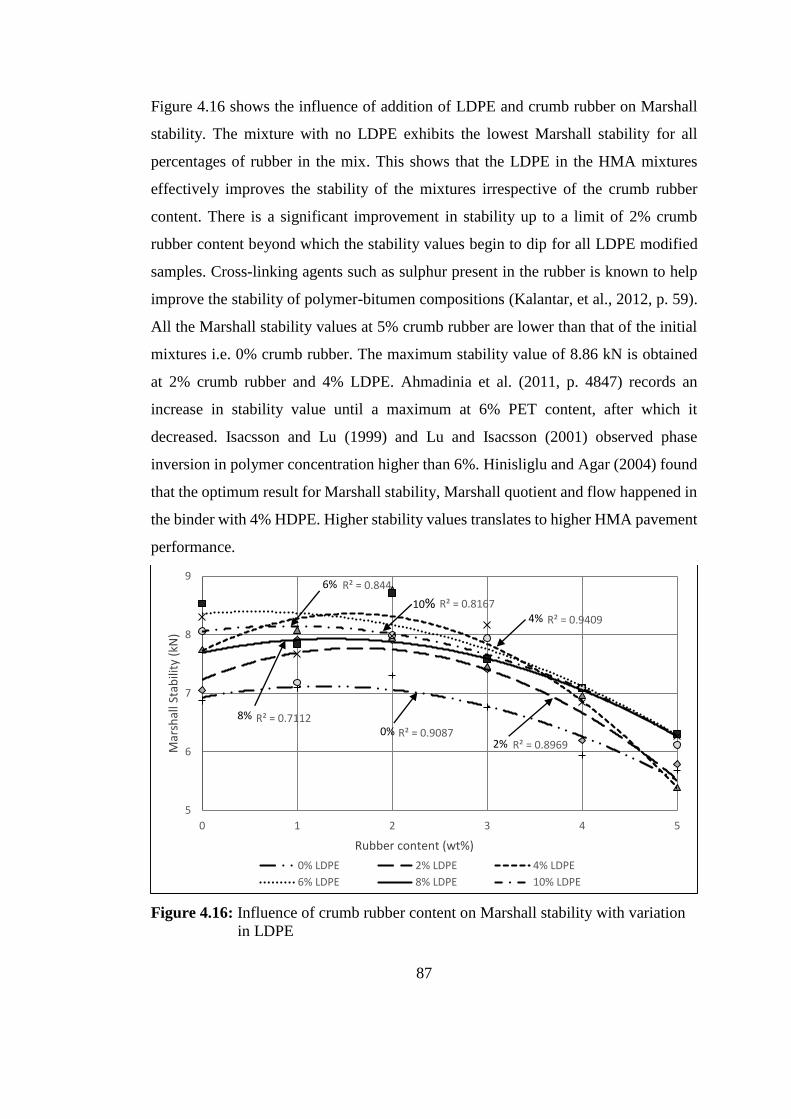
87
Figure 4.16 shows the influence of addition of LDPE and crumb rubber on Marshall
stability. The mixture with no LDPE exhibits the lowest Marshall stability for all
percentages of rubber in the mix. This shows that the LDPE in the HMA mixtures
effectively improves the stability of the mixtures irrespective of the crumb rubber
content. There is a significant improvement in stability up to a limit of 2% crumb
rubber content beyond which the stability values begin to dip for all LDPE modified
samples. Cross-linking agents such as sulphur present in the rubber is known to help
improve the stability of polymer-bitumen compositions (Kalantar, et al., 2012, p. 59).
All the Marshall stability values at 5% crumb rubber are lower than that of the initial
mixtures i.e. 0% crumb rubber. The maximum stability value of 8.86 kN is obtained
at 2% crumb rubber and 4% LDPE. Ahmadinia et al. (2011, p. 4847) records an
increase in stability value until a maximum at 6% PET content, after which it
decreased. Isacsson and Lu (1999) and Lu and Isacsson (2001) observed phase
inversion in polymer concentration higher than 6%. Hinisliglu and Agar (2004) found
that the optimum result for Marshall stability, Marshall quotient and flow happened in
the binder with 4% HDPE. Higher stability values translates to higher HMA pavement
performance.
Figure 4.16: Influence of crumb rubber content on Marshall stability with variation
in LDPE
R² = 0.9087R² = 0.8969
R² = 0.9409
R² = 0.844
R² = 0.7112
R² = 0.8167
5
6
7
8
9
0 1 2 3 4 5
Mar
shal
l Sta
bili
ty (
kN)
Rubber content (wt%)
0% LDPE 2% LDPE 4% LDPE
6% LDPE 8% LDPE 10% LDPE
6%
4%
0%
10%
8%
2%
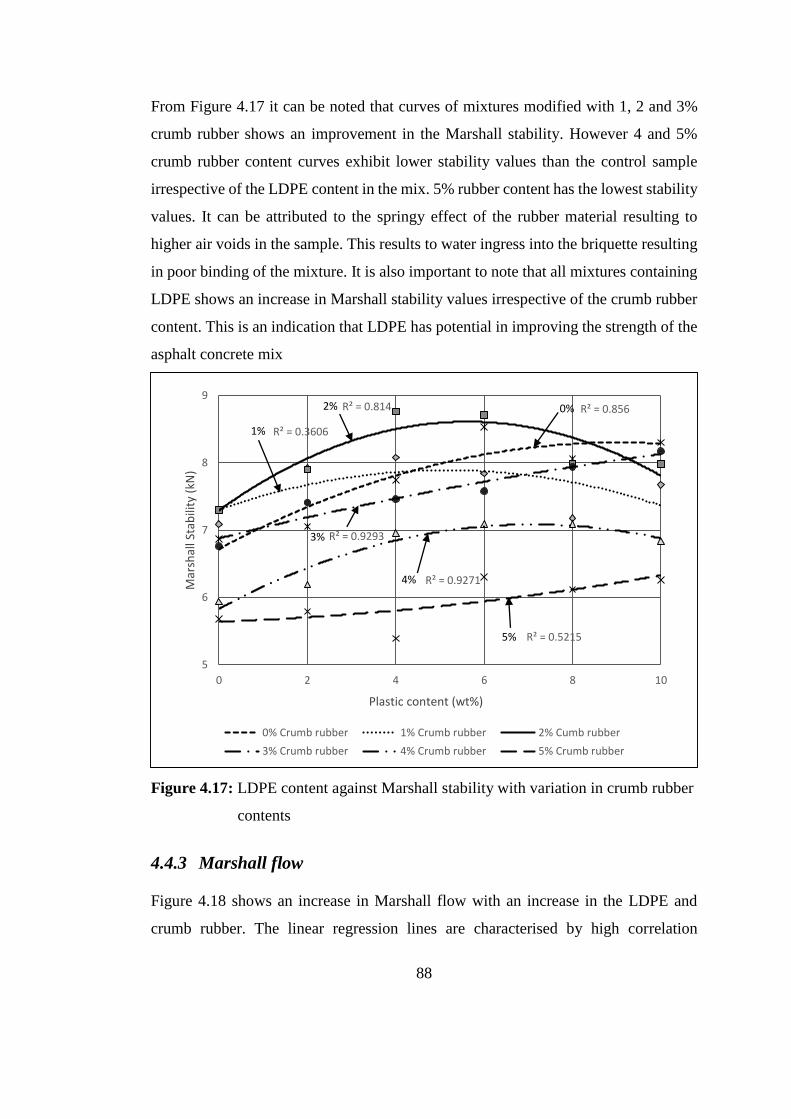
88
From Figure 4.17 it can be noted that curves of mixtures modified with 1, 2 and 3%
crumb rubber shows an improvement in the Marshall stability. However 4 and 5%
crumb rubber content curves exhibit lower stability values than the control sample
irrespective of the LDPE content in the mix. 5% rubber content has the lowest stability
values. It can be attributed to the springy effect of the rubber material resulting to
higher air voids in the sample. This results to water ingress into the briquette resulting
in poor binding of the mixture. It is also important to note that all mixtures containing
LDPE shows an increase in Marshall stability values irrespective of the crumb rubber
content. This is an indication that LDPE has potential in improving the strength of the
asphalt concrete mix
Figure 4.17: LDPE content against Marshall stability with variation in crumb rubber
contents
4.4.3 Marshall flow
Figure 4.18 shows an increase in Marshall flow with an increase in the LDPE and
crumb rubber. The linear regression lines are characterised by high correlation
R² = 0.856
R² = 0.3606
R² = 0.814
R² = 0.9293
R² = 0.9271
R² = 0.5215
5
6
7
8
9
0 2 4 6 8 10
Mar
shal
l Sta
bili
ty (
kN)
Plastic content (wt%)
0% Crumb rubber 1% Crumb rubber 2% Cumb rubber
3% Crumb rubber 4% Crumb rubber 5% Crumb rubber
1%
2% 0%
5%
4%
3%
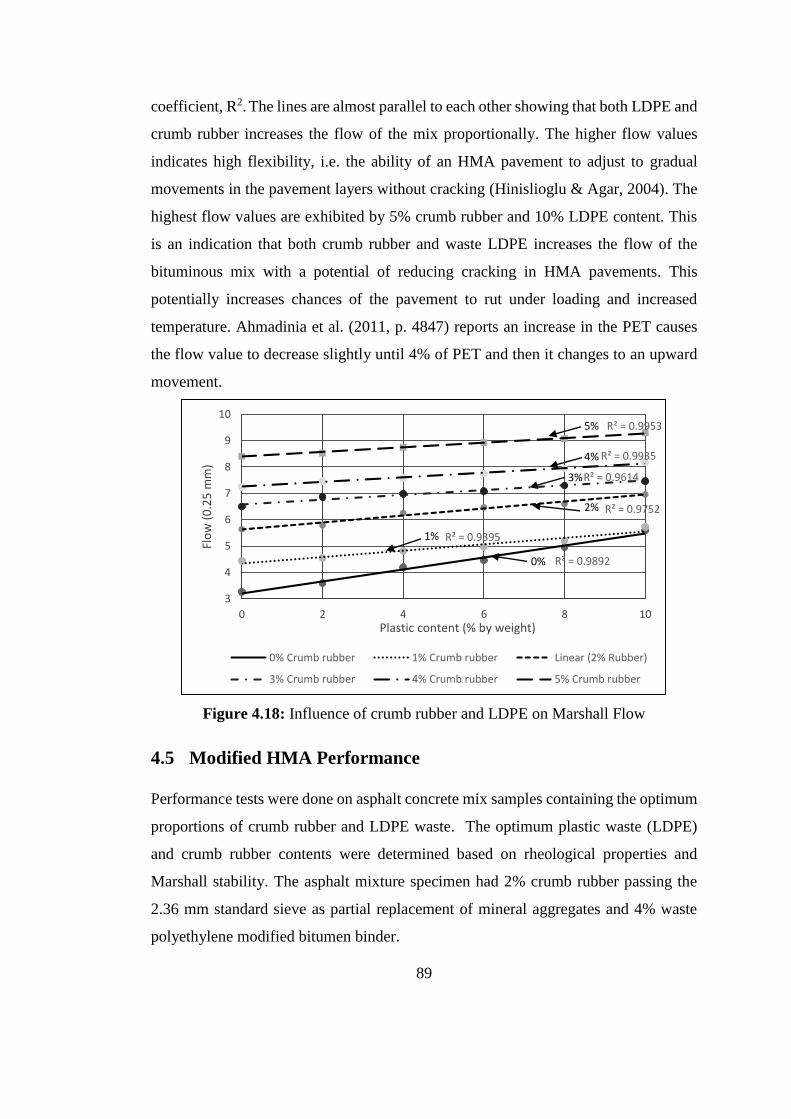
89
coefficient, R2. The lines are almost parallel to each other showing that both LDPE and
crumb rubber increases the flow of the mix proportionally. The higher flow values
indicates high flexibility, i.e. the ability of an HMA pavement to adjust to gradual
movements in the pavement layers without cracking (Hinislioglu & Agar, 2004). The
highest flow values are exhibited by 5% crumb rubber and 10% LDPE content. This
is an indication that both crumb rubber and waste LDPE increases the flow of the
bituminous mix with a potential of reducing cracking in HMA pavements. This
potentially increases chances of the pavement to rut under loading and increased
temperature. Ahmadinia et al. (2011, p. 4847) reports an increase in the PET causes
the flow value to decrease slightly until 4% of PET and then it changes to an upward
movement.
Figure 4.18: Influence of crumb rubber and LDPE on Marshall Flow
4.5 Modified HMA Performance
Performance tests were done on asphalt concrete mix samples containing the optimum
proportions of crumb rubber and LDPE waste. The optimum plastic waste (LDPE)
and crumb rubber contents were determined based on rheological properties and
Marshall stability. The asphalt mixture specimen had 2% crumb rubber passing the
2.36 mm standard sieve as partial replacement of mineral aggregates and 4% waste
polyethylene modified bitumen binder.
R² = 0.9892
R² = 0.9395
R² = 0.9752
R² = 0.9614
R² = 0.9935
R² = 0.9953
3
4
5
6
7
8
9
10
0 2 4 6 8 10
Flo
w (
0.2
5 m
m)
Plastic content (% by weight)
0% Crumb rubber 1% Crumb rubber Linear (2% Rubber)
3% Crumb rubber 4% Crumb rubber 5% Crumb rubber
5%
4%
3%
2%
1%
0%
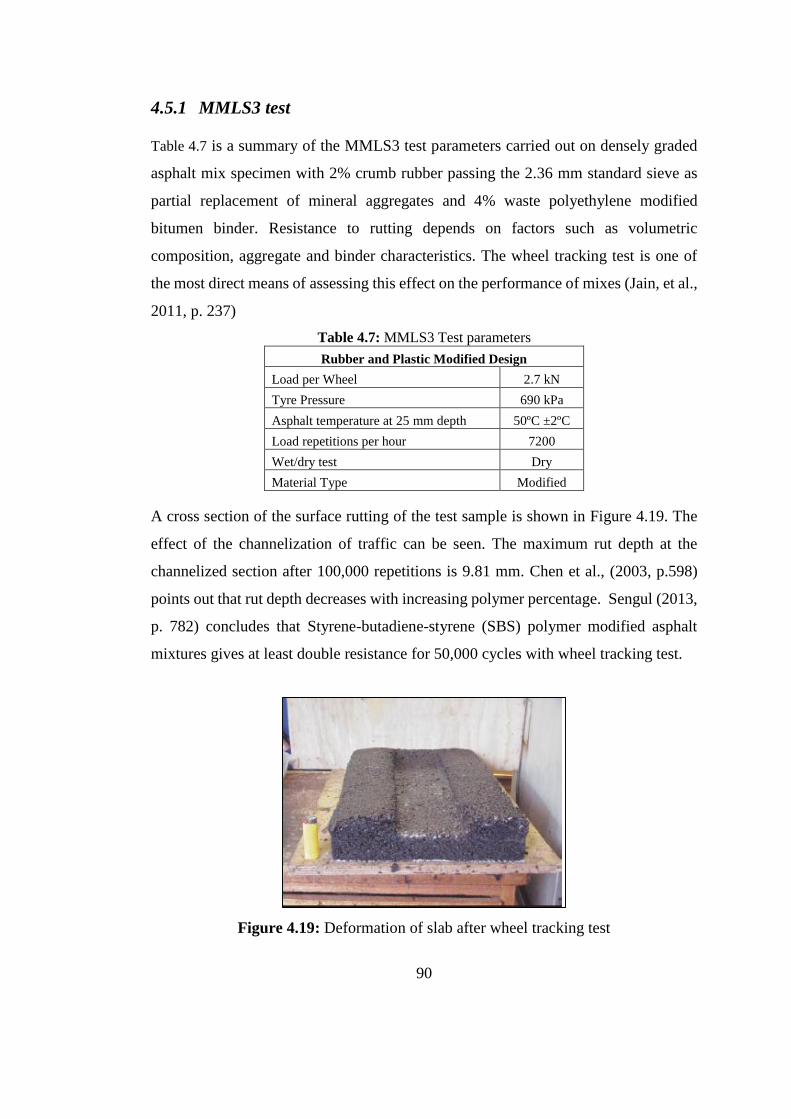
90
4.5.1 MMLS3 test
Table 4.7 is a summary of the MMLS3 test parameters carried out on densely graded
asphalt mix specimen with 2% crumb rubber passing the 2.36 mm standard sieve as
partial replacement of mineral aggregates and 4% waste polyethylene modified
bitumen binder. Resistance to rutting depends on factors such as volumetric
composition, aggregate and binder characteristics. The wheel tracking test is one of
the most direct means of assessing this effect on the performance of mixes (Jain, et al.,
2011, p. 237)
Table 4.7: MMLS3 Test parameters
Rubber and Plastic Modified Design
Load per Wheel 2.7 kN
Tyre Pressure 690 kPa
Asphalt temperature at 25 mm depth 50ºC ±2ºC
Load repetitions per hour 7200
Wet/dry test Dry
Material Type Modified
A cross section of the surface rutting of the test sample is shown in Figure 4.19. The
effect of the channelization of traffic can be seen. The maximum rut depth at the
channelized section after 100,000 repetitions is 9.81 mm. Chen et al., (2003, p.598)
points out that rut depth decreases with increasing polymer percentage. Sengul (2013,
p. 782) concludes that Styrene-butadiene-styrene (SBS) polymer modified asphalt
mixtures gives at least double resistance for 50,000 cycles with wheel tracking test.
Figure 4.19: Deformation of slab after wheel tracking test
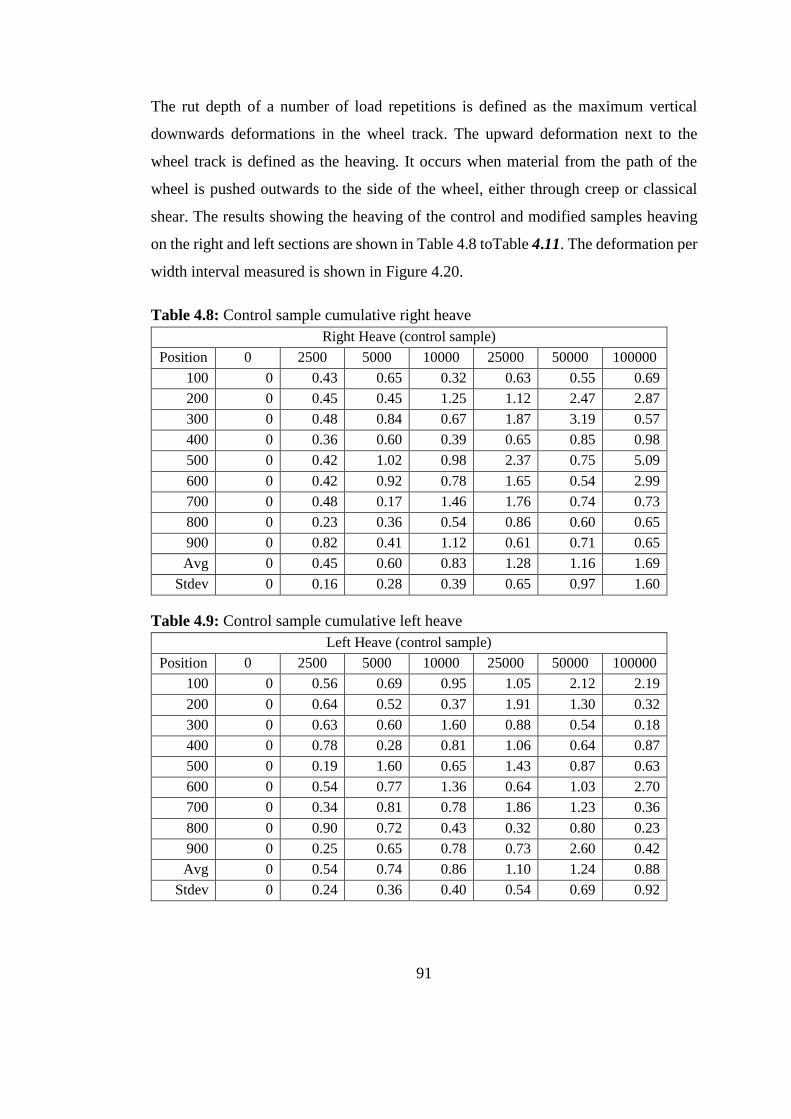
91
The rut depth of a number of load repetitions is defined as the maximum vertical
downwards deformations in the wheel track. The upward deformation next to the
wheel track is defined as the heaving. It occurs when material from the path of the
wheel is pushed outwards to the side of the wheel, either through creep or classical
shear. The results showing the heaving of the control and modified samples heaving
on the right and left sections are shown in Table 4.8 toTable 4.11. The deformation per
width interval measured is shown in Figure 4.20.
Table 4.8: Control sample cumulative right heave
Right Heave (control sample)
Position 0 2500 5000 10000 25000 50000 100000
100 0 0.43 0.65 0.32 0.63 0.55 0.69
200 0 0.45 0.45 1.25 1.12 2.47 2.87
300 0 0.48 0.84 0.67 1.87 3.19 0.57
400 0 0.36 0.60 0.39 0.65 0.85 0.98
500 0 0.42 1.02 0.98 2.37 0.75 5.09
600 0 0.42 0.92 0.78 1.65 0.54 2.99
700 0 0.48 0.17 1.46 1.76 0.74 0.73
800 0 0.23 0.36 0.54 0.86 0.60 0.65
900 0 0.82 0.41 1.12 0.61 0.71 0.65
Avg 0 0.45 0.60 0.83 1.28 1.16 1.69
Stdev 0 0.16 0.28 0.39 0.65 0.97 1.60
Table 4.9: Control sample cumulative left heave
Left Heave (control sample)
Position 0 2500 5000 10000 25000 50000 100000
100 0 0.56 0.69 0.95 1.05 2.12 2.19
200 0 0.64 0.52 0.37 1.91 1.30 0.32
300 0 0.63 0.60 1.60 0.88 0.54 0.18
400 0 0.78 0.28 0.81 1.06 0.64 0.87
500 0 0.19 1.60 0.65 1.43 0.87 0.63
600 0 0.54 0.77 1.36 0.64 1.03 2.70
700 0 0.34 0.81 0.78 1.86 1.23 0.36
800 0 0.90 0.72 0.43 0.32 0.80 0.23
900 0 0.25 0.65 0.78 0.73 2.60 0.42
Avg 0 0.54 0.74 0.86 1.10 1.24 0.88
Stdev 0 0.24 0.36 0.40 0.54 0.69 0.92
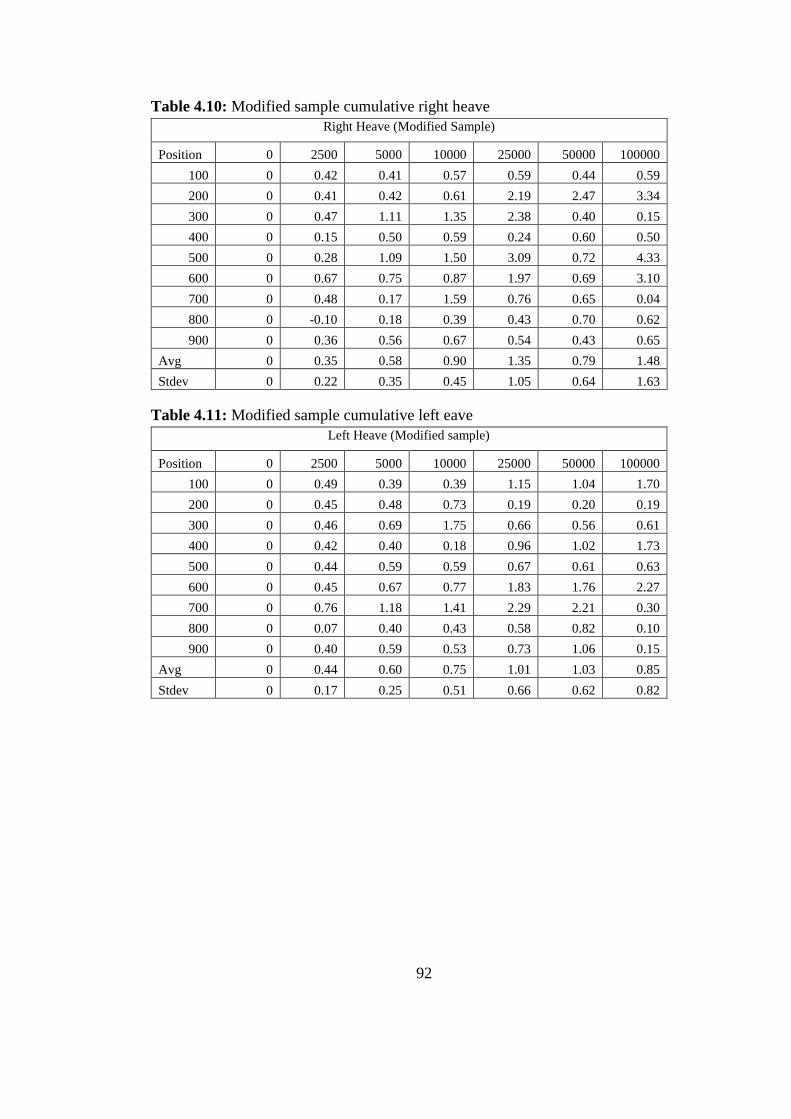
92
Table 4.10: Modified sample cumulative right heave
Right Heave (Modified Sample)
Position 0 2500 5000 10000 25000 50000 100000
100 0 0.42 0.41 0.57 0.59 0.44 0.59
200 0 0.41 0.42 0.61 2.19 2.47 3.34
300 0 0.47 1.11 1.35 2.38 0.40 0.15
400 0 0.15 0.50 0.59 0.24 0.60 0.50
500 0 0.28 1.09 1.50 3.09 0.72 4.33
600 0 0.67 0.75 0.87 1.97 0.69 3.10
700 0 0.48 0.17 1.59 0.76 0.65 0.04
800 0 -0.10 0.18 0.39 0.43 0.70 0.62
900 0 0.36 0.56 0.67 0.54 0.43 0.65
Avg 0 0.35 0.58 0.90 1.35 0.79 1.48
Stdev 0 0.22 0.35 0.45 1.05 0.64 1.63
Table 4.11: Modified sample cumulative left eave
Left Heave (Modified sample)
Position 0 2500 5000 10000 25000 50000 100000
100 0 0.49 0.39 0.39 1.15 1.04 1.70
200 0 0.45 0.48 0.73 0.19 0.20 0.19
300 0 0.46 0.69 1.75 0.66 0.56 0.61
400 0 0.42 0.40 0.18 0.96 1.02 1.73
500 0 0.44 0.59 0.59 0.67 0.61 0.63
600 0 0.45 0.67 0.77 1.83 1.76 2.27
700 0 0.76 1.18 1.41 2.29 2.21 0.30
800 0 0.07 0.40 0.43 0.58 0.82 0.10
900 0 0.40 0.59 0.53 0.73 1.06 0.15
Avg 0 0.44 0.60 0.75 1.01 1.03 0.85
Stdev 0 0.17 0.25 0.51 0.66 0.62 0.82
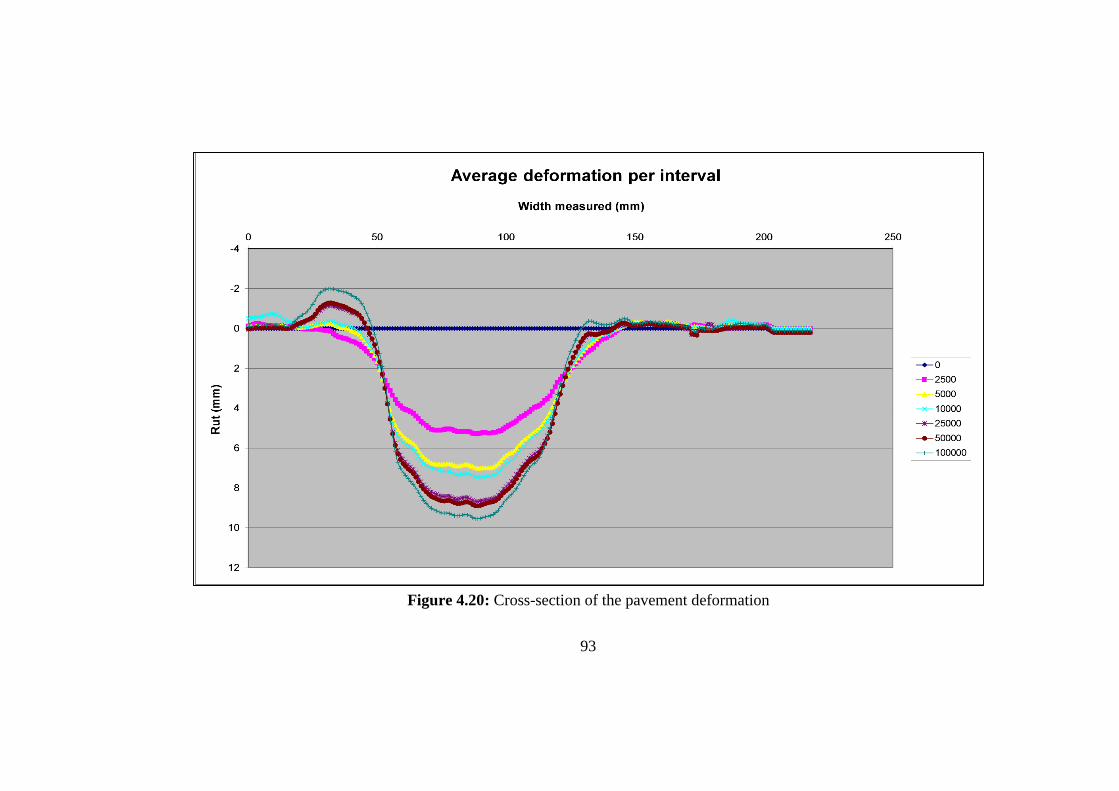
93
Figure 4.20: Cross-section of the pavement deformation
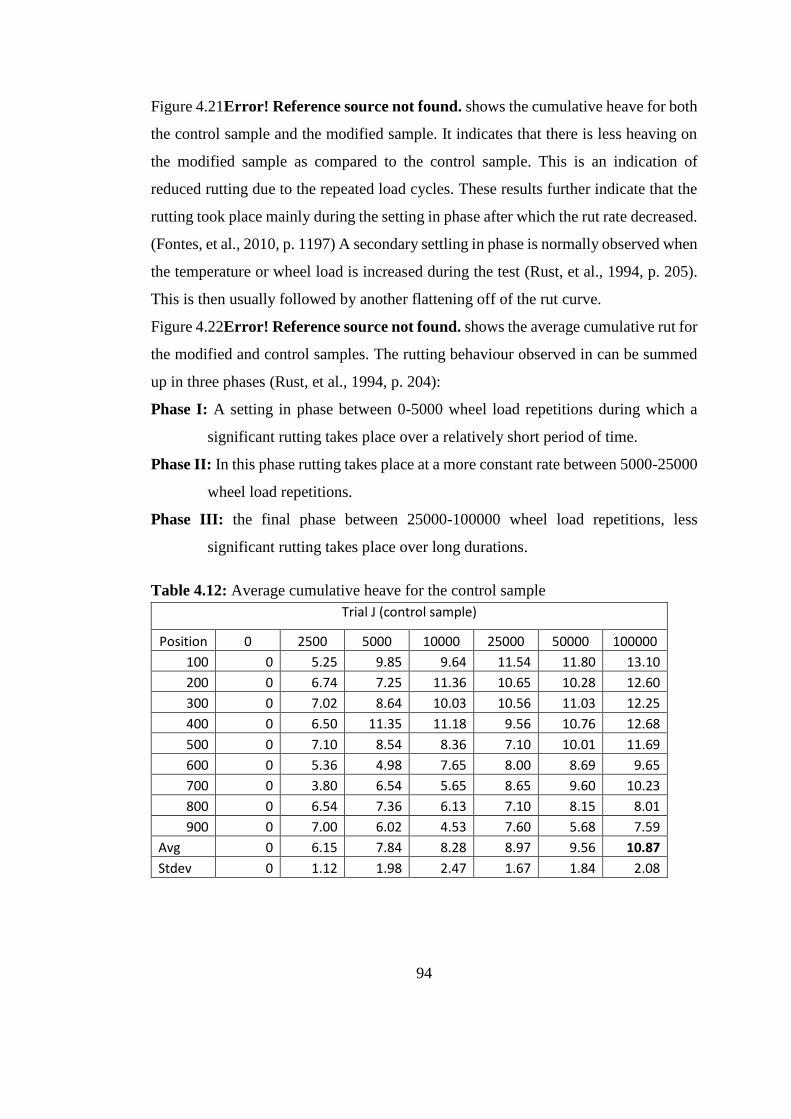
94
Figure 4.21Error! Reference source not found. shows the cumulative heave for both
the control sample and the modified sample. It indicates that there is less heaving on
the modified sample as compared to the control sample. This is an indication of
reduced rutting due to the repeated load cycles. These results further indicate that the
rutting took place mainly during the setting in phase after which the rut rate decreased.
(Fontes, et al., 2010, p. 1197) A secondary settling in phase is normally observed when
the temperature or wheel load is increased during the test (Rust, et al., 1994, p. 205).
This is then usually followed by another flattening off of the rut curve.
Figure 4.22Error! Reference source not found. shows the average cumulative rut for
the modified and control samples. The rutting behaviour observed in can be summed
up in three phases (Rust, et al., 1994, p. 204):
Phase I: A setting in phase between 0-5000 wheel load repetitions during which a
significant rutting takes place over a relatively short period of time.
Phase II: In this phase rutting takes place at a more constant rate between 5000-25000
wheel load repetitions.
Phase III: the final phase between 25000-100000 wheel load repetitions, less
significant rutting takes place over long durations.
Table 4.12: Average cumulative heave for the control sample
Trial J (control sample)
Position 0 2500 5000 10000 25000 50000 100000
100 0 5.25 9.85 9.64 11.54 11.80 13.10
200 0 6.74 7.25 11.36 10.65 10.28 12.60
300 0 7.02 8.64 10.03 10.56 11.03 12.25
400 0 6.50 11.35 11.18 9.56 10.76 12.68
500 0 7.10 8.54 8.36 7.10 10.01 11.69
600 0 5.36 4.98 7.65 8.00 8.69 9.65
700 0 3.80 6.54 5.65 8.65 9.60 10.23
800 0 6.54 7.36 6.13 7.10 8.15 8.01
900 0 7.00 6.02 4.53 7.60 5.68 7.59
Avg 0 6.15 7.84 8.28 8.97 9.56 10.87
Stdev 0 1.12 1.98 2.47 1.67 1.84 2.08
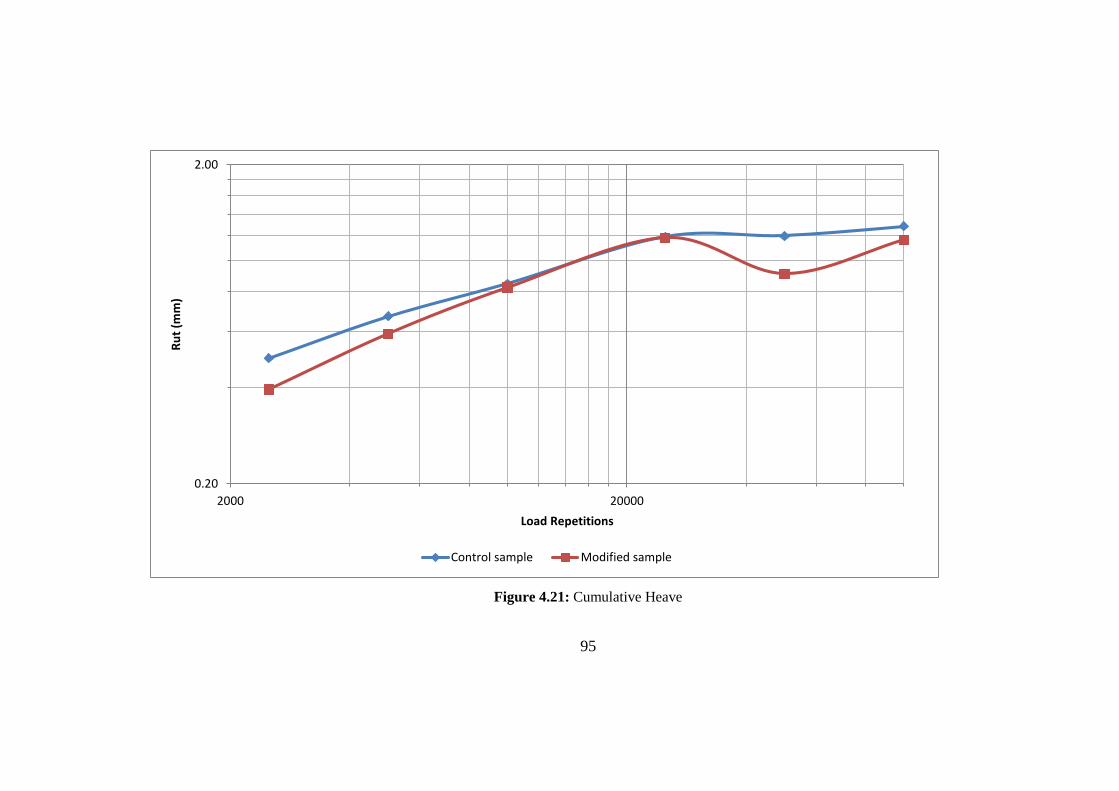
95
Figure 4.21: Cumulative Heave
0.20
2.00
2000 20000
Ru
t (m
m)
Load Repetitions
Control sample Modified sample
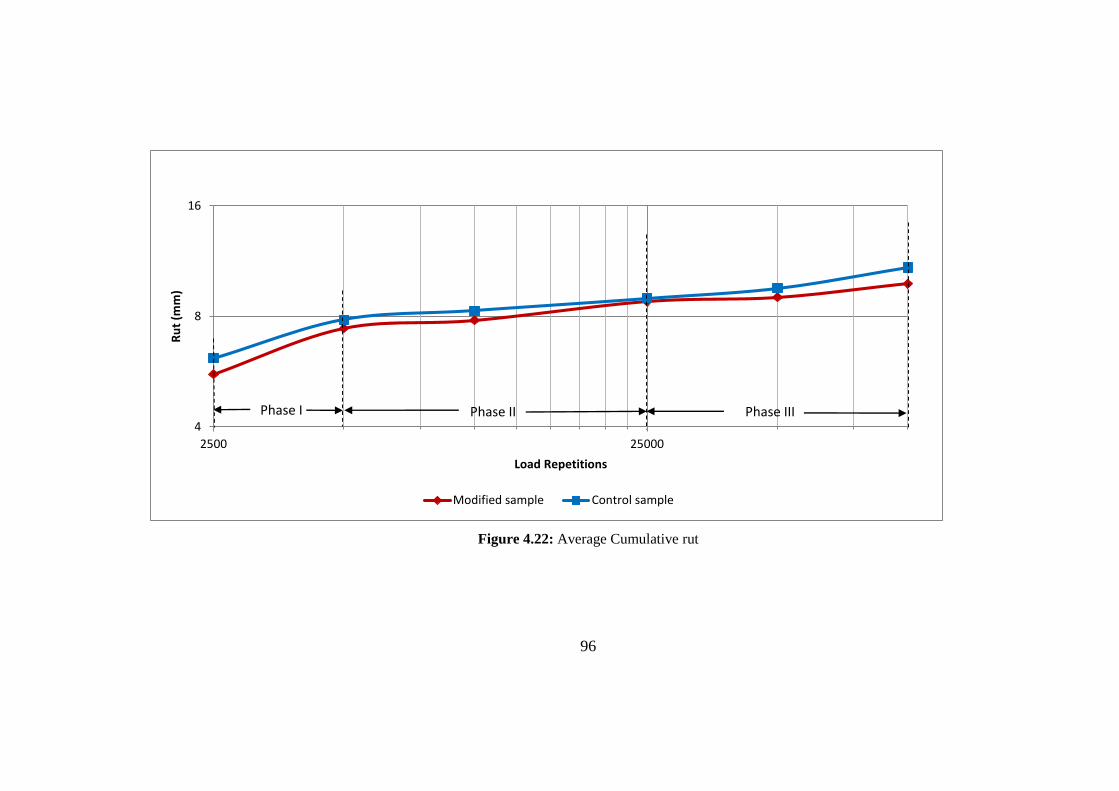
96
Figure 4.22: Average Cumulative rut
4
8
16
2500 25000
Ru
t (m
m)
Load Repetitions
Modified sample Control sample
Phase I Phase II Phase III
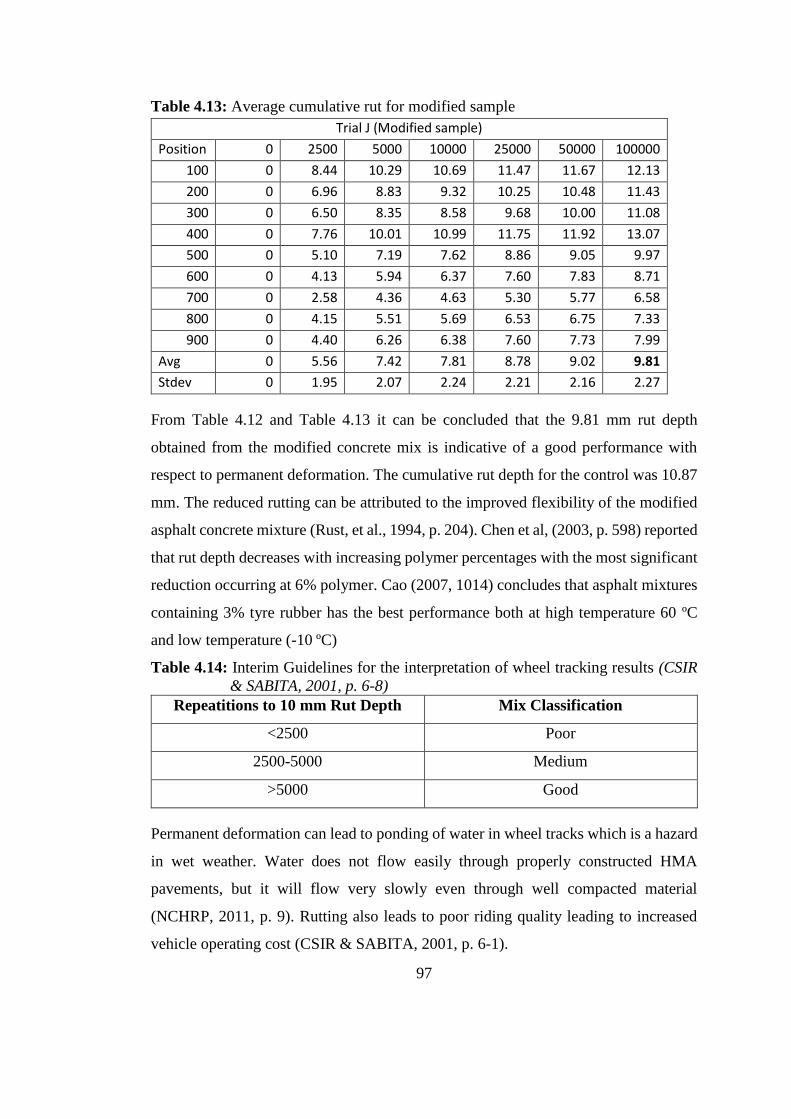
97
Table 4.13: Average cumulative rut for modified sample
Trial J (Modified sample)
Position 0 2500 5000 10000 25000 50000 100000
100 0 8.44 10.29 10.69 11.47 11.67 12.13
200 0 6.96 8.83 9.32 10.25 10.48 11.43
300 0 6.50 8.35 8.58 9.68 10.00 11.08
400 0 7.76 10.01 10.99 11.75 11.92 13.07
500 0 5.10 7.19 7.62 8.86 9.05 9.97
600 0 4.13 5.94 6.37 7.60 7.83 8.71
700 0 2.58 4.36 4.63 5.30 5.77 6.58
800 0 4.15 5.51 5.69 6.53 6.75 7.33
900 0 4.40 6.26 6.38 7.60 7.73 7.99
Avg 0 5.56 7.42 7.81 8.78 9.02 9.81
Stdev 0 1.95 2.07 2.24 2.21 2.16 2.27
From Table 4.12 and Table 4.13 it can be concluded that the 9.81 mm rut depth
obtained from the modified concrete mix is indicative of a good performance with
respect to permanent deformation. The cumulative rut depth for the control was 10.87
mm. The reduced rutting can be attributed to the improved flexibility of the modified
asphalt concrete mixture (Rust, et al., 1994, p. 204). Chen et al, (2003, p. 598) reported
that rut depth decreases with increasing polymer percentages with the most significant
reduction occurring at 6% polymer. Cao (2007, 1014) concludes that asphalt mixtures
containing 3% tyre rubber has the best performance both at high temperature 60 ºC
and low temperature (-10 ºC)
Table 4.14: Interim Guidelines for the interpretation of wheel tracking results (CSIR
& SABITA, 2001, p. 6-8)
Repeatitions to 10 mm Rut Depth Mix Classification
<2500 Poor
2500-5000 Medium
>5000 Good
Permanent deformation can lead to ponding of water in wheel tracks which is a hazard
in wet weather. Water does not flow easily through properly constructed HMA
pavements, but it will flow very slowly even through well compacted material
(NCHRP, 2011, p. 9). Rutting also leads to poor riding quality leading to increased
vehicle operating cost (CSIR & SABITA, 2001, p. 6-1).
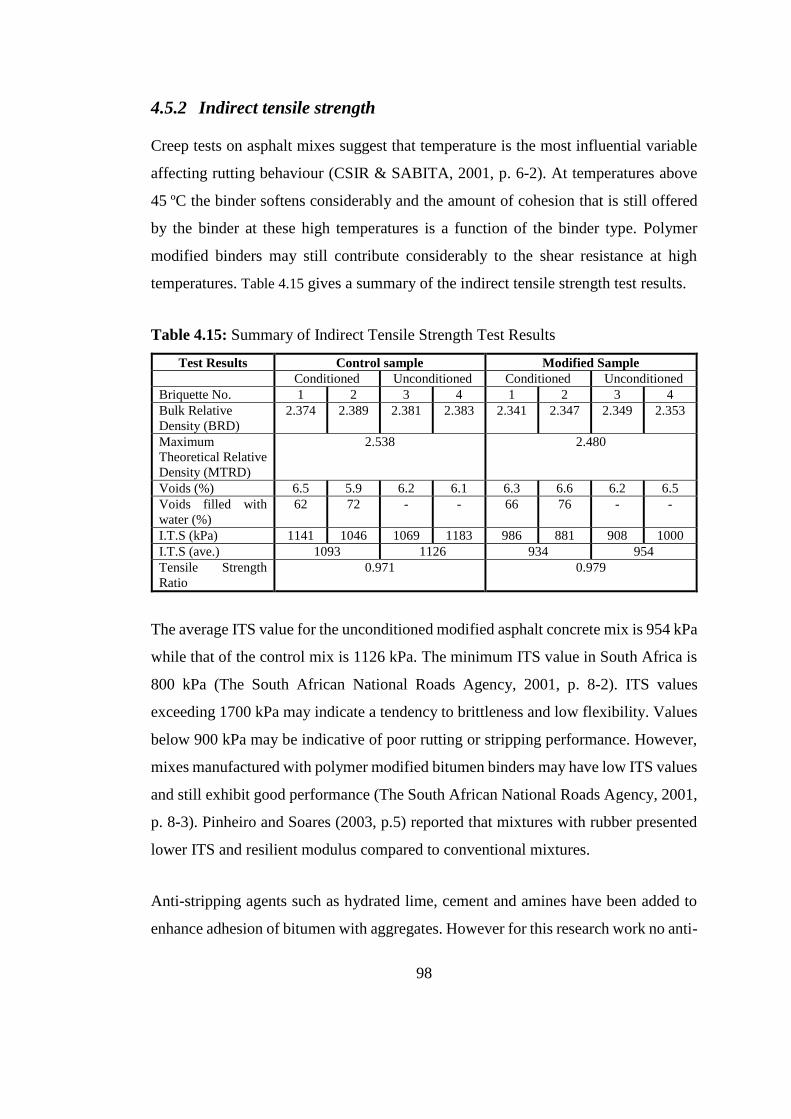
98
4.5.2 Indirect tensile strength
Creep tests on asphalt mixes suggest that temperature is the most influential variable
affecting rutting behaviour (CSIR & SABITA, 2001, p. 6-2). At temperatures above
45 ºC the binder softens considerably and the amount of cohesion that is still offered
by the binder at these high temperatures is a function of the binder type. Polymer
modified binders may still contribute considerably to the shear resistance at high
temperatures. Table 4.15 gives a summary of the indirect tensile strength test results.
Table 4.15: Summary of Indirect Tensile Strength Test Results
Test Results Control sample Modified Sample
Conditioned Unconditioned Conditioned Unconditioned
Briquette No. 1 2 3 4 1 2 3 4
Bulk Relative
Density (BRD)
2.374 2.389 2.381 2.383 2.341 2.347 2.349 2.353
Maximum
Theoretical Relative
Density (MTRD)
2.538 2.480
Voids (%) 6.5 5.9 6.2 6.1 6.3 6.6 6.2 6.5
Voids filled with
water (%)
62 72 - - 66 76 - -
I.T.S (kPa) 1141 1046 1069 1183 986 881 908 1000
I.T.S (ave.) 1093 1126 934 954
Tensile Strength
Ratio
0.971 0.979
The average ITS value for the unconditioned modified asphalt concrete mix is 954 kPa
while that of the control mix is 1126 kPa. The minimum ITS value in South Africa is
800 kPa (The South African National Roads Agency, 2001, p. 8-2). ITS values
exceeding 1700 kPa may indicate a tendency to brittleness and low flexibility. Values
below 900 kPa may be indicative of poor rutting or stripping performance. However,
mixes manufactured with polymer modified bitumen binders may have low ITS values
and still exhibit good performance (The South African National Roads Agency, 2001,
p. 8-3). Pinheiro and Soares (2003, p.5) reported that mixtures with rubber presented
lower ITS and resilient modulus compared to conventional mixtures.
Anti-stripping agents such as hydrated lime, cement and amines have been added to
enhance adhesion of bitumen with aggregates. However for this research work no anti-
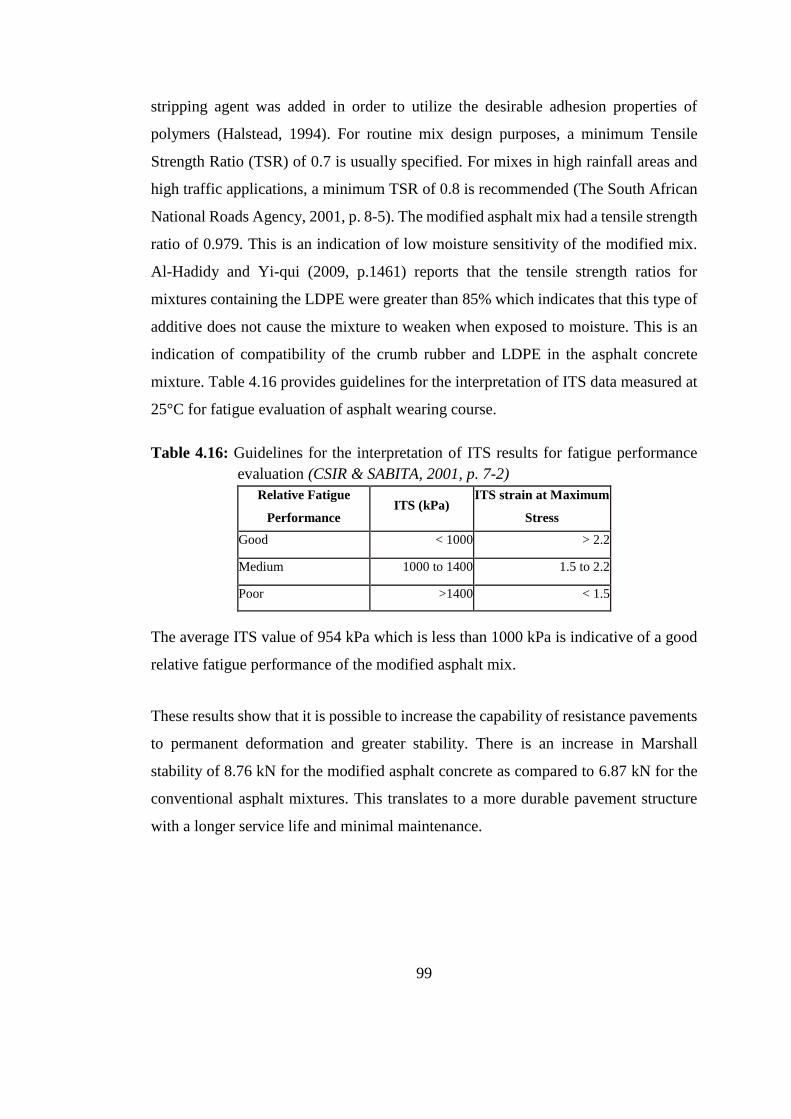
99
stripping agent was added in order to utilize the desirable adhesion properties of
polymers (Halstead, 1994). For routine mix design purposes, a minimum Tensile
Strength Ratio (TSR) of 0.7 is usually specified. For mixes in high rainfall areas and
high traffic applications, a minimum TSR of 0.8 is recommended (The South African
National Roads Agency, 2001, p. 8-5). The modified asphalt mix had a tensile strength
ratio of 0.979. This is an indication of low moisture sensitivity of the modified mix.
Al-Hadidy and Yi-qui (2009, p.1461) reports that the tensile strength ratios for
mixtures containing the LDPE were greater than 85% which indicates that this type of
additive does not cause the mixture to weaken when exposed to moisture. This is an
indication of compatibility of the crumb rubber and LDPE in the asphalt concrete
mixture. Table 4.16 provides guidelines for the interpretation of ITS data measured at
25°C for fatigue evaluation of asphalt wearing course.
Table 4.16: Guidelines for the interpretation of ITS results for fatigue performance
evaluation (CSIR & SABITA, 2001, p. 7-2)
Relative Fatigue
Performance ITS (kPa)
ITS strain at Maximum
Stress
(%) Good < 1000 > 2.2
Medium 1000 to 1400 1.5 to 2.2
Poor >1400 < 1.5
The average ITS value of 954 kPa which is less than 1000 kPa is indicative of a good
relative fatigue performance of the modified asphalt mix.
These results show that it is possible to increase the capability of resistance pavements
to permanent deformation and greater stability. There is an increase in Marshall
stability of 8.76 kN for the modified asphalt concrete as compared to 6.87 kN for the
conventional asphalt mixtures. This translates to a more durable pavement structure
with a longer service life and minimal maintenance.
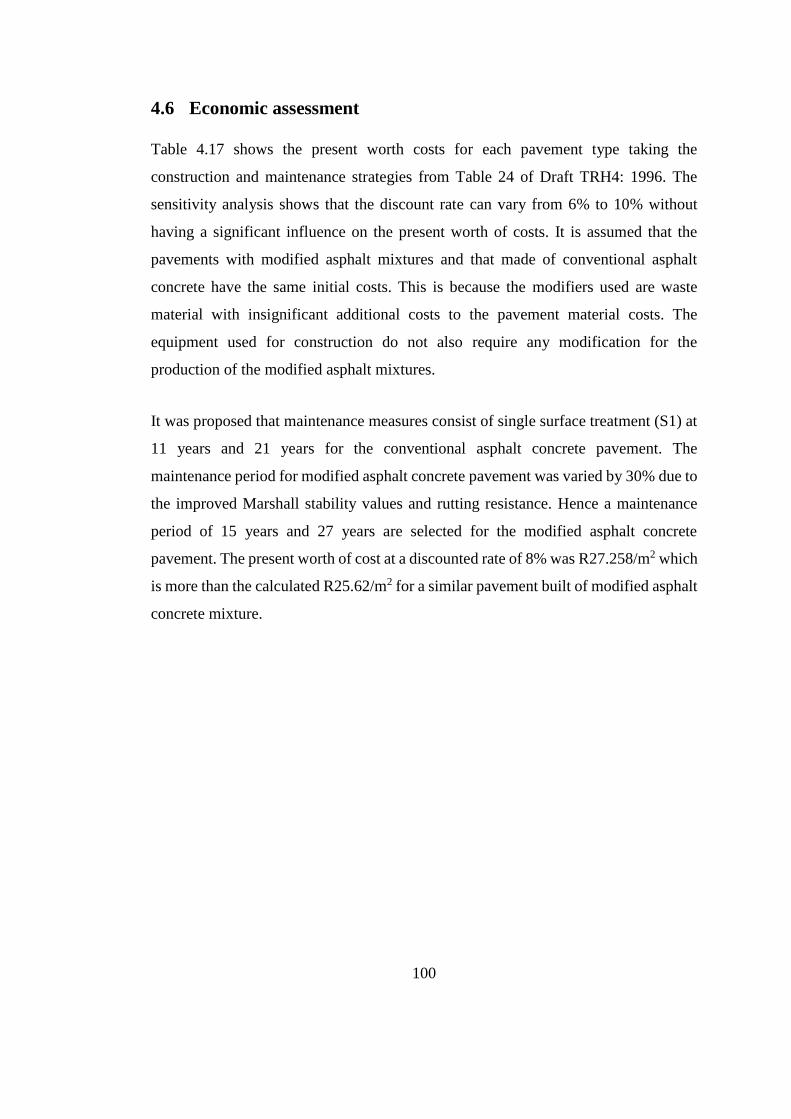
100
4.6 Economic assessment
Table 4.17 shows the present worth costs for each pavement type taking the
construction and maintenance strategies from Table 24 of Draft TRH4: 1996. The
sensitivity analysis shows that the discount rate can vary from 6% to 10% without
having a significant influence on the present worth of costs. It is assumed that the
pavements with modified asphalt mixtures and that made of conventional asphalt
concrete have the same initial costs. This is because the modifiers used are waste
material with insignificant additional costs to the pavement material costs. The
equipment used for construction do not also require any modification for the
production of the modified asphalt mixtures.
It was proposed that maintenance measures consist of single surface treatment (S1) at
11 years and 21 years for the conventional asphalt concrete pavement. The
maintenance period for modified asphalt concrete pavement was varied by 30% due to
the improved Marshall stability values and rutting resistance. Hence a maintenance
period of 15 years and 27 years are selected for the modified asphalt concrete
pavement. The present worth of cost at a discounted rate of 8% was R27.258/m2 which
is more than the calculated R25.62/m2 for a similar pavement built of modified asphalt
concrete mixture.
101
Table 4.17: Present worth of costs
Pavement
structure Initial
costs/m² Maintenance
Discounted maintenance costs/m²
Present worth of costs/m²
Discounted rate Discounted rate
6% 8% 10% 6% 8% 10%
AC
10.5 S1 (12 yrs) 5.219 4.169 3.350
10.5 S1 (21 yrs) 3.087 2.090 1.418
21 8.306 6.258 4.767 29.306 27.258 25.767
AC (Modified)
10.5 S1 (15 yrs) 4.379 3.308 2.510
10.5 S1 (27 yrs) 2.174 1.313 0.798
21 6.552 4.620 3.308 27.552 25.620 24.308
102
5 CONCLUSION AND RECOMMENDATIONS
5.1 Conclusions
The main objective of this research work was to determine the feasibility of the use of
rubber tyre waste and plastic wastes in asphalt concrete pavements with the aim of
improving the engineering properties of the asphalt concrete mix and safe disposal of
these non-biodegradable wastes. The research showed that it is indeed feasible to use
various proportions of these wastes to achieve greater performance of the pavement.
The optimum values of 4% of the waste plastic and 2% of the crumb rubber used in
the asphalt concrete mixture gave a significant improvement in the performance of the
mixture.
The plastic waste blended with 60/70 penetration grade bitumen showed an
improvement in the PMB’s rheological properties. Addition of 4% LDPE reduced
susceptibility of the asphalt binder to temperature by increasing its softening point
from 43.8 °C to 50.2 °C and reducing its penetration value from 68 mm to 64 mm.
This reduced temperature susceptibility is beneficial for use in high temperature areas.
The addition of LDPE caused the bitumen to be stiffer making it susceptible to low
temperature cracking and fatigue failure.
Addition of 4% LDPE and 2% crumb rubber reduced the susceptibility of the asphalt
concrete mix to moisture and permanent deformation. There was a reduced rut depth
from 10.87 mm for the control sample to 9.81 mm for the modified asphalt mixture
which led to an improved service life of the pavement. The better Tensile Strength
Ratio of 0.979 for the modified sample up from 0.971 for the control sample attests to
the improved binding property of plastics in its molten state (wet process) which
helped improve cohesion of the modified asphalt mix. This is an indication of good
compatibility of the wastes in the asphalt concrete mix. This in effect reduced the
susceptibility of the mixture to moisture therefore increasing the service life of the
asphalt concrete pavement.
103
The extended service life in effect increased the time interval needed for road
maintenance from 11 years and 21 years for the conventional asphalt to 15 years and
21 years for modified asphalt concrete. This reduced the present worth of cost value
for the modified asphalt pavement therefore making it cost effective as an alternative
design strategy.
5.2 Recommendations
Characterisation tests have been shown to be a good measurement of polymer
contribution to binder performance. The conventional measurement techniques are
inconsistent in ranking multiple-polymer modified HMA performance and may only
measure whether or not a modifier is present in an asphalt specimen but not its
contribution to the asphalts performance. Therefore this research work recommends
the following:
a) There is need to for further research on performance tests and modelling of the
outcome to ensure consistent response (output) for the input variables using the
optimization process.
b) A study needs to be done to establish the interactions between the bitumen
binder, LDPE and crumb rubber that influence the physical and rheological
properties of the asphalt concrete mix during processing, storage and
application of the modified asphalt concrete.
c) Polymer modified binders have proven successful in the laboratory. Efforts
should be made to develop a correlation between results from laboratory tests
and field performance by large scale modelling and testing.
d) This research findings need to be followed by technology implementation and
monitoring to ensure the desired life cycle performance improvements are
achieved.
104
References
Adhikari, B., de, D. & Maiti , S., 2000. Reclamation and recycling of waste rubber.
Progress in Polymer Science, 25(7), p. 909-948.
Ahmadinia, E. et al., 2011. Using waste plastic bottles as additive for stone mastic
asphalt. Materials and Design, 32(10), p. 4844-4849.
Airey, G. D., Collop , A. C. & Singleton , T. M., 2001. Rheological and cohesive
properties of bitumen cured in crumb rubber. UK, University of Dundee.
Airey, G., Rahman, M. & Collop, A. C., 2004. Crumb Rubber and Bitumen Interaction
as a Function of Crude Source and Bitumen Viscosity. Road Materials and Pavement
Design, 5(4), p. 453-475.
Aisien, F. A., Hymore , F. K. & Ebewele, R. O., 2006. Application of ground scrap
tyre rubbers in asphalt concrete pavements. Indian Journal of Engineering and
Materials Sciences, p. 333-338.
Al-Hadidy, A. I., Yi-Qiu & Tan, 2009. Effect of polyethylene on life of flexible
pavements. Construction and Building Materials, 23(3), p. 1456-1464.
Alonso, S., Medina-Torres, L., Zitzumbo, R. & Avolos, F., 2010. Rheology of asphalt
and styrene–butadiene blends. Journal of Materials Science, 45(10), p. 2591-2597.
Anochie-Boeteng, J., Denneman, E. & Verhaege, B., 2011. Bitumen rubber asphalt
mix testing for south african pavement design method. Pretoria, South Africa,
Proceedings of the 30th Southern African Transport Conference.(11-14 July 2011)
ASTM International, Standards and test methods for road building materials.
Bahia, H. U. & Perdomo, D., 1996. Current practices for modification of paving
asphalts. The Asphalt Institute, 41(4), p. 1192-1198.
105
Cao, W., 2007. Study on properties of recycled tire rubber modified asphalt mixtures
using dry process. Construction and Building Materials, 21(5), p. 1011–1015.
Chen, J. -S., Liao, M. -C. & Lin, C. -H., 2003. Determination of polymer content in
modified bitumen. Materials and Structures, 36(9), p. 594-598.
Chui-Te , C. & Li-Cheng, . L., 2007. A laboratory study on stone matrix asphalt using
ground tire rubber. Construction and Building Materials, 21(5), p. 1027–1033.
CIB and UNEP-IETC, 2002. Agenda 21 for Sustainable Construction in Developing
Countries: A discussion document, Pretoria: CSIR Building and Construction
Technology.
COLTO, 1996. TRH4: Structural design of flexible pavements for interurban and rural
roads. Pretoria: Department of Transport.
COLTO, 1998. Standard Specifications for Road and Bridge Works for State Road
Authorities. 1 ed. Halfway House, South Africa: South African Institution of Civil
Engineers (SAICE).
Commitee of Land Transport Officials (COLTO), 1986. Standard methods of testing
road materials TMH1, Pretoria: TM1, Department of Transport.
Committee of State Roads Authorities (CSRA), 1987. DRAFT TRH8: DESIGN AND
USE OF HOT-MIX ASPHALT IN PAVEMENTS. Pretoria, South Africa: Department
of Transport.
CSIR & SABITA, 2001. Interim Guidelines for th design of Hot-mix Asphalt in South
Africa.http://www.asphaltacademy.co.za/pubart.php [Accessed 12 July 2012].
Department for International Development, 2002. Overseas Road Note 19: A guide to
the design of hot mix asphalt in tropical and sub-tropical countries, Berkshire, UK:
TRL Limited.
Department of Economic Development, 2010. The New Growth Path: The
Framework, Pretoria: Department of Economic Development.
106
Department of Environmental Affairs, 2005. National Waste Management Strategy
Implementation South Africa: Waste Stream Analysis and Prioritisation for Recycling,
Pretoria, South Africa: Department of Environmental Affairs.
Department of Environmental Affairs, 2010. National Waste Management, Pretoria:
Department of Environmental Affairs.
Department of Environmental Affairs, 2011. Governance of Climate Change in South
Africa, Pretoria: Department of Environmental Affairs, SA.
Department of Environmental Affairs, 2012. National Waste Information Baseline
Report, Pretoria, South Africa: Department of Environmental Affairs.
Department of Water Affairs and Forestry, 2005. Waste Management Series. Minimum
Requirements for the Handling, Classification and Disposal of Hazardous Waste,
Pretoria: Department of Water and Forestry.
Development Bank of Southern Africa, 2012. The State of South Africa’s Economic
Infrastructure: Opportunities and challenges 2012, Pretoria: Development Planning
Division: Development Bank of South Africa.
European Asphalt Pavement Association, 2012. European Asphalt Pavement
Association Statistics, Brussels, Belgium: European Asphalt Pavement Association.
FHWA, 2012. User Guidelines for Waste and By-product Materials in Pavement
Construction.
Flynn, L., 1993. Recycled plastic finds home in asphalt binder. Transportation
Research Board, 31(3), p. 41-47.
Fontes, L. P., Trichês, G., Pais, J. C. & Pereira, P. A., 2010. Evaluating permanent
deformation in asphalt rubber mixtures. Construction and Building Materials, 24(7),
p. 1193–1200.
García-Morales, M., Partal, P. & Gallegos, C., 2006. Effect of waste polymer addition
on the rheology of modified bitumen. Fuel, 85(7-8), p. 936-943.
107
Gawandea, A. et al., 2012. An overview on waste plastic utilization in asphalting of
roads. Journal of Engineering Research and Studies, III(II), p. 1-5.
Gawandea, A. et al., 2012. Utilization of waste plastic in asphalting of roads. Scientific
Reviews and Chemical Communications, 2(2), p. 147-157.
Halstead, J., 1994. Waste management and job creation, Madison: Cooperative
Extension Service.
Hassani, A., Ganjidoust, H. & Maghanaki, A. A., 2005. Use of plastic waste (poly-
ethylene terephthalate) in asphalt concrete mixture as aggregate replacement. 23(4), p.
322-7.
Heitzman , P. E. & Michael , A., 1992. State of the practice- Design and construction
of asphalt paving materials with crumb rubber modifier, Washington D.C: Federal
Highway Administration.
Hinislioglu, S. & Agar, E., 2004. Use of waste high density polyethylene as bitumen
modifier in asphalt concrete mix. Materials Letters, Volume 58, p. 267-271.
Hopewell, J., Dvorak, R. & Kosior, E., 2009. Plastics recycling: challenges and
opportunities. Philosophical Transactions of The Royal Society B, p. 2115-2126.
Hossain , M., Sadeq, M., Funk, L. & Maag, R., 1995. A study of chunk rubber from
recycled tyres as a road construction material. Kansas, Kansas State University, p.
188-197.
Huang, Y., Bird, R. N. & Heidrich, O., 2007. A review of the use of recycled solid
waste materials in asphalt pavements. Resources, Conservation and Recycling, 52(1),
p. 58-73.
Jahromi, S. G. & Khodalii, A., 2009. Effects of nanoclay on rheological properties of
bitumen binder. Construction and Building Materials, 23(8), p. 2894-2904.
108
Jain, P. K., Kumar, S. & Sengupta, J. B., 2011. Mitigation of rutting in bituminous
roads by use of waste polymeric packaging materials. Indian Journal of Engineering
and Materials Sciences (IJEMS), 18(3), p. 233-238.
Jooste, N. J., 2011. A consultant's perspective on the use of bitumen-rubber in
especially double seals. Pretoria, SATC 2011, p. 597-612.
Kajal, Pundhir, N. K. S., Sangita & Chandra, A., 2007. Use of waste plastics and
copper slag for low cost bituminous roads. Journal of Scientific and Industrial
Research (JSIR), 66(11), p. 938-944.
Kalantar, Z., Mahrez, A. & Karim, M. R., 2010. Properties of Bituminous Binder
Modified With Waste Polyethylene. s.l., Universiti Tenaga Nasional.
Kalantar, Z. N., Mohamed Rehan Karim, M. R. R. & Abdelaziz Mahrez, A., 2012. A
review of using waste and virgin polymer in pavement. Construction and Building
Materials, Volume 33, p. 55-62.
King, G. N. et al., 1993. Influence of asphalt grade and polymer concentration on the
low temperature properties of polymer modified asphalt. Journal of the Association of
Paving Technologies, Volume 62, p. 1-22.
Kok, B. V. & Colak, H., 2011. Laboratory comparison of the crumb-rubber and SBS
modified bitumen and hot mix asphalt. Construction and Building Materials, 25(8), p.
3204-3212.
Liebenberg, J. E. E., Rossmann , D. & Fletcher , E., 2004. Asphalt mix design and
construction: A selection of possible pitfalls. Sun City, South Africa, Document
Transformation Technologies.
Liu, S., Cao, W., Fang, J. & Shang, S., 2009. Variance analysis and performance
evaluation of different crumb rubber modified (CRM) asphalt. Construction and
Building Materials, p. 2701-2708.
109
Lopez-Moro, F. J. et al., 2013. Microscopic analysis of the interaction between crumb
rubber and bitumen in asphalt mixtures using the dry process. Construction and
Building Materials, Volume 48, p. 691-699.
Lottman , R. P., 1982. Laboratory test methods for predicting moisture-induced
damage to asphalt concrete. Transportation Research Record, p. 88-95.
Lu, X. & Isacsson, U., 2001. Modification of road bitumens with thermoplastic
polymers. Polymer Testing, 20(1), p. 77-86.
Moreno, F., Rubio , M. C. & Martinez-Echevarria, M. J., 2011. Analysis of digestion
time and the crumb rubber percentage in dry-process crumb rubber modified hot
bituminous mixes. Construction and Building Materials, 25(5), p. 2323-2334.
Moreno, F., Rubio, M. C. & Martinez-Echevarria, M. J., 2012. The mechanical
performance of dry-process crumb rubber modified hot bituminous mixes.
Construction and Building Materials, 26(1), p. 466-474.
Mturi, G. A. & O'Connell, J., 2011. Rheological analysis of crumb rubber modified
binder. Pretoria, University of Pretoria.
NCHRP, 2011. Report 673: A Manual for Design of Hot Mix Asphalt with
Commentary. 1st ed.Transport Research Board: National Academy of Sciences.
Nemade, S. N. & Thorat, P. V., 2013. Utilization of polymer waste for modification
of bitumen in road construction. Science Riviews ans Chemical Communications, 3(4),
p. 198-213.
Nuha, S.M., Asim, H.A., Suhana, K. & Mohamed R.K., 2013. Performance evaluation
of crumb rubber modified stone mastic asphalt pavement in Malaysia. Advances in
Materials Science and Engineering, 2013, p. 1-8.
Partl, M. N., Pasquini, E., Canestrari, F. & Virgili, A., 2010. Analysis of water and
thermal sensitivity of open graded asphalt rubber mixtures. Construction and Building
Materials, 24(3), p. 283-291.
110
Pinheiro, J. H. M. & Soares, J. B., 2003. The effect of crumb rubber gradation and
binder-ruber interaction time on the mechanical properties of asphalt-rubber mixtures
(dry process). Asphalt Rubber Conference:2003.(2-4 December 2013)
PlasticEurope, 2010. Plastics-the Facts 2010: An analysis of European plastics
production, demand and recovery for 2009, Brussels, Belgium: PlasticEurope.
Plastics SA, 2013. Plastics Recycling Survey: 2012 update. Available at:
www.plasticsinfo.co.za [Accessed 10 October 2013].
Potgieter, C., 2004. Bitumen rubber asphalt: Year 2003 design and construction
procedures in South Africa. Sun City, Potgieter Hattingh and Raspi Inc.
Rahman , M. M., Airey, G. D. & Collop, A. C., 2011. Moisture susceptibility of high
and low compaction dry process crumb rubber-nodified asphalt mixtures.
Transportation Research Record: Journal of the Transportation Research Board,
Volume 2, p. 121-129.
Rahman, N., Ahmeduzzaman, M., Sobhan, M. A. & Ahmed, T. U., 2013. Performance
Evaluation of Waste Polyethylene and PVC on Hot Asphalt Mixtures. American
Journal of Civil Engineering and Architecture, 1(5), p. 97-102.
Raissi, S. & Farsani, R.-E., 2009. Statistical process optimization through multi-
response surface methodology. World Academy of Science, Engineering and
Technology, 3(3), p. 251-255.
Rajmane , P. B., Gupta, A. K. & Desai, D. B., 2009. Effective utilization of waste
plastic in construction of flexible pavement for improving their performance. Nagpur,
Maharashtra, India , Dr J.J Magdum College of Engineering, Jaysingpur, p. 27-30.
Read, J. & Whiteoak, D., 2003. The Shell Bitumen Handbook. 5th ed. London: Thomas
Telford Publishing.
REDISA, 2009. REDISA. Available at: http://www.redisa.org.za/info-facts/
[Accessed 19 June 2012].
111
Rogers, M., 2003. Highway engineering. 1st ed. Ireland: Oxford: Blackwell Science .
Rokade, S., 2012. Use of Waste Plastic and Waste Rubber Tyres in Flexible Highway.
Singapore, IACSIT Press, Singapoore.
Rust, F.C., Harvey, J., Verhaeghe, B.M.J.A. & Van Kirk, J., 1994. Fatigue and rutting
performance of conventional asphalt and bitumen-rubber asphalt under accelerated
trafficking. CSIR, Cape Town, South Africa, 6th Conference on Asphalt Pavements for
Southern Africa, (3), p. 199-215.
Sabina, et al., 2009. Performance evaluation of waste plastic/polymer modified
bituminous concrete mixes. Journal of Scientific and Industrial Research (JSIR),
68(11), p. 975-979.
SABITA, 2005. User Guide for the Design of Hot Mix Asphalt. Manual 24 ed.
Pinelands: SABITA.
SABITA, 2008. Manual 5: Guidelines for the manufacture and construction of hot-
mix, Pinelands, South Africa: SABITA
SABITA, 2010. A Review of the South African Road Network and its Imapact on the
Bituminous Product Industry, Pinelands, South Africa: SABITA.
SABITA, 2012. A review of the South African road network and its impact on the
bituminous product industry.Available at: www.sabita.co.za/ [Accessed 03 June
2012].
SANRAL, 2013. South African Pavement Engineering Manual. 1 ed. South Africa:
South African National Roads Agency Ltd.
SATRP, 2009. The integrated industry waste tyre management plan of the south
african tyre recycling process company, Johannesburg: South African Tyre Recycling
Process Company.
112
SATRPC, 2011. The Integrated Industry Waste Tyre Management Plan of the South
African Tyre Recycling Process Company, s.l.: South African Tyre Recycling Process
Company.
Sengul, E.C., Oruc, S., Iskender, E. & Aksoy, A., 2013. Evaluation of SBS modified
stone mastic asphalt pavement performance. Construction and Building Materials, 41,
p. 777-783.
Siddique, R. & Naik, T. R., 2004. Properties of concrete containing scrap-tire rubber-
an overview. Waste Management, 24(6), p. 563-9.
Southern African Bereau of Standards, 1972 (amended 2003). Standard specifications
for penetration grade bitumens. Pretoria: SABS 307.
Southern African Bitumen Association (Sabita), 2011. Asphalt News. April, 25(1), p.
1-31.
Technical Guide 1, 2007. Technical Guideline: The use of Modified Bituminous
Binders in Road Construction, Pretoria: Asphalt Academy.
The South African National Roads Agency, 2001. Interim Guidelines for the Design
of Hot-Mix Asphalt in South Africa. 1 ed. Pretoria, South Africa: The South African
Bational Roads Agency Ltd.
Thomson, D. C. & Hoiberg, A. J., 1979. Bituminous materials: Asphalt tars and
pitches. New York: Krieger Publishing.
Tuncan , M., Tuncan, A. & Cetin , A., 2003. The use of waste materials in asphalt
concrete mixtures. Waste Management and Research, 21(2), p. 83-92.
Urban Land Institute and Earnest and Young, 2011. Infrastructure 2011: A Strategic
Priority. Washington, D.C: s.n.
Van Rooyen & Hilda, 2010. Multi-million rand research to design better, durable
roads. CSIR Science Scope, 1 September, 5(1), p. 6-8.
113
Yildirim, Y., 2007. Polymer modified asphalt binders. Construction and Building
Materials, 21(1), p. 66-72.
Yilmaz, M., Kok, V. B. & Kuloglu, N., 2011. Effects of using asphaltite as filler on
mechanical properties of hot mix asphalt. Construction and Building Materials,
25(11), p. 4279-4286.
Zhang, S. L., Xin, Z. X., Zhang, Z. X. & Kim, J. K., 2009. Characterization of the
properties of thermoplastic elastomers containing waste rubber tire powder. Waste
Management, 29(5), p. 1480-1485.
Zhang, S. L. et al., 2010. Prediction of mechanical properties of waste
polypropylene/waste ground rubber tire powder blends using artificial neural
networks. Materials & Design, 31(8), p. 3624-3629.
Zoorob, S. E. & Suparma, L. B., 2000. Laboratory design and investigation of the
properties of continuously graded Asphaltic concrete containing recycled plastics
aggregate replacement (Plastiphalt). Cement and Concrete Composites, 22(4), p. 233-
242.