Embed Size (px)
Citation preview

Atmospheric Research 139 (2014) 18–26
Contents lists available at ScienceDirect
Atmospheric Research
j ourna l homepage: www.e lsev ie r .com/ locate /atmos
Rainfall asymmetries of tropical cyclones prior to, during, andafter making landfall in South China and SoutheastUnited States
Weixin Xu a,⁎, Haiyan Jiang b, Xianbiao Kang c
a Department of Atmospheric Sciences, Colorado State University, Fort Collins, CO, United Statesb Department of Earth and Environment, Florida International University, Miami, FL, United Statesc National Marine Environmental Forecasting Center, State Oceanic Administration, Beijing, China
a r t i c l e i n f o
⁎ Corresponding author at: Department of AtmosphState University, 3915 W. Laporte Ave., Fort Collins, CO
E-mail address: [email protected] (W. Xu).
0169-8095/$ – see front matter © 2014 Elsevier B.V. Ahttp://dx.doi.org/10.1016/j.atmosres.2013.12.015
a b s t r a c t
Article history:Received 3 October 2013Received in revised form 12 December 2013Accepted 26 December 2013
This study examines rainfall asymmetries of tropical cyclones (TCs) prior to, during, and aftermaking landfall in South China and the Southeast United States from 1998 to 2011 based onTRMM rainfall products. The climatological TC rainfall asymmetries are then linked to variouspotential environmental factors. These factors include TC intensity and motion, vertical windshear, topography, sea surface temperature (SST), and total precipitable water (TPW). All thesefactors are examined in combination, as it is in the realworld. Results show that effects of the deepvertical wind shear (200–850 hPa) dominate the rainfall asymmetries producing maxima on thedownshear and downshear-left sides. This wind shear effect is still dominant even during TCsmaking landfall, or after landfall, or interacting with mountains. The magnitude of the rainfallasymmetry increases with shear magnitude, but decreases with increasing TC intensity.Furthermore, the shear effect is less efficient for TCs over relatively cool SST and low TPW oceanswhen TCs produce less precipitation. On the other hand, effects of storm motion (producingrainfall maxima at front quadrants) are not evident in this study, mainly due to opposing verticalwind shear effects. However, landfalling TCs experience a significant increase in the rainfallpercentage toward the right quadrants relative to the coast, likely due to surface frictionalgradient between land and sea. There is no evident signature of precipitation enhancement overthe windward slope of mountains (400–600 m) in SCHN and SECHN.
© 2014 Elsevier B.V. All rights reserved.
Keywords:Landfalling tropical cycloneTropical cyclone rainfallTC rainfall asymmetryVertical wind shear effectTC motion effect
1. Introduction
When a tropical cyclone (TC) makes landfall, strong windsand storm surge can cause tremendous damage in coastal areas.However, the most deadly and destructive disaster produced bylandfalling TCs may be inland freshwater flooding (or mudslidesinmountains induced by flash flooding) caused by torrential rain(Marks and Shay, 1998; Rappaport, 2000; Chien and Kuo, 2011).
eric Sciences, Colorado80521, United States.
ll rights reserved.
Therefore, correctly predicting the specific areas that willexperience the heaviest rain is extremely important in disastermitigation. A fundamental step is to characterize TC precipitationasymmetries and find the contributing factors (Chan et al., 2004;Lonfat et al., 2004; Chen et al., 2006). Previous studies showedthat TCs both over oceans andmaking landfall exhibit significantrainfall (or convective activity) asymmetries (Corbosiero andMolinari, 2002; Lonfat et al., 2004; Chan et al., 2004; Chen et al.,2006; Cecil, 2007).
Early observations have generally shown that TCs over theglobal ocean have a precipitation maximum ahead (eitherfront-right or front-left) of the storm center (Burpee and Black,1989; Rodgers et al., 1994). Recently, based on satellitecomposites, it was found that the maximum rainfall is located

19W. Xu et al. / Atmospheric Research 139 (2014) 18–26
at the front-left quadrant for tropical storms and at thefront-right for hurricanes or typhoons (Lonfat et al., 2004).Previous studies cited above have emphasized the impor-tance of surface friction-induced low-level convergencecaused by storm motion. However, more recent studiesindicate that TC precipitation asymmetries are more relatedto the vertical wind shear (Corbosiero and Molinari, 2002;Chen et al., 2006; Ueno, 2007; Cecil, 2007). As shown inthese studies, a maximum of lightning, convective activity,and rain rate occurs at the downshear and left-of-shear inthe Northern Hemisphere regardless of the storm motion.The magnitude of rainfall asymmetry increases with themagnitude of the wind shear, but decreases with stormintensity. Wind shear effect overwhelms the storm motioneffect on TC rainfall asymmetry, e.g., rainfall maxima is stilllocated at the downshear or left-of-shear even stormmotionplays an opposite effect.
As a TC approaches land, surface friction gradient betweenland and sea induces a frictional convergence to the right sideof the storm motion in the Northern Hemisphere. This rightside favored feature of landfalling TCs' precipitation has beenshown in many observations and numerical studies (Powell,1982; Tuleya and Kurihara, 1978). Rainfall maxima on the leftside have also been found in landfalling TCs (Parrish et al.,1982; Blackwell, 2000). Rainfall maxima in left quadrantscould be caused by frictional effects in recurving TCs movingnorthward parallel to the coastline. However, frictionalconvergence cannot be the only factor in determining therainfall maximum location. Recent studies showed thatrainfall distribution in landfalling TCs could be influencedbymany other factors such as vertical wind shear (Chan et al.,2004; Liu et al., 2007), TPW (Jiang et al., 2008a,b; Matyas,2010), surrounding SST (Cecil, 2007; Jiang et al., 2008a,b),interaction between TC and baroclinic systems (Atallah et al.,2007) or between TC and monsoon flows (Chien and Kuo,2011; Lee et al., 2012), and local topographic effects (Liou etal., 2012).
The southern China and southeastern United States coastshave the greatest occurrence of TC landfalls across all TCbasins (Knapp et al., 2010). Although TC rainfall asymmetriesin these basins have been extensively investigated, there areless studies focusing on landfalling TCs. First of all, previousstudies on the precipitation asymmetries of landfalling TCsare more case (or multiple case) based (Powell, 1982; Parrishet al., 1982; Blackwell, 2000; Chan et al., 2004; Liu et al.,2007; Liou et al., 2012). Therefore, a long-term climatology ofsuch is very necessary. In short, important issues associatedwith TC rainfall asymmetries are still left to answer. Forexample, how does the rainfall distribution change duringthe life cycle (prior-to, during, and after landfall) of TCsmaking landfall? How do rainfall asymmetries of landfallingTCs respond to a combination of various environmental andother factors including TC motion and intensity, atmosphericdynamics and moisture, topography, and SST? Solving theseissues could help to improve TC precipitation forecasts onland during landfall and could possibly be utilized asguidance by forecasters. This study is therefore motivated toinvestigate rainfall asymmetries of TCs that are close tolandfall using different methodology and data from previousstudies, and correlates rainfall asymmetries to possibleinfluencing factors.
2. Data and methodology
2.1. Best-track, reanalysis, and precipitation datasets
The International Best Track Archive for Climate Steward-ship (IBTrACS) (Knapp et al., 2010) is used in this study. Thedatabase collects and combines historical records of TCinformation for all TC basins from 25 agencies. As otherbest-track databases, the IBTrACS provides the TC centerlocation, TC intensity, and other important characteristic para-meters of TCs every 6 h. The European Centre for Medium-Range Weather Forecasts re-analysis (ERA) Interim reanalysisdata (Dee and Uppala, 2009) are used to calculate the meandeep environmental vertical wind shear between 200 and850 hPa and the TPW. SST data are taken from the dailyReynolds SST analysis (Reynolds et al., 2007).
The precipitation data used in this study are taken fromTropical Rainfall Measuring Mission (TRMM) Multi-satellitePrecipitation Analysis (TMPA) 3B42 precipitation productversion 7 (Huffman et al., 2007). TRMM 3B42 has 3-hourlytemporal resolution and 0.25° by 0.25° spatial resolution,covering the globe from 50° S to 50° N, available from 1998 tothe present. TRMM 3B42 has been frequently used for TCrainfall analysis regionally and globally (Shepherd et al., 2007;Jiang and Zipser, 2010; Prat and Nelson, in press). Based on theprevious studies, TRMM 3B42 rainfall estimates performreasonably well over southeast China and Southeast US(Huffman et al., 2007; Shen et al., 2010; Zhao and Yatagai,2013), even for TC precipitation (Jiang et al., 2008a,b). Thepresent TRMM 3B42 data have incorporated gauge datathrough PDF (probability density function) matching(Huffman et al., 2007). Shen et al. (2010) showed that thegauge-adjustment procedures applied in TRMM 3B42 removethe large-scale bias almost completely, especially for regionswith dense gauge networks including southeast China. Zhaoand Yatagai (2013) reported that the differences betweenTRMM 3B42 product and the gauge analysis of daily precipi-tation are within ~10% over southeast China. Jiang et al.(2008a,b) also showed that the TRMM 3B42 (RT) rainfallestimates have fairly high accuracy compared to radar andgauge data, during the landfalls of hurricanes Isidore and Liliover southeast US. For example, the overall bias of TRMM3B42 (RT) for hurricane Lili is ~0.49 mm day−1. Based on sixheavy TC rainfall events over Louisiana, USA, Habib et al.(2009) indicated that TRMM 3B42 research products havefairly low bias (b25%) and high correlation values (0.8) withrelate to gauge and radar observations. The bias of TRMM3B42 rainfall estimates might comes from uncertainties ofradar attenuation corrections and microwave retrievals(Huffman et al., 2007). Even though satellite-based rainfallestimates are subject to uncertainties, rain gauge measure-ments could also underestimate the true catch in the largesurface wind environment induced by hurricanes. This studyis based on composites of TCs over relatively large boxes(e.g., 10,000 km by 500 km). These averages can smooth thedata field and lower the uncertainty. A major goal of thisstudy is to examine the variability of TC rainfall asymmetryas a function of distance to the coast, i.e., prior to, during, andafter TC landfalling. TRMM 3B42 data are in a good positionto serve this purpose due to its high resolution, full coverage,and reasonable accuracy.
20 W. Xu et al. / Atmospheric Research 139 (2014) 18–26
2.2. Selection criteria and definitions
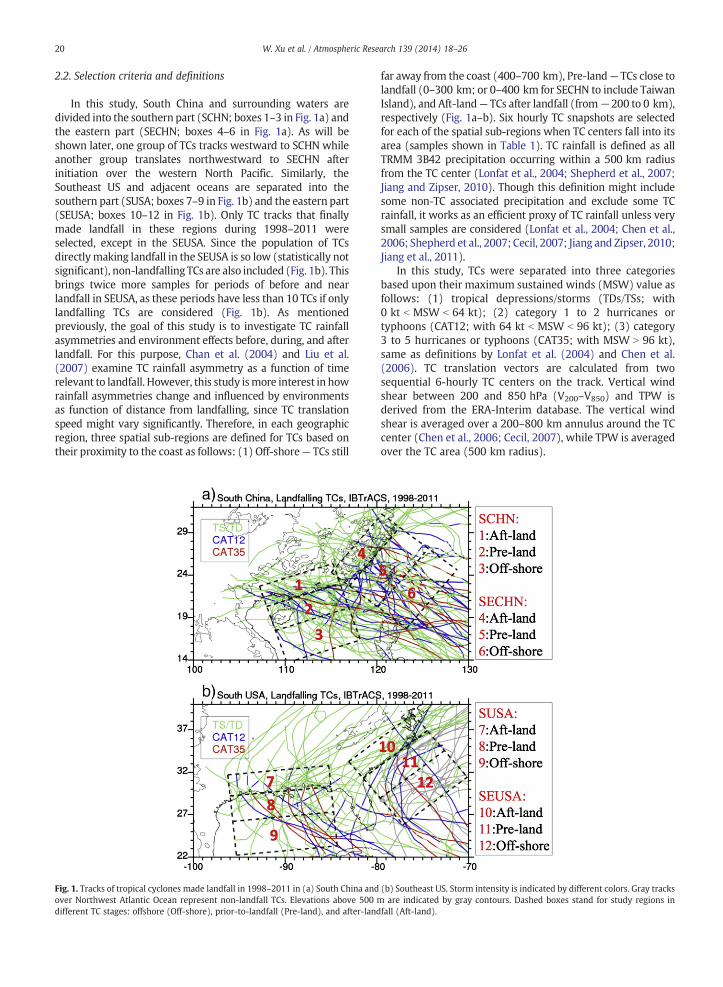
In this study, South China and surrounding waters aredivided into the southern part (SCHN; boxes 1–3 in Fig. 1a) andthe eastern part (SECHN; boxes 4–6 in Fig. 1a). As will beshown later, one group of TCs tracks westward to SCHN whileanother group translates northwestward to SECHN afterinitiation over the western North Pacific. Similarly, theSoutheast US and adjacent oceans are separated into thesouthern part (SUSA; boxes 7–9 in Fig. 1b) and the eastern part(SEUSA; boxes 10–12 in Fig. 1b). Only TC tracks that finallymade landfall in these regions during 1998–2011 wereselected, except in the SEUSA. Since the population of TCsdirectlymaking landfall in the SEUSA is so low (statistically notsignificant), non-landfalling TCs are also included (Fig. 1b). Thisbrings twice more samples for periods of before and nearlandfall in SEUSA, as these periods have less than 10 TCs if onlylandfalling TCs are considered (Fig. 1b). As mentionedpreviously, the goal of this study is to investigate TC rainfallasymmetries and environment effects before, during, and afterlandfall. For this purpose, Chan et al. (2004) and Liu et al.(2007) examine TC rainfall asymmetry as a function of timerelevant to landfall. However, this study ismore interest in howrainfall asymmetries change and influenced by environmentsas function of distance from landfalling, since TC translationspeed might vary significantly. Therefore, in each geographicregion, three spatial sub-regions are defined for TCs based ontheir proximity to the coast as follows: (1) Off-shore— TCs still
Fig. 1. Tracks of tropical cyclones made landfall in 1998–2011 in (a) South China andover Northwest Atlantic Ocean represent non-landfall TCs. Elevations above 500different TC stages: offshore (Off-shore), prior-to-landfall (Pre-land), and after-land
far away from the coast (400–700 km), Pre-land— TCs close tolandfall (0–300 km; or 0–400 km for SECHN to include TaiwanIsland), and Aft-land— TCs after landfall (from−200 to 0 km),respectively (Fig. 1a–b). Six hourly TC snapshots are selectedfor each of the spatial sub-regions when TC centers fall into itsarea (samples shown in Table 1). TC rainfall is defined as allTRMM 3B42 precipitation occurring within a 500 km radiusfrom the TC center (Lonfat et al., 2004; Shepherd et al., 2007;Jiang and Zipser, 2010). Though this definition might includesome non-TC associated precipitation and exclude some TCrainfall, it works as an efficient proxy of TC rainfall unless verysmall samples are considered (Lonfat et al., 2004; Chen et al.,2006; Shepherd et al., 2007; Cecil, 2007; Jiang and Zipser, 2010;Jiang et al., 2011).
In this study, TCs were separated into three categoriesbased upon their maximum sustained winds (MSW) value asfollows: (1) tropical depressions/storms (TDs/TSs; with0 kt b MSW b 64 kt); (2) category 1 to 2 hurricanes ortyphoons (CAT12; with 64 kt b MSW b 96 kt); (3) category3 to 5 hurricanes or typhoons (CAT35; with MSW N 96 kt),same as definitions by Lonfat et al. (2004) and Chen et al.(2006). TC translation vectors are calculated from twosequential 6-hourly TC centers on the track. Vertical windshear between 200 and 850 hPa (V200–V850) and TPW isderived from the ERA-Interim database. The vertical windshear is averaged over a 200–800 km annulus around the TCcenter (Chen et al., 2006; Cecil, 2007), while TPW is averagedover the TC area (500 km radius).
(b) Southeast US. Storm intensity is indicated by different colors. Gray tracksm are indicated by gray contours. Dashed boxes stand for study regions infall (Aft-land).

Table 1Landfalling TC population and six hourly samples in various regions shownin Fig. 1 during 1998–2011. For SEUSA, non-landfalling (number in bracket)TCs are included for study. TCs are categorized by intensity at landfall or nearlandfall (within 300 km from the coast).
Tropical cyclone population Six hourly samples
Total TS/TD CAT12 CAT35 Off-shore Pre-land Aft-land
SCHN 49 33 12 4 181 166 153SECHN 42 20 14 8 142 151 100SUSA 32 22 5 5 112 140 123SEUSA 39
(19)25(12)
11(6)
3(1)
189 146 68
21W. Xu et al. / Atmospheric Research 139 (2014) 18–26
3. Results
3.1. Landfalling TC tracks
During the period from 1998 to 2011, a total of 91 and 52TCs made landfall in southern China (including SCHN andSECHN) and in the southeastern US (including SUSA andSEUSA), respectively (Table 1). From this total there were 38typhoons in the southern China and 17 hurricanes in thesoutheastern US by the time of landfall or near landfall. Most ofthe TCs that made landfall on the southern China coastoriginated from the warm waters of the western North Pacificocean to the east of 130° (Fig. 1a). After developing into tropical
Fig. 2. Distribution of TC daily rainfall averaged in 1998–2011 over (a) SCHN, (b) SEand mean vertical wind shear (200–850 hPa), respectively. Dashed and dotted linesAveraged SST and TPW are denoted by red text at the top, while mean rainfall rate
storms or typhoons over the western North Pacific, a group ofTCs (mostly TSs) tracked down west-north-westward, crossedthe Philippines, and made landfall in the SCHN region, whileanother group (mostly typhoons) tracked down northwest-ward, crossed the Taiwan Island, and made landfall in theSECHN region. It is interesting that major typhoons are morelikely tomove along the northern track (SECHN) than along thesouthern one (SCHN). In the western Atlantic basin, some TCstracked northwestward and made landfall in the SUSA regionafter passing the Gulf of Mexico, while some TCs trackednorthwestward and then made a northeast turn with finallandfall in the SEUSA region (Fig. 1b). A few TCs crossing theSEUSA coast also originated from the Gulf of Mexico aftermaking landfall in the SUSA region or Florida Peninsula. Itshould be noted that in the SCHN SECHN, and SUSA regions, TClandfall angles to the coastline are more perpendicular,whereas the TC landfalls in the SEUS are more parallel to thecoastline. As has been mentioned, the landfalling angle mightimpact the precipitation distribution of TCs during and afterlandfall.
3.2. Overall TC rainfall asymmetries
Fig. 2 displays the distribution of mean TC daily rainfallamount in SCHN, SECHN, SUSA, and SEUSA. TCs in thenorthwest Pacific basin (SCHN and SECHN; Fig. 2a–b) produce
CHN, (c) SUSA, and (d) SEUSA. Black and white arrows represent TC motioncrossing the storm center are parallel and normal to the coast, respectively.
s at the bottom.

22 W. Xu et al. / Atmospheric Research 139 (2014) 18–26
heavier precipitation and a larger rainfall area than those in theAtlantic basin (SUSA and SEUSA; Fig. 2c–d). This ismainly due towarmer waters (SST) and more TPW in the former region thanthe latter. All the regions show clear TC rainfall asymmetries. Themost evident feature is that all regions have TC rainfall maximalocated downshear (front quadrants) or downshear-left (frontleft quadrant) of vertical wind shear (Fig. 2 and Table 2).Although the rain ratemagnitudes are greatest in the inner core,the magnitude of the asymmetry increases with distance(Table 2). Here, the asymmetry magnitude is simply defined asthe ratio between precipitation rates in the favored quadrantsand in the unfavored quadrants followed Cecil (2007). Forexample, the rainfall asymmetry magnitude under the highwind shear condition (e.g., SCHN, SUSA, and SEUSA; Fig. 2a,c, andd) is about 1.5 in the innermost 100 km, and increases to 2.0 and3.0 at the radii of 200 and 300 km, respectively (Table 2). On theother hand, TC precipitation rates are slightly less asymmetricunder the low shear environment (e.g., SECHN; Fig. 2b andTable 2). These general findings are consistent to previous casestudies and satellite composites (Corbosiero andMolinari, 2002;Chan et al., 2004; Chen et al., 2006; Cecil, 2007). Numericalstudies have shown certain mechanisms that make thedownshear and downshear-left regions favored for upwardmotion and enhanced precipitation (Frank and Ritchie, 1999,2001; Rogers et al., 2003; Ueno, 2007). These mechanismsinvolve downshear tilt of the TC vortex, secondary circulation(upwardmotion on the downtilt) due to vortex balance, verticalmotion asymmetry produced by potential temperature anoma-lies, water vapor asymmetry due to vertical motion asymmetry,and cyclonic advection from the downshear region. In addition,the upward motion asymmetry is positively related to themagnitude of the vertical shear and intensity of the vortex(Ueno, 2007).
Certain studies demonstrated that storm motion effects onTC rainfall asymmetries (precipitation maxima ahead of thestorm center) are quite substantial (Burpee and Black, 1989;Rodgers et al., 1994; Lonfat et al., 2004). However, in this study,three out of the four regions do not show TC rainfall maxima inthe front quadrants of TCmotion (black arrow; Fig. 2). AlthoughSEUSA TCs displays front-maximum asymmetry (Fig. 2d), theirfront quadrants favored by storm motion actually overlap withthe downshear-left quadrants favored bywind shear. Chen et al.(2006) and Ueno (2007) found that the downshear-leftquadrant favored rainfall maxima are still evident even whenstorm motion is in the opposite direction or right of shear.Similarly, Corbosiero and Molinari (2002) showed that stormmotion effects are secondary to that of wind shear in
Table 2Direction (relative to wind shear) and magnitude of TC rainfall asymmetryas a function of distance from the TC center. Asymmetry direction is definedas the maximum precipitation quadrant (QUA) relative to wind shear, whileasymmetry magnitude (MAG) is defined as the ratio of quadrant-averagedmaximum and minimum precipitation. Quadrants include front-right (FR),front-left (FL), rear-right (RR), and rear-left (RL).
Region 0–100 km 100–200 km 200–300 km 300–400 km
QUA MAG QUA MAG QUA MAG QUA MAG
SCHN FL 1.94 FL 2.79 FL 3.00 FL 3.01SECHN FR 1.39 FR 1.88 FR 2.11 FR 2.59SUSA FL 1.64 FL 2.11 FL 3.13 FL 4.68SEUSA FL 1.46 FL 1.82 FL 3.51 FL 5.53
determining the asymmetric distribution of lightning flashes.The explanation is that stormmotion-produced vertical motionasymmetries at the top of the boundary layer do not initiatedeep convection if wind shear-induced circulations opposethem. In practice, storm motion itself should have an internalrelationship with vertical wind shear. Ueno (2007) reportedthat TC motion in the western North Pacific tends to favor theright of the wind shear in the low-latitudes, whereas it favorsthe left of the wind shear in mid-latitudes.
3.3. TC rainfall asymmetry as a function of distance from thecoast
Fig. 3 shows the TC rainfall distribution (in percentage ofmean rainfall) as a function of distance of TCs from coast(Off-shore, Pre-land, Aft-land). In general, TCs prior to, during,and after landfall all display similar rainfall distribution. That is,most TCs have maximum rainfall located in the downshear (ordownshear-left) quadrants. In other words, wind shear effects(see discussions in Section 3.2) dominate the rainfall distributionfor the whole life cycle of landfalling TCs. Over the open oceans(Fig. 3a–d), TCs have far more rainfall in the downshear side(Fig. 3a–c), except for TCs in SEUSA (Fig. 3d). In SECHN (Fig. 3b),while the shear magnitude is relatively weak (b5 m s−1), TCrainfall still favors the downshear quadrants. In contrast, TCsbefore landfalling in SEUSA are less asymmetric (asymmetriesmainly in themost outer and light rain region), though the shearmagnitude is substantial (7–10 m s−1). It should be noted thatSEUSA has relatively cool SST and small TPW and thereforelimited rainfall area.
As TCs translate from the open ocean (Off-shore, Fig. 3a–d),approach the coast (Pre-land, Fig. 3e–h), and finally makelandfall (Aft-land, Fig. 3i–l), the rainfall distribution experi-ences some noticeable changes. In SCHN and SECHN, TC rainfallpercentage on the right side (relative to the coast) of the TCincreases gradually in the outer rainband region (10–20%). TheTC rainfall percentage in coastal regions to the right of TCcenter increases by more than 30% after the TC makes landfall.This indicates that the surface frictional convergence betweenthe land and ocean plays some role in the rainfall enhancementin landfalling TCs (Powell, 1982; Blackwell, 2000; Chan et al.,2004). In the SUSA region, TC rainfall experiences a negligiblerainfall (percentage) enhancement on the right side during thecourse of approaching the coast and making landfall. This canbe explained by the fact that the right side of the TC motion inSUSA happens to be the downshear area where wind sheareffect dominates the precipitation enhancement. In contrast,SEUSA TCs have an evident increase of rainfall percentage onthe front-left quadrant of storm motion (but still right siderelative to the coast) when TCs are close to landfall. Theexplanation is that TCs close to landfall in SEUSA recurvenorthward and graze the coast or make landfall on the leftquadrants where friction gradient between the land and sea ispresent (Fig. 1b). In addition, the interaction between TCs andmidlatitude systems also lead to precipitation maxima on theleft of the track (Atallah et al., 2007). In many TCs that makelandfall on the east coast of the US (especially north of NorthCarolina), the heaviest rains are found to the left (Atallah et al.,2007). Hurricane Sandy (2012) is such an example.
In mountainous coasts, topography could be a majorfactor that enhances TC rainfall due to the uplifting of TC

Fig. 3. Rainfall (in percentage of mean rainfall) distribution within 500 km radius of TCs at different stages of landfalling: (a)–(d): far away from coast (Off-shore),(e)–(h): prior to landfall (Pre-land), and (i)–(l): after-landfall (Aft-land). Thick dashed line is the approximate location of the coast.
23W. Xu et al. / Atmospheric Research 139 (2014) 18–26
flowswhen impinging onmountains (Chien andKuo, 2011; Liouet al., 2012). In this study, TC rainfall enhancement by relativelylow mountains (400–600 m) in SCHN and SECHN coasts is notevident when TCs made landfall and penetrated these moun-tains. Based on radar observations, Chan et al. (2004) pointedout that although bursts of convective cells can be seen in thevicinity of some isolated elevated locations in south China, thecontribution of these terrains to the convective asymmetries(which are of the order of 100 km) were relatively small. Eventhough there is no signature of precipitation enhancement overthewindward slopes in SCHN and SECHN, the topographymightinfluence the TC rainfall through modifying the vertical windshear. For example, low-level winds would be reduced whenprevailing winds (e.g., southwesterlies) are approaching moun-tains over SCHN. This helps to enhance the northeasterly windshear over this region, as the low-level southwesterly windsdecrease. However, steep mountains in Taiwan (inside SECHNregion) could cause major rainfall asymmetries. Pre-landfall TCsin SECHN (Fig. 3f and j) show clear rainfall maxima on thesouthern (also downshear) quadrants. These rainfall maxima
might not be caused by thewind shear effect, as the shear is veryweak (2–3 m s−1). Instead, they are more likely caused byorographic lifting through TC flows impinging on steepmountains in central Taiwan, as most TCs in SECHN track nearor over Taiwan. In many cases (40–50%), TCs cross Taiwan fromthe east and track down northwestward leading westerly flowsin the southwest quadrant to impinge on thewest side of centralTaiwan mountains.
In this study, SST and TPW factors show a great influenceon the extent and intensity of TC rainfall (Fig. 2), and slightimpact on the TC rainfall asymmetry amplitude. In thewarmer SST and larger TPW environment, wind shear effecton rainfall asymmetry tends to be more pronounced. Forexample, offshore TCs in SCHN, SECHN, and SUSA regionsdisplay a much greater magnitude of rainfall asymmetry,even under similar or smaller wind shear, than SEUSA wherecondition is cool and dry (Fig. 3a–d). Further study is neededto examine whether the dramatic rainfall asymmetry underweak shear environment is due to asymmetric distribution ofSST and/or moisture field within the TC. On the other hand,

24 W. Xu et al. / Atmospheric Research 139 (2014) 18–26
the interaction of TC outer circulation with the southwesterlyflows might partially contribute to the rainfall maxima in thesouthern quadrants of TCs in western North Pacific. Forexample, Lee et al. (2012) reported that 22% typhoons in thewestern North Pacific are observed with long-lasting intensemesoscale convective systems (mainly in the southwest quad-rant) due to the convergence between TC circulation andsouthwesterly low-level jets. Furthermore, this monsoon-TCinteraction is a key factor in producing unexpected heavyprecipitation by TC (e.g., Typhoon Marakot brought 1000–3000 mm to southern Taiwan in 4 days) (Chien and Kuo, 2011).
3.4. TC rainfall asymmetry as a function of TC intensity
This section analyzes TC rainfall distribution as a function ofTC intensity (Fig. 4). TCs are limited to prior-to landfall(100–600 km from the coast), as most TCs degrade to tropicalstorms after landfall. In general, rainfall intensity increases as TCintensity increases due to the stronger circulation and dynamicsin more intense TCs. However, the magnitude of TC rainfall
Fig. 4. Rainfall (in percentage of mean rainfall) distribution within 500 km radius ofby storm intensities (a)–(d): tropical storm or depression (TS/TD), (e)–(h): catego
asymmetry decreaseswith increasing TC intensity. For example,CAT35 TCs have nearly symmetric rainfall distributions, andtropical storms show the most pronounced rainfall maxima inthe downshear direction (Fig. 4a and b), while CAT12 TCs have amodest asymmetry. These results are consistent with previousstudies based on satellite composites of TCs over global oceans(Chen et al., 2006; Cecil, 2007; Wingo and Cecil, 2010). Thedifferences between asymmetry amplitude among the variousintensity groups might be mainly due to the different primarycirculation strength of the TC vortex. Tropical storms have aweaker and less organized (or less axisymmetric) circulationthan CAT12 and CAT35 storms (Marks and Houze, 1987;Croxford and Barnes, 2002). In this case, the wind shear-induced asymmetric vertical motion is more substantial com-pared with the mean TC circulation. As a result, the deepconvective activities on the downshear are more evident whenthey are initiated and enhanced by the asymmetric verticalmotion. As the storm intensity increases, the primary circulationbecomes stronger and more symmetric, and deep convectionshould bemore symmetrically distributed around storm center.
TCs prior to landfall (100–600 km from coast) in specific regions categorizedry one to two (CAT12), and (i)–(l): category three to five (CAT35).

25W. Xu et al. / Atmospheric Research 139 (2014) 18–26
Of course, the relationship between vertical wind shearmagnitude and TC intensity should also be considered. StrongTCs are usually located in a low shear environment becausethey wouldn't have been able to intensify into a stronghurricane under high shear conditions. For example, CAT35TCs in this study are under the weakest wind shear environ-ment, especially for SCHN and SECHN where CAT35 TCs areunder the shear of less than 3 m s−1 (Fig. 4i–j). There is nodoubt that the shear effect is negligible under this situation.However, major hurricanes (CAT35) in SUSA experiencesubstantial vertical wind shear (7–8 m s−1) but not anysignificant rainfall asymmetry. In this case, the strong andsymmetric TC circulation might be the key factor to symmet-rically distribute rainfall. For TCs in TS/TD and CAT12 category,the wind shear factor predominantly determines the maxi-mum rainfall location.
4. Conclusions
This study examines landfalling TCs in South China and theSoutheast US on the aspect of long-term (14-yr) averagedrainfall distribution as a function of TC distance from the coast,TC intensity, and other parameters such as SS and TPW. Statisticsfrom this study are generally consistent with previous studies.This study further reveals that (1) the vertical wind shear(200–850 hPa) is a dominant factor in determining rainfallasymmetries (maxima on the downshear and downshear-left)even during landfalling or after-landfall periods, (2) the mag-nitude of the rainfall asymmetry decreases with increasingTC intensity even under substantial wind shear conditions,(3) effects of storm motion are not observed when verticalwind shear effects oppose them, (4) TCs close to landfallexperience significant increase in the rainfall percentagetoward the right quadrants relative to the coast, due tosurface frictional gradient between land and sea (5) TCrainfall enhancement is only evident for TCs moving close tosteep mountains (e.g., Taiwan), whereas low elevationmountains on the coast shows not any clear effects, and (6)the shear effect on rainfall asymmetry is more pronouncedunder the high SST and TPW environment than it is underthe relatively cool SST and dry condition.
Acknowledgment
This research was supported by the NASA PrecipitationMeasurement Mission (PMM) Grant #NNX10AE28G. Theauthors would like to thank Joseph Zagrodnik (M.S. studentat FIU) for his help on the English of the manuscript.
References
Atallah, E.H., Bosart, L.F., Aiyyer, A.R., 2007. Precipitation distributionassociated with landfalling tropical cyclones over the eastern UnitedStates. Mon. Weather Rev. 135, 2185–2206.
Blackwell, K.G., 2000. The evolution of Hurricane Danny 1997 at landfall:Doppler-observed eyewall replacement, vortex contraction/intensifica-tion, and low-level wind maxima. Mon. Weather Rev. 128, 4002–4016.
Burpee, R.W., Black, M.L., 1989. Temporal and spatial variations of rainfall nearthe centers of two tropical cyclones. Mon. Weather Rev. 117, 2204–2218.
Cecil, D.J., 2007. Satellite-derived rain rates in vertically sheared tropical cyclones.Geophys. Res. Lett. 34, L02811. http://dx.doi.org/10.1029/2006GL027942.
Chan, J.C.-L., Liu, K.-S., Ching, E., Lai, E.S.-T., 2004. Asymmetric distribution ofconvection associated with tropical cyclones making landfall along theSouth China coast. Mon. Weather Rev. 132, 2410–2420.
Chen, S.S., Knaff, J.A., Marks Jr., F.D., 2006. Effects of vertical wind shear andstorm motion on tropical cyclone rainfall asymmetries deduced fromTRMM. Mon. Weather Rev. 134, 3190–3208.
Chien, F.-C., Kuo, H.-C., 2011. On the extreme rainfall of TyphoonMorakot 2009.J. Geophys. Res. 116, D05104. http://dx.doi.org/10.1029/2010JD015092.
Corbosiero, K.L., Molinari, J., 2002. The effects of vertical wind shear on thedistribution of convection in tropical cyclones. Mon. Weather Rev. 130,2110–2123.
Croxford, M., Barnes, G.M., 2002. Inner core strength of Atlantic tropicalcyclones. Mon. Weather Rev. 130, 127–139.
Dee, D.P., Uppala, S., 2009. Variational bias correction of satellite radiance datain the ERA-Interim reanalysis. Q. J. R. Meteorol. Soc. 135, 1830–1841.
Frank, W.M., Ritchie, E.A., 1999. Effects of environmental flow upon tropicalcyclone structure. Mon. Weather Rev. 127, 2044–2061.
Frank, W.M., Ritchie, E.A., 2001. Effects of vertical wind shear on the intensityand structure of numerically simulatedhurricanes.Mon.Weather Rev. 129,2249–2269.
Habib, E., Henschke, A., Adler, R.F., 2009. Evaluation of TMPA satellite-based research and real-time rainfall estimates during six tropical-related heavy rainfall events over Louisiana, USA. Atmos. Res. 94,373–388.
Huffman, G.J., et al., 2007. The TRMM multi-satellite precipitation analysisTMPA: quasi-global, multiyear, combined sensor precipitation estimatesat fine scales. J. Hydrometeorol. 8, 38–55.
Jiang, H., Zipser, E.J., 2010. Contribution of tropical cyclones to the globalprecipitation from 8 seasons of TRMM data: regional, seasonal, andinterannual variations. J. Clim. 23, 1526–1543. http://dx.doi.org/10.1175/2009JCLI3303.1.
Jiang, H., Halverson, J.B., Simpson, J., 2008a. On the differences in stormrainfall from Hurricanes Isidore and Lili. Part I: satellite observations andrain potential. Weather Forecast. 23, 29–43.
Jiang, H., Halverson, J.B., Zipser, E.J., 2008b. Influence of environmentalmoisture on TRMM-derived tropical cyclone precipitation over landand ocean. Geophys. Res. Lett. 35, L17806. http://dx.doi.org/10.1029/2008GL034658.
Jiang, H., Liu, C., Zipser, E.J., 2011. A TRMM-based tropical cyclone cloud andprecipitation feature database. J. Appl. Meteorol. Climatol. 50, 1255–1274.
Knapp, K.R., Kruk, M.C., Levinson, D.H., Diamond, H.J., Neumann, C.J., 2010. TheInternational Best Track Archive for Climate Stewardship (IBTrACS). Bull. Am.Meteorol. Soc. 91, 363–376. http://dx.doi.org/10.1175/2009BAMS2755.1.
Lee, C.-S., Chen, B.-F., Elsberry, R.L., 2012. Long-lasting convective systems in theouter region of tropical cyclones in thewesternNorth Pacific. Geophys. Res.Lett. 39, L21812. http://dx.doi.org/10.1029/2012GL053685.
Liou, Y.C., Wang, T.C.C., Tsai, Y.C., Tang, Y.S., Lin, P.L., Lee, Y.A., 2012. Structureof precipitating systems over Taiwan's complex terrain during TyphoonMorakot 2009 as revealed by weather radar and rain gauge observa-tions. J. Hydrol. 506, 14–25.
Liu, K.S., Chan, J.C.L., Cheng, W.C., Tai, S.L., Wong, P.W., 2007. Distribution ofconvection associated with tropical cyclones making landfall along theSouth China coast. Meteorog. Atmos. Phys. 97, 57–68.
Lonfat, M., Marks Jr., F.D., Chen, S.S., 2004. Precipitation distribution intropical cyclones using the Tropical Rainfall Measuring Mission(TRMM) microwave imager: a global perspective. Mon. Weather Rev.132, 1645–1660.
Marks, F.D., Houze Jr., R.A., 1987. Inner core structure of Hurricane Aliciafrom airborne Doppler radar observations. J. Atmos. Sci. 44, 1296–1317.
Marks, F.D., Shay, L.K., 1998. Landfalling tropical cyclones: forecastproblems and associated research opportunities. Bull. Am. Meteorol.Soc. 79, 305–323.
Matyas, C.J., 2010. Associations between the size of hurricane rain fields atlandfall and their surrounding environments. Meteorog. Atmos. Phys. 106,135–148.
Parrish, J.R., Burpee, R.W., Marks Jr., F.D., Grebe, R., 1982. Rain patternsobserved by digitized radar during the landfall of Hurricane Frederic1979. Mon. Weather Rev. 110, 1933–1944.
Powell, M.D., 1982. The transition of the Hurricane Frederic boundary-layerwind field from the open Gulf of Mexico to landfall. Mon. Weather Rev.110, 1912–1932.
Prat, O.P., Nelson, B.R., 2014. Characteristics of annual, seasonal, anddiurnal precipitation in the Southeastern United States derived fromlong-term remotely sensed data. Atmos. Res. http://dx.doi.org/10.1016/j.atmosres.2013.07.022 (in press).
Rappaport, E.N., 2000. Loss of life in the United States associated with recentAtlantic tropical cyclones. Bull. Am. Meteorol. Soc. 81, 2065–2074.
Reynolds, R.W., Smith, T.M., Liu, C., Chelton, D.B., Casey, K.S., Schlax, M.G.,2007. Daily high-resolution blended analyses for sea surface tempera-ture. J. Clim. 20, 5473–5496.
Rodgers, E.B., Chang, S., Pierce, H.F., 1994. A satellite observational andnumerical study of precipitation characteristics in western NorthAtlantic tropical cyclones. J. Appl. Meteorol. 33, 129–139.

26 W. Xu et al. / Atmospheric Research 139 (2014) 18–26
Rogers, R., Chen, S.S., Tenerelli, J., Willoughby, H., 2003. A numerical study ofthe impact of vertical shear on the distribution of rainfall in HurricaneBonnie 1998. Mon. Weather Rev. 131, 1577–1599.
Shen, Y., Xiong, A., Wang, Y., Xie, P., 2010. Performance of high-resolutionsatellite precipitation products over China. J. Geophys. Res. 115, D02114.http://dx.doi.org/10.1029/2009JD012097.
Shepherd, J.M., Grundstein, A., Mote, T.L., 2007. Quantifying thecontribution of tropical cyclones to extreme rainfall along the coastalsoutheastern United States. Geophys. Res. Lett. 34, L23810. http://dx.doi.org/10.1029/2007GL031694.
Tuleya, R.E., Kurihara, Y., 1978. A numerical simulation of the landfall oftropical cyclones. J. Atmos. Sci. 35, 242–257.
Ueno, M., 2007. Observational analysis and numerical evaluation of theeffects of vertical wind shear on the rainfall asymmetry in the typhooninner-core region. J. Meteorol. Soc. Jpn 85, 115–136.
Wingo, M.T., Cecil, D.J., 2010. Effects of vertical wind shear on tropicalcyclone precipitation. Mon. Weather Rev. 138, 645–662.
Zhao, T., Yatagai, A., 2013. Evaluation of TRMM 3B42 product using a newgauge-based analysis of daily precipitation over China. Int. J. Climatol.http://dx.doi.org/10.1002/joc.3872.