Embed Size (px)
Citation preview

www.TheCIE.com.au
R E P O R T
Peer review of economic assessment
Wallarah 2 Coal Project
Prepared for
NSW Department of Planning and Environment
13 February 2016
THE CENTRE FOR INTERNATIONAL ECONOMICS
www.TheCIE.com.au
COMMERCIAL IN CONFIDENCE
The Centre for International Economics is a private economic research agency that
provides professional, independent and timely analysis of international and domestic
events and policies.
The CIE’s professional staff arrange, undertake and publish commissioned economic
research and analysis for industry, corporations, governments, international agencies
and individuals.
© Centre for International Economics 2017
This work is copyright. Individuals, agencies and corporations wishing to reproduce
this material should contact the Centre for International Economics at one of the
following addresses.
C A N B E R R A
Centre for International Economics
Ground Floor, 11 Lancaster Place
Majura Park
Canberra ACT 2609
GPO Box 2203
Canberra ACT Australia 2601
Telephone +61 2 6245 7800
Facsimile +61 2 6245 7888
Email [email protected]
Website www.TheCIE.com.au
S Y D N E Y
Centre for International Economics
Suite 1, Level 16, 1 York Street
Sydney NSW 2000
GPO Box 397
Sydney NSW Australia 2001
Telephone +61 2 9250 0800
Facsimile +61 2 9250 0888
Email [email protected]
Website www.TheCIE.com.au
DISCLAIMER
While the CIE endeavours to provide reliable analysis and believes the material
it presents is accurate, it will not be liable for any party acting on such information.

Peer review of economic assessment iii
www.TheCIE.com.au
Contents
Summary 4
1 Introduction 7
About the project 7
Scope of review 9
2 Features of a CBA 10
3 Review of CBA 12
Scope of the CBA 12
Project definition 12
Alternative options 13
Timeframe and discount rate 13
Estimated Benefits 13
Estimated costs 21
4 Regional economic assessment 28
5 Conclusion 31
BOXES, CHARTS AND TABLES
1 Summary of the Cost Benefit Analysis 5
2.1 Key features of a CBA 11
3.1 Production profile 14
3.2 Thermal Coal Spot Prices 15
3.3 AUD/USD Exchange rate 16
3.4 Identifying the economic benefit to workers 19
3.5 Mining income/Mining employment elasticity by remoteness area 20
3.6 Predicted Greenhouse Gas Emissions 23
3.7 Alternative estimates of the economic cost of greenhouse gas emissions 24

4 Peer review of economic assessment
www.TheCIE.com.au
Summary
The Wyong Areas Coal Joint Venture (WACJV) is seeking development consent under
Part 4 of the Environmental Planning and Assessment Act 1979 (EP&A Act) for the Wallarah
2 Coal Project (the Project). An economic assessment of the Project has been prepared by
Gillespie Economics (dated May 2016) and presented in Appendix J of the EIS
documentation prepared by Hansen Baily for the WACJV. A peer review (conducted by
BDA Group) of the economic assessment was also commissioned by the proponent. The
CIE has been engaged by NSW DPE to peer review the economic assessment presented.
The CIE’s review tests the reasonableness of the CBA undertaken by Gillespie
Economics and its consistency with NSW Government guidelines in relation to
undertaking CBAs. Gillespie Economics has drawn on the NSW Treasury (2007)
Government Guidelines for Economic Appraisal and the NSW Government (2015) Guidelines
for the economic assessment of mining and coal seam gas proposals.
In general we conclude that the CBA has been undertaken in a manner that is broadly
consistent with the 2015 NSW Government guidelines for conducting mining related
applications and the 2007 Guidelines for economic appraisals.
While the analytical approach is broadly consistent, the individual components and
parameter estimates warrant testing. Some of the estimates are difficult to test,
particularly where there is limited publicly available data on, for example, the cost of the
mining operations. Further, the CBA requires Gillespie Economics to develop
assumptions regarding future factors, such as the future price of coal which can change
significantly depending on global market conditions.
Given this, for our review, we have focused on the key factors that drive the results and
can be readily tested. On the benefits side, at a minimum, the NSW Government would
receive royalty payments. On the cost side, there are a range of externalities that need to
be accounted for. In some instances, these externalities have been mitigated (in full) by
the actions of the company. However, there are instances where there are residual
impacts that are not fully mitigated. We have relied on the findings presented in the EIS
documents and NSW Government agency submissions to the process to understand
whether these impacts are likely to be material and would change the conclusion
regarding the quantum of net benefits.
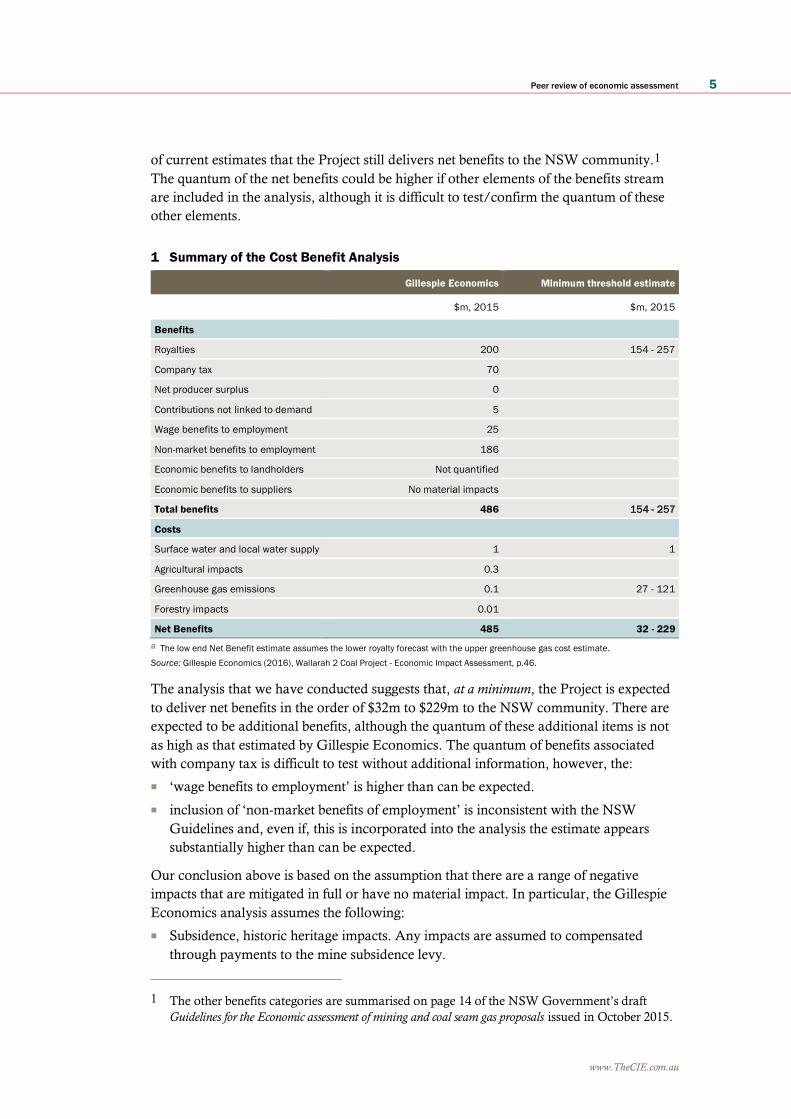
Table 1 presents Gillespie Economics estimates of the net benefits as well as an
alternative lower bound estimate of the net benefits to the NSW community. The lower
bound estimate presented in the table is based on the assumption that the only benefits
are the royalty revenues to the NSW Government from the sale of coal. That is, it
illustrates that even if there are no other public benefits (e.g. tax payments to government,
economic benefit to wage earners) aside from royalties and the costs are at the high end
Peer review of economic assessment 5
www.TheCIE.com.au
of current estimates that the Project still delivers net benefits to the NSW community.1
The quantum of the net benefits could be higher if other elements of the benefits stream
are included in the analysis, although it is difficult to test/confirm the quantum of these
other elements.
1 Summary of the Cost Benefit Analysis
Gillespie Economics Minimum threshold estimate
$m, 2015 $m, 2015
Benefits
Royalties 200 154 - 257
Company tax 70
Net producer surplus 0
Contributions not linked to demand 5
Wage benefits to employment 25
Non-market benefits to employment 186
Economic benefits to landholders Not quantified
Economic benefits to suppliers No material impacts
Total benefits 486 154 - 257
Costs
Surface water and local water supply 1 1
Agricultural impacts 0.3
Greenhouse gas emissions 0.1 27 - 121
Forestry impacts 0.01
Net Benefits 485 32 - 229
a The low end Net Benefit estimate assumes the lower royalty forecast with the upper greenhouse gas cost estimate.
Source: Gillespie Economics (2016), Wallarah 2 Coal Project - Economic Impact Assessment, p.46.
The analysis that we have conducted suggests that, at a minimum, the Project is expected
to deliver net benefits in the order of $32m to $229m to the NSW community. There are
expected to be additional benefits, although the quantum of these additional items is not
as high as that estimated by Gillespie Economics. The quantum of benefits associated
with company tax is difficult to test without additional information, however, the:
■ ‘wage benefits to employment’ is higher than can be expected.
■ inclusion of ‘non-market benefits of employment’ is inconsistent with the NSW
Guidelines and, even if, this is incorporated into the analysis the estimate appears
substantially higher than can be expected.
Our conclusion above is based on the assumption that there are a range of negative
impacts that are mitigated in full or have no material impact. In particular, the Gillespie
Economics analysis assumes the following:
■ Subsidence, historic heritage impacts. Any impacts are assumed to compensated
through payments to the mine subsidence levy.
1 The other benefits categories are summarised on page 14 of the NSW Government’s draft
Guidelines for the Economic assessment of mining and coal seam gas proposals issued in October 2015.

6 Peer review of economic assessment
www.TheCIE.com.au
■ Groundwater, flooding, noise and vibration, biodiversity, visual amenity,
transport/traffic, impacts. The impacts are mitigated in full with the cost of these
activities included in the operating and capital costs of the mine.
■ Air quality, aboriginal heritage. The impacts were assessed to have no material impact
on the evaluation of the Project.
Based on our review of the EIS documentation and submissions, there appear to be a
number of substantive issues raised regarding the potential environmental impacts of the
proposed mine. The Central Coast Council’s submission (dated 16 September 2016), for
example, raised particular concerns regarding impacts on groundwater and surface water.
Based on the proponent’s Response to Submissions (dated November 2016) and the
recent responses by the NSW Government agencies, we understand that actions will be
undertaken to mitigate impacts and that any residual impacts would not materially
change the results of the CBA. This suggests that Gillespie Economics treatment of the
potential social and environmental impacts is reasonable.
The Australia Institute’s submission (dated September 2016) also raised a separate
concern regarding the financial viability of the Project. For the Project, the financial
viability could change the expected company tax revenue of $70m, although even if the
company tax revenue was zero the Project would still generate net benefits due to the
royalty regime.
In addition to this, where a project is no longer financially viable and cannot meet its
ongoing rehabilitation obligations there is the risk that these costs are borne by the
taxpayer, instead of the proponent (as is assumed in the Gillespie Economics’ report).
The NSW Government’s Mining Rehabilitation Security Deposits are designed to avoid
this situation. Under the scheme companies authorised by the NSW Department of
Industry to undertake mining activities must pay a security deposit prior to starting mine
operations. The deposit is designed to cover the full estimated costs of rehabilitation, to
the standard set by their approvals. The Department is responsible for verifying the
adequacy of these rehabilitation cost estimates.

Peer review of economic assessment 7
www.TheCIE.com.au
1 Introduction
In determining a development application, a consent authority must take into
consideration the public interest and the likely impacts of a development. This is done
through a Cost Benefit Analysis (CBA) to estimate the net present value of the project to
the NSW community, and through the local effects analysis to assess the likely impacts of
the development in the locality. This economic assessment forms part of the proponent’s
revised Environmental Impact Statement (EIS), which is required for all state significant
development in accordance with Part 4 of the Environmental Protection and Environment Act
1979 (EP&A Act). In accordance with the EP&A Act, mining activities are considered a
state significant development.
About the project
The Wyong Areas Coal Joint Venture (WACJV) is seeking development consent under
Part 4 of the Environmental Planning and Assessment Act 1979 (EP&A Act) for the
Wallarah 2 Coal Project (the Project).2 The Project is located north-west of Wyong in the
Central Coast Local Government Area in NSW.
The key features of the Project include:
■ The construction and operation of an underground mining operation extracting up to
5.0 Mtpa of export quality thermal coal by longwall methods at a depth of between
350 m and 690 m below the surface within the underground Extraction Area;
■ Mining and related activities will occur 24 hours a day, 7 days a week for a Project
duration of 28 years;
■ Tooheys Road Site (located northeast of the intersection of the M1 Motorway and the
Motorway Link Road) includes a drift portal, coal handling facilities and stockpiles,
water and gas management facilities, small office buildings, workshop, rail spur, train
load out facility and connections to the municipal water and sewerage systems;
■ The Buttonderry Site (located off Hue Hue Road, north of Sparks Road) includes
administration offices, bathhouse, personnel access to the mine, ventilation shafts and
water management structures;
■ Western Shaft Site (located in the Wyong State Forest) includes a downcast
ventilation shaft and water management structures;
■ An inclined tunnel (or “drift”) constructed from the coal seam beneath the
Buttonderry Site to the surface at the Tooheys Road Site;
2 Kores Australia Pty Ltd is the major shareholder and manager of the WACJV, holding 82.25%
of equity. http://www.wallarah.com.au/history-of-the-wallarah-2-project

8 Peer review of economic assessment
www.TheCIE.com.au
■ Connections to the municipal water supply and sewerage systems;
■ Capture of methane, initially for flaring (to manage greenhouse gas emissions) and
later for beneficial use (such as for electricity generation at the Tooheys Road Site);
■ Transport of coal by rail to the Port of Newcastle; and
■ A workforce of approximately 300 full-time company employees.3
The Project has been in fruition over a number of years, with various iterations of the
Project being submitted for development approval over the past decade. A project
application was originally lodged with the Department in late 2006 under the now-
repealed Part 3A of the Environmental Planning and Assessment Act 1979.
In July 2010, the then Minister for Planning directed the Planning Assessment
Commission (PAC) to review the Project. The PAC review report was published in
November 2010. The PAC concluded that “the application may be approved subject to
the imposition of a substantial number of conditions covering the full range of issues”. In
March 2011, the former Minister for Planning refused the application because of
uncertainties in relation to the subsidence predictions, ability to meet acceptable water
quality outcomes, and ecological and heritage impacts.4
A revised development application was submitted to the former Department of Planning
and Infrastructure in October 2012. Although there were similarities between the revised
project and the project reviewed by the PAC in 2010, there were also significant
differences. The differences were intended to address the issues previously raised by the
PAC. The main difference in the design on the mine site was that the current application
excludes the eleven western longwalls that were in steeper terrain under Jilliby State
Conservation Area. A range of additional studies and information was prepared
including:
■ revised subsidence model/predictions with peer review;
■ additional geology report with peer review;
■ revised groundwater and surface water impact assessments;
■ additional boreholes and testing;
■ development of performance measures;
■ adaptive management approach in Extraction Plan process;
■ additional ecological surveys; and
■ additional heritage surveys.5
The PAC published its Review Report (PAC Report) in June 2014 raising a range of
potential concerns about the project and recommending actions to mitigate impacts. The
review noted that
If the recommendations concerning improved strategies to avoid, mitigate or manage the
predicted impacts of the project are adopted, there is merit in allowing the project to proceed.
3 Gillespie Economics (2016), p. 10.
4 PAC (2014), Wallarah 2 Coal Project Review Report, June, p.7.
5 PAC (2014), Wallarah 2 Coal Project Review Report, June, p.10.
Peer review of economic assessment 9
www.TheCIE.com.au
Following the review by the PAC, the Project was the subject of legal proceedings in the
NSW Land and Environment Court initiated by the Darkinjung Local Aboriginal Land.
In light of the Court’s judgment, and in the absence of a negotiated outcome with the
Land Council, coal transportation infrastructure and sewer connection for the Project
was re-designed to avoid land owned by the Council.
The amended application was placed on public exhibition from 22 July 2016 to
5 September 2016. Government agencies and other stakeholders have provided comment
on the amended application. On 23 September 2016, NSW DPE requested that WACJV
respond to concerns raised.6 On 4 November 2016 the proponent has also prepared a
separate document responding to concerns in the submissions.7
Scope of review
The CIE has been engaged by NSW DPE to peer review the economic assessment and
produced by Gillespie Economics, presented in Appendix J of the EIS documentation
prepared by Hansen Bailey for the WACJV. The scope of the review includes:
■ the assumptions relied on are reasonable and appropriate;
■ the cost benefit analysis aligns with current best practice;
■ the assessment is consistent with any relevant Government guidelines; and
■ the assessment contains any deficiencies (eg inconsistencies, contradictions or
information gaps). If so, the report should make recommendations on how to resolve
these in the assessment of the project.
The scope of the review also includes consideration of the criticisms raised by The
Australia Institute’s submission (dated September 2016), on the amended development
application.
6 https://majorprojects.affinitylive.com/public/f04b1037c8832e53b02af2fdd379a75b/01.%2
0Wallarah%202%20Coal%20Project_Amendment%20to%20DA_DPE%20Letter_Request%20
RTS.pdf
7 https://majorprojects.affinitylive.com/public/ec3f9c10395ce29b16f1e1f558a79471/Wallar
ah%202%20Coal%20Project_Amended%20DA%20RTS%20Part%201.pdf

10 Peer review of economic assessment
www.TheCIE.com.au
2 Features of a CBA
A CBA framework is a widely used tool for deciding ex-ante between alternative options
(policies or projects). It allows decision makers to consider trade-offs arising from
different options in order to assist decisions of whether the community as a whole is
better off or worse off by adopting an option.
A CBA framework is focused on the aggregate welfare of the community, rather than the
welfare of individual groups. It should take account of the full range of potential benefits
and costs of the options, including environmental, health and other social impacts as well
as the economic impacts. Where benefits exceed costs, the options are deemed to deliver
a net benefit to the community as a whole. Where costs exceed the benefits, then the
options should be rejected as society is worse-off if the options were implemented. Where
there are a number of options, all of which deliver net benefits (i.e. benefits exceed costs),
then the option that generates the highest net benefit is preferred.
Impacts are often not known with certainty.8 In these circumstances the CBA needs to be
presented as an expected value taking account of the range of possible outcomes (each
with a known probability of occurrence). In some circumstances, not all impacts can be
readily quantified and valued in a robust manner. Decision makers will need to draw on
other information to complement the result of the CBA and to assist in deciding on
whether society is better off from adopting an option.
In conducting this peer review, we have relied on the Government’s NSW Guidelines for
the economic assessment of mining and coal seam gas proposals (December 2015). Technical
notes will support the guidelines and outline methodologies, parameters and assumptions
for the economic assessment. Technical notes are currently unavailable, therefore, the
methods applied in this peer review have relied on the methodologies and assumptions in
the draft Guidelines (October 2015). We have also referred to the 2012 NSW
Government (2012), Guidelines for the use of Cost Benefit Analysis in mining and coal seam gas
proposals, where relevant.
The NSW Guidelines specifies the key features of a CBA in mining and coal seam gas
proposals, as summarised in Box 2.1.
8 For the purposes of our analysis we use the term risk and uncertainty interchangeably. In
theory, risk refers to events where a probability distribution can be developed whereas
uncertainty refers to situations where the probability of outcomes cannot be estimated.

Peer review of economic assessment 11
www.TheCIE.com.au
2.1 Key features of a CBA9
■ Scope – A CBA should include all first round (primary) impacts both direct and
indirect but not secondary impacts.
■ Discount rate - A discount rate of 7 percent per annum with sensitivity testing at 4
per cent and 10 per cent per annum.
■ Timeframe - A term that reflects the time horizon of the impacts of a proposal.
Long-term mining projects should use a 30-year timeframe from when the mine
became operational and where applicable a residual value beyond that timeframe.
■ Risk and Uncertainty - A ‘risk neutral’ approach to expected costs and benefits.
■ Unquantified factors – Decisions based on the quantified expected net benefits in
conjunction with information on any impacts that cannot be valued.
9 NSW Government (2015) Guidelines for the use of Cost Benefit Analysis in mining and coal seam gas
proposals, December, page 4.

12 Peer review of economic assessment
www.TheCIE.com.au
3 Review of CBA
This chapter reviews key elements of the CBA conducted by Gillespie Economics.
Scope of the CBA
The NSW Government Guidelines provide the following guidance for defining the scope
of the CBA:10
These benefits and costs should be estimated where possible as those that accrue to New South
Wales. In the first instance, it will generally be most practical to assess all major costs and
benefits to whoever they accrue and then adjust to estimate the proportion of these attributable
to residents of the State.
There are two types of analysis presented by Gilliespie Economics.
■ The main body of the CBA presents the first round effects of the Project from the
perspective of NSW residents in most cases by virtue of the fact that the majority of
external costs only affect residents near the mine and presents the direct impact only.
The majority of the net producer surplus does not go to the NSW as the majority of
ownership of the mining companies is foreign.
■ The regional impact Analysis attempts to incorporate second round, or indirect
effects, of the Project along with the CBA findings to disaggregate costs and benefits
at the LGA level, the State level and the “rest of world” level.
The scope defined in the Gillespie report is reasonable and is consistent with the NSW
Government Guidelines, although there are some issues raised in regards to the
estimation of the quantum of benefits (noted later in this report).
Project definition
The Project has been defined as the construction and ongoing operation of a new coal
mine, producing thermal coal for the export market. The Project also includes ancillary
activities such as the coal handling facilities and stockpiles, water and gas management
facilities, small office buildings, workshop, rail spur, train load out facility and
connections to the municipal water and sewerage systems.
The Project has been defined at a detailed level to enable a robust assessment to be
undertaken.
10 NSW Government (2012), Guidelines for the use of Cost Benefit Analysis in mining and coal seam
gas proposals, November, page 5.

Peer review of economic assessment 13
www.TheCIE.com.au
Alternative options
The EIS presents the findings in relation to a single option. The economic assessment is
conducted for this option and the base case (or status quo). Having said this, there have
been several amendments to the Project over the past few years in order to address issues
raised in the previous reviews of the earlier submissions.
Notwithstanding this, the economic analysis does not specifically put forward a range of
alternatives to be evaluated in the modelling. Given this, the analysis does not present a
ranking of alternative projects.
Timeframe and discount rate
The analysis presents the impacts in a discounted cashflow framework over the
timeframe for the Project (production commencing from 2020 to 2045). A 7 per cent real
discount rate is adopted for the main part of the analysis and alternative sensitivity testing
using discount rates of 4 per cent and 10 per cent were conducted, consistent with the
NSW Treasury Guidelines.
Estimated Benefits
Gillespie Economics estimates the benefits of the Project at $486m. The key components
of the benefits are royalties ($200m), non-market benefits of employment ($186m),
company tax ($70m) and wage benefits to employees ($25m).
Royalties
The royalties received by the NSW Government in the future depends on the future
production from the mine as well as the price received for the coal. A proportion of this
future value is received by the state as a royalty payment. The royalty rate applied
depends on whether the coal is extracted from underground or an open cut mine.
Deductions may also apply.
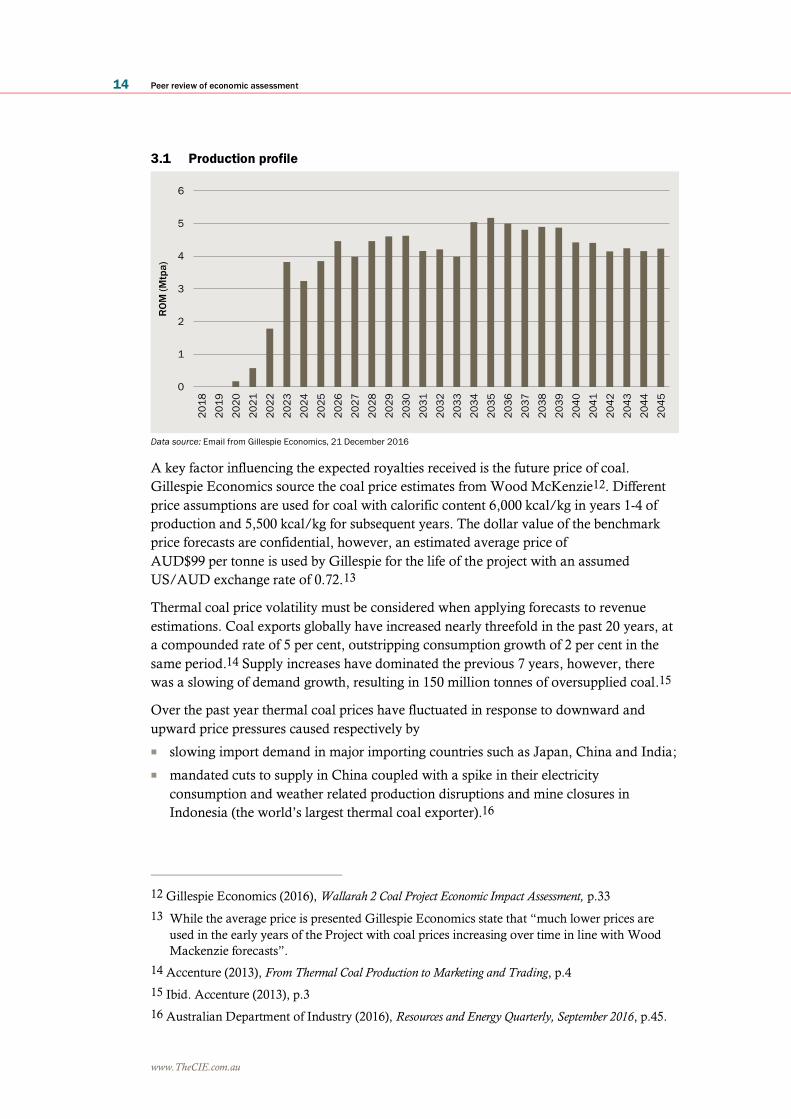
The future production profile from the mine is largely determined by a range of physical
factors (e.g. the location of the coal) as well as other factors such as the demand for the
coal and the expectations of future commodity prices. The expected production profile
from the mine is presented in chart 3.1. On average, the mine expects to extract 4 million
tonnes per annum. Gillespie Economics assumes that 100 per cent of the ROM coal will
be ‘converted’ into saleable coal.11
11 Gillespie Economics, email dated 21 December 2016.
14 Peer review of economic assessment
www.TheCIE.com.au
3.1 Production profile
Data source: Email from Gillespie Economics, 21 December 2016
A key factor influencing the expected royalties received is the future price of coal.
Gillespie Economics source the coal price estimates from Wood McKenzie12. Different
price assumptions are used for coal with calorific content 6,000 kcal/kg in years 1-4 of
production and 5,500 kcal/kg for subsequent years. The dollar value of the benchmark
price forecasts are confidential, however, an estimated average price of
AUD$99 per tonne is used by Gillespie for the life of the project with an assumed
US/AUD exchange rate of 0.72.13
Thermal coal price volatility must be considered when applying forecasts to revenue
estimations. Coal exports globally have increased nearly threefold in the past 20 years, at
a compounded rate of 5 per cent, outstripping consumption growth of 2 per cent in the
same period.14 Supply increases have dominated the previous 7 years, however, there
was a slowing of demand growth, resulting in 150 million tonnes of oversupplied coal.15
Over the past year thermal coal prices have fluctuated in response to downward and
upward price pressures caused respectively by
■ slowing import demand in major importing countries such as Japan, China and India;
■ mandated cuts to supply in China coupled with a spike in their electricity
consumption and weather related production disruptions and mine closures in
Indonesia (the world’s largest thermal coal exporter).16
12 Gillespie Economics (2016), Wallarah 2 Coal Project Economic Impact Assessment, p.33
13 While the average price is presented Gillespie Economics state that “much lower prices are
used in the early years of the Project with coal prices increasing over time in line with Wood
Mackenzie forecasts”.
14 Accenture (2013), From Thermal Coal Production to Marketing and Trading, p.4
15 Ibid. Accenture (2013), p.3
16 Australian Department of Industry (2016), Resources and Energy Quarterly, September 2016, p.45.
0
1
2
3
4
5
62
01
8
20
19
20
20
20
21
20
22
20
23
20
24
20
25
20
26
20
27
20
28
20
29
20
30
20
31
20
32
20
33
20
34
20
35
20
36
20
37
20
38
20
39
20
40
20
41
20
42
20
43
20
44
20
45
RO
M (
Mtp
a)

Peer review of economic assessment 15
www.TheCIE.com.au
The Department of Industry’s March 2016 quarterly report forecasted a continual fall in
price, culminating in an estimated benchmark price of US$59 a tonne for the Japanese
financial year (JFY) March 2016 to April 2017.17 The actual price settled by Glencore
and Japanese utility Tohoku Electric Power was marginally higher than expectations at
US$61.60 a tonne.18
Thermal coal prices rose further than anticipated in the September 2016 quarter reaching
a two-year high of US$70 a tonne19. This comes off the back of a declining coal price
trend starting in early 2011 as shown in chart 3.2. The JFY 2017 price is forecast to rise
to US$64 a tonne.20 Based on the AUS/USD exchange rate of 0.72, forecast prices in
2017 would be around A$88.89 per tonne.
3.2 Thermal Coal Spot Prices
Data source: Australian Department of Industry, (2015) Resources and Energy Quarterly, September 2016, p.45.
In the 2015 assessment of the Mount Owen mine extension the NSW Department of
Trade and Investment estimated short and medium to long-term thermal coal prices of
$A97 to $117 per tonne respectively.21
The Australia Institute’s submission (dated September 2016) notes that in 2014 the
Australian Treasury forecast long term thermal coal prices to be around AUD
$80 per tonne.
Coal prices are subject to further variation caused by movements in the AUD/USD
exchange rate. This past year the Australian dollar traded at a low of 0.69 US cents on 20
January 2016 and a peak of 0.78 US cents on 21 April 2016, as shown in figure3.3.
17 Australian Department of Industry (2015), Resources and Energy Quarterly, March 2016, p.58.
18 Australian Department of Industry (2015), Resources and Energy Quarterly, June 2016, p.44.
19 Ibid. Australian Department of Industry (2016), p.45
20 Ibid. Australian Department of Industry, (2016) p.45.
21 NSW Department of Trade and Investment 2015, Mount Owen continued operations project (SSD
5850) Review of Environmental Impact Assessment, OUT 15/4442, Sydney. Letter dated 9 March
2015.
0
20
40
60
80
100
120
140
160
Sep-11 Sep-12 Sep-13 Sep-14 Sep-15 Sep-16
US
$ a
to
nn
e
Newcastle 6000kcal Richards Bay 6000kcal QHD 5800kcal
16 Peer review of economic assessment
www.TheCIE.com.au
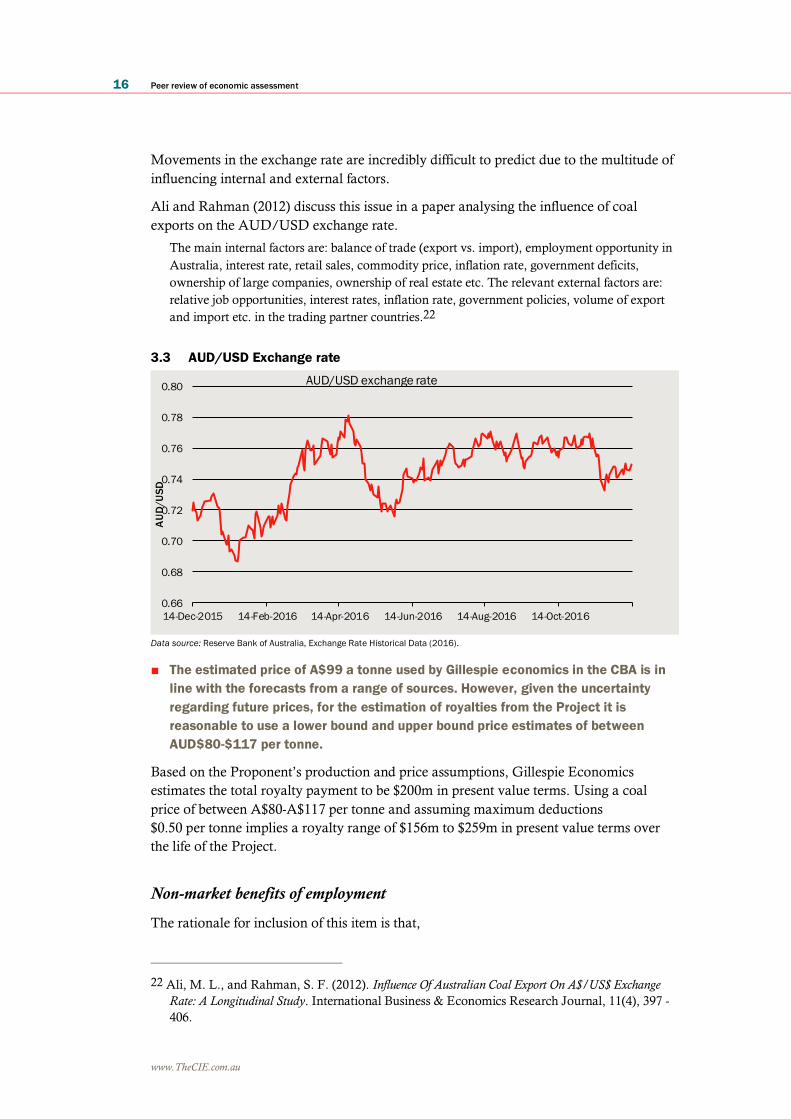
Movements in the exchange rate are incredibly difficult to predict due to the multitude of
influencing internal and external factors.
Ali and Rahman (2012) discuss this issue in a paper analysing the influence of coal
exports on the AUD/USD exchange rate.
The main internal factors are: balance of trade (export vs. import), employment opportunity in
Australia, interest rate, retail sales, commodity price, inflation rate, government deficits,
ownership of large companies, ownership of real estate etc. The relevant external factors are:
relative job opportunities, interest rates, inflation rate, government policies, volume of export
and import etc. in the trading partner countries.22
3.3 AUD/USD Exchange rate
Data source: Reserve Bank of Australia, Exchange Rate Historical Data (2016).
■ The estimated price of A$99 a tonne used by Gillespie economics in the CBA is in
line with the forecasts from a range of sources. However, given the uncertainty
regarding future prices, for the estimation of royalties from the Project it is
reasonable to use a lower bound and upper bound price estimates of between
AUD$80-$117 per tonne.
Based on the Proponent’s production and price assumptions, Gillespie Economics
estimates the total royalty payment to be $200m in present value terms. Using a coal
price of between A$80-A$117 per tonne and assuming maximum deductions
$0.50 per tonne implies a royalty range of $156m to $259m in present value terms over
the life of the Project.
Non-market benefits of employment
The rationale for inclusion of this item is that,
22 Ali, M. L., and Rahman, S. F. (2012). Influence Of Australian Coal Export On A$/US$ Exchange
Rate: A Longitudinal Study. International Business & Economics Research Journal, 11(4), 397 -
406.
0.66
0.68
0.70
0.72
0.74
0.76
0.78
0.80
14-Dec-2015 14-Feb-2016 14-Apr-2016 14-Jun-2016 14-Aug-2016 14-Oct-2016
AU
D/U
SD
AUD/USD exchange rate

Peer review of economic assessment 17
www.TheCIE.com.au
….there may also be spillover effects and externalities to third parties. These are public good
values. Spill-over effects referred to in the literature relate to empathy based losses to family or
friends (close associates) of impacted workers because of the workers being unemployed and
increased crime and community dislocation (Haveman and Weimer 2015: Streeting and
Hamilton 1991). Empathy based impacts may also spill over more broadly into the existence
values of others in the community who feel sympathy for the unemployed.23
Gillespie Economics estimated the non-market value of employment at the Project to be
$186 million (in present value terms).24 This is based on an average non-market value of
approximately $25 000 per employee per year transferred from a choice modelling study
conducted by Gillespie Economics in 2009.25
The reported values reflect empathy values “because of the workers being unemployed
and increased crime and community dislocation”. However, as the BDA Group points
out, the context of a fully employed economy may not be as pertinent.26 The Gillespie
Economics analysis does not appear that consideration has been given to the existing
employment status of the employees, nor the impacts of potential ‘crowding out’ of
existing jobs.
To put this non-market value into perspective, if the value of $25 000 per mining
employee per year was applied to all workers in the mining industry (approximately
40 000 in NSW) 27, the total non-market benefit of employment in the mining industry
would be approximately $1 billion per year. It seems unrealistic that NSW residents are
willing to pay $1 billion per year (equivalent to $350 per household per year) to attain the
non-market benefit of mining employment. As a comparison, if 20 per cent of mining
employees would otherwise have been unemployed, the avoided cost of unemployment
benefits, paid indirectly by households through tax revenue, would be equal to
approximately $40 per household per year, significantly lower than $350 per household
per year.
Gillespie Economics recognise that the inclusion of this benefit category is contentious
and have, therefore, reported the results ‘with and without’ the inclusion of these
benefits. The inclusion of this category of benefits is also inconsistent with NSW
Government (December 2015) Guidelines.
■ Given the highly contentious nature of these estimates, the CIE recommends the
estimated non-market value of employment is excluded from the economic
analysis of the Project.
23 Gillespie Economics (2016), p.40.
24 Based on 300 employees over 25 years
25 Gillespie Economics, 2009, Bulli Seam Operations: Choice Modelling Study of Environmental and
Social Impacts, Prepared for Illawarra Coal Holdings Pty Ltd.
26 BDA Group (2016), Economics Peer Review, p.4.
27 NSW Mining, Fast Facts, http://www.nswmining.com.au/industry/fast-facts

18 Peer review of economic assessment
www.TheCIE.com.au
Company tax
The other key benefits are associated with the distribution of company taxes (paid to the
Australian Government) allocated to NSW level, estimated at $70 million in present
value terms.
Company tax from the Project was estimated based on a discounted cash flow analysis of
the Project adjusted for depreciation, and the application of a 30 per cent tax rate to
estimated taxable income.28 32 per cent of the estimated company tax generated from the
Project is attributed to NSW.29
The Australia Institute (September 2016), on the other hand, argues that the mine is not
expected to be financially viable. It quotes the operating costs of mines in Australia and
abroad, arguing that the stated operating costs of the Project are not credible. It also notes
that
Given the complexities involved in company tax payments, particularly with large companies
with offshore entities, this is inappropriate and almost certainly serves to overestimate the
benefits of the project. Mining companies have a huge array of ways to minimise company tax
payments and this calculation should be shown in detail.30
■ Given the complexities of potential tax arrangements and the need for detailed
(potentially confidential) information we have not sought to test the estimates
presented in Gillespie Economics analysis. The estimates could, therefore, be seen
as an upper bound estimate of the benefits associated with company tax
payments.
Wage benefits to employees
Workers in the mining project who would otherwise be unemployed, working part-time
or working in other non-mining sectors may gain higher wages than they would without
the project. This is a labour/wage premium and represents a gain to these workers. The
cost benefit framework outlined in the NSW Government guidelines recognises this as a
potential gain to be included in a CBA.
Gillespie Economics include this gain and state that,
Following the approach of Streeting and Hamilton (1991) if it were assumed that 50% of the
direct workforce of the Project (150 out of a total of 300 jobs) would otherwise be unemployed
for three years and that the reservation wage for these people was $52,000 compared to a
mining wage of $134,000, then the market employment benefit in terms of income would be
$25M present value, at a 7% discount rate.31
28 Gillespie Economics (2016), p.42.
29 Gillespie Economics (2016), p.45.
30 The Australia Institute (2016), p.11.
31 Gillespie Economics (2016), p.40.

Peer review of economic assessment 19
www.TheCIE.com.au
In theory, the economic benefit to workers is the difference between the wage that he or
she is paid in the mining project and the minimum (reservation)32 wage at which they
would be ‘indifferent’ to working in the mining sector (chart 3.4).33 The minimum wage
reflects the employment opportunity costs, skill level required and the relative disutility of
an employment position. However, in practice, minimum (reservation) wages are not
observable.
3.4 Identifying the economic benefit to workers
Data source: The CIE.
Further, in theory, a CBA for NSW should include the economic benefit to workers
already residing in NSW prior to the project (the base case). The economic benefit to
workers migrating to NSW should not be included in the CBA for NSW. The estimate
should be based on the proportion of NSW resident and non-NSW resident workers to be
employed by the project for the purposes of attribution.
In practice, measuring the wage premium is challenging. In a 2016 study for the
Department the CIE sought to estimate the benefits to mining workers based on available
data. The CIE found that:
■ an increase in mining employment increases the mining wage, showing that there are
worker benefits.
■ the impact of mining employment on the mining wage differs across remoteness
areas.
■ the positive effect of a change in mining employment on mining income declines as
the initial share of mining employment increases.
32 The reservation wage is the minimum wage a worker has to be paid to work in a particular
industry. In view of the hours of work and working conditions, there is a reasonable possibility
that workers’ reservation wages in mining are higher than in other industries. and take into
account hours of work and working conditions.
33 NSW Government (2015), draft Guidelines for the economic assessment of mining and coal seam gas
proposals, October, p. 20.
0
10
20
30
40
50
60
70
80
90
100
Minimum wage required in
non-minng sector
Minimum wage required in
mining sector
Wage from proposed mining
project
Wa
ge
('0
00
)
Economic
benefit to worker
Wage difference
due to skills and
disutility to work
in mining
industry
Opportunity cost
of labour (non-
mining sector)

20 Peer review of economic assessment
www.TheCIE.com.au
■ the positive effect of a change in mining employment on mining income declines as
the initial unemployment rate increases.34
The paper estimated the benefits to mining workers in terms of a proportional change in
the mining wage in response to a 100 per cent change in mining employment (table 3.5).
For example, a 100 per cent increase in mining employment in Inner Regional Australia
will increase the mining wage by 10.7 per cent.
3.5 Mining income/Mining employment elasticity by remoteness area
Remoteness area Elasticity
per cent
Major cities of Australiaa 0
Inner regional Australia 10.7
Outer regional Australia 5.8
Remote Australia 4.3
Very remote Australiaa 0
a The estimated elasticities for Major Cities of Australia and Very Remote Australia were -1.7 and -6.7 respectively. However, we have
assumed the elasticity to be 0 in these two remoteness areas due to limited constraints on labour supply for new mines due to
minimal mining activity in Major Cities of Australia and the fly-in fly-out labour market servicing Very Remote Australia.
Note: The wage premium due to changes in mining employment may be underestimated as the modelling is based on ABS income
data which specifies the highest income bracket of “$2500 plus”. Conversely the estimate is slightly biased upwards because the ABS
income estimate includes all income sources, not just income from direct employment.
Source: The CIE based on ABS data.
Using this information the benefits associated with the wage premium can be
approximated as follows:
■ The mine is located near Wyong which we consider to be in Inner Regional Australia.
The mining income/mining employment elasticity estimated for Inner Regional
Australia is 10.7 per cent for a 100 per cent increase in mining employment.
■ Based on the Gillespie Economics report (p.55) there were 1,972 employed in the
mining sector in the local area which is defined as the Gosford, Wyong and Lake
Macquarie LGAs. If the Project will employ on average 300 additional persons over
the life of the Project which is equivalent to a 15 per cent increase in mining
employment in the local area.35
■ Assuming a pre-tax mining wage of $130,000 per annum, the 15 per cent increase in
mining employment as a result of the Project would increase the average mining wage
to around $132,116 per annum assuming a 10.7 per cent income/employment
elasticity. That is, the wage premium per worker for the Project is $2,116.
■ The total economic benefit to workers of the Project is equivalent to the wage
premium per worker ($2,116) multiplied by the number of NSW based workers
34 CIE (2016), Economic benefits of mining projects for NSW: Estimating default values for indirect
economic benefits, January.
35 If the local area was expanded to include Singleton, Cessnock and Newcastle the incremental
proportional effect of the Project on mining employment would be substantially less. However,
for the purposes of this illustration we have adopted Gillespie Economics assumption of 1,971
persons employed in the mining sector.

Peer review of economic assessment 21
www.TheCIE.com.au
employed in the Project. Assuming that all workers employed in the Project are NSW
based, the economic benefit to mining workers is around $635,000 per annum (even
without adjustment to capture disutility of marginal workers entering the mining
industry. Over the life of the Project this is equivalent to around $7.4m in present
value terms. However, once adjusting for the disutility of marginal workers entering
the mining industry the benefit is closer $3.7m in present value terms.
The approach described above provides an approximation of the potential impacts on the
mining wage. In order to refine this analysis further additional detailed information is
required on, for example, the current unemployment rates in the area and evidence that
the new mine would draw labour from the currently unemployed.
■ The analysis above provides an indication of the ‘orders of magnitude’ that can be
expected associated with the benefits attributable to the wage premium. For the
purposes of the CBA, and in the absence of more detailed data on the labour force
in the area, it reasonable to assume that the benefit attributable to the wage
premium is between $3.7m to $7.4m in present value terms.
Estimated costs
The Gillespie Economics report assumes that there are a range of negative impacts that
are mitigated in full or have no material impact. In particular, the Gillespie Economics
analysis assumes the following:
■ Subsidence, historic heritage impacts. Any impacts are assumed to be compensated
through payments to the mine subsidence levy. Gillespie has not specified the exact
cost of contribution to the mine subsidence levy, only stating it is between $0.00132 to
$0.39006.36
■ Groundwater, flooding, noise and vibration, biodiversity, visual amenity,
transport/traffic, impacts. The impacts are mitigated in full with the cost of these
activities included in the operating and capital costs of the mine.
■ Air quality, aboriginal heritage. The impacts were assessed to have no material impact
on the evaluation of the Project.
The analysis, therefore, focuses on the quantification of a number of unmitigated impacts
relating to:
■ Surface water and local water supply
■ Greenhouse gas emissions
■ Agricultural impacts
■ Forestry impacts
For the purpose of our review, we have focused on the surface water and greenhouse gas
emissions as these are expected to result in the largest cost item.
36 Gillespie Economics (2016), Wallarah 2 Coal Project Economic Impact Assessment, p.101

22 Peer review of economic assessment
www.TheCIE.com.au
Water
Underground mining presents various risks to the groundwater system. However,
through monitoring and management these impacts can be mitigated and minimised.
The Project is predicted to have impacts on both shallow and deep groundwater systems,
however, these impacts are expected to be minimal and will be managed by the WACJV
Groundwater Monitoring Plan. The Groundwater Impact Assessment (GIA) predicts
minor seepage at the alluvial aquifers of the Yarramalong and Dooralong valleys and the
shallow hardrock areas of 2 mililitres/m2/day and 4 mililitres/m2/day respectively. By
comparison, average rainfall is expected to be 130 millilitres/m2/day and as a result will
replenish water losses from seepage.37
The WACJV will obtain water access licences (WALs) for 300ML to mitigate the effects
of subsidence on the alluvial groundwater system and reduce runoff contributions while
affected areas equilibrate to near normal conditions. Gillespie assumes a market value of
$2,000/ML for the WALs, resulting in a total cost for the 300 WALs to be $0.6M.38
Based on our review of historical prices presented by the National Water Commission
and some recent observed groundwater trades, the price assumption used by Gillespie is
reasonable.39
Notwithstanding this, the WACJV currently holds an entitlement of 185 units/ML in the
Jilliby Creek Water Source and is requested by DPI water report any updates on the
water licensing strategy.40
The WACJV will be required to acquire appropriate licences for the extraction of
groundwater under part 5 of the Water Act 1912. However, this is expected to be
negligible, as the majority of groundwater will be sourced from the coal seam or the deep
overburden strata within the fractured zone.41 Gillespie reports that within the Jilliby
Jilliby Water Source and the Wyong Water Source, exist sufficient transferrable licences
to purchase.42 Excess treated water produced by the project will be provided to the
Central Coast Water Authority to offset potential impacts on catchment yield.43
The water treatment plant will produce brine as a by-product of the reverse osmosis
process, which will be dewatered and stored in an underground sump. The WACJV in
conjunction with EPA and DPI water will prepare a Brine Treatment Management Plan
prior to construction of the surface facilities. The underground mine will act as a
groundwater sink for approximately 500 years and as a result will inhibit the movement
37 Gillespie Economics (2016), Wallarah 2 Coal Project Economic Impact Assessment, p.12
38 Ibid, Gillespie, p.36
39 National Water Commission (2014), Australian water markets: trends and drivers 2007–08 to
2012–13, p.32.
40 Department of Primary Industries (2016), Comment on the Environmental Impact Statement,
attachment A
41 Ibid, Gillespie, p.12
42 Ibid, Gillespie, p.12
43 Ibid, Gillespie, p.15

Peer review of economic assessment 23
www.TheCIE.com.au
of the highly salty brine.44 Consequently, the brine is not expected to have a measureable
impact on water quality.
Twelve bores have been identified within the project footprint that may be affected by
either loss of pressure head or loss of structural integrity. According to the EIS
documents these bores can be repaired or re-drilled without loss of yield.45
Based on the proponent’s Response to Submissions (dated November 2016) and the
recent responses by the NSW Government agencies, we understand that actions will be
undertaken to mitigate impacts and that any residual impacts would not materially
change the results of the CBA.
■ The impact of the project on water supply and quality has been adequately
mitigated through the collaborated creation of monitoring and management plans.
Greenhouse gas
In its review of air pollution, Pacific Environment estimates that the project will generate
5.7 million tonnes (Mt) of scope 1 and 2 and 0.3 Mt of scope 3 emissions from mining
and transport of product coal by rail to the port.
3.6 Predicted Greenhouse Gas Emissions
Class of Emissions Greenhouse gas emissions
t CO2e
Scope 1 4,643,044
Scope 2 1,061,990
Scope 3 256,026,932
a For the purpose of the CBA, Gillespie Economics (p.39) assumes that only 0.3 Mt of scope 3 emissions associated with rail transport
of coal to port are included
Source: Pacific Environment Limited (2016), Air Quality and Greenhouse Gas Assessment - Addendum, p.49
In order to calculate the cost of the emissions, Gillespie uses three shadow prices, the
Forecast European Union Emission Allowance Units price, the Australian Treasury
Clean Energy Future Policy Scenario and the US EPA Social Cost of Carbon.
The NSW Energy Saving Scheme46 suggests using the Forecast European Union
Emission Allowance Units price forecasts while using the other prices to test sensitivity.
Using these prices, the present value of emissions for the project is between $27m and
$121m.
44 Ibid, Gillespie, p.14
45 Mackie Environmental Research (2013), Groundwater Impact Assessment, p.4
46 NSW (2015), Review of the NSW Energy Savings Scheme: Part 2: Options Paper, Page 128.

24 Peer review of economic assessment
www.TheCIE.com.au
3.7 Alternative estimates of the economic cost of greenhouse gas emissions
Carbon Price Total Cost Australian percentage of
World population
NSW percentage of
Australian population
$’m, present value $’m, present value $’m, present value
European Unit Price 26.6 0.08 0.03
EPA Social Cost of Carbon 47.0 0.14 0.05
Australian Treasury 120.8 0.36 0.12
Note: There are some minor differences between the costs presented in Gillespie Economics p.39 and that calculated by the CIE using
available data.
Source: Gillespie Economics, verified by The CIE.
Gillespie makes the argument that the cost of emissions should be scaled downwards as
Australia comprises 0.3% of the world population and NSW 32% of that. This results in a
cost estimate of between $25,000 and $114,000 (in present value terms).
This approach is inconsistent with the 2015 draft guidelines, which require the attribution
of the full cost (i.e. between $27m and $121m). Having said this, we recognise that there
is debate in the economic literature regarding the extent to which the global social cost of
carbon is appropriate for the use in the benefit cost analysis of domestic policy options.47
Nevertheless, irrespective of whether the costs associated with greenhouse gas emissions
(under all price scenarios) are allocated in full to NSW or only a portion is allocated to
NSW this does not change the conclusions.
■ The economic cost of greenhouse emissions ranges from between $27m and
$121m, assuming 100 per cent of the impacts from greenhouse gas emissions are
allocated to NSW.
Other impacts
There are a range of other potential impacts arising from the Project.
Air Quality
Impacts on air quality are relatively low as the project is an underground mine. Dust
emissions are primarily the result of the following operations; coal stockpiling, coal
transfers by conveyor, coal loading and rail movements.
Emissions from construction are projected to be 84%, 48% and 22% of the emissions
estimated to occur during the operational phase of the project for TSP, PM10 and PM2.5
respectively.48 As a result, compliance during the operational phase will extend
throughout the Project.
The assessment of incremental PM10, PM2.5, TSP and dust deposition at the closest
residential receptors found all levels to be below impact assessment criteria49. The
47 See for example Kotchen, M (2016), Which Social Cost of Carbon? A theoretical Perspective,
National Bureau of Economic Research, May, Working Paper 22246,
http://www.nber.org/papers/w22246
48 Pacific Environment Limited (2016), Air Quality and Greenhouse Gas Assessment - Addendum, p.v
49 Ibid, Pacific Environment Limited, p.v

Peer review of economic assessment 25
www.TheCIE.com.au
WACJV will implement emission reduction strategies in line with best practice controls
based off the recommendations of the NSW Coal Mining Benchmarking Study: International
Best Practice Measures to Prevent and/or Minimise Emissions of Particulate Matter from Coal
Mining50, a study commissioned by the EPA. Furthermore, the existing high volume air
samplers will be augmented or replaced by a continuous monitoring instrument at a
location representative of receivers susceptible to short term dust elevations.
Emissions to air associated with the flaring of methane have been assessed and shown to
have minor cumulative affects when added to existing background levels.
The Air Quality Greenhouse Gas Assessment has identified one privately owned receiver
in the vicinity of the Buttonderry site who could experience ground level concentrations
(glcs) of above the assessment criteria of 2 odour units (OU). According to the Approved
Methods for the Modelling and Assessment of Air Pollutants in New South Wales51, the
acceptable levels of OU range from 2 to 7, for dense urban populations to single rural
residences respectively. Accordingly, the 3 OU prediction for the private residence would
be acceptable as they reside in a non-urban environment.
■ Gillespie has outlined all potential impacts on air quality and found there to be no
impact above assessment criteria. There is one incident of glcs above the
assessment criteria however it is within the acceptable limits for a rural residence.
NSW Government agencies that regulate air quality impacts have not raised major
concerns regarding potential unmitigated impacts arising from air pollution.
Impact on other landholders
A key part of controversy around the Wallarah 2 project has been its potential impacts on
land owned by the Darkinjung Local Aboriginal Land Council (DLALC) and the various
developments existing and planned for this area. The Australia Institute argues that the
economic assessment includes no consideration of costs that might be imposed on the
Darkinjung in either the CBA or the local effects analysis.
In the Department’s letter (dated 23 September 2016) to WACJV seeking its response to
submissions,
The Department acknowledges the Darkinjung LALC as a significant landholder of land
surrounding the proposed amendment area. The Department considers that the interests of the
Darkinjung LALC in regards to its land surrounding the amendment proposal have not been
adequately considered in the ElS. Further detailed information regarding proximity of these
land parcels to the proposed coal infrastructure, and potential noise, air quality and visual
impacts should be provided. As discussed in Section 4, photomontages of the proposed coal
infrastructure as potentially viewed from these parcels of land should be provided.
In its Response to Submissions, WACJV argues that there is no clear evidence that the
land owned by the DLALC has been identified as land proposed for residential
50 Donnelly, S et al (2011), Prepared by Katestone Enivironmental Pty Ltd for Office of
Environment and Heritage June 2011. “NSW Coal Mining Benchmarking Study: International Best
Practice Measures to Prevent and/or Minimise Emissions of Particulate Matter from Coal Mining”
51 NSW Department of Environment and Conservation (2005), “Approved Methods for the
Modelling and Assessment of Air Pollutants in New South Wales”
26 Peer review of economic assessment
www.TheCIE.com.au
development. This conclusion is based on the proponents interpretation of the following
documents: the Wyong Shire Settlement Strategy 2013, the North Wyong Shire Structure
Plan 2012 and the Central Coast Regional Plan 2036.
■ We are unaware of any evidence to suggest that the land will be developed for
residential properties in the short to medium term. On this basis, the approach
adopted in the economic analysis is reasonable.
Transmission Lines
The project underlies two 330kV transmission lines and 29 associated towers owned by
Transgrid. Mining induced horizontal loads can impact the towers bay length. The
WACJV in conjunction with Transgrid are developing a mitigation strategy whereby
protective measures are being fitted to the towers.
Two tension towers (21-44-T and 22-52-T) have large deviation angles and as a result
cannot be safeguarded by the previous mitigation strategy.52 In a last choice scenario the
coal surrounding the towers can be sterilised, thereby safeguarding the area, although
reducing the coal yield.
A mine subsidence management committee has been recommended by the MSEC, to be
formed between the WACJV, Transgrid and the MSB. The purpose of the committee is
to oversee the development of a contingency plan in the event the affected towers cannot
be resolved with altered development patterns.
The towers will not be undermined in the first 20 years of the project, which provides the
committee time to test alternative safeguarding strategies for the towers as well as
conduct ground movement monitoring.53
The economic cost of this contingency has not been quantified by Gillespie. The WACJV
has agreed to bear the costs of any mitigation and management measures to reduce the
impact of subsidence on the towers.54 The impact of coal sterilisation can be quantified
by using the Gillespie sensitivity analysis. A 30 per cent reduction in the volume of coal
(from year 2040 onward), reduces the royalty revenue from $154m to $151m (based on
the lowest price forecast). The cost of works in the process agreement would be negligible
in respect of the projects entirety.
■ While the estimated cost of mitigating the Transgrid towers in unknown, a 30%
decrease in the volume of coal after the first 20 years of the Project reduces the
expected royalty revenue to $151m (based on the lowest price forecast).
52 Mine Subsidence Engineering Consultants (2013), “Subsidence Predictions and Impact
Assessments” p.98
53 Ibid, MSEC, p.100
54 Ibid, EIS, p.11

Peer review of economic assessment 27
www.TheCIE.com.au
Financial viability and rehabilitation costs
In its submission, The Australia Institute has raised concerns regarding the financial
viability of the Project. It notes that
…..many coal projects are being delayed or abandoned in NSW and beyond. Many coal
companies are in financial distress, with several filing for bankruptcy protection in the USA,
including former major company Peabody Energy. Existing coal mines are being traded at
peppercorn prices in Australia and shares in operating mines can be bought cheaply. It is highly
unlikely in this environment that a company would invest in a new, deep-underground
greenfields thermal coal mine, particularly one with so much political and environmental
controversy surrounding it. (p.6)
The financial viability can impact on the profitability of the mine, impacting on the
expected revenue from company taxes. The financial viability of a project could also has
implications for who bears the rehabilitation costs of the project.
The site remediation costs of the mine are assumed to be met by the proponent. Where a
proponent is in financial stress there is a bond held that is intended to cover the full
remediation liability. To the extent that the bond does not cover the full remediation
costs, or where these obligations can be avoided, these liabilities are likely to fall on the
public. If this occurred it could significantly reduce the net benefits derived from the
project.
The security amount is determined and held by DRE to provide and maintain security
funding for the DRE to fulfil obligations in the event that the title is cancelled or the
titleholder fails to comply with rehabilitation requirements. The deposit is calculated in
accordance with the Rehabilitation Security Deposits Policy55 and environmental
guidelines for rehabilitation56.
While we have no reason to suggest that the mining bond is insufficient to meet the
rehabilitation cost, we note that in its recent report Performance Audit Program 2016–17 to
2018–19, the Auditor General has noted that it will be auditing
……. whether the Department maintains adequate security deposits to cover the liabilities
associated with mining rehabilitation, including the decommissioning of infrastructure and any
long term post-closure management requirements.57
In this context, the Government needs to be satisfied that the mining bond is sufficient to
cover any potential liabilities arising from the Project and if there are any shortfalls that
this it is not of sufficient scale to substantially alter the estimate of net benefits.
■ For the purposes of our review we assume that the security bond held is sufficient
to ensure that any future liability associated with the Project can be appropriately
managed in the event of adverse financial position of the company.
55 http://www.resourcesandenergy.nsw.gov.au/miners-and-explorers/rules-and-
forms/pgf/environmental-policies
56 http://www.resourcesandenergy.nsw.gov.au/miners-and-explorers/rules-and-
forms/pgf/environmental-guidelines
57 https://www.audit.nsw.gov.au/ArticleDocuments/298/Performance_Audit_Program_2016-
17_to_2018-19.pdf.aspx?Embed=Y

28 Peer review of economic assessment
www.TheCIE.com.au
4 Regional economic assessment
The previous chapter presents the CIE’s findings in regards to the CBA. The CBA
provides a basis on which to assess whether or not the Project will deliver net benefits to
the NSW community. The regional economic impact analysis provides a further
description of the potential impacts on the regional economy if the Project is approved.
The regional economic impact analysis uses the input-output technique to estimate the
direct, flow-on and total economic impacts of the Wallarah 2 Coal Project.
Overall the analysis follows the standard procedures of the input-output technique. But as
opposed to a computable general equilibrium (CGE) modelling approach, input-output
analysis, and the resultant multipliers, tend to overstate the follow-on effect as the analysis
is based on some strong assumptions such as a lack of resource constraints, absence of
economies of scale, no technological progress (since the data the multipliers were derived
from was assembled), and ‘average’ rather than ‘marginal’ analysis. And as noted by the
Productivity Commission
[Multiplier] Abuse primarily relates to overstating the economic importance of specific sectoral
or regional activities. It is likely that if all such analyses were to be aggregated, they would sum
to much more than the total for the Australian economy… In particular, these [multiplier]
applications fail to consider the opportunity cost of both spending measures and alternate uses
of resources, and may misinform policy-makers.58
In other words, by failing to take into account resource constraints and the manner in
which an economy adjusts to economic stimuli, multipliers overstate the impacts of
economic activities, and potentially overstate the economic impacts.
The degree to which the multiplier analysis overstates the economic impact will be
mitigated to some extent by relaxing the full employment assumption (see further below).
The CIE has not verified the multipliers used in the analysis. Typically, multipliers are
estimated in terms such as the additional value-added, output and employment generated
by a particular industry increasing its output by $1 million. This approach does not
appear to have been used here. Rather, the multipliers seem to have been calculated with
respect to the wage bill or employment numbers. That is, and for example, the additional
wages paid in the economy due to the (net) wage bill in the mining sector increasing by
$1 million.
It is also not always clear how the multipliers have been applied to estimate the impact.
Some more specific comments follow.
58 Gretton, P. 2013, On input-output tables: uses and abuses, Staff Research Note, Productivity
Commission, Canberra, page 1.

Peer review of economic assessment 29
www.TheCIE.com.au
The logic of the FTE job increase of 72 (Table 5.1) is somewhat challenging to interpret.
According to the text before the table
Assuming that future employees residing in the local area are already employed and that job
vacancies created by these people filling the construction and mining positions remain unfilled,
…
If employees working at the mine were already employed, and their now vacant former
employment positions remain unfilled, then there must be no net increase in jobs. Rather,
(a subset) of already employed persons in the region receive a higher income by virtue of
working at the mine (construction and operation phases).
On this later issue of net change in income, it would be better to replace the average net
income in mining (item b) in Table 5.1 by the average labour income per employee for
the Project. In this way, the contribution of the Project to the local income would be
better measured. There is also a question mark over using ‘Average net income in other
industries’ as the comparator. Doing so assumes that people employed elsewhere in the
region, potentially doing different activities/roles, could gain employment in mine
construction or operation. It is not immediately clear that this is a reasonable
assumption. A better comparison, if the data were available, would be to use average
incomes from other heavy construction/mining activities.
As noted above, it has been assumed that the Project will not see a net change in (direct)
employment. As such, using an employment multiplier (Table 5.2) in inappropriate. As
the impact of the Project on employment is reflected in higher income, it is, so far as
using multipliers is appropriate, legitimate to use an income multiplier to estimate the
flow-on effects. Presumably, higher income leads to higher demand, and thus higher
employment/income elsewhere in the region. So ‘an employment multiplier of income’
might be estimated and applied to estimate the employment impact of higher income.
Some environmental and social impacts on the local community (Table 5.3) should be
subject to the same multiplier analysis no matter how small the direct impacts are.
Mitigation of some impacts are included in capital and/or operating costs such as
flooding, noise impacts, and visual amenity as stated in Table 5.3. Ideally these costs
should be separately listed. Further, this may present a problem of painting negative
impacts as positive ones. The capital and operating costs to mitigate the adverse impacts
may well be included in the non-labour expenditure which are attributed to the local
economy as benefits in subsections 5.3 and 5.4.
Separately estimating the impacts of construction equipment purchases on regional
economy (tables 6.3, 6.5, 6.7, 6.9) may present double-counting problems. Presumably,
the $163m of capital expenditure in the heavy and civil engineers construction sector and
construction services sector must include intermediate inputs from the specialised and other
machinery and equipment manufacturing sector in the local and NSW input-output tables. If
so, the direct and production induced effect of output must already include the
expenditure on the construction equipment purchase.
According to Table 6.10, an income per employee for the Project of $133 843 per annum
can be derived (income of $40 153 000 divided by 300 employees). This is significantly

30 Peer review of economic assessment
www.TheCIE.com.au
higher than the average income of mining as reported in Table 5.1 ($96 473). There
appears to be no justification for this higher income assumption.
Finally, according to the second dot point on page 70
The estimated wage bill of employees residing in the region was allocated to the household wages
row with any remainder allocated to imports
Does that mean the 300 operation jobs are employees residing in the region too? If so,
presumably there are some employees residing in other NSW regions. If so, then the
income and employment numbers for the Project in the whole of NSW (Table 6.12)
should be higher than those for the region (Table 6.10).
If the 300 jobs are total employment for the Project, then according to the above quoted
dot point, the average income per employee would be even higher than $133 843.

Peer review of economic assessment 31
www.TheCIE.com.au
5 Conclusion
In general we conclude that the CBA has been undertaken in a manner that is broadly
consistent with the 2015 NSW Government guidelines for conducting mining related
applications and the 2007 Guidelines for economic appraisals.
While the analytical approach is broadly consistent, the individual components and
parameter estimates warrant testing. Some of the estimates are difficult to test,
particularly where there is limited publicly available data on, for example, the cost of the
operations. Further, the CBA requires Gillespie Economics to develop assumptions
regarding future factors, such as the future price of coal which are volatile.
On the benefits side, at a minimum, the NSW Government would receive royalty
payments. On the cost side, there are a range of externalities that need to be accounted
for. In some instances, these externalities have been mitigated (in full) by the actions of
the company. However, there are instances where there are residual impacts that are not
fully mitigated. We have relied on the findings presented in the EIS documents and NSW
Government agency submissions to the process to understand whether these impacts are
likely to be material and would change the conclusion regarding the quantum of net
benefits.
Based on alternative assumptions, we would anticipate that the benefits associated with
royalties to be between $154m to $257m in present value terms over the life of the
Project. This can be viewed as the minimum benefit that could be expected from the
Project. On the cost side, the key item relates to the greenhouse gas emissions which
ranges from around $27m to $121m in present value terms, depending on assumptions
used.
Therefore, even if we assume upper bound estimates of greenhouse gas emissions
($154m) and lower bound estimate of royalties ($121m), the Project is expected to deliver
net benefits of around $33m in present value terms. The quantum of the net benefits
could be higher if other elements of the benefits stream are included in the analysis,
although it is difficult to test/confirm the quantum of these other elements. This, of
course, assumes that there are a range of negative impacts that are mitigated in full or
have no material impact which is consistent with the findings of the EIS documentation
and NSW Government agencies’ submissions.
In regards to the regional economic analysis, the use of ‘multipliers’ is likely to overstate
the potential economic impact of the Project. Further, it is difficult to trace through the
analysis to understand how the impacts have been derived. Therefore, while the CBA
indicates that there are expected net benefits if the Project is approved, the regional
economic analysis conducted may not accurately reflect the potential economic impact
on the local region.


![[Maksimenkova_Neznanov] Peer Assessment to Programmers & Peer Assessment System for Complex Artifacts](https://img.dokumen.tips/doc/110x75/587ac6251a28ab760f8b4577/maksimenkovaneznanov-peer-assessment-to-programmers-peer-assessment-system.jpg)


![Peer Assessment[1]](https://img.dokumen.tips/doc/110x75/557e73b0d8b42a4d108b477b/peer-assessment1.jpg)