Embed Size (px)
Citation preview

A STUDY ON “QUALITY OF WORK LIFE” AT
C.A.V COTON MILLS LIMTED,DINDIGUL
BY,
SURESHNATHAN V

The Project has been done in C.A.V COTON MILLS LIMTED. The title of the project is “A STUDY ON “QUALITY OF WORK LIFE” AT ,DINDIGUL
The main objective of the study is to find out the employees satisfaction on major areas like job security, job satisfaction, medical facilities, canteen facilities, rewards, ESI, etc…
In the company I have studied thoroughly the working method and functions of the HR department individually.
The collected data was analyzed by using relevant tools such as,
Chi-square test
Weighted Average
Percentage analysis
ABSTRACT

• Introduction• Industry Profile • Company Profile• Objective of the Study• Scope of the Study• Limitation of the Study
CHAPTER I
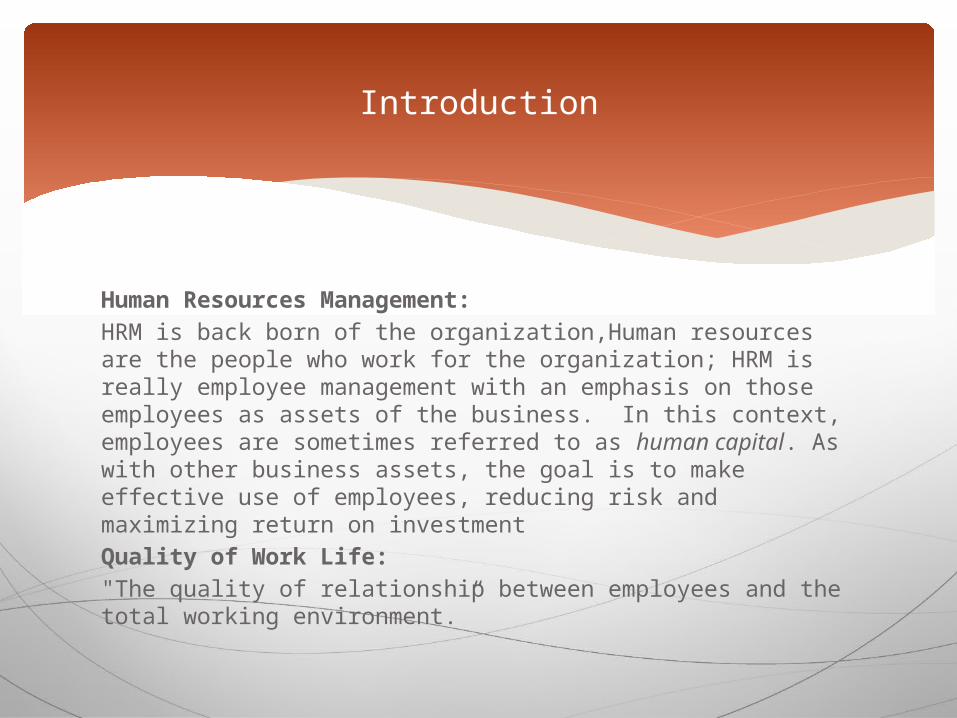
Human Resources Management:
HRM is back born of the organization,Human resources are the people who work for the organization; HRM is really employee management with an emphasis on those employees as assets of the business. In this context, employees are sometimes referred to as human capital. As with other business assets, the goal is to make effective use of employees, reducing risk and maximizing return on investment
Quality of Work Life:
"The quality of relationship between employees and the total working environment.”
Introduction

Indian textile industry is well recognized and one of the areas of strength of this industry is its spinning sector. India has one of the most successful spinning industries of the world with over
37million spindle and 50000 rotors. In cotton yarn the Indian spinning industry is the worldleadercontributing over
25% of world trade. Currently it accounts for about 4% of GDP, 14% of industrial production and over 30% of export earnings of India(3% of the
world garment trade) and has only 7-8% of import intensity 35 million people are gainfully employed with the industry making it the 2nd largest
employment providing section after agriculture, The total turn over of the Indian textile industry is estimated at arount RS 1300
billion
INDUSTRY PROFILE

Top 10 Cotton Producing Countries (in metric tonnes)
Rank Country 2011 2012 2013
1 China 6,377,000 5,970,000 6,588,950
2 India 4,083,400 5,683,000 5,984,000
3 United States 2,653,520 3,941,700 3,412,550
4 Pakistan 2,111,400 1,869,000 2,312,000
5 Brazil 956,189 973,449 1,673,337
6 Uzbekistan 1,128,200 1,136,120 983,400
7 Turkey 638,250 816,705 954,600
8 Australia 329,000 386,800 843,572
9 Turkmenistan 220,100 330,000 330,000
10 Argentina 135,000 230,000 295,000
— World 19,848,921 22,714,154 24,941,738

YEARS TURNOVER PERCENTAGE OF GROWTH (%)
2004 72409130.34 100
2005 60889386.21 84
2006 82344131.66 114
2007 93932788.58 130
2008 108833793 150
2009 634024100.01 102
2010 647281971 112
2011 832491818 116
2012 876542812.76 121
2013 786471891,97 103
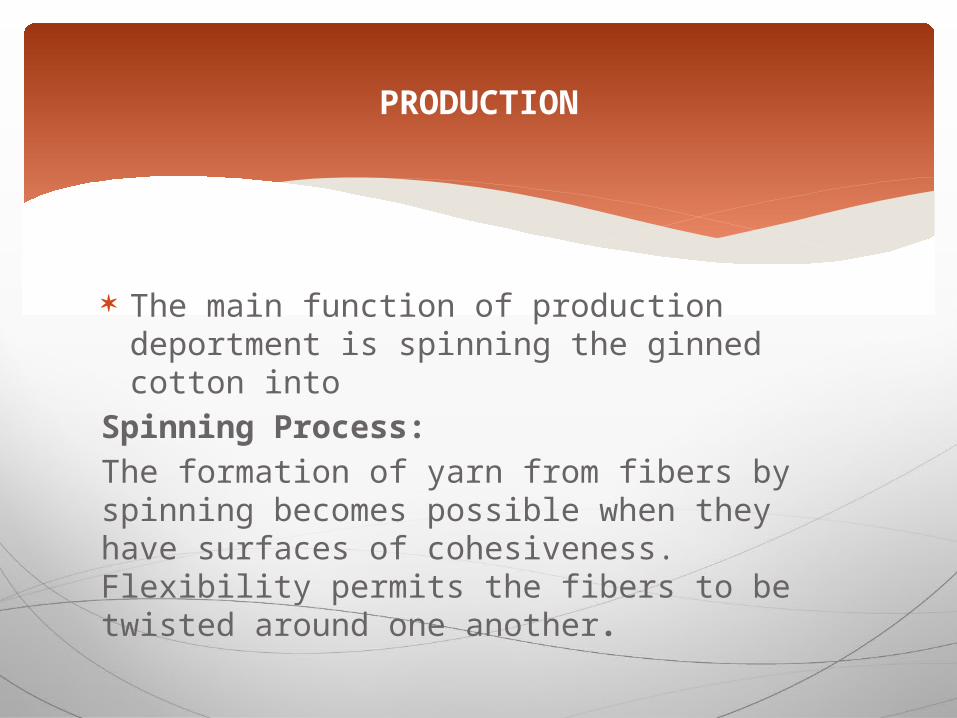
The main function of production deportment is spinning the ginned cotton into
Spinning Process:
The formation of yarn from fibers by spinning becomes possible when they have surfaces of cohesiveness. Flexibility permits the fibers to be twisted around one another.
PRODUCTION
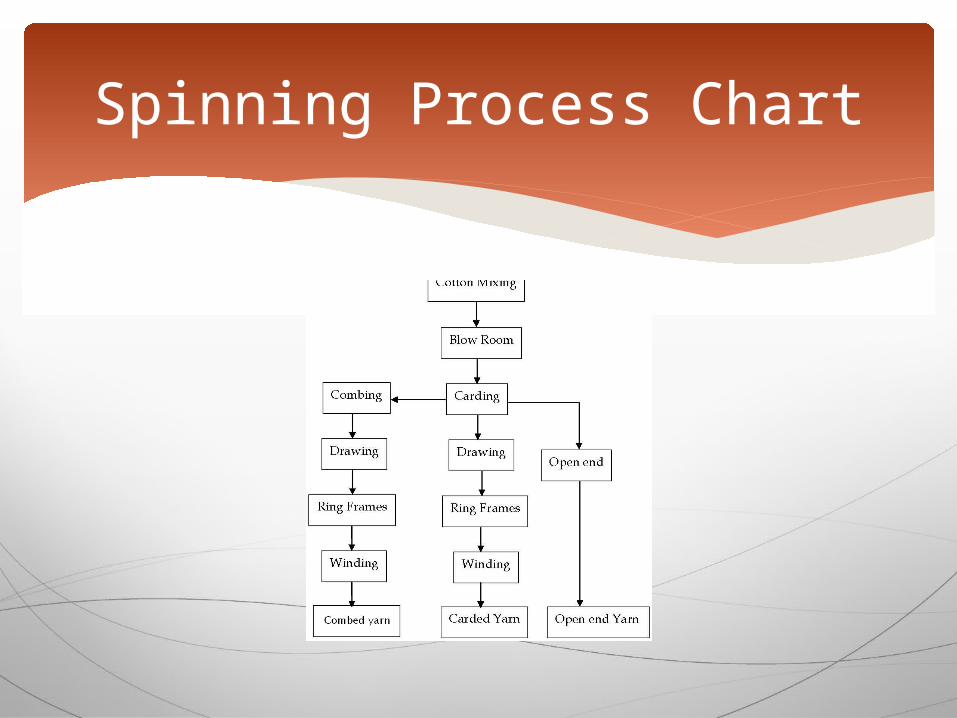
Spinning Process Chart
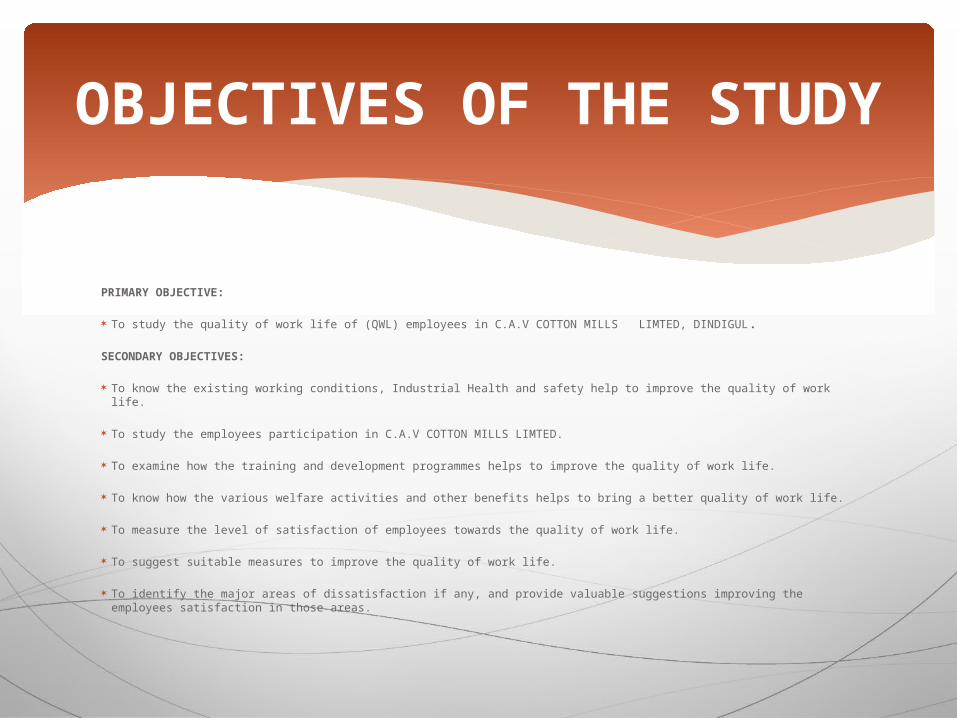
PRIMARY OBJECTIVE:
To study the quality of work life of (QWL) employees in C.A.V COTTON MILLS LIMTED, DINDIGUL .
SECONDARY OBJECTIVES:
To know the existing working conditions, Industrial Health and safety help to improve the quality of work life.
To study the employees participation in C.A.V COTTON MILLS LIMTED.
To examine how the training and development programmes helps to improve the quality of work life.
To know how the various welfare activities and other benefits helps to bring a better quality of work life.
To measure the level of satisfaction of employees towards the quality of work life.
To suggest suitable measures to improve the quality of work life.
To identify the major areas of dissatisfaction if any, and provide valuable suggestions improving the employees satisfaction in those areas.
OBJECTIVES OF THE STUDY

The study is concerned with Quality of work life of employees at C.A.V COTTON MILLS LIMTED, DINDIGUL. Quality of work life is a multi-dimensional aspect. this study covers The workers expect the following needs to be fulfilled.
SCOPE OF THE STUDY

Time was the major constraint for the project. The study is restricted to HR dept and can’t be
generalized. The individual perspective appears to be different.
LIMITATIONS OF THE STUDY:

Miller, 1978; Kirkman, 1981; Metz, 1982; Mirvis & Lawler, 1984; Cooper, 1988) define the qualities of work life are broadly similar to the study on Singaporean Employees Development suggest four dimensions of Quality of work life labeled as,
Favorable work environment Personal growth and autonomy Nature of job and Stimulating opportunities and co‐workers.
REVIEW OF LITERATURE

QWL refers to the level of satisfaction, motivation, involvement and commitment individuals experience with respect to their line at work. QWL is the degree of excellence brought about work and working conditions which contribute to the overall satisfaction and performance primarily at the individual level but finally at the organizational level.
CONCEPT
QWL is a prescriptive concept, it attempts to design work environments so as to maximize concern for human welfare. QWL acts in two dimensions.
Goal Process
QWL acts as goal by
Creation of more involving satisfying and effective jobs Work environment for people at all levels of the organization
QWL acts as process by
Make efforts to realize this goal through active participation
The whole essence of QWL may be stated thus, the QWL is co – operative rather than
authoritarian; evolutionary and open rather static and rigid; informal rather than mechanistic; mutual respect and trust than hatred against each other.
Objectives of QWL
The major three main objectives for the QWL are
To Improve employees satisfaction strengthen workplace learning, and
To Better manage on – going chance and transition
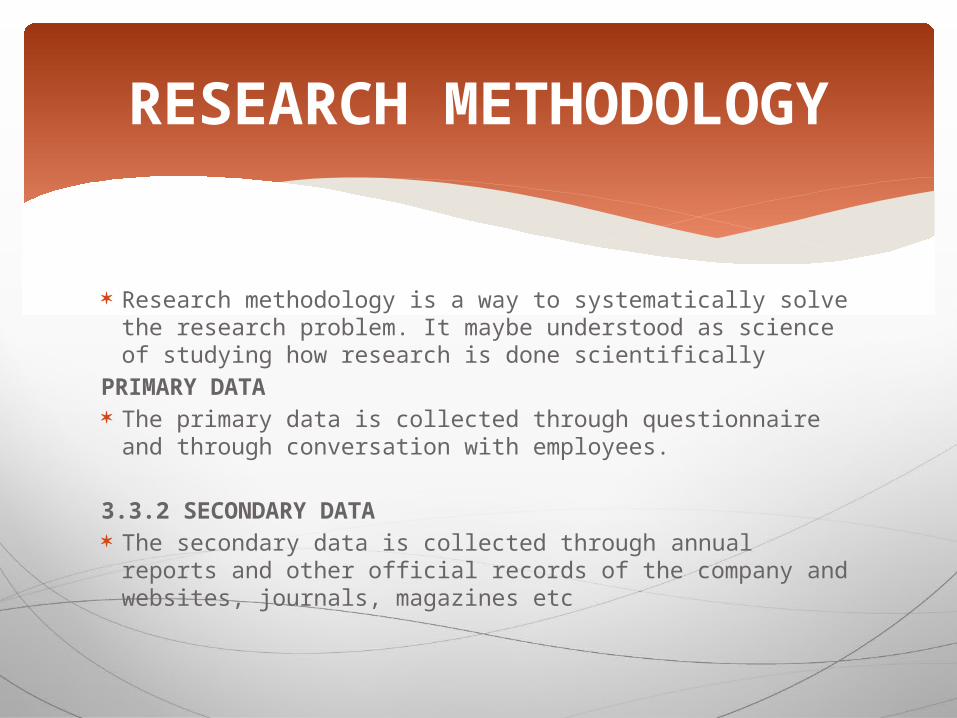
Research methodology is a way to systematically solve the research problem. It maybe understood as science of studying how research is done scientifically
PRIMARY DATA The primary data is collected through questionnaire and through
conversation with employees.
3.3.2 SECONDARY DATA The secondary data is collected through annual reports and other
official records of the company and websites, journals, magazines etc
RESEARCH METHODOLOGY

Both Primary and Secondary data were collected. The researcher had a discussion with the officers in the HR Departments of the unit, under
study for collecting the primary data. The Secondary Data were collected from the books, records and reports of the organization.
Here the Research design used is descriptive research design. In descriptive research design the researcher try to find out in what frequency the relationship exist between the variables.
Sample Size: Population Size - 319 Sample Size - 147
RESEARCH DESIGN
The followings are the tools which are commonly used to analyze the data.
1.Percentage analysis 2. Chi-Square 3. Weighted average
RESERCH TOOLS
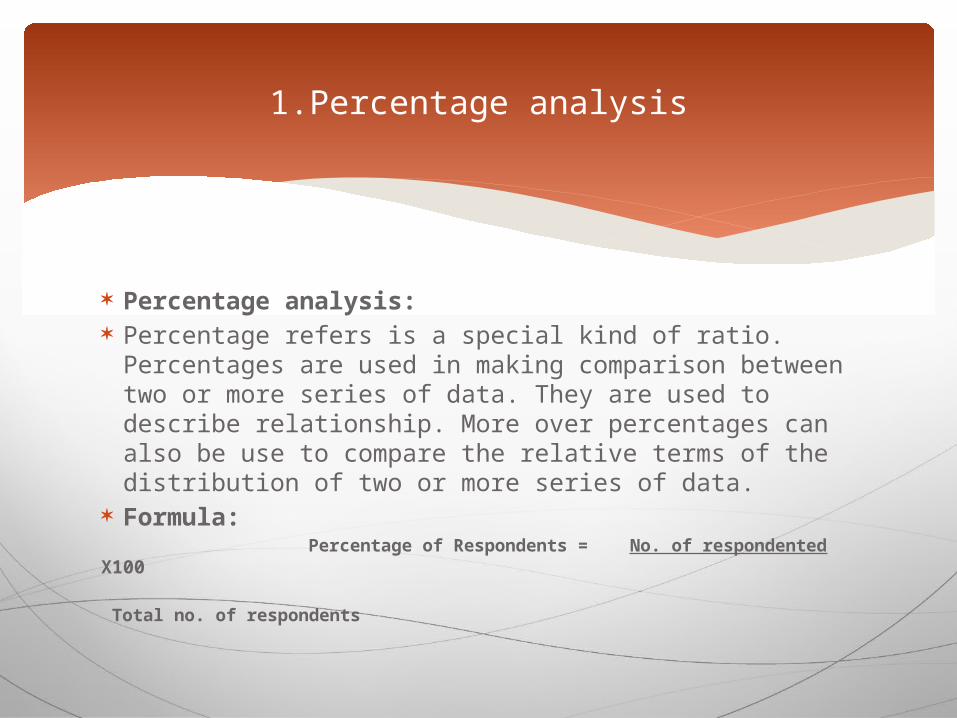
Percentage analysis: Percentage refers is a special kind of ratio. Percentages are
used in making comparison between two or more series of data. They are used to describe relationship. More over percentages can also be use to compare the relative terms of the distribution of two or more series of data.
Formula: Percentage of Respondents = No. of respondented X100
Total no. of respondents
1.Percentage analysis

Weighted Average Method was applied to find out the desirable policies & practices that are adopted by the company by ranking certain criteria's in some of the important functional areas of H.R.
Formula:
Weighted average method = (X1W1 + X2W2 + X3W3 +……..)
n X= values of the quantity Q= values of the corresponding weights N= Variable
2.Weighted Average Method:

Chi ‐ Square is a non‐parametric technique, most commonly used fay a research to test the analysis. The main objective of chi‐square is to determine whether significant difference exist among group of data
Formula:
Chi ‐ Square test = Σ (Oi ‐ Ei)2/ Ei
Oi = Observed frequency
Ei = Expected frequency
Degree of freedom = n – 1.
3.Chi ‐ square test:
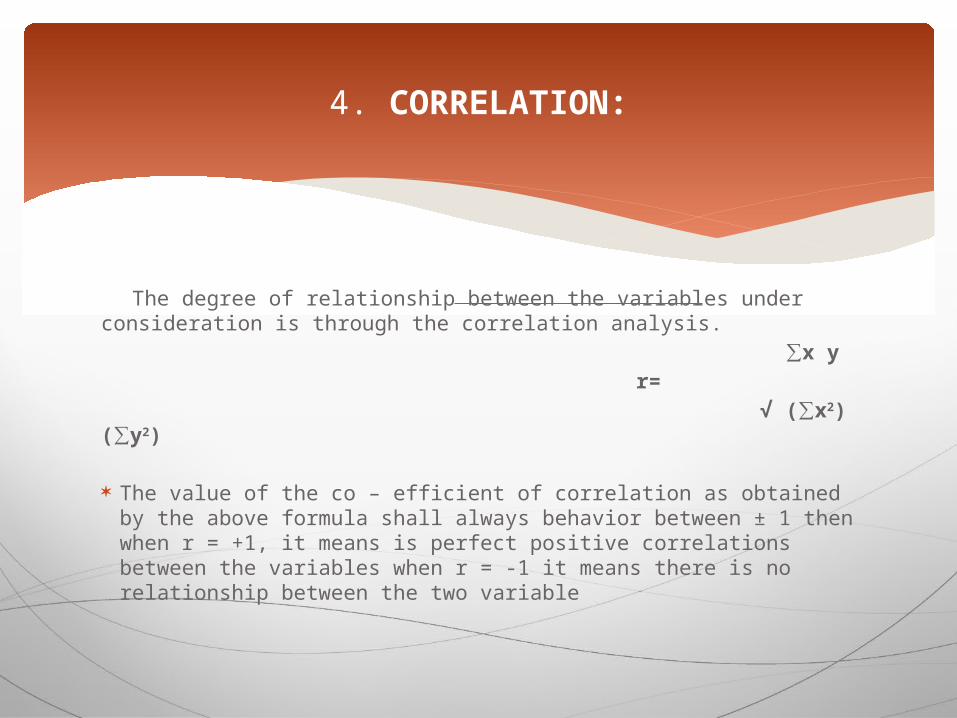
The degree of relationship between the variables under consideration is through the correlation analysis.
∑x y
r=
√ (∑x2) (∑y2)
The value of the co – efficient of correlation as obtained by the above formula shall always behavior between ± 1 then when r = +1, it means is perfect positive correlations between the variables when r = -1 it means there is no relationship between the two variable
4. CORRELATION:

From table 1, it is inferred that 37% of employees are highly satisfied with the salary package.
Based on the research analysis table 2, it is inferred that 35% of employees are highly satisfied with the current job.
In table 3 clearly research analysis shows, it is inferred that35% of employees are satisfied with casual leave with pay.
From table 4, it is inferred that 39% of employees are highly satisfied with the medical facilities
Based on the research table 5, it is inferred that 39% of employees are satisfied with the bonus.
Research analysis From table 6 , it is inferred that 61% of employees are satisfied with the canteen facility.
From the study table 7, it is inferred that 54% of employees are satisfied with the ESI & PF.
Based on the research table 8, it is inferred that 46% of employees are satisfied with the healthy and safety working conditions
From table 9, it is inferred that 63% of employees are satisfied with the job security. From table 10, it is inferred that 35% of employees are satisfied with the promotion
policy.
FINDINGS OF THE STUDY:

From the study , it is inferred that 41% of employees are neutral with quality of work life.
From table 12, it is inferred that 46% of employees are satisfied with the attention of changes.
Based on the research table 13, it is inferred that 36% of employees are satisfied cordial relationship among employees.
From table 14, it is inferred that 41% of employees are satisfied with training.
From the study table 15, it is inferred that 50% of employees are satisfied with performance appraisal.
From table 16, it is inferred that 36% of employees are satisfied with grievance redressal.
From table 17, it is inferred that 60% of employees are highly dissatisfied with reward recognition.
Based on the research table 18, it is inferred that 47% of employees are satisfied with the career development.
From the study table 19, it is inferred that 40% of employees are satisfied with the freedom given to the employee for doing their own work.
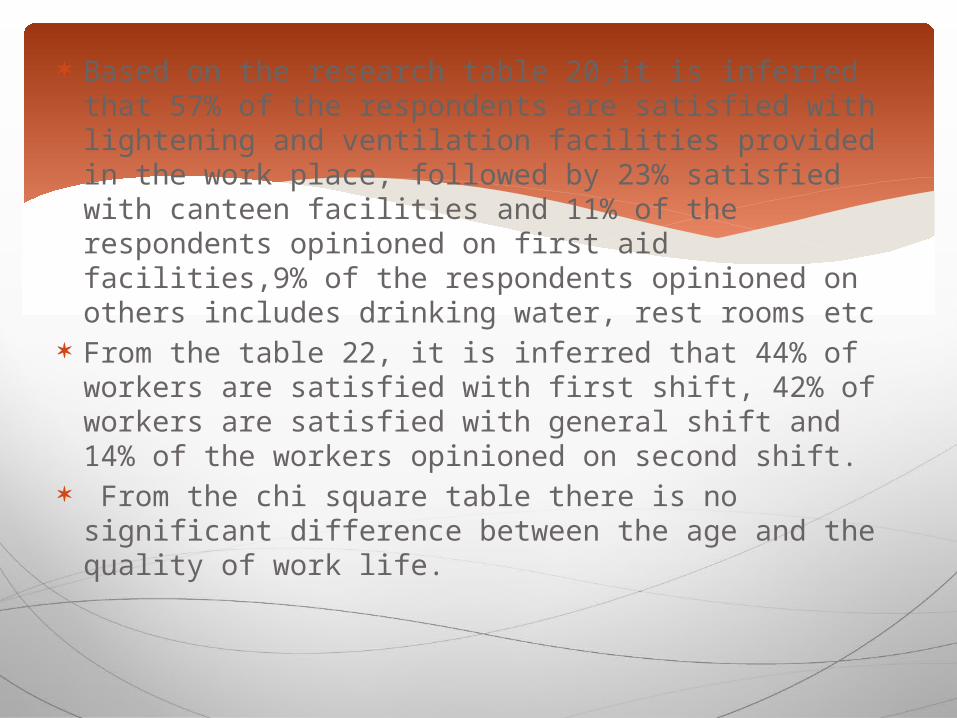
Based on the research table 20,it is inferred that 57% of the respondents are satisfied with lightening and ventilation facilities provided in the work place, followed by 23% satisfied with canteen facilities and 11% of the respondents opinioned on first aid facilities,9% of the respondents opinioned on others includes drinking water, rest rooms etc
From the table 22, it is inferred that 44% of workers are satisfied with first shift, 42% of workers are satisfied with general shift and 14% of the workers opinioned on second shift.
From the chi square table there is no significant difference between the age and the quality of work life.

The employees of C.A.V COTON MILLS LIMTED are expecting the following from the company.
Improvement in rewarding and awarding policies. Introduction of Promotion policy at operation level
Employees need high motivation from the top management of the company.
Employees need more compensation from the company Employees expect mutual relationship between co‐workers Employee’s need special training from the company related to
their job during working period.
SUGGESSTIONS

Employees expects the quality of work to be measured periodically by the company
Improving more policies and some good entertainment and
relaxation programs for employees. Improving good relationship with employees and providing
friendly environment in the organization. Making the employees to enjoy the work. Establish career development systems Help to satisfy the employees esteem needs. Gift vouchers for the top performers in the department for
giving an innovative idea for solving problems which is cost saving, time saving and is beneficial to the organization.

From the study, it is clear that quality of work life of employees in C.A.V COTON MILLS LIMTED is good. This research highlights some of the small gaps in employee’s satisfaction towards the company.Compared to other companies believe in employee’s satisfaction and brilliant productivity hours. Quality mission includes not only the quality of the products but also the Quality of Work Life.C.A.V COTON MILLS LIMTED aims to promote the peaceful industrial relations and good organization which is highlighted by management and the employees.
CONCLUTION

Social security scheme as well as welfare measures that are undertaken by the company are appreciable. These measures are not only for the company but also for the employees through satisfaction levels a company can ascertain whether an employee has shown his/her best performance on given job.Welfare measures of the employees should be taken seriously by the top management to improve the satisfaction level by providing various benefits and facilities to them. Since employees are the backbone of the company. So company should satisfy them in order to improve the business in the higher competitive market of the liberalized economy.

C.A.V COTON MILLS LIMTED HR records
K. Aswathappa (1997), “Human Resources and Personal Management” Tata Mcgraw‐Hill Publishing Company Limited, New Delhi – 110 001.
John M. Ivancevich (2003), “Human Resources and Personal
Management” Tata Mcgraw‐Hill Publishing Company Limited, New Delhi – 110 001.
C. R. Kothari (2001) “Research Methodology” of Wishwa Prakashan Publishing, Chennai
REFERENCES


![qwl final[1]](https://img.dokumen.tips/doc/110x75/5524653c4a795907498b472b/qwl-final1.jpg)