Embed Size (px)
Citation preview
lable at ScienceDirect
Quaternary Science Reviews 29 (2010) 2705e2718
Contents lists avai
Quaternary Science Reviews
journal homepage: www.elsevier .com/locate/quascirev
Climatic interpretation of a 1.9 Ma environmental magnetic record of loessdeposition and soil formation in the central eastern Pampas of Buenos Aires,Argentina
Clifford W. Heil Jr. a,*, John W. King a, Marcelo A. Zárate b, Peter H. Schultz c
aGraduate School of Oceanography, University of Rhode Island, Narragansett, Rhode Island 02882, USAbCONICET-FCEN-UNLPAM, Avenida Uruguay 151, 6300, Santa Rosa, La Pampa, ArgentinacBrown University, Department of Geological Science, Providence, Rhode Island 02912, USA
a r t i c l e i n f o
Article history:Received 12 November 2009Received in revised form10 June 2010Accepted 12 June 2010
* Corresponding author. Tel.: þ1 401 874 6537; faxE-mail address: [email protected] (C.W. Heil Jr.).
0277-3791/$ e see front matter � 2010 Elsevier Ltd.doi:10.1016/j.quascirev.2010.06.024
a b s t r a c t
Much of what we know about Quaternary climate has been learned from sedimentary records from theworld’s oceans. With the exception of the extensive studies of the Chinese loess/paleosol sequence andmore recent studies of long lake records, there are few long terrestrial climate records, particularly from thesouthern hemisphere. The loess record of Argentina provides an important opportunity to further ourunderstanding of climate change from a terrestrial environment, but its complexity and discontinuity haveled to difficulty in formulating a climatological model of depositional and pedogenic processes. In thisstudy, we present one of the longest and most continuous loess/loessoid records from the central easternPampas of Argentina. Our age model is based on optically stimulated luminescent dates and a paleomag-netic reversal stratigraphy and indicates a basal age around 1.9Ma.Within the agemodel uncertainties, wecharacterize the environmental magnetic properties associated with loess deposition and soil formationwith respect towind patterns,moisture availability, and temperature. Major changes inmagnetic grain sizeare linked to a differential northward shift of the subtropical high-pressure cell during glacial periods.We suggest that coarser (finer) magnetic grains correspond to weaker (stronger) glacial periods when thehigh-pressure cell is located in a more southerly (northerly) position and the source region is moreproximal (distal) to our study area. An abrupt increase in the ultrafine-grained magnetic material around0.9 Ma is related to an increase in moisture transport from the South Atlantic driven by an increase insummer sea surface temperatures at themid-Pleistocene transition (w1Ma). In addition to these grain sizevariations, there is a relative decrease in the amount of goethite compared to hematite beginning around0.5 Ma, which has been related to the temperature increase observed after the mid-Brunhes Event(w450 ka) in the EPICA ice core temperature record. A more detailed comparison to insolation indicatesthat, for portions of the record, ferrimagnetic minerals are depleted during periods of low insolation. Thisresult suggests that Argentine loess deposition and soil formation follows a model more similar to theAlaskan loess sequences than the Chinese loess sequences. Although further work is needed to validate themodels and mechanisms proposed in this study, our record indicates that the mineral magnetic propertiesof the loess and paleosol deposits record major changes in deposition and soil formation and provideinsight into possible mechanisms relating to global and/or hemispheric climate change.
� 2010 Elsevier Ltd. All rights reserved.
1. Introduction
Among the most important terrestrial paleoclimate records arethose from the loess and paleosol sequences of central China andthe Tibetan Plateau (Heller and Liu, 1986; Kukla and An, 1989; Zhouet al., 1990; Maher and Thompson, 1995; Sun et al., 2006). Mineral
: þ1 401 874 6811.
All rights reserved.
magnetic studies of these sequences have demonstrated thecomplexity of preservation and/or formation of magnetic mineralsduring the pedogenic process as well as changes in loess deposi-tion. These records have contributed significantly to our under-standing of monsoonal circulation and its role in heat and moisturetransport to Southeast Asia during the last w8 Ma.
The loess/loessoid deposits of Argentina have the potential to bea southern hemisphere counterpart to the sequences of China. Theloess/loessoid sediments of Argentina were deposited duringglacial intervals by westerly winds carrying material from the

Argentina
South America
Atlantic OceanB u e n o sA i r e s
P r o v i n c e
-62°
-62° -58°
-58° -54° -50°
-42°
-40°
-38°
-36°
-34°
-32°
051 0030
Km
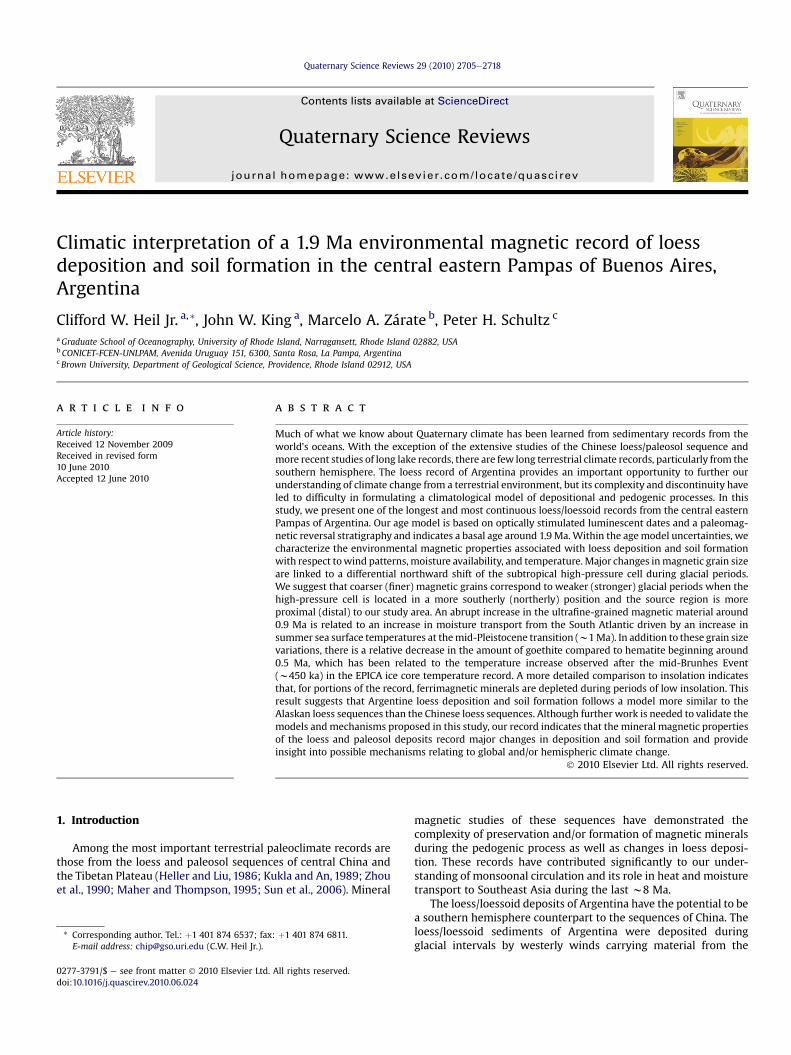
Fig. 1. Location map of Gorina Quarry, indicated by the star.
C.W. Heil Jr. et al. / Quaternary Science Reviews 29 (2010) 2705e27182706
Andes Cordillera (Frenguelli, 1957; Teruggi, 1957; Bidegain et al.,2007). These sediments have accumulated since the late Miocene(w10Ma; Zárate, 2003 and references therein) and contain discretepaleosols and/or pedogenic units (Bidegain,1998; Nabel et al., 1999;Kemp and Zárate, 2000; Zinck and Sayago, 2001; Zárate et al., 2002;Zárate, 2003; Bidegain et al., 2005; Kemp et al., 2006;Schellenberger and Veit, 2006; Bidegain et al., 2007). However,many of these studies have shown that the loess/paleosolsequences of Argentina have been affected by compoundpedogenesis, which creates a complex stratigraphy and obscurescorrelations to regional and global paleoclimate records. Inaddition, the sequences in Argentina contain hiatuses and erosionalsurfaces of unknown duration. Although these discontinuities donot appear to span long periods of time, they increase thecomplexity of the sequences.
Depending on the composition of the loess, iron (in both theFe3þ and Fe2þ forms) can be liberated, mobilized, and ultimatelyboundwith oxygen and/or hydrogen during weathering. The extentof weathering is determined by several environmental factorsincluding temperature, water regime, pH, Eh (oxidation potential),biological activity, and the duration of exposure (Maher, 1986;Murad and Fischer, 1988). Two general magnetic depositional/pedogenic models have been established describing the mineralmagnetic variations in loess/paleosol sequences. Briefly, the “windvigor” model (i.e., Alaskan loess/paleosol sequence) is based onstrong glacial winds carrying dense magnetic minerals in the loessmaterial, whereas decreased wind strength and increased moistureduring interglacial periods diminishes the concentration ofmagnetic minerals. The “pedogenic” model (i.e., Chinese loess/paleosol sequence) is based on magnetic enhancement of theparent loess during pedogenic interglacial intervals. Identifying themagnetoclimatological relationship in these types of environmentsis critical to constructing paleoclimate records and understandingthem in the context of regional and global climate change.
In this paper we present a detailed (2 cm sample resolution)environmental magnetic characterization of six pedogenic unitsfrom a 16m section located in the central eastern Pampas of BuenosAires, Argentina. The age of the section was constrained usinga magnetic reversal stratigraphy and optically stimulated lumi-nescence dates (OSL) and spans the last w1.9 Ma. We identifiedchanges in magnetic concentration, mineralogy and grain size andrelated them to changes in available moisture, wind strength, andtemperature. Ultimately, we consider our record in the context ofglobal climate changes/patterns (e.g., orbital cycles, the mid-Pleistocene transition, and the Mid-Brunhes Event) and proposemechanisms to explain our observations.
2. Geologic setting
The Argentine Pampas extend from 23�S to 38�S in the southernplains of South America. Primarily derived from reworkedpyroclastic deposits, primary tephra units, and other volcaniclasticsediments, the loess and loessoid/paleosol sequences span thePliocene through the Pleistocene with similar underlyingsequences extending to the late Tertiary (Zárate and Fasano, 1989;Schultz et al., 1998). Located 45 km southeast of the city ofBuenos Aires, Gorina Quarry (34�5400800S; 58�0105600W) (Fig. 1) lieswithin the ‘Pampa Ondulada’ in the northeastern portion of theArgentine Pampas. The undulating topography formed by fluvialerosion associated with tributary streams of the Rio Paraná and Riode la Plata (Zárate and Rabassa, 2005). The present climate is humidtemperate, having a mean annual temperature of 17 �C and expe-riencing an average annual rainfall of 1000 mm (Prohaska, 1976).The section is composed primarily of clayey and sandy silts (Zárateet al., 2002) and has been divided by Bidegain (1998) into three
lithostratigraphic units: La Postrera Formation (youngest) (Fidalgoet al., 1973), the Buenos Aires Formation, and the EnsenadaFormation (oldest) (Riggi et al., 1986). The Brunhes/Matuyamaboundary (0.781 Ma) marks the upper boundary of the EnsenadaFormation (Bidegain, 1998).
3. Methods
A series of 29 block samples (w8 cm deep � 8 cm across andranging in length from 40 to 100 cm) were extracted from thesouthwest wall of Gorina Quarry. The exposed face of the outcropwas first cleared to remove weathered and/or slumped material.Maintaining an overlap of w10 cm between the top and bottom ofadjacent samples, a continuous 16 m section was recovered. Inorder to measure the paleomagnetic record (i.e., the magneticreversal stratigraphy), a 2.5 cm � 2.5 cm continuous sub-samplewas cut from the larger block samples. In addition to the contin-uous samples, discrete samples were taken every 2 cm from theblock sections. Each discrete sample was ground into a powder anddivided between two different sample containers (a 3.17 cm3
plastic box and a 0.3 cm3 plastic vial) and then weighed.The natural remanent magnetization (NRM) was measured at
1 cm intervals along the continuous samples using a 2-G� Enter-prises small-access cryogenic magnetometer. The samples weresubjected to stepwise alternating field demagnetization at eightsteps to a maximum of 30 mT, at which point the magnetizationwas typically less than 50% of its initial value. The NRM afterdemagnetization at a peak field of 20 mT is reported here.Demagnetization above this level produced linear demagnetizationpaths toward she origin (Suppl. Fig. 1).
Following the NRM measurements, a series of laboratory-induced magnetizations were performed on the 3.17 cm3 and0.3 cm3 samples to characterize the concentration, size, andmineralogy of the magnetic minerals present in the sediment.Magnetic susceptibility (K or c), anhysteretic remanent magneti-zation (ARM), and saturation isothermal remanent magnetization(SIRM) commonly reflect the content of ferrimagnetic minerals(e.g., magnetite, titanomagnetite, and greigite) but differ in theirsensitivity to variations in magnetic grain size (Dunlop andÖzdemir, 1997). These ferrimagnetic minerals are characteristi-cally strongly magnetic and have relatively low coercivities. For

C.W. Heil Jr. et al. / Quaternary Science Reviews 29 (2010) 2705e2718 2707
ferrimagnetic grains large enough to carry a remanent magneti-zation (�30 nm), K has a weak dependence on magnetic grain size,increasing somewhat as grains increase from single domain tomulti-domain. For such remanence-carrying grains, both SIRM andARMdecreasewith increasing grain size so that largemulti-domaingrains contribute relatively little in comparison to smaller grains. Incomparison to SIRM, ARM varies more strongly for very smallgrains (<1 mm), with ARM being particularly strong for magnetitegrains with diameters on the order of 0.1 mm or smaller (King et al.,1982; Dunlop and Özdemir, 1997). Because of the differingdependence of these magnetic properties on the size of ferrimag-netic grains, the ratios ARM/K, SIRM/K, and ARM/SIRM provideconvenient qualitative measures of “magnetic grain size” (withhigher values indicating finer sizes) and are used in this study.Grain size interpretations based on these ratios assume that K,ARM, and SIRM reflect the same ferrimagnetic minerals. Thisassumption is commonly violated when K is significantly affectedby superparamagnetic, paramagnetic and/or diamagnetic material,when SIRM contains a large high-coercivity component (e.g.,hematite and goethite), and when there are major changes in thetype of ferrimagnetic minerals.
In order to address the ambiguities with these grain sizeparameters, the sediment in the 3.17 cm3 boxes was used tomeasure the high and low frequency mass magnetic susceptibility(clf and chf), frequency dependence of magnetic susceptibility(cfd%), and the ARM. clf and chf were measured using a BartingtonInstruments MS2B dual frequency sensor (470 Hz and 4700 Hz).Each sample was measured 3 times at each frequency and theaverage values for clf and chf were used to calculate cfd% (defined as[(clf � chf)/clf] � 100). While c and K are magnetic concentrationparameters, cfd% is an indicator of the amount of super-paramagnetic material (<w25e30 nm; Dunlop and Özdemir, 1997)in the sediment. Both parameters have been used as indicators ofpedogenesis related to rainfall and paleomonsoon intensity (Maheret al., 1994, 2002; Maher and Thompson, 1995; Chen et al., 1999;Deng et al., 2005).
To better characterize concentration changes and variations inthe <1 mm size range, an ARM was imparted in a 100 mT peakalternating field while in the presence of a 79.6 A/m direct field.After measurement of the initial ARM, the samples were subjectedto incremental alternating field demagnetization at fields of 10, 15,20, 25, and 30 mT. It has been shown that the ratio of ARM30 mT/ARM provides a qualitative magnetic grain size proxy that can havea direct relationship to bulk grain size variations (Blanchet et al.,2007). We compare this proxy to the other well-establishedmagnetic grain size proxies mentioned above.
The samples in the 0.3 cm3 vials were subjected to a series ofisothermal remanent magnetizations (IRM) using an ASC ScientificModel IM-10-30 Impulse Magnetizer to characterize changes in theamount of high-coercivity minerals. The premise behind thesehigh-field treatments and measurements is that high-coercivityminerals (e.g., hematite and goethite) approach magnetic satura-tion in fields >1 T while low-coercivity minerals (e.g., magnetiteand maghemite) saturate around 0.3 T. The remanent magnetiza-tion measured after removal from the saturating field is known asthe saturation isothermal remanent magnetization (SIRM).Although the saturating fields for hematite and goethite are notwell-known, and have been suggested to be in excess of 20 T(Rochette et al., 2005), we subjected our samples to a saturationfield of 4.4 T (the largest field attained by the impulse magnetizer)and a back field of 0.3 T followed by a second back field of 2.5 T.Based on the approach of Sangode and Bloemendal (2004) whoshow that the maximum percentage of IRM acquisition for hema-tite and goethite occur between 0.5e1 Tand 3e4 T, respectively, theIRM fields that we have chosen should result in a sufficiently
distinct mineralogical saturation to characterize the relativecontributions of low-coercivity minerals versus high-coercivityminerals as well as the relative contribution of hematite versusgoethite.
Thedistinctionbetweengoethite andhematite is important becausethe goethite to goethite þ hematite ratio [G/(G þ H)] has been used toinfer climatic phases of pedogenesis relating to temperature andmois-ture (e.g., Sangode and Bloemendal, 2004). In general, warmertemperatures favor hematite formation (i.e., lower ratio values) andhigher excess moisture favors goethite formation (i.e., higher ratiovalues). However, the relationship is confounded by the combination ofthese climatic factors as well as soil pH and organic carbon content(Kämpf and Schwertmann,1983). Following the sequential magnetiza-tionsandmeasurements, theS-ratio (definedhereas IRM�0.3 T/IRM4.4 T),HIRM [defined here as (IRM4.4 T � IRM�0.3 T)/2] and the goethite andhematite contents (G¼ IRM4.4 T� IRM�2.5 T;H¼ IRM�2.5 T� IRM�0.3 T)were calculated.
To further characterize the environmental magnetic changes,5e20 mg samples were taken throughout the section (74 totalsampleswith an average sample spacing ofw20-cm) andmeasuredusing a Princeton Measurements Corporation Alternating GradientMagnetometer. The samplesweremeasured toobtain the saturationremanent magnetization (Mrs), the saturation magnetization (Ms),the magnetic coercivity (Hc) and the coercivity of remanence (Hcr).We use Hcr and Mrs/Ms to characterize variations in the relativecontribution of high-coercivity minerals (e.g., hematite andgoethite) and magnetic grains size, respectively (Day et al., 1977).Like the interparametric ratios discussedabove, higher valuesofMrs/Ms indicate finer magnetic grain sizes.
4. Sedimentology
The Gorina sedimentary succession resulted from the accretionof coarse to fine aeolian dust and consists of six pedological units(Pu1ePu6) identified on the basis of field morphological properties(Fig. 2). In addition, two erosional surfaces are observed near thebottom of Pu1 (the present surface soil and its parent loess) and atthe bottom of Pu4 (Zárate et al., 2002, 2009). At field scale, thesequence is primarily divided into B and C horizons. Redoximorphicfeatures (Femottles, FeeMn nodules) varying from rare to commonare found from the lower section of Pu1 downward, whereascarbonate nodules occur throughout the section. Zárate et al.(2002) carried out a systematic micromorphological analysis ofthe upper five pedological units, suggesting that Pu4, Pu3 and Pu2are accretionary or compound paleosols rather than discretepaleosols. Compound pedogenesis may have masked evidence fordepositional hiatuses. A progressive grain size decrease occurs fromthe lower part of Pu4 upwards with a dominance of fine texturedsediments in the upper three units (Blasi et al., 2001; Zárate et al.,2002). The very fine sand fraction of the upper five pedologicalunits is lithologically heterogeneous, including not only volcanicbut also metamorphic and granitic rock particles. Fresh volcanicglass occurs in low amounts throughout the section (slightly moreabundant in the lower parts of Pu4 and Pu1); the clay mineralassemblage is composed of illite (dominant in Pu1, Pu4 and Pu5),smectite, interstratified illiteesmectite (prevailing in Pu2) withtraces of kaolinite throughout; the amounts of illite, smectite,and interstratified illiteesmectite are about equal in Pu3 (Blasiet al., 2001).
One of the most notable features in the Gorina section is thegeneral absence of A horizons. This absence is an importantdistinction between this section and other “typical” loess/paleo-sol sections (e.g., China and Alaska). Kemp and Zárate (2000)provide a pedogenic model to explain the absence of A horizonsthat calls for a period of landscape stability, during which time AE

Fig. 2. (a) Sedimentological log showing paleosol units of Zárate et al. (2002). (b) Inclination record indicating reversal boundaries; Brunhes/Matuyama Boundary (B/M e 0.781 Ma),Jaramillo (0.988e1.072 Ma), Top Olduvai (1.778 Ma). Ages of reversal boundaries from Ogg and Smith (2004). (c) Age model based on optically stimulated luminescent dates(indicated with asterisks) of Zárate et al. (2009) and reversal boundaries. Average sedimentation rates are shown and the linear fit is discussed in the text. The closed circle at190.5 ka and 4.675 m is the average age and depth of the inverted OSL dates discussed in Section 5.1.
C.W. Heil Jr. et al. / Quaternary Science Reviews 29 (2010) 2705e27182708
and Bt horizons develop (e.g., the modern AE horizon formedduring the Holocene), followed by a period of loess accumulationand pedogenesis that changes the AE horizon into BCt/AE hori-zons. The continued development of AE and Bt horizons andsubsequent homogenization over several glacial/interglacialcycles results in pedologic units that lack discrete AE horizons.Although this model was developed for the Plioceneloessepaleosol sequence at Los Acantilados of east-centralArgentina (Kemp and Zárate, 2000) and the Pleistoceneloessepaleosol sequence at La Mesada in the Tucumán provinceof northwest Argentina (Kemp et al., 2003), it has been proposedas a suitable analog for the formation of pedologic units at GorinaQuarry (Zárate et al., 2002).
5. Results
5.1. Chronology and sedimentation rates
OSL ages were obtained to establish a chronology for the upper5 m of the section (Zárate et al., 2009). The results indicate agesbetween 9 � 0.6 ka in the lowermost part of the modern A horizon(0.35m depth) to 29� 2 ka at the lower part of Pu1 (2.6 m, Fig. 2). Inaddition to these dates, OSL samples from the upper part of thePu4ePu3ePu2 pedocomplex (2.95e8.3 m), with its upper limitreinterpreted based on a reevaluation of published data (Zárate et al.,2009), provided minimum age estimates of 56 � 5 ka, 187 � 11 ka,and 194� 11 ka at depths of 3.0, 5.1, and 4.25 m, respectively (Fig. 2)

C.W. Heil Jr. et al. / Quaternary Science Reviews 29 (2010) 2705e2718 2709
A total of four paleomagnetic reversal boundaries were identi-fied in the inclination data from the 16 m section at Gorina Quarry(Fig. 2). The uppermost w9 m of the section records negativeinclination values, indicating deposition during the Brunhesnormal polarity chron. The transition to positive inclination valuesat 8.95 m is interpreted as the BrunheseMatuyama boundary(781 ka; Ogg and Smith, 2004). Its position just above the Pu4/Pu5paleosol boundary (Zárate et al., 2002) is consistent with previousstudies at this locale (Bidegain, 1998). Three other reversalboundaries are identified below the B/M boundary. The briefinterval of negative inclination values between 10.13 and 10.45 m isinterpreted as the Jaramillo normal subchron (988e1072 ka; Oggand Smith, 2004). The transition from positive inclination valuesto negative inclination values at 14.09 m is interpreted as the upperboundary of the Olduvai normal subchron (1778 ka; Ogg and Smith,2004). The remainder of the section (14.09e15.85 m) recordsnegative inclination values indicating that the lower boundary ofthe Olduvai subchron (1945 ka; Ogg and Smith, 2004) is notreached. This sequence of reversal boundaries suggests that thebasal age for the Gorina Quarry section is <1945 ka.
The age model was constructed using a linear interpolationbetween OSL and reversal ages (Fig. 2). The two OSL dates at 5.1 and4.25 m (187 and 194 ka, respectively) exhibit an age/depth inver-sion; however, they overlap in time within the error estimates(�11 ka each). In order to constrain the age for this interval, wehave forced the age model through the average age and depth,190.5 ka and 4.675 m, respectively (closed circle in Fig. 2). Theinterpolated ages below the upper Olduvai reversal (1778 ka) aremaximum age estimates based on the absence of the lower Olduvaireversal (1945 ka) (Fig. 2). Based on this age model, there are fourapparent changes in sediment accumulation rates for this section.The sediments of the lowermost interval (>1778 ka) must haveaccumulated at a rate >1.08 cm/ka since the lower Olduvai is notrecovered in our samples. Between 1778 and 781 ka, the averagesedimentation rate is w0.49 cm/ka. This estimate may be low dueto the presence of the erosional surface at the Pu4/Pu5 boundary,but it is notable that sediment accumulation decreased by 50%compared to the preceding interval. Sedimentation rates increasedto w0.72 cm/ka between 781 and 190.5 ka and then increased tow1.2 cm/ka between 109.5 and 56 ka. The sedimentation ratesincreased substantially to w9 cm/ka from 29 ka to present. The29 ka and 56 ka ages are separated by 0.4 m stratigraphicallysuggesting an average sedimentation rate of w1.5 cm/ka for thisinterval, but there is an erosional surface at 2.95 m so this isa minimum estimate. Sedimentologic and environmental magneticevidence (discussed below) suggests that the large increase insedimentation rate observed after 29 ka may have occurredimmediately following the erosional event. In summary, the sedi-mentation rate increases progressively up the section, excludingthe lowermost 2 m.
The dramatic increase in sedimentation rate associatedwith Pu1(beginning 29 ka) and the presence of an A horizon (the modernsoil) is particularly noteworthy in the context of the pedogenicmodel of Kemp and Zárate (2000). This unit does not appear to havebeen affected by the compound pedogenesis described by theseauthors, which means that loess deposition and subsequent soilformation occurred during one depositional/pedogenic cycle (i.e.,one glacial/interglacial cycle). The fact that the loess from Pu1 wasdeposited during one glacial cycle makes the high sedimentationrates even more notable compared to the sedimentation rates ofthe other units. Although it is possible that a change in climate mayhave led to the increased sedimentation, it is also possible thatsediment was eroded in the older pedologic units (e.g., Pu2ePu4)during the multiple cycles of deposition and pedogensis. Kemp andZárate (2000) favor diminished deposition over erosion in the
sequences used for their model. Despite the uncertainties aboutloess accumulation and erosion that are specific to the GorinaQuarry sequence, their model provides a framework to explain thegeneral absence of A horizons in our record.
5.2. Mineral-magnetic stratigraphy
It is apparent from the bulk magnetic coercivity (Hcr values�35 mT; Fig. 3) that the sediments of Gorina Quarry are dominatedby low-coercivity ferrimagnetic minerals [e.g., (titano)magnetiteand (titano)maghemite]. However, variations in the contribution ofhigh-coercivity magnetic minerals (e.g., hematite and goethite)were observed throughout the section (S-ratio and HIRM; Fig. 3).These observations are consistent with those of Bidegain et al.(2007) who report that magnetite dominates the magnetic signa-ture of both loess and paleosol units at Gorina Quarry. In addition,hematite was previously identified in sandy loess layers, whereasgoethite was identified in carbonate-rich paleosols (Bidegain, 1998;Bidegain et al., 2007). Variations in the contributions of theseminerals [S-ratio, HIRM, and G/(G þ H); Fig. 3] and the amount ofultrafine-grained magnetic minerals (<w25e30 nm), indicated bythe frequency dependence of magnetic susceptibility (cfd%; Fig. 3),resulted in mass susceptibility (c) values ranging from 0 to3�10�6 m3/kg (Fig. 3). The most pronounced mineralogical changeoccurred between 2.6 and 7 m where there was a decrease in therelative contribution of low-coercivity minerals (lower S-ratiovalues; Fig. 3). In addition, the relative amount of goethite to thetotal amount of high-coercivity minerals was much less variableand slightly lower from 0 to 7m than it was below 7m ([G/(Gþ H)];Fig. 3).
In general, the magnetic grain size appears to be dominatedby larger pseudo-single domain (PSD) grains (Mrs/Ms valuesbetween 0.1 and 0.2; Fig. 3) (Day et al., 1977; Thompson andOldfield, 1986). The ARM/K and ARM/SIRM records are generallyin-phase with Mrs/Ms while the SIRM/K record is not (Fig. 3). TheSIRM/K record resembles all three concentration parameters(c, SIRM, and ARM) and HIRM from 0 to 6.8 m (Pu1ePu3; Fig. 3).From 6.8 to 9.1 m (Pu4), the SIRM/K does not resemble any of theother parameters, but from 9.1 m to the base of the section(Pu5ePu6) it is in-phase with ARM30 mT/ARM (Fig. 3). In addition,the cfd% record is in-phase with the ARM/K, ARM/SIRM, andMrs/Msrecords for the entire section (Fig. 3).
The ARM30 mT/ARM record illustrates a phase opposition relativeto ARM/K and ARM/SIRM (Fig. 3), suggesting finer magnetic grainsizes when the other parameters indicate coarsening. Although theARM ratio contradicts the other grain size proxies, it is in-phasewith the bulk grain size variations determined by Zárate et al.(2002); the highest ARM30 mT/ARM values (finest magneticgrains) corresponded to clayey silts while the lowest values(coarsest magnetic grains) corresponded to sandy silts.
These parameters and ratios indicate that coarse-grainedminerals dominate the sediment of Gorina Quarry, however, thereappears to be a wide range of grain sizes (e.g., high cfd% valuesindicative of ultrafine-grained minerals) present and mineralogicalvariations confound the parameters even further. This result isconsistent with previous studies by Orgeira et al. (1998) whodetermined that MD magnetite was the dominant carrier of themagnetic signal and by Bidegain et al. (2005) who found a widegrain size range for the magnetite in their record. Magneticvariations were characterized with respect to the six pedologicunits below.
5.2.1. Pedologic unit 1This unit consists of the present surface soil and its parent loess
(Zárate et al., 2009). There is an erosional surface at 2.95 m that

Fig. 3. Sedimentological log showing pedogenic units of Zárate et al. (2002). Environmental magnetic parameters used to characterize concentration, grain size, and mineralogicalchanges; parameters and ratios are discussed in Section 3 of the text.
C.W. Heil Jr. et al. / Quaternary Science Reviews 29 (2010) 2705e27182710
marks a dramatic change in the environmental magnetic properties(Fig. 3). Previous studies interpreted the erosional surface as theboundary between the most recent pedologic unit (Pu1) and theprevious pedologic unit (Pu2) (Zárate et al., 2002), but a recentreinterpretation by Zárate et al. (2009) indicates that the erosionalsurface was formed in the lower portion of Pu1. This reinterpreta-tion is noteworthy because the magnetic properties below theerosional surface are more similar to those of Pu2 than those of Pu1(Fig. 3). Above the erosional surface (the AeCk2 horizons; 0e2.6m),there is an abrupt increase in concentration parameters and anapparent fining in the grain size parameters with the exception ofARM30 mT/ARM (Fig. 3). In addition, there is an increase in the totalamount of high-coercivity minerals coincident with a relativeincrease in low-coercivity minerals (higher HIRM and S-ratiovalues, respectively; Fig. 3). The cfd% increases slightly (approach-ing 6%) in the B horizons (0.4e1 m) but decreases in the A horizon(0e0.4 m). This decrease is associated with decreases in c, S-ratio,and, to a lesser degree, HIRM. The Ck3 horizon (2.6e2.95 m) of thisunit is markedly different than the Ck1 and Ck2 horizons (1e2.6 m)above in that it is characterized by low c, S-ratio, and HIRM values.
5.2.2. Pedologic units 2 and 3The Pu4ePu3ePu2 pedocomplex was differentiated by macro-
scale sedimentologic and possible diagnetic factors by Zárate et al.(2002). Based on our environmental magnetic properties, Pu2 andPu3 are similar and are considered together, whereas Pu4 isdistinctive and is considered separately. The Pu2 and Pu3 units arecharacterized by low c, cfd%, and HIRM values, with the exceptionof high c and HIRM values at the Pu2/Pu3 boundary (Fig. 3). The
S-ratio and ARM30 mT/ARM are highly variable throughout theseunits. The Pu3 unit is characterized by lower S-ratio values andhigher ARM30 mT/ARM values than the overlying Pu2 unit, but thistransition begins in the upper portion of the Pu3 unit. These unitsconsist entirely of B horizons that have varying amounts ofcarbonate content and have been exposed to periodic or permanentreduction (Zárate et al., 2002). In addition, these units consist ofclayey silts, making them the finest grain size of the entire section(Zárate et al., 2002).
5.2.3. Pedologic unit 4Unlike Pu3 and Pu2, this unit consists of A, B and C horizons. This
unit is generally characterized by high c, S-ratio, and HIRM values,but these values begin to decrease toward the low values of theoverlying Pu3/Pu2 units in the A horizon (w6.8e7.4 m; Fig. 3). Ingeneral, the magnetic grain size parameters indicate the presenceof finer grains. However, the ARM30 mT/ARM record is contradictoryand suggests a coarsening of the magnetic grain size. The evidencefor coarsening is consistent with an increase in bulk grain size tosandy silts (Zárate et al., 2002). The grain size parameters change inthe C horizons (w8.5e9.1 m) of the lower portion of the unit. Thecfd% values indicate that there is little or no production of ultrafine-grained magnetic minerals in the C horizons, which is consistentwith the typical unaltered nature expected in parent material.
5.2.4. Pedologic unit 5The upper boundary of this unit is truncated by an erosional
surface at the top of a Bt horizon (9.1 m; Zárate et al., 2002). Theunit grades into a BC and then a BCk horizonwithin the topw1.5 m

C.W. Heil Jr. et al. / Quaternary Science Reviews 29 (2010) 2705e2718 2711
(9.1e10.5 m) at which point there are abundant carbonate nodules(Fig. 3). The upper 1.5 m of this unit are characterized by inter-mediate c and HIRM values, and the highest cfd% values (>8%)of the section. The remainder of the unit is a BCk horizon(10.5e12.9 m) and is characterized by higher magnetic concentra-tions and intermediate cfd% values. The ARM30 mT/ARM record isconsistent with bulk grain size variations in the upper 1.5 m of theunit and indicates coarser magnetic grains in a sandy silt matrix(Zárate et al., 2002), which is contradictory to the other magneticgrain size parameters (Fig. 3).
5.2.5. Pedologic unit 6This unit is similar to Pu5 in that it contains a surface Bt horizon
with an underlying BCk horizon(s). The Bt horizon (12.9e13.8 m) ischaracterized by intermediate c, cfd%, and HIRM values (Fig. 3). Theout-of-phase magnetic grain size relationship persists throughoutthis unit such that low ARM30 mT/ARM values indicate generallycoarser magnetic grains while other parameters suggest finermagnetic grain sizes. There is an increase in the ultrafine-grainedcomponent (cfd%) atw13.8 m, which is coincident with an increasein the abundance of carbonate nodules (Fig. 3). The BCk interval(13.8e16 m) is characterized by variable (intermediate to high) c,S-ratio, and HIRM values.
6. Discussion
6.1. Magnetic grain size
Magnetic grains size records are an important paleoenvir-onmental proxy that have the potential to provide insight intodepositional and/or postdepositional processes. Themagnetic grainsize parameters used in this study are convenient, qualitativemeasures but must be considered in the context of magneticmineralogical and concentration changes. This is evident in theapparent discrepancy between the ARM30 mT/ARM ratio and theother well-established grain size proxies (Mrs/Ms, ARM/K, ARM/SIRM, and SIRM/K). These interparametric ratios can be confoundedby mineralogical variations and contributions by nonremanence-carrying grain sizes (<30 nm), much like those observed in theGorina Quarry section (Fig. 3). The two parameters that are leastaffected by mineralogical variations are ARM30 mT/ARM and cfd%.The ARM ratio is sensitive to fine-grained ferrimagnetic minerals(Dunlop and Özdemir, 1997) while cfd% reflects the relativecontribution of superparamagnetic material (<w25e30 nm;Dunlop and Özdemir, 1997).
Typical cfd% values associated with the formation of ultrafine-grained minerals during pedogenesis are w5e8% (Liu et al., 2007and references therein). Based on the C horizons preserved atGorina Quarry, typical non-pedogenic cfd% values range from 4 to5% (Pu1 and Pu4; Fig. 3). In addition, the lowest cfd% values atGorina Quarry (<4%, but typically w2%) appear to be associatedwith reducing conditions in poorly drained soil horizons (Pu2 andPu3; Fig. 3) (Zárate et al., 2002). This is consistent with the findingsof Bidegain et al. (2005) who found similarly low cfd% values fromother gleyed soils in the region. Reducing conditions, commonlyassociated with soil gleying, result in the destruction of fine-grained ferrimagnetic minerals (Maher, 1986; Liu et al., 2001;Bidegain et al., 2005). Since cfd% appears to be an indicator ofpostdepositional formation and/or destruction of ultrafine-grainedmagnetic minerals, it is likely that Mrs/Ms, ARM/K, and ARM/SIRMare also indicators of postdepositional grain size variations (ina larger size range) since those records respond in-phase with cfd%.Conversely, the ARM30 mT/ARM values respond in the oppositemanner to the other grain size parameters but more closely matchthe bulk grain size variations determined by Zárate et al. (2002).
This relationship suggests that the ARM ratio is an indicator ofdepositional changes in fine-grained ferrimagnetic minerals. Thisresult is consistent with the findings of Blanchet et al. (2007) whofound that the ARM ratio demonstrated a linear relationship to theclay/silt ratio (from a terrigenous source) while contradicting theother magnetic grain size proxies (e.g., ARM/K and SIRM/K).
6.2. Wind patterns
The relationship outlined above suggests that ARM30 mT/ARMmaybeconsideredas a continuousanalog forvariations inbulkgrainsize changes in the Gorina Quarry section. In general, there aresystematic grain size changes (bulk andmagnetic) at pedologic unitboundaries (Fig. 3) and, based on our age model, it is apparent thatlargeamplitudevariations inARM30mT/ARMoccurona500e600-katimescale (Fig. 4a), which equates to a 1e1.2 Ma cycle. Berger andLoutre (1991) demonstrated that a 1.19-Ma period can be gener-ated by the 41.09-ka and 39.71-ka periods of obliquity for the last10 Ma. A comparison of our ARM30 mT/ARM record to the obliquitysignal filtered at 1.2-Ma demonstrated a good agreement betweenthe records over the 0.4e1.94 Ma time period (Fig. 4a). The rela-tionship indicates that finer magnetic grain sizes (higher ARM30 mT/ARM values) occurred during periods of high obliquity amplitude.Oxygen isotope records indicate that glaciations are stronger duringperiods of high amplitude obliquity (e.g., Lisiecki and Raymo, 2005),which means that magnetic (and bulk) grain size in our record wasfinest during strong glacial intervals. At face value, this appears to becounterintuitive since it is generallyaccepted that glacial periods areassociatedwith strongerwinds and strongerwinds can carrycoarsermaterial longer distances (Pye, 1987, p. 51). We propose a mecha-nism to explain this grain size phenomenon that involves a north-ward displacement of the continental high-pressure cell duringglacial periods.
The present configuration of atmospheric pressure at sea levelduring austral winter has a small high-pressure cell centered at34�S and 64�W (Fig. 5a; Schwerdtfeger, 1976). Marine records fromthe southeast Atlantic and southeast Pacific indicate that theAntarctic Circumpolar Current is displaced northwards duringglacial periods (e.g., Becquey and Gersonde, 2002; Lamy et al.,2004) and as a result, atmospheric circulation patterns areaffected in the same manner (e.g., Heusser, 1991). Based on thesestudies, it is likely that the high-pressure cell located over centralSouth America is displaced northward during glacial intervals. Wepropose a scenario in which the extent of this northwarddisplacement is related to the strength of glaciations, such thatstronger glaciations result in a more northerly displacement(Fig. 5b and c). It is possible that this differential displacement ofthe high-pressure cell is a factor controlling the magnetic grain sizein the sediments deposited at Gorina Quarry.
This model provides a mechanism to alter wind patterns insubtropical South America over glacial/interglacial timescales, butit is necessary to consider how these positional changes translate tochanges in the magnetic grain size of the loess deposited at ourstudy location. Like bulk grain size, changes in magnetic grain sizeare controlled by the type of source sediment(s), proximity to thesource(s), and wind strength and/or direction. Zárate and Blasi(1993) suggest that loess deposited in southern Buenos Aires wasderived from the lower reaches of the Rio Colorado and Negro,which both derive their sediment from Patagonia and the southcentral Andes. Of these two similar source regions, the Rio Coloradoand Negro source region is closer to our study location. In ourmodel, the high-pressure cell is located closer to the Rio Coloradoand Negro source region during weaker glacial periods (Fig. 5b)than it is during stronger glacial periods (Fig. 5c). Winds from thehigh-pressure cell are likely to carry sediment from the Rio
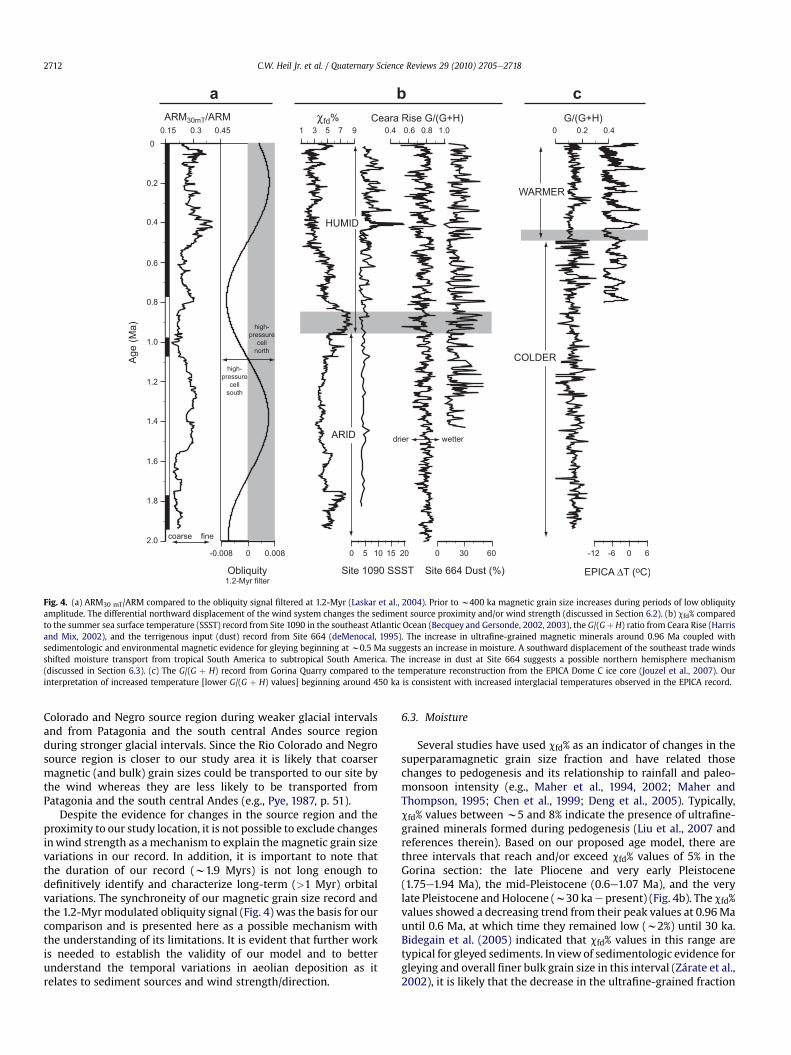
Fig. 4. (a) ARM30 mT/ARM compared to the obliquity signal filtered at 1.2-Myr (Laskar et al., 2004). Prior to w400 ka magnetic grain size increases during periods of low obliquityamplitude. The differential northward displacement of the wind system changes the sediment source proximity and/or wind strength (discussed in Section 6.2). (b) cfd% comparedto the summer sea surface temperature (SSST) record from Site 1090 in the southeast Atlantic Ocean (Becquey and Gersonde, 2002, 2003), the G/(G þ H) ratio from Ceara Rise (Harrisand Mix, 2002), and the terrigenous input (dust) record from Site 664 (deMenocal, 1995). The increase in ultrafine-grained magnetic minerals around 0.96 Ma coupled withsedimentologic and environmental magnetic evidence for gleying beginning at w0.5 Ma suggests an increase in moisture. A southward displacement of the southeast trade windsshifted moisture transport from tropical South America to subtropical South America. The increase in dust at Site 664 suggests a possible northern hemisphere mechanism(discussed in Section 6.3). (c) The G/(G þ H) record from Gorina Quarry compared to the temperature reconstruction from the EPICA Dome C ice core (Jouzel et al., 2007). Ourinterpretation of increased temperature [lower G/(G þ H) values] beginning around 450 ka is consistent with increased interglacial temperatures observed in the EPICA record.
C.W. Heil Jr. et al. / Quaternary Science Reviews 29 (2010) 2705e27182712
Colorado and Negro source region during weaker glacial intervalsand from Patagonia and the south central Andes source regionduring stronger glacial intervals. Since the Rio Colorado and Negrosource region is closer to our study area it is likely that coarsermagnetic (and bulk) grain sizes could be transported to our site bythe wind whereas they are less likely to be transported fromPatagonia and the south central Andes (e.g., Pye, 1987, p. 51).
Despite the evidence for changes in the source region and theproximity to our study location, it is not possible to exclude changesinwind strength as a mechanism to explain the magnetic grain sizevariations in our record. In addition, it is important to note thatthe duration of our record (w1.9 Myrs) is not long enough todefinitively identify and characterize long-term (>1 Myr) orbitalvariations. The synchroneity of our magnetic grain size record andthe 1.2-Myr modulated obliquity signal (Fig. 4) was the basis for ourcomparison and is presented here as a possible mechanism withthe understanding of its limitations. It is evident that further workis needed to establish the validity of our model and to betterunderstand the temporal variations in aeolian deposition as itrelates to sediment sources and wind strength/direction.
6.3. Moisture
Several studies have used cfd% as an indicator of changes in thesuperparamagnetic grain size fraction and have related thosechanges to pedogenesis and its relationship to rainfall and paleo-monsoon intensity (e.g., Maher et al., 1994, 2002; Maher andThompson, 1995; Chen et al., 1999; Deng et al., 2005). Typically,cfd% values between w5 and 8% indicate the presence of ultrafine-grained minerals formed during pedogenesis (Liu et al., 2007 andreferences therein). Based on our proposed age model, there arethree intervals that reach and/or exceed cfd% values of 5% in theGorina section: the late Pliocene and very early Pleistocene(1.75e1.94 Ma), the mid-Pleistocene (0.6e1.07 Ma), and the verylate Pleistocene and Holocene (w30 kae present) (Fig. 4b). The cfd%values showed a decreasing trend from their peak values at 0.96Mauntil 0.6 Ma, at which time they remained low (w2%) until 30 ka.Bidegain et al. (2005) indicated that cfd% values in this range aretypical for gleyed sediments. In viewof sedimentologic evidence forgleying and overall finer bulk grain size in this interval (Zárate et al.,2002), it is likely that the decrease in the ultrafine-grained fraction

Fig. 5. Schematic representation of the location of atmospheric pressure cells and associated wind patterns during interglacial periods (a), weaker glacial periods (b), and strongerglacial periods (c). The increased northward displacement during stronger glacial periods increases the distance between Gorina Quarry and the source region, resulting in finermagnetic grain sizes. The black square and the black triangles in (b) and (c) represent the location of the Rio Colorado/Negro source region and the Patagonia/Andes source region(Smith et al., 2003), respectively. The present configuration (a) is taken from Schwerdtfeger (1976). The star indicates the location of Gorina Quarry.
C.W. Heil Jr. et al. / Quaternary Science Reviews 29 (2010) 2705e2718 2713
resulted from intermittent reducing conditions associatedwith waterlogged soils (Maher, 1986; Liu et al., 2001; Bidegainet al., 2005).
Herewe focus on the notable increase in cfd% that occurs around0.96 Ma (Fig. 4b) and the apparent increased humidity from thatpoint on. The timing of this increase is similar to that of the mid-Pleistocene transition (MPT) which is characterized by a changefrom a world dominated by the 41 ka obliquity cycle to the 100 kaeccentricity cycle around 0.9 Ma (Raymo et al., 1989; Ruddimanet al., 1989). Much of the work relating to the MPT has come frommarine isotopic studies (e.g., Raymo et al., 1997; Huybers, 2007),but there are limited studies relating oceanic changes associatedwith the MPT to a terrestrial environment. Here we attempt tomake that connection and provide plausiblemechanisms to explainthe changes observed in our record.
Several studies indicate that the transport ofmoisture to tropicalSouth America is influenced by the position and strength of theSouth Atlantic Anticyclone (SAA) and the Pacific Anticyclone (PA)(e.g., Villagrán, 1993; Cruz et al., 2006). Based on these studies, wecompared our cfd% record to the summer sea surface temperature(SSST) record from the South Atlantic sector of the Southern Oceanof Becquey and Gersonde (2002, 2003; Fig. 4b). Their SSST recon-structions along a northesouth transect across the AntarcticCircumpolar Current (ACC) fromODP Leg 177 showed themigrationof the oceanic frontal systems (the Subtropical Front, the Subant-arctic Front and the Polar Front) throughout the Pleistocene andHolocene (Becquey and Gersonde, 2002, 2003). Their results for theearly to mid-Pleistocene (1.83e0.87 Ma) indicated generally lowSSST values (3e5 �C) with minor changes (w2 �C) between glacialand interglacial periods, suggesting a northward shift of the Polar
Front Zone (PFZ) by about 7� latitude relative to its present position(Becquey and Gersonde, 2002). Based on our record, the driestconditions in central eastern Argentina occurred from w0.96 to1.93Ma, when SSSTs were lowest and least variable between glacialand interglacial stages (Fig. 4b). We attribute the relative aridity ofcentral eastern Argentina during this time period to the diminishedstrength and northward displacement of the SAA associated withcolder SSSTs, and a 7� northward shift of the PFZ. In this state, thediminished strength of the SAA carried less moisture to tropical andsubtropical South America (Fig. 6a).
During the mid- to late Pleistocene and Holocene, SSSTs in theSouthern Ocean increased and became more variable (Fig. 4b)(Becquey and Gersonde, 2003). Although glacial SSSTs increasedslightly, interglacial SSSTs increased in two steps. The first increaseoccurred around 0.87 Ma and the second, more dramatic increaseoccurred at 0.43 Ma (Fig. 4b). With these warmer interglacial SSSTs,the PFZ shifted southward toward its present location, as is likely tohappen with the SAA (Fig. 6b). In this configuration, the southerntrade winds were in a more southerly location allowing for moremoisture to be carried to subtropical South America.
To support our model, we compared our record to the G/(G þ H)of ODP Site 926, the Ceara Rise (Harris and Mix, 1999, 2002). Thesediments from this location reflect changes in continental erosionrelating to climatic and tectonic mechanisms, and the G/(G þ H)record is used as a proxy for precipitation in the Amazon lowlandsor the pre-Amazon drainage areas (Harris and Mix, 1999, 2002).They related the G/(G þ H) ratio to precipitation such that highvalues indicated increased precipitation in the terrigenouslowlands. The G/(Gþ H) record from Ceara Rise shows a decrease inratio values beginning around 0.95 Ma (Fig. 4b) indicating that

Fig. 6. Position of the South Atlantic Anticyclone (SAA) for (a) the early to mid-Pleistocene (0.96e1.93 Ma) and (b) the mid- to late Pleistocene and Holocene (0.96 Ma-present). Thepresent position of the SAA is taken from Peterson and Stramma (1991). The white arrow in each diagram indicates the relative position of the southern trade winds (and associatedmoisture transport direction). The dashed lines are a schematic representation of the frontal zones of the Antarctic Circumpolar Current (from Peterson and Stramma, 1991);Subtropical Front (STF), Subantarctic Front (SAF), and the Polar Front (PF). The positions of these hydrographic boundaries are shown relative to the location of the SSSTreconstruction of ODP Site 1090, the G/(G þ H) record of Ceara Rise (Site 926), and the dust record of Site 664. The star indicates the location of Gorina Quarry.
C.W. Heil Jr. et al. / Quaternary Science Reviews 29 (2010) 2705e27182714
precipitation decreased in the Amazon lowlands after the mid-Pleistocene. This result is consistent with the redirection ofmoisture from tropical South America to subtropical South Americaassociated with the southward displacement of the SAA andsouthern trades proposed in our model.
Our model provides a southern hemisphere mechanism toexplain changes in moisture to tropical and subtropical SouthAmerica around 1 Ma, but it is possible that the intensification ofnorthern hemisphere glaciation around that time (Ruddiman et al.,1989; Raymo, 1994) may have altered the position and strength ofthe trade winds. Marine records of African climate variability showan increase in the concentration of aeolian sediment around 1 Ma(deMenocal, 1995). Model simulations show that cold NorthAtlantic sea surface temperatures (SSTs) strengthen the subtropicalAtlantic high-pressure cell resulting in strengthened northeasttrade winds (deMenocal, 1995). The combination of cold SSTs andstrengthened winds led to increased African aridity and theresulting increase in aeolian material in the marine records.Ruddiman and Janecek (1989) suggested that increased dust flux toequatorial Atlantic Site 664 (ODP Leg 108) may have been the resultof a more southerly position of the Intertropical Convergence Zone(ITCZ) over Africa. A comparison of the amount of terrigenousdetritus from Site 664 (deMenocal,1995) to our cfd% record (Fig. 4b)indicates an initial increase in dust just prior to 1.2 Ma and a secondincrease just prior to 0.9 Ma, which is similar in timing to theincrease in moisture from our record (increased cfd% at 0.96 Ma). Ifthe ITCZ was in a more southern position beginning around thattime, the southeast trades would have been in a more southerlyposition as well, providing the same change in moisture transportsuggested in our model.
Having presented two scenarios to explain the changesobserved in our record, it seems increasingly likely that the position
and/or strength of the southeast tradewinds changed around 1Ma,similar in timing to the MPT. At this point it is unclear whether onescenario is the dominant mechanism controlling moisture trans-port to subtropical South America or if both processes are involved.
6.4. Temperature
Schwertmann (1988) and Kämpf and Schwertmann (1983)indicated that the formation of hematite (aFe2O3) and goethite(aFeOOH) is related, at least in part, to moisture and temperature insuch a way that the relative amount of goethite increases expo-nentially as excess moisture increases, whereas the amount ofhematite increases with increased air temperature. Our environ-mental magnetic record indicates a decrease in the G/(G þ H) ratioaround 500 ka (Fig. 4c) that can be attributed to several factorsincluding increasing air temperature, decreasing moisture,decreasing soil organic matter, or increasing pH (Kämpf andSchwertmann, 1983). Although it is difficult to elucidate thesefactors on magnetic proxies alone, we attempted to exclude severalfactors based on other environmental magnetic properties andsedimentologic evidence. Based on our previous discussion aboutmoisture, it does not appear that moisture decreased during thistime interval. Since soil moisture is intimately linked to vegetation,it is also likely that soil organic matter did not decrease. In addition,the presence of calcium carbonate nodules throughout the sectionsuggests that therewas no appreciable change in soil pH. Therefore,it is likely that this decrease in G/(G þ H) is related to an increase intemperature. Based on these assumptions, our conclusions aboutincreasing temperature are consistent with the high-resolutiontemperature reconstruction obtained from the EPICA Dome C icecore (Jouzel et al., 2007) that showed an increase in interglacialtemperatures by as much as 6 �C (relative to the average

Fig. 7. Wavelet (a) and spectral (b) analysis of G/(G þ H) from Gorina Quarry. Several cycles are identified (41, 125, 250, 400 ka), however, their presence is variable, as indicated bythe wavelet analysis. The shaded horizontal bars in (b) represent the typical Milankovitch orbital periodicities. (c) G/(G þ H) record versus age. Wavelet software was provided byC. Torrence and G. Compo, and is available at URL: http://atoc.colorado.edu/research/wavelets/. Spectral analysis was performed using REDFIT 3.5 (Schulz and Mudelsee, 2002).
C.W. Heil Jr. et al. / Quaternary Science Reviews 29 (2010) 2705e2718 2715
temperature of the last 1000 years) since the mid-Brunhes Event(w450 ka; Jouzel et al., 2007).
6.5. Pedogenesis and insolation
The sedimentology and micromorphology of the Gorina Quarrysection (Zárate et al., 2002) indicate that, with the exception of thesurface soil (Pu1), the sequence has a complex pedosedimentaryhistory of welding that inhibits differentiation of discrete paleosolunits. The pedologic units identified by Zárate et al. (2002), anddiscussed in this study, are basedmore on grain size variations thanon macro or micromorphological evidence of pedosedimentaryprocesses. Kemp and Zárate (2000) described a pedosedimentarymodel for Pliocene deposits in the southern Pampas of Argentinathat involved continuous pedogenesis during periods of deposition,resulting in continual alteration of loess and previous soil horizons.It is likely that this model is an appropriate analog for the sequenceat Gorina Quarry (Zárate et al., 2002). Despite the complex
400 500Aus. Summer Insolation
0 0.03 0.06Eccentricity
χfd%
1300
1350
1400
1450
1500
1550
1300
1350
1400
1450
1500
1550
Age
(ka) Age (ka)
543
a
Fig. 8. (a) The cfd% record from 1.3 to 1.55 Ma compared to eccentricity and austral summer iand eccentricity (p-value ¼ 0.0273). Preservation of ultrafine-grained ferrimagnetic minerals0 to 250 ka compared to eccentricity and austral summer insolation from 30�S (Laskar et alperiods of high eccentricity and insolation (p-value ¼ 0.0239). The shaded horizontal bar i2002). The ultrafine-grained minerals are depleted in the A horizon which corresponds to
depositional and pedogenic history of the Pliocene deposits, Kempand Zárate (2000) identified cyclic behavior in sedimentation andpedogenesis. They determined that periods of reduced sedimen-tation and stable landscapes resulted in clearly defined eluvial andilluvial horizons while periods of increased sedimentation resultedin welding of new pedologic features on existing soils. If the samepedosedimentary model is a reasonable analog for sedimentationand pedogensis at Gorina Quarry, it is reasonable to expect at leastsome degree of depositional and/or pedogenic cycles to bepreserved in the sediment record of Gorina Quarry.
It is apparent from variations in magnetic grain size and bulkgrain size that the Gorina Quarry sequence records long-wave-length (w1.2 Ma; Fig. 4a) changes in deposition relating to changesin wind patterns and source regions. In addition, spectral andwavelet analysis of the G/(G þ H) ratio indicates cyclic behaviorrelating to postdepositional processes (Fig. 7). The periodogramshows peaks in the mid and low frequency range (w41, 125, 250,and 400 ka periods) (Fig. 7b) and the wavelet shows the variable
6χfd%
0 0.03 0.06Eccentricity
400 500Aus. Summer Insolation
0
50
100
150
200
250
0
50
100
150
200
250
Age
(ka) Age (ka)
3 0b
nsolation from 30�S (Laskar et al., 2004). There is a significant correlation between cfd%(high cfd% values) corresponds to high eccentricity and highest insolation. (b) cfd% from., 2004) indicating the preservation of ultrafine-grained ferrimagnetic minerals duringn the top of (b) corresponds to the A horizon of the present surface soil (Zárate et al.,relatively low insolation and low eccentricity.

Table 1General characteristics of Argentine loess/paleosol record compared to Alaskan and Chinese.
Location Argentina (Gorina Quarry) Alaska China
Sedimentation rates 0.38e1.2 cm/ka (excluding Pu1 9 cm/ka) w6.5 cm/ka (Begét et al., 1990) w6e18 cm/ka (Lu and Sun, 2000)
Discrete paleosols Rare (only two A horizons preserved) Prominent Prominent
Interglacials Pedogenic depletion of ferrimagnetic minerals;lower magnetic concentration
Pedogenic depletion of ferrimagneticminerals; lower magnetic concentration
Pedogenic enhancement of magneticminerals; higher magnetic concentration
Glacials Deposition of ferri and antiferromagneticmagnetic minerals; coarser grained duringweaker glacials; higher magnetic concentration
Deposition of ferrimagnetic minerals;coarser grains during stronger glacials;higher magnetic concentration
Deposition of ferri and antiferromagneticmagnetic minerals; coarser grains duringglacials; lower magnetic concentration
Orbital periods Present sporadically Present prominently Present prominently
C.W. Heil Jr. et al. / Quaternary Science Reviews 29 (2010) 2705e27182716
presence of these periods throughout the section (Fig. 7a).Although these periods are similar to Milankovitch-type orbitalperiods, the uncertainties associated with the broad peaks andintermittent presences suggest that other mechanisms (e.g.,regional climate) play an important role in postdepositionalprocesses. A rigorous characterization of the spectral properties ofthe Gorina Quarry section is beyond the goals of this paper. Thespectral and wavelet analysis was intended to demonstrate that,despite the pedosedimentary complexity of the section, the envi-ronmental magnetic properties record cyclic behavior like thePliocene sections of Kemp and Zárate (2000).
Although the spectral record fromGorina Quarry is complex andvariable, there are portions of the record that suggest relationshipsto eccentricity and insolation (Fig. 8). Here we examine the cfd%record from two time intervals and discuss notable similaritieswhen compared to the eccentricity record and austral summerinsolation. The first interval spans the time period 1.3e1.55 Ma andcovers the lower portion of Pu5. The cfd% records a relatively higheramount of ultrafine magnetic minerals (higher cfd% values) duringpeak eccentricity and higher amplitude insolation (Fig. 8a).There appears to be a significant correlation between eccentricityand the amount of ultrafine-grained ferrimagnetic minerals(p-value ¼ 0.0273). Considering the relationship between cfd% andprecipitation (e.g., Maher et al., 1994, 2002; Maher and Thompson,1995; Chen et al., 1999; Deng et al., 2005) it is likely that precipi-tation increased during intervals of higher amplitude insolation.However, the cfd% values are lower than those resulting frompedogenic enhancement (>5%; Liu et al., 2007). It is likely that ourdata record changes in the preservation of ultrafine-grainedmagnetic minerals during pedogenesis versus their formation. Thisinterpretation would be similar to that invoked for the Alaskan andSiberian loess/paleosol records that display pedogenic destructionof ferrimagnetic minerals (Begét and Hawkins,1989; Liu et al., 2001,2008). In these records, the destruction of ferrimagnetic mineralswas caused by increased temperature and moisture that increasedthe reducing potential of the soils (Liu et al., 2008). If the sameprocess occurred in this interval at our location, then it wouldappear that the pedogenic destruction of the ferrimagneticminerals occurred during periods of lower eccentricity and lowerinsolation amplitude, which would imply that these periods werewetter and/or warmer. Since it seems unlikely that it would bewarmer during periods of low insolation amplitude, it is likely thatsoil moisture was higher during these times due to either increasedprecipitation or lower evaporation.
A similar relationship exists among cfd%, eccentricity and inso-lation for the period 30e250 ka (p-value ¼ 0.0239) (Fig. 8b). Thisinterval spans all of Pu2 and the upper portion of Pu3 and appearsto have been subjected to a degree of gleying. The reducingconditions associated with gleyed soils are likely to diminish theamount of ferrimagnetic minerals, which is reflected by the lowestS-ratio values of the entire sequence (Fig. 3). Although this intervalwas deposited/altered during a different climatic regime than the
older interval discussed above, it appears as though eccentricityand insolation played a similar role in the preservation of ferri-magnetic minerals.
In addition, the A horizon of the surface soil (Pu1) appears to bediminished in ferrimagnetic minerals compared to the B and C(loess) horizons (Fig. 3). The decrease in ferrimagnetic minerals inthe A horizon corresponds to a decrease in eccentricity and rela-tively low insolation amplitude (shaded region in Fig. 8b).
The evidence from these intervals suggests insolation is animportant factor in the preservation of ferrimagnetic mineralsduring pedogenesis. Although the relationship does not persistthroughout the entire sequence (e.g., the interval between 0.8 and1.1 Ma), it seems as though the magnetic record of pedogensis fromthe Gorina Quarry sequence is more similar to the Alaskan loesssequences than the Chinese loess sequences. A comparison of thegeneral characteristics of the Gorina Quarry loess/paleosolsequence to those of the Alaskan and Chinese loess/paleosolsequences are outlined in Table 1. Although there are more simi-larities between our record and the Alaskan sequences compared tothe Chinese sequences, it is worth noting the profound difference insedimentation rates (Table 1). The average sedimentation ratesfrom Alaska and China are at least 6 times higher (Begét et al., 1990;Lu and Sun, 2000) than those in our record. Whether the lowsedimentation rates in our record are the result of diminisheddeposition or erosion, it appears as though they are a limiting factorin the preservation and/or recording of climate cycles. This point isaccentuated in Pu1, which has an average sedimentation rate of9 cm/kyr (within the range of the Alaskan and Chinese sequences)and demonstrates the well-developed soil horizons that defineglacial/interglacial boundaries in both China and Alaska.
7. Conclusions
We characterized the environmental magnetic record for thelast w1.9 Ma from the central eastern Pampas of Buenos Aires,Argentina. Thew16 m section resulted from the accretion of coarseto fine grained aeolian material and consists of six pedologic units.Although the pedologic units are distinguished by bulk sedimen-tological changes and not by macro or micromorphological pedo-genic indicators, there are systematic changes in the environmentalmagnetic properties associated with each pedologic unit. Under-standing these changes in the context of depositional and/orpostdepositional processes provide some insight into potentialmechanisms relating to regional and global climate change.
Using a paleomagnetic reversal stratigraphy and opticallystimulated luminescence ages, we constrained the timing of severalsedimentological and environmental magnetic changes and relatedthem to major climate transitions with plausible mechanisms:
e Long-wavelength (w1.2 Ma) cycles in ferrimagnetic mineralgrain size and bulk grain size were attributed to a differential

C.W. Heil Jr. et al. / Quaternary Science Reviews 29 (2010) 2705e2718 2717
northward displacement of the high-pressure cell and theassociated winds.
e An increase in the amount of ultrafine-grained magneticminerals coupled with sedimentologic evidence suggests anincrease in moisture at 0.96 Ma. This change in moistureavailability was linked to a southward displacement of thetradewinds and the associatedmoisture at themid-Pleistocenetransition, caused by increased sea surface temperatures in theSouth Atlantic or by a decrease in North Atlantic sea surfacetemperatures.
e A relative decrease in the amount of goethite over hematitesuggested that temperature increased at our study locationaround 500 ka, which is similar in timing to the temperatureincrease observed in the EPICA Dome C ice core recordfollowing the mid-Brunhes Event (w450 ka).
e Although the spectral record is inconsistent, it is evident thatorbital and non-orbital cycles are recorded (if only intermit-tently) in the environmental magnetic record from GorinaQuarry.
e Portions of the magnetic record demonstrated a relationship toeccentricity and insolation such that ultrafine-grained ferri-magnetic minerals were destroyed during periods of lowinsolation. This evidence suggests that the magnetic model forpedogensis is more similar to that of the Alaskan loesssequences than the Chinese loess sequences.
This study presented one of the longest and most continuousenvironmental magnetic records from the loess/loessoid depositsof Argentina. Our models and mechanisms are proposed to explainthe environmental magnetic and sedimentological variationsobserved at Gorina Quarry; however, it is evident that further workis required to test them. Despite the inherent uncertainties, it isclear that the environmental magnetic record from the loess andpaleosol deposits in the central eastern Pampas of Buenos Airesrecords major changes in deposition and soil formation.
Acknowledgements
This research was supported by NSF Grant EAR-0001047 andpartial support for C. Heil was from a NASA/RI Space GrantFellowship. We thank James King, Dane Sheldon, and CarolineGreene Hunt for their help in sample preparation. We’d also like tothank T. Evans and Q. Liu for their thoughtful reviews andcomments of this paper and an earlier version.
Appendix. Supplementary data
Supplementary data associated with this article can be found inthe online version, at doi:10.1016/j.quascirev.2010.06.024.
References
Becquey, S., Gersonde, R., 2002. Past hydrographic and climatic changes in theSubantarctic Zone of the South Atlantic e the Pleistocene record from ODP site1090. Palaeogeography, Palaeoclimatology, Palaeoecology 182, 221e239.
Becquey, S., Gersonde, R., 2003. A 0.55-Ma paleotemperature record from theSubantarctic zone: implications for Antarctic Circumpolar Current develop-ment. Paleoceanography 18 (1), 1014. doi:10.1029/2000PA000576.
Begét, J.E., Stone, D.B., Hawkins, D.B., 1990. Paleoclimatic forcing of magneticsusceptibility variations in Alaskan loess during the late Quaternary. Geology18, 40e43.
Begét, J.E., Hawkins, D.B., 1989. Influence of orbital parameters on Pleistocene loessdeposition in central Alaska. Nature 337, 151e153.
Berger, A., Loutre, M.F., 1991. Insolation values for the climate of the last 10 millionyears. Quaternary Science Reviews 10, 297e317.
Bidegain, J.C., 1998. New evidence of the Brunhes/Matuyama polarity boundary inthe Hernández-Gorina quarries, northwest of the city of La Plata, Buenos Aires
province, Argentina. Quaternary of South America and Antarctic Peninsula 11,207e228.
Bidegain, J.C., Evans, M.E., van Velzen, A.J., 2005. A magnetoclimatological investi-gation of Pampean loess, Argentina. Geophysical Journal International 160,55e62.
Bidegain, J.C., van Velzen, A.J., Rico, Y., 2007. The Brunhes/Matuyama boundary andmagnetic parameters related to climatic changes in Quaternary sediments ofArgentina. Journal of South American Earth Sciences 23, 17e29.
Blanchet, C.L., Thouveny, N., Vidal, L., Leduc, G., Tachikawa, K., Bard, E., Beaufort, L.,2007. Terrigenous input response to glacial/interglacial climatic variations oversouthern Baja California: a rock magnetic approach. Quaternary ScienceReviews 26, 3118e3133.
Blasi, A.M., Zárate, M.A., Kemp, R.A., 2001. Sedimentación y pedogénesis cuaternariaen el noreste de la pampa bonaerense:la localidad Gorina como caso de estudio.Asociación Argentina de Sedimentología, Revista 8, 77e92.
Chen, F.H., Bloemendal, J., Feng, Z.D., Wang, J.M., Parker, E., Guo, Z.T., 1999. EastAsian monsoon variations during Oxygen Isotope Stage 5: evidence from thenorthwest margin of the Chinese loess plateau. Quaternary Science Reviews 18,1127e1135.
Cruz Jr., F.W., Burns, S.J., Karmann, I., Sharp, W.D., Vuille, M., Ferrari, J.A., 2006.A stalagmite record of changes in atmospheric circulation and soil processes inthe Brazilian subtropics during the Late Pleistocene. Quaternary ScienceReviews 25, 2749e2761.
Day, R., Fuller, M., Schmidt, V.A., 1977. Hysteresis properties of titanomagnetites:grain-size and compositional dependence. Physics of the Earth and PlanetaryInteriors 13, 260e267.
Deng, C.L., Vidic, N.J., Verosub, K.L., Singer, M.L., Liu, Q.S., Shaw, J., Zhu, R.X., 2005.Mineral magnetic variation of the Jiaodao Chinese loess/paleosol sequence andits bearing on long-term climatic variability. Journal of Geophysical Research110 (B03103).
Dunlop, D., Özdemir, Ö, 1997. Rock Magnetism d Fundamentals and Frontiers.Cambridge University Press, New York, NY.
Fidalgo, F., De Francesco, F., Colado, U., 1973. Geología superficial de las hojasCastelli, J.M. Cobo y Monasterio (provincia de Buenos Aires). V CongresoGeológico Argentino 4, 27e39.
Frenguelli, J., 1957. Neozoico, en Geografía de la República Argentina. In: SociedadArgenntina de estudios Geográficos GAEA, Tomo II tercera parte, Buenos Aires.
Harris, S.E., Mix, A.C., 1999. Pleistocene precipitation balance in the Amazon Basinrecorded in deep sea sediments. Quaternary Research 51, 14e26.
Harris, S.E., Mix, A.C., 2002. Climate and tectonic influences on continental erosionof tropical South America, 0e13 Ma. Geology 30, 447e450.
Heller, F., Liu, T.S., 1986. Palaeoclimatic and sedimentary history from magneticsusceptibility of loess in China. Geophysical Research Letters 13, 1169e1172.
Heusser, C.J., 1991. Biogeographic evidence for late Pleistocene palaeoclimate ofChile. Bamberger Geographische Schriften 11, 257e270.
Huybers, P., 2007. Glacial variability over the last two million years: an extendeddepth-derived age model, continuous obliquity pacing, and the Pleistoceneprogression. Quaternary Science Reviews 26, 37e55.
Jouzel, J., Masson-Delmotte, V., Catan, O., Dreyfus, G., Falourd, S., Hoffmann, G.,Minster, B., Nouet, J., Bartola, J.M., Chappellaz, J., Fischer, H., Gallet, J.C.,Johnsen, S., Leuenberger, M., Loulergue, L., Luethi, D., Verter, H., Parrenin, F.,Raisbeck, G., Raynaud, D., Schilt, A., Schwander, J., Selmo, E., Souchez, R.,Spahni, R., Stauffer, B., Steffensen, J.P., Stenni, B., Stocker, T.F., Tison, J.L.,Werner, M., Wolf, E.W., 2007. Orbital and millennial Antarctic climate variabilityover the past 800,000 years. Science 317, 793e796.
Kämpf, N., Schwertmann, U., 1983. Goethite and hematite in a climosequencein southern Brazil and their application in classification of kaolinitic soils.Geoderma 29, 27e39.
Kemp, R.A., Toms, P.S., Sayago, J.M., Derbyshire, E., King, M., Wagoner, L., 2003.Micromorphology and OSL dating of the basal part of the loessepaleosolsequence at La Mesada in Tucumán province, Northwest Argentina. QuaternaryInternational 106e107, 111e117.
Kemp, R.A., Zárate, M.A., Toms, P., King, M., Sanabria, J., Arguello, G., 2006. LateQuaternary paleosols, stratigraphy and landscape evolution in the NorthernPampa, Argentina. Quaternary Research 66, 119e132.
Kemp, R.A., Zárate, M.A., 2000. Pliocene pedosedimentary cycles in the southernPampas, Argentina. Sedimentology 47, 3e14.
King, J.W., Banerjee, S.K., Marvin, J., Özdemir, Ö, 1982. A new rock-magneticapproach to selecting sediments for geomagnetic paleointensity studies:application to paleointensity for the last 4000 years. Earth and PlanetaryScience Letters 59, 404e419.
Kukla, G., An, Z., 1989. Loess stratigraphy in central China. Palaeogeography,Palaeoclimatology, Palaeoecology 72, 203e225.
Lamy, F., Kaiser, J., Ninnemann, U., Hebbeln, D., Arz, H.W., Stoner, J., 2004. Antarctictiming of surface water changes off Chile and Patagonian ice sheet response.Science 304, 1959e1962.
Laskar, J., Robutel, P., Joutel, F., Gastineau, M., Correia, A.C.M., Levrard, B., 2004.A long-term numerical solution for the insolation quantities of the Earth.Astronomy and Astrophysics 428, 261e285. doi:10.1051/0004-6361:20041335.
Lisiecki, L.E., Raymo, M.E., 2005. A PlioceneePleistocene stack of 57 globallydistributed d18O records. Paleoceanography 20 (PA1003). doi:10.1029/2004PA001071.
Liu, X.M., Hesse, P., Béget, J., Rolph, T., 2001. Pedogenic destruction of ferrimagneticsin Alaskan loess deposits. Australian Journal of Soil Research 39, 99e115.

C.W. Heil Jr. et al. / Quaternary Science Reviews 29 (2010) 2705e27182718
Liu, Q., Deng, C., Torrent, J., Zhu, R., 2007. Review of recent developments inmineral magnetism of the Chinese Loess. Quaternary Science Reviews 26,368e385.
Liu, X.M., Liu, T.S., Hesse, P., Xia, D.S., Chlachula, J., Wang, G., 2008. Two pedogenicmodels for paleoclimatic records of magnetic susceptibility from Chinese andSiberian loess. Science in China Series D: Earth Sciences 51, 284e293.
Lu, H., Sun, D., 2000. Pathways of dust input to the Chinese Loess Plateau during thelast glacial and interglacial periods. Catena 40, 251e261.
Maher, B.A., 1986. Characterisation of soils by mineral magnetic measurements.Physics of the Earth and Planetary Interiors 42, 76e92.
Maher, B.A., Thompson, R., Zhou, L.P., 1994. Spatial and temporal reconstructions ofchanges in the Asian paleomonsoon: a new mineral magnetic approach. Earthand Planetary Science Letters 125, 461e471.
Maher, B.A., Alekseev, A., Alekseeva, T., 2002. Variation of soil magnetism across theRussian steppe: its significance for use of soil magnetism as a paleorainfallproxy. Quaternary Science Reviews 21, 1571e1576.
Maher, B.A., Thompson, R., 1995. Paleorainfall reconstructions from pedogenicmagnetic susceptibility variations in the Chinese loess and paleosols. Quater-nary Research 44, 383e391.
deMenocal, P.B., 1995. Plio-Pleistocene African climate. Science 270, 53e59.Murad, E., Fischer, W.R., 1988. The geobiochemical cycle of iron. In: Stucki, J.W., et al.
(Eds.), Iron in Soils and Clay Minerals. D. Reidel, Dordrecht, The Netherlands,pp. 1e18.
Nabel, P.E., Morras, H.J.M., Petersen, N., Zech, W., 1999. Correlation of magnetic andlithologic features from soils and Quaternary sediments from the undulatingPampa, Argentina. Journal of South American Earth Sciences 12, 311e323.
Ogg, J.G., Smith, A.G., 2004. The geomagnetic polarity timescale. In: Gradstein, F.M.,Ogg, J.G., Smith, A.G. (Eds.), A Geologic Time Scale 2004. Cambridge UniversityPress, United Kingdom, pp. 63e86.
Orgeira, M.J., Walther, A.M., Vásquez, C.A., Di Tommaso, I., Alonso, S., Sherwood, G.,Yuguan, H., Vilas, J.F.A., 1998. Mineral magnetic record of paleoclimate variationin loess and paleosol from the Buenos Aires formation (Buenos Aires,Argentina). Journal of South American Earth Sciences 11, 561e570.
Peterson, R.G., Stramma, L., 1991. Upper-level circulation in the South AtlanticOcean. Progress in Oceanography 26, 1e73.
Prohaska, F., 1976. The climate of Argentina, Paraguay and Uruguay. In:Schwerdtfeger, W. (Ed.), World Survey of Climatology: Climates of Central andSouth America. Elsevier, Amsterdam, pp. 13e112.
Pye, K., 1987. Aeolian Dust and Dust Deposits. Academic Press, New York.Raymo, M.E., 1994. The initiation of Northern Hemisphere glaciation. Annual
Review of Earth and Planetary Sciences 22, 353e383.Raymo, M.E., Ruddiman, W., Backman, J., Clement, B., Martinson, D., 1989. Late
Pleistocene variations in Northern Hemisphere ice sheets and North Atlanticdeep water circulation. Paleoceanography 4, 413e446.
Raymo, M.E., Oppo, D., Curry, W., 1997. The mid-Pleistocene climate transition:a deep sea carbon isotopic perspectiva. Paleoceanography 12, 546e559.
Riggi, J.C., Fidalgo, F., Martínez, O., Porro, N., 1986. Geología de los SedimentosPampeanos en el partido de la Plata. Revista de la Asociación GeológicaArgentina XLIV, 316e333.
Rochette, P., Mathe, P.E., Esteban, L., Rakoto, H., Bouchez, J.L., Liu, Q., Torrent, J., 2005.Non-saturation of the defect moment of goethite and fine-grained hematite upto 57 Teslas. Geophysical Research Letters 32 (L22309) 1-L22309.4.
Ruddiman, W.F., Raymo, M.E., Martinson, D.G., Clement, B.M., Backman, J., 1989.Pleistocene evolution: northern hemisphere ice sheets and north AtlanticOcean. Paleoceanography 4, 353e412.
Ruddiman, W.F., Janecek, T.R., 1989. PlioceneePleistocene biogenic and terrigenousfluxesat equatorial Atlantic Sites662, 663, and664. In: Ruddiman,W., Sarnthein,M.,et al. (Eds.), Proc. ODP Sci. Results, vol. 108, pp. 211e240. College Station, TX.
Sangode, S.J., Bloemendal, J., 2004. Pedogenic transformation of magnetic mineralsin PlioceneePleistocene palaeosols of the Siwalik Group, NW Himalaya, India.Palaeogeography, Palaeoclimatology, Palaeoecology 212, 95e118.
Schellenberger, A., Veit, H., 2006. Pedostratigraphy and pedological and geochem-ical characterization of Las Carreras loessepaleosol sequence, Valle de Tafí,NW-Argentina. Quaternary Science Reviews 25, 811e831.
Schultz, P., Zárate, M., Hames, W., Camilión, C., King, J., 1998. A 3.3 Ma impact inArgentina and possible consequences. Science 282, 2061e2063.
Schulz, M., Mudelsee, M., 2002. REDFIT: estimating red-noise spectra directly fromunevenly spaced paleoclimate time series. Computers and Geosciences 28,421e426.
Schwerdtfeger, W., 1976. Introduction. In: Schwerdtfeger, W. (Ed.), World Survey ofClimatology: Climates of Central and South America. Elsevier, Amsterdam,pp. 1e12.
Schwertmann, U., 1988. Occurrence and formation of iron oxides in variouspedoenvironments. In: Stucki, J.W., et al. (Eds.), Iron in Soils and Clay Minerals.D. Reidel, Dordrecht, The Netherlands, pp. 267e308.
Smith, J., Vance, D., Kemp, R.A., Archer, C., Toms, P., King, M., Zárate, M., 2003.Isotopic constraints on the source of Argentinian loess e with implications foratmospheric circulation and the provenance of Antarctic dust during recentglacial maxima. Earth and Planetary Science Letters 212, 181e196.
Sun, Y., Clemens, S.C., An, Z., Yu, Z., 2006. Astronomical timescale and palaeoclimaticimplication of stacked 3.6-Myr monsoon records from the Chinese LoessPlateau. Quaternary Science Reviews 25, 33e48.
Teruggi, M.E., 1957. The nature and origin of Argentine loess. Journal of SedimentaryPetrology 27, 322e332.
Thompson, F., Oldfield, F., 1986. Environmental Magnetism. Allen & Unwin, London.Villagrán, C., 1993. Una interpretación climática del registro palinológico del último
ciclo glacialepostglacial en Sudamérica. Bull. Inst. Fr. ÉtudesAndines 22, 243e258.Zárate, M.A., 2003. Loess of southern South America. Quaternary Science Reviews
22, 1987e2006.Zárate, M., Blasi, A., 1993. Late PleistoceneeHolocene Aeolian deposits of the
southern Buenos Aires province, Argentina: a preliminary model. QuaternaryInternational 17, 15e20.
Zárate, M., Kemp, R.A., Blasi, A.M., 2002. Identification and differentiation ofPleistocene paleosols in the northern pampas of Buenos Aires, Argentina.Journal of South American Earth Sciences 15, 303e313.
Zárate, M.A., Kemp, R.A., Toms, P.S., 2009. Late Quaternary landscape reconstructionand geochronology in the northern Pampas of Buenos Aires province,Argentina. Journal of South American Earth Sciences 27, 88e99.
Zárate, M., Fasano, J., 1989. The Plio-Pleistocene record of the central easternpampas, Buenos Aires, Argentina. Palaeogeography, Palaeoclimatology, Palae-oecology 72, 27e52.
Zárate, M., Rabassa, J., 2005. Geomorfología de la provincia de Buenos Aires. In:de Barrio, R., Etcheverry, R., Caballé, M., Llambías, E. (Eds.), Relatorio XVICongreso Geológico Argentino. Geología y recursos Minerales de la provinciade Buenos Aires, pp. 119e138.
Zhou, L.P., Oldfield, F., Wintle, A.G., Robinson, S.G., Wang, J.T., 1990. Partly pedogenicorigin of magnetic variations in Chinese loess. Nature 346, 737e739.
Zinck, J.A., Sayago, J.M., 2001. Climatic periodicity during the late Pleistocene froma loessepaleosol sequence in northwest Argentina. Quaternary International78, 11e16.