Embed Size (px)
Citation preview
at SciVerse ScienceDirect
Quaternary Science Reviews 77 (2013) 101e112
Contents lists available
Quaternary Science Reviews
journal homepage: www.elsevier .com/locate/quascirev
A Last Glacial Maximum through middle Holocene stalagmite recordof coastal Western Australia climate
Rhawn F. Denniston a,*, Yemane Asmeromb, Matthew Lachniet c, Victor J. Polyak b,Pandora Hope d, Ni An a, Kristyn Rodzinyak a,1, William F. Humphreys e,f,g
aDepartment of Geology, Cornell College, Mount Vernon, IA 52314, USAbDepartment of Earth and Planetary Sciences, University of New Mexico, Albuquerque, NM, USAcDepartment of Geoscience, University of Nevada-Las Vegas, Las Vegas, NV, USAdCentre for Australian Weather and Climate Research, Bureau of Meteorology, Melbourne, Australiae School of Animal Biology, University of Western Australia, Perth, AustraliafWestern Australian Museum, Welshpool DC, AustraliagUniversity of Adelaide, Adelaide, Australia
a r t i c l e i n f o
Article history:Received 9 March 2013Received in revised form30 June 2013Accepted 2 July 2013Available online 14 August 2013
Keywords:StalagmiteOxygenCarbonIsotopeIndo-Australian summer monsoonSouthern westerliesCape RangeAustralia
* Corresponding author. Tel.: þ1 319 895 4306.E-mail address: [email protected] (R.
1 Current address: Department of Earth and Planet
0277-3791/$ e see front matter � 2013 Elsevier Ltd.http://dx.doi.org/10.1016/j.quascirev.2013.07.002
a b s t r a c t
Stable isotope profiles of 230Th-dated stalagmites from cave C126, Cape Range Peninsula, WesternAustralia, provide the first high-resolution, continental paleoclimate record spanning the Last GlacialMaximum, deglaciation, and early to middle Holocene from the Indian Ocean sector of Australia. Today,rainfall at Cape Range is sparse, highly variable, and is divided more or less equally between winter andsummer rains, with winter precipitation linked to northwest cloud bands and cold fronts derived fromthe southern mid- to high-latitudes, and summer precipitation due primarily to tropical cyclone activity.Influences of the Indo-Australian summer monsoon at Cape Range are minimal as this region lies southof the modern monsoon margin. The interaction of these atmospheric systems helps shape the envi-ronment at Cape Range, and thus C126 stalagmite-based paleoclimatic reconstructions should reflectvariability in moisture source driven by changing ocean and atmospheric conditions.
The C126 record reveals slow stalagmite growth and isotopically heavy oxygen isotope values duringthe Last Glacial Maximum, followed by increased growth rates and decreased oxygen isotopic ratios at19 ka, reaching a d18O minimum from 17.5 to 16.0 ka, coincident with Heinrich Stadial 1. The origin of thisoxygen isotopic shift may reflect enhanced moisture and lower oxygen isotopic ratios due to amounteffect-driven changes in rainfall d18O values from an increase in rainfall derived from tropical cyclones orchanges in northwest cloud band activity, although the controls on both systems are poorly constrainedfor this time period. Alternatively, lower C126 stalagmite d18O values may have been driven by morefrequent or more intense frontal systems associated with southerly-derived moisture sources, possibly inrelation to meridional shifts in positioning of the southern westerlies which have been linked to southernAustralia megalake highstands at this time. Finally, we also consider the possibility of contributions oftropical moisture derived from the Indo-Australian summer monsoon. The Intertropical ConvergenceZone and associated monsoon trough shifted southward during Heinrich events and other periods ofhigh northern latitude cooling, and although clearly weakened during glacial periods, rainfall with lowd18O values associated with the monsoon today suggests that even small contributions from thismoisture source could have accounted for some of the observed oxygen isotopic decrease. Despite apronounced isotopic excursion coincident with Heinrich Stadial 1, no identifiable anomaly is associatedwith Heinrich Stadial 2.
The Holocene is also characterized by overall low d18O values and rapid growth rates, with decreasingoxygen isotopic values during the earliest Holocene and at w6.5 ka, roughly coincident with southernAustraliamegalakehighstands. Theorigins of these stalagmite oxygen isotopic shifts donot appear to reflectincreases inmean annual temperature but are tied here largely to changes in the d18O values of precipitationand may reflect a more southerly influence of the Indo-Australian summer monsoon at this time.
C126 stalagmite carbon isotopic ratios offer an important complement to the oxygen isotopic timeseries. Stalagmite d13C values averaged �5& during the Last Glacial Maximum and early deglaciation,
F. Denniston).ary Sciences, McGill University, Montreal, Quebec, Canada.
All rights reserved.
R.F. Denniston et al. / Quaternary Science Reviews 77 (2013) 101e112102
and reached a plateau during the oxygen isotopic minimum at 17.5 ka. However, d13C values decreasedsharply to �12& between 11 and 8 ka, a shift interpreted to reflect increases in plant density in responseto the onset of interglacial conditions. Stalagmite d13C values at 6 ka are lower than expected for themodern C4-dominated vegetation and thin soils of Cape Range, suggesting that a more C3-rich envi-ronment was present during elevated rainfall conditions of the early and middle Holocene. The CapeRange stalagmite time series thus reveals for the first time the millennial-scale sensitivity of the moisturesource variations in northwestern Australia, a result that has implications for precipitation dynamicsacross much of the continent.
� 2013 Elsevier Ltd. All rights reserved.
1. Introduction
Identifying the timing and nature of regional responses to cli-matic change is necessary for developing a holistic view of theglobal climate system. This is particularly true for the Last GlacialMaximum (LGM) through the Holocene, an interval of profoundenvironmental change, but attempts to construct an integratedpicture of this period are hampered in some regions by a scarcity ofthe requisite high-resolution paleoenvironmental records. WesternAustralia is one such area that lacks high-resolution, Late Quater-nary paleoclimate time series, particularly north of 30�S latitude. Todate, the most continuous paleoclimate reconstructions from thisregion are based on terrestrial pollen and spores obtained frommarine cores located off the Cape Range Peninsula (Fig. 1), butinterpreting these data is complicated by limited temporal resolu-tion, the potential for bioturbation and unconformities, and thelikelihood that the pollen was sourced from a wide latitudinaltransect (van der Kaars and De Deckker, 2002, 2003; van der Kaarset al., 2006). Cape Range is an area of particular interest becausepart of it and the adjacent Ningaloo Reef are UNESCO world heri-tage sites, and Cape Range and the surrounding region have a richarcheological record.
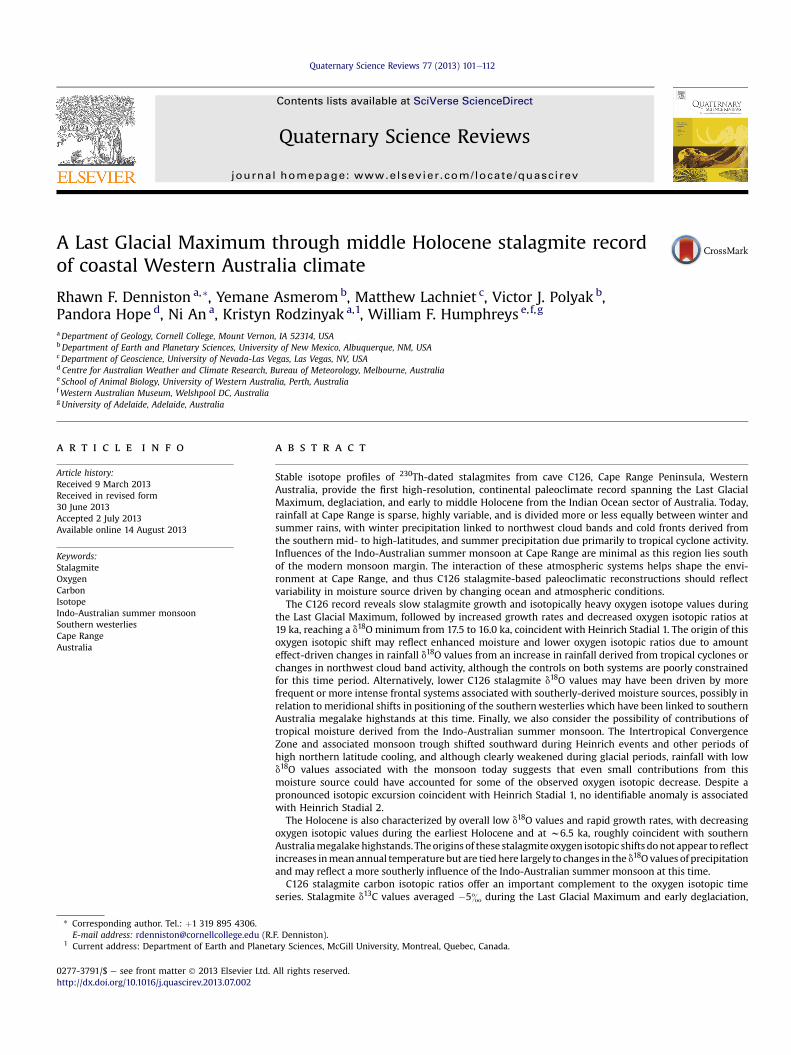
Today, Cape Range lies at the northern margin of the zone ofwinter precipitation associated with the southern hemispherewesterlies, and the southern margin of the interval of WesternAustralia experiencing the highest historical tropical cyclone ac-tivity (bom.gov.au). Cape Range also receives a considerable per-centage of its winter moisture totals from northwest cloud bands,broad atmospheric systems stretching northwestesoutheast andthat can span much of the Australian continent (Telcik, 2003;Indian Ocean Climate Initiative, 2012). Cape Range also lies southof the margin of the Indo-Australian summer monsoon (IASM), butgiven the dynamic nature of the IASM during the last deglaciation(Muller et al., 2012; Denniston et al., 2013), it is conceivable thatthis system, too, may have once contributed significant quantitiesof rainfall to Cape Range (Fig. 1). Variations in the IASM, thesouthern hemisphere westerlies, and tropical cyclones have eachbeen linked to extra-regional forcing, and thus globally expressedclimate changes may be reflected in the interactions of these andrelated systems.
Despite this region’s paucity of traditional paleoclimate ar-chives, Cape Range Peninsula contains numerous caves and thusholds the potential for speleothem-based paleoenvironmentalreconstruction. Here we present an absolute-dated stalagmite iso-topic time series from cave C126 in Cape Range that marks the firsthigh-resolution continental paleoclimate record from this region ofWestern Australia spanning the LGM, deglaciation, and early/mid-dle Holocene. Dating by 230Th methods reveals stalagmite growthfrom 26 to 15 and 11 to 6 ka, and stalagmite carbon and oxygenisotopic ratios track paleoenvironmental changes, thereby allowinga rare and detailed examination of these mechanisms by whichclimate variability was expressed in Western Australia during thistime.
2. Geologic and environmental settings
2.1. Cape Range and Cave C126 geology
Cape Range, Western Australia lies within the Exmouth sub-basin of the Carnarvon geological province, and is composed ofanticlinal, middle Cenozoic marine carbonate sequences (Russell,2004). The range itself reaches 330 m in elevation and isdissected by gorges that cut karstic limestone bedrock stretching toa coastal plain that ends in a series of raised, wave-cut terraces.Cape Range marks the closest point in Australia to the continentalslope and thus remained proximal to the ocean throughout theLGM. Approximately 800 caves are identified in this area, and twostalagmites were collected in August of 1991 AD from cave C126(22.1�S, 113.9�E), a solution pipe with lateral development at depth(approx. 54 m below the land surface; cave floor elevation approx.50 m), that represents a typical cave morphology for this region(Hamilton-Smith et al., 1998) (Fig. 2). When visited, the cave was21 �C with 96% relative humidity (D. Brooks, Pers. Comm.).
2.2. Regional climate
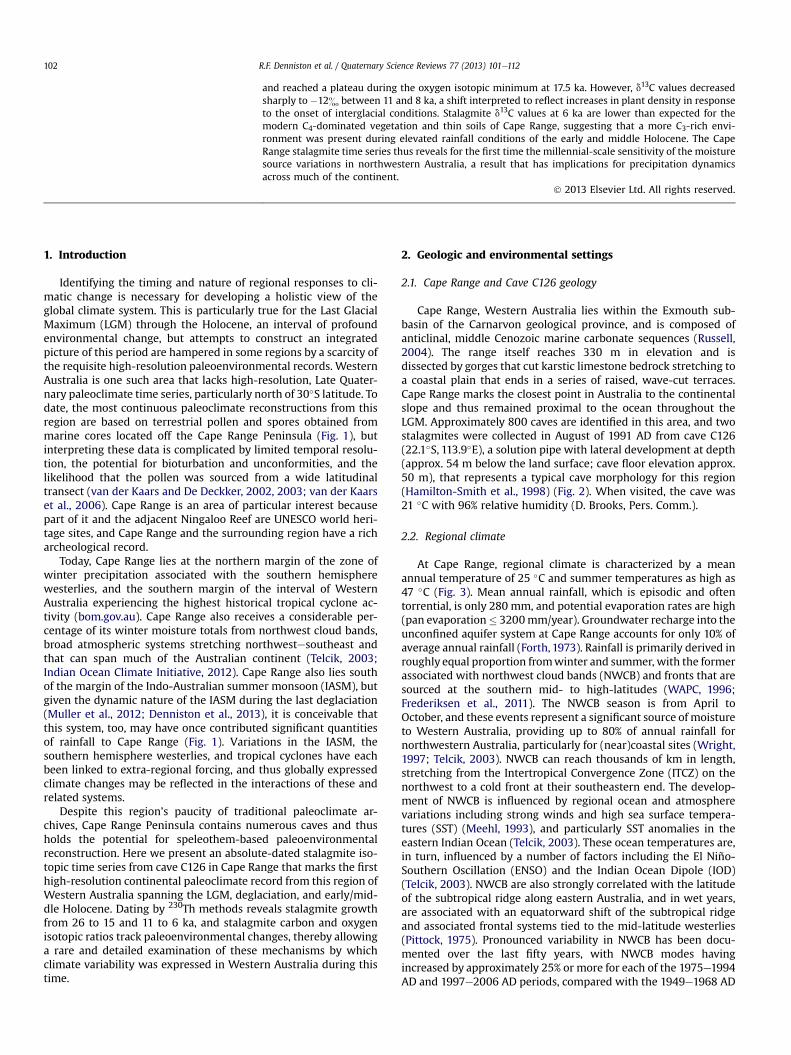
At Cape Range, regional climate is characterized by a meanannual temperature of 25 �C and summer temperatures as high as47 �C (Fig. 3). Mean annual rainfall, which is episodic and oftentorrential, is only 280 mm, and potential evaporation rates are high(pan evaporation� 3200mm/year). Groundwater recharge into theunconfined aquifer system at Cape Range accounts for only 10% ofaverage annual rainfall (Forth, 1973). Rainfall is primarily derived inroughly equal proportion fromwinter and summer, with the formerassociated with northwest cloud bands (NWCB) and fronts that aresourced at the southern mid- to high-latitudes (WAPC, 1996;Frederiksen et al., 2011). The NWCB season is from April toOctober, and these events represent a significant source of moistureto Western Australia, providing up to 80% of annual rainfall fornorthwestern Australia, particularly for (near)coastal sites (Wright,1997; Telcik, 2003). NWCB can reach thousands of km in length,stretching from the Intertropical Convergence Zone (ITCZ) on thenorthwest to a cold front at their southeastern end. The develop-ment of NWCB is influenced by regional ocean and atmospherevariations including strong winds and high sea surface tempera-tures (SST) (Meehl, 1993), and particularly SST anomalies in theeastern Indian Ocean (Telcik, 2003). These ocean temperatures are,in turn, influenced by a number of factors including the El Niño-Southern Oscillation (ENSO) and the Indian Ocean Dipole (IOD)(Telcik, 2003). NWCB are also strongly correlated with the latitudeof the subtropical ridge along eastern Australia, and in wet years,are associated with an equatorward shift of the subtropical ridgeand associated frontal systems tied to the mid-latitude westerlies(Pittock, 1975). Pronounced variability in NWCB has been docu-mented over the last fifty years, with NWCB modes havingincreased by approximately 25% or more for each of the 1975e1994AD and 1997e2006 AD periods, compared with the 1949e1968 AD
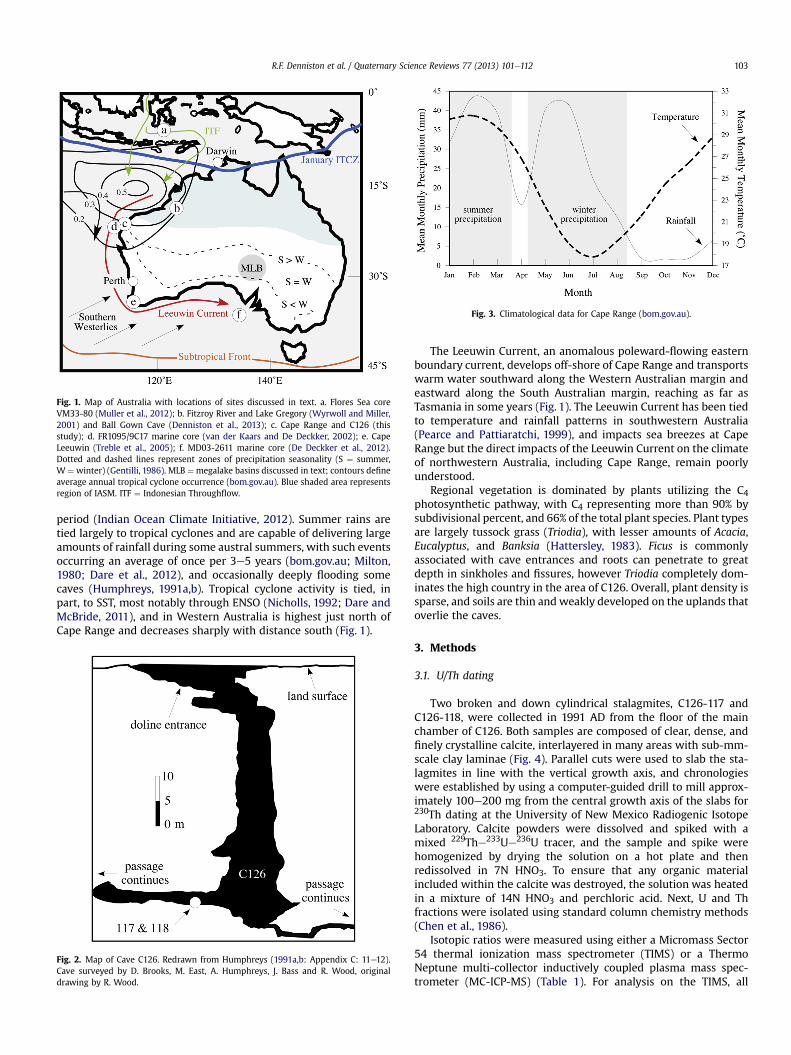
Fig. 3. Climatological data for Cape Range (bom.gov.au).
Fig. 1. Map of Australia with locations of sites discussed in text. a. Flores Sea coreVM33-80 (Muller et al., 2012); b. Fitzroy River and Lake Gregory (Wyrwoll and Miller,2001) and Ball Gown Cave (Denniston et al., 2013); c. Cape Range and C126 (thisstudy); d. FR1095/9C17 marine core (van der Kaars and De Deckker, 2002); e. CapeLeeuwin (Treble et al., 2005); f. MD03-2611 marine core (De Deckker et al., 2012).Dotted and dashed lines represent zones of precipitation seasonality (S ¼ summer,W ¼ winter) (Gentilli, 1986). MLB ¼megalake basins discussed in text; contours defineaverage annual tropical cyclone occurrence (bom.gov.au). Blue shaded area representsregion of IASM. ITF ¼ Indonesian Throughflow.
R.F. Denniston et al. / Quaternary Science Reviews 77 (2013) 101e112 103
period (Indian Ocean Climate Initiative, 2012). Summer rains aretied largely to tropical cyclones and are capable of delivering largeamounts of rainfall during some austral summers, with such eventsoccurring an average of once per 3e5 years (bom.gov.au; Milton,1980; Dare et al., 2012), and occasionally deeply flooding somecaves (Humphreys, 1991a,b). Tropical cyclone activity is tied, inpart, to SST, most notably through ENSO (Nicholls, 1992; Dare andMcBride, 2011), and in Western Australia is highest just north ofCape Range and decreases sharply with distance south (Fig. 1).
Fig. 2. Map of Cave C126. Redrawn from Humphreys (1991a,b: Appendix C: 11e12).Cave surveyed by D. Brooks, M. East, A. Humphreys, J. Bass and R. Wood, originaldrawing by R. Wood.
The Leeuwin Current, an anomalous poleward-flowing easternboundary current, develops off-shore of Cape Range and transportswarm water southward along the Western Australian margin andeastward along the South Australian margin, reaching as far asTasmania in some years (Fig. 1). The Leeuwin Current has been tiedto temperature and rainfall patterns in southwestern Australia(Pearce and Pattiaratchi, 1999), and impacts sea breezes at CapeRange but the direct impacts of the Leeuwin Current on the climateof northwestern Australia, including Cape Range, remain poorlyunderstood.
Regional vegetation is dominated by plants utilizing the C4photosynthetic pathway, with C4 representing more than 90% bysubdivisional percent, and 66% of the total plant species. Plant typesare largely tussock grass (Triodia), with lesser amounts of Acacia,Eucalyptus, and Banksia (Hattersley, 1983). Ficus is commonlyassociated with cave entrances and roots can penetrate to greatdepth in sinkholes and fissures, however Triodia completely dom-inates the high country in the area of C126. Overall, plant density issparse, and soils are thin and weakly developed on the uplands thatoverlie the caves.
3. Methods
3.1. U/Th dating
Two broken and down cylindrical stalagmites, C126-117 andC126-118, were collected in 1991 AD from the floor of the mainchamber of C126. Both samples are composed of clear, dense, andfinely crystalline calcite, interlayered in many areas with sub-mm-scale clay laminae (Fig. 4). Parallel cuts were used to slab the sta-lagmites in line with the vertical growth axis, and chronologieswere established by using a computer-guided drill to mill approx-imately 100e200 mg from the central growth axis of the slabs for230Th dating at the University of New Mexico Radiogenic IsotopeLaboratory. Calcite powders were dissolved and spiked with amixed 229The233Ue236U tracer, and the sample and spike werehomogenized by drying the solution on a hot plate and thenredissolved in 7N HNO3. To ensure that any organic materialincluded within the calcite was destroyed, the solution was heatedin a mixture of 14N HNO3 and perchloric acid. Next, U and Thfractions were isolated using standard column chemistry methods(Chen et al., 1986).
Isotopic ratios were measured using either a Micromass Sector54 thermal ionization mass spectrometer (TIMS) or a ThermoNeptune multi-collector inductively coupled plasma mass spec-trometer (MC-ICP-MS) (Table 1). For analysis on the TIMS, all
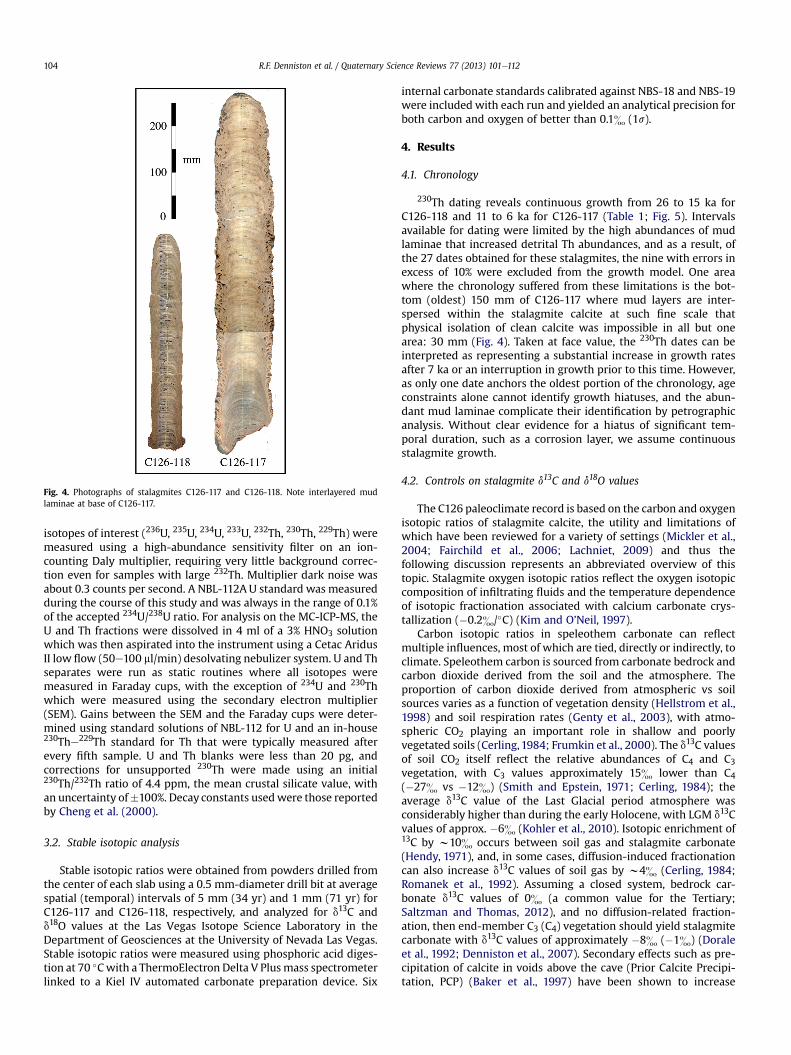
Fig. 4. Photographs of stalagmites C126-117 and C126-118. Note interlayered mudlaminae at base of C126-117.
R.F. Denniston et al. / Quaternary Science Reviews 77 (2013) 101e112104
isotopes of interest (236U, 235U, 234U, 233U, 232Th, 230Th, 229Th) weremeasured using a high-abundance sensitivity filter on an ion-counting Daly multiplier, requiring very little background correc-tion even for samples with large 232Th. Multiplier dark noise wasabout 0.3 counts per second. A NBL-112A U standard was measuredduring the course of this study and was always in the range of 0.1%of the accepted 234U/238U ratio. For analysis on the MC-ICP-MS, theU and Th fractions were dissolved in 4 ml of a 3% HNO3 solutionwhich was then aspirated into the instrument using a Cetac AridusII low flow (50e100 ml/min) desolvating nebulizer system. U and Thseparates were run as static routines where all isotopes weremeasured in Faraday cups, with the exception of 234U and 230Thwhich were measured using the secondary electron multiplier(SEM). Gains between the SEM and the Faraday cups were deter-mined using standard solutions of NBL-112 for U and an in-house230The229Th standard for Th that were typically measured afterevery fifth sample. U and Th blanks were less than 20 pg, andcorrections for unsupported 230Th were made using an initial230Th/232Th ratio of 4.4 ppm, the mean crustal silicate value, withan uncertainty of�100%. Decay constants usedwere those reportedby Cheng et al. (2000).
3.2. Stable isotopic analysis
Stable isotopic ratios were obtained from powders drilled fromthe center of each slab using a 0.5 mm-diameter drill bit at averagespatial (temporal) intervals of 5 mm (34 yr) and 1 mm (71 yr) forC126-117 and C126-118, respectively, and analyzed for d13C andd18O values at the Las Vegas Isotope Science Laboratory in theDepartment of Geosciences at the University of Nevada Las Vegas.Stable isotopic ratios were measured using phosphoric acid diges-tion at 70 �Cwith a ThermoElectron Delta V Plusmass spectrometerlinked to a Kiel IV automated carbonate preparation device. Six
internal carbonate standards calibrated against NBS-18 and NBS-19were included with each run and yielded an analytical precision forboth carbon and oxygen of better than 0.1& (1s).
4. Results
4.1. Chronology
230Th dating reveals continuous growth from 26 to 15 ka forC126-118 and 11 to 6 ka for C126-117 (Table 1; Fig. 5). Intervalsavailable for dating were limited by the high abundances of mudlaminae that increased detrital Th abundances, and as a result, ofthe 27 dates obtained for these stalagmites, the nine with errors inexcess of 10% were excluded from the growth model. One areawhere the chronology suffered from these limitations is the bot-tom (oldest) 150 mm of C126-117 where mud layers are inter-spersed within the stalagmite calcite at such fine scale thatphysical isolation of clean calcite was impossible in all but onearea: 30 mm (Fig. 4). Taken at face value, the 230Th dates can beinterpreted as representing a substantial increase in growth ratesafter 7 ka or an interruption in growth prior to this time. However,as only one date anchors the oldest portion of the chronology, ageconstraints alone cannot identify growth hiatuses, and the abun-dant mud laminae complicate their identification by petrographicanalysis. Without clear evidence for a hiatus of significant tem-poral duration, such as a corrosion layer, we assume continuousstalagmite growth.
4.2. Controls on stalagmite d13C and d18O values
The C126 paleoclimate record is based on the carbon and oxygenisotopic ratios of stalagmite calcite, the utility and limitations ofwhich have been reviewed for a variety of settings (Mickler et al.,2004; Fairchild et al., 2006; Lachniet, 2009) and thus thefollowing discussion represents an abbreviated overview of thistopic. Stalagmite oxygen isotopic ratios reflect the oxygen isotopiccomposition of infiltrating fluids and the temperature dependenceof isotopic fractionation associated with calcium carbonate crys-tallization (�0.2&/�C) (Kim and O’Neil, 1997).
Carbon isotopic ratios in speleothem carbonate can reflectmultiple influences, most of which are tied, directly or indirectly, toclimate. Speleothem carbon is sourced from carbonate bedrock andcarbon dioxide derived from the soil and the atmosphere. Theproportion of carbon dioxide derived from atmospheric vs soilsources varies as a function of vegetation density (Hellstrom et al.,1998) and soil respiration rates (Genty et al., 2003), with atmo-spheric CO2 playing an important role in shallow and poorlyvegetated soils (Cerling,1984; Frumkin et al., 2000). The d13C valuesof soil CO2 itself reflect the relative abundances of C4 and C3vegetation, with C3 values approximately 15& lower than C4(�27& vs �12&) (Smith and Epstein, 1971; Cerling, 1984); theaverage d13C value of the Last Glacial period atmosphere wasconsiderably higher than during the early Holocene, with LGM d13Cvalues of approx. �6& (Kohler et al., 2010). Isotopic enrichment of13C by w10& occurs between soil gas and stalagmite carbonate(Hendy, 1971), and, in some cases, diffusion-induced fractionationcan also increase d13C values of soil gas by w4& (Cerling, 1984;Romanek et al., 1992). Assuming a closed system, bedrock car-bonate d13C values of 0& (a common value for the Tertiary;Saltzman and Thomas, 2012), and no diffusion-related fraction-ation, then end-member C3 (C4) vegetation should yield stalagmitecarbonate with d13C values of approximately �8& (�1&) (Doraleet al., 1992; Denniston et al., 2007). Secondary effects such as pre-cipitation of calcite in voids above the cave (Prior Calcite Precipi-tation, PCP) (Baker et al., 1997) have been shown to increase
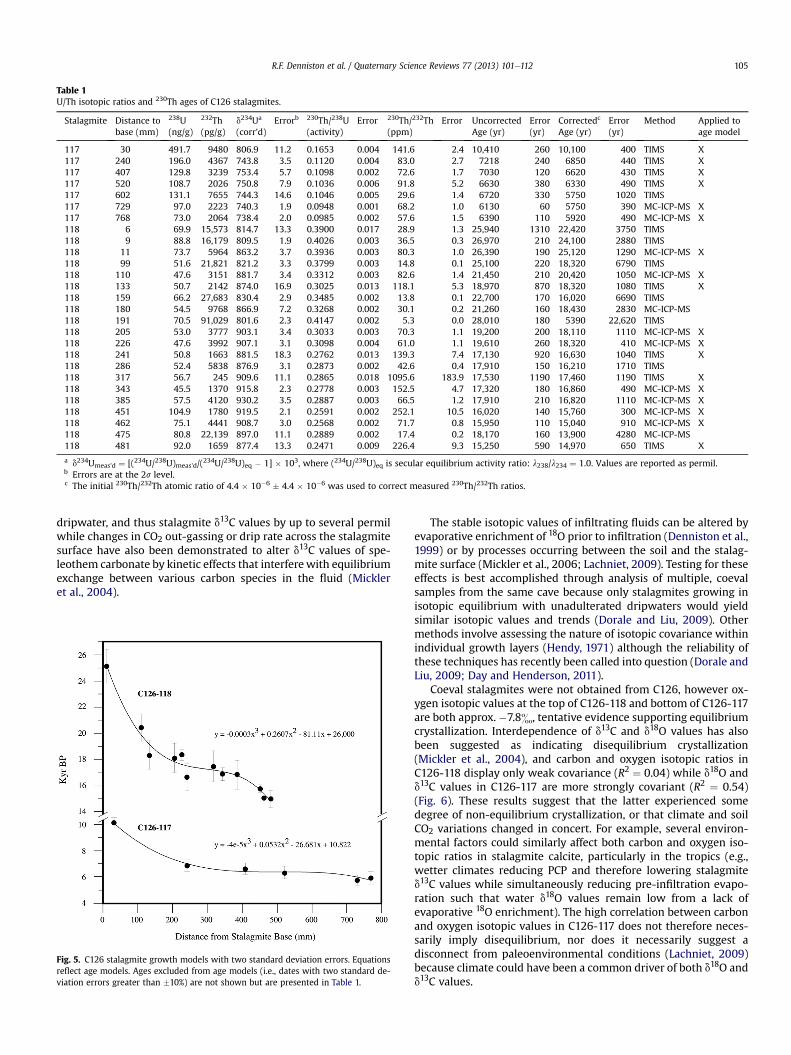
Table 1U/Th isotopic ratios and 230Th ages of C126 stalagmites.
Stalagmite Distance tobase (mm)
238U(ng/g)
232Th(pg/g)
d234Ua
(corr’d)Errorb 230Th/238U
(activity)Error 230Th/232Th
(ppm)Error Uncorrected
Age (yr)Error(yr)
Correctedc
Age (yr)Error(yr)
Method Applied toage model
117 30 491.7 9480 806.9 11.2 0.1653 0.004 141.6 2.4 10,410 260 10,100 400 TIMS X117 240 196.0 4367 743.8 3.5 0.1120 0.004 83.0 2.7 7218 240 6850 440 TIMS X117 407 129.8 3239 753.4 5.7 0.1098 0.002 72.6 1.7 7030 120 6620 430 TIMS X117 520 108.7 2026 750.8 7.9 0.1036 0.006 91.8 5.2 6630 380 6330 490 TIMS X117 602 131.1 7655 744.3 14.6 0.1046 0.005 29.6 1.4 6720 330 5750 1020 TIMS117 729 97.0 2223 740.3 1.9 0.0948 0.001 68.2 1.0 6130 60 5750 390 MC-ICP-MS X117 768 73.0 2064 738.4 2.0 0.0985 0.002 57.6 1.5 6390 110 5920 490 MC-ICP-MS X118 6 69.9 15,573 814.7 13.3 0.3900 0.017 28.9 1.3 25,940 1310 22,420 3750 TIMS118 9 88.8 16,179 809.5 1.9 0.4026 0.003 36.5 0.3 26,970 210 24,100 2880 TIMS118 11 73.7 5964 863.2 3.7 0.3936 0.003 80.3 1.0 26,390 190 25,120 1290 MC-ICP-MS X118 99 51.6 21,821 821.2 3.3 0.3799 0.003 14.8 0.1 25,100 220 18,320 6790 TIMS118 110 47.6 3151 881.7 3.4 0.3312 0.003 82.6 1.4 21,450 210 20,420 1050 MC-ICP-MS X118 133 50.7 2142 874.0 16.9 0.3025 0.013 118.1 5.3 18,970 870 18,320 1080 TIMS X118 159 66.2 27,683 830.4 2.9 0.3485 0.002 13.8 0.1 22,700 170 16,020 6690 TIMS118 180 54.5 9768 866.9 7.2 0.3268 0.002 30.1 0.2 21,260 160 18,430 2830 MC-ICP-MS118 191 70.5 91,029 801.6 2.3 0.4147 0.002 5.3 0.0 28,010 180 5390 22,620 TIMS118 205 53.0 3777 903.1 3.4 0.3033 0.003 70.3 1.1 19,200 200 18,110 1110 MC-ICP-MS X118 226 47.6 3992 907.1 3.1 0.3098 0.004 61.0 1.1 19,610 260 18,320 410 MC-ICP-MS X118 241 50.8 1663 881.5 18.3 0.2762 0.013 139.3 7.4 17,130 920 16,630 1040 TIMS X118 286 52.4 5838 876.9 3.1 0.2873 0.002 42.6 0.4 17,910 150 16,210 1710 TIMS118 317 56.7 245 909.6 11.1 0.2865 0.018 1095.6 183.9 17,530 1190 17,460 1190 TIMS X118 343 45.5 1370 915.8 2.3 0.2778 0.003 152.5 4.7 17,320 180 16,860 490 MC-ICP-MS X118 385 57.5 4120 930.2 3.5 0.2887 0.003 66.5 1.2 17,910 210 16,820 1110 MC-ICP-MS X118 451 104.9 1780 919.5 2.1 0.2591 0.002 252.1 10.5 16,020 140 15,760 300 MC-ICP-MS X118 462 75.1 4441 908.7 3.0 0.2568 0.002 71.7 0.8 15,950 110 15,040 910 MC-ICP-MS X118 475 80.8 22,139 897.0 11.1 0.2889 0.002 17.4 0.2 18,170 160 13,900 4280 MC-ICP-MS118 481 92.0 1659 877.4 13.3 0.2471 0.009 226.4 9.3 15,250 590 14,970 650 TIMS X
a d234Umeas’d ¼ [(234U/238U)meas’d/(234U/238U)eq � 1] � 103, where (234U/238U)eq is secular equilibrium activity ratio: l238/l234 ¼ 1.0. Values are reported as permil.b Errors are at the 2s level.c The initial 230Th/232Th atomic ratio of 4.4 � 10�6 � 4.4 � 10�6 was used to correct measured 230Th/232Th ratios.
R.F. Denniston et al. / Quaternary Science Reviews 77 (2013) 101e112 105
dripwater, and thus stalagmite d13C values by up to several permilwhile changes in CO2 out-gassing or drip rate across the stalagmitesurface have also been demonstrated to alter d13C values of spe-leothem carbonate by kinetic effects that interferewith equilibriumexchange between various carbon species in the fluid (Mickleret al., 2004).
Fig. 5. C126 stalagmite growth models with two standard deviation errors. Equationsreflect age models. Ages excluded from age models (i.e., dates with two standard de-viation errors greater than �10%) are not shown but are presented in Table 1.
The stable isotopic values of infiltrating fluids can be altered byevaporative enrichment of 18O prior to infiltration (Denniston et al.,1999) or by processes occurring between the soil and the stalag-mite surface (Mickler et al., 2006; Lachniet, 2009). Testing for theseeffects is best accomplished through analysis of multiple, coevalsamples from the same cave because only stalagmites growing inisotopic equilibrium with unadulterated dripwaters would yieldsimilar isotopic values and trends (Dorale and Liu, 2009). Othermethods involve assessing the nature of isotopic covariance withinindividual growth layers (Hendy, 1971) although the reliability ofthese techniques has recently been called into question (Dorale andLiu, 2009; Day and Henderson, 2011).
Coeval stalagmites were not obtained from C126, however ox-ygen isotopic values at the top of C126-118 and bottom of C126-117are both approx. �7.8&, tentative evidence supporting equilibriumcrystallization. Interdependence of d13C and d18O values has alsobeen suggested as indicating disequilibrium crystallization(Mickler et al., 2004), and carbon and oxygen isotopic ratios inC126-118 display only weak covariance (R2 ¼ 0.04) while d18O andd13C values in C126-117 are more strongly covariant (R2 ¼ 0.54)(Fig. 6). These results suggest that the latter experienced somedegree of non-equilibrium crystallization, or that climate and soilCO2 variations changed in concert. For example, several environ-mental factors could similarly affect both carbon and oxygen iso-topic ratios in stalagmite calcite, particularly in the tropics (e.g.,wetter climates reducing PCP and therefore lowering stalagmited13C values while simultaneously reducing pre-infiltration evapo-ration such that water d18O values remain low from a lack ofevaporative 18O enrichment). The high correlation between carbonand oxygen isotopic values in C126-117 does not therefore neces-sarily imply disequilibrium, nor does it necessarily suggest adisconnect from paleoenvironmental conditions (Lachniet, 2009)because climate could have been a common driver of both d18O andd13C values.

Fig. 6. Comparison of carbon and oxygen isotopic ratios as an indicator for isotopicequilibrium crystallization of C126 stalagmite calcite.
R.F. Denniston et al. / Quaternary Science Reviews 77 (2013) 101e112106
5. Discussion
5.1. Origins of C126 stalagmite oxygen isotopic variability
The C126 stalagmite stable isotopic time series contains signif-icant, short-term variability (Fig. 7), but identifying the origins ofisotopic dynamics at these scales is not necessarily straightforward,and thus we focus our interpretation on millennial-scale trends.The most pronounced features of the C126 oxygen isotopic recordare a d18O minimum from 17.5 to 16.0 ka, a second decrease in d18Ovalues that defines the earliest Holocene, and a smaller oxygenisotopic minimum at w6.5 ka. Evaluating stalagmite oxygenisotopic ratios during a period of rapidly changing glacial boundaryconditions involves assessing the relative influences of a numberof variables including temperature and the isotopic compositionof meteoric precipitation, the latter being a reflection of itssource area and evolution during transport (Dansgaard, 1964).Although significant attention has been paid to the modern and
Fig. 7. C126 stalagmite (a) oxygen and (b) carbon isotopic time series (this study);marine core pollen transfer function-based mean annual temperature (MAT) (c) andmean annual precipitation (MAP) (d) for Cape Range region based on analysis ofsediment samples from major rivers bordering the ocean in the Cape Range region(van der Kaars et al., 2006); vertical yellow bars represent periods megalake levelhighstands (MLH) from South Australia (Cohen et al., 2011); horizontal blue barsdenote two sigma age ranges for respective 230Th dates on C126 stalagmites.
paleoclimatology of the IASM-dominated regions of tropicalnorthwestern Australia and the winter precipitation-dominatedsouthwestern Australia, origins of rainfall variability in the CapeRange region remain far less well understood.
5.2. Influences of temperature
Previous determinations of continental Australian deglacialpaleo-temperature changes include isoleucine epimerization ofradiocarbon-dated fossil emu eggshells from the Australian inte-rior, which yielded a rapid temperature rise starting at 16 ka, withmaximum warming of 9 �C between the LGM and the Holocene(Miller et al., 1997). For Cape Range, pollen transfer functionsapplied to assemblages obtained from a marine core suggest a 4 �Cincrease in mean annual temperature between the LGM and earlyHolocene, with rapid temperature rises from 23 to 19 and 11 to 7 ka(van der Kaars et al., 2006) (Fig. 7). Because temperatures in deep,poorly ventilated caves such as C126 typically approximate thelocal mean annual temperature, calcite crystallization tempera-tures should have tracked regional climate trends, and thisparameter could in principle be estimated based on the measuredstalagmite d18O values if the d18O value of precipitationwas known.The nearest IAEA Isotopes in Precipitation collection stations toCape Range are located at Darwin, Northern Territory (within theIASM regime) and at Perth, Western Australia (within the winterrainfall regime) (Fig. 1). Monthly average rainfall data from Perthreveal a precipitation d18O/air temperature relationship of þ0.2&/�C and amount effects of approx.�1&/100mm/month, with winterrain d18O values ranging from �3.5& to �4.1& (IAEA/WMO).Monthly average summer monsoon rainfall d18O values obtained atDarwin average �6& and yield no statistically significant rela-tionship with air temperature but do exhibit an amount effect ofapprox. �1&/100 mm/month (IAEA/WMO) (Fig. 8). Combining thetemperature signal in winter rainfall from Perth (þ0.2&/�C) withthe temperature dependence of oxygen isotopic fractionation ofcalcite crystallization (�0.2&/�C) (Kim and O’Neil, 1997) results inan essentially temperature-insensitive stalagmite paleother-mometer, and temperature effects are further complicated by thecontribution of moisture derived from tropical cyclones, the d18Ovalues for which are dominated by amount effects rather than airtemperature (Lawrence and Gedzelman, 1996).
Applying such isotopic measurements of precipitation fromdistal stations is a source of considerable uncertainty andmodern rainfall d18O values at Cape Range are not well con-strained. Dogramaci et al. (2012) report three years of precipi-tation and groundwater oxygen isotopic values for theHamersley Basin, located approximately 400 km east of CapeRange. Precipitation d18O values were highly variable over thisinterval and appeared to reflect amount effects, with the heavyrainfall (>20 mm) events that dominate the area’s groundwaterrecharge averaging �6.7 � 5.5&; shallow groundwater valueswere more tightly clustered at �8.0 � 0.8&. Liu et al. (2010)modeled Australian precipitation oxygen isotopic values basedon latitude, longitude, and altitude, and applying their model toCape Range produces an average rainfall oxygen isotopic valueof �6.2&, a result identical to water from the Cape Rangegroundwater estuary (salinity ¼ 1.9 p.s.u.) sampled in September2011. Using the calcite-water paleothermometer of Craig (1965),water with this composition, coupled with the average middleHolocene stalagmite d18O value of �8.0 � 0.3&, yields a calcitecrystallization temperature of 25 � 1 �C, identical to modernmean annual temperature of Cape Range and consistent with themiddle Holocene temperature reconstruction of van der Kaarset al. (2006). Nonetheless, stalagmite-based paleo-temperatureestimates are untenable for the deglacial and LGM given the

Fig. 8. Top e Oxygen isotopic ratios in rainwater relative to air temperature (Perth) and rainfall amount (Darwin).
R.F. Denniston et al. / Quaternary Science Reviews 77 (2013) 101e112 107
possibility of changing contributions of moisture sources andtheir respective oxygen isotopic ratios on Cape Range precipi-tation d18O values. Substantial differences in d18O values be-tween summer and winter precipitation is theoreticallysufficient to allow stalagmites to track temporal changes in therelative influence of seasonal moisture, a technique similarlyapplied to studies of speleothems that grew during the LastGlacial cycle in the southwestern United States (Asmerom et al.,2010). However, our limited understanding of the evolution ofthese moisture sources under modern conditions, coupled withincreased uncertainty regarding the positioning and strength ofthe IASM, southern westerlies, tropical cyclones, and northwestcloud bands during the late Pleistocene places the goal ofuniquely constraining the roles of moisture source variations onC126 stalagmite oxygen isotopic variability beyond our ability.
5.3. Influences of winter precipitation
The deglacial C126 oxygen isotopic record is dominated by thenegative oxygen isotopic anomaly coincident with Heinrich Stadial1 (HS1), a feature that may be explained by changing contributionsof winter rainfall. Variations in positioning of the southern hemi-sphere westerlies during the Last Glacial cycle have been suggestedfrom geomorphic evidence across South America (Heusser, 1989),Africa (Mills et al., 2012), and Australia (Schulmeister et al., 2004)including a more northward position during glacial periods(Toggweiler et al., 2006; Fletcher and Moreno, 2012). Evidence forprecipitation changes associated with migration of the southernhemisphere westerlies has also been obtained from south-centralAustralia, where megalake level markers track variations in hy-drologic balances across the Last Glacial cycle (Cohen et al., 2011).Some of these interior basins, such as Lake Eyre, are located southof the area receiving monsoon rainfall, but contain vast catchment
areas that reach far enough north to capturemonsoon-derived run-off (Magee et al., 2004). Water levels in other nearby basins havebeen demonstrated to reflect contributions from southerly sources,as well. One such site, Lake Frome, experienced significant lakelevel fluctuations during the deglacial period, including lake levelhighs at 17.6e15.8 and 13.5e12.0 ka (Cohen et al., 2011) (Fig. 1;Fig. 7), and which have been tied to increased precipitation fromsoutherly sources. This interpretation is supported by stalagmitesfrom southern Australia (w30�S) that reveal accelerated growthfrom 17.1 to 15.8 ka (Cohen et al., 2011) and by an equatorward shiftin polar waters at this time (Barrows and Juggins, 2005). However,using multi-proxy analysis of a marine core just south of theAustralian margin, De Deckker et al. (2012) documented deglacialchanges in the strength of the Leeuwin Current which, in turn,reflect positioning of the Subtropical Front and the southernhemisphere westerlies. These data reveal an anti-phasing with theNorth Atlantic such that poleward migration of the southernhemisphere westerlies occurred synchronously with HS1 and HS2,possibly due to linkages to AMOC, and thus rainfall from thesesources should have been generally reduced across southernAustralia during HS1. However, concentrations of Fe from aeoliandust within the same marine core record a sharp drop in SouthAustralia continental aridity beginning at 17.5 ka. Taken together,these results may indicate that the relationship between posi-tioning of the southern westerlies and rainfall balances across thesouthern portion of Australia were not necessarily straightforward.The C126 stalagmite record oxygen isotopic anomaly shows astructural similarity to this reconstruction of Leeuwin Currentstrength, although it is unclear whether there is a causal link be-tween the two sites.
While some uncertainties therefore exist between the megalakeand marine core records, it is clear that the southern hemispherewesterlies, along with associated storm tracks, are important
R.F. Denniston et al. / Quaternary Science Reviews 77 (2013) 101e112108
components of winter rainfall in southern Australia today, and thuslatitudinal shifts of their position would have impacted southernand possibly also central Australia precipitation patterns. Re-ductions in South Australia aridity are coincident with periods ofdecreased d18O values in C126 stalagmites, and given the pre-dominance of modern winter rainfall at Cape Range, equatorwardmigration of the westerlies may explain Last Glacial and early Ho-locene climate variability at C126. This interpretation is challenged,however, by precipitation reconstructions from pollen data ob-tained from the Cape Range margin and interpreted using transferfunctions developed by van der Kaars et al. (2006). Although con-taining substantial short-term variability, when smoothed, thesedata suggest increases in summer rainfall and decreases in winterrainfall from the LGM to the early Holocene. In addition, HS2 is notapparent in the C126 record, although the relatively weak responseof HS2 in the marine core taken south of Australia similarly maysuggest that it was limited in magnitude in this region.
Treble et al. (2005) conducted daily precipitation isotopic ana-lyses over a year-long interval from Cape Leeuwin Lighthouse(34.5�S), located approximately 200 km south of Perth, and whilethey found precipitation d18O values consistent with those fromPerth (weighted average of �4.3&), they also identified a negativecorrelation with rainfall amount, with the largest amounts ofrainfall associated with the lowest d18O values; no statisticallysignificant correlation between precipitation and air temperaturewas evident (although ultra-high-resolution d18O analysis of earlytwentieth century stalagmite calcite from this area suggests abreakdown in amount effects on precipitation at this time) (Trebleet al., 2005). These 18O-depleted rainfall events were delivered bylow pressure systems in the Southern Ocean that passed closest tothe South Australian coast. These data suggest that moisturederived from southern sources such as these may have been moreisotopically-depleted further north in association with equator-ward migration of the southern hemisphere westerlies.
Next, given their prominent influence on modern moisturebudgets at Cape Range today, changes in the strength or frequencyof NWCB must also be considered. Observational and modelingstudies demonstrate a correlation between northwest Australiarainfall and SST (and SST gradients; Shi et al., 2008) in the tropicaleastern Indian Ocean (Fredericksen et al., 2011). Over the LastGlacial cycle, this region experiencedmarked changes in SST drivenby changes in the strength of the Indonesian Throughflow (Zuraidaet al., 2009). Oxygen isotopic and Mg/Ca analyses of foraminiferataken from a core located at the southwestern margin of the TimorStraight (13�50S, 121�470E), the main outflow for the IndonesiaThroughflow, record SST variations that rose sharply during HS 3e5, with minimum SST of w19.5 �C prior to HS and peak SST of 22e24 �C during HS. If similar SST changes coincided with HS1, thenthey could have driven a concomitant increased rainfall responseacross northwestern Australia.
Additional sources of eastern Indian Ocean SST variability, atleast during the Holocene, have been the IOD and ENSO. Ashok et al.(2003) found a statistically significant reduction in westernAustralian winter rainfall during positive IOD years, although theydid not investigate impacts on rainfall during negative IOD years.And Telcik (2003) noted an apparent inverse relationship betweenthe IOD and NWCB activity. Abram et al. (2007) attributed SSTvariations in the northeastern Indian Ocean to strengthened andmore frequent IOD activity during the middle Holocene relative totoday which could have resulted in enhanced rainfall duringnegative IOD events. Regional SST in the NWCB-generating regionare also influenced by ENSO with El Niño (La Niña) events resultingin less (more) warm surface water passing through the IndonesianThroughflow into the eastern Indian Ocean (Meyers, 1996), andresulting in diminished (enhanced) NWCB production (Wright,
1997; Telcik, 2003). However, changes in rainfall alone do notnecessarily equate with changing precipitation (and therefore sta-lagmite) d18O values, and given the lack of isotopic data for pre-cipitation associated with NWCB in northwest Australia, thismechanism remains largely untestable at the present time.
5.4. Influences of summer precipitation
The possibility also exists for a relationship between C126 sta-lagmite d18O variability and summer rainfall, which in the CapeRange region is largely attributable to tropical cyclone activity.Today, tropical cyclones contribute approximately 30% of therainfall to the Cape Range (Milton, 1980; Dare et al., 2012; IndianOcean Climate Initiative, 2012), and can deliver rainfall substan-tially lower in d18O values than average precipitation (Lawrence andGedzelman,1996; Lawrence,1998; Lawrence et al., 2002). Lawrenceand Gedzelman (1996) documented rainfall d18O values that rangedfrom �7 to �14& associated with Hurricane Gilbert (in contrast tonon-cyclone-related summer rains which averaged �3&) (IAEA/WMO) where it made landfall across Texas, USA in 1988 AD andtied these lightest values to isotopic exchange between inflowingvapor and falling rain. The area south of 18�S along the WesternAustralia coast is dominated by dry subsiding anticyclonic airmasses associated with subtropical high pressure ridges. Duringthe austral summer, moist air masses shift southeast, bringing withthem convective thunderstorms, and inwinter, rain may be derivedfrom fronts that shift northward from the mid-latitudes. In general,the contribution of tropical cyclones to the annual hydrologicbudget decreases with distance north and south of 18�S, in partbecause of the increase in rainfall derived from the IASM to thenorth and winter rainfall events to the south (Milton, 1980; Dareet al., 2012).
Tropical cyclone activity is linked to positioning of the ITCZ(Wang and Magnusdottir, 2006), and the coastal area just north ofCape Range is characterized by the highest average frequency ofsevere tropical cyclones in Western Australia (bom.gov.au) (Fig. 1).Therefore, southward migration of the ITCZ conceivably could havepushed this tropical cyclone activity further southward, resulting inelevated landfall events at Cape Range, and concomitant decreasesin average annual precipitation d18O values. Prerequisites fortropical cyclone genesis include minimum SST of w26.5 �C(Nicholls, 1979; Dare and McBride, 2011) and variations in SSTassociated with changes in Indonesian Throughflow form anadditional, poorly constrained influence on cyclone activity as thiswould have impacted regional SST.
An alternative source of summer moisture during deglaciationmay lie in the IASM. Recent IASM reconstructions from the south-ern Indo-Pacific Warm Pool (IPWP) (Flores and the Flores Sea;Fig. 1) reveal evidence for monsoon links to North Atlantic climate(Griffiths et al., 2009; Muller et al., 2012) with HS1 cooling in theNorth Atlantic Ocean forcing a southward displacement of the ITCZthrough a reduction in Atlantic Meridional Overturning Circulation(AMOC) and increased ice cover in the high northern latitudes(Broccoli et al., 2006). Similar isotopic variability was documentedin stalagmites from Ball Gown Cave in the western Kimberley re-gion of tropical Australia and which also showed a close similarityto North Atlantic climate variations, with both HS1 and the YoungerDryas marked by periods of enhanced IASM moisture and theBølling/Allerød characterized by a dramatic weakening in the IASM(Denniston et al., 2013) (Figs. 1 and 9). The similarity of the d18Orecord from C126 and the southern IPWP and western Kimberleysuggests that this monsoon displacement was regional in scale, andthus raises the question of whether an increase in the contributionof C126 dripwater derived from isotopically light IASM sources wasresponsible for decreasing stalagmite d18O values during HS1.
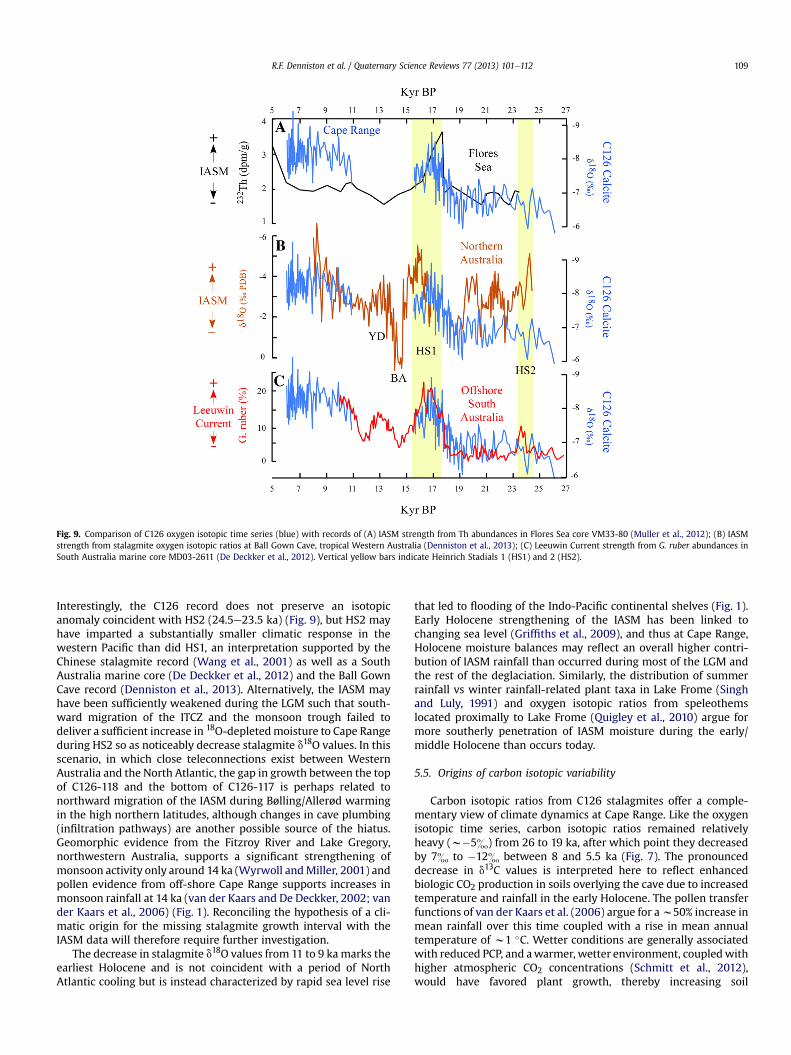
Fig. 9. Comparison of C126 oxygen isotopic time series (blue) with records of (A) IASM strength from Th abundances in Flores Sea core VM33-80 (Muller et al., 2012); (B) IASMstrength from stalagmite oxygen isotopic ratios at Ball Gown Cave, tropical Western Australia (Denniston et al., 2013); (C) Leeuwin Current strength from G. ruber abundances inSouth Australia marine core MD03-2611 (De Deckker et al., 2012). Vertical yellow bars indicate Heinrich Stadials 1 (HS1) and 2 (HS2).
R.F. Denniston et al. / Quaternary Science Reviews 77 (2013) 101e112 109
Interestingly, the C126 record does not preserve an isotopicanomaly coincident with HS2 (24.5e23.5 ka) (Fig. 9), but HS2 mayhave imparted a substantially smaller climatic response in thewestern Pacific than did HS1, an interpretation supported by theChinese stalagmite record (Wang et al., 2001) as well as a SouthAustralia marine core (De Deckker et al., 2012) and the Ball GownCave record (Denniston et al., 2013). Alternatively, the IASM mayhave been sufficiently weakened during the LGM such that south-ward migration of the ITCZ and the monsoon trough failed todeliver a sufficient increase in 18O-depletedmoisture to Cape Rangeduring HS2 so as noticeably decrease stalagmite d18O values. In thisscenario, in which close teleconnections exist between WesternAustralia and the North Atlantic, the gap in growth between the topof C126-118 and the bottom of C126-117 is perhaps related tonorthward migration of the IASM during Bølling/Allerød warmingin the high northern latitudes, although changes in cave plumbing(infiltration pathways) are another possible source of the hiatus.Geomorphic evidence from the Fitzroy River and Lake Gregory,northwestern Australia, supports a significant strengthening ofmonsoon activity only around 14 ka (Wyrwoll andMiller, 2001) andpollen evidence from off-shore Cape Range supports increases inmonsoon rainfall at 14 ka (van der Kaars and De Deckker, 2002; vander Kaars et al., 2006) (Fig. 1). Reconciling the hypothesis of a cli-matic origin for the missing stalagmite growth interval with theIASM data will therefore require further investigation.
The decrease in stalagmite d18O values from 11 to 9 ka marks theearliest Holocene and is not coincident with a period of NorthAtlantic cooling but is instead characterized by rapid sea level rise
that led to flooding of the Indo-Pacific continental shelves (Fig. 1).Early Holocene strengthening of the IASM has been linked tochanging sea level (Griffiths et al., 2009), and thus at Cape Range,Holocene moisture balances may reflect an overall higher contri-bution of IASM rainfall than occurred during most of the LGM andthe rest of the deglaciation. Similarly, the distribution of summerrainfall vs winter rainfall-related plant taxa in Lake Frome (Singhand Luly, 1991) and oxygen isotopic ratios from speleothemslocated proximally to Lake Frome (Quigley et al., 2010) argue formore southerly penetration of IASM moisture during the early/middle Holocene than occurs today.
5.5. Origins of carbon isotopic variability
Carbon isotopic ratios from C126 stalagmites offer a comple-mentary view of climate dynamics at Cape Range. Like the oxygenisotopic time series, carbon isotopic ratios remained relativelyheavy (w�5&) from 26 to 19 ka, after which point they decreasedby 7& to �12& between 8 and 5.5 ka (Fig. 7). The pronounceddecrease in d13C values is interpreted here to reflect enhancedbiologic CO2 production in soils overlying the cave due to increasedtemperature and rainfall in the early Holocene. The pollen transferfunctions of van der Kaars et al. (2006) argue for aw50% increase inmean rainfall over this time coupled with a rise in mean annualtemperature of w1 �C. Wetter conditions are generally associatedwith reduced PCP, and awarmer, wetter environment, coupledwithhigher atmospheric CO2 concentrations (Schmitt et al., 2012),would have favored plant growth, thereby increasing soil

R.F. Denniston et al. / Quaternary Science Reviews 77 (2013) 101e112110
respiration and vegetation density (Hellstrom et al., 1998). Changesin the C3/C4 ratio of vegetation over the cave may have beenresponsible for the observed 7& decrease in carbon isotopic valuesfrom the LGM to the Holocene but the dominance of C4 vegetationat Cape Range today necessitates that if plant type alone drovestalagmite d13C shifts from 20 to 7 ka, then an almost completereplacement by C4 plants has occurred since themiddle Holocene, ashift that is not recorded in regional pollen data (van der Kaars andDe Deckker, 2002). Alternatively, the large decrease in stalagmitecarbon isotopic values from 15 to 9 ka is a function of (or somecombination of) elevated atmospheric CO2 concentrations, tem-peratures, and precipitation that increased vegetation density andplant respiration, and thus the proportion of biogenic soil CO2relative to atmospheric CO2 in the infiltrating fluids, and that mayhave also been associated with a decrease in PCP (Fig. 7).
The concomitant decreases in carbon and oxygen isotopic ratiosfrom 19 to 17 ka may be explained by a similar mechanism. In thisarid deglacial climate, plant density would have responded to in-creases in moisture, thereby elevating the production of soil CO2,limiting the relative contribution of atmospheric CO2 in infiltratingfluids, and thereby decreasing stalagmite d13C values. Althoughstalagmite growth rates reflect a myriad of influences, in arid cli-mates, effective moisture exerts a first-order control (Asmerom andPolyak, 2004; Mattey et al., 2008). Therefore, the association ofelevated growth rates in both C126-117 and C126-118 with themost negative d13C values likely reflects increased delivery ofdripwater to the stalagmite surface during periods of greater plantdensity over the cave.
Under the current climate, deep caves such as C126 are seldomseenwith active drips on the stalagmites. In the absence of moderncalcite deposition, it remains unclear why middle Holocene sta-lagmite d13C values are characteristic of C3-dominated vegetationover the cave site. One possibility is that vegetation has shifteddramatically since 6 ka in response to changing rainfall conditions.In fact, van der Kaars et al. (2006) document peak Holocene rainfallat 6 ka, followed by substantial decreases in both summer andannual average rainfall to the present, consistent with our data. TheLake Frome and associated stalagmite records preserve evidence ofa middle Holocene (w5 ka) highstand which was tied to southwardmigration of the IASM trough and resulting tropical rainfall (Singhand Luly, 1991; Quigley et al., 2010; Cohen et al., 2011) rather thanwinter moisture, and if correct, then this monsoon influence wouldlikely have been felt at Cape Range, as well. In addition, some effectsmay be related to PCP and/or kinetic-driven fractionation thatdecreased stalagmite d13C values through disequilibrium betweenthe calcite and dissolved inorganic carbon reservoirs, an effectlinked in tropical speleothems to negative shifts in stalagmite d13Cvalues (Mickler et al., 2004).
6. Conclusions
Paleoenvironmental signals in stalagmites from Cape Range,Western Australia generally track glacial boundary conditionsduring the LGM and deglaciation. Origins of millennial-scale oxy-gen isotopic variability likely reflect multiple influences, includingshifts in winter moisture related to positioning of the southernhemisphere westerlies, variations in IASM rainfall, and/or tropicalcyclone activity. A shift to lower stalagmite calcite d18O valuescoincident with HS1 likely reflects changing moisture or moisturesource that could involve the positioning of the southern hemi-sphere westerlies, an increase in the strength/and or location of theIASM trough, tropical cyclone activity, and/or northwest cloud bandactivity. In the absence of a clear relationship between air tem-perature and precipitation d18O values at Cape Range, it appearsthat temperature exerted at most a small influence on C126
stalagmite oxygen isotopic variability. Interestingly, the magnitudeof the d18O anomaly coincident with HS1 is similar to the Pleisto-cene/Holocene oxygen isotopic shift, however no oxygen isotopicexcursion is associated with HS2. Stalagmite d13C data indicate adominant C4 vegetation type during the drier and colder LGMperiod, with a transition to more prominent C3 vegetation beingcomplete by the middle Holocene (ca 5.5e7.0 ka), although theroles of PCP and kinetic fractionation on stalagmite carbon isotopicvalues cannot be ruled out. Decreased d13C values in the earlyHolocene are a response to increased effective moisture, tempera-ture and possibly also atmospheric carbon dioxide levels. A middleHolocene minimum in stalagmite d13C and d18O values may reflectincreased IASM rainfall, as recorded by regional pollen evidence.
Acknowledgments
This work was funded by grants from the National EstatesGrants Program (to WFH), the Center for Global and RegionalEnvironmental Research and Cornell College (to RFD), and NSF EAR-0521196 (to MSL) and EAR-0326902 (to YA). We thank DarrenBrooks for assistance in recovering the samples in 1991 underfunding from the National Estate Program, a Commonwealth-financed grants scheme administered by the Australian HeritageCommission (Federal Government) and the Western AustralianHeritage Committee (State Government). Sample collection andarchiving information is available from WFH. This manuscriptbenefitted from discussions with Karl-Heinz Wyrwoll, CharithaPattiaratchi, Ming Feng, Glenn Cook, and Bart Geerts, as well fromcomments by two anonymous reviewers.
References
Abram, N.J., Gagan, M.K., Liu, Z., Hantoro, W.S., McCulloch, M.T., Suwargadi, W.,2007. Seasonal characteristics of the Indian Ocean Dipole during the Holoceneepoch. Nature 445, 299e302.
Ashok, K., Guan, Z., Yamagata, T., 2003. Influence of the Indian Ocean Dipole on theAustralian winter rainfall. Geophysical Research Letters 30, 1821. http://dx.doi.org/10.1029/2003GL017926.
Asmerom, Y., Polyak, V., 2004. Comment on Betancourt et al. (2002) “A test ofannual resolution in stalagmites using tree rings.” Quaternary Research 61,119e121.
Asmerom, Y., Polyak, V., Burns, S., 2010. Variable winter moisture in the south-western United States linked to rapid glacial climate shifts. Nature Geoscience3, 114e117.
Baker, A., Ito, E., Smart, P.L., McEwan, R.F., 1997. Elevated and variable values of 13Cin speleothems in a British cave system. Chemical Geology 136, 263e270.
Barrows, T.T., Juggins, S., 2005. Sea-surface temperatures around the Australianmargin and Indian Ocean during the last glacial maximum. Quaternary ScienceReviews 24, 1017e1047.
Broccoli, J.E., Dahl, K.A., Stouffer, R.J., 2006. Response of the ITCZ to NorthernHemisphere cooling. Geophysical Research Letters 33, L01702.
Cerling, T.E., 1984. The stable isotopic composition of modern soil carbonate and itsrelationship to climate. Earth and Planetary Science Letters 71, 229e240.
Chen, J., Edwards, L., Wasserburg, W., 1986. 238U, 234U, and 232Th in seawater. Earthand Planetary Science Letters 80, 241e251.
Cheng, H., Edwards, R.L., Hoff, J., Gallup, C.D., Richards, D.A., Asmerom, Y., 2000. Thehalf-lives of U-234 and Th-230. Chemical Geology 169, 17e33.
Cohen, T.J., Nanson, G.C., Jansen, J.D., Jones, B.G., Jacobs, Z., Treble, P., Price, D.M.,May, J.-H., Smith, A.M., Ayliffe, L.A., Hellstrom, J.C., 2011. Continental aridifica-tion and the vanishing of Australia’s megalakes. Geology 39, 167e170.
Craig, H., 1965. The measurement of oxygen isotope paleotemperatures. In:Tongiorgi, E. (Ed.), Stable Isotopes in Oceanographic Studies and Paleotemper-atures. Consiglio Nazionale della Richerche Laboratorio di Geologia Nucleare,Pisa, pp. 161e182.
Dansgaard, W., 1964. Stable isotopes in precipitation. Tellus 16, 436.Dare, R.A., Davidson, N.E., McBride, J.L., 2012. Tropical cyclone contribution to
rainfall over Australia. Monthly Weather Review 140, 3606e3619.Dare, R.A., McBride, J.L., 2011. The threshold sea surface temperature condition for
tropical cyclogenesis. Journal of Climate 24, 4570e4576.Day, C.C., Henderson, G.M., 2011. Oxygen isotopes in calcite grown under cave-
analogue conditions. Geochimica et Cosmochimica Acta 75, 3956e3972.De Deckker, P., Moros, M., Perner, K., Jansen, E., 2012. Influence of the tropics and
southern westerlies on glacial interhemispheric asymmetry. Nature Geoscience5, 266e269.

R.F. Denniston et al. / Quaternary Science Reviews 77 (2013) 101e112 111
Denniston, R.F., González, L.A., Asmerom, Y., Baker, R.G., Reagan, M.K., Bettis III, E.A.,1999. Evidence for increased cool season moisture during the middle Holocene.Geology 27, 815e818.
Denniston, R.F., DuPree, M., Asmerom, Y., Polyak, V., Dorale, J.A., Carpenter, S., 2007.Episodes of increased aridity in the Late Holocene recorded by stalagmites fromDevils Icebox Cave, Central Missouri, USA. Quaternary Research 68, 45e52.
Denniston, R.F., Wyrwoll, K.-H., Asmerom, Y., Polyak, V.J., Humphreys, W., Cugley, J.,Woods, D., Peota, J., Greaves, E., 2013. North Atlantic forcing of millennial-scaleAustralian monsoon variability during the Last Glacial. Quaternary ScienceReviews 72, 159e168.
Dogramaci, S., Skrzypek, G., Dodson, W., Grierson, P.F., 2012. Stable isotope andhydrochemical evolution of groundwater in the semi-arid Hamersley Basin ofsubtropical northwest Australia. Journal of Hydrology 475, 281e293.
Dorale, J.A., Liu, Z., 2009. Limitations of Hendy Test criteria in judging the paleo-climatic suitability of speleothems and the need for replication. Journal of Caveand Karst Studies 71, 73e80.
Dorale, J.A., Gonzalez, L.A., Reagan, M.K., Pickett, D.A., Murrell, M.T., Baker, R.G.,1992. A high-resolution record of Holocene climate change in speleothemcalcite from Cold Water Cave, northeast Iowa. Science 258, 1626e1630.
Fairchild, I.J., Smith, C.L., Baker, A., Fuller, L., Spotl, C., Mattey, D., McDermott, F.,E.I.M.F., 2006. Modification and preservation of environmental signals in spe-leothems. Earth-Science Reviews 75, 105e153.
Fletcher, M.-S., Moreno, P.I., 2012. Vegetation, climate and fire regime changes inthe Andean region of southern Chile (38�S) covaried with centennial-scaleclimate anomalies in the tropical Pacific over the last 1500 years. QuaternaryScience Reviews 46, 46e56.
Forth, J.R., 1973. Exmouth Water Supply Western Australia. Western AustralianGeological Survey Annual Report 1972, pp. 11e15.
Frederiksen, J.S., Fredericksen, C.S., Osbrough, S.L., Sisson, J.M., 2011. Changes inSouthern Hemisphere rainfall, circulation and weather systems. In: 19th In-ternational Congress on Modelling and Simulation, Perth, Australia, 12e16December 2011. http://mssanz.org.au/modsim2011.
Frumkin, A., Ford, D.C., Schwarcz, H.P., 2000. Paleoclimate and vegetation of the LastGlacial cycles in Jerusalem from a speleothem record. Global BiogeochemicalCycles 14, 863e870.
Gentilli, J., 1986. Climate. In: Jeans, D.N. (Ed.), Australia, a Geography, The NaturalEnvironment, vol. 1. Sydney University Press, Sydney, Australia, pp. 14e48.
Genty, D., Blamart, D., Ouahdi, R., Gilmour, M., Baker, A., Jouzel, J., Van-Exter, S.,2003. Precise dating of Dansgaard-Oeschger climate oscillations in westernEurope from stalagmite data. Nature 421, 833e837.
Griffiths, M.L., Drysdale, R.N., Gagan, M.K., Zhao, J.X., Ayliffe, L.K., Hellstrom, J.C.,Hantoro, W.S., Frisia, S., Feng, Y.X., Cartwright, I., Pierre, E.S., Fischer, M.J.,Suwargadi, B.W., 2009. Increasing Australian-Indonesian monsoon rainfalllinked to early Holocene sea-level rise. Nature Geoscience 2, 636e639. http://dx.doi.org/10.1038/ngeo605.
Hamilton-Smith, E., Kiernan, K., Spate, A., 1998. Karst Management Considerationsfor the Cape Range Karst Province, Western Australia. A Report Prepared for theDepartment of Environmental Protection, Perth, Western Australia.
Hattersley, P.W., 1983. The distribution of C3 and C4 grasses in Australia in relationto climate. Oecologia 57, 113e128.
Hellstrom, J., McCulloch, M., Stone, J., 1998. A detailed 31,000-year record of climateand vegetation change, from the isotope geochemistry of two New Zealandspeleothems. Quaternary Research 50, 167e178.
Hendy, C., 1971. The isotopic geochemistry of speleothems e I. The calculation of theeffects of different modes of formation on the isotopic composition of speleo-thems and their applicability as palaeoclimatic indicators. Geochimica et Cos-mochimica Acta 35, 801e824.
Heusser, C.J., 1989. Southern westerlies during the Last Glacial Maximum. Quater-nary Research 31, 423e425.
Humphreys, W.F., 1991a. Survey of Caves in Cape Range, North West Cape Peninsula,Western Australia. Unpublished Report Prepared Under the National EstateGrants Program, a Commonwealth-finance Grants Scheme Administered by theAustralian Heritage Commission (Federal Government) and the HeritageCouncil of Western Australia (State Government).
Humphreys, W.F., 1991b. Experimental re-establishment of pulse-driven pop-ulations in a terrestrial troglobite community. Journal of Animal Ecology 60,609e623.
IAEA/WMO: Global Network of Isotopes in Precipitation, The GNIP Database. http://isohis.iaea.org.
Indian Ocean Climate Initiative, 2012. In: Bates, B., Frederiksen, C., Wormworth, J.(Eds.), Western Australia’s Weather and Climate: a Synthesis of Indian OceanClimate Initiative Stage 3 Research. CSIRO and BoM, Australia, p. 117.
Kim, S.-T., O’Neil, J.R., 1997. Equilibrium and nonequilibrium oxygen isotope effectsin synthetic carbonates. Geochimica et Cosmochimica Acta 61, 3461e3475.
Kohler, P., Fischer, H., Schmitt, J., 2010. Atmospheric d13CO2 and its relation to pCO2and deep ocean d13C during the late Pleistocene. Paleoceanography 25, PA1213.
Lachniet, M.S., 2009. Climatic and environmental controls on speleothem oxygenisotope values. Quaternary Science Reviews 28, 412e432.
Lawrence, J.R., 1998. Isotopic spikes from tropical cyclones in surface waters: op-portunities in hydrology and paleoclimatology. Chemical Geology 144, 153e160.
Lawrence, J.R., Gedzelman, D., 1996. Low stable isotope ratios of tropical cyclonerains. Geophysical Research Letters 23, 527e530.
Lawrence, J.R., Gedzelman, S.D., Gamache, J., Black, M., 2002. Stable isotope ratios:Hurricane Olivia. Stable isotope ratios of precipitation collected at 3 km elevationin Hurricane Olivia (1994). Journal of Atmospheric Chemistry 41, 67e82.
Liu, J., Fu, G., Song, X., Charles, S.P., Zhang, Y., Han, D., Wang, S., 2010. Stable isotopiccompositions in Australian precipitation. Journal of Geophysical Research 115,D23307.
Magee, J.W., Miller, G.H., Spooner, N.A., Questiaux, D., 2004. Continuous 150 k.y.monsoon record from Lake Eyre, Australia. Insolation-forcing implications andunexpected Holocene failure. Geology 32, 885e888.
Mattey, D., Lowry, D., Duffet, J., Fisher, R., Hodge, E., Frisia, S., 2008. A 53 yearseasonally resolved oxygen and carbon isotope record from a modern Gibraltarspeleothem: reconstructed drip water and relationship to local precipitation.Earth and Planetary Science Letters 269, 80e95.
Meehl, G.A., 1993. A coupled air-sea mechanism in the tropical Indian Ocean andPacific regions: role of the ocean. Journal of Climate 6, 31e41.
Meyers, G., 1996. Variations of Indonesian throughflow and El Niño/SouthernOscillation. Journal of Geophysical Research 101 (C5), 12,255e12,263.
Mickler, P.J., Banner, J.L., Stern, L., Asmerom, Y., Edwards, R.L., Ito, E., 2004. Stableisotope variations in modern tropical speleothems: evaluating applications topaleoenvironmental reconstructions. Geochimica et Cosmochimica Acta 68,4381e4393.
Miller, G.H., Magee, J.W., Jull, A.J.T., 1997. Low-latitude glacial cooling in theSouthern Hemisphere from amino-acid racemization in emu eggshells. Nature385, 241e244.
Mills, S.C., Grab, S.W., Rea, B.R., Carr, S.J., Farrow, A., 2012. Shifting westerlies andprecipitation patterns during the Late Pleistocene in southern Africa deter-mined using glacier reconstruction and mass balance modeling. QuaternaryScience Reviews 55, 149e159.
Milton, D., 1980. The contribution of tropical cyclones to the rainfall of tropicalWestern Australia. Singapore Journal of Tropical Geography 1, 46e54.
Muller, J., McManus, J.F., Oppo, D.W., Francois, R., 2012. Strengthening of theNortheast Monsoon over the Flores Sea, Indonesia, at the time of Heinrich event1. Geology 40, 635e638.
Nicholls, N., 1979. A possible method for predicting seasonal tropical cycloneactivity in the Australian region. Monthly Weather Review 107, 1221e1224.
Nicholls, N., 1992. Recent performance of a method for forecasting Australian sea-sonal tropical cyclone activity. Australian Meteorology Magazine 40, 105e110.
Pearce, A., Pattiaratchi, C., 1999. The Capes Current: a summer countercurrentflowing past Cape Leeuwin and Cape Naturalist, Western Australia. ContinentalShelf Research 19, 401e420.
Pittock, A.B., 1975. Climatic change and the pattern of variation in Australianrainfall. Search 1, 498e504.
Quigley, M.C., Horton, T., Hellstrom, J.C., Cupper, M.L., Sandiford, M., 2010. Holoceneclimate change in arid Australia from speleothem and alluvial records. TheHolocene 20, 1,093e1,104.
Romanek, C.S., Grossman, E.L., Morse, J.W., 1992. Carbon isotopic fractionation insynthetic aragonite and calcite: effects of temperature and precipitation rate.Geochimica et Cosmochimica Acta 56, 419e430.
Russell, P.J., 2004. Geological and Geomorphic Features and Evolution of the LakeMcLeod e Ningaloo e Cape Range e Exmouth Gulf Area, Western Australia.Report prepared for the Department on Conservation and Land Management,Perth, Western Australia.
Saltzman, M.R., Thomas, E. Carbon isotope stratigraphy. In: Gradstein, F., Ogg, J.,Ogg, G., Schmitz, M. (Eds.), The Geologic Time Scale 2012, pp. 207e232. http://dx.doi.org/10.1016/B978-0-444-59425-9.00011-1.
Schmitt, J., Schneider, R., Elsig, J., Leuenberger, D., Lourantou, A., Chappellaz, J.,Köhler, P., Joos, F., Stocker, T.F., Leuenberger, M., Fischer, H., 2012. Carbonisotope constraints on the deglacial CO2 rise from ice cores. Science 336,711e714.
Schulmeister, J., Goodwin, I., Renwick, J., Harle, K., Armand, L., McGlone, M.S.,Cook, E., Dodson, J., Hesse, P.P., Mayewski, P., Curran, M., 2004. The SouthernHemisphere westerlies in the Australasian sector over the Last Glacial cycle: asynthesis. Quaternary International 118e119, 23e53.
Shi, G., Cai, W., Cowan, T., Ribbe, J., Rotstayn, L., Dix, M., 2008. Variability and trendof North West Australia rainfall: observations and coupled climate modeling.Journal of Climate 21, 2938e2959.
Singh, G., Luly, J., 1991. Changes in vegetation and seasonal climates since the lastfull glacial at Lake Frome, South Australia. Palaeogeography, Palaeoclimatology,Palaeoecology 84, 75e86.
Smith, B.N., Epstein, S., 1971. Two categories of C3/C4 ratios for higher plants. PlantPhysiology 47, 380e384.
Telcik, N., 2003. Influence of the Eastern Indian Ocean Variability on SouthwestAustralian Rainfall (Unpublished masters thesis). University of WesternAustralia, p. 159.
Toggweiler, J.R., Russel, J., Carson, S.R., 2006. Midlatitude westerlies, atmo-spheric CO2, and climate change during the ice ages. Paleoceanography 21,PA2005.
Treble, P.C., Chappell, J., Gagan, M.K., McKeegan, K.D., Harrison, T.M., 2005. In situmeasurement of seasonal d18O variations and analysis of isotopic trends in amodern speleothem from southwest Australia. Earth and Planetary ScienceLetters 233, 17e32.
van der Kaars, S., De Deckker, P., 2002. A Late Quaternary pollen record from deep-sea core Fr10/95, GC17 offshore Cape Range Peninsula, northwestern WesternAustralia. Review of Palaeobotany and Palynology 120, 17e39.
van der Kaars, S., De Deckker, P., 2003. Pollen distribution in marine surface sedi-ments offshore Western Australia. Review of Palaeobotany and Palynology 124,113e129.

R.F. Denniston et al. / Quaternary Science Reviews 77 (2013) 101e112112
van der Kaars, S., De Deckker, P., Gingele, F.X., 2006. A 100 000-year record ofannual and seasonal rainfall and temperature for northwestern Australiabased on a pollen record obtained offshore. Journal of Quaternary Science 21,879e889.
Wang, Y.J., Cheng, H., Edwards, R.L., An, Z.S., Wu, J.Y., Shen, C.C., Dorale, J.A.,2001. A high-resolution absolute-dated late Pleistocene monsoon recordfrom Hulu Cave, China. Science 294, 2345e2348. http://dx.doi.org/10.1126/science.1064618.
Wang, C.-C., Magnusdottir, G., 2006. The ITCZ in the central and eastern Pacific onsynoptic time scales. Monthly Weather Review 134, 1405e1421.
WAPC, Western Australia Planning Commission, 1996. Environmental Protection ofCape Range Province; Position Statement 1. Environmental Protection Author-ity, ISBN 0 7309 8169 X, p. 28.
Wright, W.J., 1997. Tropical-extratropical cloudbands and Australian rainfall. I:Climatology. International Journal of Climatology 17, 807e829.
Wyrwoll, K.-H., Miller, G.H., 2001. Initiation of the Australian summer monsoon14,000 years ago. Quaternary International 83-85, 119e128.
Zuraida, R., Holbourn, A., Nurnberg, D., Kuhnt, W., Durkop, A., Erichsen, A., 2009.Evidence for Indonesian throughflow slowdown during Heinrich events 3e5.Paleoceanography 24, PA2205.