Embed Size (px)
Citation preview


Q2-2017: Performance
review
November 7, 2016

2
Certain statements in these slides are forward-looking statements.
These statements are based on management's current expectations and
are subject to uncertainty and changes in circumstances. Actual results
may differ materially from those included in these statements due to a
variety of factors. More information about these factors is contained in
ICICI Bank's filings with the US Securities and Exchange Commission.
All financial and other information in these slides, other than financial
and other information for specific subsidiaries where specifically
mentioned, is on an unconsolidated basis for ICICI Bank Limited only
unless specifically stated to be on a consolidated basis for ICICI Bank
Limited and its subsidiaries. Please also refer to the statement of
unconsolidated, consolidated and segmental results required by Indian
regulations that has, along with these slides, been filed with the stock
exchanges in India where ICICI Bank’s equity shares are listed and with
the New York Stock Exchange and the US Securities and Exchange
Commission, and is available on our website www.icicibank.com

3
P&L indicators
Agenda
Credit quality
Subsidiaries
Capital
Growth
Highlights

4
P&L indicators
Agenda
Credit quality
Subsidiaries
Capital
Growth
Highlights

5
Sharp focus on strategic priorities: 4x4
agenda
Robust funding profile Digital leadership & strong
customer franchise
Continued cost efficiency Focus on capital efficiency
including value unlocking
Monitoring focus Improvement in portfolio
mix
Concentration risk
reduction Resolution of stress cases
En
han
cin
g
fran
ch
ise
Po
rtfo
lio
qu
ality

6
Value unlocking
Completed initial public offer of ICICI Prudential Life
Insurance Company Limited in Q2-2017
The Bank sold 12.63% stake in the IPO and realised
gains of ₹ 56.82 billion in Q2-2017; shareholding of
54.9% after the sale

7
Reduction in exposure to key sectors
The Bank’s aggregate exposure to power, iron & steel,
mining, cement and rigs sectors1 decreased from
16.2% of total exposure at Mar 2012 and 13.3% of
total exposure at Mar 2016 to 11.9% of total exposure
at Sep 2016
1. Key sectors impacted by challenges in the operating environment
8
• Net reduction in exposure and rating upgrades of ₹
24.61 billion during H1-2017
• Based on the transactions announced by certain
borrowers, significant further reduction expected
over next six to nine months, subject to necessary
approvals and completion of transactions
Repayments & upgrades from
drilldown exposures
In April 2016, the Bank had disclosed exposure to
‘below investment grade’ rated entities in key sectors
and promoter entities1
1. Promoter entities where underlying is partly linked to the key sectors

9
₹ billion
Additional provisions 35.88
Additional provisions for standard loans
Entire loss on sale of NPAs in H1-2017 recognised
upfront (permitted to be amortised as per RBI
guidelines)
16.78
3.95
1
2
3 Floating provisions 15.15
Further strengthening the balance sheet
10
P&L indicators
Agenda
Credit quality
Subsidiaries
Capital
Growth
Highlights

11
Continued healthy loan growth driven by
retail
Overall loan growth at 10.9%
y-o-y
Total loans at ` 4,543 bn at Sep
30, 2016
1.Overseas portfolio decreased by 5.5% y-o-y in US$ terms
Domestic loan growth at 15.9%
y-o-y
1

12
Increasing share of retail loans
Share of retail loans in total
loans increased from 44.0% at
Sep 30, 2015 to 47.9% at Sep
30, 2016
1. Based on advances gross of floating provisions
1

13
Retail portfolio: robust growth across
segments
1. Dealer funding loans have been reclassified from Business banking to Others
2. Others include dealer funding: 1.4% and loan against securities: 0.7%
3. Vehicle loans include auto loans: 10.8%, commercial
business: 6.2% and two-wheeler loans: 0.1%
Retail loan growth at 21.1%
y-o-y
Total retail loans at ` 2,182
billion at Sep 30, 2016
1
2
3

14
Growth in domestic corporate portfolio at 8.4% y-o-y; growth
in corporate loans, other than non-performing loans,
restructured loans and loans to companies included in
drilldown exposures, is significantly higher
Continued focus on lending to higher rated corporates
Corporate business: focus on selective
lending

15
Sustained healthy CASA ratios
Overall deposit growth healthy at 16.8% y-o-y; proportion of
retail deposits at about 76%
Balance sheet: slide 59
• 18.3% y-o-y growth in period-end CASA deposits; 21.7%
y-o-y growth in period-end SA deposits
• Accretion of ₹ 86.84 billion to SA deposits and ₹ 52.24 billion
to CA deposits in Q2-2017
• 17.7% y-o-y growth in average CASA deposits

16
Extensive franchise
Branches At Mar
31, 2014
At Mar
31, 2015
At Mar
31, 2016
At Sep
30, 2016
% share
at Sep
30, 2016
Metro 935 1,011 1,159 1,167 26.1%
Urban 865 933 997 998 22.3%
Semi urban 1,114 1,217 1,341 1,346 30.1%
Rural 839 889 953 957 21.4%
Total branches 3,753 4,050 4,450 4,468 100.0%
Total ATMs 11,315 12,451 13,766 14,295 -

17
Leadership in technology

18
Growing payments franchise
Number
of cards
Card spends

19
Spectrum of unique digital offerings
• India’s first ‘Digital Bank’: Amongst the top four
wallet apps in terms of time spent on the app1
•Only bank app to figure in the top wallet apps
•About 5.3 million downloads
• Banking services available on Facebook and Twitter
• Fan base of 4.8 million on Facebook
Social media
•Over 150 services including industry first features
•New features like iMobile Smartkeys introduced
Digital wallet
iMobile
1. As per Nielsen Whitepaper on Wallets

1
20
Adoption of digital offerings
1. Includes touch banking, phone banking & debit cards POS transactions
2. Financial and non-financial transactions of savings account customers
Channel mix of transactions2 for Q2-2017

21
• UPI based transactions introduced
in ‘iMobile’ and ‘Pockets’
• Over 200,000 Virtual Payment
Addresses (VPA)
• Working on tie-ups with several
merchants for enabling ‘Person to
Merchant’ (P2M) transactions; tie-
ups under execution with several
merchants
Launch of Unified Payments Interface (UPI)
Continued digital leadership (1/2)

22
• Over 200 software robotic systems
perform over 1.0 million banking
transactions every working day
• Reduced response time for
customers by up to 60%; improved
productivity
Roll-out of ‘Software robotic systems’
Continued digital leadership (2/2)
The Bank became the first bank in India and among few
globally to successfully exchange and authenticate
remittance transaction messages and original international
trade documents using blockchain technology

23
P&L indicators
Agenda
Credit quality
Subsidiaries
Capital
Growth
Highlights

24
1. The Bank sold net NPAs amounting to ` 22.32 billion and ₹ 8.82 billion to ARCs in
Q1-2017 and Q2-2017 respectively. In Q2-2017, the Bank has recognised entire loss
on sale of NPAs in H1-2017, which is permitted to be amortised as per RBI
guidelines
2. Based on customer assets
` billion FY2016 Q2-2016 Q1-2017 Q2-2017
Opening gross NPA
152.42 152.86 267.21 275.63
Add: gross additions
171.13 22.42 82.49 80.29
- of which:
slippages from
restructured assets 53.00 9.31 13.21 12.31
- of which: Slippages from
exposure to ‘below investment
grade’ companies in key sectors
reported - - 45.59 45.55
Less: recoveries & upgrades 21.84 7.09 7.92 8.00
Net additions 149.29 15.33 74.57 72.29
Less: write-offs & sale1
34.50 8.13 66.15 22.44
Closing gross NPAs 267.21 160.06 275.63 325.48
Gross NPA ratio2
5.21% 3.36% 5.28% 6.12%
Movement of NPA (1/2)

25
About 80% of the gross additions to NPAs for the
wholesale & and SME businesses in Q2-2017 were on
account of slippages relating to companies internally
rated below investment grade in key sectors,
restructured portfolio and non-performing accounts at
June 30, 2016
Movement of NPA (2/2)

26
Asset quality and provisioning
` billion September
30, 2015
June 30,
2016
September
30, 2016
Gross NPAs
160.06 275.63 325.48
Less: cumulative provisions
91.78 122.55 160.651
Net NPAs 68.28 153.08 164.83
Net NPA ratio
1.47% 3.01% 3.21%
Retail NPAs (` billion) September
30, 2015
June 30,
2016
September
30, 2016
Gross retail NPAs
35.39 41.47 42.98
- as a % of gross retail advances
1.86% 1.96% 1.94%
Net retail NPAs 11.76 13.55 14.27
- as a % of net retail advances
0.63% 0.65% 0.65%
Net investment in security receipts of ARCs was ` 28.29 billion
at Sep 30, 2016 (June 30, 2016: ₹ 22.39 billion); the Bank sold
net NPAs amounting to ` 8.82 billion to ARCs during Q2-2017
1. Include floating provisions of ₹ 15.15 billion

27
NPA and restructuring trends
` billion September
30, 2015
June 30,
2016
September
30, 2016
Net NPAs (A)
68.28 153.08 164.83
Net restructured loans (B)
118.68 72.41 63.36
Total (A+B) 186.96 225.49 228.19
Total as a % of net
customer assets
4.02% 4.44% 4.44%
Outstanding general provision on standard assets:
` 25.65 billion at September 30, 20161
Provisioning coverage ratio at 59.6% including
cumulative technical/ prudential write-offs and floating
provisions
1. Excludes additional provision of ₹ 16.78 billion against standard assets

28
Portfolio trends and approach

Portfolio composition over the years
29
1. Based on advances gross of floating provisions
2. Including impact of exchange rate movement
% of total
advances
March
31, 2012
March
31, 2013
March
31, 2014
March
31, 2015
March
31, 2016
September
30, 20161
Retail 38.0% 37.0% 39.0% 42.4% 46.6% 47.9%
Domestic
corporate 28.6% 32.5% 30.1% 28.8% 27.5% 27.7%
SME 6.0% 5.2% 4.4% 4.4% 4.3% 4.3%
International2 27.4% 25.3% 26.5% 24.3% 21.6% 20.1%
Total
advances
(` billion) 2,537 2,902 3,387 3,875 4,353 4,543

Sector-wise exposures
30
1. Top 10 based on position at Sep 30, 2016
2. Figures may not be fully comparable with subsequent
periods due to certain reclassifications effective 2013
Top 10 sectors1: % of total
exposure of the Bank
March 31,
20122
March 31,
20132
March
31, 2014
March
31, 2015
March
31, 2016
Sep 30,
2016
Retail finance 16.2%
18.9%
22.4% 24.7% 27.1% 28.9%
Electronics & engineering 8.1% 8.3% 8.2% 7.6% 7.3% 7.2%
Banks 10.1% 8.8% 8.6% 7.8% 8.0% 7.0%
Road, port, telecom, urban
development & other infra 5.8% 6.0% 6.0% 5.9% 5.8% 6.1%
Services – finance 6.6% 6.0% 4.9% 4.2% 4.9% 5.8%
Crude petroleum/refining &
petrochemicals 5.5% 6.6% 6.2% 7.0% 5.7% 5.7%
Power 7.3% 6.4% 5.9% 5.5% 5.4% 5.0%
Services - non finance 5.5% 5.1% 5.2% 5.0% 4.9% 4.4%
Iron/steel & products 5.2% 5.1% 5.0% 4.8% 4.5% 3.8%
Construction 4.3% 4.2% 4.4% 4.0% 3.4% 3.2%
Total exposure of the
Bank (` billion) 7,133 7,585 7,828 8,535 9,428 9,512

31
There are uncertainties in respect of certain sectors due to:
• Weak global economic environment
• Low commodity prices
• Gradual nature of the domestic economic recovery
• High leverage
The Bank had identified power, iron & steel, mining, cement
and rigs sectors as the key sectors in this context

Aggregate exposure to key sectors
32
% of total
exposure of
the Bank
March 31,
2012
March 31,
2013
March 31,
2014
March 31,
2015
March 31,
2016
Sep 30,
2016
Power 7.3% 6.4% 5.9% 5.5% 5.4% 5.0%
Iron/steel
5.2% 5.1% 5.0% 4.8% 4.5% 3.8%
Mining 2.0% 1.7% 1.7% 1.5% 1.6% 1.6%
Cement 1.2% 1.4% 1.4% 1.5% 1.2% 1.1%
Rigs 0.5% 0.5% 0.8% 0.5% 0.6% 0.4%
Total
exposure of
the Bank to
key sectors 16.2% 15.1% 14.8% 13.8% 13.3% 11.9%

Further drilldown: approach
33
All internally ‘below investment grade’ rated companies
in key sectors across domestic corporate, SME and
international branches portfolios
Promoter entities internally ‘below investment grade’
where the underlying is partly linked to the key sectors
Largely includes 5/25 and SDR in key sectors
Fund-based limits and non-fund based outstanding to
above categories considered
1
2
3
4
Loans already classified as restructured and non-
performing excluded 5

Further drilldown: sector-wise details
34
At June 30, 2016 At September 30, 2016
` billion Exposure1,2,3
% of total
exposure Exposure
1,2,3 % of total
exposure
Power 114.26 1.2% 90.03 0.9%
Mining 77.28 0.8% 75.84 0.8%
Iron/steel 49.02 0.5% 47.13 0.5%
Cement 56.71 0.6% 56.17 0.6%
Rigs 25.61 0.3% 0.44 -
Promoter entities3
64.36 0.7% 55.29 0.6%
1. Aggregate fund based limits and non-fund based outstanding
2. Excludes net exposure of ₹ 5.82 bn to central public sector owned undertaking
3. Includes promoter entities where underlying is partly linked to the key sectors
4. Includes non-fund based outstanding in respect of accounts included in the
drilldown exposure where the fund based outstanding has been classified as
non-performing
5. In addition to the above, the non-fund based outstanding to borrowers classified
as non-performing was ₹ 32.86 bn at Sep 30, 2016
35
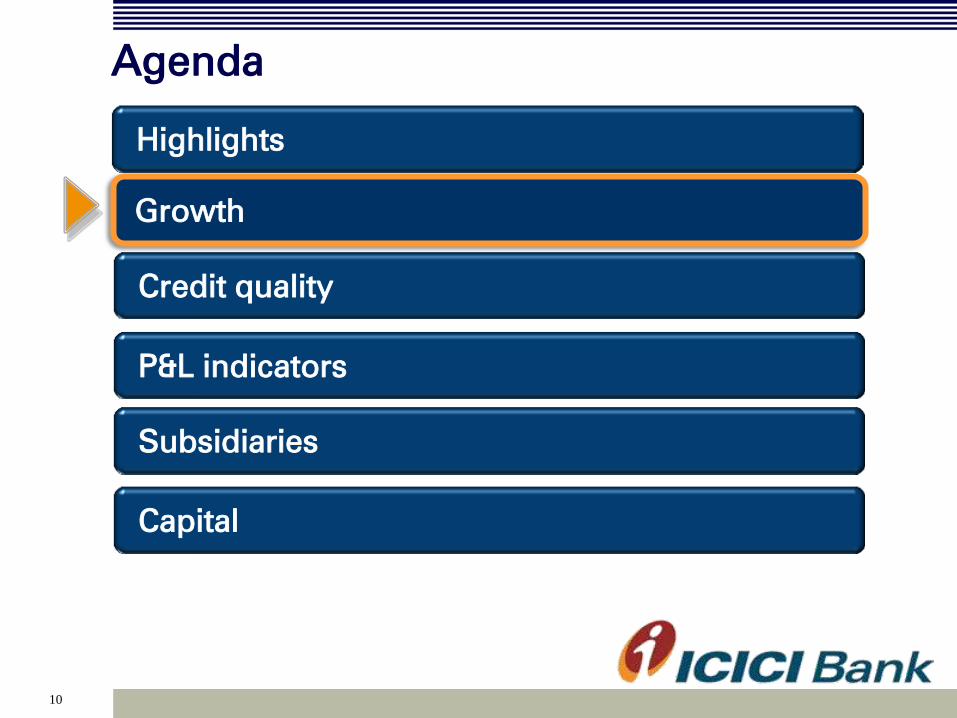
Further drilldown: movement
1. Aggregate fund based limits and non-fund based outstanding
2. Excludes net exposure of ₹ 5.82 bn to central public sector owned undertaking
3. Includes promoter entities where underlying is partly linked to the key sectors
4. Includes non-fund based outstanding in respect of accounts included in the
drilldown exposure where the fund based outstanding has been classified as
non-performing
5. In addition to the above, the non-fund based outstanding to borrowers classified
as non-performing was ₹ 32.86 bn at Sep 30, 2016
Aggregate exposure1,2,3,4
Q2-2017 H1-2017
Opening balance 387.23 440.65
Net reduction in exposure (16.77) (20.36)
Net rating upgrade to ‘investment
grade’ - (4.25)
Classified as non-performing (45.55) (91.14)
Closing balance 324.90 324.90
₹ billion

36
P&L indicators
Agenda
Credit quality
Subsidiaries
Capital
Growth
Highlights

37
Profit & loss statement
1. Includes net foreign exchange gains relating to overseas operations of ` 9.41 billion in
FY2016, ` 1.90 billion in Q2-2016, ` 2.06 billion in Q1-2017, nil in Q2-2017 and ` 2.06
billion in H1-2017
2. Includes profit on sale of shareholding in ICICI Life and ICICI General of ` 33.74 billion in
FY2016 and profit on sale of shareholding in ICICI Life of
₹ 56.82 billion in Q2-2017 and H1-2017
` billion FY
2016
Q2-
2016
H1-
2016
Q1-
2017
Q2-
2017
H1-
2017
Q2-o-Q2
growth
NII
212.24 52.51 103.66 51.59 52.53 104.12 -
Non-interest
income 153.22 30.07 59.97 34.29 91.20 125.49 203.3%
- Fee income 88.20 22.35 43.45 21.56 23.56 45.12 5.4%
- Other income1
24.42 5.50 12.23 5.05 3.52 8.57 (36.0%)
- Treasury income2
40.60 2.22 4.29 7.68 64.12 71.80 -
Total income 365.46 82.58 163.63 85.88 143.73 229.61 74.0%
Operating
expenses
126.83 31.00 61.67 33.73 37.37 71.10 20.5%
Operating profit 238.63 51.58 101.96 52.15 106.36 158.51 106.2%

38
Profit & loss statement
` billion FY
2016
Q2-
2016
H1-
2016
Q1-
2017
Q2-
2017
H1-
2017
Q2-o-
Q2
growth
Operating profit 238.63 51.58 101.96 52.15 106.36 158.51 106.2%
Additional
provisions - - - - 35.88 35.88 -
Collective
contingency &
related reserve 36.00 - - - - - -
Other provisions1
80.67 9.42 18.98 25.15
34.95 60.10 271.0%
Profit before tax 121.96 42.16 82.98 27.00 35.53 62.53 (15.7%)
Tax 24.70 11.86 22.92 4.68 4.51 9.19 (62.0%)
Profit after tax 97.26 30.30 60.06 22.32 31.02 53.34 2.4%
1. There was a drawdown from the collective contingency and related reserve of ₹ 8.65
billion and ₹ 6.80 billion during Q1-2017 and Q2-2017 respectively

39
Yield, cost & margin
Movement in yield,
costs & margins
(Percent)1
FY
2016
Q2-
2016
H1-
2016
Q1-
2017
Q2-
2017
H1-
2017
Yield on total interest-
earning assets
8.67 8.78 8.82 8.17 8.14 8.15
- Yield on advances
9.47 9.64 9.68 9.06 8.82 8.94
Cost of funds
5.85 5.93 5.98 5.65 5.63 5.64
- Cost of deposits
5.88 5.95 6.00 5.64 5.52 5.58
Net interest margin 3.49 3.52 3.53 3.16 3.13 3.15
- Domestic 3.83 3.84 3.87 3.45 3.41 3.43
- Overseas 1.86 2.00 1.94 1.65 1.65 1.65
1. Annualised for all interim periods

40
Other key ratios
Percent
FY
2016
Q2-
2016
H1-
2016
Q1-
2017
Q2-
2017
H1-
2017
Return on average
networth1
11.3
14.2 14.4 9.9 13.2 11.5
Return on average
assets1
1.49 1.89 1.90 1.27 1.70 1.49
Weighted average
EPS1
16.8 20.8 20.7 15.4 21.2 18.3
Book value (`)
154
149 149 158 163 163
Fee to income 24.1 27.1 26.6 25.1 16.4 19.6
Cost to income 34.7 37.5 37.7 39.3 26.0 31.0
Average CASA
ratio 40.7 40.7 40.9 41.7 41.5 41.6
1. Annualised for all interim periods

41
P&L indicators
Agenda
Credit quality
Subsidiaries
Capital
Growth
Highlights

42
Domestic subsidiaries

43
ICICI Life (1/2)
1. FY2016 PAT as per audited financials
2. All expenses (including commission) / (Total
premium – 90% of single premium)
3. Source: Life Insurance Council; Retail weighted
received premium basis
The company continues to retain its market leadership
among the private players with an overall market share of
12.4%3 and private market share of 24.2%
3 in H1-2017
` billion FY2016 Q2-2016 Q2-2017
New business premium
67.66 21.55 19.47
Renewal premium
123.99 30.51 35.21
Total premium 191.64 52.05 54.69
Profit after tax1
16.50 4.15 4.19
Assets under management 1,039.39 991.27 1,128.27
Annualized premium
equivalent (APE) 51.70 13.25 16.01
Expense ratio2 14.5% 14.9% 14.5%

44
ICICI Life (2/2)
• Value of New Business (VNB) Margins1 increased from
5.7% in FY2015 and 8.0% in FY2016 to 9.4% in H1-
2017
• Indian Embedded Value increased from ₹ 139.39
billion in FY2016 to ₹ 148.38 billion at September 30,
2016
1. Indian Embedded Value basis on actual cost

45
ICICI General
` billion FY2016 Q2-2016 Q2-2017
Gross written premium 82.96 19.92 27.52
Profit before tax 7.08 1.99 2.44
PAT 5.07 1.43 1.71
1. Source: General Insurance Council
Sustained leadership in private sector with an overall
market share of 9.2%2 and private sector market share of
19.9%2 in H1-2017

46
Other subsidiaries
Slide 65
Profit after tax (` billion) FY2016 Q2-2016 Q2-2017
ICICI Prudential Asset
Management 3.26 0.84 1.30
ICICI Securities Primary
Dealership 1.95 0.88 1.71
ICICI Securities (Consolidated) 2.39 0.60 0.99
ICICI Venture (0.21) (0.03) 0.01
ICICI Home Finance 1.80 0.49 0.45
ICICI AMC was the largest AMC in India based on average
AUM in H1-2017

47
Overseas subsidiaries

48
ICICI Bank UK
Asset and liability composition: slide 63
USD million FY2016 Q2-2016 Q2-2017
Net interest income 71.5 17.2 16.6
Profit after tax 0.5 0.6 2.3
Loans and advances 3,144.1 3,204.7 2,512.2
Deposits 2,466.9 2,318.5 1,783.0
- Retail term deposits 738.5 849.5 522.0
Capital adequacy ratio 16.7% 16.3% 18.7%
- Tier I 13.1% 12.6% 15.0%

49
ICICI Bank Canada
Asset and liability composition: slide 64
CAD million FY2016 Q2-2016 Q2-2017
Net interest income
82.8 20.4 19.8
Profit after tax
22.4 6.6 (5.4)
Loans and advances 5,767.4 5,631.2 5,737.7
- Securitised insured
mortgages 2,967.6 2,759.5 3,117.9
Deposits 2,732.1 2,616.2 2,780.7
Capital adequacy ratio 23.6% 25.2% 24.9%
- Tier I
23.6% 25.2% 24.9%
The loss in Q2-2017 was primarily on account of higher
provisions on existing impaired loans

50
Consolidated financials
51
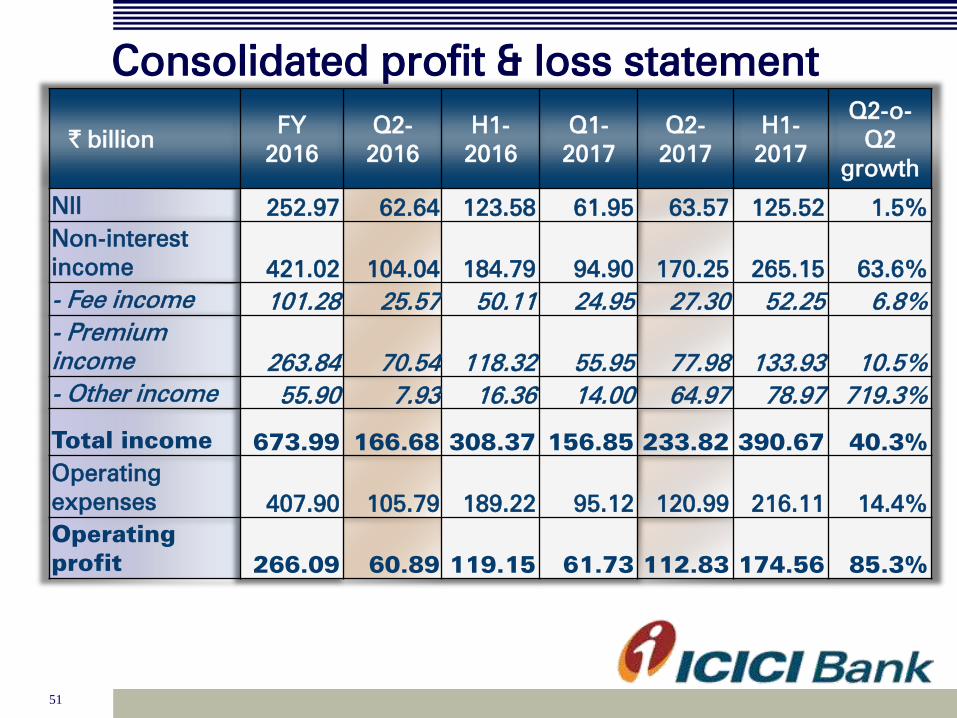
Consolidated profit & loss statement
` billion FY
2016
Q2-
2016
H1-
2016
Q1-
2017
Q2-
2017
H1-
2017
Q2-o-
Q2
growth
NII
252.97 62.64 123.58 61.95 63.57 125.52 1.5%
Non-interest
income 421.02 104.04 184.79 94.90 170.25 265.15 63.6%
- Fee income 101.28 25.57 50.11 24.95 27.30 52.25 6.8%
- Premium
income
263.84 70.54 118.32 55.95 77.98 133.93 10.5%
- Other income
55.90 7.93 16.36 14.00 64.97 78.97 719.3%
Total income 673.99 166.68 308.37 156.85 233.82 390.67 40.3%
Operating
expenses
407.90 105.79 189.22 95.12 120.99 216.11 14.4%
Operating
profit 266.09 60.89 119.15 61.73 112.83 174.56 85.3%

52
Consolidated profit & loss statement
` billion FY
2016
Q2-
2016
H1-
2016
Q1-
2017
Q2-
2017
H1-
2017
Q2-o-
Q2
growth
Operating profit 266.09 60.89 119.15 61.73 112.83 174.56 85.3%
Additional
provisions - - - - 35.88 35.88 -
Collective
contingency &
related reserve 36.00 - - - - - -
Other provisions1
87.05 10.55 21.47 27.13 36.94 64.07 250.1%
Profit before tax 143.04 50.34 97.68 34.60 40.01 74.61 (20.5%)
Tax 33.77 14.26 27.53 7.17 7.60 14.77 (46.7%)
Minority interest 7.47 1.89 3.64 2.27 2.62 4.89 38.6%
Profit after tax 101.80 34.19 66.51 25.16 29.79 54.95 (12.9%)
1. There was a drawdown from the collective contingency and
related reserve of ₹ 8.65 billion and ₹ 6.80 billion during Q1-
2017 and Q2-2017 respectively

53
Key ratios (consolidated)
Percent
FY
2016
Q2-
2016
H1-
2016
Q1-
2017
Q2-
2017
H1-
2017
Return on average
networth1,2
11.3
15.3 15.2 10.6 12.1 11.4
Weighted average
EPS (`)1
17.5 23.4 22.9 17.4 20.3 18.8
Book value (`) 162
157 157 166 171 171
1. Based on quarterly average networth
2. Annualised for all interim periods
Consolidated balance sheet: slide 66

54
P&L indicators
Agenda
Credit quality
Subsidiaries
Capital
Growth
Highlights

55
Capital adequacy
Excess Tier-1 ratio of 5.58% over the minimum requirement of
7.68% as per current RBI guidelines
• Capital ratios significantly higher
than regulatory requirements
• Tier-1 capital is composed almost
entirely of core equity capital
• Substantial scope to raise Additional
Tier-1 and Tier-2 capital
Sep 30, 2016
Tie
r I
CA
R
16.671%
13.261%
Standalone
Capital adequacy ratios: slide 67
8.4% y-o-y growth in risk weighted assets compared to 14.4%
y-o-y growth in total assets
1. Including profits for H1-2017

In summary (1/2)
56
Continuing momentum in retail lending; selective
corporate lending with focus on higher rated corporates 1
Loan growth backed by strong funding profile and
customer franchise 2
Maintaining leadership in digital and technology-
enabled customer convenience 3
Progress on value unlocking: completed IPO of ICICI
Life during Q2-2017 4

In summary (2/2)
57
Strong capital base with Tier-1 capital adequacy of
13.26%1
Encouraging progress on resolution of key sector
exposures
7
6
1. Including profits for H1-2017
Further strengthened balance sheet with additional
provisions of ₹ 35.88 billion
8
Decreasing trend in exposure to key sectors 5

58
Thank you

59
Balance sheet: assets
` billion September
30, 2015
June 30,
2016
September
30, 2016
Y-o-Y
growth
Cash & bank balances 315.45 387.31 525.64 66.6%
Investments 1,541.90 1,683.22 1,743.49 13.1%
- SLR investments 1,115.40 1,184.59 1225.40 9.9%
- Equity investment in
subsidiaries 110.89 107.63 105.82 (4.6%)
Advances
4,096.93 4,494.27 4,542.56 10.9%
Fixed & other assets 616.29 707.43 707.71 14.8%
- RIDF 1and related 292.34 269.45 263.73 (9.8%)
Total assets 6,570.57 7,272.23 7,519.40 14.4%
Net investment in security receipts of asset reconstruction companies
was ` 28.29 billion at September 30, 2016 (June 30, 2016: ₹ 22.39 billion)
1. Rural Infrastructure Development Fund

60
Equity investment in subsidiaries
` billion September
30, 2015
June 30,
2016
September
30, 2016
ICICI Prudential Life Insurance 35.93 35.07 33.26
ICICI Bank Canada 27.32 25.31 25.31
ICICI Bank UK 18.05 18.05 18.05
ICICI Lombard General Insurance 14.22 13.81 13.81
ICICI Home Finance 11.12 11.12 11.12
ICICI Securities Limited 1.87 1.87 1.87
ICICI Securities Primary
Dealership 1.58 1.58 1.58
ICICI AMC 0.61 0.61 0.61
ICICI Venture Funds Mgmt 0.05 0.05 0.05
Others 0.14 0.14 0.14
Total 110.89 107.63 105.82

61
Balance sheet: liabilities
` billion September
30, 2015
June 30,
2016
September
30, 2016
Y-o-Y
growth
Net worth 865.66 919.50 950.16 9.8%
- Equity capital 11.62 11.64 11.64 0.2%
- Reserves
854.04 907.86 938.52 9.9%
Deposits 3,846.18 4,240.86 4,490.71 16.8%
- Savings 1,207.20 1,382.15 1,468.99 21.7%
- Current 527.69 531.33 583.57 10.6%
Borrowings1,2
1,561.09 1,740.95 1,717.57 10.0%
Other liabilities
297.64 370.92 360.96 21.3%
Total liabilities 6,570.57 7,272.23 7,519.40 14.4%
Credit/deposit ratio of 82.9% on the domestic balance sheet at
September 30, 2016
1. Borrowings include preference shares amounting to
₹ 3.50 billion
2. Including impact of exchange rate movement

62
Composition of borrowings
` billion September
30, 2015
June 30,
2016
September
30, 2016
Domestic 686.91 815.25 789.87
- Capital instruments1 383.11 354.68 314.85
- Other borrowings 303.81 460.57 475.02
- Long term infrastructure
bonds 68.50 133.50 133.50
Overseas2 874.18 925.70 927.70
- Capital instruments 22.28 22.95 22.65
- Other borrowings 851.89 902.75 905.05
Total borrowings2 1,561.09 1,740.95 1,717.57
Capital instruments constitute 39.9% of domestic borrowings
1. Includes preference share capital ` 3.50 billion
2. Including impact of exchange rate movement
Funding profile: slide 15

63
ICICI Bank UK1
Total liabilities: USD 3.6 bn Total assets: USD 3.6 bn
1. At September 30, 2016
2. Includes cash & advances to banks, T Bills
3. Includes securities re-classified to loans &
advances
ICICI Bank UK key performance highlights: slide 48
Asset profile Liability profile
3
2

64
ICICI Bank Canada1
1. At September 30, 2016
2. Includes cash & advances to banks and government securities
3. Based on IFRS, securitised portfolio of CAD 3,118 mn considered as part of insured
mortgage portfolio at September 30, 2016
4. As per IFRS, proceeds of CAD 3,080 mn from sale of securitised portfolio considered as
part of borrowings at September 30, 2016
Total liabilities: CAD 6.7 bn Total assets: CAD 6.7 bn
Liability profile Asset profile
ICICI Bank Canada key performance highlights: slide 49
2
3
4

65
ICICI Home Finance
` billion FY2016 Q2-2016 Q2-2017
Loans and advances 87.22 83.88 89.37
Capital adequacy
ratio 26.1% 24.7% 26.3%
Net NPA ratio 0.60% 0.68% 0.62%
Other subsidiaries: slide 46

66
Consolidated balance sheet
` billion September
30, 2015
June 30,
2016
September
30, 2016
Y-o-Y
growth
Cash & bank balances
367.76 452.48 569.82 54.9%
Investments
2,757.07 3,030.08 3,144.71 14.1%
Advances 4,657.57 5,060.78 5,084.02 9.2%
Fixed & other assets 725.72 852.75 843.81 16.3%
Total assets
8,508.12 9,396.09 9,642.36 13.3%
Net worth
911.96 967.14 996.15 9.2%
Minority interest
25.76 36.07 45.11 75.1%
Deposits 4,120.72 4,530.81 4,743.58 15.1%
Borrowings 2,035.71 2,213.00 2,184.58 7.3%
Liabilities on policies in force 927.71 1,023.58 1,063.39 14.6%
Other liabilities 486.26 625.49 609.55 25.4%
Total liabilities
8,508.12 9,396.09 9,642.36 13.3%
Key ratios (consolidated): slide 53

67
Capital adequacy (1/2)
Standalone Basel III June 30, 20161
September 30, 20161
₹ billion % ₹ billion %
Total Capital
1,008.21 16.22% 1,010.69 16.14%
- Tier I
794.67 12.78% 796.40 12.72%
- Tier II 213.54 3.44% 214.29 3.42%
Risk weighted assets
6,216.26 6,260.37
- On balance sheet 5,178.70 5,233.15
- Off balance sheet 1,037.56 1,027.23
1. In line with the applicable guidelines, the Basel III capital ratios reported by the Bank for
the interim periods do not include profits for the period
Including the profits for H1-2017, the standalone capital
adequacy ratio for the Bank as per Basel III norms would have
been 16.67% and the Tier I ratio would have been 13.26% at
September 30, 2016

68
Capital adequacy (2/2)
Consolidated Basel III June 30, 20161
September 30, 20161
% %
Total Capital
16.21% 16.22%
- Tier I
12.83% 12.86%
- Tier II 3.38% 3.36%
Capital adequacy: slide 55
1. In line with the applicable guidelines, the Basel III capital ratios reported by the Bank for
the interim periods do not include profits for the period
Including the profits for H1-2017, the consolidated capital
adequacy ratio for the Bank as per Basel III norms would have
been 16.75% and the Tier I ratio would have been 13.41% at
September 30, 2016

1
Analyst call on November 7, 2016
Certain statements in this call are forward-looking statements. These
statements are based on management's current expectations and are
subject to uncertainty and changes in circumstances. Actual results may
differ materially from those included in these statements due to a variety of
factors. More information about these factors is contained in ICICI Bank's
filings with the Securities and Exchange Commission. All financial and
other information in this call, other than financial and other information for
specific subsidiaries where specifically mentioned, is on an unconsolidated
basis for ICICI Bank Limited only unless specifically stated to be on a
consolidated basis for ICICI Bank Limited and its subsidiaries. Please also
refer to the statement of unconsolidated, consolidated and segmental
results required by Indian regulations that has been filed with the stock
exchanges in India where ICICI Bank’s equity shares are listed and with the
New York Stock Exchange and the US Securities and Exchange
Commission, and is available on our website www.icicibank.com.
Ms. Kochhar’s opening remarks
Good evening to all of you. I will make brief opening remarks
and then Kannan will take you through the details of the results.
On the previous analyst calls, I had summarised the Bank’s
strategic priorities for FY2017 in the 4 x 4 Agenda covering
Portfolio Quality and Enhancing Franchise.
On Portfolio Quality
1. Proactive monitoring of loan portfolios across businesses;
2. Improvement in credit mix driven by focus on retail
lending and lending to higher rated corporates;
3. Concentration risk reduction; and
4. Resolution of stress cases through measures like asset
sales by borrowers and change in management; and

2
working with various stakeholders to ensure that the
companies are able to operate at an optimal level and
generate cash flows.
On Enhancing Franchise
1. Sustaining the robust funding profile;
2. Maintaining digital leadership and a strong customer
franchise;
3. Continued focus on cost efficiency; and
4. Focus on capital efficiency and further unlocking of value
in subsidiaries.
We continue to focus on this agenda.
I would like to highlight four key areas of progress:
1. During Q2 of 2017, we saw the first lPO from the Indian
insurance sector, by ICICI Prudential Life Insurance
Company. The Bank sold 12.63% shareholding in the
company in the IPO which resulted in gains of 56.82 billion
Rupees during the quarter. ICICI Life is well-positioned to
participate in the growth of insurance sector in the coming
years. The Bank continues to have 54.9% shareholding in
ICICI Life. The transaction demonstrates the significant value
created in our non-banking subsidiaries. Our non-banking
subsidiaries continue to maintain a strong market position
in their respective businesses and have reported robust
profits in Q2 of 2017.

3
2. We are focused on re-orienting our balance sheet towards
lower risk and a more granular portfolio. The retail portfolio
grew by 21.1% year-on-year and constituted 47.9% of total
loans at September 30, 2016 compared to 44.0% at
September 30, 2015. The robust growth in the retail
portfolio is in line with our strategic priorities. In the
corporate segment, we continue to focus on lending to
better rated clients and work towards reducing exposures in
sectors impacted by the challenging operating environment.
The Bank’s aggregate exposure to the power, iron & steel,
mining, cement and rigs sectors has decreased from 16.2%
of its total exposure at March 31, 2012 to 13.3% of its total
exposure at March 31, 2016 and further decreased to 11.9%
of total exposure at September 30, 2016.
3. We are making encouraging progress on resolution &
exposure reduction in identified areas. We had reported the
Bank’s exposure at March 31, 2016 and June 30, 2016,
comprising both fund based limits and non-fund based
outstanding to companies that were internally rated below
investment grade in key sectors - i.e. power, iron & steel,
mining, cement and rigs; and to promoter entities internally
rated below investment grade where the underlying partly
relates to the key sectors. While slide 33 to slide 35 of the
presentation have an update on these exposures and
Kannan would explain the movement in detail, I would like

4
to highlight that the Bank saw a net reduction in exposure
and rating upgrades of 24.61 billion Rupees out of this
portfolio during the six months ended September 30, 2016.
Further, based on the transactions announced and in the
public domain, we expect a significant further reduction in
this portfolio over the next six to nine months subject to
necessary approvals and completion of the transactions. A
part of the planned repayment has been received in
October 2016. We continue to work on the balance
exposures.
4. We have further strengthened our balance sheet with
additional provisions of 35.88 billion Rupees, comprising:
o Provisions of 16.78 billion Rupees for standard loans;
o Entire loss of 3.95 billion Rupees on sale of NPA
during the six months ended September 30, 2016,
which is permitted to be amortised as per RBI
guidelines, recognized upfront; and
o Floating provision of 15.15 billion Rupees.
Coming to operating highlights for the quarter, the Bank
achieved robust growth in its loan portfolio and maintained its
strong funding profile during Q2 of 2017. The overall domestic
loan growth was 15.9% year-on-year. Savings account deposits
increased by 21.7% year-on-year. The CASA ratio was 45.7%,
and retail deposits were about 76% of our total deposits at
September 30, 2016.

5
We continue to make investments to strengthen our retail
franchise. We have a network of 4,468 branches and 14,295
ATMs, and best-in-class digital and mobile platforms. During the
quarter, we saw the launch of the Unified Payments Interface, or
UPI and enabled UPI based transactions on our mobile banking
applications - ‘iMobile’ and ‘Pockets’. We now have over
200,000 Virtual Payment Addresses on UPI. We are also working
on tie-ups with several merchants to enable UPI based ‘person-
to-merchant’ transactions. The Bank recently became the first
bank in India to successfully exchange and authenticate
remittance transaction messages and original international trade
documents using blockchain technology. We will continue to
make investments to further strengthen our franchise.
We believe that we are well positioned to leverage on growth
opportunities in the coming years given our strong deposit
franchise, robust capital levels and potential for value unlocking
in our subsidiaries. We will continue to make investments to
further strengthen our franchise and work towards resolution
and reduction of stressed exposures.
I will now hand the call over to Kannan.
Mr. Kannan’s remarks
I will talk about our performance on: Growth; Credit Quality;
P&L Details; Subsidiaries; and Capital.

6
A. Growth
Within the overall retail growth of 21%, the mortgage and auto
loan portfolios grew by 19% and 14% year-on-year respectively.
Growth in the business banking and rural lending segments was
26% and 30% year-on-year respectively. We used to earlier
include dealer funding in business banking loans. From this
quarter, we have reported dealer funding as part of other retail
loans. Commercial vehicle and equipment loans grew by 17%
year-on-year. The unsecured credit card and personal loan
portfolio grew by 40% year-on-year to 179.66 billion Rupees
and was about 4.0% of the overall loan book as of September
30, 2016. The Bank continues to grow the unsecured credit card
and personal loan portfolio primarily driven by a focus on cross-
sell.
Growth in the domestic corporate portfolio was 8.4% year-on-
year as of September 30, 2016 compared to 11.2% year-on-year
as of June 30, 2016. The Bank has been focusing on reducing
exposures to the key sectors and borrowers that are impacted
by the challenging operating environment. If we exclude NPAs,
restructured loans and loans to companies included in drilldown
exposures, growth in the domestic corporate portfolio was
significantly higher. The SME portfolio grew by 12.0% year-on-
year and constitutes 4.3% of total loans.
In rupee terms, the net advances of the overseas branches
decreased by 4.0% year-on-year as of September 30, 2016. In

7
US dollar terms, the net advances of overseas branches
decreased by 5.5% year-on-year as of September 30, 2016.
Coming to the funding side: on a period-end basis, we saw an
addition of 86.84 billion Rupees to savings account deposits and
52.24 billion Rupees to current account deposits during the
quarter. Current and savings account deposits grew by 18.3%
year-on-year. The Bank continued to maintain healthy CASA
ratios on a period-end basis as well as daily average basis. On a
daily average basis, the CASA ratio was 41.5% in Q2 of 2017.
Total deposits grew by 16.8% year-on-year to 4.49 trillion
Rupees as of September 30, 2016.
B. Credit Quality
During the second quarter, the gross additions to NPAs were
80.29 billion Rupees compared to 82.49 billion Rupees in the
preceding quarter. The gross additions to NPAs in Q2 of 2017
included slippages from restructured loans of 12.31 billion
Rupees and slippages out of loans to companies internally rated
below investment grade in key sectors of 45.55 billion Rupees.
The retail portfolio had gross NPA additions of 6.40 billion
Rupees and recoveries & upgrades of 4.50 billion Rupees during
Q2 of 2017 which is in line with normal business trends. About
80% of the additions to NPAs for the wholesale and SME
businesses were on account of slippages relating to companies
internally rated below investment grade in key sectors, the

8
restructured portfolio and accounts that were non-performing as
of June 30, 2016.
During the quarter, aggregate deletions from NPA due to
recoveries and upgrades were 8.00 billion Rupees. The Bank
sold gross NPAs amounting to 17.87 billion Rupees during the
quarter. The net NPAs sold to ARCs amounted to 8.82 billion
Rupees.
The Bank’s net non-performing asset ratio was 3.21% as of
September 30, 2016 compared to 3.01% as of June 30, 2016.
The gross non-performing asset ratio was 6.12% as of
September 30, 2016 compared to 5.28% as of June 30, 2016.
The net restructured loans reduced to 63.36 billion Rupees as of
September 30, 2016 from 72.41 billion Rupees as of June 30,
2016.
The aggregate net NPAs and net restructured loans were 228.19
billion Rupees as of September 30, 2016 compared to 225.49
billion Rupees as of June 30, 2016.
While announcing our results for the quarter ended March 31,
2016, we had stated that there were continued uncertainties in
respect of certain sectors due to the weak global economic
environment, sharp downturn in the commodity cycle, gradual
nature of the domestic economic recovery and high leverage.

9
The key sectors identified in this context were power, iron &
steel, mining, cement and rigs.
The Bank had reported its exposure, comprising both fund
based limits and non-fund based outstanding at March 31, 2016
and June 30, 2016 to companies in these sectors that were
internally rated below investment grade across the domestic
corporate, SME and international branches portfolios; and to
promoter entities internally rated below investment grade where
the underlying partly relates to these sectors. On slide 35 of the
presentation, we have provided the movement in these
exposures between June 30, 2016 and September 30, 2016. The
aggregate fund based limits and non-fund based outstanding to
companies that were internally rated below investment grade in
these sectors and promoter entities, decreased from 387.23
billion Rupees as of June 30, 2016 to 324.90 billion Rupees as of
September 30, 2016 reflecting the following:
There was a net reduction in exposure of 16.77 billion
Rupees
Loans classified as non-performing during the quarter
were 45.55 billion Rupees. Please refer slide 35 for further
details.
Based on the transactions announced and in the public domain,
we expect a significant further reduction in above exposure as
of September 30, 2016 over the next six to nine months subject
to necessary approvals and completion of the transactions. A
part of the planned repayment has been received in October

10
2016. The Bank continues to work on the balance exposures.
However, it may take time for these resolutions given the
challenges in the operating and recovery environment. Our
focus will be on maximising the Bank’s economic recovery and
finding optimal solutions.
The exposure to companies internally rated below investment
grade in key sectors and promoter entities of 324.90 billion
Rupees includes non-fund based outstanding in respect of
accounts included in this portfolio where the fund based
outstanding has been classified as non-performing. Apart from
this, the non-fund based outstanding to borrowers classified as
non-performing was 33 billion Rupees at September 30, 2016 as
disclosed in slide 35.
As of September 30, 2016, the Bank had outstanding loans of 29
billion Rupees where Strategic Debt Restructuring - SDR - was
implemented, primarily comprising loans either already
classified as non-performing or restructured or to companies
that were internally rated below investment grade in key sectors
- i.e. power, iron & steel, mining, cement and rigs.
The outstanding portfolio of performing loans for which
refinancing under the 5/25 scheme has been implemented was
27 billion Rupees as of September 30, 2016, primarily
comprising loans to companies internally rated below
investment grade in the key sectors mentioned above.

11
Coming to provisions: As mentioned earlier, in Q2 of 2017, the
Bank further strengthened its balance sheet by making
additional provisions of 35.88 billion Rupees. The additional
provision comprises the following:
1. The Bank has made provisions of 16.78 billion Rupees for
standard loans;
2. Entire loss of 3.95 billion Rupees on sale of NPAs during the
six months ended September 30, 2016, which is permitted to
be amortised as per RBI guidelines, recognised upfront; and
3. The Bank has made a floating provision of 15.15 billion
Rupees as permitted by the RBI guidelines. This floating
provision has been deducted from the gross non-performing
loans while computing the net non-performing loans.
Other provisions were 34.95 billion Rupees in Q2 of 2017
compared to 25.15 billion Rupees in the preceding quarter and
9.42 billion Rupees in the corresponding quarter last year.
For the quarter, there was a drawdown of 6.80 billion Rupees
from the collective contingency and related reserve.
The provisioning coverage ratio on non-performing loans,
including cumulative technical/prudential write-offs and floating
provisions made during the quarter, was 59.6%.
We expect NPA additions to remain elevated for the next two
quarters.

12
C. P&L Details
Net interest income was 52.53 billion Rupees in Q2 of 2017. The
net interest margin was at 3.13% in Q2 of 2017 compared to
3.16% in the preceding quarter. The domestic NIM was at
3.41% in Q2 of 2017 compared to 3.45% in the preceding
quarter. International margins were at 1.65% in Q2 of 2017, at
the same level as in the preceding quarter. There was interest
on income tax refund of 1.11 billion Rupees in Q2 of 2017,
unlike in the preceding quarter. This had a positive impact of
about 7 basis points on the net interest margin for the quarter.
Going forward, the yield on advances would continue to be
impacted by non-accrual of income on non-performing assets
and implementation of resolution plans for stressed borrowers.
Total non-interest income was 91.20 billion Rupees in Q2 of
2017 compared to 30.07 billion Rupees in Q2 of 2016. Non-
interest income for the quarter included gains of 56.82 billion
Rupees relating to sale of shares of ICICI Life in the IPO.
Excluding these gains, non-interest income grew by 14.3% year-
on-year.
Fee income was 23.56 billion Rupees. Retail fees grew
by 10% year-on-year and constituted about 68% of
overall fees in Q2 of 2017.
Treasury recorded a profit of 7.30 billion Rupees
compared to 2.22 billion Rupees in the corresponding

13
quarter last year. The yield on the 10-year government
securities eased during Q2 of 2017.
Other income was 3.52 billion Rupees. The dividend
from subsidiaries was 3.27 billion Rupees. The Bank
had no exchange rate gains relating to overseas
operations in Q2 of 2017 compared to gains of 1.90
billion Rupees in the corresponding quarter last year.
On Costs: The Bank’s cost-to-income ratio was at 26.0% in Q2
of 2017 and 31.0% in H1 of 2017. Excluding gain on sale of
shares of ICICI Life, the cost-to-income would have been 43.0%
and 41.1% respectively in Q2 of 2017 and H1 of 2017
respectively. Operating expenses increased by 20.5% year-on-
year in Q2 of 2017. The increase was mainly due to a 28.3%
increase in employee expenses which among other factors
includes the impact of decline in yields on provisions for
retirement benefits in Q2 of 2017. The Bank has added 6,379
employees in H1 of 2017 and had 80,475 employees as of
September 30, 2016. For H1 of 2017, operating expenses
increased by 15.3% year-on-year which is broadly in line with
our expectation for the full year. Non-employee expenses
increased by 15.5% year-on-year in Q2 of 2017 and 15.6% year-
on-year in H1 of 2017. We would continue to focus on cost
efficiency, while investing in the franchise as required.
The Bank’s standalone profit before provisions and tax was
106.36 billion Rupees in Q2 of 2017 compared to 51.58 billion

14
Rupees in the corresponding quarter last year and 52.15 billion
Rupees in preceding quarter.
I have already discussed the provisions for the quarter.
After taking in to account additional provisions made during the
quarter, the Bank’s standalone profit before tax was 35.53 billion
Rupees in Q2 of 2017 compared to 27.00 billion Rupees in the
preceding quarter and 42.16 billion Rupees in the corresponding
quarter last year.
The Bank’s standalone profit after tax was 31.02 billion Rupees
in Q2 of 2017 compared to 22.32 billion Rupees in the preceding
quarter and 30.30 billion Rupees in the corresponding quarter
last year.
D. Subsidiaries
The profit after tax for ICICI Life for Q2 of 2017 was 4.19 billion
Rupees compared to 4.15 billion Rupees in Q2 of 2016. The new
business margin on actual cost based on Indian Embedded
Value, or IEV, methodology was at 9.4% in H1 of 2017
compared to 8.0% in FY2016 and 5.7% in FY2015. The
improvement in margins was driven by increase in proportion of
protection business from 1.6% in FY2015 and 2.7% in FY2016 to
4.4% in H1 of 2017. The company continues to retain its market
leadership among the private players with a market share of
about 12.4% in H1 of 2017. The Embedded Value, based on

15
Indian Embedded Value methodology, was 148.38 billion
Rupees as of September 30, 2016 compared to 139.39 Rupees
billion as of March 31, 2016.
The profit after tax of ICICI General increased by 19.6% from
1.43 billion Rupees in Q2 of 2016 to 1.71 billion Rupees in Q2 of
2017. The profit before tax grew by 22.6% year-on-year. The
gross written premium of ICICI General grew by 38.9% on a
year-on-year basis to 57.07 billion Rupees in H1 of 2017
compared to about 29.4% year-on-year growth for the industry.
The company continues to retain its market leadership among
the private sector players and had a market share of about 9.2%
in H1 of 2017.
The profit after tax of ICICI AMC increased by 54.8% year-on-
year from 0.84 billion Rupees in Q2 of 2016 to 1.30 billion
Rupees in Q2 of 2017. With average assets under management
of about 2.2 trillion Rupees for the quarter, ICICI AMC continues
to be the largest mutual fund in India.
The profit after tax of ICICI Securities was at 0.99 billion Rupees
in Q2 of 2017 compared to 0.60 billion Rupees in Q2 of 2016.
The profit after tax of ICICI Securities Primary Dealership was
1.71 billion Rupees in Q2 of 2017 compared to 0.88 billion
Rupees in the corresponding quarter last year.
Let me move on to the performance of our overseas banking
subsidiaries.

16
The Bank’s total equity investment in ICICI Bank UK and ICICI
Bank Canada has reduced from 11.0% of its net worth at March
31, 2010 to 4.4% at September 30, 2016.
ICICI Bank Canada’s total assets were 6.69 billion Canadian
Dollars as of September 30, 2016 and loans and advances were
5.74 billion Canadian Dollars as of September 30, 2016. ICICI
Bank Canada reported a net loss of 5.4 million Canadian Dollars
in Q2 of 2017 compared to a net profit of 6.6 million Canadian
Dollars in Q2 of 2016 on account of higher provisions on
existing impaired loans, primarily India-linked loans. The capital
adequacy ratio of ICICI Bank Canada was 24.9% at September
30, 2016.
ICICI Bank UK’s total assets were 3.63 billion US Dollars as of
September 30, 2016. Loans and advances were 2.51 billion US
Dollars as of September 30, 2016. The sequential decrease in
loans and advances of about 175 million US Dollars was on
account of lower disbursements in Q2 of 2017 given the
uncertainties in the operating environment and limited lending
opportunities. Profit after tax in Q2 of 2017 was 2.3 million US
Dollars compared to 0.6 million US Dollars in Q2 of 2016. The
capital adequacy ratio was 18.7% as of September 30, 2016.
The consolidated profit after tax was 29.79 billion Rupees in Q2
of 2017 compared to 34.19 billion Rupees in the corresponding

17
quarter last year and 25.16 billion Rupees in the preceding
quarter.
E. Capital
The Bank had a Tier 1 capital adequacy ratio of 13.26% and total
standalone capital adequacy ratio of 16.67%, including profits
for H1 of 2017. The Bank’s consolidated Tier 1 capital adequacy
ratio and the total consolidated capital adequacy ratio, including
profits for H1 of 2017, were 13.41% and 16.75 % respectively.
The capital ratios are significantly higher than regulatory
requirements.
The Bank’s pre-provisioning earnings, strong capital position
and value created in its subsidiaries give the Bank the ability to
absorb the impact of a challenging environment while driving
growth in identified areas of opportunity.
To sum up, during Q2 of 2017, we have
1. demonstrated value unlocking with the completion of IPO
of ICICI Life;
2. focused on resolution and recovery in the corporate
segment and seen progress in deleveraging by some
borrowers;
3. further strengthened our balance sheet with additional
provisions;

18
4. achieved continued healthy loan growth driven by the
retail portfolio, and maintained focus on incremental
portfolio quality;
5. sustained our robust funding profile; and
6. continued to maintain healthy capital adequacy ratios.
We will now be happy to take your questions.