Embed Size (px)
Citation preview

Performance review
May 2016

2
Certain statements in these slides are forward-looking statements.
These statements are based on management's current expectations and
are subject to uncertainty and changes in circumstances. Actual results
may differ materially from those included in these statements due to a
variety of factors. More information about these factors is contained in
ICICI Bank's filings with the US Securities and Exchange Commission.
All financial and other information in these slides, other than financial
and other information for specific subsidiaries where specifically
mentioned, is on an unconsolidated basis for ICICI Bank Limited only
unless specifically stated to be on a consolidated basis for ICICI Bank
Limited and its subsidiaries. Please also refer to the statement of
unconsolidated, consolidated and segmental results required by Indian
regulations that has, along with these slides, been filed with the stock
exchanges in India where ICICI Bank’s equity shares are listed and with
the New York Stock Exchange and the US Securities and Exchange
Commission, and is available on our website www.icicibank.com

3
P&L indicators
Agenda
Credit quality
Subsidiaries
Capital
Growth

4
P&L indicators
Agenda
Credit quality
Subsidiaries
Capital
Growth
5
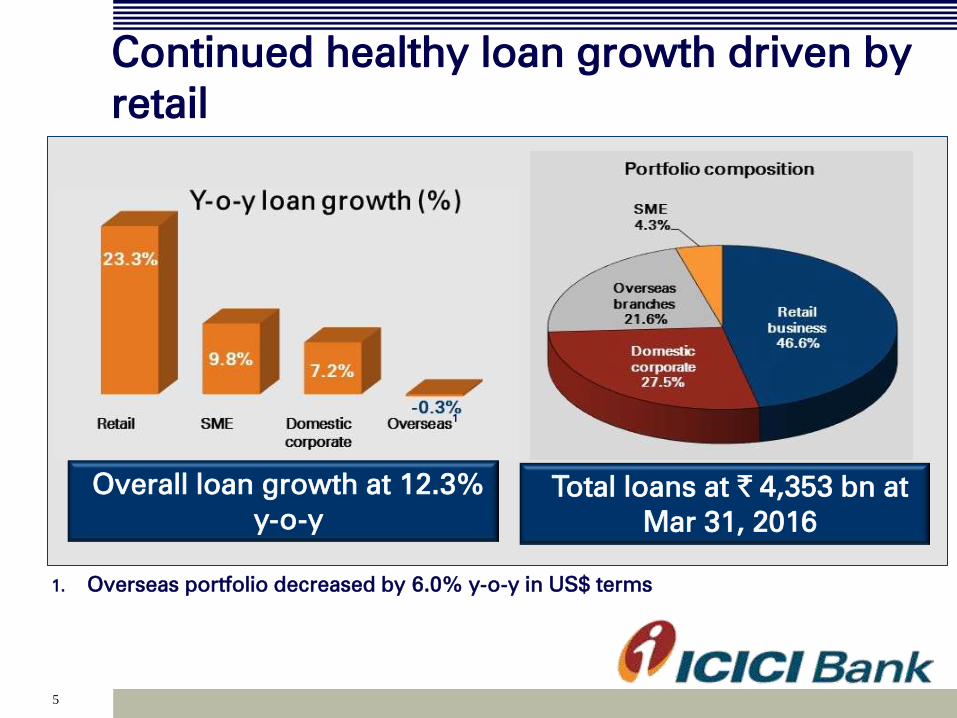
Continued healthy loan growth driven by
retail
Overall loan growth at 12.3%
y-o-y
Total loans at ` 4,353 bn at
Mar 31, 2016
1. Overseas portfolio decreased by 6.0% y-o-y in US$ terms
1
1

6
Retail portfolio: strong growth across
segments
Retail loan growth at 23.3%
y-o-y
Total retail loans at ` 2,028
bn at Mar 31, 2016
1. March 31, 2016: Vehicle loans includes auto
loans 11.0%, commercial business 6.3%,
two-wheeler loans 0.1%
1

7
Robust funding profile maintained
Period-end CASA ratio
• Accretion of ` 193.70
billion to savings account
deposits and ` 93.50
billion to current account
deposits in FY2016
16.6% y-o-y growth in total deposits; proportion of retail
deposits continues to be healthy at about 74%
17.2% y-o-y growth in average CASA deposits in Q4-
2016; average CASA ratio improved from 39.5% in
FY2015 at 40.7% in FY2016
Balance sheet: slide 57

8
Expanding franchise
` billion At Mar
31, 2013
At Mar
31, 2014
At Mar
31, 2015
At Mar
31, 2016
% share
at Mar
31, 2016
Metro 865 935 1,011 1,159 26.0%
Urban 782 865 933 997 22.4%
Semi urban 989 1,114 1,217 1,341 30.1%
Rural 464 839 889 953 21.4%
Total branches 3,100 3,753 4,050 4,450 100.0%
Total ATMs 10,481 11,315 12,451 13,766 -

9
Leadership in technology

10
High digital penetration1
Digital Internet Po
rtfo
lio
2
Lo
g-in
freq
uen
cy
pe
r m
on
th
3
1. As per a Global Benchmark Study conducted for over 100 top banks around the world
3,4 4 4 4 4 3,4
3,4 4 4
2. Percentage of customers active on digital channels
3. IN: India
4. UQ: upper quartile
4 4 3,4

11
Growing payments franchise
Credit cards
Debit cards

12
Best-in-class mobile application
More than 140 services
Industry first features:
Favourites for faster transactions
Chat services & authenticated
call
Rail ticket booking
Touch ID Login & Watch Banking
Forex purchases
Only Bank to offer insta-banking
facility on mobile
iMobile

13
Innovative offerings to improve customer
convenience
• Banking services available on Facebook and
• Fan base of over 4.7 million on Facebook
India’s First Digital Bank: over 3.6 million downloads
Significant interest from
non-ICICI Bank customers
Presence on social media
•Amongst the top 4 wallet
apps in terms of time spent
on the app1
•Only bank app to figure in
the top wallet apps
1. As per Nielsen Whitepaper on Wallets

14
Key initiatives during Q4-2016
India’s first contactless mobile payment solution (Touch
& Pay) which dematerialises credit and debit cards using
smartphones, thereby eliminating the need to carry
cash or debit and credit cards
Virtual mobile app development challenge called ‘ICICI
Appathon’
• The programme received an overwhelming response
with over 2,000 participants from across the globe
Worked closely with National Payments Corporation of
India (NPCI) for the launch of the Unified Payment
Infrastructure (UPI)

15
Adoption of digital offerings
1. Financial and non-financial transactions of savings account customers
2. Includes touch banking, phone banking & debit cards POS transactions
Continue to rollout
technology initiatives
with focus on
• Innovation
• Customer experience
• Cross-sell
• Operating efficiency
• Analytics Channel mix of transactions for FY2016
Way forward Others
5.9%
ATM
24.8%
Internet & mobile
62.9%
Branch
6.4%

16
P&L indicators
Agenda
Credit quality
Subsidiaries
Capital
Growth

This is over and above provisions made for non-
performing and restructured loans as per RBI guidelines
17
Credit quality
Impact of Reserve Bank of India (RBI) Asset Quality
Review fully considered
Further, the Bank has made a collective contingency and
related reserve of ` 36.00 billion during Q4-2016 on a
prudent basis towards exposure to certain sectors

18
Movement of NPA
1. Based on customer assets
` billion Q4-2015 FY2015 Q3-2016 Q4-2016 FY2016
Opening gross NPA
132.31 105.54 160.06 213.56 152.42
Add: gross additions
32.60 80.78 65.44 70.03 171.13
- of which:
slippages
from restructured
assets 22.46 45.29 13.55 27.24 53.00
Less: recoveries &
upgrades 6.54 16.36 5.00 7.81 21.84
Net additions 26.06 64.42 60.44 62.22 149.29
Less: write-offs & sale 5.95 17.54 6.94 8.57 34.50
Closing balance of
gross NPAs 152.42 152.42 213.56 267.21 267.21
Gross NPA ratio1
3.29% 3.29% 4.21% 5.21% 5.21%
19
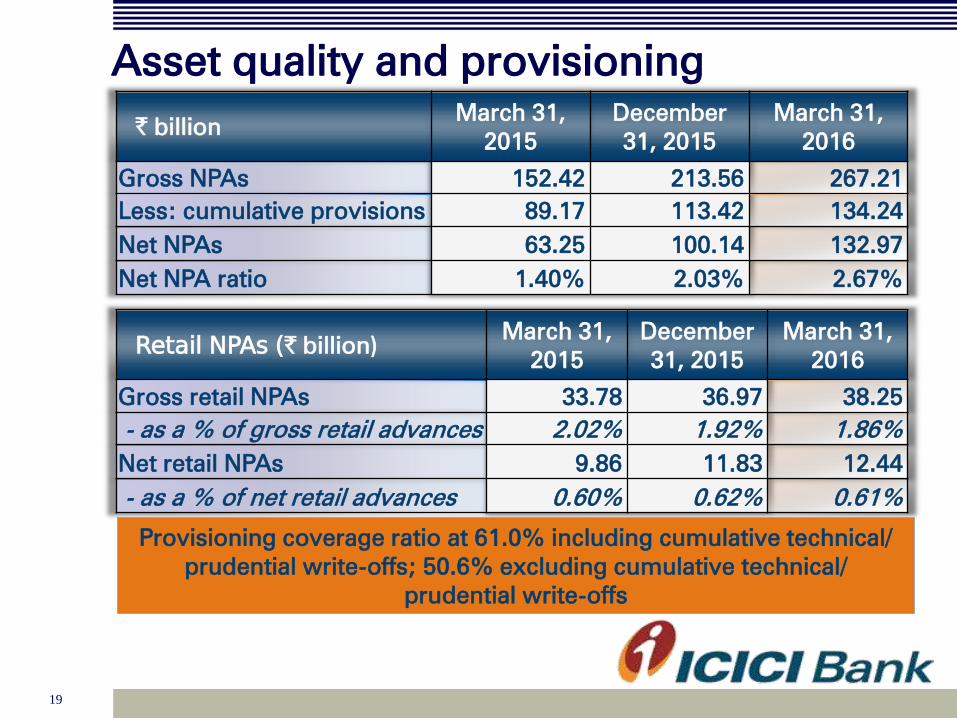
Asset quality and provisioning
` billion March 31,
2015
December
31, 2015
March 31,
2016
Gross NPAs
152.42 213.56 267.21
Less: cumulative provisions
89.17 113.42 134.24
Net NPAs 63.25 100.14 132.97
Net NPA ratio
1.40% 2.03% 2.67%
Retail NPAs (` billion) March 31,
2015
December
31, 2015
March 31,
2016
Gross retail NPAs
33.78 36.97 38.25
- as a % of gross retail advances
2.02% 1.92% 1.86%
Net retail NPAs 9.86 11.83 12.44
- as a % of net retail advances
0.60% 0.62% 0.61%
Provisioning coverage ratio at 61.0% including cumulative technical/
prudential write-offs; 50.6% excluding cumulative technical/
prudential write-offs
20
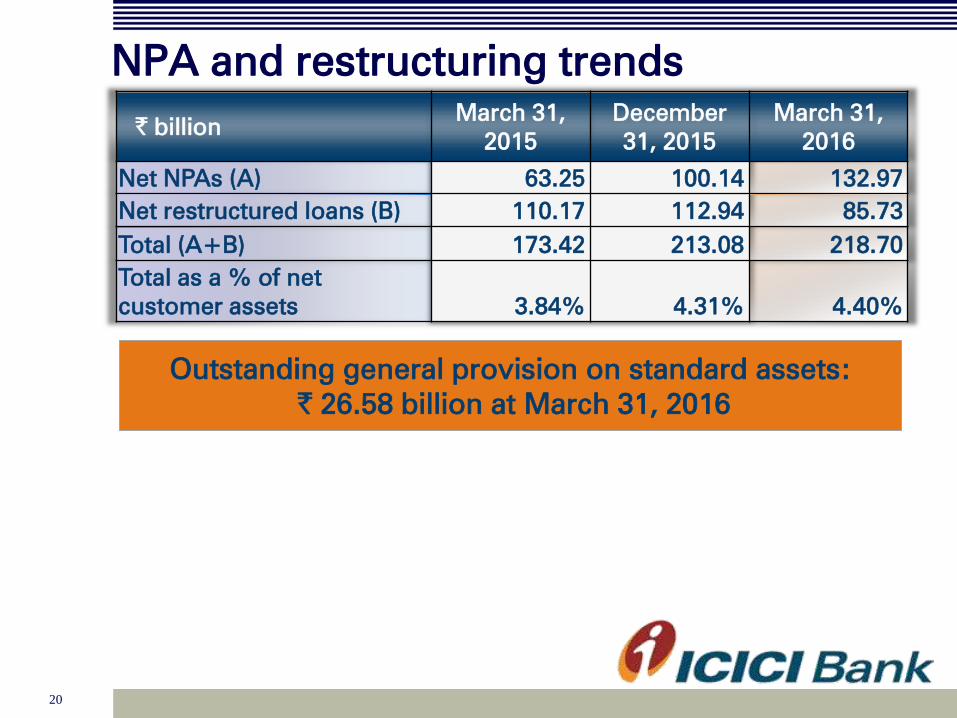
NPA and restructuring trends
` billion March 31,
2015
December
31, 2015
March 31,
2016
Net NPAs (A)
63.25 100.14 132.97
Net restructured loans (B)
110.17 112.94 85.73
Total (A+B) 173.42 213.08 218.70
Total as a % of net
customer assets
3.84% 4.31% 4.40%
Outstanding general provision on standard assets:
` 26.58 billion at March 31, 2016

21
Portfolio trends and approach

Portfolio composition over the years
22
1. Including impact of exchange rate movement
% of total
advances
March
31, 2011
March
31, 2012
March
31, 2013
March
31, 2014
March
31, 2015
March
31, 2016
Retail 39.3% 38.0% 37.0% 39.0% 42.4% 46.6%
Domestic
corporate 28.2% 28.6% 32.5% 30.1% 28.8% 27.5%
SME 7.0% 6.0% 5.2% 4.4% 4.4% 4.3%
International1 25.5% 27.4% 25.3% 26.5% 24.3% 21.6%
Total
advances
(` billion) 2,163 2,537 2,902 3,387 3,875 4,353
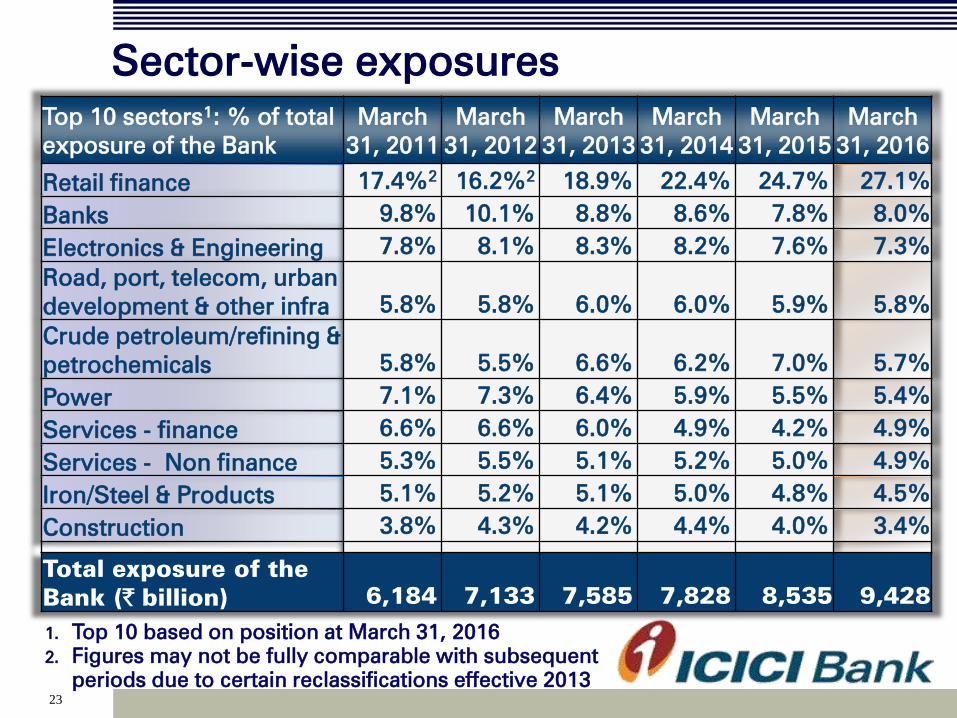
Sector-wise exposures
23
1. Top 10 based on position at March 31, 2016
2. Figures may not be fully comparable with subsequent
periods due to certain reclassifications effective 2013
Top 10 sectors1: % of total
exposure of the Bank
March
31, 2011
March
31, 2012
March
31, 2013
March
31, 2014
March
31, 2015
March
31, 2016
Retail finance 17.4%2
16.2%2 18.9% 22.4% 24.7% 27.1%
Banks 9.8% 10.1% 8.8% 8.6% 7.8% 8.0%
Electronics & Engineering 7.8% 8.1% 8.3% 8.2% 7.6% 7.3%
Road, port, telecom, urban
development & other infra 5.8% 5.8% 6.0% 6.0% 5.9% 5.8%
Crude petroleum/refining &
petrochemicals 5.8% 5.5% 6.6% 6.2% 7.0% 5.7%
Power 7.1% 7.3% 6.4% 5.9% 5.5% 5.4%
Services - finance 6.6% 6.6% 6.0% 4.9% 4.2% 4.9%
Services - Non finance 5.3% 5.5% 5.1% 5.2% 5.0% 4.9%
Iron/Steel & Products 5.1% 5.2% 5.1% 5.0% 4.8% 4.5%
Construction 3.8% 4.3% 4.2% 4.4% 4.0% 3.4%
Total exposure of the
Bank (` billion) 6,184 7,133 7,585 7,828 8,535 9,428

24
There are uncertainties in respect of certain sectors due to:
• Weak global economic environment
• Sharp downturn in the commodity cycle
• Gradual nature of the domestic economic recovery
• High leverage
• Among the top 10 sectors, power and iron & steel sectors
are the key sectors in this context
• Beyond the top 10 sectors, mining, cement and rigs
sectors are the key sectors in this context

Exposure to key sectors (1/2)
25
% of total
exposure of
the Bank
March 31,
2011
March 31,
2012
March 31,
2013
March 31,
2014
March 31,
2015
March 31,
2016
Power 7.1% 7.3% 6.4% 5.9% 5.5% 5.4%
Iron/Steel
5.1% 5.2% 5.1% 5.0% 4.8% 4.5%
Mining 1.4% 2.0% 1.7% 1.7% 1.5% 1.6%
Cement 1.6% 1.2% 1.4% 1.4% 1.5% 1.2%
Rigs 0.6% 0.5% 0.5% 0.8% 0.5% 0.6%

Exposure to key sectors (2/2)
26
• Proportion of exposure to key sectors gradually
decreasing over the last three years
• Net increase in exposure to key sectors of about ` 59.40
billion in FY2016 was entirely in A- and above category

Further drilldown: approach
27
All internally ‘below investment grade’ rated companies
in key sectors across domestic corporate, SME and
international branches portfolios
Promoter entities internally ‘below investment grade’
where the underlying is partly linked to the key sectors
SDR and 5/25 refinancing included
Fund-based limits and non-fund based outstanding to
above categories considered
1
2
3
4
Loans already classified as restructured and non-
performing excluded 5
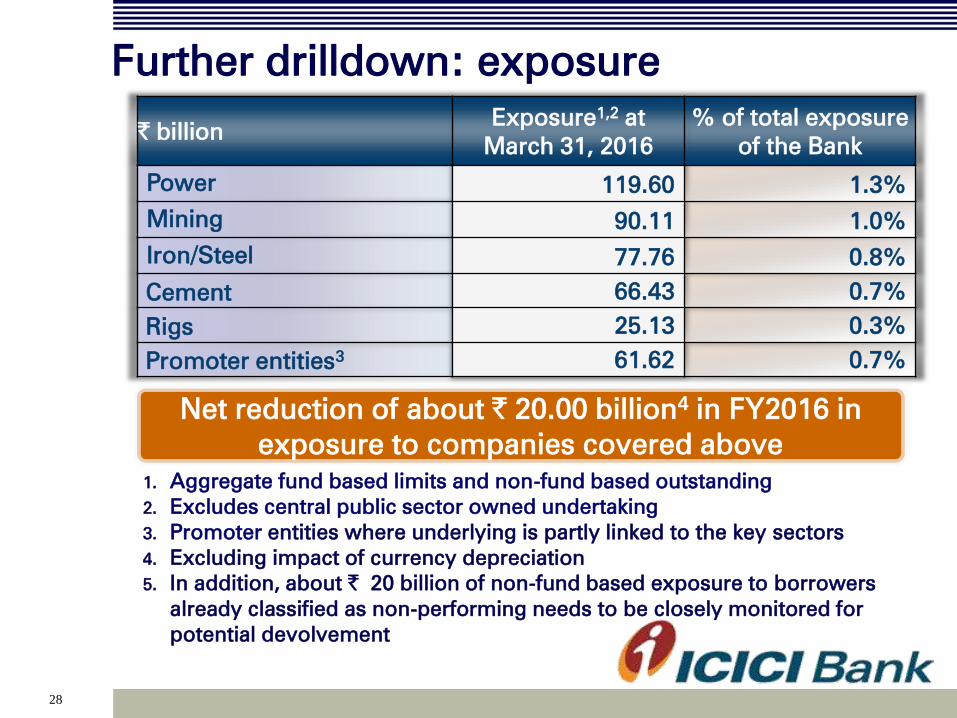
Further drilldown: exposure
28
1. Aggregate fund based limits and non-fund based outstanding
2. Excludes central public sector owned undertaking
3. Promoter entities where underlying is partly linked to the key sectors
4. Excluding impact of currency depreciation
5. In addition, about ` 20 billion of non-fund based exposure to borrowers
already classified as non-performing needs to be closely monitored for
potential devolvement
` billion Exposure
1,2 at
March 31, 2016
% of total exposure
of the Bank
Power 119.60 1.3%
Mining 90.11 1.0%
Iron/Steel 77.76 0.8%
Cement 66.43 0.7%
Rigs 25.13 0.3%
Promoter entities3 61.62 0.7%
Net reduction of about ` 20.00 billion4 in FY2016 in
exposure to companies covered above

29
Our approach
Working with borrowers for reduction and resolution of
exposure through asset sales and deleveraging
Created collective contingency and related reserve of
` 36.00 billion
Strong Tier-1 capital adequacy of 13.09% with
substantial scope to raise Additional Tier-1 and Tier-2
capital
1
2
3
Substantial value in subsidiaries
• Insurance holdings valued at about ` 330.00 billion
based on concluded transactions
• Further, significant value in other domestic
subsidiaries
4

Way forward
The Bank has a monitoring and action plan with focus
on reducing these exposures
The Bank will provide a quarterly update on these
exposures
30

31
Agenda
P&L indicators
Credit quality
Subsidiaries
Capital
Growth

32
Profit & loss statement
1. Includes net foreign exchange gains relating to overseas operations of ` 6.42
billion in FY2015, ` 1.82 billion in Q4-2015, ` 1.43 billion in Q3-2016, ` 2.61
billion in Q4-2016 and ` 9.41 billion in FY2016
2. Includes profit on sale on shareholding in ICICI Life and ICICI General of ₹ 21.31
billion in Q4-2016 and ` 33.74 billion in FY2016
` billion FY2015 Q4-
2015
Q3-
2016
Q4-
2016 FY2016
Q4-o-Q4
growth
NII
190.40 50.79 54.53 54.05 212.24 6.4%
Non-interest
income 121.76 34.96 42.17 51.09 153.22 46.1%
- Fee income 82.87 21.37 22.62 22.12 88.20 3.5%
- Other income1
21.96 6.33 5.13 7.07 24.42 11.7%
- Treasury income2
16.93 7.26 14.42 21.90 40.60 -
Total income 312.16 85.75 96.70 105.14 365.46 22.6%
Operating
expenses
114.96 31.07 31.10 34.06 126.83 9.6%
Operating profit 197.20 54.68 65.60 71.08 238.63 30.0%

33
Profit & loss statement
` billion FY2015 Q4-
2015
Q3-
2016
Q4-
2016 FY2016
Q4-o-Q4
growth
Operating profit 197.20 54.68 65.60 71.08 238.63 30.0%
Provisions
39.00 13.45 28.44 33.26 80.67 -
Profit before
collective
contingency and
related reserve
and tax 158.20 41.24 37.16 37.82 157.96 (8.3)%
Collective
contingency and
related reserve - - - 36.00 36.00 -
Profit before tax 158.20 41.24 37.16 1.82 121.96 (95.6)%
Tax 46.45 12.02 6.98 (5.20) 24.70 -
Profit after tax 111.75 29.22 30.18 7.02 97.26 (76.0)%

34
Yield, cost & margin
Movement in yield,
costs & margins
(Percent)1
FY2015 Q4-2015 Q3-2016 Q4-2016 FY2016
Yield on total interest-
earning assets
8.96 9.08 8.65 8.40 8.67
- Yield on advances
9.95 9.96 9.35 9.22 9.47
Cost of funds
6.17 6.16 5.78 5.66 5.85
- Cost of deposits
6.18 6.18 5.81 5.73 5.88
Net interest margin 3.48 3.57 3.53 3.37 3.49
- Domestic 3.89 3.99 3.86 3.73 3.83
- Overseas 1.65 1.71 1.94 1.62 1.86
1. Annualised for all interim periods

35
Other key ratios
Percent
FY2015 Q4-2015 Q3-2016 Q4-2016 FY2016
Return on average
networth1
14.3 14.6 13.6 3.2
11.3
Return on average
assets1
1.86 1.92 1.82 0.41 1.49
Weighted average
EPS1
19.3 20.5 20.7 4.9 16.8
Book value1 (`)
139 139 154 154
154
Fee to income 26.5 24.9 23.4
21.0 24.1
Cost to income 36.8 36.2 32.2
32.4 34.7
Average CASA ratio 39.5 39.9 40.7 40.5 40.7
1. Annualised for all interim periods

36
Agenda
P&L indicators
Credit quality
Subsidiaries
Capital
Growth

37
Domestic subsidiaries

38
ICICI Life (1/2)
` billion FY2015 FY2016
New business premium
53.32 67.66
Renewal premium
99.75 123.99
Total premium 153.07 191.64
Profit after tax 16.34 16.50
Assets Under Management 1,001.83 1,039.39
1. Source: Life Insurance Council
Sustained leadership in private sector with an overall
market share of 11.3%1 and private sector market share of
21.9%1 in FY2016

39
ICICI Life (2/2)
` billion FY2015 FY2016
Annualised premium equivalent
(APE) 47.44 51.70
Expense ratio1
15.4% 14.5%
Cost to RWRP2 49.1% 51.2%
1. All expenses (including commission) / (Total premium – 90% of single premium)
2. RWRP: Retail weighted received premium

40
ICICI General
` billion FY2015 FY2016
Gross written premium1 69.14 83.07
Profit before tax 6.91 7.08
PAT 5.36 5.07
1. Excluding remittances from motor declined pool and including premium on
reinsurance accepted
2. Source: General Insurance Council
Sustained leadership in private space with an overall
market share of 8.4%2 and private sector market share of
18.4%2 in FY2016

41
Other subsidiaries
Profit after tax (` billion) FY2015 FY2016
ICICI Prudential Asset
Management 2.47 3.26
ICICI Securities Primary
Dealership 2.17 1.95
ICICI Securities (Consolidated) 2.94 2.39
ICICI Venture 0.01 (0.21)
ICICI Home Finance 1.98 1.80
ICICI AMC was the largest AMC in India as on March 31,
2016 based on average AUM in Q4-2016
Slide 63

42
Overseas subsidiaries

43
Continued capital rationalisation in
overseas subsidiaries
2
1
1
2
ICICI Bank Canada repatriated capital of CAD 87.1 million in
Q4-2016
ICICI Bank UK and ICICI Bank Canada have repatriated total
capital of USD 175.0 million and CAD 242.1 million
respectively since March 2013
The Bank’s equity investment in the overseas subsidiaries
reduced from 11.0% of its net worth at March 31, 2010 to
4.8% at March 31, 2016

44
ICICI Bank UK
USD million FY2015 FY2016
Net interest income 64.7 71.5
Profit after tax 18.3 0.5
Loans and advances 3,025.1 3,144.1
Deposits 2,284.7 2,466.9
- Retail term deposits 994.7 738.5
Capital adequacy ratio 19.2% 16.7%
- Tier I 14.6% 13.1%
Asset and liabilities breakup: slide 61

45
ICICI Bank Canada
CAD million FY2015 FY2016
Net interest income
73.7 82.8
Profit after tax
33.7 22.4
Loans and advances 5,187.0 5,767.4
- Securitised insured mortgages 2,566.6 2,967.5
Deposits 2,232.9 2,732.1
Capital adequacy ratio 28.5% 23.6%
- Tier I
27.7% 23.6%
Asset and liabilities breakup: slide 62

46
Consolidated financials

47
Consolidated profit & loss statement
` billion FY2015 Q4-
2015
Q3-
2016
Q4-
2016 FY2016
Q4-o-Q4
growth
NII
226.46 60.37 64.88 64.51 252.97 6.9%
Non-interest
income 352.52 106.36 105.70 130.53 421.02 22.7%
- Fee income 97.01 25.05 25.10 26.07 101.28 4.1%
- Premium income
220.77 69.71 62.95 82.57 263.84 18.4%
- Other income
34.74 11.60 17.65
21.89 55.90 88.7%
Total income 578.98 166.73 170.58 195.04 673.99 17.0%
Operating
expenses
350.23 104.73 97.46 121.22 407.90 15.7%
Operating profit 228.75 62.00 73.12 73.82 266.09 19.1%

48
Consolidated profit & loss statement
` billion FY
2015
Q4-
2015
Q3-
2016
Q4-
2016
FY
2016
Q4-o-Q4
growth
Operating profit 228.75 62.00 73.12 73.82 266.09 19.1%
Provisions
45.36 15.71 30.61 34.97 87.05 -
Profit before collective
contingency and
related reserve and tax 183.39 46.29 42.51 38.85 179.04 16.1%
Collective contingency and
related reserve - - - 36.00 36.00 -
Profit before tax 183.39 46.29 42.51 2.85 143.04 (93.8)%
Tax 53.97 13.77 9.39 (3.15) 33.77 -
Minority interest 6.95 1.67 1.90 1.93 7.47 15.6%
Profit after tax 122.47 30.85 31.22 4.07 101.80 (86.8)%

49
Key ratios (consolidated)
Percent
FY2015 Q4-2015 Q3-2016 Q4-2016 FY2016
Return on average
networth1,2
15.0 14.5 13.5 1.7
11.3
Weighted average
EPS (`)1
21.2 21.6 21.4 2.8 17.5
Book value (`) 146 146 162 162
162
1. Based on quarterly average networth
2. Annualised for all interim periods
Consolidated balance sheet: slide 63
50
Agenda
P&L indicators
Credit quality
Subsidiaries
Capital
Growth

51
Capital adequacy
Excess Tier-1 ratio of 5.46% over the minimum requirement of
7.63% as per current RBI guidelines
• Capital ratios significantly higher
than regulatory requirements
• Tier-1 capital is composed almost
entirely of core equity capital
• Substantial scope to raise Additional
Tier-1 and Tier-2 capital
March 31, 2016
Tie
r I
CA
R
16.64%
13.09%
Standalone
Assuming Tier-1 ratio at 10.00%, surplus capital of about
` 190.00 billion at Mar 31, 2016
Capital adequacy ratios: slide 65

52
Summarising the way forward: 4x4
agenda
Robust funding profile Digital leadership & strong
customer franchise
Continued cost efficiency Focus on capital efficiency
including value unlocking
Monitoring focus Improvement in portfolio
mix
Concentration risk
reduction Resolution of stress cases
En
han
cin
g
fran
ch
ise
Po
rtfo
lio
qu
ality

In summary (1/3)
53
Positive indicators in some sectors e.g. roads, logistics,
railways, defence expected to lead to credit demand
We will grow by selectively capturing these
opportunities
Continuing momentum in retail lending
Limit framework in place for enhanced management
of concentration risk
1
2
3
4
Loan growth backed by strong funding profile and
customer franchise 5

In summary (2/3)
54
Maintaining leadership in digital and technology-
enabled customer convenience
Close monitoring of existing portfolio with focus on
resolution and reduction of vulnerable exposures
Created collective contingency and related
reserve of ` 36.00 billion
The Bank will provide a quarterly update on key
exposures
6
7
8
9
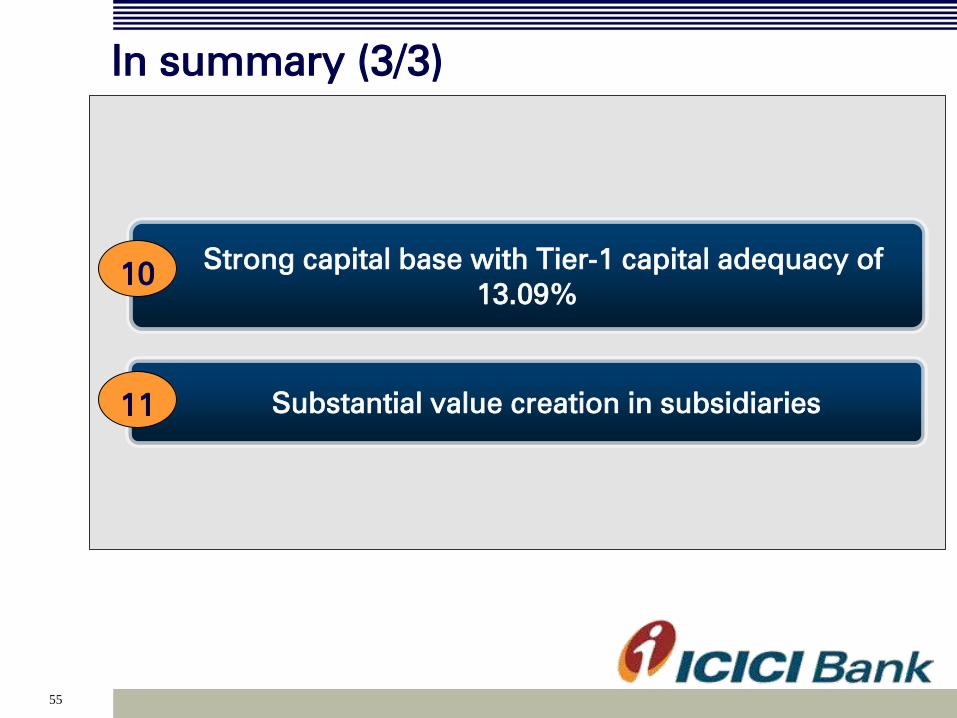
In summary (3/3)
55
Strong capital base with Tier-1 capital adequacy of
13.09%
Substantial value creation in subsidiaries
10
11

56
Thank you

57
Balance sheet: assets
` billion March 31,
2015
December
31, 2015
March 31,
2016
Y-o-Y
growth
Cash & bank balances 423.05 377.00 598.69 41.5%
Investments 1,581.29 1,635.43 1,604.12 1.4%
- SLR investments 1,056.02 1,147.71 1,104.06 4.5%
- Equity investment in
subsidiaries 110.89 110.32 107.63 (2.9)%
Advances
3,875.22 4,348.00 4,352.64 12.3%
Fixed & other assets 581.74 662.08 651.50 12.0%
- RIDF 1and related 284.51 289.37 280.66 (1.3)%
Total assets 6,461.29 7,022.51 7,206.95 11.5%
Net investment in security receipts of asset reconstruction companies
was ` 6.24 billion at March 31, 2016 (December 31, 2015: ₹ 6.39 billion)
1. Pursuant to RBI guideline dated July 16, 2015, the Bank has, effective the quarter
ended June 30, 2015, re-classified deposits placed with NABARD, SIDBI and NHB
on account of shortfall in lending to priority sector from ‘Investments’ to 'Other
Assets'.
2. Rural Infrastructure Development Fund

58
Equity investment in subsidiaries
` billion March 31,
2015
December
31, 2015
March 31,
2016
ICICI Prudential Life Insurance 35.93 35.36 35.07
ICICI Bank Canada 27.32 27.32 25.31
ICICI Bank UK 18.05 18.05 18.05
ICICI Lombard General Insurance 14.22 14.22 13.81
ICICI Home Finance 11.12 11.12 11.12
ICICI Securities Limited 1.87 1.87 1.87
ICICI Securities Primary
Dealership 1.58 1.58 1.58
ICICI AMC 0.61 0.61 0.61
ICICI Venture Funds Mgmt 0.05 0.05 0.05
Others 0.14 0.14 0.14
Total 110.89 110.32 107.63

59
Balance sheet: liabilities
` billion March 31,
2015
December
31, 2015
March 31,
2016
Y-o-Y
growth
Net worth 804.29 895.92 897.36
11.6%
- Equity capital 11.60 11.63 11.63 0.3%
- Reserves
792.70 884.30 885.66
11.7%
Deposits 3,615.63 4,073.14 4,214.26 16.6%
- Savings 1,148.60 1,269.18 1,342.30 16.9%
- Current 495.20 571.81 588.70 18.9%
Borrowings1,2
1,724.17 1,771.61 1,748.07 1.4%
Other liabilities
317.20 281.84 347.26
9.5%
Total liabilities 6,461.29 7,022.51 7,206.95 11.5%
Credit/deposit ratio of 83.2% on the domestic balance sheet at
March 31, 2016
1. Borrowings include preference shares amounting to
₹ 3.50 billion
2. Including impact of exchange rate movement

60
Composition of borrowings
` billion March 31,
2015
December
31, 2015
March 31,
2016
Domestic 843.95 793.17 788.29
- Capital instruments1 387.66 382.86 361.90
- Other borrowings 456.29 410.31 426.39
- Long term infrastructure
bonds 68.50 68.50 68.50
Overseas2 880.22 978.44 959.78
- Capital instruments 21.23 22.48 22.52
- Other borrowings 859.00 955.96 937.26
Total borrowings2 1,724.17 1,771.61 1,748.07
Capital instruments constitute 45.9% of domestic borrowings
1. Includes preference share capital ` 3.50 billion
2. Including impact of exchange rate movement
Funding profile: slide 7
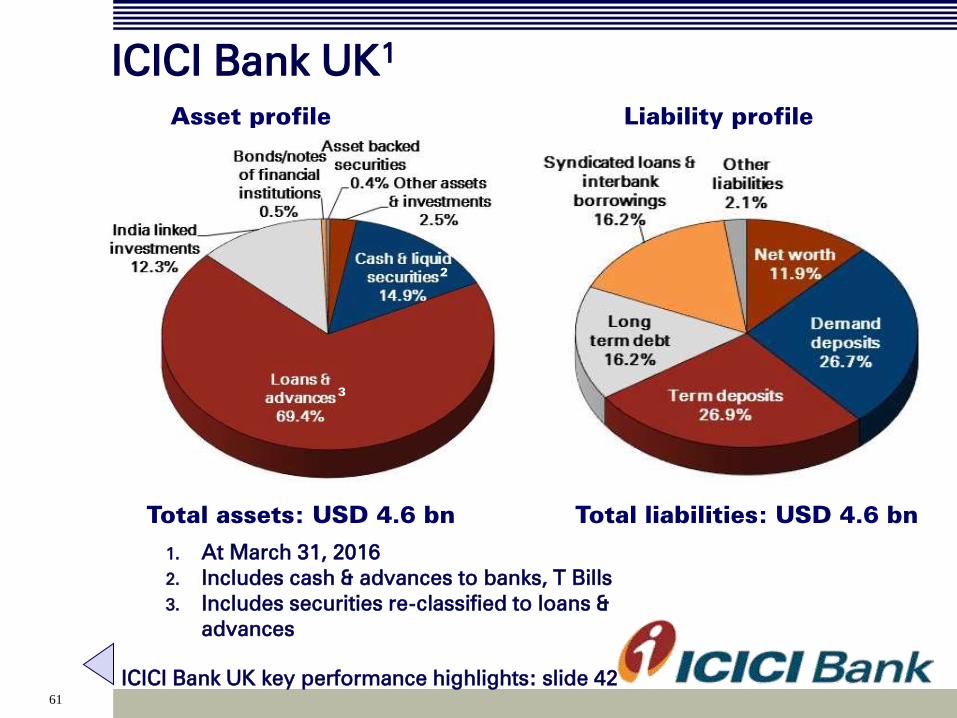
61
ICICI Bank UK1
Total liabilities: USD 4.6 bn Total assets: USD 4.6 bn
1. At March 31, 2016
2. Includes cash & advances to banks, T Bills
3. Includes securities re-classified to loans &
advances
Asset profile Liability profile
3
2
ICICI Bank UK key performance highlights: slide 42

62
ICICI Bank Canada1
1. At March 31, 2016
2. Includes cash & advances to banks and government securities
3. Based on IFRS, securitised portfolio of CAD 2,968 mn considered as part of insured
mortgage portfolio at March 31, 2016
4. As per IFRS, proceeds of CAD 2,931 mn from sale of securitised portfolio considered as
part of borrowings at March 31, 2016
Total liabilities: CAD 6.5 bn Total assets: CAD 6.5 bn
Liability profile Asset profile
4
2
3
ICICI Bank Canada key performance highlights: slide 43
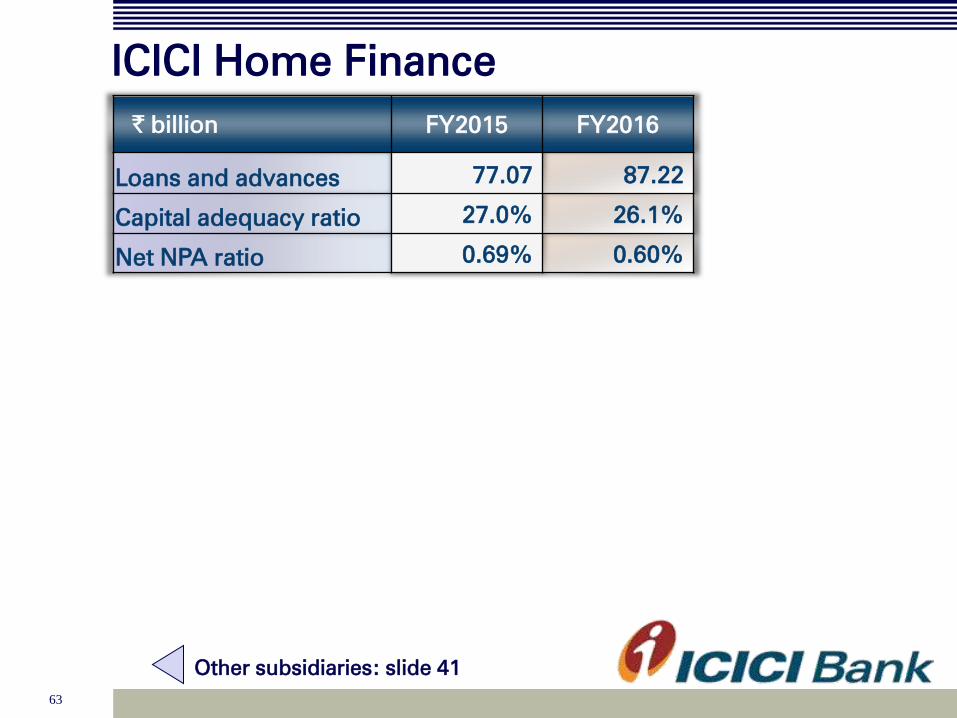
63
ICICI Home Finance
` billion FY2015 FY2016
Loans and advances 77.07 87.22
Capital adequacy ratio 27.0% 26.1%
Net NPA ratio 0.69% 0.60%
Other subsidiaries: slide 41

64
Consolidated balance sheet
` billion March
31, 2015
December
31, 2015
March 31,
2016
Y-o-Y
growth
Cash & bank balances
476.37 442.59 650.36 36.5%
Investments
2,743.11 2,842.86 2,860.44 4.3%
Advances 4,384.90 4,928.59 4,937.29 12.6%
Fixed & other assets 656.41 736.89 739.47 12.7%
Total assets
8,260.79 8,950.93 9,187.56 11.2%
Net worth
847.05 942.99 941.11
11.1%
Minority interest
25.06 28.86 33.55 33.9%
Deposits 3,859.55 4,351.30 4,510.77 16.9%
Borrowings 2,112.52 2,208.15 2,203.78 4.3%
Liabilities on policies in force 936.19 950.96 970.53 3.7%
Other liabilities 480.42 468.67 527.82
9.9%
Total liabilities
8,260.79 8,950.93 9,187.56 11.2%
1. Pursuant to RBI guideline dated July 16, 2015, the Bank has, effective the quarter ended June
30, 2015, re-classified deposits placed with NABARD, SIDBI and NHB on account of shortfall in
lending to priority sector from ‘Investments’ to 'Other Assets'
Key ratios (consolidated): slide 49

65
Capital adequacy
Standalone Basel III March 31, 2015 March 31, 2016
₹ billion % ₹ billion %
Total Capital
927.44 17.02% 1,009.95 16.64%
- Tier I
696.61 12.78% 794.82
13.09%
- Tier II 230.83 4.24% 215.13 3.54%
Risk weighted assets
5,448.96 6,071.13
- On balance sheet 4,385.65 5,021.17
- Off balance sheet 1,063.31 1,049.95
Consolidated Basel III March 31, 2015 March 31, 2016
% %
Total Capital
17.20% 16.60%
- Tier I
12.88% 13.13%
- Tier II 4.32% 3.47%
Capital adequacy: slide 51