Embed Size (px)
Citation preview
Thabo Sehume St
< Bosman St
< Kgosi Mampuru St
Church Square
Jeff
Mas
emol
a St
Steve Biko Rd
Scho
eman
St
< Jo
hann
es R
amok
hoas
e St
Steve Biko Rd
> Sophie de Bruyn St
M4
M18
M22
R101
R101
M11
M5
M6
Tshwane CBD
Paul Kruger St
Hele
n Jo
seph
St
M3
< Pr
etor
ius
St
audited financialstatements
2016for the year ended 31 August

Octodec Investments Limited incorporated in the Republic of South AfricaRegistration number: 1956/002868/06JSE share code: OCTISIN: ZAE000192258 REIT status approved
Registered addressCPA House, 101 Du Toit Street, Tshwane 0002 Tel: 012 319 8781, Fax: 012 319 8812, E-mail: [email protected]
Company secretaryCity Property Administration Proprietary Limited CPA House, 101 Du Toit Street, Tshwane 0002 Tel: 012 357 1564, E-mail: [email protected]
SponsorJava Capital PO Box 2087, Parklands 2121, Johannesburg
Transfer secretariesComputershare Investor Services Proprietary Limited Rosebank Towers, 15 Bierman Avenue, Rosebank 2196Box 61051, Marshalltown 2107
Investor relationsInstinctif Partners E-mail: [email protected]
www.octodec.co.za
companyinformation
Octodec Investments Limited | Annual Financial Statements 2016
contents
directors’ responsibility andapproval of the annual financial statements
certification by company secretary
independent auditor’s report
audit committee report
report of thedirectors
statements of financial position
statements of profit and lossand other comprehensive income
statements of changesin equity
statements ofcash flows
notes to thefinancial statements
property portfolio information
property portfolio analysis
schedule of interestin subsidiaries
shareholders’analysis
glossary
2
2
3
4
6
9
10
11
12
13
41
48
50
52
53

Octodec Investments Limited | Annual Financial Statements 2016
>2
The directors are required by the Companies Act, 71 of 2008, as amended (the Act) to maintain adequate accounting records and are responsible for the content and integrity of the annual financial statements and related financial information included in this report. It is their responsibility to ensure that the annual financial statements fairly present the state of the consolidated and separate financial statements of Octodec Investments Limited as at the end of the financial year and the results of it’s operations and cash flows for the period then ended, in conformity with International Financial Reporting Standards and the Act. The group’s external auditors are engaged to express an independent opinion on the annual financial statements.
The annual financial statements are prepared in accordance with International Financial Reporting Standards and incorporate disclosures in line with the accounting policies of the group. The annual financial statements are based upon appropriate accounting policies consistently applied and supported by reasonable and prudent judgements and estimates and have been audited in compliance with section 29(1) of the Act.
The directors acknowledge that they are ultimately responsible for the system of internal financial control established by the groupand place considerable importance on maintaining a strong control environment.
The directors are of the opinion, based on the information and explanations given by management and results of internal audits, that the system of internal control provides reasonable assurance that the financial records may be relied on for the preparation of the annual financial statements. However, any system of internal financial control can provide only reasonable, and not absolute, assurance against material misstatement or loss.
The directors have reviewed the group and company’s cash flow forecast and, in the light of this review and the current financial position, they are satisfied that the group has access to adequate resources to continue in operational existence for the foreseeable future.
The annual financial statements set out on pages 6 to 53, which have been prepared on the going concern basis, were approved by the board of directors on 23 November 2016 and were signed on their behalf by:
S Wapnick JP WapnickChairman Managing Director
certification by company secretary In terms of section 88(2)(e) of the Act, I certify that Octodec Investments Limited has lodged with the Companies and Intellectual Property Commission of South Africa all the returns required of a public company by the Act, as amended, and that all such returns appear to be true, correct and up to date.
Elize GreeffCity Property Administration Proprietary LimitedCompany Secretary23 November 2016Tshwane
directors’ responsibility and approval of the annual financial statements

>3
To the shareholders of Octodec Investments LimitedReport on the financial statementsWe have audited the consolidated and separate financial statements of Octodec Investments Limited set out on pages 9 to 40, which comprise the statements of financial position as at 31 August 2016, and the statements of profit or loss and other comprehensive income, statements of changes in equity and statements of cash flows for the year then ended, and the notes, comprising a summary of significant accounting policies and other explanatory information.
Directors’ responsibility for the financial statementsThe company’s directors are responsible for the preparation and fair presentation of these consolidated and separate financial statements in accordance with International Financial Reporting Standards and the requirements of the Companies Act of South Africa, and for such internal control as the directors determine is necessary to enable the preparation of consolidated and separate financial statements that are free from material misstatement, whether due to fraud or error.
Auditor’s responsibilityOur responsibility is to express an opinion on these consolidated and separate financial statements based on our audit. We conducted our audit in accordance with International Standards on Auditing. Those standards require that we comply with ethical requirements and plan and perform the audit to obtain reasonable assurance about whether the financial statements are free from material misstatement.
An audit involves performing procedures to obtain audit evidence about the amounts and disclosures in the financial statements. The procedures selected depend on the auditor’s judgment, including the assessment of the risks of material misstatement of the financial statements, whether due to fraud or error. In making those risk assessments, the auditor considers internal control relevant to the entity’s preparation and fair presentation of the financial statements in order to design audit procedures that are appropriate in the circumstances, but not for the purpose of expressing an opinion on the effectiveness of the entity’s internal control. An audit also includes evaluating the appropriateness of accounting policies used and the reasonableness of accounting estimates made by management, as well as evaluating the overall presentation of the financial statements.
We believe that the audit evidence we have obtained is sufficient and appropriate to provide a basis for our audit opinion.
OpinionIn our opinion, the consolidated and separate financial statements present fairly, in all material respects, the consolidated and separate financial position of Octodec Investments Limited as at 31 August 2016, and its consolidated and separate financial performance and consolidated and separate cash flows for the year then ended in accordance with International Financial Reporting Standards and the requirements of the Companies Act of South Africa.
Other reports required by the Companies ActAs part of our audit of the consolidated and separate financial statements for the year ended 31 August 2016, we have read the Report of the Directors, the Audit Committee’s Report and the Certification by the Company Secretary for the purpose of identifying whether there are material inconsistencies between these reports and the audited financial statements.
These reports are the responsibility of the respective preparers. Based on reading these reports we have not identified material inconsistencies between these reports and the audited consolidated and separate financial statements. However, we have not audited these reports and accordingly do not express an opinion on these reports.
Report on other legal and regulatory requirementsIn terms of the Independent Regulatory Board for Auditors (IRBA) Rule published in Government Gazette Number 39475 dated 04 December 2015, we report that Deloitte & Touche has been the auditor of Octodec Investments Limited for 25 years.
Deloitte & Touche Registered AuditorPer: P KlebPartner 23 November 2016
National Executive: *LL Bam Chief Executive Officer *TMM Jordan Deputy Chief Executive Officer *MJ Jarvis Chief Operating Officer*GM Pinnock Audit *N Sing Risk Advisory *NB Kader Tax TP Pillay Consulting S Gwala BPaaS *K Black Clients & Industries*JK Mazzocco Talent & Transformation *MJ Comber Reputation & Risk *TJ Brown Chairman of the Board
A full list of partners and directors is available on request *Partner and Registered Auditor
B-BBEE rating: Level 2 contributor in terms of the Chartered Accountancy Profession Sector CodeAssociate of Deloitte Africa, a Member of Deloitte Touche Tohmatsu Limited
independent auditor’s report

>4
Octodec’s independent audit committee (the committee) is pleased to present its report for the financial year ended 31 August 2016.The committee has discharged its responsibilities mandated by the board, which also allows it to execute its statutory duties in compliance with the Companies Act (71 of 2008, as amended) (the Act), as well as the King III principles applicable to audit committees. The committee’s terms of reference, which are available from the company secretary, are aligned with the legislation, regulations and principles set out above.
Composition, meetings and assessmentThe committee comprised four non-executive directors, three of whom, including its chairman, are independent directors:
Pieter StrydomMCom CA(SA)Chairman
Derek CohenAEP
Gerard KempMSc (Mining Engineering) DPLR. MDP
Myron PollackCA(SA)
A brief profile of each of the members can be viewed on pages 16 and 17 of the 2016 integrated report. The committee met on five occasions during the year under review and, except for an apology received from Gerard Kemp for one of these meetings, all members were present at these scheduled meetings. The chairman of the board, managing director, financial director, internal auditors, external auditors and the chief risk officer attend these meetings by invitation.
Separate meetings are scheduled with the internal and external auditors to allow open discussion without the presence of management. During these meetings no matters of material concern were raised.
Objective and scopeThe main purpose of the committee is to:
• perform its statutory duties as prescribed by the Act;• review and report back to the board on all financial matters relating to the group; • further assist the board in discharging its duties relating to safeguarding of assets, the operation of adequate systems, control and reporting processes and the preparation of accurate reporting and financial statements in compliance with the applicable legal requirements and accounting standards;• provide a forum for discussing business risk and control issues and for developing recommendations for consideration by the board; and• oversee the activities of internal and external audits.
The committee has evaluated the consolidated and company annual financial statements for the year ended 31 August 2016 and, based on the information provided to the committee, considers that they comply in all material respects with the requirements of the various Acts and regulations governing disclosure and reporting in the annual financial statements.
The committee is satisfied that an adequate system of internal control is in place to reduce significant financial risks faced by the group to an acceptable level and that these controls have been effective throughout the period under review. The system is designed to manage rather than eliminate the risk of failure and to maximise the opportunities to achieve business objectives. This can provide only reasonable but not absolute assurance.
The committee received confirmation from the internal auditors, KPMG, that based on the scope of work, the approach followed and the results of the reviews, including the remedial action plans that had been agreed upon by management, nothing had come to the attention of KPMG that would suggest that the prevailing systems of internal controls and the risk management activities throughout the company for the year ended 31 August 2016 were not in all material aspects satisfactory.
audit committee report

>5
Committee activities In addition to the duties set out in its terms of reference, the committee:
• determined the fees to be paid to Deloitte & Touche (external auditors) and its terms of engagement;• determined the fees to be paid to KPMG (internal auditors) and its terms of reference;• reviewed the external audit reports and management letters;• considered and satisfied itself that other services provided by the external auditors were not significant and did not have any impact on their independence;• assessed the work done by the internal auditors so as to ensure their independence and effectiveness;• reviewed the existing internal audit charter and approved amendments thereto to cater for a co-sourced model;• reviewed the quarterly compliance report and City Property Administration Proprietary Limited’s chief information officer’s report;• reviewed the accounting practices and internal financial controls of the group; and• reviewed the documented assessments, as prepared by management, of the going concern status of the group.
Annual confirmations• Annual financial statements and integrated report The committee recommended the annual financial statements as well as the 2016 integrated report to the board for approval. Deloitte & Touche, the external auditors, have provided shareholders with an independent opinion on page 3 on whether the annual financial statements for the year ended 31 August 2016 fairly present, in all material respects, the financial results for the year and the position of the company and the group at 31 August 2016.
• Independence and reappointment of the external auditor is reaffirmed The committee is satisfied that the external audit firm and designated lead auditor are independent as defined by the Act. To this end the committee considered fees for non-audit services paid to the external auditor in terms of its non-audit services policy.
The committee, in consultation with executive management, agreed to an audit fee for the 2016 financial year, which is considered appropriate for the work that was done. Audit fees are described in note 21 to the financial statements.
The committee reviewed the performance of the external auditors and recommended the appointment of Deloitte & Touche as external auditor for the 2017 financial year and Patrick Kleb as the designated lead auditor. This will be his third year as auditor of the company and group.
• Risk management policy The committee has adopted and implemented a risk management policy and has monitored compliance to the policy and is satisfied that Octodec has, in all material respects, complied with the policy during the year under review.
• Evaluation of the expertise and experience of the financial director and the finance function The committee is satisfied with the experience, expertise and adequacy of resources within the finance function and of the financial director.
• Solvency and liquidity Based on the quarterly solvency and liquidity tests performed, the committee was comfortable in its declaration to the board that the company and group are a going concern.
• Effectiveness of internal controls Using the assurance obtained from the various assurance providers the committee recommended to the board that it issues a statement as to the adequacy of the company’s internal control measures.
• Compliance with JSE's letter The audit committee has considered the JSE’s letter dated 15 February 2016 and, where necessary, has taken appropriate action.
Pieter StrydomChairman of the Audit Committee23 November 2016
Octodec Investments Limited | Annual Financial Statements 2016
>6
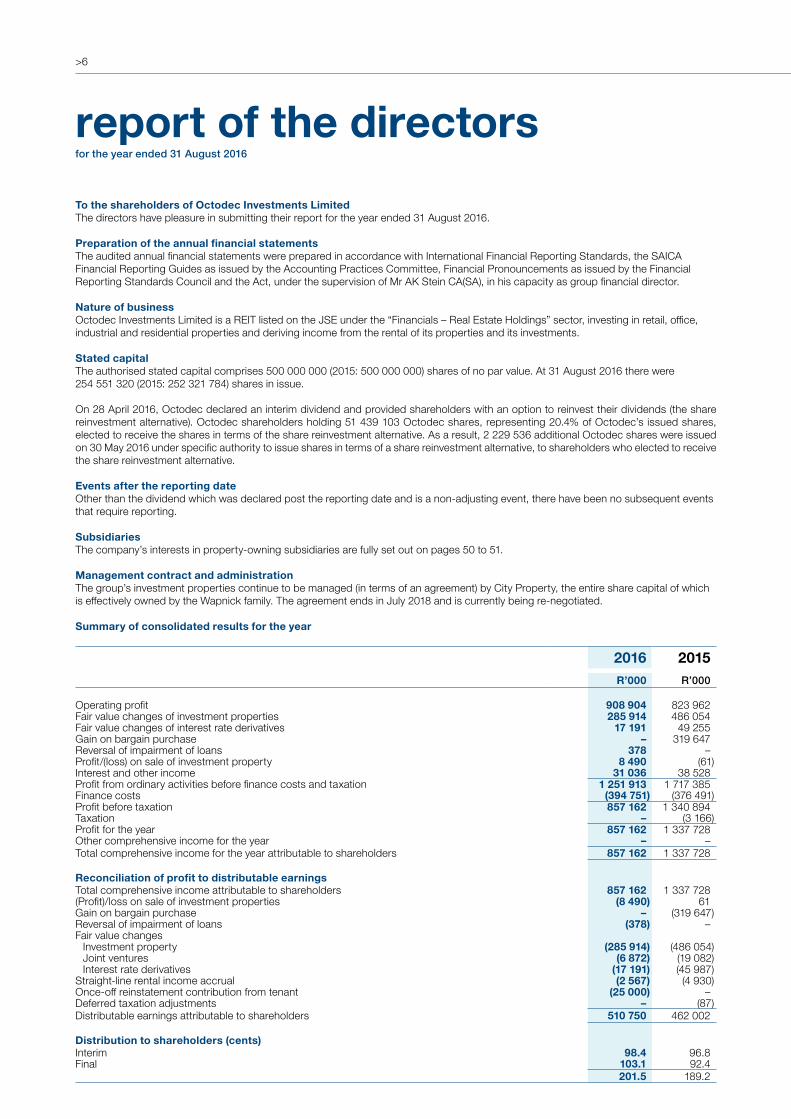
To the shareholders of Octodec Investments Limited The directors have pleasure in submitting their report for the year ended 31 August 2016.
Preparation of the annual financial statements The audited annual financial statements were prepared in accordance with International Financial Reporting Standards, the SAICA Financial Reporting Guides as issued by the Accounting Practices Committee, Financial Pronouncements as issued by the Financial Reporting Standards Council and the Act, under the supervision of Mr AK Stein CA(SA), in his capacity as group financial director. Nature of business Octodec Investments Limited is a REIT listed on the JSE under the “Financials – Real Estate Holdings” sector, investing in retail, office, industrial and residential properties and deriving income from the rental of its properties and its investments.
Stated capital The authorised stated capital comprises 500 000 000 (2015: 500 000 000) shares of no par value. At 31 August 2016 there were 254 551 320 (2015: 252 321 784) shares in issue.
On 28 April 2016, Octodec declared an interim dividend and provided shareholders with an option to reinvest their dividends (the share reinvestment alternative). Octodec shareholders holding 51 439 103 Octodec shares, representing 20.4% of Octodec’s issued shares, elected to receive the shares in terms of the share reinvestment alternative. As a result, 2 229 536 additional Octodec shares were issued on 30 May 2016 under specific authority to issue shares in terms of a share reinvestment alternative, to shareholders who elected to receive the share reinvestment alternative. Events after the reporting date Other than the dividend which was declared post the reporting date and is a non-adjusting event, there have been no subsequent events that require reporting.
Subsidiaries The company’s interests in property-owning subsidiaries are fully set out on pages 50 to 51. Management contract and administration The group’s investment properties continue to be managed (in terms of an agreement) by City Property, the entire share capital of which is effectively owned by the Wapnick family. The agreement ends in July 2018 and is currently being re-negotiated.
Summary of consolidated results for the year
report of the directorsfor the year ended 31 August 2016
2016 2015R’000 R’000
Operating profit 908 904 823 962Fair value changes of investment properties 285 914 486 054Fair value changes of interest rate derivatives 17 191 49 255Gain on bargain purchase – 319 647Reversal of impairment of loans 378 – Profit/(loss) on sale of investment property 8 490 (61)Interest and other income 31 036 38 528Profit from ordinary activities before finance costs and taxation 1 251 913 1 717 385Finance costs (394 751) (376 491)Profit before taxation 857 162 1 340 894Taxation – (3 166)Profit for the year 857 162 1 337 728Other comprehensive income for the year – – Total comprehensive income for the year attributable to shareholders 857 162 1 337 728
Reconciliation of profit to distributable earningsTotal comprehensive income attributable to shareholders 857 162 1 337 728(Profit)/loss on sale of investment properties (8 490) 61Gain on bargain purchase – (319 647)Reversal of impairment of loans (378) –Fair value changes Investment property (285 914) (486 054) Joint ventures (6 872) (19 082) Interest rate derivatives (17 191) (45 987)Straight-line rental income accrual (2 567) (4 930)Once-off reinstatement contribution from tenant (25 000) –Deferred taxation adjustments – (87)Distributable earnings attributable to shareholders 510 750 462 002
Distribution to shareholders (cents) Interim 98.4 96.8 Final 103.1 92.4
201.5 189.2

>7
2016 2015R R
S Wapnick 1 033 000 1 025 000 DP Cohen 847 000 667 000 GH Kemp 801 000 652 000 MZ Pollack 778 000 667 000 AK Stein 649 000 667 000 PJ Strydom 839 000 715 000 JP Wapnick 649 000 667 000
5 596 000 5 060 000
There are no service contracts in place with the directors of Octodec. The proportionate salaries paid by City Property for Messrs JP Wapnick and AK Stein, the executive directors of Octodec, who are employed by City Property, are set out below. These amounts are based on an approximation of the time spent on Octodec in relation to their employment at City Property for the year ended 31 August 2016. Ms S Wapnick, the non-executive Chairman, was remunerated by City Property on an approximation of her time spent on Octodec affairs.
Valuation of portfolio Octodec’s property portfolio was valued by the directors at an amount of R12.1 billion (2015: R11.4 billion) as at 31 August 2016. Over a three-year cycle, all properties are valued on a rotational basis by independent external valuers. The valuation of R3.1 billion of the property portfolio was performed by external valuers: Van Zyl Valuers CC (Gert van Zyl), Amanda de Wet Consultants and Investors CC (Amanda de Wet) and Quadrant Properties Proprietary Limited (Peter Parfitt) as at 31 August 2016 and was 0.7% more (2015: 0.6%) than the directors’ portfolio valuation. The directors are confident, taking all factors into account, that their valuation represents fair value. Net asset value The net asset value per share is 2 913 cents (2015: 2 769 cents). The closing price per share at 31 August 2016 was 2 299 cents (2015: 2 425 cents), representing a discount of 21.1% to the net asset value per share.
DirectorateThe directors of the company during the year under review were:
Executive directors JP Wapnick – Managing directorAK Stein – Financial director
Non-executive directorsS Wapnick (Chairman)DP Cohen (Lead independent director)GH Kemp (Non-executive independent director)MZ Pollack (Non-executive director)PJ Strydom (Non-executive independent director)
Directors’ remuneration
2016 2015
SalaryR
Pension fund
contribu-tions
RTotal
RSalary
R
Pension fund
contribu-tions
RTotal
R
AK Stein 2 154 014 42 789 2 196 803 1 801 162 39 554 1 840 716 JP Wapnick 2 658 478 – 2 658 478 2 617 967 – 2 617 967 S Wapnick 1 222 892 – 1 222 892 203 520 – 203 520
6 035 384 42 789 6 078 173 4 622 649 39 554 4 662 203
Octodec Investments Limited | Annual Financial Statements 2016

>8
2016
Directbeneficial
Indirectbeneficial
Indirectnon-
beneficial Total %
MZ Pollack 547 347 – 2 197 127 2 744 474 1.1 AK Stein 172 284 305 274 145 049 622 607 0.2 JP Wapnick 37 489 14 536 276 20 581 696 35 155 461 13.8 S Wapnick 36 983 14 536 276 14 802 467 29 375 726 11.5
794 103 29 377 826 37 726 339 67 898 268 26.6
Changes in directors’ shareholding after year-end There have been no changes in directors’ shareholding from reporting date to signing of the annual financial statements. Going concern The directors have considered the solvency and liquidity tests and have determined that the group has adequate resources to continue to operate in the foreseeable future. The annual financial statements have been prepared on the going concern basis. Corporate governance The board endorses the contents of the King Report on Governance for South Africa (King III). Auditors Deloitte & Touche have expressed their willingness to continue in office and resolutions proposing their reappointment will be submitted at the annual general meeting. Company secretary City Property Administration Proprietary Limited CPA House 101 Du Toit Street Tshwane, 0002
PO Box 15, Tshwane, 0001
2015
Directbeneficial
Indirectbeneficial
Indirectnon-
beneficial Total %
MZ Pollack 467 587 – 2 125 127 2 592 714 1.0 AK Stein 172 284 236 713 144 049 553 046 0.2 JP Wapnick 35 930 16 523 419 17 801 371 34 360 720 13.6 S Wapnick 36 983 16 514 225 12 624 009 29 175 217 11.6
712 784 33 274 357 32 694 556 66 681 697 26.4
Directors’ shareholdingThe beneficial and non-beneficial interest held by the directors in the company at the reporting date amounted to:
report of the directors– continuedfor the year ended 31 August 2016

>9
consolidated company2016
R’0002015
R’0002016
R’0002015
R’000Notes
AssetsNon-current assets 12 219 234 11 644 922 7 131 179 5 793 130 Investment property 2 11 776 839 11 265 331 1 073 377 999 769 Straight-line rental income accrual 3 115 849 114 773 14 138 14 150 Plant and equipment 4 6 810 8 646 40 71 Tenant installations and lease costs 5 57 133 60 407 2 003 2 230 Investment in subsidiaries 6 – – 5 955 921 4 755 342 Investment in joint ventures 7 172 582 161 314 – – Other financial assets 9 51 849 – 51 849 – Derivative financial instruments 10 38 172 34 451 33 851 21 568
Current assets 373 661 158 091 130 086 77 509 Trade and other receivables 11 131 552 102 822 13 432 14 199 Cash and cash equivalents 12 69 109 55 269 60 154 63 310
200 661 158 091 73 586 77 509 Non-current assets held for sale 13 173 000 – 56 500 –
Total assets 12 592 895 11 803 013 7 261 265 5 870 639
Equity and liabilitiesEquity 7 413 800 6 987 679 5 070 450 4 958 982 Stated capital 14 3 958 207 3 907 819 3 958 207 3 907 819 Non-distributable reserve 15 3 112 885 2 799 231 842 710 808 855 Distributable reserve 342 708 280 629 269 533 242 308
Non-current liabilities 4 106 208 3 012 937 2 146 200 691 023 Long-term borrowings 16 4 023 911 2 917 174 2 137 025 691 023 Derivative financial instruments 10 9 308 22 778 9 175 – Deferred taxation 17 72 989 72 985 – –
Current liabilities 1 072 887 1 802 397 44 615 220 634 Trade and other payables 18 315 698 335 216 43 283 39 678 Short-term borrowings 16 755 116 1 463 699 – 179 141 Shareholders for distribution 2 073 3 482 1 332 1 815
Total equity and liabilities 12 592 895 11 803 013 7 261 265 5 870 639
statements of financial positionat 31 August 2016
Octodec Investments Limited | Annual Financial Statements 2016
consolidated company2016
R’0002015
R’0002016
R’0002015
R’000Notes
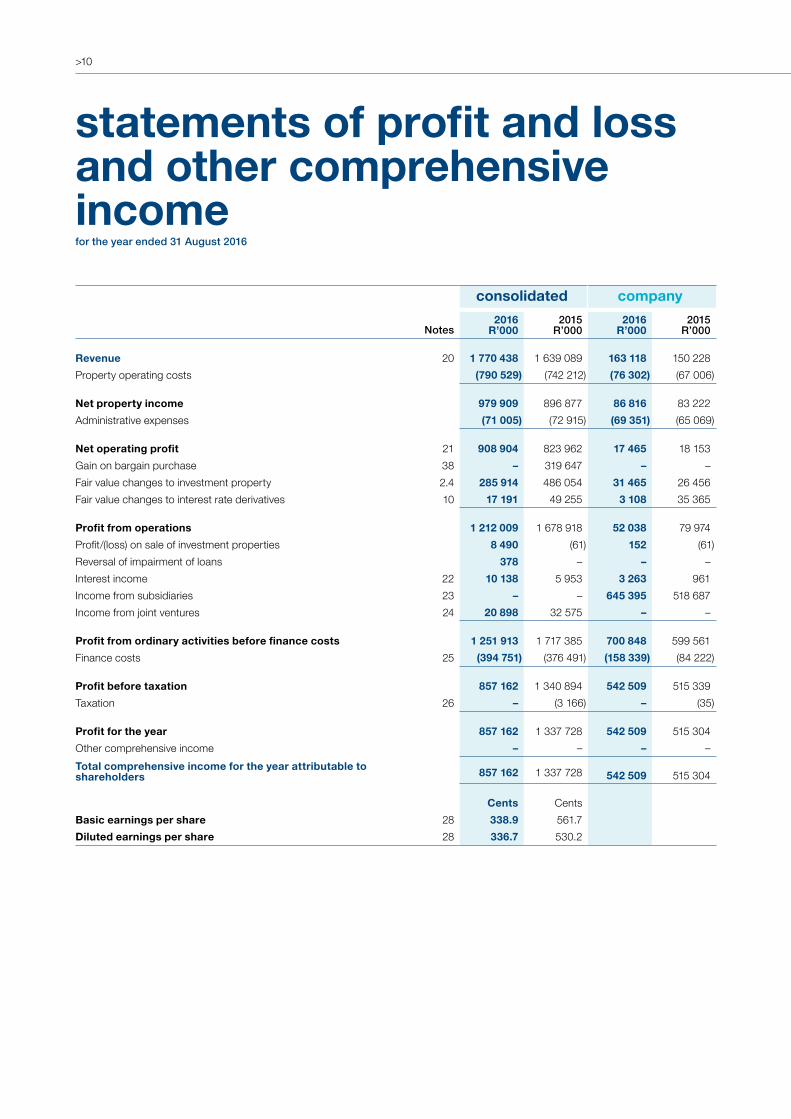
Revenue 20 1 770 438 1 639 089 163 118 150 228Property operating costs (790 529) (742 212) (76 302) (67 006)
Net property income 979 909 896 877 86 816 83 222Administrative expenses (71 005) (72 915) (69 351) (65 069)
Net operating profit 21 908 904 823 962 17 465 18 153Gain on bargain purchase 38 – 319 647 – – Fair value changes to investment property 2.4 285 914 486 054 31 465 26 456Fair value changes to interest rate derivatives 10 17 191 49 255 3 108 35 365
Profit from operations 1 212 009 1 678 918 52 038 79 974Profit/(loss) on sale of investment properties 8 490 (61) 152 (61)Reversal of impairment of loans 378 – – –Interest income 22 10 138 5 953 3 263 961Income from subsidiaries 23 – – 645 395 518 687Income from joint ventures 24 20 898 32 575 – –
Profit from ordinary activities before finance costs 1 251 913 1 717 385 700 848 599 561Finance costs 25 (394 751) (376 491) (158 339) (84 222)
Profit before taxation 857 162 1 340 894 542 509 515 339Taxation 26 – (3 166) – (35)
Profit for the year 857 162 1 337 728 542 509 515 304Other comprehensive income – – – – Total comprehensive income for the year attributable to shareholders 857 162 1 337 728 542 509 515 304
Cents CentsBasic earnings per share 28 338.9 561.7 Diluted earnings per share 28 336.7 530.2
statements of profit and loss and other comprehensive incomefor the year ended 31 August 2016
>10

>11
statements of changes in equityfor the year ended 31 August 2016
statedcapital
R’000
nondistri-
butablereserve
R’000
distri-butable reserve
R’000total
R’000
ConsolidatedBalance at 1 September 2014 918 478 1 928 522 42 449 2 889 449Total comprehensive income for the year – – 1 337 728 1 337 728Issue of new shares 2 989 341 – – 2 989 341Dividends paid – – (228 839) (228 839)Transfer to non-distributable reserve Loss on sale of investment properties – (61) 61 – Gain on bargain purchase – 319 647 (319 647) – Fair value changes
- Investment property – 486 054 (486 054) –- Joint ventures – 19 082 (19 082) –- Interest rate derivatives, net of deferred tax – 45 987 (45 987) –
Balance at 31 August 2015 3 907 819 2 799 231 280 629 6 987 679Total comprehensive income for the year – – 857 162 857 162Issue of new shares 50 388 – – 50 388Dividends paid – – (481 429) (481 429)Transfer to non-distributable reserve Profit on sale of investment properties – 8 490 (8 490) – Fair value changes
- Investment property – 285 914 (285 914) –- Joint ventures – 6 872 (6 872) –- Interest rate derivatives, net of deferred tax – 12 378 (12 378) –
Balance at 31 August 2016 3 958 207 3 112 885 342 708 7 413 800
CompanyBalance at 1 September 2014 918 478 753 135 11 563 1 683 176Total comprehensive income for the year – – 515 304 515 304Issue of new shares 2 989 341 – – 2 989 341Dividends paid – – (228 839) (228 839)Transfer to non-distributable reserve Profit on sale of investment properties – (61) 61 – Fair value changes
- Investment property – 26 456 (26 456) – - Interest rate derivatives, net of deferred tax – 29 325 (29 325) –
Balance at 31 August 2015 3 907 819 808 855 242 308 4 958 982Total comprehensive income for the year – – 542 509 542 509Issue of new shares 50 388 – – 50 388Dividends paid – – (481 429) (481 429)Transfer to non-distributable reserve Profit on sale of investment properties – 152 (152) – Fair value changes
- Investment property – 31 465 (31 465) –- Interest rate derivatives, net of deferred tax – 2 238 (2 238) –
Balance at 31 August 2016 3 958 207 842 710 269 533 5 070 450
Octodec Investments Limited | Annual Financial Statements 2016
>12
consolidated company2016
R’0002015
R’0002016
R’0002015
R’000Notes
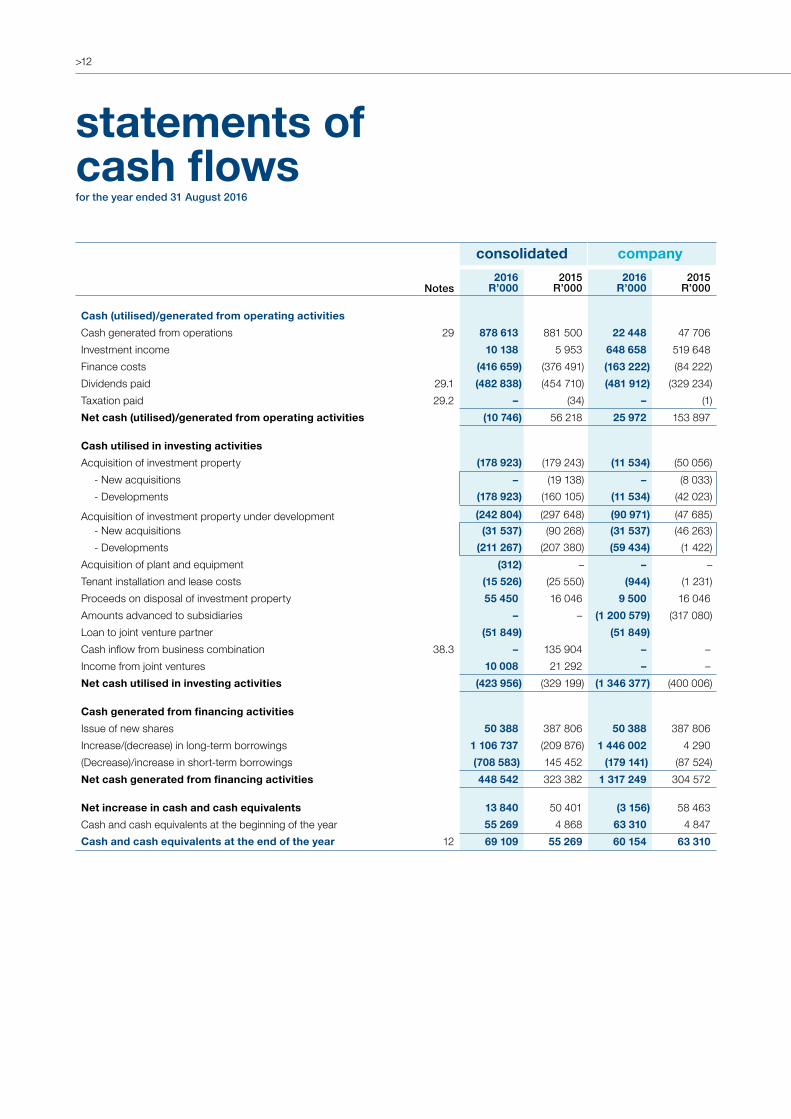
Cash (utilised)/generated from operating activitiesCash generated from operations 29 878 613 881 500 22 448 47 706Investment income 10 138 5 953 648 658 519 648Finance costs (416 659) (376 491) (163 222) (84 222)Dividends paid 29.1 (482 838) (454 710) (481 912) (329 234)Taxation paid 29.2 – (34) – (1)Net cash (utilised)/generated from operating activities (10 746) 56 218 25 972 153 897
Cash utilised in investing activitiesAcquisition of investment property (178 923) (179 243) (11 534) (50 056)
- New acquisitions – (19 138) – (8 033)- Developments (178 923) (160 105) (11 534) (42 023)
Acquisition of investment property under development (242 804) (297 648) (90 971) (47 685)- New acquisitions (31 537) (90 268) (31 537) (46 263)- Developments (211 267) (207 380) (59 434) (1 422)
Acquisition of plant and equipment (312) – – –Tenant installation and lease costs (15 526) (25 550) (944) (1 231)Proceeds on disposal of investment property 55 450 16 046 9 500 16 046 Amounts advanced to subsidiaries – – (1 200 579) (317 080)Loan to joint venture partner (51 849) (51 849)Cash inflow from business combination 38.3 – 135 904 – – Income from joint ventures 10 008 21 292 – – Net cash utilised in investing activities (423 956) (329 199) (1 346 377) (400 006)
Cash generated from financing activitiesIssue of new shares 50 388 387 806 50 388 387 806 Increase/(decrease) in long-term borrowings 1 106 737 (209 876) 1 446 002 4 290(Decrease)/increase in short-term borrowings (708 583) 145 452 (179 141) (87 524)Net cash generated from financing activities 448 542 323 382 1 317 249 304 572
Net increase in cash and cash equivalents 13 840 50 401 (3 156) 58 463Cash and cash equivalents at the beginning of the year 55 269 4 868 63 310 4 847Cash and cash equivalents at the end of the year 12 69 109 55 269 60 154 63 310
statements ofcash flowsfor the year ended 31 August 2016

>13
notes to the financial statements for the year ended 31 August 2016
1. Significant accounting policies1.1 Basis of preparation The consolidated and company financial statements (financial statements) have been prepared in accordance with International Financial Reporting Standards, the SAICA Financial Reporting Guides as issued by the Accounting Practices Committee, Financial Pronouncements as issued by the Financial Reporting Standards Council and the Act, and have been rounded to the nearest thousand (R’000). The annual financial statements have been prepared on the historical cost basis, except for the measurement of investment property and certain financial instruments at fair value, and incorporate the principal accounting policies set out below. The accounting policies adopted and methods of computation are consistent with those applied in the financial statements of the previous year.
1.2 Basis of consolidation 1.2.1 Accounting for business combinations The group accounts for business combinations by applying the acquisition method as at the acquisition date and measures goodwill as the fair value of the consideration transferred including the recognised amount of any non-controlling interest in the acquiree, less the net recognised amount (generally fair value) of the identifiable assets acquired and liabilities assumed, all measured at the acquisition date.
The group controls an entity when it has power over the entity, it is exposed to, or has rights to variable returns from its involvement with the entity and has the ability to affect those through its power over the entity. The acquisition date is the date on which control is transferred to the acquirer. Judgement is applied in determining the acquisition date and determining whether control is transferred from one party to another.
Consideration transferred includes the fair values of the assets transferred, liabilities incurred by the group to the previous owners of the acquiree, and equity interests issued by the group. Consideration transferred also includes the fair value of any contingent consideration.
A contingent liability of the acquiree is assumed in a business combination only if such a liability represents a present obligation and arises from a past event, and its fair value can be measured reliably.
The group measures any non-controlling interest at its proportionate interest in the identifiable net assets of the acquiree.
Transaction costs that the group incurs in connection with a business combination, such as finder’s fees, legal fees, due diligence fees, and other professional and consulting fees, are expensed as incurred, except transaction costs associated with the issue of debt or equity interests, which are set off against stated capital in the year of the acquisition.
1.2.2 Goodwill and gain on bargain purchase Goodwill arising on the acquisition of a business is carried at cost, as established at the date of acquisition of the business, less accumulated impairment losses, if any.
Goodwill is not amortised but is tested on an annual basis for impairment. If goodwill is assessed to be impaired, that impairment is not subsequently reversed.
On disposal of a subsidiary, attributable goodwill is included in the determination of the profit or loss on disposal.
If the cost of the acquisition is less than the fair value of the net asset value of the subsidiary, the difference is recognised directly in the statement of profit and loss and other comprehensive income as a gain on bargain purchase.
1.2.3 Investments in subsidiaries Subsidiaries are those entities controlled by the group. The financial results of subsidiaries are included in the consolidated financial statements from the date that control commences until the date that control ceases.
All intra-group transactions, balances, income and expenses are eliminated in full on consolidation.
Transactions which result in changes in ownership levels, where the group has control of the subsidiary both before and after the transaction, are regarded as equity transactions and are recognised directly in the statement of changes in equity. The difference between the fair value of the consideration paid or received and the movement in non-controlling interest for such transactions is recognised in equity attributable to the owners of the parent.
Where a subsidiary is disposed of and a non-controlling shareholding is retained, the remaining investment is measured to fair value with the adjustment to fair value recognised in the statement of profit or loss and other comprehensive income, as part of the gain or loss on disposal of the controlling interest.
Investments in subsidiaries are stated in the company’s financial statements at cost, less any impairment losses.
1.2.4 Investments in joint ventures A joint venture is an arrangement in which the group has joint control, whereby the group has rights to the net assets held under the arrangement, rather than rights to its assets and obligations for its liabilities. Joint control is the contractually agreed sharing of control under the arrangement, which occurs only when decisions about the relevant activities require unanimous consent of the parties sharing control.
Interests in joint ventures are accounted for using the equity method. They are recognised initially at cost, which includes transaction costs. Subsequent to initial recognition, the consolidated financial statements include the group’s share of the profit or loss and the other comprehensive income of equity-accounted investees, until the date on which the investment ceases to be a joint venture or when the investment is classified as held for sale.
When the group transacts with a joint venture of the group, profits and losses resulting from transactions with the joint venture are recognised in the group’s consolidated and company financial statements only to the extent of interests in the joint venture that are not related to the group.
1.2.5 Interest in joint operations A jointly controlled operation is a joint arrangement whereby the parties that have joint control of the arrangement have rights to the assets and obligations for the liabilities relating to the arrangement. Joint control is the contractually agreed sharing of control of an arrangement, which exists only when decisions about the relevant activities require unanimous consent of the parties sharing control. Jointly controlled operations are accounted for by including the group’s
Octodec Investments Limited | Annual Financial Statements 2016

>14
1.2 Basis of consolidation – continued 1.2.5 Interest in joint operations – continued share of the jointly controlled assets, liabilities, revenues and expenses on a line-by-line basis in the financial statements from the date thatjoint control commences until the date that joint control ceases. The group accounts for these assets, liabilities, revenues and expenses relating to its interest in a joint operation in accordance with the IFRS applicable to the particular assets, liabilities, revenues and expenses.
When the group transacts with a joint operation in which a group entity is a joint operator, the group is considered to be conducting the transaction with the other parties to the joint operation, and gains and losses resulting from the transactions are recognised in the group’s consolidated annual financial statements only to the extent of the other parties’ interests in the joint operation.
When a group entity transacts with a joint operation in which a group entity is a joint operator (such as a purchase of assets), the group does not recognise its share of the gains and losses until it resells those assets to a third party.
1.3 Reserves Realised profits on the disposal of investment properties, although legally distributable, are transferred to a non-distributable reserve, as it is the group’s policy to regard such profits as not being available for distribution. Gains and losses on revaluation of investment property and on interest rate derivatives net of deferred tax as applicable, are similarly transferred to a non-distributable reserve as are revaluation reserves of associates and joint ventures.
1.4 Investment property Investment properties are properties held to earn rentals and/or for capital appreciation.
Investment properties are recognised as an asset when, and only when, it is probable that the future economic benefits that are associated with the investment properties will flow to the entity, and the cost of the investment properties can be measured reliably.
Investment properties are initially recognised at cost, including transaction costs. Subsequent to initial recognition, investment properties are measured at fair value. A gain or loss arising from a change in fair value is recognised in profit or loss and transferred to a non-distributable reserve in the statement of changes in equity in the period in which it arises. Subsequent refurbishing expenditure relating to investment properties that have been recognised is added to the carrying amount of the investment properties when it is probable that future economic benefits, in excess of the originally assessed standard of performance of the existing investment properties, will flow to the entity. All other subsequent expenditure is expensed in the period in which it is incurred.
Investment properties are derecognised on disposal or when it is permanently withdrawn from use and no future economic benefits are expected from its disposal. The gain or loss on disposal of investment properties is calculated as the difference between the net disposal proceeds and the carrying amount of the investment properties and is recognised in the statement of profit and loss and other comprehensive income for the period and transferred to the non-distributable reserve in the period in which it arises.
Investment properties erected on land secured by means of long-term land leases are classified as investment properties.
1.4.1 Properties under developmentProperties under development comprise the cost of the land and development and are stated at fair value. If the fair value cannot be reasonably determined it is stated at cost and is not depreciated. Investment properties that require development are transferred from investment property to investment property under development when development commences. On completion of the development these properties become part of investment property.
1.4.2 Fair value At the reporting date all investment properties are measured at fair value as determined by management. The investment committee considers the valuations to determine the appropriateness of the valuation techniques and inputs used for fair value measurements. The valuation process is reviewed by the investment committee and approved by the board of directors at each reporting period.
In estimating the fair value of investment properties, the group uses market-observable data to the extent it is available. In accordance with the JSE Listings Requirements, independent valuations are obtained on a rotational basis to determine the reasonableness of the directors’ portfolio valuation, ensuring that every property is independently valued every three years.
1.5 Non-current assets held-for-sale A non-current asset is classified as held-for-sale if it is expected that its carrying amount will be recovered principally through sale rather than through continuing use, it is available for immediate sale and the sale is highly probable to occur within one year. For the sale to be highly probable, the appropriate level of management must be committed to a plan to sell the asset.
On initial classification as held-for-sale, generally, non-current assets are measured at the lower of the carrying amount and fair value less costs to sell, with any adjustments taken to profit or loss (or other comprehensive income in the case of a revalued asset). The same applies to gains and losses on subsequent re-measurement. However, investment property within the scope of IAS 40 continues to be measured in accordance with that standard.
Impairment losses subsequent to classification of assets as held-for-sale are recognised in profit or loss. Increases in fair value less costs to sell assets that have been classified as held-for-sale are recognised in profit or loss to the extent that the increase is not in excess of any cumulative impairment loss previously recognised in respect of the asset. Assets classified as held-for-sale are not depreciated.
Non-current assets held-for-sale are presented separately from other assets and liabilities on the statement of financial position. Prior periods are not reclassified.
1.6 Plant and equipment Plant and equipment are recognised at cost less accumulated depreciation and accumulated impairment losses. The cost of an item of plant and equipment is recognised as an asset when it is probable that future economic benefits associated with the item will flow to the entity and the cost of the item can be measured reliably. Subsequent expenditure relating to an item of plant and equipment that has already been recognised is added to the carrying amount of the asset to the extent that it is probable that future economic benefits, in excess of the originally assessed standard of performance of the existing asset, will flow to the entity.
notes to the financial statements – continued for the year ended 31 August 2016

>15
1.6 Plant and equipment – continued The residual value and the useful life of each asset are reviewed at each financial year-end. Each part of an item of plant and equipment with a cost that is significant in relation to the total cost of the item is depreciated separately.
Depreciation is based on the cost of the asset less its residual value and recognised on a straight-line basis, over the current estimated useful lives of the assets. The estimated useful lives of the assets for the current and comparative periods are:
• Furniture, fittings and carpets 6 years• Security equipment 5 – 6 years• Lifts 12 years• Air-conditioning equipment 6 years• Motor vehicles 4 years
The gain or loss arising from the disposal or retirement of an asset is determined as the difference between the sales proceeds and the carrying amount of the asset and is recognised in thestatement of profit and loss and other comprehensive income.
1.7 Financial instruments Financial assets and liabilities are recognised when the group becomes a party to the contractual provisions of the instruments.
Financial assets and liabilities are initially measured at fair value. All transaction costs directly attributable to the acquisition or issue of financial assets and liabilities (other than financial assets and financial liabilities at fair value through profit and loss) are added to or deducted from the value of the financial assets or financial liabilities, as appropriate, on initial recognition. Transaction costs directly attributable to the acquisition of financial instruments at fair value through profit or loss are expensed immediately in profit and loss. 1.7.1 Financial assets Financial assets are classified into the following specified categories: ‘financial assets at fair value through profit or loss’ (FVTPL), ‘held-to-maturity’ investments, ‘available-for-sale’ (AFS) financial assets and ‘loans and receivables’. The classification depends on the nature and purpose of the financial assets and is determined by management at the time of initial recognition.
1.7.2 Financial liabilities Financial liabilities are classified as either financial liabilities at ‘FVTPL’ or ‘other financial liabilities’. Other financial liabilities (including borrowings and trade and other payables) are subsequently measured at amortised cost using the effective interest method.
1.7.3 Loans and receivables Loans and receivables are financial assets with fixed or determinable payments that are not quoted in an active market. Loans and receivables (including loans, trade and other receivables and cash and cash equivalents) are measured at amortised cost using the effective interest method, less any impairment, except for short-term receivables where the effect of discounting is immaterial. Interest earned on loans, trade receivables and cash and cash equivalents is recognised on an accrual basis using the effective interest method.
1.7.4 Other financial liabilities Other financial liabilities (including borrowings and trade and other payables) are initially recognised at fair value and subsequently measured at amortised cost using the effective interest method, except for short-term payments where the effect of discounting is immaterial.
1.7.5 Derivative financial instruments The group uses derivative financial instruments to manage its exposure to interest rate risk arising from its financing activities. In accordance with its treasury policy, the group does not hold or issue derivative financial instruments for trading purposes. However, as the hedge relationship is not designated as a hedge for accounting purposes, the derivatives are accounted for as trading instruments.
Derivative financial instruments are initially recognised at fair value at the date the derivative contracts are entered into and are subsequently remeasured to their fair value at the end of each reporting period. The resulting gain or loss is recognised in profit or loss and other comprehensive income.
The fair value of interest rate swaps is the estimated amount that the entity would receive or pay to terminate the swap at the reporting date, taking into account current interest rates and the current creditworthiness of the swap counterparties.
1.7.6 Derecognition The group derecognises a financial asset when the contractual rights to the cash flows from the asset expire, or it transfers the rights to receive the contractual cash flows on the financial asset in a transaction in which substantially all the risks and rewards of ownership of the financial asset are transferred. Any interest in transferred financial assets that is created or retained by the entity is recognised as a separate asset or liability.
The group derecognises a financial liability when its contractual obligations are discharged, cancelled or expired.
1.7.7 Impairment of financial assets Financial assets, other than those at FVTPL, are assessed for indicators of impairment at the end of each reporting period. Financial assets are considered to be impaired when there is objective evidence that, as a result of one or more events that occurred after the initial recognition of the financial asset, the estimated future cash flows of the investment have been affected.
Objective evidence of impairment for a portfolio of receivables includes the group’s past experience of collecting payments, an increase in the number of delayed payments in the portfolio past the tolerance credit period of 60 days, as well as observable changes in local economic conditions that result in default on receivables.
An estimate is made for credit losses based on a review of all outstanding amounts at year-end. Doubtful debts are written off to profit or loss during the year in which they are identified.
A reversal of an impairment of financial assets at amortised cost is recognised immediately in profit and loss.
1.8 Impairment of non-financial assetsAt each reporting date the group assesses whether there is any indication that an asset may be impaired. If any such indication exists, the group estimates the recoverable amount of the asset.
If it is not possible to estimate the recoverable amount of the individual asset, the recoverable amount of the cash-generating unit to which the asset belongs is determined.
The recoverable amount of an asset or a cash-generating unit is the higher of its fair value less costs to sell, and its value in use. If the recoverable amount of an asset is less than its carrying amount, the carrying amount of the asset is reduced to its recoverable amount. That reduction is an impairment loss. An impairment loss of assets carried at cost less any accumulated depreciation or amortisation is recognised immediately in profit or loss. Any impairment loss of a revalued asset is treated as a revaluation decrease.
An entity assesses at each reporting date whether there is any indication that an impairment loss recognised in prior periods for assets other than goodwill may no longer exist or may have decreased. If any such indication exists, the recoverable amounts of those assets are estimated.
A reversal of an impairment loss of assets carried at cost less accumulated depreciation or amortisation other than goodwill is recognised immediately in profit or loss. Any reversal of an impairment loss of a revalued asset is treated as a revaluation increase.
Octodec Investments Limited | Annual Financial Statements 2016

>16
notes to the financial statements – continued for the year ended 31 August 2016
1.9 Borrowing costs Borrowing costs directly attributable to the acquisition, construction or production of qualifying assets, which are assets that necessarily take a substantial period of time to get ready for their intended use or sale, are added to the cost of those assets, until such time as the assets are substantially ready for their intended use.
Investment income earned on the temporary investment of specific borrowings pending their expenditure on qualifying assets is deducted from the borrowing costs eligible for capitalisation.
All other borrowing costs are recognised in profit or loss in the period in which they are incurred.
1.10 Provisions Provisions are recognised when the group has a present legal or constructive obligation as a result of a past event which will probably result in an outflow of economic benefits that can be reasonably estimated. The amount of a provision is the present value of the expenditure expected to be required to settle the obligation.
1.11 Taxation Current and deferred tax expenses are recognised in profit and loss, except when they relate to items that are recognised in other comprehensive income or directly in equity, in which case the current and deferred tax expenses are also recognised in other comprehensive income or directly in equity respectively. Where current tax or deferred tax expenses arise from the initial accounting for a business combination, the tax effect is included in the accounting for the business combination.
1.11.1 Current tax The tax currently payable is based on taxable profit for the year. Taxable profit differs from ‘profit before tax’ as reported in the consolidated statement of profit and loss and other comprehensive income because of items of income or expense that are taxable or deductible in other years and items that are never taxable or deductible. The group’s current tax is calculated using tax rates that have been enacted by the end of the reporting period.
1.11.2 Deferred tax Deferred tax is recognised on temporary differences arising between the tax bases of assets and liabilities and their carrying amounts in the consolidated financial statements.
Deferred tax liabilities are generally recognised for all taxable temporary differences. Deferred tax assets are generally recognised for all deductible temporary differences to the extent that it is probable that taxable profits will be available against which those deductible temporary differences can be utilised.
Deferred tax is not accounted for if it arises from the initial recognition of an asset or liability in a transaction other than a business combination, that at the time of the transaction affects neither accounting nor taxable profit or loss. Deferred tax liabilities are not recognised if they arise from the initial recognition of goodwill. Deferred tax is not calculated on timing differences of those assets and liabilities that when reversed will be distributed to shareholders.
Deferred tax is determined using tax rates (and laws) that have been enacted or substantively enacted by the period-end and are expected to apply when the related deferred tax asset is realised or the deferred tax liability is settled.
Deferred tax liabilities are provided on taxable temporary differences arising from investments in subsidiaries, associates, joint ventures and joint arrangements, except where the group is able to control the reversal of the temporary difference and that it is probable that the temporary difference will not reverse in the foreseeable future.
Deferred tax assets are recognised on deductible temporary differences arising from investments in subsidiaries, associates, joint ventures and joint arrangements only to the extent that it is probable the temporary difference will reverse in the future and there is sufficient taxable profit available against which the temporary difference can be utilised.
The carrying amount of deferred tax assets is reviewed at the end of each reporting period and reduced to the extent that it is no longer probable that sufficient taxable profits will be available to allow all or part of the asset to be recovered.
Deferred tax assets and liabilities are offset when there is a legally enforceable right to offset current tax assets against current tax liabilities and when the deferred tax assets and liabilities relate to income taxes levied by the same taxation authority on the same taxable entity where there is an intention to settle the balances on a net basis.
1.12 Revenue 1.12.1 Rental income and recoveries Revenue is measured at the fair value of the consideration received or receivable. Revenue comprises revenue from rental income and operating cost recoveries and excludes value added taxation. Rental income is recognised on the straight-line basis over the lease term and recoveries are recognised on the accrual basis. Turnover-based rental is recognised when it is due in terms of the lease agreement and the amount can be measured reliably.
1.12.2 Income from investments Interest income is recognised on a time proportion basis that takes into account the effective yield on the asset.
Dividends are recognised when the shareholder’s right to receive payment has been established and the amount of income can be measured reliably.
1.13 Leases A lease is classified as a finance lease if it transfers substantially all the risks and rewards incidental to ownership. All other leases are classified as operating leases.
1.13.1 The group as lessor – operating leases Contractual rental income is recognised on a straight-line basis over the period of the lease term and rental income based on a percentage of turnover is recognised when due and the amount can be measured reliably.
An adjustment is made to contractual rental income earned to bring to account in the current period, the difference between the rental income to which the group is currently entitled and the rental for the period calculated on a straight-line basis.

>17
1.13 Leases – continued1.13.1 The group as lessor – operating leases – continuedIncome from leases is disclosed under revenue in the statement of profit and loss and other comprehensive income.
Initial direct costs incurred in negotiating and arranging operating leases are added to the carrying amount of the leased asset and recognised as an expense over the lease term on the same basis as the lease income. These include tenant installation costs and commission paid in respect of the securing of leases.
1.13.2 The group as lessee Operating lease payments, which are based on a percentage of rental income, are charged to the statement of profit and loss and other comprehensive income.
1.14 Fair value informationThe group measures financial instruments, such as derivatives and investment properties, at fair value at each reporting date. The fair values of financial instruments measured at amortised cost are disclosed, should it be determined that the carrying value of these instruments does not reasonably approximate their fair value at each reporting date.
1.14.1 Fair value hierarchy The fair value hierarchy reflects the significance of the inputs used in making fair value measurements. The level within which the fair value measurement is categorised in its entirety is determined on the basis of the lowest level input that is significant to the fair value measurement in its entirety. The different levels have been defined as follows: Level 1: Quoted prices (unadjusted) in active markets for identical assets or liabilities Level 2: Input other than quoted prices included within Level 1 that is observable for the asset or liability, either directly (i.e. as prices) or indirectly (i.e. derived from prices)Level 3: Input for the asset or liability that is not based on observable market data (unobservable input)
1.15 Critical estimates and judgements Estimates and judgements are continually evaluated and are based on historical experience and other factors, including expectations of future events, and are believed to be reasonable under the circumstances. Actual results may differ from these estimates. Areas in which estimates and judgements are made include the following:
1.15.1 Investment property In the application of the accounting policies which are described in note 2, management is required to make judgements, estimates and assumptions about the fair value of investment properties that are not readily apparent from other sources. The estimates and associated assumptions are based on historical experience and other factors that are considered to be relevant.
1.15.2 Plant and equipment The group reviews the estimated useful life of the plant and equipment at the end of each reporting period. Judgements regarding the existence of impairment indicators are based on operational performance of the assets. Future events could cause management to conclude that impairment indicators exist.
An estimate is made of the residual amount the group would receive currently for the asset if the asset was already of the age and condition expected at the end of its useful life. If this changes from the prior period, the depreciation charge is adjusted prospectively.
Useful lives of assets are reviewed annually. If these change from the prior period, the depreciation charge is adjusted prospectively. The group uses the following indicators to determine useful lives:
• Expected usage of assets. • Expected physical wear and tear. • Technical or commercial obsolescence.
1.15.3 Trade receivables Trade receivables are initially recognised at fair value and subsequently measured at amortised cost, with gains or losses being recognised in profit or loss. An estimate is made for credit losses based on a review of all outstanding amounts at year-end.
1.15.4 Derivatives The fair values of interest rate swaps are calculated based on the present value of future estimated cash flows, taking into account judgements, estimates and assumptions made by management.
1.15.5 Provisions Provisions are required to be recorded when the group has a present legal or constructive obligation as a result of past events, for which it is probable that an outflow of economic benefits will occur, and where a reliable estimate can be made of the amount of the obligation. Best estimates, being the amount that the group would rationally pay to settle the obligation, are recognised as provisions at the reporting date. 1.15.6 Fair value estimation The fair values of investment properties are determined using current rentals, expected market rentals, maintenance requirements and appropriate capitalisation rates. These valuations are regularly compared to actual transactions by the group and those obtained by the market. Market rentals are determined by reference to current market rentals for similar buildings in the same location and condition.
The fair value of financial instruments that are not traded in an active market is determined by using valuation techniques. The group uses a variety of methods and makes assumptions that are based on market conditions existing at the end of each reporting period. Quoted market prices or dealer quotes for similar instruments are used for long-term debt. Other techniques, such as estimated discounted cash flows, are used to determine fair value for the remaining financial instruments. The fair value of interest rate swaps is calculated as the present value of the estimated future cash flows.
1.15.7 Deferred taxation Deferred tax assets are raised to the extent that it is probable that future taxable profit will be available against which the unused tax losses and unused tax credits can be utilised. An assessment of future taxable profit is performed at every reporting date, in the form of future cash flows using a suitable growth rate. 1.15.8 Business combination versus asset acquisition The directors have assessed the properties acquired and have concluded that, in their view, these acquisitions are property acquisitions in terms of IAS 40 and are therefore accounted for in terms of that standard. In the opinion of the directors, these properties did not constitute a “business” as defined in terms of IFRS 3, as there were no adequate processes identified within these properties to warrant classification as a business.
1.16 Segmental reporting Determination and presentation of operating segments:
The group determines and presents operating segments based on information that is provided internally to the chief operating decision-maker, namely the managing director.
Segment results that are reported to the chief operating decision-maker include items directly attributable to a segment, as well as those that can be allocated on a reasonable basis.
On a primary basis the operations are organised into six major operating segments:
• Industrial • Retail shopping centres• Office • Parking• Retail shops • Residential
The chief operating decision-maker assesses each investment property on an individual basis in making decisions about its performance.
Octodec Investments Limited | Annual Financial Statements 2016

>18
notes to the financial statements – continued for the year ended 31 August 2016
1.17 New standards 1.17.1 Standards adoptedNo new standards were adopted during the year under review.
1.17.2 Standards not yet effective
standard description effective dateIFRS 5: Non-current Assets Held for Sale and Discontinued Operations
Amendments resulting from 2012 – 2014 Annual Improvements Cycle
Annual periods beginning on or after 1 January 2016
IFRS 7: Financial Instruments: Disclosures
Amendments resulting from September 2014 Annual Improvements to IFRSs
Annual periods beginning on or after 1 January 2016
IFRS 9: Financial Instruments Reissue of a complete standard with all the chapters incorporated
Annual periods beginning on or after 1 January 2018
IFRS 10: Consolidated Financial Statements
Amendments on sale or contribution of assets between an investor and its associate or joint venture
Annual periods beginning on or after 1 January 2016
IFRS 10: Consolidated Financial Statements
Amendments related to the application of the investment entities exceptions
Deferred indefinitely
IFRS 11: Joint Arrangements Amendment requiring the acquirer of an interest in a joint operation in which the activity constitutes a business, as defined in IFRS 3: Business Combinations, to apply all of the principles on business combinations accounting in IFRS 3
Annual periods beginning on or after 1 January 2016
IFRS 12: Disclosure of Interests in Other Entities
Amendments related to the application of the investment entities exceptions
Annual periods beginning on or after 1 January 2016
IFRS 15: Revenue from Contracts with Customers
Original issue Annual periods beginning on or after 1 January 2017
IFRS 15: Revenue from Contracts with Customers
Amendments to defer the effective date to 1 January 2018
Annual periods beginning on or after 1 January 2018
IFRS 15: Revenue from Contracts with Customers
Clarifications to IFRS 15 Annual periods beginning on or after 1 January 2018
IFRS 16: Leases New standard setting out the principles for the recognition, measurement, preparation and disclosure of leases
Annual periods beginning on or after 1 January 2019
IAS 1: Presentation of Financial Statements
Amendments arising under the Disclosure Initiative Annual periods beginning on or after 1 January 2016
IAS 7: Statement of Cash Flows Amendments arising under the Disclosure Initiative Annual periods beginning on or after 1 January 2017
IAS 12: Deferred Taxes Amendments to the recognition of Deferred Tax Assets for Unrealised Losses
Annual periods beginning on or after 1 January 2017
IAS 16: Property, Plant and Equipment Amendments resulting from clarification of acceptable methods of depreciation and amortisation (Amendments to IAS 16 and IAS 38)
Annual periods beginning on or after 1 January 2016
IAS 16: Property, Plant and Equipment Amendments to include ‘bearer plants’ within the scope of IAS 16 rather than IAS 41
Annual periods beginning on or after 1 January 2016
IAS 19: Employee Benefits Amendments resulting from 2012 – 2014 Annual Improvements Cycle
Annual periods beginning on or after 1 January 2016
IAS 27: Separate Financial Statements Amendments relating to equity method in separate financial statements
Annual periods beginning on or after 1 January 2016
IAS 28: Investments in Associates and Joint Ventures
Amendments on sale or contribution of assets between an investor and its associate or joint venture
Annual periods beginning on or after 1 January 2016
IAS 28: Investments in Associates and Joint Ventures
Amendments related to the application of the investment entities exceptions
Deferred indefinitely
IAS 34: Interim Financial Reporting Amendments resulting from 2012 – 2014 Annual Improvements Cycle
Annual periods beginning on or after 1 January 2016
Management have considered the above new standards and amendments to existing standards and believe that the above will not have a material impact on the group.

>19
consolidated company2016
R’0002015
R’0002016
R’0002015
R’000Notes 2. Investment propertyDeveloped 11 300 939 10 652 898 937 818 952 084 Under development 475 900 612 433 135 559 47 685
11 776 839 11 265 331 1 073 377 999 769 The group’s investment properties are leased out under operating leases.
2.1 Reconciliation of investment property – developedCarrying value at beginning of year 10 652 898 3 258 932 952 084 891 679 Acquisitions – 19 138 – 8 033 Refurbishments 178 923 160 105 11 534 42 023 Disposals (46 233) (16 107) (8 968) (16 107)Additions through business combination – 6 734 665 – – Transferred from under development 340 210 – – – Fair value changes 336 093 496 165 36 175 26 456 Transfer to non–current assets held for sale (160 952) – (53 007) –
11 300 939 10 652 898 937 818 952 084
2.2 Reconciliation of investment property – under developmentCarrying value at beginning of year 612 433 169 416 47 685 – Acquisitions 31 537 90 268 31 537 46 263 Upgrades and developments including borrowing costs 232 525 207 380 63 937 1 422 Additions through business combination – 155 480 – – Transferred to developed (340 210) – – – Fair value changes (60 385) (10 111) (7 600) –
475 900 612 433 135 559 47 685
2.3 Reconciliation of valuation to carrying value – investment propertyValuations at end of year 12 129 631 11 449 157 1 146 058 1 016 220 Less:Straight–line rental income accrual Note 3 (115 849) (114 773) (14 138) (14 150)Plant and equipment Note 4 (6 810) (8 646) (40) (71)Tenant installation and lease costs Note 5 (57 133) (60 407) (2 003) (2 230)Transferred to non–current assets held for sale Note 13 (173 000) – (56 500) –Carrying amount at end of year 11 776 839 11 265 331 1 073 377 999 769
The investment properties are valued bi–annually by management of City Property and the portfolio valuation is reviewed by the investment committee and approved by the board.
Over a three-year cycle, all properties are valued on a rotational basis by independent external valuers. Van Zyl Valuers CC (Gert van Zyl), Amanda de Wet Consultants and Investors CC (Amanda de Wet) and Quadrant Properties Proprietary Limited(Peter Parfitt) are registered valuers in terms of section 19 of the Property Valuers Profession Act, 47 of 2000 and have extensive experience in property valuations. The valuers’ portfolio valuation at 31 August 2016 of R3.1 billion, representing 25.3% of the portfolio, was 0.7% more (2015: 0.6%) than the directors’ portfolio valuation. The directors are confident, taking all factors into account, that their valuations represent fair market value.
Investment property amounting to R315 million (2015: R335 million) currently under development is stated at cost due to the difficulty in determining a reliable fair value.
2.4 Fair value informationThe fair value of the group’s investment property as at 31 August 2016 was arrived at on the basis of a valuation technique using the net income capitalisation method, by taking into account prevailing market rentals, occupation levels and capitalisation rates. The range of annual capitalisation rates applied to the property portfolio is between 8.0% (2015: 8.0%) and 12.0% (2015: 14.0%) with a weighted annual average of 9.2% (2015: 9.3%).
The second key input used in the valuation calculation is the long-term net operating income margin, of which the expense ratio is the significant unobservable input. Expense ratios used ranged from 5.9% to 58.5% (2015: 5.7% to 78.0%) with a weighted average of 24.2% (2015: 24.9%).
The third key input used in the valuation calculation is the long –range vacancy factor. The expected long –range vacancy factor takes into account historic and future vacancy trends. The long –range vacancy factor indicates the expected vacancy to be applied over the long term that best approximates the actual experience. The long –range vacancy factor used ranged from 0.0% to 40.0% (2015: 0.0% to 55.0%) with a weighted average of 4.8% (2015: 5.8%).
In estimating the fair value of the properties the highest and best use is taken into account.
There have been no changes in judgements or estimates of amounts or valuation techniques from the previous reporting periods.
Investment property has been categorised as a Level 3 and there have been no transfers made between Level 1, 2 or 3 during the year under review. (Refer to the fair value information in accounting policies.)
Octodec Investments Limited | Annual Financial Statements 2016

>20
consolidated company2016
R’0002015
R’0002016
R’0002015
R’000
2. Investment property – continued2.4 Fair value information – continuedRelationship of unobservable inputs to fair valueAn increase of 1% in the capitalisation rate while all other inputs remain constant would result in a decrease in the carrying amount of investment property of R1.2 billion (2015: R1.1 billion). A decrease of 1% in the capitalisation rate while all other inputs remain constant would result in an increase in the carrying amount of investment property of R1.5 billion (2015: R1.4 billion).
An increase/decrease of 1% in the weighted average of the expense ratios used to calculate the long–term net operating income margin while all other inputs remain constant would result in an increase/decrease in the carrying amount of investment property of R158.0 million (2015: R149.8 million).
Reconciliation of fair value changes to investment propertyInvestment property – developed 336 093 496 265 36 175 26 456Investment property – under development (60 385) (10 111) (7 600) – Non-current assets held for sale 10 206 – 2 890
285 914 486 054 31 465 26 456
2.5 Investment property pledged as securityThe group has encumbered certain of its investment properties to secure mortgage loan facilities as set out in note 16. There are no other restrictions on the realisability of investment property or distribution of its income.
2.6 Investment property held under operating leasesWoodmead Value Mart and Intersite are situated on leasehold land and classified as investment property. The lease of Woodmead Value Mart commenced in April 1995. The term of the lease is 40 years and is renewable for a further 40 years at the election of Woodmead Value Mart Proprietary Limited, a subsidiary of the group. The lease of Intersite commenced in September 1996 for a period of 50 years.
A schedule of investment properties owned by the group is set out on pages 41 to 47.
3. Straight-line rental income accrualCarrying value at beginning of year 114 773 43 159 14 150 12 500 Net movement during the year 2 567 4 930 591 1 650Additions through business combination – 66 684 – – Disposals (73) – – – Transferred to non-current assets held for sale (1 418) – (603) –
115 849 114 773 14 138 14 150
4. Plant and equipmentCost 31 839 31 901 824 824 Accumulated depreciation (25 029) (23 255) (784) (753)Carrying value 6 810 8 646 40 71
Movement during the year:Carrying value at beginning of year 8 646 3 677 71 120 Additions through business combination – 7 401 – – Additions 312 – – – Transferred to non-current assets held for sale (374) – – – Depreciation charge net of disposals (1 774) (2 432) (31) (49)
6 810 8 646 40 71
Plant and equipment which forms an integral part of investment property is pledged as security as per note 2.5.
notes to the financial statements – continued for the year ended 31 August 2016

consolidated company2016
R’0002015
R’0002016
R’0002015
R’000
6. Investment in subsidiariesShares at cost 3 057 990 3 057 990Net amounts due by subsidiaries 2 897 931 1 697 352 Amounts due by subsidiaries 2 897 965 1 860 668 Amounts owed to subsidiaries (34) (163 316)
5 955 921 4 755 342
A schedule of the company’s interest in subsidiaries is set out on pages 50 to 51.
The group has pledged and ceded the shares and loan accounts of certain of its subsidiary companies to secure banking facilities granted to the group (refer note 16).
7. Investment in joint venturesEquity accountedCost of investment 1 1 Loans to joint ventures 128 187 127 178 Additions through business combination – 11 784 Reserves since acquisition 44 394 22 351
172 582 161 314 A loan of R80 600 000 bears interest at prime plus 1% per annum and a loan of R9 587 765 bears interest at 16% per annum. The remaining loans are interest free.
5. Tenant installation and lease costsCarrying value at beginning of year 60 407 33 181 2 230 2 442 Additions 15 526 25 550 944 1 231 Additions through business combination – 24 198 – – Transferred to non-current assets held for sale (50) – – – Amortisation (18 750) (22 522) (1 171) (1 443)
57 133 60 407 2 003 2 230
Proportion of ownership interest/voting rights held by the group 2016 2015% %
Name of joint ventureGerlan Properties Proprietary Limited 50 50Jardtal Properties Proprietary Limited 50 50Prensas Properties Proprietary Limited 50 50
The joint ventures are property investment companies deriving income from rentals.
The companies are all incorporated in the Republic of South Africa.
All the above joint ventures are accounted for using the equity method in the consolidated financial statements. Octodec has the right to cast 50% of the voting rights at shareholder meetings for each of the above joint ventures. The financial year-end of Jardtal Properties Proprietary Limited and Prensas Properties Proprietary Limited is 31 August. The financial year-end of Gerlan Properties Proprietary Limited (Gerlan) is 30 June. A change of reporting date is not possible as this is the same year-end as Bidvest Group Limited, the joint venture partner and manager of Gerlan. For the purposes of applying the equity method of accounting, the financial statements of Gerlan for the year ended 30 June 2016 have been used, and appropriate adjustments have been made for the effects of significant transactions between that date and 31 August 2016.
>21
Octodec Investments Limited | Annual Financial Statements 2016

>22
notes to the financial statements – continuedfor the year ended 31 August 2016
consolidated company2016
R’0002015
R’0002016
R’0002015
R’000
7. Investment in joint ventures – continued7.1 Summarised financial information of the joint ventures as at 31 August 2016The summarised financial information below represents amounts shown in the joint ventures’ financial statements prepared in accordance with IFRS.
As the financial information for each joint venture is not individually material when compared as a percentage to the group’s total assets, the financial information is disclosed in aggregate.
Aggregate information of joint ventures that are not individually materialAssetsNon-current 477 200 448 520Investment property 467 073 438 754Straight-line rental income accrual 8 771 8 021Plant and equipment – 23Tenant installations and lease costs 1 356 1 722
Current 15 333 3 094Trade and other receivables 15 330 2 983Taxation receivable – 108Cash and cash equivalents 3 3
492 533 451 614
Equity and liabilitiesEquity 88 788 68 271Share capital 5 768 5 768Non-distributable reserve 94 787 77 033Accumulated loss (11 767) (14 530)
Non-current liabilities 287 767 371 589Shareholder loan accounts 110 712 183 898Long-term borrowings 167 277 178 723Derivative financial instruments 1 079 – Deferred taxation 8 699 8 968
Current liabilities 115 978 11 754Trade and other payables 13 321 11 754Short-term borrowings 22 057 – Shareholder loan accounts 80 600 –
492 533 451 614
Results of operations – 12 months ended 31 August 2016Revenue 68 698 62 933Profit for the year 24 414 44 702Other comprehensive income for the year – – Total comprehensive income for the year 24 414 44 702
The above profit for the year includes the following:Depreciation and amortisation 298 289Interest income 473 362Interest expense 28 739 26 838Income tax expense 1 394 771
7.2 Reconciliation of the above summarised financial information to carrying amount of the interest in joint venturesNet assets of the joint ventures 88 788 68 27150% proportion of the group's interest in the joint ventures 44 395 34 136Loans to joint ventures 128 187 127 178Carrying amount of the group's interest in joint ventures 172 582 161 314
7.3 Commitments and contingencies of joint venturesThe group has signed sureties for R190.5 million (2015: R190.5 million) for Jardtal Properties Proprietary Limited andR11 million (2015: R11 million) for Prensas Properties Proprietary Limited for loan facilities provided by Nedbank Limited.
The group has commitments of R39 000 (2015: R7.0 million) in respect of capital expenditure relating to the upgrade of certain properties in the name of the joint ventures. These development costs will be funded by way of existing bank facilities.

>23
consolidated company2016
R’0002015
R’0002016
R’0002015
R’000
8. Joint operationThe Manhattan (50% interest)Included in the assets and liabilities of Octodec is the undivided half share of the immovable property development comprising 180 residential units in Sunninghill, Gauteng, South Africa which was acquired on 13 May 2015. The other 50% undivided share is owned by Burcress Proprietary Limited. Non-current assets- Investment property 76 222 11 653 76 222 11 653
Non-current borrowings 71 339 9 131 71 339 9 131 Current liabilities 4 883 2 261 4 883 2 261
76 222 11 392 76 222 11 392
9. Other financial assetsLoan to joint operation partner 51 849 – 51 849 – The loan to the joint operation partner is secured by a mortgage bond over their 50% share of the immovable property and bears interest at prime overdraft rate less 0.5% per annum and is repayable by no later than the third anniversary of the Pre–Let Date (the earlier of: the first anniversary of the date of completion of the development and the date upon which the property is 98% let.) The Pre–Let Date is not expected to occur within the next twelve months.
The group has a commitment to fund the joint operation partner to a maximum of R75 million.
10. Derivative financial instrumentsInterest rate derivativesCarrying value at beginning of year 11 673 (13 797) 21 568 (13 797)Additions through business combination – (23 785) – –Fair value changes 17 191 49 255 3 108 35 365
28 864 11 673 24 676 21 568 Reconciliation to statement of financial positionDerivative financial instrumentsNon-current assets 38 172 34 451 33 851 21 568Non-current liabilities (9 308) (22 778) (9 175) –
28 864 11 673 24 676 21 568 The notional principal amount of the outstanding contracts for the group at year–end was R4.8 billion (2015: R3.6 billion) and for the company R4.3 billion (2015: R2.1 billion). Fair value information The fair values of the interest rate swaps are determined on a mark–to–market valuation calculated by discounting the estimated future cash flows based on the terms and maturity of each contract and using the market interest rate indicated on the SA swap curve. Fair value hierarchy Derivative financial instruments have been categorised as a Level 2 and there have been no significant transfers made between Level 1, 2 or 3 during the year under review.
11. Trade and other receivablesNet trade receivables 40 356 24 656 1 859 1 254 Trade receivables 57 436 37 584 3 807 1 716Less: Provision for impairment (17 080) (12 928) (1 948) (462)Other receivables– utility and assessment rate recoveries 62 660 63 854 9 496 10 151 Other receivables– assessment rate refunds 12 992 – 484 – Sundry receivables 9 014 5 376 585 865
125 022 93 886 12 424 12 270Payments in advance 6 530 8 936 1 008 1 929
131 552 102 822 13 432 14 199All trade and other receivables are short–term in nature. Interest is charged at prime plus 4% (2015: 4%) on arrear tenant balances if appropriate.
Octodec Investments Limited | Annual Financial Statements 2016

>24
notes to the financial statements – continuedfor the year ended 31 August 2016
consolidated company2016
R’0002015
R’0002016
R’0002015
R’000
13. Non-current assets held for saleReconciliation of investment property held for saleTransferred from investment property 160 952 – 53 007 – Transferred from straight-line rental income accrual 1 418 – 603 – Transferred from tenant installation and lease costs 50 – – – Transferred from plant and equipment 374 – – – Fair value changes 10 206 – 2 890 – Carrying value at the end of the year 173 000 – 56 500 – A decision was made by the board to dispose of 32 non-core or underperforming investment properties. The non-current assets will be sold piecemeal and the properties are expected to be disposed of by August 2017.
The properties classified as held for sale are valued using the net income capitalisation method as detailed in note 2.4 except for those where a firm offerhas been received in which case it is valued at the offer value.
14. Stated capitalAuthorised500 000 000 ordinary shares of no par value 500 000 500 000 500 000 500 000
Issued254 551 320 (2015: 252 321 784) ordinary shares of no par value Carrying value at beginning of year 3 907 819 918 478 3 907 819 918 4782015: Issue of 119 055 519 ordinary shares of no par value – 2 601 324 – 2 601 324 2015: Issue of 15 918 367 ordinary shares of no par value in terms of a bookbuild – 388 017 – 388 017 2016: Issue of 2 229 536 ordinary shares of no par value in terms of a dividend reinvestment programme 50 388 – 50 388 –
3 958 207 3 907 819 3 958 207 3 907 819The unissued ordinary shares are under the control of the directors and subject to the conditions of the company’s memorandum of incorporation the JSE Listings Requirements and the Act. This authority remains in force until the company’s next annual general meeting. All shares are fully paid up.
15. Non-distributable reserveCapital reserve arising on disposal of investment property 23 202 14 712 11 239 11 087Fair value changes to investment property 2 151 680 1 865 766 621 808 590 343Fair value changes to derivative financial instruments 44 662 32 284 17 151 14 913Fair value changes to joint venture reserves 25 954 19 082 – – Additions through business combination 867 387 867 387 192 512 192 512
3 112 885 2 799 231 842 710 808 855
12. Cash and cash equivalentsCash and cash equivalents consist of:Cash on hand and bank balances 27 063 21 044 18 108 29 085
Cash and cash equivalents held by the entity that are not available for use by the group:Bank account held for tenant deposits 42 046 34 225 42 046 34 225
69 109 55 269 60 154 63 310

>25
consolidated companyInterest rate%
Expirydate
2016R’000
2015R’000
2016R’000
2015R’000
16. Borrowings16.1 Loans at amortised costSecured loansNedbank LimitedLoan 1 Prime less 2.15 9 September 2015 – 93 092 – – Loan 2 Prime less 2.15 9 September 2015 – 7 631 – – Loan 3 Prime less 1.65 9 September 2015 – 13 528 – – Loan 4 Prime less 1.00 9 September 2015 – 39 992 – 39 992 Loan 5 Prime less 2.15 1 September 2015 – 1 912 – – Loan 6 Prime less 1.00 2 November 2015 – 124 480 – – Loan 7 1-month JIBAR plus 1.55 1 December 2015 – 138 081 – – Loan 8 Prime less 2.15 1 December 2015 – 7 699 – – Loan 9 1-month JIBAR plus 1.53 1 December 2015 – 2 966 – – Loan 10 Prime less 1.00 1 December 2015 – 77 557 – – Loan 11 Prime less 1.00 1 December 2015 – 21 996 – – Loan 12 Prime less 1.65 1 February 2016 – 1 168 – 1 168 Loan 13 Prime less 1.65 1 February 2016 – 3 792 – 3 792 Loan 14 Prime less 1.65 1 February 2016 – 3 437 – 3 437 Loan 15 Prime less 1.65 1 February 2016 – 378 – 378 Loan 16 Prime less 1.00 1 February 2016 – 68 997 – 68 997 Loan 17 Prime less 2.15 1 February 2016 – 1 386 – 1 386 Loan 18 Prime less 1.30 3 May 2016 – 59 992 – 59 992 Loan 19 1-month JIBAR plus 1.85 2 May 2019 287 251 262 499 – – Loan 20 Prime less 1.63 2 May 2019 174 634 160 757 – – Loan 21 Prime less 1.77 2 May 2019 334 282 345 565 – – Loan 22 Prime less 1.67 2 May 2019 378 734 318 564 – – Loan 23 Prime less 2.15 2 May 2019 24 340 24 341 – – Loan 24 Prime less 2.15 2 May 2019 30 167 30 167 – – Loan 25 Fixed at 12.15 2 May 2018 160 000 160 000 – – Loan 26 Prime less 2.15 2 May 2018 25 552 25 552 – – Loan 27 Fixed at 12.06 2 May 2018 40 580 40 580 – – Loan 28 Fixed at 12.06 2 May 2018 100 000 100 000 – – Loan 29 Prime less 2.15 1 June 2018 30 000 30 000 – – Loan 30 Prime less 2.15 2 July 2018 790 790 – – Loan 31 Prime less 1.77 3 September 2018 277 975 226 361 277 975 226 361 Loan 32 Prime less 1.79 1 October 2018 74 988 74 988 – – Loan 33 Fixed at 11.72 1 October 2018 75 000 75 000 – – Loan 34 Fixed at 11.01 1 November 2018 36 400 36 400 – – Loan 35 Prime less 1.65 3 December 2018 50 697 50 697 50 697 50 697 Loan 36 Prime less 1.67 3 December 2018 16 369 16 369 – – Loan 37 Prime less 1.67 1 February 2019 4 738 4 738 – – Loan 38 Prime less 2.15 1 March 2019 30 950 31 148 – – Loan 39 Prime less 2.00 3 June 2019 27 726 27 726 – – Loan 40 Prime less 1.00 1 March 2018 34 385 34 385 – – Loan 41 Prime less 1.63 2 May 2019 537 578 – 537 578 – Loan 42 Prime less 1.26 3 February 2020 245 406 – 245 406 –
Standard Bank of South Africa LimitedLoan A Prime less 1.92 15 August 2016 – 115 024 – – Loan B Prime less 1.92 30 September 2016 – 88 898 – – Loan C Prime less 1.75 31 October 2016 – 337 684 – – Loan D Prime less 1.70 31 August 2019 118 912 118 909 118 912 118 909 Loan E Prime less 1.45 31 August 2019 52 013 62 014 52 013 62 014 Loan F 3-month JIBAR plus 1.52 31 December 2017 233 255 233 042 233 255 233 041 Loan G Prime less 1.92 31 August 2019 115 027 – 115 027 – Loan H Prime less 1.92 31 August 2019 88 901 – 88 901 – Loan I Prime less 1.45 31 August 2020 277 682 – 277 681 – Loan J Prime less 1.55 27 November 2018 139 579 – 139 579 –
4 023 911 3 700 282 2 137 025 870 164
Octodec Investments Limited | Annual Financial Statements 2016

>26
notes to the financial statements – continuedfor the year ended 31 August 2016
consolidated companyInterest rate% Expiry date
2016R’000
2015R’000
2016R’000
2015R’000
16. Borrowings – continued16.1 Loans atamortised costUnsecured loansDomestic medium-term note programme (DMTN)PMM 16 – issuance 6 months Fixed at 7.225 2 September 2015 – 160 000 – – PMM 17 – issuance 12 months 3-month JIBAR plus 1.20 6 March 2016 – 265 000 – – PMM 18 – issuance 6 months 3-month JIBAR plus 0.90 4 November 2015 – 194 000 – – PMM 19 – issuance 12 months 3-month JIBAR plus 1.30 13 May 2016 – 50 000 – – PMM 21 – issuance 12 months 3-month JIBAR plus 1.30 2 September 2016 95 000 – – – PMM 23 – issuance 6 months 3-month JIBAR plus 1.00 2 September 2016 55 000 – – – PMM 24 – issuance 6 months 3-month JIBAR plus 1.00 7 September 2016 55 000 – – – PMM 25 – issuance 12 months 3-month JIBAR plus 1.35 7 March 2017 209 856 – – – PMM 26 – issuance 6 months 3-month JIBAR plus 1.10 4 November 2016 259 948 – – – PMM 27 – issuance 6 months 3-month JIBAR plus 1.10 25 November 2016 69 985 – – – Accrued interest 10 327 11 591 – –
755 116 680 591
4 779 027 4 380 873 2 137 025 870 164
Reconciliation to statement of financial positionNon-current 4 023 911 2 917 174 2 137 025 691 023 Current 755 116 1 463 699 – 179 141
4 779 027 4 380 873 2 137 025 870 164
The group has R633 million undrawn debt facilities available on demand as at 31 August 2016. The facilities are secured by mortgage bonds over various properties with a fair value of R10.7 billion (2015: R9.7 billion), and cession of shares from certain subsidiaries.
2016 Loans 1 to 18 were consolidated into loans 41 and 42 on expiry in the name of Octodec. Loans A, B and C were consolidated into loans G, H and I in the name of Octodec. PMM 21 and 23 have since been refinanced by PMM 28 for R65 million maturing 2 March 2017 and PMM 29 for R119 million maturing 4 September 2017. PMM 24 has since been partially refinanced by PMM 30 for R50 million maturing on 7 September 2017.PMM 26 has been partially refinanced by PMM 31 for R253 million maturing on 4 May 2017.
2015PMM 16 has since been partially refinanced by PMM 20 for R55 million maturing 2 March 2016 and PMM 21 for R95 million maturing2 September 2016. PMM 18 has since been partially refinanced by PMM 22 for R185 million maturing on 4 May 2016.
The fair values of the fixed interest rate loans were determined using the discounted cash flow method. The average annual interest rate used to discount the cash flows on the fixed interest loans was 9.76% (2015: 9.60%), based on the quoted swap rate at year-end for loans with similar maturities. The average credit risk margin used was 1.46% (2015: 1.25%) based on the group’s most recent fixed-rate loan agreements with Nedbank Limited. The fair value of long-term loans have been categorised as a Level 2 and there have been no transfers made between Level 1, 2 or 3 during the year under review.
consolidated2016 2015
Carrying value
Fair value
Carrying value
Fair value
R’000 R’000 R’000 R’000
16.2 Fair value of long-term loansLoans at fixed interest ratesNedbank Limited 411 980 426 441 411 980 435 279

>27
20. RevenueRental income 1 349 946 1 278 449 114 140 105 722Once-off reinstatement contribution from tenant 25 000 – – – Turnover rental income 2 068 2 137 334 17 Straight-line rental income accrual 2 567 4 930 591 1 651Recoveries and other income 390 857 353 573 48 053 42 838
1 770 438 1 639 089 163 118 150 228
21. Net operating profitNet operating profit is arrived at after taking the following items into account:Auditors’ remunerationExternal audit fee 2 693 3 631 2 693 2 769External audit – other services – 242 – 115Internal audit fees 859 941 859 941 Fees for servicesManagement fees 50 044 51 915 50 044 51 915Collections fees 116 190 109 007 9 482 8 728Commissions 13 408 13 455 1 003 1 206OtherDepreciation of plant and equipment 1 774 2 432 31 49Amortisation of tenant installation and lease costs 18 750 22 522 1 171 1 443Reversal of provision for losses in subsidiaries – – – (446)Reversal of impairment of loans (378) – – –Operating lease – minimum lease payments 1 045 1 045 – –Operating lease – contingent 4 940 4 460 104 78Employee costs 29 206 27 643 2 912 2 621Directors' emoluments 5 596 5 060 5 596 5 060Repairs and maintenance 63 879 59 516 4 763 4 470
22. Interest incomeTenants 6 617 5 003 587 536Bank 1 183 619 474 284 Loans and sundry receivables 2 338 331 2 202 141
10 138 5 953 3 263 961
18. Trade and other payablesTrade payables 58 998 87 143 11 220 7 826Tenant deposits 92 714 86 223 12 154 8 063Accrued expenses – utilities and assessment rates 63 222 56 346 2 797 4 348Accrued expenses – repairs and maintenance 9 972 13 453 974 1 187Other payables 88 151 69 597 15 994 18 254
313 057 312 762 43 139 39 678VAT payable 2 641 22 454 144 –
315 698 335 216 43 283 39 678The group has financial policies in place to ensure that all payables are paid within the credit framework. Amounts are settled within payment terms to ensure that no interest is payable.
19. Bank overdraftThe group's overdraft is unsecured and bears interest at the prime overdraft rate.
The group overdraft facilities of R45.5 million (2015: R45.5 million) are reviewable on an annual basis.
consolidated company2016
R’0002015
R’0002016
R’0002015
R’000
17. Deferred taxationThe deferred tax liability arises from the following temporary differences:Tax losses available for set-off against future taxable income (133 608) (128 538) (7 619) (6 749)Building allowances – pre conversion to a REIT 178 943 178 943 – – Wear and tear allowance 19 574 19 311 710 710Fair value changes – interest rate derivatives 8 080 3 269 6 909 6 039
72 989 72 985 – – Reconciliation of movement for the yearCarrying value at beginning of year 72 985 7 103 – – Additions through business combinations – 62 701 – – Tax losses available for set-off against future taxable income (5 070) (17 608) (870) (2 975)Wear and tear allowance 263 17 520 – 94 Fair value changes – derivative financial instruments 4 811 3 269 870 6 039Other allowances – – – (3 158)
72 989 72 985 – – A REIT cannot claim building allowances. Allowances claimed in previous years will be recouped on sale of the investment properties where applicable. The deferred tax liability was therefore retained.
Octodec Investments Limited | Annual Financial Statements 2016

>28
notes to the financial statements – continuedfor the year ended 31 August 2016
25. Finance costsInterest rate derivatives 15 602 39 082 5 906 17 699Borrowings 400 578 356 079 157 316 68 005Other suppliers 479 889 – 548 Less: Interest capitalised (21 908) (19 559) (4 883) (2 030)
394 751 376 491 158 339 84 222
26. TaxationCurrent taxation – 15 – (35)Deferred taxation – (3 181) – –
– (3 166) – (35)
Reconciliation of the income tax expense for the year to accounting profitProfit before tax 857 162 1 340 894 542 509 515 339 Income tax expense calculated at 28% (2015: 28%) 240 005 375 450 151 903 144 295 Non-taxable income – fair value changes (100 167) (246 997) (10 069) (14 891)Non-taxable equity income (2 784)Non-deductible expenses 7 207 6 105 1 558 728 Amounts not credited to the statement of profit and loss and other comprehensive income 10 871 10 874 803 962 Allowances (12 710) 4 658 (867) (716) Wear and tear (7 797) 8 065 (279) (144) Provision for doubtful debts (1 196) (905) (136) (32) Prepaid expenses (1 828) (2 502) (282) (540) Finance costs (1 889) – (170) –Reversal of allowances/deductions granted in previous years 3 398 (6 359) 573 27Capital gain (2 377) (42)Qualifying distribution (143 010) (129 355) (143 010) (129 355)Assessed losses utilised/limited (433) (11 195) (2 007) (1 050)Prior period adjustment to deferred tax – (15) 1 158 35
– 3 166 – 35
Effective tax rate 0.0% 0.2% 0.0% 0.0%The group and company have tax losses amounting to R591.2 million (2015: R594.1 million) (company R44.3 million (2015: R44.3 million)) which can be utilised against future taxable income.
27. Leases27.1 As lessorNon–cancellable rental lease agreements Less than one year 891 701 917 699 103 511 86 452 Later than one year and not later than five years 1 024 558 1 110 881 162 377 141 291 Later than five years 63 569 93 560 28 030 39 367
1 979 828 2 122 140 293 918 267 110
Rental receivable represents contractual rental income excluding other recoveries for leases in existence at year–end.
Leases are entered into for an average period of between 1 and 10 years. Residential leases are for a 12-month period and provide for a monthly agreement at expiry.
23. Income from subsidiariesDividends received 630 680 518 687 Interest received 14 715 –
645 395 518 687
24. Income from joint venturesManagement fees 700 567 Interest received 10 317 9 657 Equity accounted earnings 9 881 22 351 Share of earnings 3 009 3 269 Share of fair value change to investment property 6 872 19 082
20 898 32 575
consolidated company2016
R’0002015
R’0002016
R’0002015
R’000

>29
28. Earnings, headline earnings and distributable earnings per share (cents)The calculation of basic earnings per share is based on net income attributable to shareholders and the number of shares in issue during the year.
Actual number of shares in issue (000) 254 551 252 322Weighted number of shares in issue (000) 252 888 238 148
Cents CentsBasic earnings per share 338.9 561.7 Diluted earnings per share 336.7 530.2 Basic headline earnings per share 218.2 203.3 Diluted headline earnings per share 219.7 215.4 Distribution per share 201.5 189.2
Given the nature of its business, Octodec uses dividend per share as its key performance measure, as it is considered a more relevant performance measure than earnings or headline earnings per share.
29. Cash generated from operationsProfit before taxation 857 162 1 340 894 542 509 515 339Adjusted for:Straight–line rental income accrual (2 567) (4 930) (591) (1 650)Fair value changes of investment property (285 914) (486 054) (31 465) (26 456)Fair value changes of interest rate derivatives (17 191) (49 255) (3 108) (35 365)(Profit)/loss on disposal of investment property (8 490) 61 (152) 61Reversal of impairment of loans (378) – – – Gain on bargain purchase – (319 647) – – Finance costs 394 751 376 491 158 339 84 222Investment income (31 036) (38 528) (648 658) (519 648)Depreciation and amortisation 20 524 24 954 1 202 1 492Operating income before working capital changes 926 861 843 986 18 076 17 995(Increase)/decrease in trade and other receivables (28 730) (9 024) 767 16 275(Decrease)/increase in trade and other payables (19 518) 46 538 3 605 13 436
878 613 881 500 22 448 47 706
29.1 Dividends paidAmounts unpaid at the beginning of the year (3 482) (102 210) (1 815) (102 210)Additions through business combination – (127 143) – – Amounts charged to the statement of changes in equity (481 429) (228 839) (481 429) (228 839)Amounts unpaid at the end of the year 2 073 3 482 1 332 1 815
(482 838) (454 710) (481 912) (329 234)
29.2 Taxation paidAmounts unpaid/(receivable) at the beginning of the year – (49) – 34Amounts charged to the statement of profit and loss and other comprehensive income – 15 – (35)
– (34) – (1)
Reconciliation of earnings to headline earningsProfit after taxation 857 162 1 337 728Adjusted for:(Profit)/loss on sale of investment property (8 490) 61Gain on bargain purchase – (319 647)Reversal of impairment of loans (378) – Fair value changes Investment property (285 914) (486 054) Investment property – joint ventures (6 872) (19 082)
Headline earnings attributable to shareholdersReconciliation of headline earnings to distributable earnings
555 508 513 006
Fair value adjustments Interest rate derivatives (17 191) (45 987)Straight-line rental income accrual (2 567) (4 930)Deferred taxation adjustment – (87)Once-off reinstatement contribution from tenant (25 000) – Distributable earnings attributable to shareholders 510 750 462 002
Octodec Investments Limited | Annual Financial Statements 2016
consolidated company2016
R’0002015
R’0002016
R’0002015
R’000
27. Leases – continued27.2 As lesseeFuture minimum lease payments Within one year 1 046 1 046 Two to five years 4 183 4 183 More than five years 51 009 52 055
56 238 57 284The land leases above relate to Woodmead Value Mart and Intersite and will be funded from the proceeds of rental income. The lease contracts provide for the greater of the future minimum lease payment and 23.9% of gross monthly rental in respect of Woodmead Value Mart and 6% in respect of Intersite. The lease of Woodmead Value Mart has an option to be renewed for another 40 years.
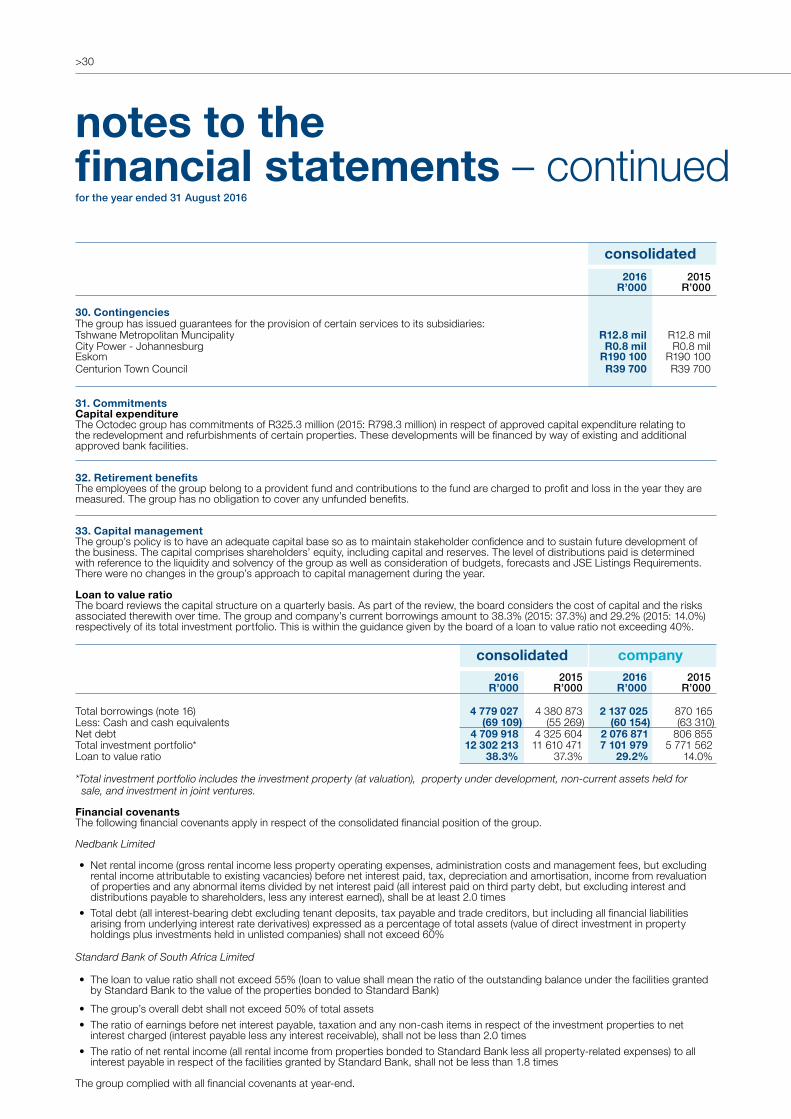
>30
notes to the financial statements – continuedfor the year ended 31 August 2016
*Total investment portfolio includes the investment property (at valuation), property under development, non-current assets held for sale, and investment in joint ventures.
Financial covenantsThe following financial covenants apply in respect of the consolidated financial position of the group.
Nedbank Limited
• Net rental income (gross rental income less property operating expenses, administration costs and management fees, but excluding rental income attributable to existing vacancies) before net interest paid, tax, depreciation and amortisation, income from revaluation of properties and any abnormal items divided by net interest paid (all interest paid on third party debt, but excluding interest and distributions payable to shareholders, less any interest earned), shall be at least 2.0 times
• Total debt (all interest-bearing debt excluding tenant deposits, tax payable and trade creditors, but including all financial liabilities arising from underlying interest rate derivatives) expressed as a percentage of total assets (value of direct investment in property holdings plus investments held in unlisted companies) shall not exceed 60%
Standard Bank of South Africa Limited
• The loan to value ratio shall not exceed 55% (loan to value shall mean the ratio of the outstanding balance under the facilities granted by Standard Bank to the value of the properties bonded to Standard Bank)
• The group’s overall debt shall not exceed 50% of total assets • The ratio of earnings before net interest payable, taxation and any non-cash items in respect of the investment properties to net
interest charged (interest payable less any interest receivable), shall not be less than 2.0 times • The ratio of net rental income (all rental income from properties bonded to Standard Bank less all property-related expenses) to all
interest payable in respect of the facilities granted by Standard Bank, shall not be less than 1.8 times
The group complied with all financial covenants at year-end.
consolidated company2016
R’0002015
R’0002016
R’0002015
R’000
Total borrowings (note 16) 4 779 027 4 380 873 2 137 025 870 165 Less: Cash and cash equivalents (69 109) (55 269) (60 154) (63 310)Net debt 4 709 918 4 325 604 2 076 871 806 855 Total investment portfolio* 12 302 213 11 610 471 7 101 979 5 771 562 Loan to value ratio 38.3% 37.3% 29.2% 14.0%
consolidated2016
R’0002015
R’000
30. ContingenciesThe group has issued guarantees for the provision of certain services to its subsidiaries: Tshwane Metropolitan Muncipality R12.8 mil R12.8 milCity Power - Johannesburg R0.8 mil R0.8 milEskom R190 100 R190 100Centurion Town Council R39 700 R39 700
31. CommitmentsCapital expenditureThe Octodec group has commitments of R325.3 million (2015: R798.3 million) in respect of approved capital expenditure relating to the redevelopment and refurbishments of certain properties. These developments will be financed by way of existing and additional approved bank facilities.
32. Retirement benefitsThe employees of the group belong to a provident fund and contributions to the fund are charged to profit and loss in the year they are measured. The group has no obligation to cover any unfunded benefits.
33. Capital managementThe group’s policy is to have an adequate capital base so as to maintain stakeholder confidence and to sustain future development of the business. The capital comprises shareholders’ equity, including capital and reserves. The level of distributions paid is determined with reference to the liquidity and solvency of the group as well as consideration of budgets, forecasts and JSE Listings Requirements. There were no changes in the group’s approach to capital management during the year.
Loan to value ratioThe board reviews the capital structure on a quarterly basis. As part of the review, the board considers the cost of capital and the risks associated therewith over time. The group and company’s current borrowings amount to 38.3% (2015: 37.3%) and 29.2% (2015: 14.0%) respectively of its total investment portfolio. This is within the guidance given by the board of a loan to value ratio not exceeding 40%.

>31
34. Financial risk managementThe group’s financial instruments consist mainly of deposits with banks, bank overdrafts, interest rate swaps, trade receivables and payables and loans to and from subsidiaries. In respect of all financial instruments listed above,the carrying value approximates fair value.
The group is exposed to the following risks arising from its exposure to financial instruments: • Credit risk• Interest rate risk• Liquidity risk
34.1 Credit riskCredit risk relates mainly to cash deposits, cash equivalents and trade and other receivables. The group only deposits cash with major banks with high quality credit standing and limits exposure to any one counterparty. The concentration of credit risk is limited due to the large and unrelated tenant base.
Before accepting any new tenant, a vetting process is applied to assess the potential tenant’s credit quality. The group monitors the financial position of its tenants on an ongoing basis. Provision is made for specific doubtful debts and all balances over 90 days. Balances between 60 and 90 days are provided for based on estimated recoverable amounts by reference to past default experience. At year-end management did not consider there to be any material credit risk exposure. The carrying amount of financial assets represents the maximum credit exposure.
All of the group’s trade and other receivables have been reviewed for impairment. Certain trade receivables were found to be impaired and a provision of R17.0 million (2015: R12.9 million) (company R1.9 million (2015: R0.4 million))has been recorded accordingly.
Included in the group’s trade receivable balance are tenant balances with a carrying amount of R40.3 million (2015: R24.6 million) (company: R1.9 million (2015: R1.2 million)) which are past due at reporting date and not provided for, as there has not been any significant change in the credit quality and the amounts are still considered recoverable.
The ageing of trade receivables outstanding and not provided for is as follows:30 days or less 4 365 22 780 466 1 198More than 30 days and less than 60 days 30 999 1 421 216 44More than 60 days and less than 90 days 4 992 455 1 177 12
40 356 24 656 1 859 1 254
Reconciliation of provision for impairment of trade and other receivablesCarrying value at beginning of year 12 928 5 351 462 1 318 Additions through business combination – 8 649 – –Additional provisions for the year 14 152 11 839 1 757 353 Amounts written off as uncollectable (10 000) (12 911) (271) (1 209)
17 080 12 928 1 948 462
34.2 Interest riskAt 31 August 2016, the group had borrowings of R4.8 billion (2015: R4.4 billion) (company R2.1 billion (2015: R870 million)) at various interest rates. The all-in weighted average cost of borrowings, including the cost of interest rate swaps, was 9.0% (2015: 8.9%) (company 8.8% (2015: 9.7%)) per annum. At the reporting date, 82.9% (2015: 94.2%) (company 140% (2015: 100%)) of borrowings were fixed or hedged by way of interest rate swap contracts
At 31 August 2016, the group was exposed to changes to interest rates through bank borrowings. The exposure of borrowings to interest rate movements was 17.1% (2015: 5.8%) (company 0% (2015: 0%)) of total borrowings. A breakdown of the borrowings is detailed in note 16.
Interest rate trends are constantly monitored and appropriate steps taken to ensure the group’s exposure to interest movements is managed. The policy is to reduce interest rate risk exposure on long-term financing by entering into fixed interest rate contracts as well as swap rate contracts.
The group analyses its interest rate exposure on a dynamic basis and calculates the impact on profit and loss of a defined interest rate shift by using different scenarios. The scenarios are calculated only for liabilities that represent the major interest-bearing obligations and the impact on post-tax profit. A 0.5% per annum shift would represent a maximum increase or decrease of R2.9 million (2015: R0.9 million) (company Rnil (2015: Rnil)) in post-tax profits per annum. The calculations are done monthly to verify that the maximum additional expense is within limits.
Octodec Investments Limited | Annual Financial Statements 2016
consolidated company2016
R’0002015
R’0002016
R’0002015
R’000

>32
2015Fixed rate borrowings expirySeptember 2015 165 796 7.23 – – May 2018 160 000 12.15 – – May 2018 100 000 12.06 – – May 2018 40 580 12.06 – – October 2018 75 000 11.72 – – October 2018 36 400 11.01 – –
577 776 10.59 – – Variable rate borrowings excluding interest rate derivatives 3 803 097 7.73 870 165 7.88 Total borrowings 4 380 873 8.10 870 165 7.88
Amount
Average all-in
margin over/
(below) variable rate per annum
Amount
Average all-in
margin over/
(below) variable rate per annum
R’000 % R’000 %
Interest rate derivatives maturity 2016February 2017 650 000 0.30 550 000 0.30 May 2017 50 000 1.12 50 000 1.12 June 2017 100 000 1.00 100 000 1.00 July 2017 100 000 0.59 100 000 0.59 August 2017 350 000 0.50 250 000 0.56 September 2017 100 000 0.31 50 000 0.31 January 2018 150 000 0.43 50 000 0.43 April 2018 200 000 (1.68) 100 000 (1.68) May 2018 50 000 1.13 50 000 1.13 July 2018 400 000 0.14 400 000 0.14 August 2018 150 000 0.13 50 000 0.40 November 2018 500 000 (0.36) 500 000 (0.36) January 2019 750 000 (0.82) 750 000 (0.82) Total interest rate derivatives 3 550 000 0.09 3 000 000 0.09 Fixed rate borrowings 411 980 – – –Total fixed rate loans and interest rate derivatives 3 961 980 0.09 3 000 000 0.09
34. Financial risk management – continued34.2 Interest risk – continued2016Fixed rate borrowings expiryMay 2018 160 000 12.15 – – May 2018 100 000 12.06 – – May 2018 40 580 12.06 – – October 2018 75 000 11.72 – – October 2018 36 400 11.01 – –
411 980 11.9 – – Variable rate borrowings excluding interest rate derivatives 4 367 047 8.80 2 137 025 8.90 Total borrowings 4 779 027 9.10 2 137 025 8.90
notes to the financial statements – continuedfor the year ended 31 August 2016
consolidated company
Nominal amount
All-in weighted
average interest rate per annum
Nominal amount
All-in weighted
average interest rate per annum
R’000 % R’000 %

>33
consolidated company
Amount
Average all-in
margin over/
(below) variable rate per annum Amount
Average all-in
margin over/
(below) variable rate per annum
R’000 % R’000 %
34. Financial risk management – continued34.2 Interest risk – continuedInterest rate derivatives maturity 2015February 2017 650 000 1.46 150 000 1.56 May 2017 50 000 2.12 – – June 2017 100 000 2.00 – – July 2017 100 000 1.59 – – August 2017 350 000 1.50 200 000 2.15 September 2017 100 000 1.31 50 000 1.31 January 2018 150 000 1.43 50 000 1.43 April 2018 200 000 (0.62) 100 000 (0.62)May 2018 50 000 2.13 50 000 2.13 July 2018 400 000 1.34 200 000 1.34 August 2018 150 000 1.20 50 000 1.40 November 2018 500 000 0.70 500 000 0.70 January 2019 750 000 0.23 750 000 0.23 Total interest rate derivatives 3 550 000 0.99 2 100 000 0.81 Fixed rate borrowings 577 776 – – – Total fixed rate loans and interest rate derivatives 4 127 776 0.99 2 100 000 0.81
Company 2015Current interest rate 7.35% - 8.5% – Due in less than one year 68 715 – 68 715Due in one to two years 57 382 – 57 382Due in two to three years 43 100 – 43 100Due in three to four years 13 781 – 13 781
Company 2016Current interest rate 8.35% - 9.5% – Due in less than one year 309 053 – 309 053Due in one to two years 299 028 – 299 028Due in two to three years 201 567 – 201 567Due in three to four years 43 395 – 43 395
Consolidated 2015Current interest rate 7% - 8.5% 11.01% - 12.15%Due in less than one year 282 564 49 192 331 756Due in one to two years 211 741 49 192 260 933Due in two to three years 201 888 37 060 238 948Due in three to four years 130 386 1 400 131 786Due in four to five years 2 923 – 2 923Due in six to eight years 1 461 – 1 461
Floating interestrate per annum
Fixed interest rate per annum Total
R’000 R’000 R’000
34.3 Cash flow interest rate riskInterest payable on borrowingsConsolidated 2016Current interest rate 8.35% - 9.5% 11.01% - 12.15%Due in less than one year 362 122 49 192 411 314Due in one to two years 318 963 37 060 356 023Due in two to three years 207 792 1 400 209 192Due in three to four years 43 395 – 43 395
Octodec Investments Limited | Annual Financial Statements 2016
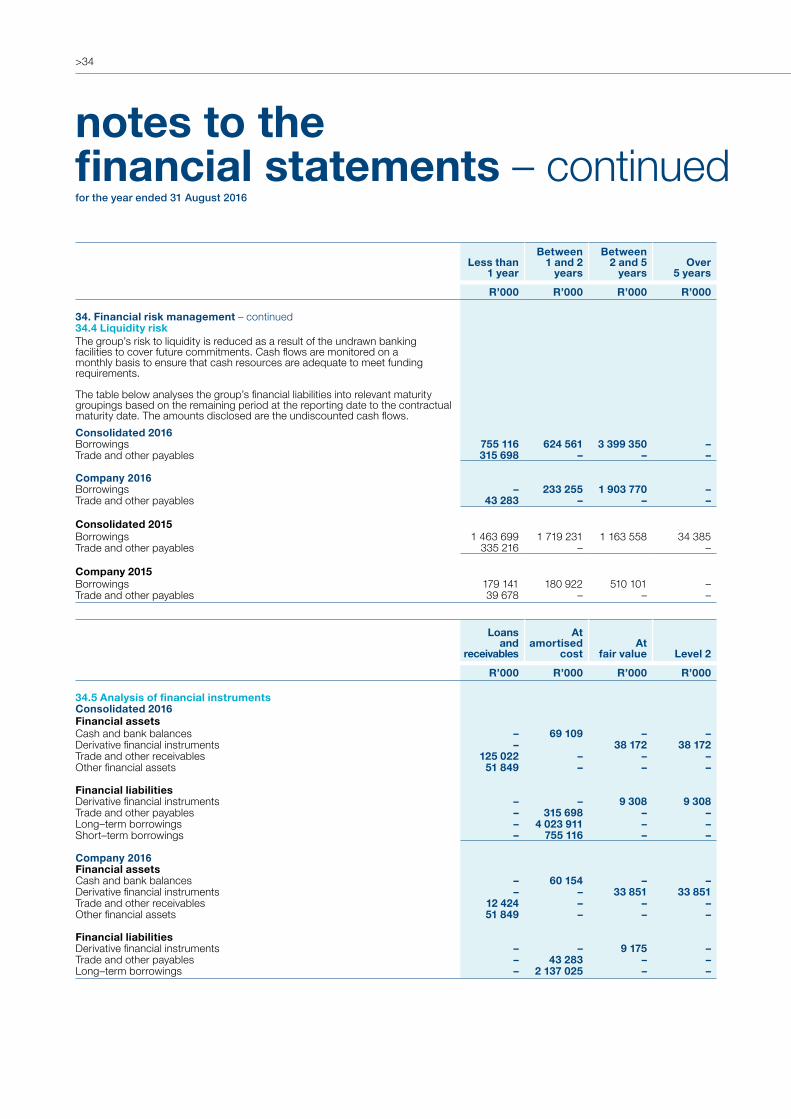
>34
notes to the financial statements – continuedfor the year ended 31 August 2016
Less than 1 year
Between 1 and 2
years
Between 2 and 5
yearsOver
5 years
R’000 R’000 R’000 R’000
34. Financial risk management – continued34.4 Liquidity riskThe group’s risk to liquidity is reduced as a result of the undrawn banking facilities to cover future commitments. Cash flows are monitored on a monthly basis to ensure that cash resources are adequate to meet funding requirements.
The table below analyses the group’s financial liabilities into relevant maturity groupings based on the remaining period at the reporting date to the contractual maturity date. The amounts disclosed are the undiscounted cash flows.Consolidated 2016Borrowings 755 116 624 561 3 399 350 – Trade and other payables 315 698 – – –
Company 2016Borrowings – 233 255 1 903 770 – Trade and other payables 43 283 – – –
Consolidated 2015Borrowings 1 463 699 1 719 231 1 163 558 34 385Trade and other payables 335 216 – –
Company 2015Borrowings 179 141 180 922 510 101 – Trade and other payables 39 678 – – –
Loans and
receivables
At amortised
costAt
fair value Level 2
R’000 R’000 R’000 R’000
34.5 Analysis of financial instrumentsConsolidated 2016Financial assetsCash and bank balances – 69 109 – – Derivative financial instruments – 38 172 38 172 Trade and other receivables 125 022 – – – Other financial assets 51 849 – – –
Financial liabilitiesDerivative financial instruments – – 9 308 9 308 Trade and other payables – 315 698 – – Long–term borrowings – 4 023 911 – – Short–term borrowings – 755 116 – –
Company 2016Financial assetsCash and bank balances – 60 154 – – Derivative financial instruments – – 33 851 33 851 Trade and other receivables 12 424 – – – Other financial assets 51 849 – – –
Financial liabilitiesDerivative financial instruments – – 9 175 – Trade and other payables – 43 283 – – Long–term borrowings – 2 137 025 – –

>35
Loans and
receivable
At amortised
costAt fair value Level 2
R’000 R’000 R’000 R’000
34. Financial risk management – continued34.5 Analysis of financial instruments – continuedConsolidated 2015Financial assetsCash and bank balances – 55 269 – –Derivative financial instruments – – 34 451 34 451 Trade and other receivables 93 856 – – –
Financial liabilitiesDerivative financial instruments – – 22 778 22 778 Trade and other payables – 335 216 – – Long-term borrowings – 2 917 174 – – Short-term borrowings – 1 463 699 – –
Company 2015Financial assetsCash and bank balances – 63 310 – – Derivative financial instruments – – 21 568 21 568 Trade and other receivables 12 270 – – –
Financial liabilitiesTrade and other payables – 39 678 – –Long-term borrowings – 691 023 – –Short-term borrowings – 179 141 – –
35. Related party transactionsA related party is a person or entity that is related to Octodec. A person or a close member of that person’s family is related to Octodec if he/she:
(i) has control or joint control of the reporting entity; (ii) has significant influence over the reporting entity; or (iii) is a member of the key management of the reporting entity.
Related parties where control existed during the year are as follows:Directors: S Wapnick; DP Cohen; GH Kemp; MZ Pollack; AK Stein; PJ Strydom and JP Wapnick.Subsidiary companies: Refer to schedule of interest in subsidiaries on pages 50 and 51.
Related parties where control did not exist during the year are as follows:Jointly controlled asset: The Manhattan
Related parties over which significant influence is exercised: Gerlan Properties Proprietary Limited Jardtal Properties Proprietary Limited Prensas Properties Proprietary Limited
35.1 City Property Administration Proprietary Limited RelationshipA company which manages the group’s property portfolio and over which significant influence is exercised by JP Wapnick.
Pricing policy• Fixed percentage of collections made • Commission based on a percentage of the cost of property acquisitions and property sales • Fixed percentage of the aggregate of the group’s average market capitalisation and total indebtedness to banks and other financial institutions in respect of mortgage bond loans and other unsecured loans
Octodec Investments Limited | Annual Financial Statements 2016
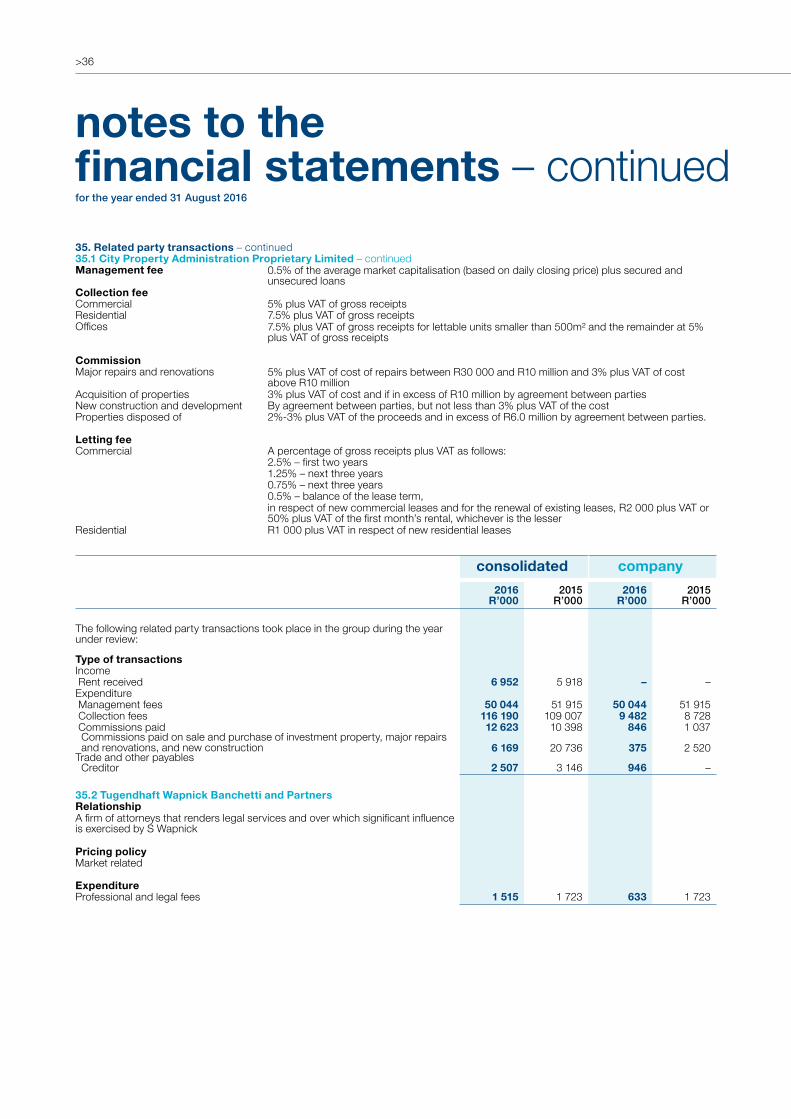
>36
notes to the financial statements – continuedfor the year ended 31 August 2016
35. Related party transactions – continued35.1 City Property Administration Proprietary Limited – continuedManagement fee 0.5% of the average market capitalisation (based on daily closing price) plus secured and
unsecured loans Collection feeCommercial 5% plus VAT of gross receiptsResidential 7.5% plus VAT of gross receiptsOffices 7.5% plus VAT of gross receipts for lettable units smaller than 500m² and the remainder at 5%
plus VAT of gross receipts
CommissionMajor repairs and renovations 5% plus VAT of cost of repairs between R30 000 and R10 million and 3% plus VAT of cost
above R10 millionAcquisition of properties 3% plus VAT of cost and if in excess of R10 million by agreement between parties New construction and development By agreement between parties, but not less than 3% plus VAT of the costProperties disposed of 2%-3% plus VAT of the proceeds and in excess of R6.0 million by agreement between parties.
Letting feeCommercial A percentage of gross receipts plus VAT as follows:
2.5% – first two years 1.25% – next three years 0.75% – next three years 0.5% – balance of the lease term,in respect of new commercial leases and for the renewal of existing leases, R2 000 plus VAT or 50% plus VAT of the first month’s rental, whichever is the lesser
Residential R1 000 plus VAT in respect of new residential leases
consolidated company2016
R’0002015
R’0002016
R’0002015
R’000
The following related party transactions took place in the group during the year under review:
Type of transactionsIncome Rent received 6 952 5 918 – – Expenditure Management fees 50 044 51 915 50 044 51 915 Collection fees 116 190 109 007 9 482 8 728 Commissions paid 12 623 10 398 846 1 037 Commissions paid on sale and purchase of investment property, major repairs and renovations, and new construction 6 169 20 736 375 2 520Trade and other payables Creditor 2 507 3 146 946 –
35.2 Tugendhaft Wapnick Banchetti and PartnersRelationshipA firm of attorneys that renders legal services and over which significant influence is exercised by S Wapnick
Pricing policyMarket related
ExpenditureProfessional and legal fees 1 515 1 723 633 1 723
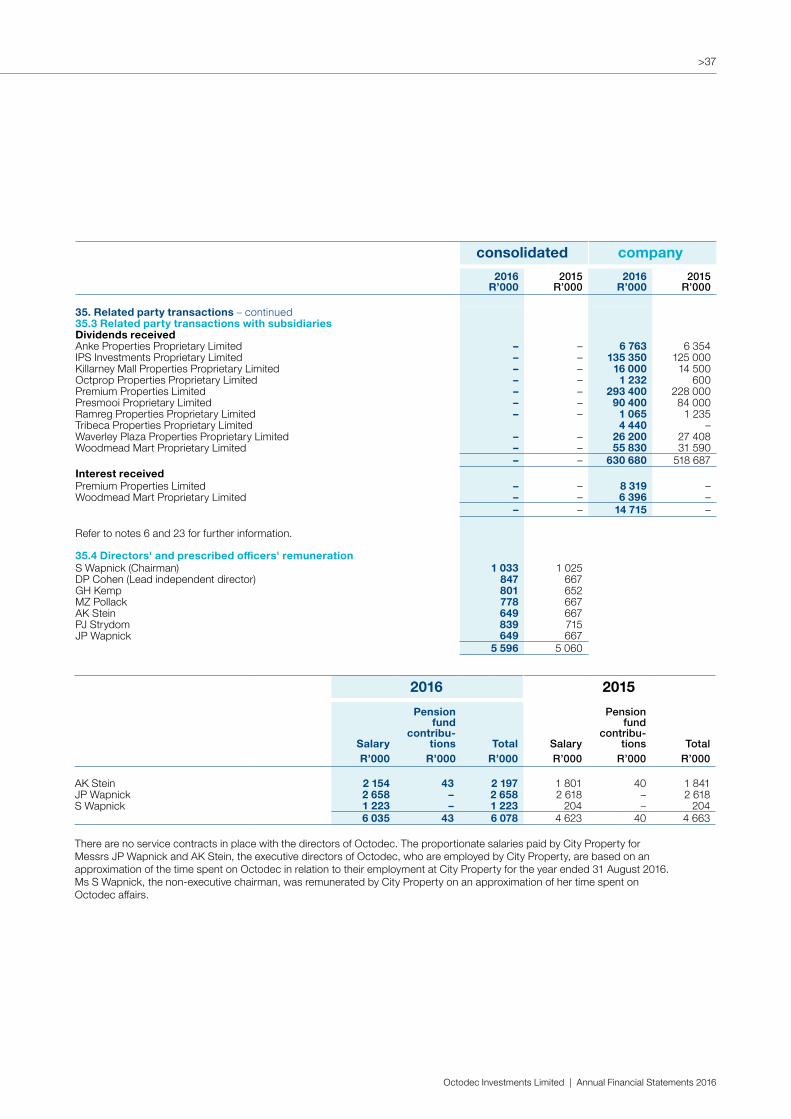
>37
Octodec Investments Limited | Annual Financial Statements 2016
consolidated company2016
R’0002015
R’0002016
R’0002015
R’000
35.4 Directors' and prescribed officers' remunerationS Wapnick (Chairman) 1 033 1 025 DP Cohen (Lead independent director) 847 667 GH Kemp 801 652 MZ Pollack 778 667 AK Stein 649 667 PJ Strydom 839 715 JP Wapnick 649 667
5 596 5 060
2016 2015
Salary
Pension fund
contribu-tions Total Salary
Pension fund
contribu-tions Total
R’000 R’000 R’000 R’000 R’000 R’000
AK Stein 2 154 43 2 197 1 801 40 1 841 JP Wapnick 2 658 – 2 658 2 618 – 2 618 S Wapnick 1 223 – 1 223 204 – 204
6 035 43 6 078 4 623 40 4 663
There are no service contracts in place with the directors of Octodec. The proportionate salaries paid by City Property for Messrs JP Wapnick and AK Stein, the executive directors of Octodec, who are employed by City Property, are based on an approximation of the time spent on Octodec in relation to their employment at City Property for the year ended 31 August 2016. Ms S Wapnick, the non-executive chairman, was remunerated by City Property on an approximation of her time spent on Octodec affairs.
35. Related party transactions – continued35.3 Related party transactions with subsidiariesDividends receivedAnke Properties Proprietary Limited – – 6 763 6 354IPS Investments Proprietary Limited – – 135 350 125 000Killarney Mall Properties Proprietary Limited – – 16 000 14 500Octprop Properties Proprietary Limited – – 1 232 600Premium Properties Limited – – 293 400 228 000Presmooi Proprietary Limited – – 90 400 84 000Ramreg Properties Proprietary Limited – – 1 065 1 235Tribeca Properties Proprietary Limited 4 440 –Waverley Plaza Properties Proprietary Limited – – 26 200 27 408Woodmead Mart Proprietary Limited – – 55 830 31 590
– – 630 680 518 687Interest receivedPremium Properties Limited – – 8 319 – Woodmead Mart Proprietary Limited – – 6 396 –
– – 14 715 –
Refer to notes 6 and 23 for further information.

>38
37. Events after reporting dateDividends amounting to 103.1 cents per share (2015: 94.2 cents per share) were declared after the reporting date.
The directors are not aware of any other events subsequent to 31 August 2016 not arising in the normal course of business which are likely to have a material effect on the financial information contained in this report.
2016 2015R’000 % R’000 %
36. Segmental reporting36.1. Segmental reportingThe group earns revenue in the form of property rentals. On a primary basis the group is organised into six operating segments:
• Office• Retail shops • Shopping centres• Industrial• Parking• Residential
Rental income by sector Offices 269 100 19.6 266 929 20.8 Retail shops 398 439 28.9 353 588 27.6 Shopping centres 134 786 9.8 128 732 10.1 Industrial 110 253 8.0 105 920 8.3 Parking 57 775 4.2 52 677 4.1 Residential 406 661 29.5 372 740 29.1 Total rental income 1 377 014 100.0 1 280 586 100.0 Recoveries 393 424 358 503 Revenue 1 770 438 1 639 089
Further segmental results cannot be allocated on a reasonable basis due to the “mixed use” of certain of the properties. It is the group’s policy to invest predominantly in properties situated in the Gauteng area, therefore the group has not reported on a geographical basis.
In the current year the group included a new sector, Parking, as it has become a significant revenue component. Parking was previously included in the other sectors. The comparative amounts were restated to reflect the new sector separately.
notes to the financial statements – continuedfor the year ended 31 August 2016
consolidated
36.2. Reconciliation of earnings to distributable earningsReconciliation of earnings to headline earningsProfit after taxation 857 162 1 337 728Adjusted for:(Profit)/loss on sale of investment property (8 490) 61Gain on bargain purchase – (319 647)Reversal of impairment of loans (378) – Fair value changes Investment property (285 914) (486 054) Investment property – joint ventures (6 872) (19 082)
Headline earnings attributable to shareholdersReconciliation of headline earnings to distributable earnings
555 508 513 006
Fair value adjustments Interest rate derivatives (17 191) (45 987)Straight-line rental income accrual (2 567) (4 930)Deferred taxation adjustment – (87)Once-off reinstatement contribution from tenant (25 000) – Distributable earnings attributable to shareholders 510 750 462 002
consolidated2016
R’0002015
R’000

>39
Octodec Investments Limited | Annual Financial Statements 2016
consolidated2016
R’0002015
R’000
38. Business combinations38.1. Premium Properties LimitedWith effect from 1 September 2014, Octodec acquired all of the issued Premium linked units that it did not already own, increasing its shareholding to 100%. The merger between Octodec and Premium was implemented by way of a scheme of arrangement in terms of section 114(1)(d) of the Companies Act ofSouth Africa (the scheme). In terms of the scheme, Octodec acquired Premium linked units for which each Premium unit holder received 88.5 Octodec shares for every 100 Premium linked units held. Premium became a wholly-owned subsidiary of Octodec and was delisted from the JSE effective 1 September 2014.
Fair value of assets acquired and liabilities recognised at the date of acquisition
Non-current assetsInvestment properties 4 860 151 Plant and equipment 6 105 Operating lease assets 55 256 Lease costs capitalised 17 638 Investment in IPS 660 015 Current assetsTrade and other receivables 31 754 Cash and cash equivalents 121 648 Non-current liabilitiesInterest-bearing borrowings (1 145 059)Derivative financial instruments (16 896)Deferred taxation (6 460)Current liabilitiesNon-interest bearing borrowings (136 526)Interest-bearing borrowings (975 917)Linked unit holders for distribution (127 143)Total identifiable net assets 3 344 566 Fair value of equity interest held before the business combination (405 698)Gain on bargain purchase (319 647)Acquisition date fair value of consideration paid 2 619 221
Acquisition date fair value of consideration paidEquity – 119 055 519 ordinary shares in group 2 619 221
The acquisition date fair value of consideration paid was calculated utilising a share price of R22 on 1 September 2014.
Net cash inflow on acquisitionCash and cash equivalents acquired 121 648 Cash consideration paid – Net cash inflow on acquisition 121 648
Equity issued as part of consideration paidThe number of shares, being 119 055 519 ordinary shares, issued as part of the consideration for the business combination was calculated by utilising a swap ratio, which was determined based on the following:
a) the forecast distributions per Octodec linked unit and Premium linked unit for the twelve month period ending 31 August 2015;b) the relative historic volume weighted average price of Octodec linked units and Premium linked units; andc) the relative net asset values per Octodec linked unit and Premium linked unit calculated on a fair value basis as at 31 August 2014.
Merger-related costsThe merger-related costs are R17.7 million. These costs were set off against stated capital in the year of the acquisition due to these costs being directly attributable to the issue of Octodec’s own equity instruments.
Gain on acquisitionA gain of R319.6 million was recognised on acquisition and is included as a gain on bargain purchase in profit and loss in the 2015 financial year.

>40
notes to the financial statements – continuedfor the year ended 31 August 2016
consolidated2016
R’0002015
R’000
38. Business combinations during the reporting period – continued38.2. IPS Investments Proprietary LimitedWith effect from 1 September 2014, Octodec acquired all of the issued Premium linked units that it did not already own, increasing its shareholding to 100%. This resulted in Octodec acquiring control of IPS Investments Proprietary Limited. As the shareholding increased from 50% to 100%, IPS changed from an associate to a subsidiary.Fair value of assets acquired and liabilities recognised at the date of acquisition
Non-current assetsInvestment properties 2 029 994 Plant and equipment 1 296 Operating lease assets 11 428 Lease costs capitalised 6 560 Investment in joint venture 150 032 Current assetsTrade and other receivables 15 137 Cash and cash equivalents 17 276 Non-current liabilitiesInterest-bearing borrowings (718 059)Derivative financial instruments (6 888)Deferred taxation (56 241)Current liabilitiesNon-interest bearing borrowings (60 795)Interest-bearing borrowings (51 480)Bank overdraft (3 020)Total identifiable net assets 1 335 240 Fair value of equity interest held before the business combination 667 620 Acquisition date fair value of consideration paid 667 620
Acquisition date fair value of consideration paid 667 620 50% if IPS was acquired at the fair value of the total identifiable net assets.Net cash inflow on acquisitionCash and cash equivalents acquired 17 276 Bank overdraft (3 020)Net cash inflow on acquisition 14 256
38.3 Net cash inflow from business combinationCash and cash equivalents acquired 138 924 Bank overdraft (3 020)Net cash inflow on acquisition 135 904
The revenue included in the consolidated statements of profit and loss and other comprehensive income since 1 September 2014, contributed by Premium and IPS, was R1.1 billion. Premium and IPS also contributed distributable profit of R359.9 million over the same period.

>41
Octodec Investments Limited | Property Portfolio Information
property portfolio informationfor the year ended 31 August 2016
*Properties securing long-term borrowings (notes 2 and 16). ^Properties in which the group has a 50% interest.
1. Investment properties owned by the group
Property name
Description of buildings
Weighted average
rental per m² at
31 August 2016 –
commercial
Weighted average
rental per unit at
31 August 2016 –
residential
Rental income
R’000Site area
m²GLA
m²
Vacancy at
31 August 2016
%
CenturionAndpot* Warehouses 45 – 923 3 029 1 752 – FNB Centurion* Shops 149 – 3 634 6 590 1 874 – Lenchen Centre* Shops 110 – 4 320 9 245 3 331 2.7 Lenchen Park* Shops and
workshops 64 – 4 347 11 000 5 722 – Prime Cure House* Offices 77 – 2 648 4 622 2 689 – The Hangar 260 flats – 5 729 16 225 19 342 19 962 10.4Weighted average per location 90 5 729 32 097 53 828 35 330 6.1
HatfieldAbsa Hatfield Offices 131 – 5 435 1 276 3 448 – Blagil* House 136 – 262 1 276 161 – Highlands* 18 flats – 7 257 1 441 1 461 1 076 10.2 Intersite* Gym and office 103 – 5 695 17 213 5 603 22.0 Protea Hotel* Hotel and shops 71 – 4 257 2 803 5 360 3.6 Talland (2)* Motor showroom 119 – 678 1 664 570 100.0 The Fields* Hotel, shops, offices
and 765 flats 116 5 845 83 739 19 793 54 056 3.7 Weighted average per location 109 5 875 101 508 45 486 70 274 5.8
HermanstadErf One Eight One* Factories, workshops
and warehouses 26 – 3 630 30 610 12 865 11.3 Hannyhof Centre Shops 52 – 1 103 5 733 1 754 4.7 Hardwood Warehouse 24 – 336 5 239 1 112 – Pretboy Factories 42 – 455 5 102 850 – Steyns Industrial Park* Warehouses 31 – 4 777 25 240 13 615 7.8 Talkar Warehouses 47 – 3 875 12 759 6 873 – Weighted average per location 34 – 14 176 84 683 37 069 7.0
Johannesburg and surrounding areas3 West Street* Shops and offices 67 – 1 885 2 009 3 290 14.7 CCMA Place* Shops and offices 80 – 3 779 1 785 4 152 9.2 Druthon Centre* Shops and offices 74 – 1 508 2 362 3 270 50.9 Erand Gardens* Offices 124 – 4 553 6 484 2 663 – Herriotdale Germiston* Vacant land Sold – 32 – – – Iskemp Warehouse and
offices 31 – 1 994 12 742 7 028 31.9 Kempton Place*^ Shops and 469 flats 92 4 518 32 911 39 770 32 507 14.5Killarney Mall* Shopping centre,
offices and parking 131 – 75 851 57 603 46 945 7.3Kyalami Crescent* Warehouses and mini
factories 52 – 5 557 3 503 9 634 – McCarthy Midrand* Motor dealerships 85 – 3 785 8 639 3 692 – Motor City Strijdom Park Shops 79 – 5 100 10 326 6 769 16.9 Pretwade Workshops 33 – 1 326 6 719 3 380 – The Manhattan^ Greenfield residential
development Project – – 13 335 – – Woodmead Value Mart* Value Mart shopping
centre 150 – 32 397 42 255 18 093 – Weighted average per location 108 4 518 170 678 207 532 141 423 9.9
Johannesburg CBD119 Albertina Sisulu Street* Shops and offices Vacant – – 496 1 639 100.0 121 Albertina Sisulu Street* Shops 52 – 385 245 613 –

>42
1. Investment properties owned by the group – continued
Property name
Description of buildings
Weighted average
rental per m² at
31 August 2016 –
commercial
Weighted average
rental per unit at
31 August 2016 –
residential
Rental income
R’000Site area
m²GLA
m²
Vacancy at
31 August 2016
%
Johannesburg CBD – continuedAnderson Place* Shops and offices 58 – 4 367 992 5 385 – Arlington House* Shops and offices 136 – 4 036 2 480 2 905 13.2 Armadale* Shops and 82 flats 79 4 807 13 260 1 982 12 781 13.4 Bradlows Corner* Shops 55 – 1 055 991 2 115 25.3 Bram Fischer Towers* Shops, offices and
parking 71 – 6 063 2 447 11 684 34.1 Brisk Place* Shops and 93 flats 81 3 739 6 034 1 004 5 624 6.5 Castle Mansions* Shops and 177 flats 132 4 551 18 544 2 477 16 164 2.8 City Block Workshops 15 – 746 – 4 074 21.8 CPA Place* Shops, offices and 194
flats 98 4 200 6 096 991 4 674 11.3Dan’s Place* Shops and 150 flats 122 4 048 9 442 1 490 8 061 10.2 Education Centre* Shops, offices and
parking 137 – 3 912 1 983 10 924 76.6 Elephant House* Offices 65 2 488 990 4 828 34.0 Eloff Street* Warehouse Sold – 195 – – – Empisal Shops and offices 67 – 1 316 497 1 628 – Essenby Shops and 116 flats Vacant 4 278 5 482 992 6 294 13.6
,
property portfolioinformation – continuedfor the year ended 31 August 2016
Fedsure House* Shops, offices and parking 5 – 1 722 3 488 19 613 96.3
Fine Art Court Shops and 35 flats 158 3 784 1 754 250 1 499 8.4 Fine Art House Shops and offices 52 – 492 499 3 210 77.9 Focus House* Shops and offices 52 – 1 640 501 3 066 8.6 Frank’s Place* Shops and 106 flats 81 4 247 11 333 2 234 11 963 7.6High Court Building and Somerset House
Shops, offices and 20 flats 38 Vacant 707 544 3 205 59.7
Howard House Shops and offices 98 – 1 430 248 1 399 10.3 Inner Court* Shops, offices and
parking 92 – 11 890 3 733 23 509 54.7 Jeppe House* Shops and offices 63 – 5 673 988 7 777 –John Street* Warehouses 38 – 6 225 14 782 14 300 –Kings City Parkade* Shops and parking 168 – 6 211 1 985 1 578 – Klamson Towers* Shops and offices 74 – 4 349 992 6 571 17.0 Lara’s Place* Shops, offices, 142
flats and parking 112 4 105 9 634 1 495 7 441 3.1 Lister Medical Centre* Shops and offices 87 – 10 797 1 983 15 167 36.9 London House Shops and offices 38 – 1 526 – 4 261 17.4 Lusam Mansions* Shops, store room and
82 flats 170 3 806 4 601 497 3 753 10.5 Marlborough House Shops and offices 92 – 7 975 1 387 9 173 25.1 Medical Towers* Shops and offices 115 – 2 630 991 5 659 81.9 Mr Price* Shops and offices 106 – 4 069 991 3 413 3.5 North City* Shops and offices 92 – 6 154 1 489 8 570 42.5 Plaza Place* Shops and 214 flats 77 3 670 10 266 1 495 8 514 5.6 Presmooi Shops and offices 52 – 2 227 2 975 3 578 6.8 Raschers Shops 146 – 182 500 888 83.1 Record House* Shops and 41 flats 148 3 402 2 212 248 1 523 9.8 Reinsurance House Offices Mothballed – – 1 986 15 034 100.0 Reliance Centre* Offices and
warehouses 36 – 2 480 1 691 7 199 15.9 Ricci’s Place* Shops and 281 flats 125 4 091 15 373 2 475 10 395 5.9 Royal Place* Shops, offices and 155
flats 103 3 859 15 790 2 457 14 585 13.3 Selby 515* Factories 40 – 2 988 12 288 6 416 6.0 Shoprite – Eloff Street* Shops and offices 8 – 28 126 3 968 34 224 – Splendid Place* Shops and 150 flats 153 4 158 8 150 1 492 8 372 3.2 Tali’s Place* Shops and 337 flats 60 3 840 17 840 3 718 17 894 8.8 Temple Court* Shops and 45 flats 142 4 345 2 785 249 2 335 4.2 The Brooklyn*^ Shops and 154 flats 9 3 390 5 948 992 6 070 1.7Union Club* Shops and 72 flats 236 3 537 5 257 644 3 687 10.1

>43
Octodec Investments Limited | Property Portfolio Information
*Properties securing long-term borrowings (notes 2 and 16). ^Properties in which the group has a 50% interest.
Property name
Description of buildings
Weighted average
rental per m² at
31 August 2016 –
commercial
Weighted average
rental per unit at
31 August 2016 –
residential
Rental income
R’000Site area
m²GLA
m²
Vacancy at
31 August 2016
%
Johannesburg CBD – continued
Tshwane CBD1 on Mutual Greenfield residential
development with retail and parking Project – 244 2 552 2 261 100.0
228 Pretorius Street Shops and offices 83 – 3 580 696 3 530 –250 Pretorius Street* Shops and offices 90 – 2 880 812 4 002 28.3 28 Church Street* Shops and offices 51 – 3 830 1 276 6 933 15.5 Alec’s Place* Shops and 95 flats 124 5 068 5 848 1 357 5 225 2.2Amanda Court* Shops and 23 flats 89 4 734 2 754 2 186 2 577 3.6 AVN* Shops, offices and
parking 85 – 7 890 2 374 7 073 –Bank Towers* Offices 120 – 8 447 1 722 7 321 18.6 Bosch Building Parking – – 395 1 276 – –Boschurch Shops 57 – 612 638 922 –Burlan* Shop and offices 63 – 888 480 1 951 32.5 Callaway* Shop and warehouse 38 – 750 2 552 2 002 –Capitol Towers North* Shops and offices 91 – 14 930 2 966 13 481 2.1 Central House* Shops and offices 126 – 6 865 2 552 5 602 16.8 Central Towers* Shops and offices 119 – 6 646 1 299 7 443 39.8 Centre Place* Shops, 234 flats and
parking 183 3 823 18 172 3 509 10 971 11.5 Centre Walk* Shops, offices and
parking 119 – 27 960 7 582 25 417 4.3 City Corner* Shops 114 1 990 1 740 1 494 0.7City Place* Shops and 298 flats 93 4 024 16 766 5 725 11 513 3.5 City Towers* Shop and office 90 – 1 807 1 134 2 940 42.7 CPA House* Shops, offices and
parking 77 – 7 843 5 104 8 177 –Curpro Motor showroom 257 – 517 2 552 168 –Cuthchurch* Basement, shops and
offices 91 – 9 698 2 551 9 155 0.5Daloria* Shops 59 – 1 090 1 873 1 544 –Damalis Shops 147 – 760 917 499 12.8 Demar Building* Shops, basement
parking and 70 flats 39 4 343 4 432 2 225 4 991 2.1 Du Proes Shops and vacant land 52 2 435 5 204 3 665 2.7 Dupro Vacant land, shop and
storeroom 28 441 1 933 995 –
Vuselela Place* Shops, offices and 193 flats 179 4 028 10 743 1 735 9 098 9.5
Wits Technikon* Colleges 30 – 2 341 3 969 16 937 61.3 Works@Main* Shops and offices 27 – 1 432 991 5 061 23.8 Works@Registry* Shops and offices Sold – 2 556 – – – Weighted average per location 62 4 006 320 929 103 007 426 330 26.8
Tshwane – Arcadia470 Pretorius Street Vacant land 62 – 284 917 917 – Apollo Centre Shops, offices and
parking 49 – 4 517 2 552 9 844 21.9 Benrico* Shops, offices store
and parking 36 – 1 170 1 499 2 680 – BP Leyds Street* Garage and vacant
land 176 – 1 336 5 452 1 411 – Corner Place* 112 flats – 4 338 5 585 1 913 3 722 0.8 Craig’s Place* 154 flats – 4 267 7 920 2 889 5 186 2.6 LPA Beleggings Workshop 25 – 306 1 914 1 054 – Leo’s Place Shops and 167 flats 115 4 437 8 495 3 416 6 353 4.4 Ludwigs Showroom 29 – 789 2 552 2 261 – MBA Building* Offices 87 – 3 006 1 276 3 050 25.6 McCarthy Church Street* Motor dealerships 99 – 3 817 6 461 3 199 – Monaco 27 flats – 5 724 1 765 4 718 2 649 2.9 Nedbank Plaza* Shops, offices,
144 flats and parking 90 6 086 24 314 10 207 23 177 38.6 Numall* Shops and college 58 – 4 019 8 588 5 220 – Provisus* Offices and shops 99 – 6 911 2 552 5 837 6.8 Tiny Town House, 14 cottages
and vacant land – 9 992 1 581 3 171 1 862 16.6 Weighted average per location 73 4 924 75 815 60 077 78 422 16.7

>44
1. Investment properties owned by the group – continued
Property name
Description of buildings
Weighted average
rental per m² at
31 August 2016 –
commercial
Weighted average
rental per unit at
31 August 2016 –
residential
Rental income
R’000Site area
m²GLA
m²
Vacancy at
31 August 2016
%
Tshwane CBD – continuedDusku* Motor showroom 47 – 195 334 336 –Eland House Shops, warehousing
and 21 flats 133 4 662 1 338 2 552 1 497 20.0 Filkem House Shops, offices and
basement 139 – 1 828 443 1 568 21.9 FNB Church Street Shops and offices 36 – 460 761 1 523 30.6 Govpret* Shops, offices and
parking 94 – 7 549 2 552 6 216 –Hacklu Enterprises Shops 119 – 858 986 683 1.0 Indacom Shops and
warehouses 29 2 010 6 663 6 478 –Jardown* Shops, warehousing
and workshops 43 4 233 12 175 9 056 23.1Jeff’s Place* 384 flats and parking – 4 170 20 575 4 842 14 771 2.2 Joan’s Place* Shops and 28 flats 130 3 631 1 459 1 195 1 187 4.5 Karps* Shops and 6 flats 12 4 959 517 2 764 2 370 35.9 Ken’s Court* Shop and 46 flats 68 5 019 3 696 3 166 3 681 2.6Letari Building Shops, offices and
warehouses 30 – 967 2 561 3 013 29.0 Lisa’s Place 97 flats – 4 378 4 779 2 552 3 090 3.0 Locarno House* Shops and offices 105 – 4 307 1 703 5 355 36.7 Louis Pasteur* Shops, offices, hospital
and parking 65 – 37 141 12 760 34 137 3.1 Maravin Shops 65 – 416 553 790 46.8 MidChurch Shops 19 – 322 654 1 424 –Navy House* Shops and offices 115 – 5 192 1 235 6 881 45.0 Olivetti House Offices 64 – 2 694 2 582 3 791 9.0 Orpheum Mansions Shops and 22 flats 72 4 821 2 112 1 485 2 739 6.0 Parking@Sophie de Bruyn Parking – – 196 1 181 – –Paulefko Shop 27 – 452 557 1 372 –Perl Modes Building* Shops and college 97 – 2 448 1 577 2 170 –Pete’s Place* Shops and 181 flats 166 3 900 8 541 1 782 6 916 2.0 Potmeul Vacant land – – – 16 523 – –Potproes* Shops, workshop,
warehouse, filling station and motor showroom 45 – 4 117 30 071 10 317 37.4
Poyntons* Shop and offices 59 – 2 226 2 001 3 150 –Praetor Forum* Shop and offices 100 – 4 825 2 132 6 105 22.3 Premium Towers Shop and offices 118 – 7 166 1 418 6 995 22.2 Pretjolum* Shops, offices,
workshop and warehouse 45 – 3 925 9 316 6 809 –
Prime Towers* Shops, offices and basement 91 – 3 773 638 4 237 9.7
Prinsben* Shops 73 – 1 145 2 552 1 312 –
property portfolio information – continuedfor the year ended 31 August 2016
Prinschurch* Shops, offices and parking 123 – 3 639 2 552 13 128 86.5
Prinsman* Shops, offices, parking and 175 flats 61 3 850 13 980 12 979 12 240 2.8
Prinsproes Shops and offices 36 – 2 034 2 378 4 597 –Prinstruben Shops 55 – 1 208 2 552 2 209 –Protea Towers* Offices and parking 114 – 7 402 1 862 9 446 19.8 Provincial House Shops and offices 41 – 337 1 060 3 047 81.9 Rapier* Shops 129 – 1 441 5 710 920 –Rezmep Shops, offices and
warehousing 54 – 7 195 15 403 12 423 19.3Ross Electrical Shop Vacant – – 583 525 100.0 Russell’s Place* Shops and 191 flats 92 4 180 10 458 3 022 8 144 1.6

Tshwane EastElarduspark Shopping Centre*
Shopping centre 130 – 17 072 1 876 12 214 19.5
Odeon Forum* Offices 130 – 5 330 6 788 3 121 –Weighted average per location 130 – 22 402 8 664 15 335 15.6
Tshwane NorthBlaauw Village*^ Shopping centre 103 – 8 293 17 862 7 205 1.5 Erf Agt Nul Nege Shops 60 – 845 2 552 1 755 39.7 Erf Six Five One Factories 46 – 386 2 552 1 355 32.9 Normed* Shops and offices 54 – 3 374 7 655 6 250 9.9 Ramreg Shops, house and 19
flats 61 3 907 1 626 5 104 1 765 3.2 Rosnew Shops, workshop and
garage 84 – 4 707 19 016 6 437 22.3 Tronap Investments Shops 44 – 850 2 552 1 487 –Weighted average per location 76 3 907 20 081 57 293 26 254 12.8
Tshwane OtherLandkirk Warehouse Sold – 207 – – –Persequor Park* Offices and parking 109 – 11 059 16 526 8 073 1.9Rentmeester Park* Offices and parking 103 – 16 166 17 232 12 259 0.7 Valhof* Shops and offices 58 – 1 472 6 519 2 159 6.7 Weighted average per location 100 – 28 904 40 277 22 491 1.7
>45
*Properties securing long-term borrowings (notes 2 and 16). ^Properties in which the group has a 50% interest.
Property name
Description of buildings
Weighted average
rental per m² at
31 August 2016 –
commercial
Weighted average
rental per unit at
31 August 2016 –
residential
Rental income
R’000Site area
m²GLA
m²
Vacancy at
31 August 2016
%
Tshwane CBD – continuedSamchurch* Shops, basement and
vacant land 309 – 701 3 237 189 –SchoeCourt Shops and storeroom 26 – 718 2 738 2 491 9.7 Scott's Corner* Shops 74 – 4 280 5 104 4 811 –Sharon's Place* Greenfield residential
development with shops and parking Project – – 8 922 – –
Sharp Centre Shops and offices 40 – 888 2 552 2 128 –Shepstru* Shops, offices and
storeroom 41 – 1 551 2 378 3 309 3.9 Shoprite* Shops and offices 64 – 14 475 7 358 18 900 –SKD Offices, shops and
warehouse 34 – 1 676 7 962 3 975 –Standard Bank Chambers* Offices and bank 79 – 6 146 1 741 7 782 16.9 Station Place* Shops and 369 flats 31 3 947 18 074 7 656 16 329 2.9Steyn’s Place* Shops and 381 flats 148 4 321 23 127 3 816 15 638 4.4 Steynscor* Shops and offices 137 – 6 577 5 104 3 812 –Time Place Shops and 144 flats 120 3 860 7 439 1 429 5 381 3.6 Toitman Shops and offices 48 – 1 236 13 034 2 139 –Tom’s Place* 320 flats – 4 336 16 891 6 816 9 984 1.1 Tshwane Midtown Shops, offices and
parking 92 – 210 2 136 8 547 86.7 Tuel Shops 69 – 903 740 1 093 –Valcourt Shops and offices 34 – 930 3 480 3 150 36.3 Vanstrub Shops and warehouse 53 – 2 730 5 104 4 450 –Viskin Workshop 52 – 195 3 536 312 –Van Riebeeck Building Offices Mothballed – – 2 552 11 497 100.0 Volks Building* Parking – – 338 1 276 – –Weighted average per location 76 4 151 458 711 347 825 504 417 15.3
Octodec Investments Limited | Property Portfolio Information

>46
property portfolio information – continuedfor the year ended 31 August 2016
1. Investment properties owned by the group – continued
Property name
Description of buildings
Weighted average
rental per m² at
31 August 2016 –
commercial
Weighted average
rental per unit at
31 August 2016 –
residential
Rental income
R’000Site area
m²GLA
m²
Vacancy at
31 August 2016
%
Tshwane WestAsland* Warehouse and
workshops 29 – 1 800 9 993 5 374 1.4 Carlzeil* Workshops and
warehouses 37 – 3 156 14 040 8 677 19.9Dirk Du Toit Shop and workshop – – 227 – – – Goleda Shops, showroom,
warehouse, workshops and 10 flats 23 – 2 112 15 087 7 504 –
Grariv* Two flats – 5 706 103 6 828 270 – Henwoods Factories 44 – 1 852 5 710 3 539 7.5 H&S Mansions Shops, factories and
10 flats 29 4 112 1 543 3 847 3 451 3.0 Imbuia* 11 flats – 5 018 653 12 529 1 155 – Ischurch* Shops, offices,
warehouse, 8 flats, workshops and house 32 4 069 2 408 13 336 6 930 12.3
Jakaranda* 33 flats – 4 179 1 651 12 529 1 782 – Kiaat* 40 flats – 4 133 1 949 12 529 3 080 2.5 Lasmitch Properties Warehouse and
showroom 37 – 970 2 855 3 272 – Lutbridge Shops and warehouse 31 – 1 969 7 138 5 439 3.8 Metromitch* Shops, showroom,
warehouse and 36 flats 28 4 290 4 489 13 364 9 921 9.0 Mimosa* 18 flats – 4 882 1 000 12 529 1 890 – Mitchbuit * Shops and
warehouses Sold – 617 – – – Mitchpap Shops and
warehouses 37 – 1 650 5 710 4 414 5.8 Nedwest Centre* Shops and
warehouses 35 – 4 167 40 740 9 344 1.1 Panag Investments Shops and workshops 40 – 927 2 855 1 970 17.7 Rosemitch* Motor showroom,
warehouse, workshop and 18 flats 21 4 154 2 947 15 703 11 360 6.7
Rovon Investments Shops, workshops and warehouses 49 – 1 962 9 719 4 304 28.4
Soutwest Properties* Warehouses and workshops 57 – 1 350 2 855 1 919 –
Syringa* 40 flats – 4 435 2 112 12 529 3 633 – Weighted average per location 32 4 345 41 614 232 425 99 228 6.9
Silverton and surrounding areasBrianley Warehouse and
workshops 36 – 5 097 16 372 13 267 13.7Janvoel Shops 39 – 823 4 461 1 798 – Muntstreet Factories 17 – 1 362 12 243 6 664 – Notrevlis Shops and
warehouses 66 – 1 275 5 093 1 842 22.8 Sildale Park* Industrial park 43 – 11 220 50 266 22 392 6.2 Silver Place* Shops, 232 flats and
parking 43 4 670 19 391 23 555 29 106 5.5 Silverfas* Warehouses 33 – 801 3 850 2 697 12.6 Silvertondale 36* Workshops and
warehouses 48 – 804 2 058 1 818 40.4 Supmall Shops 62 – 853 2 364 1 316 75.1 Tomzeil* Warehouse and
workshops 39 – 4 060 16 865 6 584 –

>47
Waverley, Gezina, MootBouwer Broers Shops 43 – 1 149 3 844 2 719 31.7 Frederika straat Shops 49 – 832 2 552 1 569 – Gerlan^ Motor dealership
showroom 108 – 6 702 1 276 5 174 – Gezina City Shopping Centre*
Shopping centre 56 – 10 439 43 153 16 218 –
Karkap Properties Shops 52 – 668 2 552 1 079 13.0 Motor City Capital Park Shops, storerooms
and workshops 62 – 5 071 17 669 7 461 7.6 Orion Shops, warehousing
and 22 flats 43 4 338 1 570 1 862 2 405 5.0 Ou Holland Shops and 22 flats 61 4 769 1 609 2 552 2 351 12.8 Swemvoor Shops and offices 37 – 1 069 2 552 2 376 – Trekfred Vacant land, parking
and shops 77 – 2 388 6 379 2 783 15.3 Trekmin* Shops, 48 flats and
parking 70 4 609 7 143 11 483 9 350 0.8 Troymona Houses – 6 788 155 1 081 300 – Waverley Plaza Shopping Centre*
Shopping centre 146 – 19 187 38 198 11 188 1.7
Weighted average per location
80 4 612 57 982 135 153 64 973 4.1
Weighted average for portfolio of properties 72 4 402 1 430 869 1 600 646 1 669 120 15.6
Investment properties 100% held 71 4 415 1 377 015 1 540 746 1 618 165Investment properties 50% held 92 4 235 53 854 59 900 5 095Weighted average for total portfolio 72 4 402 1 430 869 1 600 646 1 669 120
*Properties securing long-term borrowings (notes 2 and 16). ^Properties in which the group has a 50% interest.
Property name
Description of buildings
Weighted average
rental per m² at
31 August 2016 –
commercial
Weighted average
rental per unit at
31 August 2016 –
residential
Rental income
R’000Site area
m²GLA
m²
Vacancy at
31 August 2016
%
Silverton and surrounding areas – continuedThe Tannery Industrial Park*
Industrial park 45 – 17 352 64 834 39 268 24.4
Weighted average per location 41 4 670 63 038 201 961 126 752 13.3
SunnysideKarelia Flats* 48 flats – 3 935 2 264 1 276 1 464 1.8 Les Nize Flats* 55 flats – 3 723 2 433 992 1 456 7.1Savyon Place* Shops and 28 flats 153 5 039 2 921 1 637 2 646 – Selmar* 19 flats – 4 995 1 120 1 276 1 512 6.4 Sunnyside Galleries* Offices, shops and
5 flats 71 5 143 3 434 5 369 4 116 – The Pavilion* Shops 138 – 4 291 3 448 2 350 – The Village* Shops 73 – 4 043 7 226 5 023 4.6 Unity Heights* Shops and 24 flats 118 5 837 2 429 1 211 2 254 1.6 Weighted average per location 92 4 444 22 935 22 435 20 821 2.4
Octodec Investments Limited | Property Portfolio Information

>48
m2% of total vacancies
% of total gross let-table area
% of total portfolio
properties held for
redevelop-ment
% of core vacancies
2.2 Vacancy profile by locationJohannesburg CBD 114 172 43.8 26.8 (13.6) 13.2 Tshwane CBD 77 041 30.3 15.3 (7.4) 8.1 Tshwane West 6 892 2.6 6.9 (0.1) 6.8 Silverton and surrounding areas 16 868 6.5 13.3 0.0 13.3 Johannesburg and surrounding areas 14 384 5.5 10.2 0.0 9.7 Tshwane Arcadia 13 118 5.0 16.7 0.0 16.7 Hatfield 4 109 0.8 5.8 0.0 5.8 Tshwane North 3 353 0.8 12.8 (1.5) 11.2 Hermanstad 2 596 0.9 7.0 0.0 7.0 Waverley, Gezina, Moot 2 685 0.7 4.1 0.0 4.1 Tshwane East 2 387 2.6 15.6 0.0 15.6 Sunnyside 495 0.2 2.4 0.0 2.4 Centurion 2 167 0.1 6.1 (3.1) 3.0 Tshwane Other 390 0.1 1.7 0.0 1.7 Total 2016 260 657 100.0 15.6 (5.8) 9.8 Total 2015 254 536 100.0 15.1 (6.0) 9.1
property portfolio analysisfor the year ended 31 august 2016
rental income
property value
gross lettable area
site area
R’000% of total portfolio R'000
% of total portfolio m2
% of total portfolio m2
% of total portfolio
2.1 Geographical spread by locationTshwane CBD 458 711 32.2 4 301 720 34.1 504 417 30.2 347 825 21.7 Johannesburg CBD 320 929 22.5 2 665 300 21.1 426 330 25.5 103 007 6.4Johannesburg and surrounding areas
170 678 12.0 1 526 622 12.1 141 423 8.5 207 532 13.0 Hatfield 101 507 7.1 925 100 7.3 70 274 4.2 45 486 2.8 Tshwane Arcadia 75 815 5.3 637 868 5.1 78 422 4.7 60 077 3.7 Silverton and surrounding areas 63 038 4.4 521 100 4.1 126 752 7.6 201 961 12.5 Waverley, Gezina, Moot 57 982 3.7 498 700 4.0 64 973 3.9 135 153 8.4 Tshwane West 41 614 2.9 319 500 2.5 99 228 5.9 232 425 14.5 Centurion 32 097 2.3 285 600 2.3 35 330 2.1 53 828 3.3 Tshwane Other 28 904 2.0 250 100 2.0 22 491 1.3 40 277 2.5 Tshwane East 22 402 1.6 219 700 1.7 15 335 0.9 8 664 0.6 Sunnyside 22 935 1.6 161 900 1.3 20 821 1.2 22 435 1.4 Tshwane North 20 081 1.4 158 700 1.3 26 254 1.6 57 293 3.6 Hermanstad 1 4 176 1.0 134 800 1.1 37 069 2.2 84 683 5.2 Total 2016 1 430 869 100.0 12 606 710 100.0 1 669 120 100.0 1 600 646 100.0 Total 2015 1 325 611 100.0 11 897 677 100.0 1 690 912 100.0 1 610 922 100.0
Total GLAVacancy GLA m2
% of total vacancies
% of sector gross
lettable area
GLA of properties
held for redevelop-
ment Vacancy -
GLA - core% of core vacancies
2.3 Vacancies by sectorOffices 489 750 170 137 65.3 34.7 94 961 75 176 15.3 Retail shops 432 456 39 513 15.2 9.1 – 39 513 9.1 Industrial 288 908 31 266 12.0 10.8 – 31 266 10.8 Residential 366 827 14 824 5.7 4.0 1 652 13 172 3.6 Shopping centres 91 179 4 917 1.9 5.4 – 4 917 5.4 Total 2016 1 669 120 260 657 100.0 15.6 96 613 164 044 9.8 Total 2015 1 690 912 254 536 100.0 15.1 100 831 153 705 9.1 Some properties were remeasured and some reclassifications made to the 31 August 2015 values to ensure comparability to the current year.
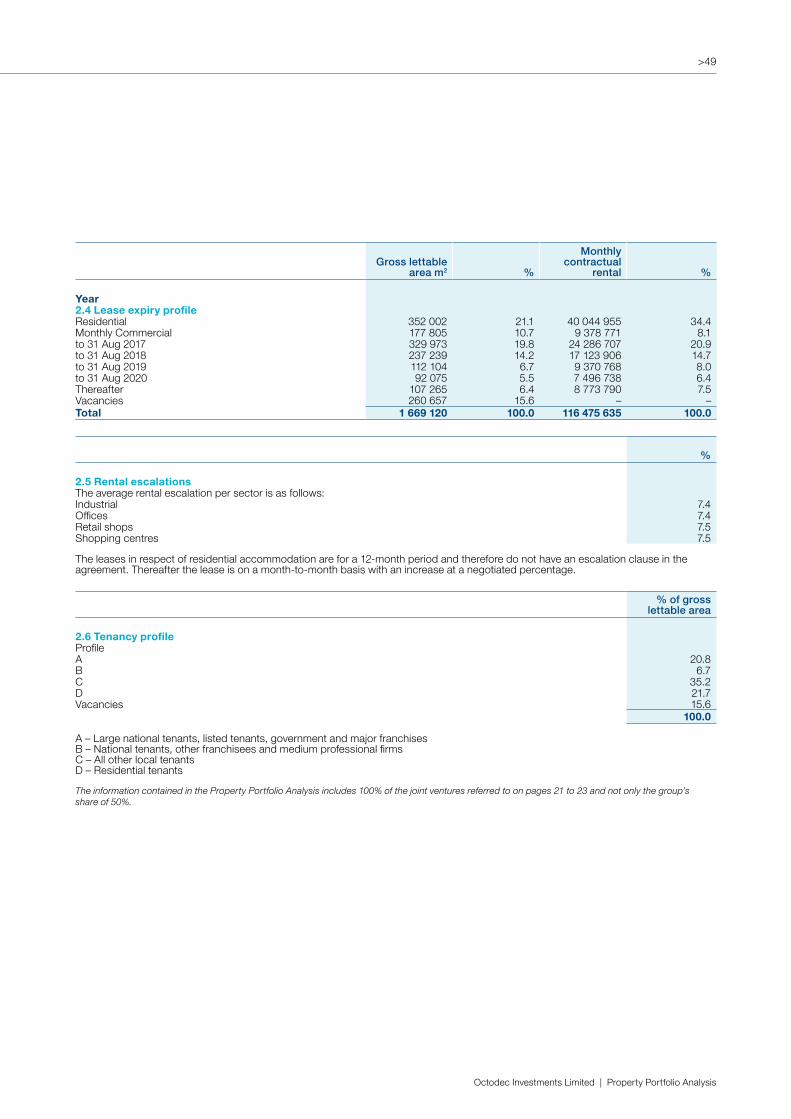
>49
Octodec Investments Limited | Property Portfolio Analysis
Gross lettable area m2 %
Monthly contractual
rental %
Year2.4 Lease expiry profileResidential 352 002 21.1 40 044 955 34.4Monthly Commercial 177 805 10.7 9 378 771 8.1to 31 Aug 2017 329 973 19.8 24 286 707 20.9to 31 Aug 2018 237 239 14.2 17 123 906 14.7to 31 Aug 2019 112 104 6.7 9 370 768 8.0to 31 Aug 2020 92 075 5.5 7 496 738 6.4Thereafter 107 265 6.4 8 773 790 7.5Vacancies 260 657 15.6 – – Total 1 669 120 100.0 116 475 635 100.0
%
2.5 Rental escalationsThe average rental escalation per sector is as follows:Industrial 7.4Offices 7.4Retail shops 7.5Shopping centres 7.5
The leases in respect of residential accommodation are for a 12-month period and therefore do not have an escalation clause in the agreement. Thereafter the lease is on a month-to-month basis with an increase at a negotiated percentage.
The information contained in the Property Portfolio Analysis includes 100% of the joint ventures referred to on pages 21 to 23 and not only the group’sshare of 50%.
% of gross lettable area
2.6 Tenancy profileProfileA 20.8B 6.7C 35.2D 21.7Vacancies 15.6
100.0
A – Large national tenants, listed tenants, government and major franchisesB – National tenants, other franchisees and medium professional firmsC – All other local tenantsD – Residential tenants

>50
schedule of interestin subsidiariesfor the year ended 31 august 2016
Subsidiary name
Cost of shares2016
Cost of shares2015
Amounts owing by / (to)
subsidiaries2016
Amounts owing by / (to)
subsidiaries2015
R R R R
Alert Investments Share Block Proprietary Limited 600 600 (600) (600)Anke Properties Proprietary Limited 1 000 1 000 21 429 626 (1 189 572)Carine Properties Share Block Proprietary Limited 107 875 107 875 (300) (300)Cold Air Investments Share Block Proprietary Limited 1 000 1 000 (1 000) (1 000)Dirk du Toit Share Block Proprietary Limited* 100 100 (100) (100)Dusku Investments Share Block Proprietary Limited 803 933 803 933 (100) (100)Elarduspark Shopping Centre Proprietary Limited 7 362 821 7 362 821 (1 000) (1 000)Erf 181 Hermanstad Share Block Proprietary Limited 100 100 (100) (100)Erf 651 Pretoria North Share Block Proprietary Limited 1 000 1 000 (1 000) (1 000)Erf 809 Share Block Proprietary Limited* 95 95 (95) (95)Fawn Properties Share Block Proprietary Limited 200 200 (200) (200)Frederika Straat Beleggings Share Block Proprietary Limited 100 100 (100) (100)Gezfarm Properties Share Block Proprietary Limited 1 000 1 000 (1 000) (1 000)Goleda Properties Share Block Proprietary Limited 200 200 (200) (200)Hannyhof Share Block Proprietary Limited 1 000 1 000 (1 000) (1 000)Hardwood Properties Share Block Proprietary Limited 3 3 (3) (3)Henwoods (Pretoria) Development Company Share Block Proprietary Limited*
1 000 1 000 (1 000) (1 000)
Heracle Share Block Proprietary Limited 753 047 753 047 (8 442) (8 442)Indacom Properties Share Block Proprietary Limited* 16 16 (16) (16)IPS Investments Proprietary Limited^ 968 968 896 605 824 614 648 878 Janvoel Properties Share Block Proprietary Limited 1 000 1 000 (1 000) (1 000)Karkap Properties Share Block Proprietary Limited 100 100 (100) (100)Killarney Mall Properties Proprietary Limited 2 392 153 2 392 153 257 527 041 234 374 774Lasmitch Properties Share Block Proprietary Limited 1 000 1 000 (1 000) (1 000)Lutbridge Investment Share Block Proprietary Limited 70 70 (70) (70)Metromitch Share Block Proprietary Limited 100 100 (100) (100)Middle Pip Share Block Proprietary Limited 1 000 1 000 (1 000) (1 000)Mitchpap Share Block Proprietary Limited* 200 200 (200) (200)Muntstreet Properties Share Block Proprietary Limited* 1 000 1 000 (1 000) (1 000)Nedwest Centre Share Block Proprietary Limited 4 000 4 000 (4 000) (4 000)Octprop Properties Proprietary Limited 100 100 26 094 187 25 541 226Panag Investments Share Block Proprietary Limited 200 200 19 667 19 667Potproes Properties Share Block Proprietary Limited 3 086 426 3 086 426 (1 000) (1 000)Premium Properties Limited# 3 024 919 806 3 024 919 806 338 945 166 (162 092 535)Presmooi Proprietary Limited* 523 031 523 031 869 348 393 599 213 494Pretboy Share Block Proprietary Limited 100 100 (100) (100)Pretvin Share Block Proprietary Limited 4 000 4 000 (4 000) (4 000)Pretwade Share Block Proprietary Limited 2 2 (2) (2)Prinsben Properties Share Block Proprietary Limited* 1 000 1 000 (1 000) (1 000)Prinstruben Share Block Proprietary Limited 1 000 1 000 (1 000) (1 000)Ramreg Properties Proprietary Limited 1 1 4 676 409 4 488 268Rovon Investments Share Block Proprietary Limited* 316 642 316 642 (4) (4)Rumpro Investments Share Block Proprietary Limited 1 713 213 1 713 213 (120) (120)SKD Beleggings (Skof Vyf) Share Block Proprietary Limited 100 100 (100) (100)Steynscor Share Block Proprietary Limited 18 18 (18) (18)Swemvoor Investments Share Block Proprietary Limited 100 100 (100) (100)Talkar Properties Share Block Proprietary Limited 100 100 (100) (100)Tribeca Properties Proprietary Limited 11 752 737 11 752 737 57 246 503 45 853 455Tronap Investments Share Block Proprietary Limited 100 100 (100) (100)Tuel Share Block Proprietary Limited 300 300 (300) (300)Viskin Share Block Proprietary Limited 1 000 1 000 (1 000) (1 000)Waverley Plaza Properties Proprietary Limited 794 399 794 399 117 834 410 148 469 595Woodmead Mart Proprietary Limited 3 438 345 3 438 345 308 258 061 188 059 086
3 057 989 401 3 057 989 401 2 897 931 750 1 697 352 666
All the subsidiaries are 100% owned by the company and the places of business are in the Republic of South Africa and are all included in the consolidated financial statements of the group. The subsidiaries’ principal activities are that of property companies, deriving income from rentals. There are no restrictions on thesubsidiaries other than the cession of shares to secure long-term borrowings. *Ceded shares securing long-term borrowings (note 16).

>51
Octodec Investments Limited | Schedule of Interest in Subsidiaries
schedule of interestin subsidiaries – continuedfor the year ended 31 august 2016
# Premium Properties Limited – wholly owned subsidiaries Bartlucia Investments Share Block Proprietary Limited Brianley Properties Share Block Proprietary Limited Burnfield Properties Proprietary Limited Centpret Properties Proprietary Limited Centuria 369 Proprietary Limited Du-Proes Share Block Proprietary Limited Filkem House Share Block Proprietary Limited Hacklu Enterprises Share Block Proprietary Limited L.P.A. Beleggings Share Block (Eiendoms) Beperk Landjack Properties Proprietary Limited Notrevlis Share Block Proprietary Limited Prinsman Properties Share Block Proprietary Limited Prinsproes Properties Share Block Proprietary Limited Rezmep Investments Share Block Proprietary Limited Roslev Properties Share Block Proprietary Limited Savyon Building Proprietary Limited Tomzeil Share Block Proprietary Limited ^ IPS Investments Proprietary Limited – wholly owned subsidiaries Inspret Properties Proprietary Limited Grariv Properties Share Block Proprietary Limited Johnbuild Properties Proprietary Limited Joybee Properties Proprietary Limited OPC Properties Proprietary Limited Simprit Properties Share Block Proprietary Limited Vuselela Investments Proprietary Limited Waltpost Properties Proprietary Limited

Number of shareholdings
% of total shareholdings
Number of shares
% of issued capital
Shareholders’ classification1 - 1 000 621 18.30 318 531 0.131 001 - 10 000 1 818 53.58 7 260 913 2.8510 001 - 100 000 721 21.25 22 605 878 8.88100 001 - 1 000 000 180 5.31 55 984 954 21.99Over 1 000 000 53 1.56 168 381 044 66.15Total 3 393 100.00 254 551 320 100.00
Beneficial shareholders with a holding greater than 3% of the issued sharesLefkopaul CC 19 994 725 7.85Tomneff Investments Proprietary Limited 16 680 146 6.55Old Mutual Group 12 571 370 4.94Government Employees Pension Fund 14 883 752 5.85Stanlib 14 757 054 5.80City Property Administration Proprietary Limited 11 538 176 4.53Total 90 425 223 35.52
Share price performance
Opening price 02 September 2015 R24.25Closing price 31 August 2016 R22.99Closing high for peroid R25.84Closing low for peroid R19.91
Number of shares in issue 254 551 320 Volume traded during period 31 044 349 Ratio of volume traded to shares issued (%) 12.20Rand value traded during the period R705 003 829.00Market capitalisation at 31 August 2016 R5 852 134 847.00
shareholders’analysisfor the year ended 31 August 2016
Distribution of shareholdersAssurance companies 22 0.65 5 020 919 1.97Close corporations 60 1.77 26 158 475 10.28Collective investment schemes 109 3.21 58 313 847 22.92Custodians 25 0.74 2 475 282 0.97Foundations and charitable funds 92 2.71 6 685 834 2.63Hedge funds 1 0.03 1 339 0.00Insurance companies 2 0.06 12 569 0.00Investment partnerships 8 0.24 78 569 0.03Managed funds 16 0.47 278 765 0.11Medical aid funds 2 0.06 156 056 0.06Organs of state 4 0.12 17 192 139 6.75Private companies 137 4.04 69 621 020 27.35Public companies 2 0.06 38 027 0.01Public entities 3 0.09 118 920 0.05Retail shareholders 2 328 68.61 26 602 198 10.45Retirement benefit funds 93 2.73 14 397 049 5.66Scrip lending 7 0.21 516 562 0.20Stockbrokers and nominees 16 0.47 1 289 258 0.51Trusts 465 13.70 25 594 393 10.05Unclaimed scrip 1 0.03 99 0.00Total 3 393 100.00 254 551 320 100.00
Fund managers with a holding greater than 3% of the issued sharesStanlib Asset Management 17 924 301 7.04Public Investment Corporation 15 218 036 5.98Old Mutual Investment Group 12 846 866 5.05Total 45 989 203 18.07
Shareholder typeNon-public shareholdersDirectors and associates 67 1.92 96 710 165 37.99Public shareholders 3 326 98.08 157 841 155 62.01Total 3 393 100.00 254 551 320 100.00
>52
>53
Octodec Investments Limited | Glossary
Act Companies Act, No 71 of 2008CBD Central business districtCity Property City Property Administration Proprietary LimitedConsolidated Octodec and its subsidiariesGLA Gross lettable areaGroup Octodec, its subsidiaries and joint venturesIAS International Accounting StandardsIFRS International Financial Reporting StandardsJIBAR The Johannesburg Interbank Agreed RateJSE JSE LimitedPrime Interest rate charged by banks to creditworthy clientsREIT Real Estate Investment Trust as defined in section 1 of the Income Tax Act
glossary
Produced by ahcomm & green grass design

Gandhi Square
HIGH COURT
CARLTON
Johannesburg
CBD
Troye St
Von Wielligh St
Anderson St
Rissik St
Harrison St
Simmonds St
> Albertina Sisulu Rd
Market St
R29
Comm
issioner StPritchard St