Embed Size (px)
Citation preview

Copyright 2016 TRAC Intermodal
TRAC Intermodal Quarter Ended March 31, 2016
Earnings Release – May 10, 2016

Copyright 2016 TRAC Intermodal
Forward Looking Statements and Use of Non-GAAP Information
FORWARD LOOKING STATEMENTS
• This Presentation contains certain “forward-looking statements” within the meaning of the Private Securities Litigation Reform Act of 1995, which
reflect our current views with respect to, among other things, future events (including, but not limited to, import container growth, chassis supply
trends and the shift to the motor carrier model) and financial performance. Readers can identify these forward-looking statements by the use of
forward-looking words such as “outlook,” “believes,” “expects,” “potential,” “continues,” “may,” “will,” “should,” “seeks,” “approximately,” “predicts,”
“intends,” “plans,” “estimates,” “anticipates”, “projects”, “likely”, “would” or the negative version of those words or other comparable words. Any
forward-looking statements contained in the Presentation are based upon our historical performance and on our current plans, estimates and
expectations. The inclusion of this forward-looking information should not be regarded as a representation by us or any other person that the future
plans, estimates or expectations contemplated by us will be achieved. Such forward-looking statements are subject to various risks, uncertainties
and assumptions relating to our operations, financial results, financial condition, business prospects, growth strategy and liquidity. If one or more of
these or other risks or uncertainties materialize, or if our underlying assumptions prove to be incorrect, our actual results may vary materially from
those indicated in these statements. Accordingly, you should not place undue reliance on any forward-looking statements.
• Important factors that could cause actual results to differ materially from those in the forward-looking statements include, without limitation, the
following: the volume of world trade due to economic, political, or other factors; increased operating costs; increased regulatory costs; defaults by our
customers; third-party strikes; and, the demand for chassis. More information about potential factors that could affect our business and financial
results is included in our filings with the SEC, including our Annual Report on Form 10-K, Quarterly Reports on Form 10-Q and Current Reports on
Form 8-K.
• The Company undertakes no obligation to update the forward-looking information or any of the information contained in this Presentation.
USE OF NON-GAAP INFORMATION
• There are non-GAAP measures used in this Presentation, including Adjusted EBITDA, Adjusted net income and free cash flow. The Company
believes that such non-GAAP measures are appropriate measures of the operating performance of the Company. Additionally, certain of the
Company’s debt covenant calculations use Adjusted EBITDA. The Company’s calculation of these measures may differ from the methodology used
by other companies and, accordingly, may not be comparable to other companies. Adjusted EBITDA is defined as income before income taxes,
interest expense, depreciation and amortization expense, impairment of assets and leasing equipment, early retirement of leasing equipment, loss
on modification and extinguishment of debt and capital lease obligations, other expense (income), interest income, non-cash share-based
compensation and principal collections on direct finance leases. Adjusted net income is defined as net income before non-cash interest expense
related to deferred financing fees, non-cash share-based compensation, loss on modification and extinguishment of debt and capital lease
obligations, terminations, modification, and fair value adjustments of derivative instruments and other non-routine, non-cash items as determined by
management. Free cash flow is defined as Adjusted EBITDA less Cash Interest Accrued. Adjusted EBITDA, Adjusted net income and free cash
flow are not measures recognized under GAAP and are therefore unlikely to be comparable to similar measures presented by other companies and
do not have a standardized meaning prescribed by GAAP. Management uses Adjusted EBITDA, Adjusted net income and free cash flow to provide
comparative information about performance. A reconciliation of Adjusted EBITDA, Adjusted net income (and free cash flow to net income is
provided on slide 15. A reconciliation of segment Adjusted EBITDA is provided on the slides 16.
2

Copyright 2016 TRAC Intermodal
• Revenue of $168.3 million, a decrease of -$0.5 million in Q1 2016 vs. Q1 2015
• Adjusted EBITDA¹ of $51.3 million, lower by -$10.6 million in Q1 2016 vs. Q1 2015
• Free cash flow¹ of $40.2 million in Q1 2016 vs. $47.0 million in Q1 2015
• Leverage ratio reduced from 5.5x in Q1 2015 to 5.4x in Q1 2016
Executive Summary – Q1 2016
3
• Average on-hire fleet remained relatively unchanged at 258,000 from Q1 2016 vs. Q1 2015
− Net average fleet size driven primarily by the final acquisition of chassis from the 2015
Domestic new remanufactured program offset by fewer Marine chassis on term leases
• Active fleet utilization decreased to 93.9% at March 31, 2016 from 95.8% at March 31, 2015
− Lower Marine chassis pool utilization in Q1 2015
• Facilitating shipping line’s conversion to the motor carrier model for chassis provisioning
• Initiate key customer service initiatives
• In-sourcing of select operational activities
• Realignment of cost structure to better match regional chassis demand
1 See slide 15 for a reconciliation of Adjusted EBITDA and free cash flow to net income
Financial
Performance
Chassis Fleet
Key Initiatives

Copyright 2015 TRAC Intermodal
Summary of Financial Performance – Q1 2016
• Revenues were $0.5 million lower in Q1 2016 vs. Q1 2015
− Marine Market segment revenues were down -3%
− Domestic Market segment revenues grew 6%
• Adjusted EBITDA¹ was $10.6 million lower in Q1 2016 vs. Q1 2015
− Marine Market segment Adjusted EBITDA² decreased -29%
− Domestic Market segment Adjusted EBITDA² was flat to last year
4
Summary Income Statement for the Quarter ended March 31st
1 See slide 15 for a reconciliation of Adjusted EBITDA and Adjusted Net Income to net income
2 See slide 16 for a reconciliation of segment Adjusted EBITDA to net income
$ millions B / (W) vs. 2015
2015 2016 $ %
Revenue 168.8$ 168.3$ (0.5)$ 0%
Direct operating expenses 85.0 94.2 (9.2) -11%
All other expenses 64.3 62.5 1.8 3%
Net income before tax 19.5 11.6 (7.9) -41%
Net income 12.2$ 7.0$ (5.2)$ -43%
Adjusted EBITDA¹ 61.9$ 51.3$ (10.6)$ -17%
Adjusted net income¹ 16.7$ 11.5$ (5.1)$ -31%
Copyright 2016 TRAC Intermodal
Containers
International Domestic Total
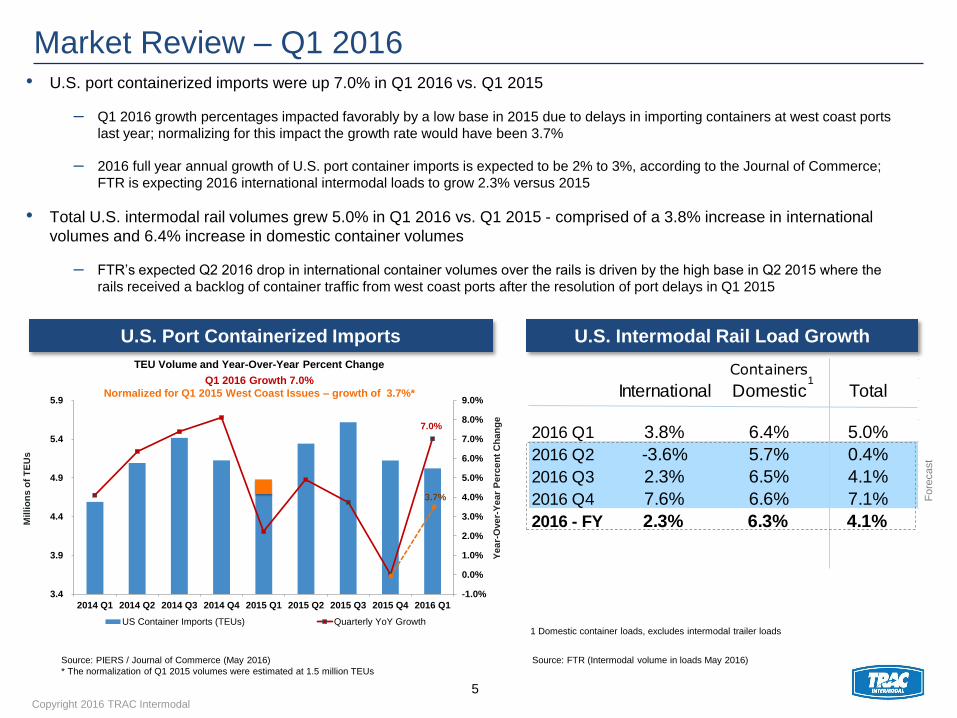
2016 Q1 3.8% 6.4% 5.0%
2016 Q2 -3.6% 5.7% 0.4%
2016 Q3 2.3% 6.5% 4.1%
2016 Q4 7.6% 6.6% 7.1%
2016 - FY 2.3% 6.3% 4.1%
Market Review – Q1 2016
5
• U.S. port containerized imports were up 7.0% in Q1 2016 vs. Q1 2015
– Q1 2016 growth percentages impacted favorably by a low base in 2015 due to delays in importing containers at west coast ports
last year; normalizing for this impact the growth rate would have been 3.7%
– 2016 full year annual growth of U.S. port container imports is expected to be 2% to 3%, according to the Journal of Commerce;
FTR is expecting 2016 international intermodal loads to grow 2.3% versus 2015
• Total U.S. intermodal rail volumes grew 5.0% in Q1 2016 vs. Q1 2015 - comprised of a 3.8% increase in international
volumes and 6.4% increase in domestic container volumes
– FTR’s expected Q2 2016 drop in international container volumes over the rails is driven by the high base in Q2 2015 where the
rails received a backlog of container traffic from west coast ports after the resolution of port delays in Q1 2015
U.S. Intermodal Rail Load Growth
Source: FTR (Intermodal volume in loads May 2016)
1
1 Domestic container loads, excludes intermodal trailer loads
U.S. Port Containerized Imports
Source: PIERS / Journal of Commerce (May 2016)
* The normalization of Q1 2015 volumes were estimated at 1.5 million TEUs
Q1 2016 Growth 7.0%
Normalized for Q1 2015 West Coast Issues – growth of 3.7%*
TEU Volume and Year-Over-Year Percent Change
Fo
recast
-1.0%
0.0%
1.0%
2.0%
3.0%
4.0%
5.0%
6.0%
7.0%
8.0%
9.0%
3.4
3.9
4.4
4.9
5.4
5.9
2014 Q1 2014 Q2 2014 Q3 2014 Q4 2015 Q1 2015 Q2 2015 Q3 2015 Q4 2016 Q1
US Container Imports (TEUs) Quarterly YoY Growth
Mil
lio
ns
of
TE
Us
Ye
ar-
Ove
r-Y
ea
r P
erc
en
t C
ha
ng
e
7.0%
3.7%
Copyright 2016 TRAC Intermodal
Revenue Drivers – Marine and Domestic Market Segments
6
¹ Per Diem Revenue in $ thousands - represents revenues billed under operating leases and excludes amounts billed to lessees for maintenance and repair, positioning and handling,
and other ancillary charges
² Average Total Fleet in units - based upon the total fleet at each month end
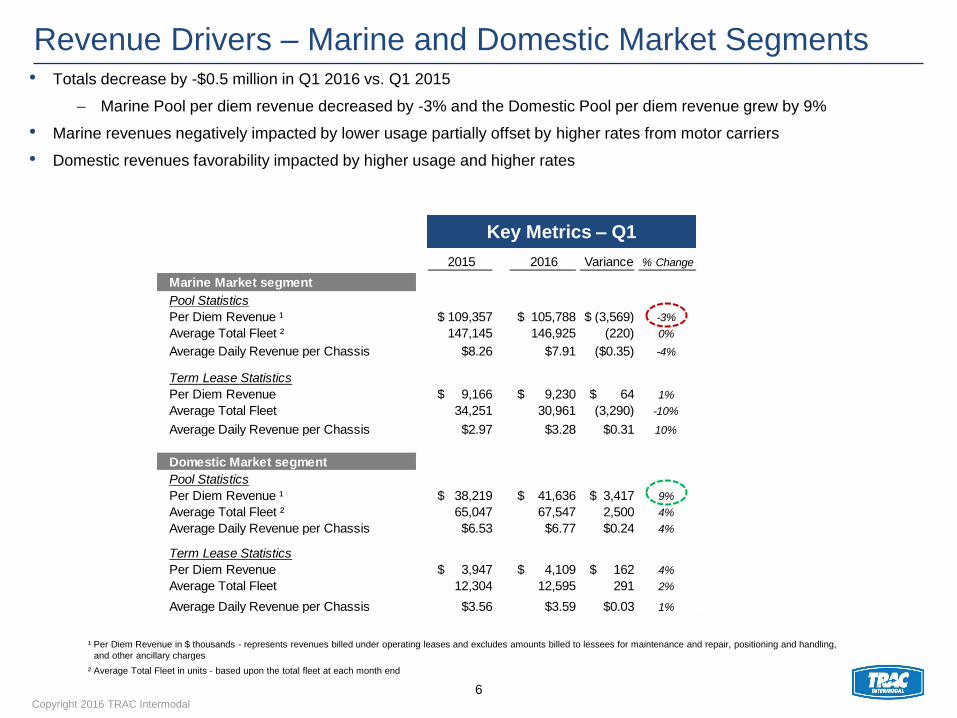
• Totals decrease by -$0.5 million in Q1 2016 vs. Q1 2015
– Marine Pool per diem revenue decreased by -3% and the Domestic Pool per diem revenue grew by 9%
• Marine revenues negatively impacted by lower usage partially offset by higher rates from motor carriers
• Domestic revenues favorability impacted by higher usage and higher rates
Key Metrics – Q1
2015 2016 Variance % Change
Marine Market segment
Pool Statistics
Per Diem Revenue ¹ $ 109,357 $ 105,788 $ (3,569) -3%
Average Total Fleet ² 147,145 146,925 (220) 0%
Average Daily Revenue per Chassis $8.26 $7.91 ($0.35) -4%
Term Lease Statistics
Per Diem Revenue $ 9,166 $ 9,230 $ 64 1%
Average Total Fleet 34,251 30,961 (3,290) -10%
Average Daily Revenue per Chassis $2.97 $3.28 $0.31 10%
Domestic Market segment
Pool Statistics
Per Diem Revenue ¹ $ 38,219 $ 41,636 $ 3,417 9%
Average Total Fleet ² 65,047 67,547 2,500 4%
Average Daily Revenue per Chassis $6.53 $6.77 $0.24 4%
Term Lease Statistics
Per Diem Revenue $ 3,947 $ 4,109 $ 162 4%
Average Total Fleet 12,304 12,595 291 2%
Average Daily Revenue per Chassis $3.56 $3.59 $0.03 1%

Copyright 2015 TRAC Intermodal
Quarterly Revenue and Adjusted EBITDA Trends
• Revenue: difficult comparison to last year due to high volumes on the west coast in 2015
− Q1 ’16 volumes at reduced levels due to the west coast correction in Q1 ‘15 and lower import / export volumes,
partially offset by increased rates and strong Domestic pool results
• Adjusted EBITDA¹: lower Q1 ’16 results due to lower utilization and higher frequency of repairs for Marine pool chassis
− West coast labor rates and repairs frequency along with increased fixed facility costs at the east coast ports added to
overall costs
7
Quarterly Revenue
($ millions)
Quarterly Adjusted EBITDA¹
($ millions)
1 See slide 15 for a reconciliation of Adjusted EBITDA to net income
$52.2
$61.9
$51.3
$44.6
$55.4
$49.3
$55.8 $54.8 $54.1
$25
$30
$35
$40
$45
$50
$55
$60
$65
Q1 14 Q1 15 Q1 16 Q2 14 Q2 15 Q3 14 Q3 15 Q4 14 Q4 15
$139.7
$168.8 $168.3
$152.4
$177.6
$167.1
$177.2
$167.8 $167.9
$100
$110
$120
$130
$140
$150
$160
$170
$180
$190
Q1 14 Q1 15 Q1 16 Q2 14 Q2 15 Q3 14 Q3 15 Q4 14 Q4 15

Copyright 2015 TRAC Intermodal
Year ended
Q1 '15 Q1 '16 2015
Adjusted EBITDA¹ 61.9$ 51.3$ 227.2$
Cash Interest Expense² (14.9) (11.1) (53.5)
Free Cash Flow¹ 47.0$ 40.2$ 173.7$
Capital Expenditures
Capital Expenditures and Free Cash Flow
• Invested $36.4 million of capital for chassis in Q1 2016
− Domestic chassis capital for remanufacture units to complete the 2016 program
− Marine chassis capital for refurbishment units
• $40.2 million of free cash flow¹ generated in Q1 2016
− Reduced cash interest expense due to lower interest rate in ABL facility and the reduction of 2nd Lien Notes outstanding
− Fleet maintenance spending is captured in the income statement
8
($ millions)
Free Cash Flow²
($ millions)
2 Cash Interest Expense excludes non-cash interest expense items, including deferred financing fees, amortized losses on terminations of derivative instruments and fair value adjustments
for derivative instruments. Bond interest which is paid Q1 and Q3 is accrued in Cash Interest Expense.
1 See slide 15 for a reconciliation of Adjusted EBITDA and Free Cash Flow to net income
Q1 '15 Q1 '16
Domestic Chassis 10.0$ 12.2$
Marine Chassis 2.2 24.2
Purchase of Leasing
Assets 12.2$ 36.4$

Copyright 2016 TRAC Intermodal
3/31/2015 12/31/2015 3/31/2016
ABL Facility Size 1,250.0$ 1,300.0$ 1,300.0$
Available Assets (85% x Eligible Assets) 1,161.2 1,210.5 1,205.9
Excess Availability 401.2 343.5 266.9
Cash 8.1$ 3.2$ 1.4$
Cash Rate Maturity
ABL Facility Libor + 200 Dec '20 760.0 867.0 939.0
Capital Leases 4.9% Various 89.2 63.7 60.3
2nd Lien Notes 11.0% Aug '19 300.0 150.0 150.0
Total Debt 4.0% ¹ 1,149.2$ 1,080.7$ 1,149.3$
Member's Interest ² 544.6$ 568.7$ 525.2$
Total Debt and Equity 1,693.8$ 1,649.4$ 1,674.5$
LTM Consolidated EBITDA³ 210.7 227.2 214.7
Total Debt / LTM Adj. EBITDA 5.5x 4.8x 5.4x
Capital Structure • Leverage ratio decreased 0.1x in Q1 2016 vs. Q1 2015, and increased 0.6x from prior quarter
− Total debt increased by $68.6 million in Q1 2016 vs. the prior quarter primarily due to $36.4 million of chassis capital
spending, the acquisition of Interstar for $4.7 million in net cash and $51.2 million of dividend payments, partially
offset by operating cash flows
− In compliance with all covenants across the ABL Facility, Capital Leases and Notes
9
Capital Structure
¹ Weighted cash interest rate at 3/31/2016 – includes cash impact of interest rate swaps and unused fees
² Member’s interest is the equivalent of shareholder’s equity for LLC entities
³ Consolidated EBITDA is a defined term from the Company’s ABL Credit Facility agreement, and is comprised of Adjusted EBITDA excluding $1.9 million of costs for a
terminated debt offering and other non-recurring professional fees. See slide 15 for a reconciliation of Adjusted EBITDA to net income
($ millions)

Copyright 2016 TRAC Intermodal
For More Information
10
Investor Relations:
Blake Morris
+1 609.986.0270
TRAC Intermodal LLC,
750 College Rd East,
Princeton, NJ, 08540
www.tracintermodal.com
+1 609.452.8900
TRAC Intermodal is North America’s leading intermodal
equipment provider and chassis pool manager, measured
by total assets. TRAC Intermodal provides short term
rentals through an extensive chassis pool network, long
term chassis leasing and pool/fleet management through
the utilization of its proprietary PoolStat® information
management system. TRAC Intermodal’s active fleet
consists of approximately 278,000 chassis. TRAC
Intermodal has a broad operating footprint with
approximately 600 marine, 160 domestic and 60 depot
locations across North America and is the leader in
providing chassis solutions to the intermodal industry.

Copyright 2016 TRAC Intermodal
Appendix
11

Copyright 2015 TRAC Intermodal
2015 2016 Variance
Revenues:
Equipment leasing revenue 160,689$ 160,763$ 0%
Finance revenue 406 344 -15%
Other revenue 7,660 7,235 -6%
Total revenues 168,755$ 168,342$ 0%
Expenses:
Direct operating expense 84,951$ 94,211$ -11%
Selling, general and administrative expenses 21,276 26,414 -24%
Depreciation expense 17,901 18,846 -5%
Provision (recovery) for doubtful accounts 2,072 (965) NM
Other expense, net 879 1,539 -75%
Interest expense, net 22,096 16,705 24%
Loss on modification and extinguishment of debt and
capital lease obligations39 - 100%
Total expenses 149,214 156,750 -5%
Income before provision for income taxes 19,541$ 11,592$ -41%
Provision / (benefit) for income taxes 7,380 4,634 37%
Net income 12,161$ 6,958$ -43%
Adjusted EBITDA¹
EBITDA 60,456$ 48,682$ -19%
Plus: DFL collections 1,225 758 -38%
Plus: Non-cash stock compensation 247 56 -77%
Plus: Bond fees and M&A costs - 1,789 NM
Adjusted EBITDA¹ 61,928$ 51,285$ -17%
Adjusted net income¹ 16,683$ 11,544$ -31%
Three months ended March 31,
Income Statement
12
Consolidated Income Statement
¹ See slide 15 for a reconciliation of Adjusted EBITDA and Adjusted Net Income to net income
Unaudited – Quarter ended March 31st numbers for 2015 and 2016
($ thousands)
NM – not meaningful as either 2015 or 2016 was a negative number

Copyright 2015 TRAC Intermodal
December 31, March 31,
2015 2016
Assets
Cash and cash equivalents 3,161$ 1,429$
Accounts receivable, net 110,662 108,187
Net investment in direct finance leases 12,797 12,757
Leasing equipment, net 1,435,978 1,432,568
Goodwill 251,907 256,815
Other assets 32,991 40,601
Total assets 1,847,496$ 1,852,357$
Liabilities and member's interest
Accounts payable and accrued expenses 88,933$ 62,478$
Deferred income taxes, net 127,580 132,752
Debt and capital lease obligations:
Current portion 41,396 45,150
Non-current portion 1,039,283 1,104,167
Total debt and capital lease obligations 1,080,679 1,149,317
Less unamortized debt issuance costs 18,350 17,393
Total debt and capital lease obligations less debt issuance costs 1,062,329 1,131,924
Total liabilities 1,278,842 1,327,154
Member's interest
Member's interest 586,757 542,320
Accumulated other comprehensive loss (18,103) (17,117)
Total member's interest 568,654 525,203
Total liabilities and member's interest 1,847,496$ 1,852,357$
Balance Sheet
13
Consolidated Balance Sheet
($ thousands)
Unaudited – March 31, 2016

Copyright 2016 TRAC Intermodal
Three months ended March 31,
2015 2016
Cash flows from operating activities
Net income 12,161$ 6,958$
Depreciation and amortization 17,940 18,863
Other adjustments to reconcile net loss to net cash provided by operating activities 18,926 11,655
Changes in assets and liabilities (22,026) (13,141)
Net cash provided by operating activities 27,001$ 24,335$
Cash flows from investing activities
Collections on net investment in direct finance leases, net of interest earned 1,225$ 758$
Purchase of leasing equipment (12,158) (36,450)
Acquisitions - (4,706)
Other investing activities 3,201 (2,709)
Net cash used in investing activities (7,732)$ (43,107)$
Cash flows from financing activities
Proceeds from debt 54,000$ 109,500$
Repayments of debt (69,064) (41,062)
Dividend paid - (51,185)
Other financing activities - (293)
Net cash (used in) provided by financing activities (15,064)$ 16,960$
Effects of changes in exchange rates on cash and cash equivalents (353) 80
Net increase (decrease) in cash and cash equivalents 3,852$ (1,732)$
Cash and cash equivalents, beginning of period 4,256$ 3,161$
Cash and cash equivalents, end of period 8,108$ 1,429$
Cash Flow Statement
14
Cash Flows
Unaudited – Quarter ended March 31st numbers for 2015 and 2016
($ thousands)

Copyright 2015 TRAC Intermodal
Q1 2014 Q2 2014 Q3 2014 Q4 2014 Q1 2015 Q2 2015 Q3 2015 Q4 2015 Q1 2016
Net income (loss) 5,474$ (21,745)$ 6,162$ 7,153$ 12,161$ 7,711$ (1,238)$ 8,084$ 6,958$
Income tax (benefit) expense 3,856 (12,042) 896 3,845 7,380 5,054 737 4,709 4,634
Interest expense 22,216 21,375 21,079 22,167 22,097 21,506 19,715 16,928 16,830
Depreciation expense 18,504 16,773 18,942 17,895 17,901 17,914 18,017 18,296 18,846
Impairment of leasing equipment 1,126 1,191 932 2,606 1,433 2,569 1,693 1,582 1,999
Early retirement of leasing equipment - 37,766 - - - - - - -
Loss on retirement of debt 22 80 - 213 39 - 16,173 3,640 -
Other income, net (382) (135) (166) (242) (554) (221) (290) (329) (460)
Interest income (24) (23) (5) (9) (1) - - (18) (125)
Non-cash share-based compensation 218 218 218 156 247 102 221 305 56
Principal collections on direct finance leases, net of interest earned 1,187 1,172 1,227 1,036 1,225 785 761 894 758
Other - bond fees and M&A costs 1,789
Adjusted EBITDA 52,197$ 44,630$ 49,285$ 54,820$ 61,928$ 55,420$ 55,789$ 54,091$ 51,285$
Cash interest accrued (16,000) (15,217) (15,245) (15,155) (14,891) (14,665) (12,850) (11,089) (11,139)
Free cash flows 36,197$ 29,413$ 34,040$ 39,665$ 47,037$ 40,755$ 42,939$ 43,002$ 40,146$
Net income (loss) 5,474$ (21,745)$ 6,162$ 7,153$ 12,161$ 7,711$ (1,238)$ 8,084$ 6,958$
Non-cash interest expense, net of tax 978 1,075 1,069 1,086 1,112 1,097 1,053 911 627
Non-cash stock compensation, net of tax 131 130 131 94 148 61 71 95 33
Loss on modification and extinguishment of debt and capital leases,
net of tax 2,765 2,667 2,432 3,248 3,262 3,053 12,816 4,835 2,852
Early retirement of leasing equipment - 22,660 - - - - - - -
Other - - - - - - 62 88 1,074
Adjusted Net Income 9,348$ 4,787$ 9,794$ 11,581$ 16,683$ 11,922$ 12,764$ 14,013$ 11,544$
Reconciliation of Non GAAP Measures
15
Adjusted EBITDA, Adjusted Net Income and
Free Cash Flow Reconciliation
($ thousands)
Note - Adjusted EBITDA, Free cash flows and Adjusted Net Income are not U.S. GAAP measures, see note on page 2
Unaudited – Quarter ending numbers

Copyright 2015 TRAC Intermodal
Three Months Ended
March 31,
Three Months Ended
March 31,
Three Months Ended
March 31,
Three Months Ended
March 31,
2015 2016 Variance 2015 2016 Variance
Consolidated Statement of Operations Data:
Marine Market segment $ 122,418 $ 118,596 $ (3,822) $ 42,216 $ 29,896 $(12,320)
Domestic Market segment 44,484 47,096 2,612 27,158 27,292 134
Total Reportable segments $ 166,902 $ 165,692 $ (1,210) $ 69,374 $ 57,188 $(12,186)
Other 1,853 2,650 797 (7,446) (5,903) 1,543
Total Company $ 168,755 $ 168,342 $ (413) $ 61,928 $ 51,285 $(10,643)
Principal collections on direct finance leases (1,225) (758)
Non-cash share-based compensation (247) (56)
Depreciation expense (17,901) (18,846)
Impairment of leasing equipment (1,433) (1,999)
Early retirement of leasing equipment - -
Loss on modification and extinguishment of debt and
capital lease obligations (39) -
Interest expense (22,097) (16,830)
Other income, net 554 460
Non-recurring professional fees - (1,789)
Interest income 1 125
Income before provision for income taxes 19,541 11,592
Provision for income taxes 7,380 4,634
Net income $ 12,161 $ 6,958
Revenues Adjusted EBITDA
Reconciliation of Non GAAP Measures – Segments
16
Segment Adjusted EBITDA Reconciliation
($ thousands)
Note - Adjusted EBITDA is not a U.S. GAAP measure, see note on page 2
Unaudited – Quarter ending numbers

Copyright 2015 TRAC Intermodal
Fleet Composition
17
Total Fleet by Lease Type
At March 31, 2016
Units NBV of owned fleet % of on-
# of units % of total $ millions % of total hire fleet
Term lease 42,424 14% 213.0$ 15% 17%
Direct finance lease 3,583 1% 12.8 1% 1%
Marine chassis pool 145,162 47% 616.9 43% 56%
Domestic chassis pool 67,723 22% 444.7 31% 26%
On-hire fleet 258,892 84% 1,287.4 90% 100%
Available fleet 16,925 5% 72.1 4%
Active fleet 275,817 89% 1,359.5 94%
Units available for remanufacture 33,433 11% 85.8 6%
Total fleet 309,250 100% 1,445.3$ 100%