Embed Size (px)
Citation preview

Second Quarter 2016Earnings Presentation
July 26, 2016

Safe Harbor Statement
Statements contained in this presentation that reflect our views about our future performance and constitute “forward-looking statements” under the Private Securities Litigation Reform Act of 1995. Forward-looking statements can be identified by words such as “believe,” “anticipate,” “appear,” “may,” “will,” “should,” “intend,” “plan,” “estimate,” “expect,” “assume,” “seek,” “forecast,” and similar references to future periods. Our views about future performance involve risks and uncertainties that are difficult to predict and, accordingly, our actual results may differ materially from the results discussed in our forward-looking statements. We caution you against relying on any of these forward-looking statements.
Our future performance may be affected by the levels of home improvement activity and new home construction, our ability to maintain our strong brands and to develop and introduce new and improved products, our ability to maintain our competitive position in our industries, our reliance on key customers, our ability to achieve the anticipated benefits of our strategic initiatives, our ability to sustain the performance of our cabinetry businesses, the cost and availability of raw materials, our dependence on third party suppliers, and risks associated with international operations and global strategies. These and other factors are discussed in detail in Item 1A, “Risk Factors” in our most recent Annual Report on Form 10-K, as well as in our Quarterly Reports on Form 10-Q and in other filings we make with the Securities and Exchange Commission. The forward-looking statements in this press release speak only as of the date of this press release. Factors or events that could cause our actual results to differ may emerge from time to time, and it is not possible for us to predict all of them. Unless required by law, we undertake no obligation to update publicly any forward-looking statements as a result of new information, future events or otherwise.
2

Masco Q2 2016 Results
Topic
• Summary of Results Keith Allman
• Financial/Operations Review John Sznewajs
• Q&A
3

Q 2 2 0 1 6 I N R E V I E W
Execution and Leverage Drive Margin Expansion
• Execution drove sales and profit growth
• Continued strength in end markets
• Operating leverage and cost productivity contributed to profit margin expansion
• $400 million of debt retired
• 2.8 million shares repurchased
• Board announced intention to increase annual dividend by $0.02, beginning in the fourth quarter
4
Driving Shareholder
Value

Masco Q2 2016 Results
Topic
• Summary of Results Keith Allman
• Financial/Operations Review John Sznewajs
• Q&A
5

($ in Millions) Second Quarter 2016
Revenue Y-O-Y Change
$2,0014%
Operating Profit* Y-O-Y Change
$342$62
Operating Margin* Y-O-Y Change
17.1%260 bps
Adjusted EPS*Y-O-Y Change
$0.4621%
Strong Performance Delivers Sales and Operating Profit Growth
6
*See Appendix for GAAP reconciliation.
Quarter Highlights• North American sales increased 3%; international sales increased 9% in
local currency• FX negatively impacted sales by $6 million• Adjusted EPS includes ~$40 million interest expense due to early retirement
of debt

P L U M B I N G P R O D U C T S
7
N. American and Int’l Share Gains Fuel Growth
Quarter Highlights• North American sales increased 9%; international sales increased 11% in
local currency • FX negatively impacted sales by approximately $5 million• Delta, Hansgrohe, BrassCraft and Watkins each achieved record quarterly
sales
($ in Millions) Second Quarter 2016
Revenue Y-O-Y Change
$9239%
Operating Profit* Y-O-Y Change
$192$54
Operating Margin* Y-O-Y Change
20.8%450 bps
*Excludes business rationalization charges of $4 million for the second quarter 2016.
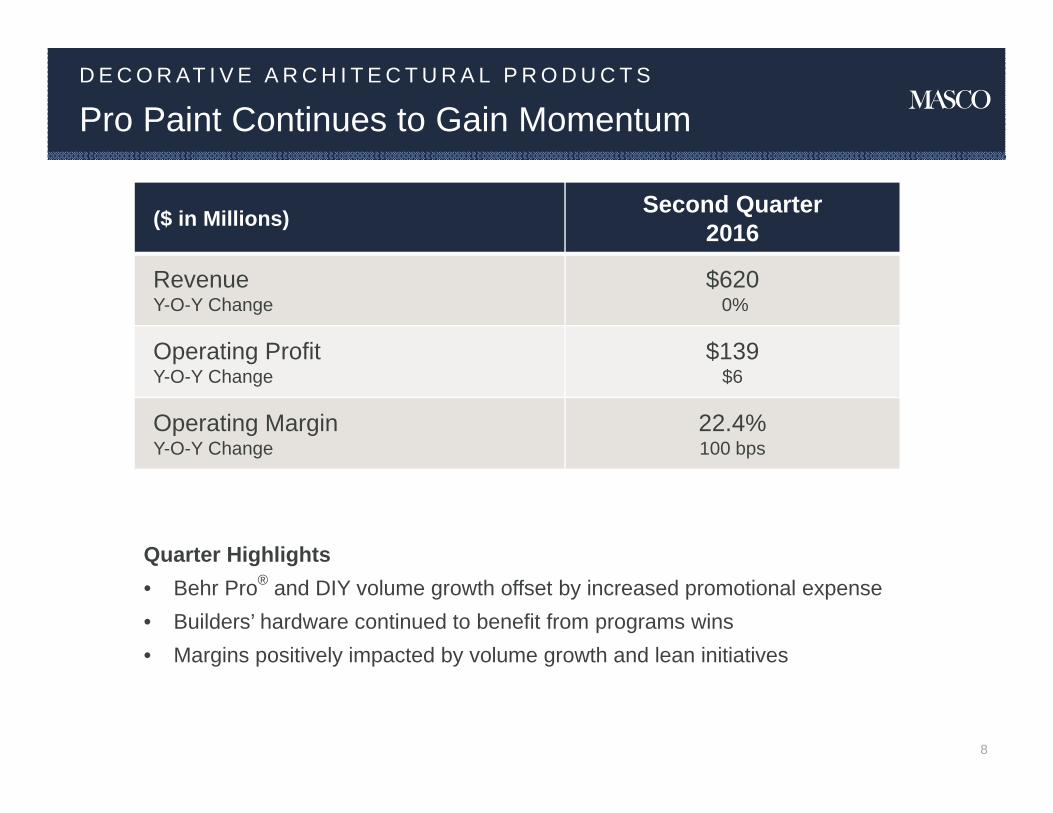
D E C O R AT I V E A R C H I T E C T U R A L P R O D U C T S
8
Pro Paint Continues to Gain Momentum
Quarter Highlights• Behr Pro® and DIY volume growth offset by increased promotional expense • Builders’ hardware continued to benefit from programs wins• Margins positively impacted by volume growth and lean initiatives
($ in Millions) Second Quarter 2016
Revenue Y-O-Y Change
$6200%
Operating Profit Y-O-Y Change
$139$6
Operating Margin Y-O-Y Change
22.4%100 bps

C A B I N E T R Y P R O D U C T S
9
Sales Mix and Productivity Drive Profit Growth
Quarter Highlights• Strong retail sales offset by the exit of certain less profitable direct-to-
builder business• Retail and dealer sales driven by continued success of KraftMaid® products• Sustained operating efficiencies and favorable mix drove margin expansion
($ in Millions) Second Quarter2016
Revenue Y-O-Y Change
$261(3%)
Operating Profit* Y-O-Y Change
$37$22
Operating Margin* Y-O-Y Change
14.2%860 bps
*Excludes business rationalization charges of $3 million for the second quarter 2016.

W I N D O W S A N D O T H E R S P E C I A LT Y P R O D U C T S
10
Windows Delivers Another Quarter of Growth
Quarter Highlights• Sales increased 4% excluding the effects of foreign currency translation• Positive mix and favorable pricing drove sales• Operating margin impacted by $6 million in ERP expense, $8 million in labor
inefficiencies, and a $10 million increase in warranty reserve
($ in Millions) Second Quarter 2016
Revenue Y-O-Y Change
$1973%
Operating LossY-O-Y Change
($2)($23)
Operating MarginY-O-Y Change
(1.0%)(1,190 bps)

Strengthened Balance Sheet
11
Liquidity as of 6/30/2016
Cash and cash investments $1.0B
Short-term bank deposits $0.1B
Total $1.1B
Disciplined Capital Allocation
• Repurchased approximately 2.8 million shares in Q2
• Issued $900M of debt in March
• Retired $1.3B of debt in April
• One-time debt retirement cost of ~$40M in Q2; expected interestexpense of $44M per quarter beginning in Q3

Masco Q2 2016 Results
Topic
• Summary of Results Keith Allman
• Financial/Operations Review John Sznewajs
• Q&A
12

Q&A

Appendix
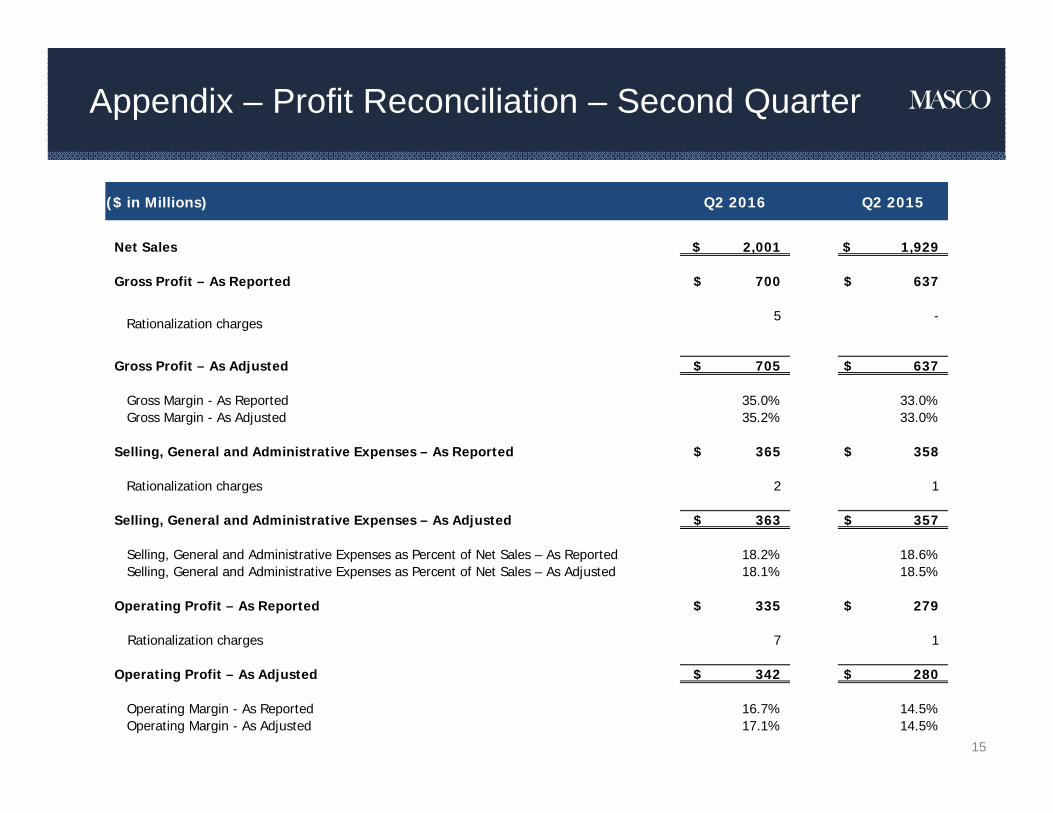
Appendix – Profit Reconciliation – Second Quarter
15
($ in Millions) Q2 2016 Q2 2015
Net Sales $ 2,001 $ 1,929
Gross Profit – As Reported $ 700 $ 637
Rationalization charges 5 -
Gross Profit – As Adjusted $ 705 $ 637
Gross Margin - As Reported 35.0% 33.0%Gross Margin - As Adjusted 35.2% 33.0%
Selling, General and Administrative Expenses – As Reported $ 365 $ 358
Rationalization charges 2 1
Selling, General and Administrative Expenses – As Adjusted $ 363 $ 357
Selling, General and Administrative Expenses as Percent of Net Sales – As Reported 18.2% 18.6%Selling, General and Administrative Expenses as Percent of Net Sales – As Adjusted 18.1% 18.5%
Operating Profit – As Reported $ 335 $ 279
Rationalization charges 7 1
Operating Profit – As Adjusted $ 342 $ 280
Operating Margin - As Reported 16.7% 14.5%Operating Margin - As Adjusted 17.1% 14.5%

Appendix – EPS Reconciliation – Second Quarter
16
(in Millions, Except per Common Share Data) Q2 2016 Q2 2015
Income from Continuing Operations before Income Taxes – As Reported $ 253 $ 221
Rationalization charges 7 1
Gains from private equity funds, net (1) (2)
Earnings from equity investments, net - (2)
Gains from auction rate securities (1) -
Income from Continuing Operations before Income Taxes – As Adjusted $ 258 $ 218
Tax at 36% rate (93) (78)
Less: Net income attributable to noncontrolling interest 13 10
Income from Continuing Operations, as adjusted $ 152 $ 130
Income per common share, as adjusted $ 0.46 $ 0.38
Average Diluted Shares Outstanding 331 344

2016 Guidance Estimates
($ in Millions) 2016 Estimate 2015 Actual1
Rationalization Charges2 ~ $19 $18
Tax Rate3 ~ 36% 43%
Interest Expense4 ~ $230 $225
General Corp. Expense5 ~ $100 $105
Capital Expenditures ~ $190 $152
Depreciation & Amortization ~ $140 $127
Shares Repurchased6 $400-500 $456
Shares Outstanding7 331 million 335 million
17
1. 2015 results exclude TopBuild Corp.2. Based on 2016 business plans. 3. 2015 tax rate is impacted by a $21 million valuation allowance resulting from our decision to spin-off TopBuild and a $19 million charge to recognize the
required taxes on substantially all undistributed foreign earnings except those that are legally restricted.4. Includes the ~$40 million debt extinguishment cost in April 2016 to retire early $1.3 billion in outstanding debt.5. Excludes rationalization expenses of $4 million for the year ended December 31, 2015.6. 2016 and 2015 share repurchases include approximately 1.0 million and 741,000 shares, respectively, that were repurchased to offset grants of long-term
stock awards.7. Reflects weighted average diluted shares outstanding for the second quarter 2016 and assumes no further share repurchases in 2016.

2015 Segment Mix*
18
R&R = % of sales to repair and remodel channelsNC = % of sales to new construction channels NA = % of sales within North AmericaInt’l = % of sales outside North America
* Based on Company estimates; excludes TopBuild Corp.
Business Segment
PlumbingProducts
DecorativeArchitecturalProducts
$3.3B
$2.0B
Revenue 2015 % of Total
47%
28%
$ 7.1B 100%Total Company
Windows and Other Specialty Products
$0.8B 11%
R&R% vs. NC NA% vs. Int’l
83% 63%
99% 100%
70% 76%
83% 79%
Cabinetry andRelated Products
$1.0B 14% 57% 92%

2015 International Revenue Split*
19*Based on Company estimates; excludes TopBuild Corp.
International Sales Accounted for ~21% of Total 2015 Masco SalesInternational Sales Accounted for ~21% of Total 2015 Masco Sales
29%
5%
8%
26%
5%
17%
10%
UKNorthern EuropeSouthern EuropeCentral EuropeEastern EuropeEmerging marketsOther